the Creative Commons Attribution 4.0 License.
the Creative Commons Attribution 4.0 License.
 | 17 Jan 2023
Uncovering the veil of night light changes in times of catastrophe
Wouter Botzen
Natural disasters have large social and economic consequences. However, adequate economic and social data to study subnational economic effects of these negative shocks are typically difficult to obtain especially in low-income countries. For this reason, the use of night light data is becoming increasingly popular in studies which aim to estimate the impacts of natural disasters on local economic activity. However, it is often unclear what observed changes in night lights represent exactly. In this paper, we examine how changes in night light emissions following a severe hurricane relate with local population, employment, and income statistics. We do so for the case of Hurricane Katrina, which struck the coastline of Louisiana and Mississippi in August 2005. Hurricane Katrina is an excellent case for this purpose as it is one of the biggest hurricanes in recent history in terms of human and economic impacts, it made landfall in a country with high-quality sub-national socioeconomic data collection, and it is covered extensively in the academic literature. We find that overall night light changes reflect the general pattern of direct impacts of Katrina as well as indirect impacts and subsequent population and economic recovery. Our results suggest that change in light intensity is mostly reflective of changes in resident population and the total number of employed people within the affected area and less so but positively related to aggregate income and real GDP.
- Article
(9033 KB) - Full-text XML
- BibTeX
- EndNote


Natural disasters can have significant social and economic consequences around the world, which are projected to rise as a result of climate change and continued urbanization in disaster-prone areas (IPCC, 2014). However, studying these impacts is not trivial. For many areas where natural disasters have large impacts, adequate data on local population and economic activity are not available. For this reason, a growing body of literature studies the local effects of natural disasters by making use of changes in local night light intensity (see, e.g., Bertinelli and Strobl, 2013; Gillespie et al., 2014; Elliott et al., 2015; Zhao et al., 2018; Kocornik-Mina et al., 2020). The idea is attractive as night light data are available at high levels of spatial detail over time for the whole globe and do not suffer from inadequate data collection and measurement error relating to the capacity of (national) statistical offices to measure the state of the economy. Night light intensity is used in a wide range of applications, such as a proxy for economic activity (e.g., Hodler and Raschky, 2014; Michalopoulos and Papaioannou, 2013), or for population and GDP (Elvidge et al., 1997; Sutton and Costanza, 2002; Ebener et al., 2005; Sutton et al., 2007; Ghosh et al., 2010) or GDP growth (Chen and Nordhaus, 2011; Henderson et al., 2012). In other studies, night lights have been used to study urbanization (Henderson et al., 2003; Zhang and Seto, 2011; Ma et al., 2012), increases in human flood exposure (Ceola et al., 2014), migration in response to flood risk (Mård et al., 2018), and population displacement due to violent conflict (Li and Li, 2014; Li et al., 2015). However, few studies have examined how night lights and economic activity relate to each other in times of shock, and there is a relatively poor understanding of what changes in night light intensity exactly reflect, especially when downturns in lights are considered (Bennett and Smith, 2017).
In this paper, we aim to advance our understanding of this issue by studying in detail the effects of Hurricane Katrina on county-level population, employment, and income for the most heavily affected counties in Mississippi and Louisiana and then relating these to changes in night light intensity. Katrina is amongst the largest hurricanes in terms of human and economic impacts, located in a country with high-quality sub-national data collection. We exploit these high-quality data by relating local changes in economic activity to changes in night light. Our key goal is to assess to what extent it is possible to capture the regional economic dynamics following damages from a large natural disaster by making use of annual nighttime light.
Our paper connects to a number of different fields studying natural disasters and economic development. First, our study connects with the literature on the economic consequences of floods and other natural disasters which uses night lights or economic indicators to proxy these consequences. This literature was sparked by the application of night light data for studying natural disaster impacts and a strand of economic literature that establishes a link between (the growth of) night light intensity and economic activity at national and subnational levels.1 Specifically for floods, the most closely related work is by Kocornik-Mina et al. (2020), who study the urban impact of large-scale floods in a global sample, using nighttime light intensity as a proxy for local economic activity. The authors find a short-lived negative effect of flooding in the year of the flood, suggesting that economic activity recovers to the pre-flood equilibrium rather quickly. In effect, our case study of Katrina is a part of their broader analysis, which we study in more detail and for which we examine the relationship between decline and recovery of night light and economic activity. Further related to Kocornik-Mina et al. (2020) is the study by Elliott et al. (2015), who similarly find a significant but short-term effect of typhoons on economic activity in cities in coastal China, also proxied by nighttime lights, and Gillespie et al. (2014), who study the impact of the 2004 tsunami in the Indian Ocean on affected communities in Sumatra, Indonesia.2
Second, most economic studies use more traditional indicators of economic activity instead of night lights to analyze disaster impacts. For instance, Strobl (2011) assesses the economic growth impact of hurricanes for US counties and reports a decline of on average 0.5 % in GDP growth in the year of impact. Notably, this impact is netted out at the state level within a year, implying that effects are local in nature. Closely connected to this study is work on the economic growth impacts of hurricanes in Central America and the Caribbean (Strobl, 2012) as well as in a global sample (Hsiang and Jina, 2014; Berlemann and Wenzel, 2018). Heger and Neumayer (2019) study the long-term economic growth impact of the Indian Ocean tsunami of 2004 for Aceh, using both GDP and annual night lights, and find a positive effect that can be explained by the large aid inflow and coordinated reconstruction efforts. Again, no effect on economic growth is observable at the national level. We also relate to a broad literature that studies the impacts of other natural disasters on economic growth (Noy, 2009; Cavallo et al., 2013; Fomby et al., 2013; Felbermayr and Gröschl, 2014).3 However, a critique is that many of these studies have used aggregate national GDP indicators to analyze the impacts of disasters which are often local events (Felbermayr et al., 2022; Botzen et al., 2019). We contribute to this literature by combining insights into impacts on economic activity in the affected region through conventional economic statistics with an analysis of changes in night light activity to assess the value of the latter in studying impacts of natural disasters on local economic activity.
Third, our work relates closely to studies examining the social and economic impacts of Hurricane Katrina, which we discuss in detail in the next section. These studies have analyzed the effects of Katrina on neighborhoods in New Orleans (Logan, 2006), the economic welfare of displaced individuals (Paxson and Rouse, 2008; Groen and Polivka, 2008; Deryugina et al., 2018; Groen et al., 2020), business survival and recovery (Jarmin and Miranda, 2009; Basker and Miranda, 2018), and its substantial wider effects on the affected regional economies (Vigdor, 2008; Hallegatte, 2008; Xiao and Nilawar, 2013). We incorporate and synthesize the existing empirical evidence in the following section, before analyzing the effects of Hurricane Katrina on night light intensity of the affected region.
Finally, and more broadly, our study connects with the literature on estimating the costs of climate change and sea level rise, as well as the increasing risk from hurricanes and flooding which coastal cities face in the near future (Hallegatte et al., 2013; Aerts et al., 2014; de Ruig et al., 2019). We study in this paper one case of a heavily urbanized coastal region that is exposed to the risks of hurricane landfalls. Global warming and sea level rise are expected to aggravate these risks in many parts of the world (IPCC, 2014). Understanding the consequences of hurricanes on coastal economies is therefore important for risk management and planning. Because adequate data to study local economic impacts are not available in many parts of the (developing) world, we aim to contribute to this discussion by assessing the extent to which remotely sensed night light can be of value in this context.
In this section, we first summarize the immediate impact of Hurricane Katrina and assess its economic impact on the affected region. We then make the link with visible effects of Katrina on the affected counties from space by evaluating the changes in night light intensity of the affected areas. Subsequently, we assess the recovery in light intensity over the subsequent years, before comparing economic impacts and effects on night light intensity in Sect. 3.
2.1 Hurricane Katrina: landfall and economic impacts
On 29 August 2005 Hurricane Katrina made landfall close to New Orleans. Although it was downgraded from a Category 5 to a strong Category 3 hurricane, it was an exceptionally large storm when it approached the shoreline with wind speeds up to approximately 200 km h−1 (Knabb et al., 2005). The storm killed almost 2000 people and caused substantial damage totaling USD 125 billion due to winds, extreme precipitation, and major storm surge flooding (National Hurricane Center, 2018). A large part of these damages occurred in New Orleans, which experienced massive flooding of about 80 % of its land (Pistrika and Jonkman, 2010). Several levees meant to protect the city of New Orleans, which is situated largely below sea level, were overtopped or breached due to the storm surge (see top-left panel of Fig. 1). Major unanticipated flooding occurred, especially in Orleans Parish and St. Bernard Parish. These areas were inundated for a long time as it took 43 d until all flood waters were removed from the city (Knabb et al., 2005). The distributional impact across the city of New Orleans resembles a clear pattern of segregation that was present long before Katrina struck. The parts of the city that proved most vulnerable were majority black and low-income neighborhoods, and recovery was also slowest in these areas (Logan, 2006). Other parishes were mainly affected by wind and less severe flooding of a shorter duration for which warnings were issued. As a consequence, more housing units were destroyed in the inner city compared with these outside parishes (Vigdor, 2008). Some areas have never been rebuilt. Wider devastating effects were recorded on the south coast of Louisiana and Mississippi, where in some counties well over half of the residential housing stock was severely or completely damaged.

Figure 1Flooding and night lights for the city of New Orleans before and after Katrina. Top left: excerpt from Dartmouth Flood Observatory flood map of New Orleans (image by Dartmouth Flood Observatory, 2005, reprinted with permission). Color coding indicates flooding by 30 August, 2 September, and 7 September from light to darker shades of red respectively. Note how especially in the eastern part of the city entire neighborhoods were still inundated a week after the hurricane. Knabb et al. (2005) report that the final waters were only cleared 5 weeks later. Top-right and bottom panels: night lights as observed from space by DMSP-OLS (raw uncorrected data from satellite F15). Brighter areas are indicated by green, whereas purple implies darker areas. Much of the city was at maximum brightness of DN63 in 2004 (top right) but fell below this threshold in the year 2005 (bottom left). In line with the pattern of flooding, especially the eastern part of the city dimmed and had only partly recovered by 2006 (bottom right). As discussed, it took almost a decade to recover light levels to their prior intensities in these neighborhoods.
Hurricane Katrina had severe impacts on the population and economic activity in New Orleans which differ amongst its parishes and vary over time. Orleans and Bernard parishes in particular experienced severe population declines for about 2 years after Katrina; they were also the parishes which experienced the worst flooding. The short-term population decline was even more severe. Within a week the population reduced from more than 400 000 to almost zero as people evacuated the city; of these, about half had returned 2 years later, after which the population more or less stabilized by about mid-2008 (Vigdor, 2008). Deryugina et al. (2018) estimated that a third of the evacuees from New Orleans still had not returned by 2013. Katrina therefore reinforced a trend of an already shrinking population, which may explain why the population has not fully recovered. Before Katrina, the city was already experiencing continued out-migration due to a lack of economic opportunities, which especially applied to the central city (Vigdor, 2008). Economic activity further deteriorated after Katrina, which is reflected in lower employment. The private sector lost approximately 70 000 jobs in the New Orleans metropolitan area. The most severe decline in employment was observed in services-oriented sectors, which lost part of their customer base due to the population decline. Some positive employment growth occurred in the construction sector, but declines of well over 10 % to 20 % in most other industries, ranging from business and trade to state and local government services, resulted in a large net employment loss (Vigdor, 2008).
The overall loss in employment indicates that economic activity declined, but this does not necessarily mean that income decreased as well. Perhaps surprisingly, the decline in income was only roughly half that of population and employment, mirroring the unequal effect the hurricane had on different income groups. The low-lying and predominantly poorer and black neighborhoods of New Orleans were hit hardest (Logan, 2006).4 It was also the low-income and primarily African American former residents who, in large numbers, were unable to return to the city after the disaster (see, e.g., Paxson and Rouse, 2008).5 Groen and Polivka (2008) describe that evacuees suffered substantially in terms of labor market outcomes in the year after Katrina, although on average these effects diminished over time. Moreover, evacuees who did not return to New Orleans had worse labor market outcomes than those who did return in the short run, part of which is explained by individual and family characteristics also discussed by Logan (2006) and Vigdor (2008). The long-run development of household income of those who lived in New Orleans during Katrina has been analyzed by Deryugina et al. (2018) using tax return data. They find labor income declined by USD 2000 shortly after Katrina and by USD 2300 in 2006 compared with similar households who lived outside of New Orleans when Katrina occurred, mirroring the findings by Groen and Polivka (2008). However, this income decline disappeared in 2008 when incomes of Katrina victims were USD 1300 higher (Deryugina et al., 2018). Explanations for this result are that wages in New Orleans increased in the years after Katrina to compensate for local price rises, especially for housing (which was in short supply), and that evacuees moved to areas with improved job opportunities and higher wages. In addition, a strengthening local labor market with relatively scarce labor supply caused further upwards pressure on relative wages (Groen et al., 2020). Focusing on business establishments rather than individuals, Basker and Miranda (2018) find very low survival rates for businesses which incurred physical damage from Katrina, especially for smaller and less productive establishments. Xiao and Nilawar (2013) focus on the regional impacts of the disaster and observe positive spillover effects on income and employment growth from heavily affected counties to their surrounding counties. This pattern suggests the presence of spatial demand shifts away from the core affected area into neighboring less affected counties. Overall, the social and economic impact of Katrina was enormous.
2.2 Visible impacts from space
A first analysis shows that the devastating impacts of Katrina are visible even from space. We collect the Defense Meteorological Satellite Program (DMSP) annual average stable night light composites and plot average annual night light intensity for the city of New Orleans in Fig. 1.6 The data come at a resolution of 30 arcsec (roughly 1 km2 at the Equator), and intensity is given in digital numbers (DNs) ranging from DN0 to DN63, reflecting dark to very bright respectively.7 Even though New Orleans is a densely urbanized location where brightness of lights is as high as the satellite can record, city lights fell drastically in many parts of the city as a result of the flooding and wind damage caused by Katrina. In the eastern part of the city, as well as in its eastern suburbs (Chalmette), night light intensity almost halved, reflecting the severity of flooding in that part of the city. While some recovery is apparent in 2006, impacts remain visible even in the raw light data, especially in the eastern part of the city. Next, we zoom out and assess direct impacts along the coastline of Louisiana and Mississippi. We collect the damage figures from the U.S. Department of Housing and Urban Development (2006), which reports damage assessments to occupied housing units based on FEMA's data on Individual Assistance registrants and Small Business Administration disaster loan applications. Damage to housing units is divided into three categories: minor damage (< USD 5200), major damage (USD 5200–30 000), and severe damage (> USD 30 000). Housing damage in the category of major and severe as a percentage of total occupied housing units by county is reported below in Fig. 2.8 Over 50 % of occupied housing units in Plaquemines Parish (LA) and Orleans Parish (LA) had major or severe damage, and damages were even higher at 70 % in Hancock County (MS) and close to 80 % in St. Bernard Parish (LA). Four other counties have damages close to or over 20 % of their housing stock: Jackson County (MS), Harrison County (MS), and St. Tammany Parish (LA) and Jefferson Parish (LA). In our main analysis, we focus on these eight most severely affected counties.

Figure 2Housing damage and change in night light intensity in 2005. Left: percentage of occupied housing units with major or severe damage from Hurricane Katrina. Own calculations, based on U.S. Department of Housing and Urban Development (2006) data from FEMA Individual Assistance registrants and Small Business Administration disaster loan applications. Counties with major/severe damage of 15 % or more are labeled in the map. Damages for the counties in western Louisiana (most notably Cameron, Vermillion, and Calcasieu) are related to Hurricane Rita, which made landfall on the coastline of Texas later in 2005. These are not to be related to the impact of Katrina but show a similar pattern of damages and night light intensity reductions. Right: night light reduction by county between 2004 and 2005, with the sum of light intensity indexed to 2004 = 100. Values below 100 indicate a reduction in light intensity with respect to 2005, while values above 100 indicate an increase. Based on own calculations. Sum of night light is based on calibrated light series using the Elvidge et al. (2014) method, discussed in detail in Sect. 2.3. Color coding is based on the standard deviation method (see Appendix Fig. A2 for the distribution of night light changes).
The main interest of this study is to assess the extent to which we can capture the regional economic dynamics following these damages by making use of the annual nighttime lights. To do so, we start with a simple descriptive analysis of the association between housing damage and change in light intensity between 2004 and 2005. Throughout the analysis, we express the change in light intensity as the relative difference between light intensity of a county in a year compared to the level of light intensity of that county in 2004, the year prior to Katrina. Thus, we index the sum of light of a county in a year by dividing by the sum of light for that county in 2004 (implying that indexed light intensity in 2004 = 100).9 We then plot changes in the total sum of light by county on the same map (see Fig. 2) and find a pattern that is strikingly similar to that of the housing damage map in Fig. 2. Indeed, an (unconditional) correlation plot reveals the same pattern, with a correlation of −0.60, which is significant at 1 % (see Fig. 3 below). The immediate impact of Hurricane Katrina is thus evidently captured quite well in the changes in night light intensity.10
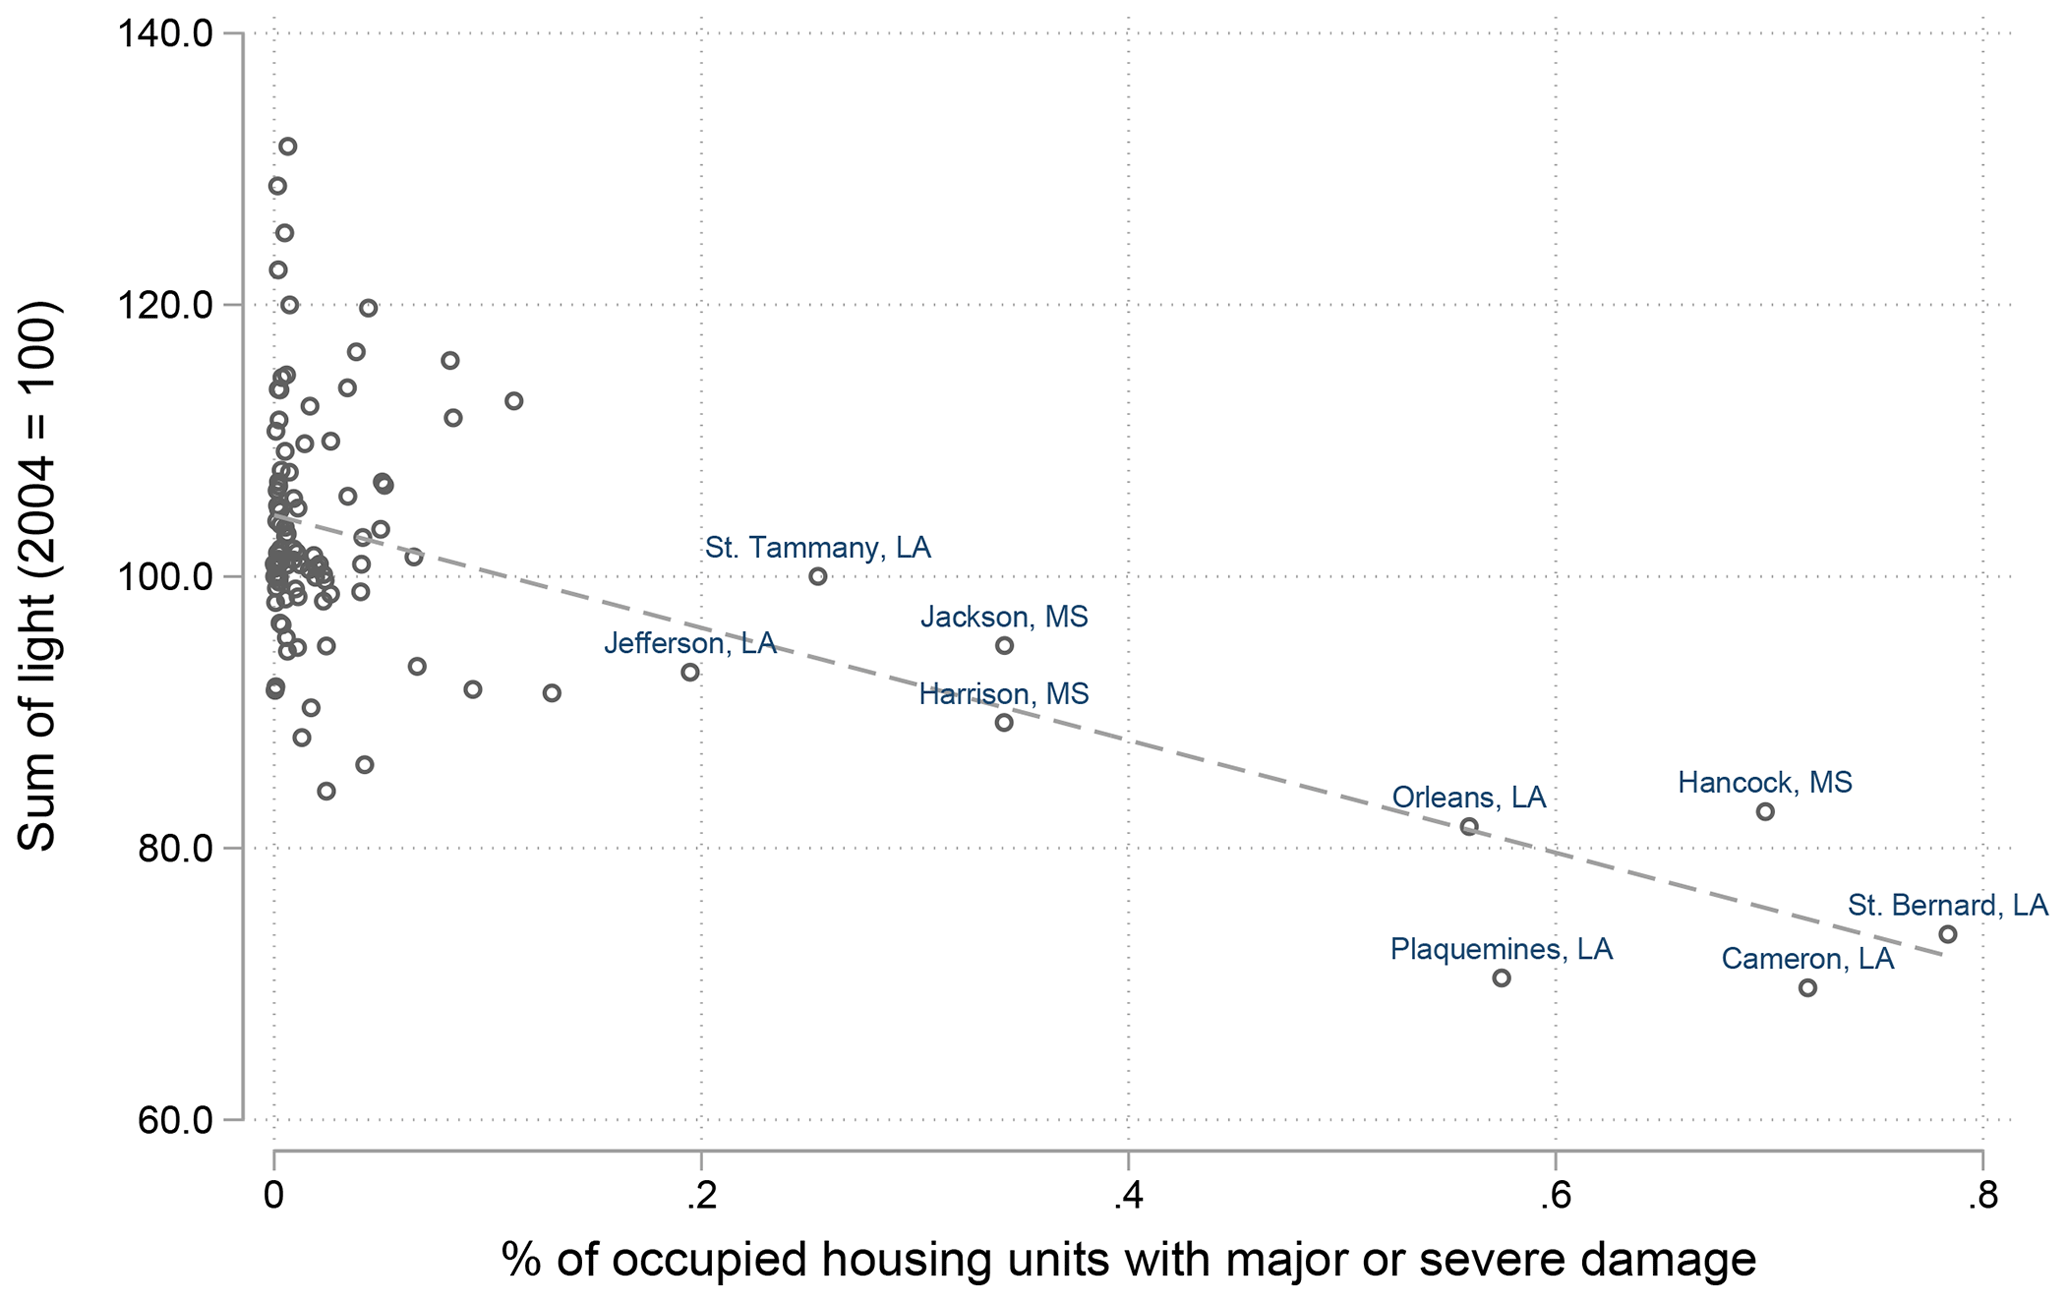
Figure 3Correlation plot of housing damage and night light reduction in 2005. Data on housing damage in 2005 for Louisiana and Mississippi from the U.S. Department of Housing and Urban Development (2006). Nighttime lights are indexed to 2004 = 100 and are calibrated using the Elvidge et al. (2014) method, discussed in detail in Sect. 2.3. Note that the damage and associated night light reduction for Cameron Parish (LA) are linked to Hurricane Rita, which made landfall on the coastline of Texas in 2005. We do not focus on this particular case in the remainder of the paper, as our focus is on Hurricane Katrina.
2.3 Regional impacts and recovery in night lights
We can further illustrate the reductions in light intensity by more closely examining the night light images for the affected region at large. However, two features of the night light data make comparison over space and across time challenging. The first issue is that the DMSP annual composite data are known for their problematic intertemporal and between-satellite measurement differences, due to varying gain settings of the sensor over time and aging of the satellites (for a detailed discussion see Elvidge et al., 2009b, 2014). This makes it difficult to compare night light intensity within an area over time. To facilitate cross-time comparison, we calibrate the light composites by using the Elvidge et al. (2014) invariant area calibration method. This method is based on a reference image for an area where true light intensity remains approximately unchanged throughout the study period, which then allows for separating true changes in light intensity from pure satellite measurement error. In Appendix B, we discuss this calibration in detail and also propose alternative methods of adjusting the data, notably an alternative calibration by Zhang et al. (2016) and an econometric fixed-effects approach more customary in economics (Henderson et al., 2012). Of these options, the calibration by Elvidge et al. (2014) performs best for our purposes. In all main results that follow, we therefore use calibrated night light images following that methodology. We test our results for robustness with the alternative calibration proposed by Zhang et al. (2016) and by implementing an econometric panel fixed-effects correction proposed by Henderson et al. (2012) in Appendix A. Our main results are very robust to these alternative correction methods. A second issue is that of top coding in the DMSP annual night light composites: an upper limit to the DMSP Operational Linescan System (OLS) sensor results in saturation of recorded light intensity at DN63 (Small et al., 2005). This implies that any light intensity above this saturation threshold is not captured in the data. As a result, predominantly bright urban centers are top coded, as is also the case for the city of New Orleans.11 This is problematic for several reasons but specifically results in issues in our case when assessing decreases in night light intensity as a result of Katrina for a high-income area with bright urban centers such as New Orleans: true decreases in night light intensity which occur above this saturation threshold may be obscured in these pixels. We therefore investigate the importance of top coding for our results in this section.

Figure 4Night light intensity in the study region prior to Katrina, 2004. Based on own calculations using satellite F15, corrected with the Elvidge et al. (2014) calibration method. Top-coded pixels are indicated in orange. County names are in white.
The distribution of night light intensity values in the study region is presented in Fig. 4. Clearly the majority of New Orleans city is top coded, with only its edges falling below the saturation threshold prior to Katrina.12 Note how similar top coding is present along the urbanized coastlines of Harrison and Jackson County. The light reductions we observe for our case study are therefore a lower bound of the true effect. This issue is not unique to our particular study area but is true more generally for highly urbanized centers in high-income countries. We stress that this problem is much less severe in low- and middle-income countries, where the share of top-coded pixels is very small (see, e.g., Felbermayr et al., 2022, for a discussion). Moreover, Kocornik-Mina et al. (2020) show that light reductions following severe flooding are observed in urban areas around the world. The majority of their sample consists of urban areas in middle- and lower-income countries, for which the authors similarly note that top coding is of very limited concern. Our finding for the case of Hurricane Katrina is therefore not unique, and effects should be more pronounced in lower- and middle-income countries. Taking the substantial top coding in our study area as a matter of fact, we turn to assessing changes in light intensity after Katrina.
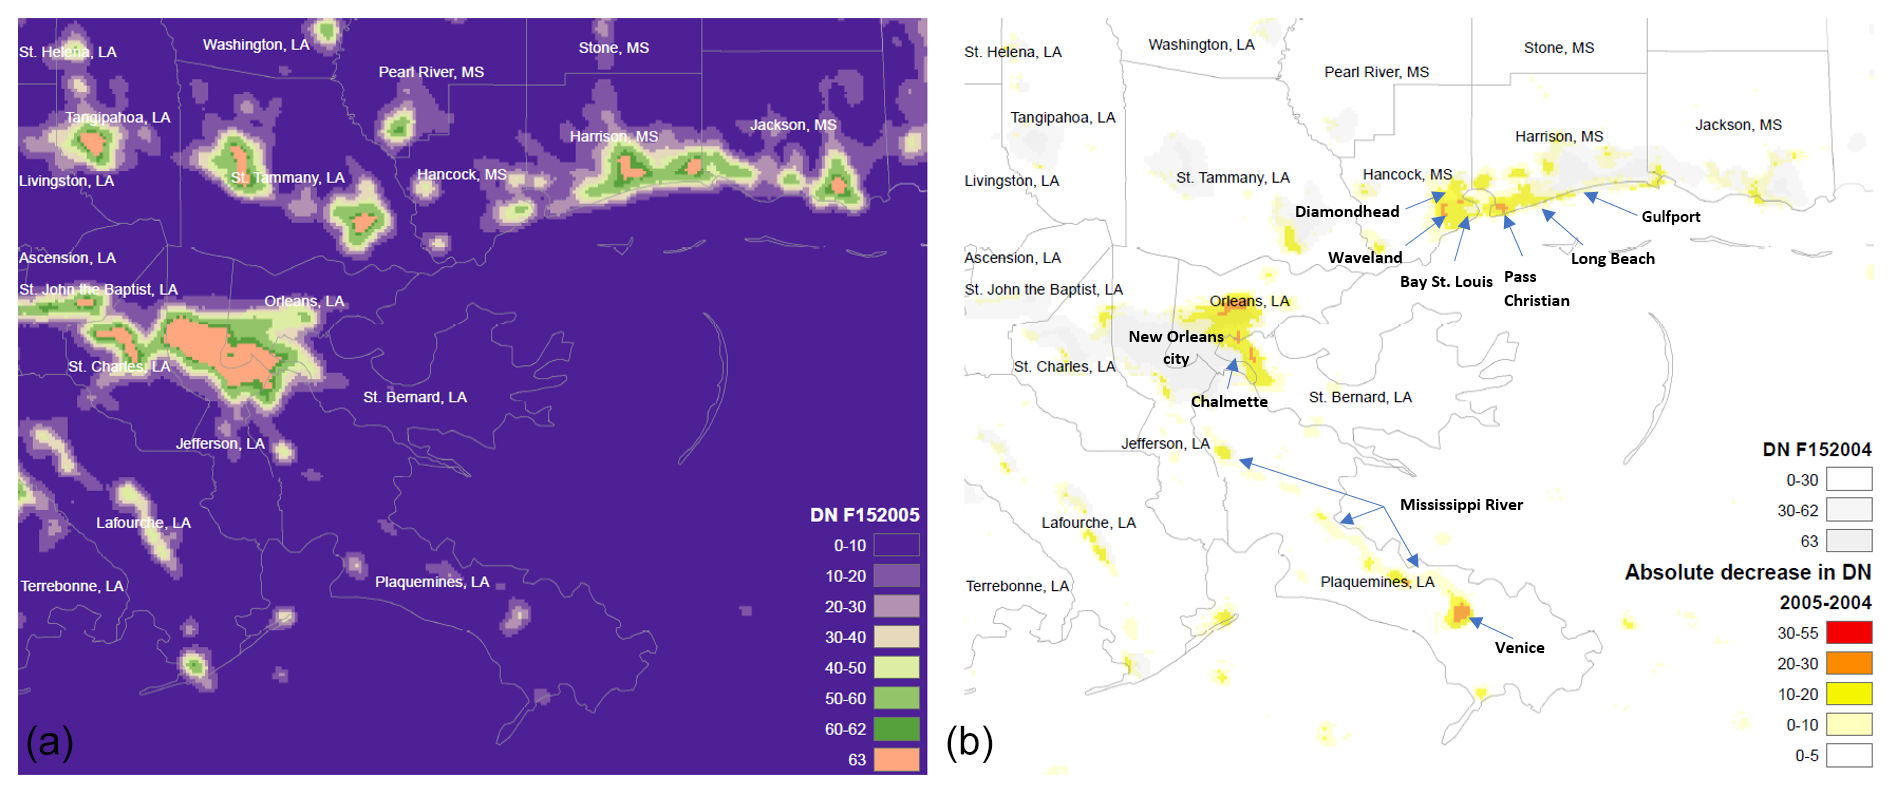
Figure 5Absolute change in night light intensity from 2004 to 2005. Based on own calculations using satellite F15, corrected with the Elvidge et al. (2014) calibration method. (a) Night light intensity in the study region, year of Katrina 2005. Top-coded pixels are indicated in orange. (b) Absolute difference of pixel value (DN) between 2004 and 2005.
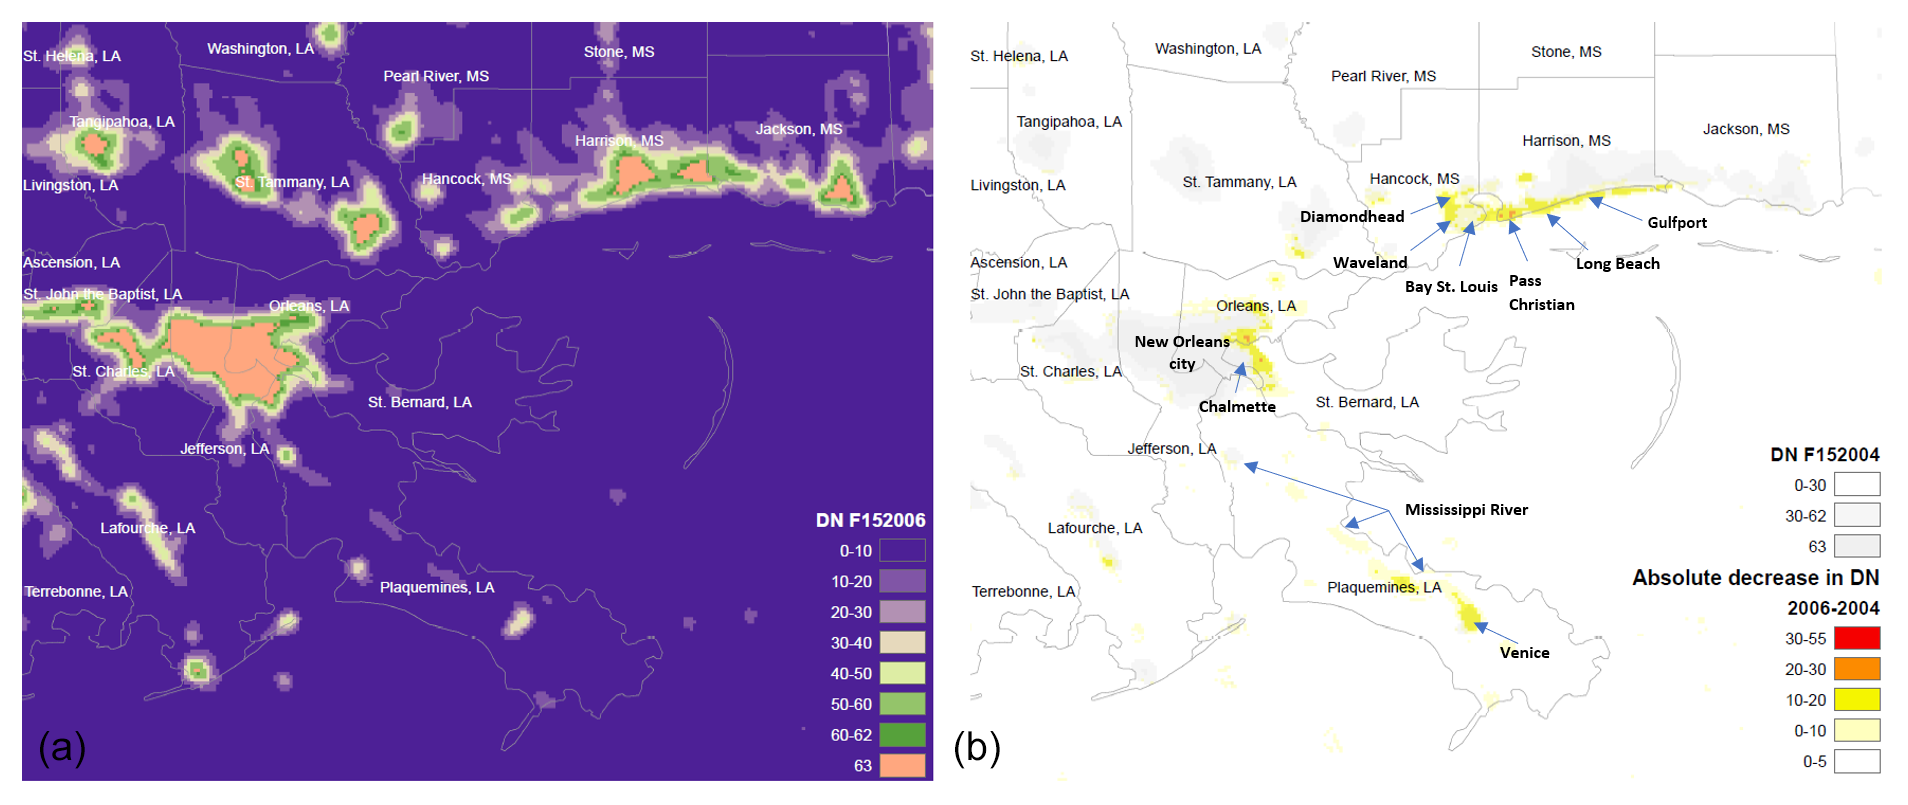
Figure 6Absolute change in night light intensity from 2004 to 2006. Based on own calculations using satellite F15, corrected with the Elvidge et al. (2014) calibration method. (a) Night light intensity in the study region, year of Katrina 2006. Top-coded pixels are indicated in orange. (b) Absolute difference of pixel value (DN) between 2004 and 2006.
Two panels of images now follow to compare the changes over time in 2005 and 2006. First, Fig. 5a presents the distribution of night light intensity across the study region for 2005. Figure 5b plots the absolute decrease in night light intensity (the digital number for 2004 subtracted from 2005 for each pixel). Figure 6 does the same but for 2006. Focusing first on New Orleans, the immediate effects of Katrina become apparent in the eastern part of the city and in the suburbs of Chalmette, as we saw even in the raw data in Fig. 1. Reduction in light intensity is most severe in the northeastern tip of the city, with light reductions from 30 up to 50 points, translating to reductions which amount to well over 50 %. Moreover, notable reductions occur in previously top-coded parts of the city. While we cannot exclude the possibility that the true decrease in light intensity is even stronger, here too reductions run well over 10 percentage points. Note that in the west of the city hardly any change is detected, which is very much in line with the geographical spread of flooding (see Fig. 1).
Two other main areas that suffered heavy light reduction can be clearly identified from these figures. First, Plaquemines Parish has a long inhabited strip along the Mississippi River ending at the town of Venice, Louisiana, which suffered enormous damages from Hurricane Katrina. Light reductions are evident along the entire river, with the highest reduction located in Venice. Note that no top coding was present in this area in 2004. The second area is Bay St. Louis, Mississippi, and the coastline along Harrison County. Major light reductions are visible in all urban zones around the bay, notably in Waveland, Diamondhead, and Pass Christian. Reductions in the order of 10–20 points are also visible further along the coastline in Long Beach and Gulfport. Again, no top coding was present here in 2004.13
Next we turn to the year 2006, depicted in Fig. 6. A first observation is that the worst reductions in night light have largely disappeared from the map: reductions over 20 points – compared to 2004 – are rare in 2006. However, the eastern part of New Orleans remains depressed, notably also along the Mississippi River near Chalmette. While a substantial part of the city returns to being top coded, this is clearly not the case for the northeastern neighborhoods. This is true even for a large strip that was top coded in 2004. Similarly, the riverbed of Mississippi still shows depressed night light values all the way to the town of Venice. There are signs of recovery around the St. Louis Bay, but light intensity is still 10 to 20 points lower in many parts of the metropolitan area around the bay. Top coding thus mainly affects the changes observed in New Orleans city, thereby affecting the changes in light intensity for the parishes Orleans, St. Bernard, and Plaquemines – which, as discussed below, are the counties for which we observe permanent reductions in population and employment. This means we must interpret our comparison of changes in night light intensity to changes in economic indicators for these areas with care. It is likely that the observed reductions in night lights are an underestimate of the true effect on night light intensity. However, even with this caveat in mind, the overall patterns of direct impact and recovery in terms of night light changes are closely in line with our expectations, based on the geographical spread of flooding and on the impact numbers we know from previous studies.
Our analyses in the subsequent section focus on the following two issues: (1) the extent to which this reduction in night light intensity corresponds to reductions in economic activity, as captured through county level income, employment, population, and GDP, and (2) the extent to which recovery of night light intensity over time corresponds to recovery in these economic indicators. Because the impacts are clearly strongest in the defined core group of eight coastal counties, we collected for these counties annual data on their economic indicators and assess the longer-term impacts of Katrina on their economies. We then compare these developments to changes in night light intensity over time.
The economic impact of Hurricane Katrina on the county economies along the coast becomes evident from the graphs in Fig. 7 (see below), which plot population, aggregate employment and income, real GDP, and night light intensity by county for the years 2000–2018.14 To allow a comparison of impacts and recovery over time, we standardize the series of each county to their respective levels in 2004 (2004 = 100). The graphs are sorted by normalized housing damage, expressed as percentage of total occupied housing units with major or severe damage. Some notes are warranted before discussing the graphs. First, the economic data are aggregates for calendar years, which means the majority of hurricane impacts are captured in the records for 2006. Second, the DMSP night light composites are also annual averages, which means that only the months from September to December are affected by Katrina's impact. Third, population figures come from the Census Bureau midyear population estimates, which implies the population effect of Katrina is only captured in 2006. As such, all reported figures represent a lower boundary of the true short-run effects of Katrina.
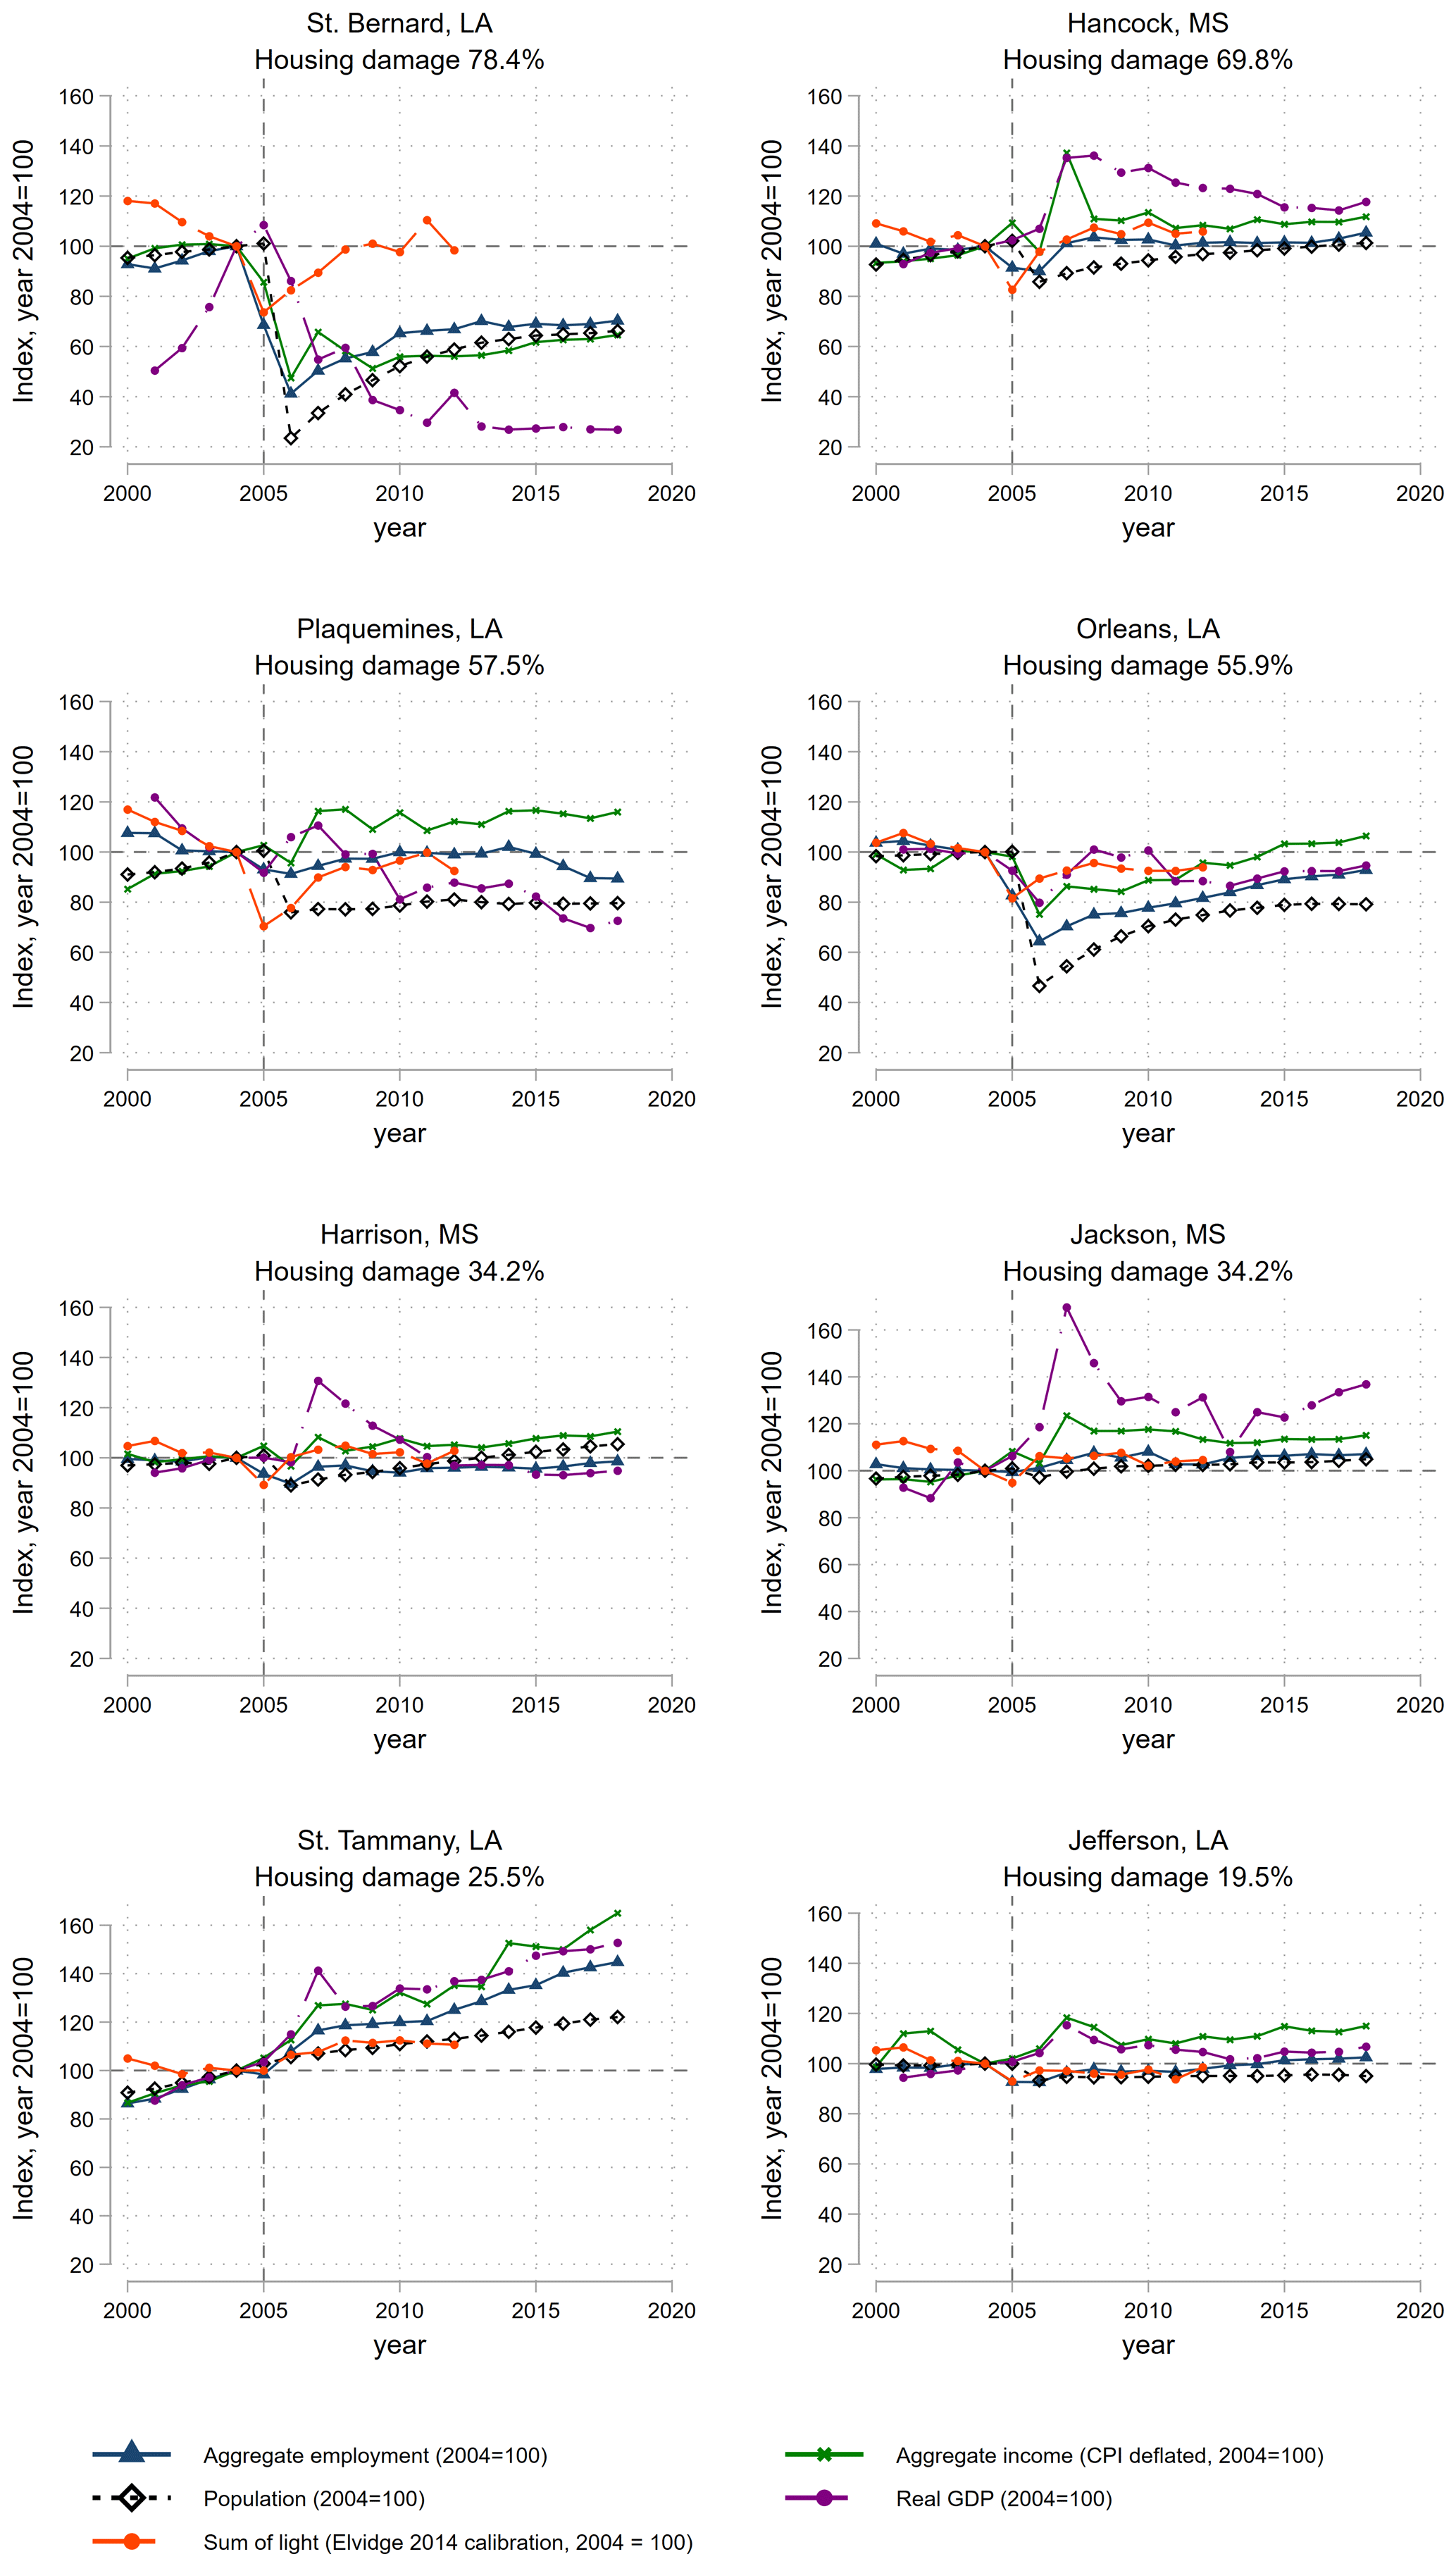
Figure 7Night light and economic indicators following Katrina for the eight most-affected counties. Based on own calculations. All variables are indexed with 2004 = 100. Aggregate employment, income, population, and real GDP data come from the U.S. Burea of Econonomic Analysis (2020). Night lights are calibrated using the Elvidge et al. (2014) method.
We now assess the impact of Katrina on the worst-affected counties. The general patterns are clear and reassuring: reductions in night light intensity were clearly strongest for the most-affected counties of St. Bernard, Hancock, Plaquemines, and Orleans, as was also shown in Figs. 5 and 6. All counties experienced major or severe damage to over 50 % of housing units, which is associated with reductions in light intensity of 20 % to 30 %. These reductions are in line with large losses in population. In contrast, the bottom four counties in Fig. 7 experienced smaller housing damage of 20 % to 35 % and saw much smaller population losses. Harrison, Jackson, St. Tammany, and Jefferson experienced smaller economic impacts in comparison to the top four counties in Fig. 7, and, in line with these patterns, reduction in night light intensity was less at 3 % to 13 %.
The overall pattern with regards to population and night light changes is as follows. The effect of Katrina on counties' night light intensity corresponds with their respective changes in population, although more so qualitatively than quantitatively. Reductions in light intensity were roughly a third at maximum, whereas population losses were over twofold in some counties. However, recovery patterns in population numbers closely match those of recovery in light intensity. This is especially clear from the three most-affected counties in Louisiana: St. Bernard, Plaquemines, and Orleans Parish.
Considering the other indicators, it is clear that the impact of Katrina on the counties' economies has not been uniform. Employment losses overall were roughly proportional to losses in total population and are therefore closely related to changes in night light intensity.15 Income and GDP changes, however, were more heterogeneous, with the exception of all counties experiencing a spike in income in 2007, related to the massive federal recovery assistance funds disbursed in that year (Xiao and Nilawar, 2013).
In summary, while the size of economic effects is related to the extent of damages, there is no single coherent explanation that captures economic changes in terms of population and income as a function of damages. Some counties experienced lasting population losses, whereas others – most notably Hancock – recovered fairly quickly and experienced (temporary) booms in income and GDP. In turn, night light intensity does not perform perfectly at capturing these dynamics but does so as expected in qualitative terms: the heaviest-hit counties show the largest declines in night light intensity, and light intensity recovers to pre-disaster levels in the subsequent years. However, recovery of night light intensity towards pre-Katrina levels was much faster than for population and employment and income in the heaviest-hit counties of St. Bernard and Orleans. Growth in income and employment after Katrina is positively correlated with night light intensity as well. The relationship with GDP seems less evident across the eight counties compared to the other indicators. Nonetheless, overall the qualitative patterns are promising: night light intensity can inform us about regional economic downturns in this case study.
3.1 Correlations between night lights and economic indicators
To further structure the discussion, we assess the correlation between the change in the total sum of light and the change in economic indicators for the eight affected counties.16 We distinguish two periods: one before Katrina (2000–2004) and the period starting in the year of Katrina (2005–2012). Because the population record for 2005 is based on the midyear estimate in July, we limit population figures to 2006–2012 for the second period for this indicator only.17 Results are reported in Fig. 8.
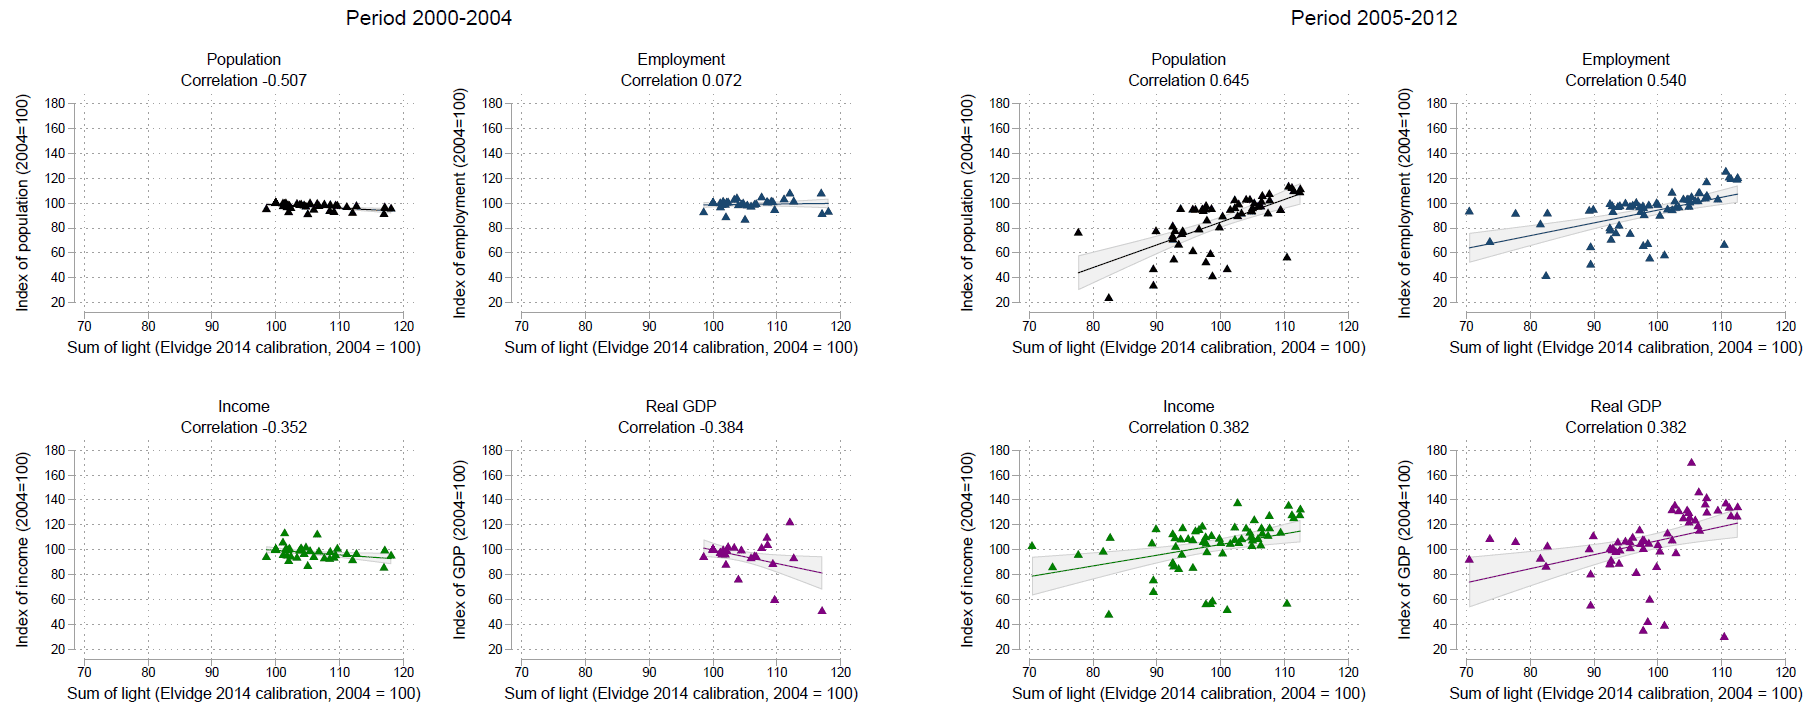
Figure 8Indexed economic indicators and total sum of light for the eight affected counties before Katrina. Based on own calculations. Right panel: population data are for 2006–2012 only.
The findings are rather striking. In the period before Katrina, the correlations are weak and predominantly negative (see Fig. 8). The correlation with population is strongest – and negative – driven by light levels that are higher in the period prior to 2004 in all eight counties. This pattern is visible in all counties, while the population was either growing or stagnant in these years. This is not the case for employment, which instead shows close to no correlation with light intensity before Katrina. For both income and GDP, the correlation is again negative but weaker than with population. This is likely due to top coding in the night light data, making light intensity unresponsive to economic changes prior to the negative shock caused by Katrina. For GDP specifically, the negative correlation is purely driven by St. Bernard Parish; when excluding St. Bernard, the correlation is weak and positive at 0.22.18
In stark contrast, there is a clear positive and substantially stronger correlation in the years after Katrina for all four indicators (see Fig. 8). Unconditional pairwise correlations of 0.65 and 0.54 indicate that the change in night light as a result of Katrina is most closely related to population and employment, respectively. The scatterplots clearly reflect that reductions in night light underestimate the reductions in population and employment in some of the counties, as discussed in the previous section. Again, this likely relates to the top-coding issue and may also be partly explained by the timing of the hurricane in the last part of the calendar year. Still, the correlation between the change in light intensity and population is strong, whereas it is moderate for employment.
Although similarly positive, the correlation between indexed light intensity and income and GDP is weaker at 0.38. The lower correlation can be explained by developments in the counties of Hancock, Harrison, Jackson, St. Tammany, and Jefferson, all of which had income and GDP levels (far) exceeding pre-Katrina levels. Instead, growth in light intensity was much lower for these counties. A notable spike visible in all counties occurs in 2007, in which relief transfers boosted both income and GDP. However, there appears to be no correlation between these transfers and light intensity for this year, further lowering the correlation with income and GDP.
The main findings are then twofold: first, the correlation between night light intensity and the four considered economic indicators is much stronger after Hurricane Katrina struck than before. The positive and – in the case of population and employment – strong correlations with economic activity show that changes in night light intensity can be used successfully to capture local effects on economic activity of a large shock like Hurricane Katrina. Second, and within the limits of our study, the results suggest that change in light intensity is mostly reflective of changes in resident population and the total number of employed people within the affected area, and it is less so but positively related to aggregate income and real GDP. We test robustness of these findings regarding the use of the alternative calibration method by Zhang et al. (2016), as well as fixed-effects-corrected light data. Results are reported in Appendix A. For the Zhang et al. (2016) calibrated data all correlations for the period 2005-2012 are lower than for the baseline results using the Elvidge et al. (2014) calibration. This can be explained by the anomalous year corrections in 2010 and 2012, discussed in detail in Appendix B. When excluding 2010–2012, we find similar correlations for the two calibration methods (results available upon request). Alternatively using an econometric fixed-effects approach yields comparable results (see Appendix B for a discussion on the methodology), but correlations between indexed light and income and real GDP are considerably higher at 0.57 and 0.68 respectively. This puts their correlation in a similar range as population (0.55). However, the correlation with employment is still considerably stronger at 0.75. We also test sensitivity of the results to combining the two periods in a single correlation analysis for 2000–2012 (see Appendix A).19 In line with the results above, the overall correlations are lower, but the patterns remain qualitatively the same: correlations with all economic indicators are somewhat lower, as the pre-Katrina period observations are now part of the analysis, but the conclusions remain unchanged.
Our results can be compared to a few other studies to get an impression of their generalizability. Elliott et al. (2015) conduct panel data regressions to estimate the relationship between typhoon damage in coastal China and local night lights as proxy for economic activity. They find a significant negative influence of damage on night lights, which is consistent with our observation that night lights negatively relate with local damages from Hurricane Katrina. These effects observed by Elliott et al. (2015) are also important in size. For instance, based on assumed relationships between night lights and economic activity, the influence of a typhoon on net economic activity in a year for an average cell ranges in between a decline of 20 % up to 30 %. Our results that examine relationships between night lights following a disaster and economic activity more directly reveal qualitatively similar patterns of findings. Moreover, Gillespie et al. (2014) estimate how night lights develop in response to the 2004 tsunami in Indonesia as well as the relationship between these night lights and damages and economic indicators. They conclude that significant drops are observed in night lights shortly after the tsunami in damaged areas. Additionally, real per capita expenditures significantly declined with the observed reduction in night lights. Taken together these findings give confidence that our pattern of results observed for Hurricane Katrina is not unique to our case study selection.
An emerging strand of literature has used night lights to study the impacts of natural disasters on local economic activity. Night light analysis of impacts of natural hazards is especially useful in areas which lack local data of population and economic activity. However, it is often unclear what observed changes in night lights exactly represent as they have been used as a proxy for changes in GDP levels or growth, urbanization, and temporary and permanent population movements. Our study contributes to this emerging literature by providing insights into the interpretation of night light changes in times of natural disasters. In particular, we examined how these changes following a severe hurricane relate to direct damages, local population, employment, and income statistics.
We did so by studying the impacts of Hurricane Katrina on New Orleans and the coastline of Louisiana and Mississippi. This case study allowed us to combine night light data with local population and economic statistics, while we can also relate our findings to a variety of studies that have examined the direct and indirect socioeconomic impacts of Katrina in detail. The following main lessons emerge from our study.
First, the immediate effects observed in night lights reflect well the heterogenous severity of direct impacts of the hurricane in the different geographical areas. We find a clear correlation between reduction in night light intensity in the year of Katrina and the degree of housing damage recorded in the affected counties. Overall, the heaviest-hit counties show the largest declines in night light intensity, and light intensity recovers to pre-disaster levels in the subsequent years. This observation suggests that night lights can be used as an indicator for the short-term severity of a natural disaster and reveal worst-hit areas, echoing findings reported by Gillespie et al. (2014) on the impacts of the 2004 Indian Ocean tsunami in Sumatra.
Second, our results show that change in light intensity is mostly reflective of changes in resident population and the total number of employed people within the affected area and is less so but positively related to aggregate income and real GDP. We also find that the correlation between night light intensity and the considered economic indicators is much stronger after Hurricane Katrina struck than before. The positive and – in the case of population and employment – strong correlations with economic activity demonstrate that changes in night light intensity can be successfully used to capture local effects on economic activity of a large natural disaster, such as Hurricane Katrina.
Nonetheless, we also identified several limitations to the night light approach. First, population losses in some counties, such as Orleans, were much more severe than the night lights presented. This may be explained by the fact that Katrina made landfall in August, thus comprising only a third of the mean annual night light intensity of the area. Population recovery patterns are also observed in the amount of night light, but recovery in light intensity is faster and does not accurately reflect permanent population decline. We similarly find that recovery of night lights is more substantial in hard-hit counties compared to the actual recovery of income and GDP.
A major part of the explanation is likely top coding of the DMSP night light data in urban centers, which makes part of the change in light invisible to the censor. However, we stress that although top coding is an issue in the studied area, we can still observe the impacts of the hurricane quite clearly. Studying areas with a lower degree of top coding, which is a much smaller problem even within urban areas in developing countries (Kocornik-Mina et al., 2020), may therefore reveal stronger relationships between light intensity and economic indicators. In future research, the newer Visible Infrared Imaging Radiometer Suite (VIIRS) data could be used to address the issue of top coding (see Elvidge et al., 2013), although only for events after early 2012. Recent examples are Zhao et al. (2018) and Gao et al. (2020), who study the effects of Hurricane Irma and Hurricane Maria on light intensity in Puerto Rico and the 2015 Ghorka earthquake in Nepal, respectively.
Second, our results also indicate that night lights are no substitute for assessments of economic data if the aim is to obtain a profound understanding of the economic consequences of a natural disaster. In-depth analysis of economic data, such as sectoral impacts and wage development, provides more detailed insights than night light data. For instance, economic impacts of Hurricane Katrina were a complex combination of disruptions in certain sectors and positive effects for sectors involved in reconstruction as well as substitution effects between companies within a sector (Vigdor, 2008; Hallegatte, 2008). Such complexity cannot be disentangled with night light data. Concerning individual economic outcomes, Deryugina et al. (2018) show based on tax return data that Katrina victims eventually experienced higher wage growth than non-victims. These in-depth analyses of economic data indicate positive long-run economic effects of the hurricane for households, which cannot be directly derived from analyses of night light data. Combining the insights from these studies and applying them to the effects of Katrina is important to understand the value of night light data in this context for two reasons. First, night light intensity is spatially explicit and highly detailed but reflects an immobile area rather than its mobile residents. Focusing on the impacted counties alone therefore does not consider general equilibrium effects and potential spillovers of population and economic activity towards neighboring counties. Xiao and Nilawar (2013) provide an example of how such effects occurred in less-affected counties in the case of Katrina, and Felbermayr et al. (2022) apply this framework more generally in a global analysis of disaster impacts on local economic activity. Second, displaced population results in lower population numbers in the affected areas, and recovery of an area's economy depends on a combination of return migration, reconstruction, and recovery of and/or new economic activity. Using night light intensity, we can only ascertain the combined derivative of these processes.
We also make some observations with respect to findings in the literature on natural disasters and night lights. Most studies in this field report a negative impact of natural disasters on local night lights only in the year of occurrence (e.g., Bertinelli and Strobl, 2013; Gillespie et al., 2014; Elliott et al., 2015; Kocornik-Mina et al., 2020). First, we show here that decreases in night light intensity after severe disasters can span beyond this period for a disaster of this magnitude. This confirms that changes in night light intensity do not just originate from temporary power outages, which remains a concern in some of the studies. Second, we demonstrate that even for this extreme case, recovery of night light intensity is rather quick – in the order of 1 to a few years – whereas recovery in the economic indicators is much slower. This places conclusions in the literature about fast local recovery based on rebounding of night light in a different perspective. For example, Kocornik-Mina et al. (2020) discuss that economic activity within cities does not relocate to less risky areas after the occurrence of a major flood in the city, based on the finding that on average no negative effects on light intensity exist beyond the year of the flood. This is the case, even though the authors limit their study to large-scale urban floods that displaced at least 100 000 people. Our results suggest that night light intensity may only partly reflect reduction in population and economic activity, such that relocation of economic activity and population may have occurred in reality. For the case of Katrina, we indeed show that this happened. We again stress that night lights serve as a means to proxy local economic impacts in areas where no alternative data are available but that this only provides part of the picture.
It is also important to note that we have studied in this paper a highly developed region with high levels of light intensity. Future work in less developed areas, most notably in low-income countries for which data on local economic indicators are available, can help to further develop this method in areas with lower levels of light intensity and different sectoral compositions as compared to our study area. Challenges remain in sparsely populated areas with very little light (see, e.g., Chen and Nordhaus, 2015), where the DMSP data have limited observational capabilities. The newer VIIRS night light data solve this problem but only for events starting in 2012. It should also be noted that we have studied an area with mainly industrial and service sector activities. In regions with substantially higher shares of agricultural activity, night light data likely capture only part of total economic activity (see, e.g., Keola et al., 2015). Finally, future research can conduct similar analyses as undertaken in this study for other natural disasters to improve our understanding of the interpretation of night light data for direct impact and recovery, especially for disaster events of a less extreme nature than Hurricane Katrina.
We conclude that changes in night light intensity prove a valuable proxy for changes in local economic activity following a natural disaster, despite the various shortcomings discussed in this paper. Analyses of disaster impacts using night light data are ideally complemented with detailed analysis of economic data which provide additional, more-in-depth insights into disaster impacts, such as we discussed for our case. Nevertheless, in areas where such economic data are unavailable, our results suggest that night light data can be used to approximate the impacts of natural disasters on regional economies.
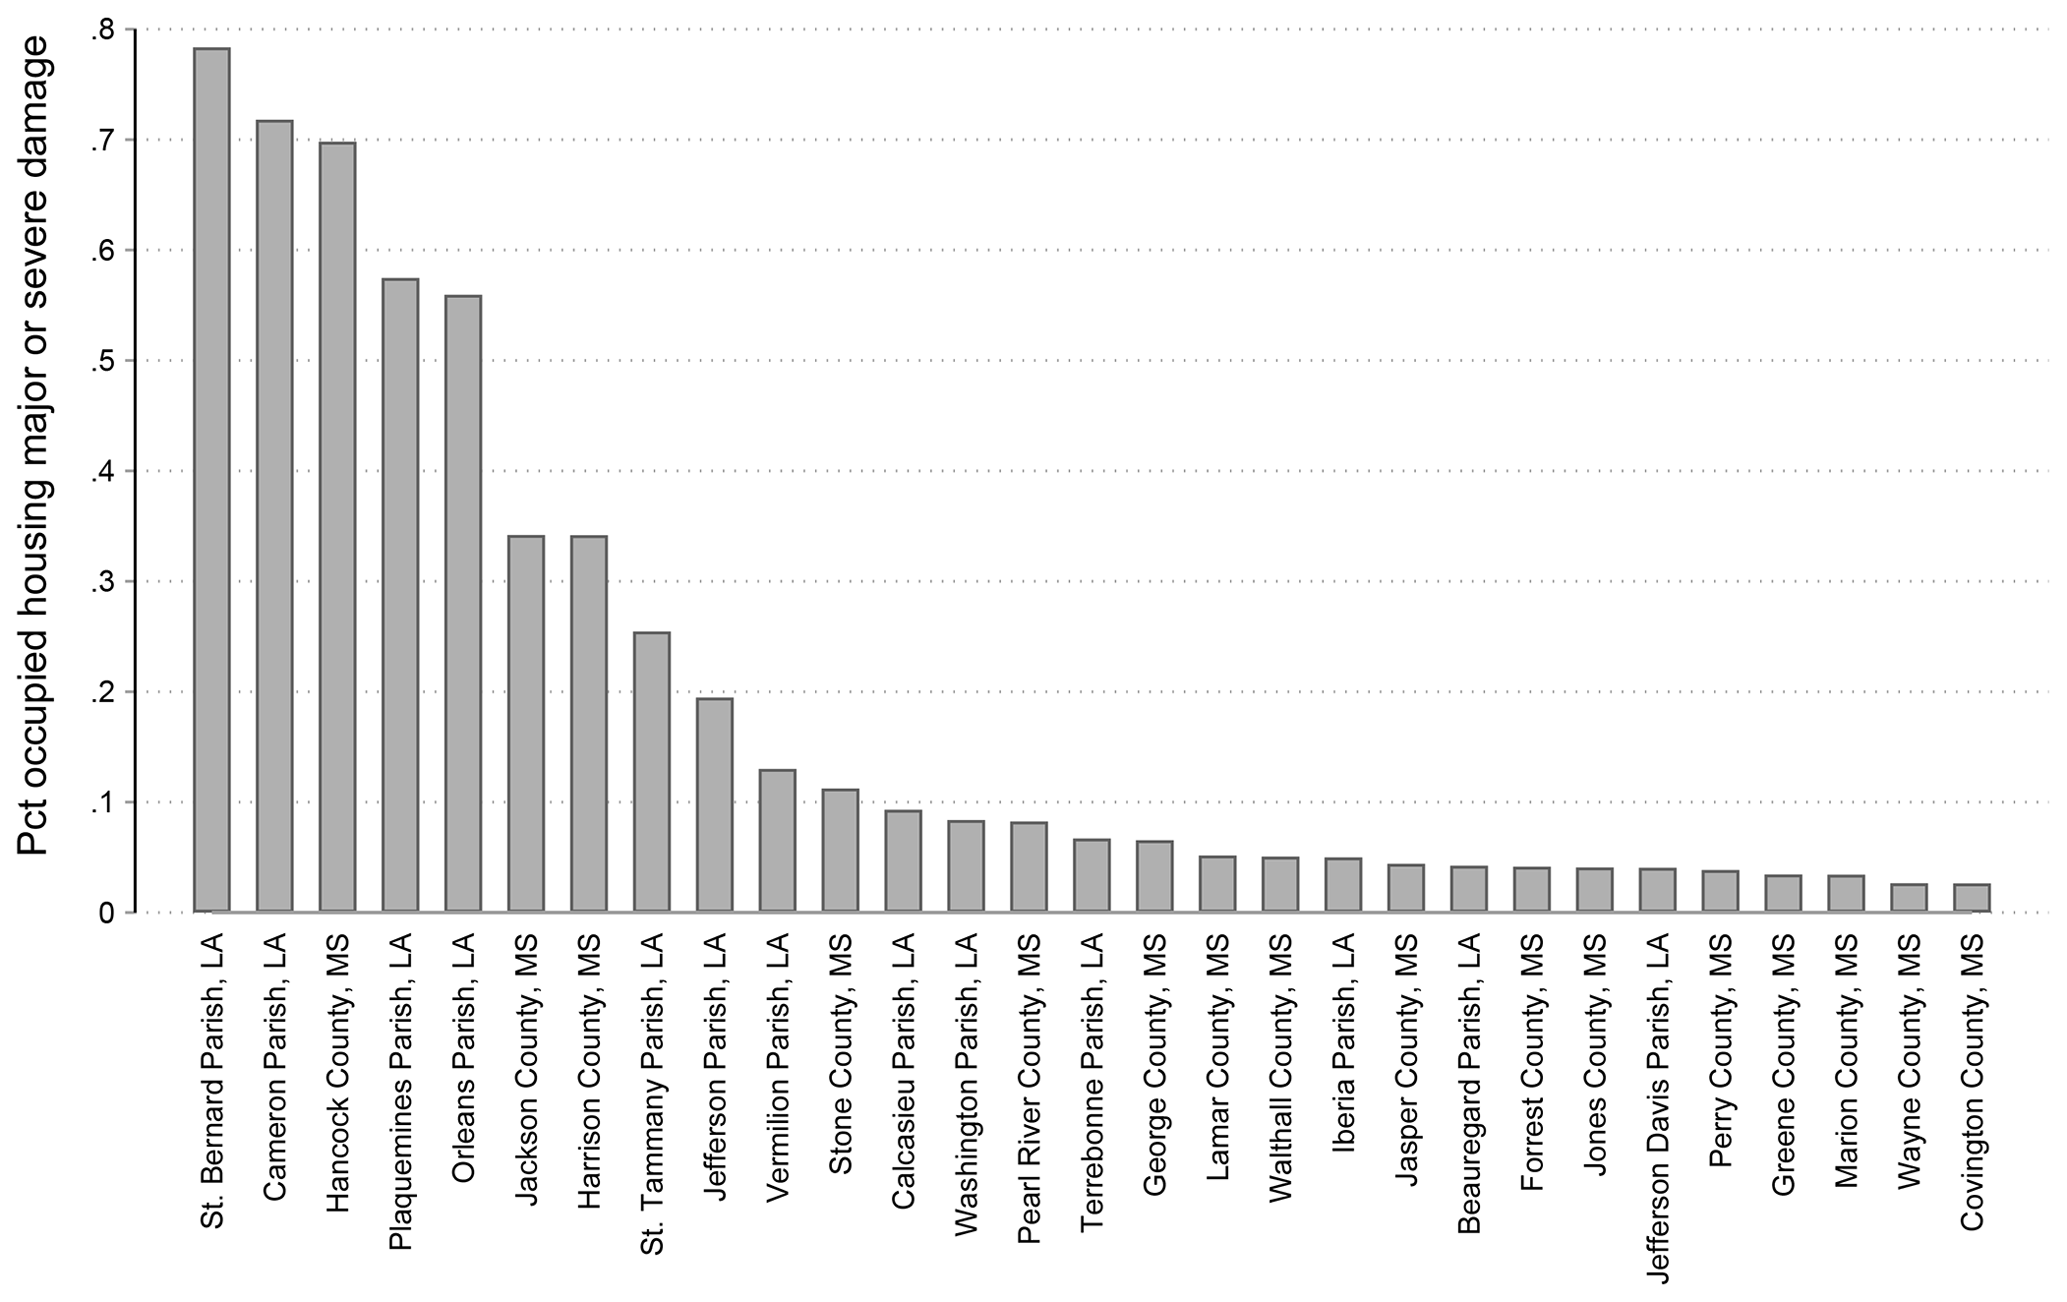
Figure A1Distribution of damage to occupied housing units. Based on own calculations. Data on housing damage in 2005 from the U.S. Department of Housing and Urban Development (2006). Note that the extremely high housing damage figure for Cameron Parish relates to Hurricane Rita rather than Katrina, as is the case for the counties Vermilion and Calcasieu.
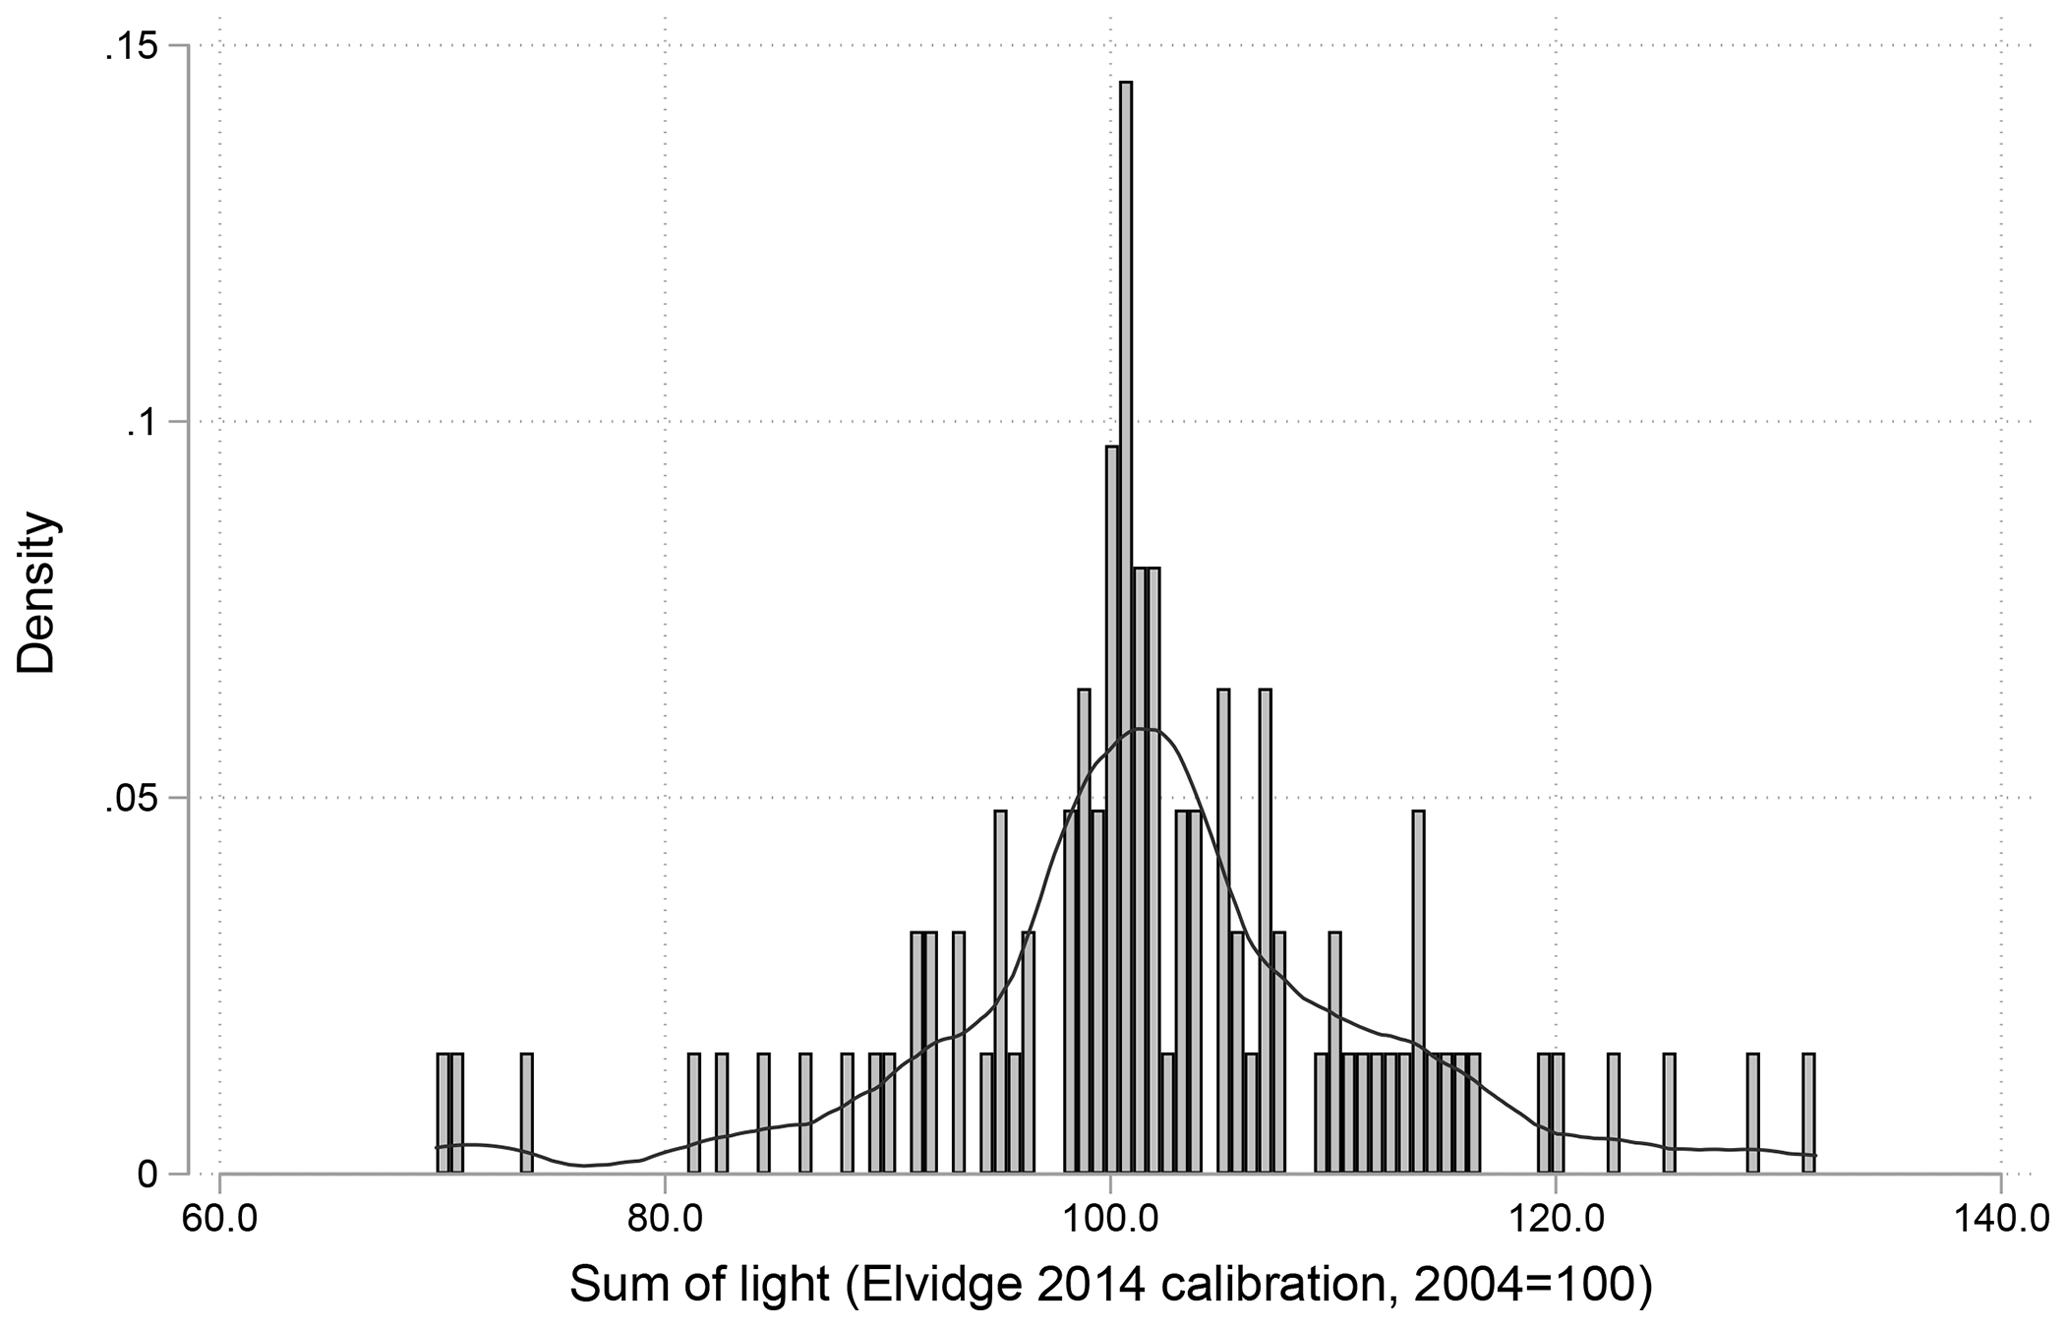
Figure A2Histogram of changes in night light intensity between 2004 and 2005 for the affected area. Based on own calculations. Affected area refers to all counties with non-missing housing damage based on the report from the U.S. Department of Housing and Urban Development (2006), i.e., those included in Fig. 2. Nighttime lights are calibrated using the Elvidge et al. (2014) method and indexed with 2004 = 100. A kernel density is plotted on top. Given the approximate normality of the distribution, the maps about changes in night lights make use of a standard deviation method for color coding.
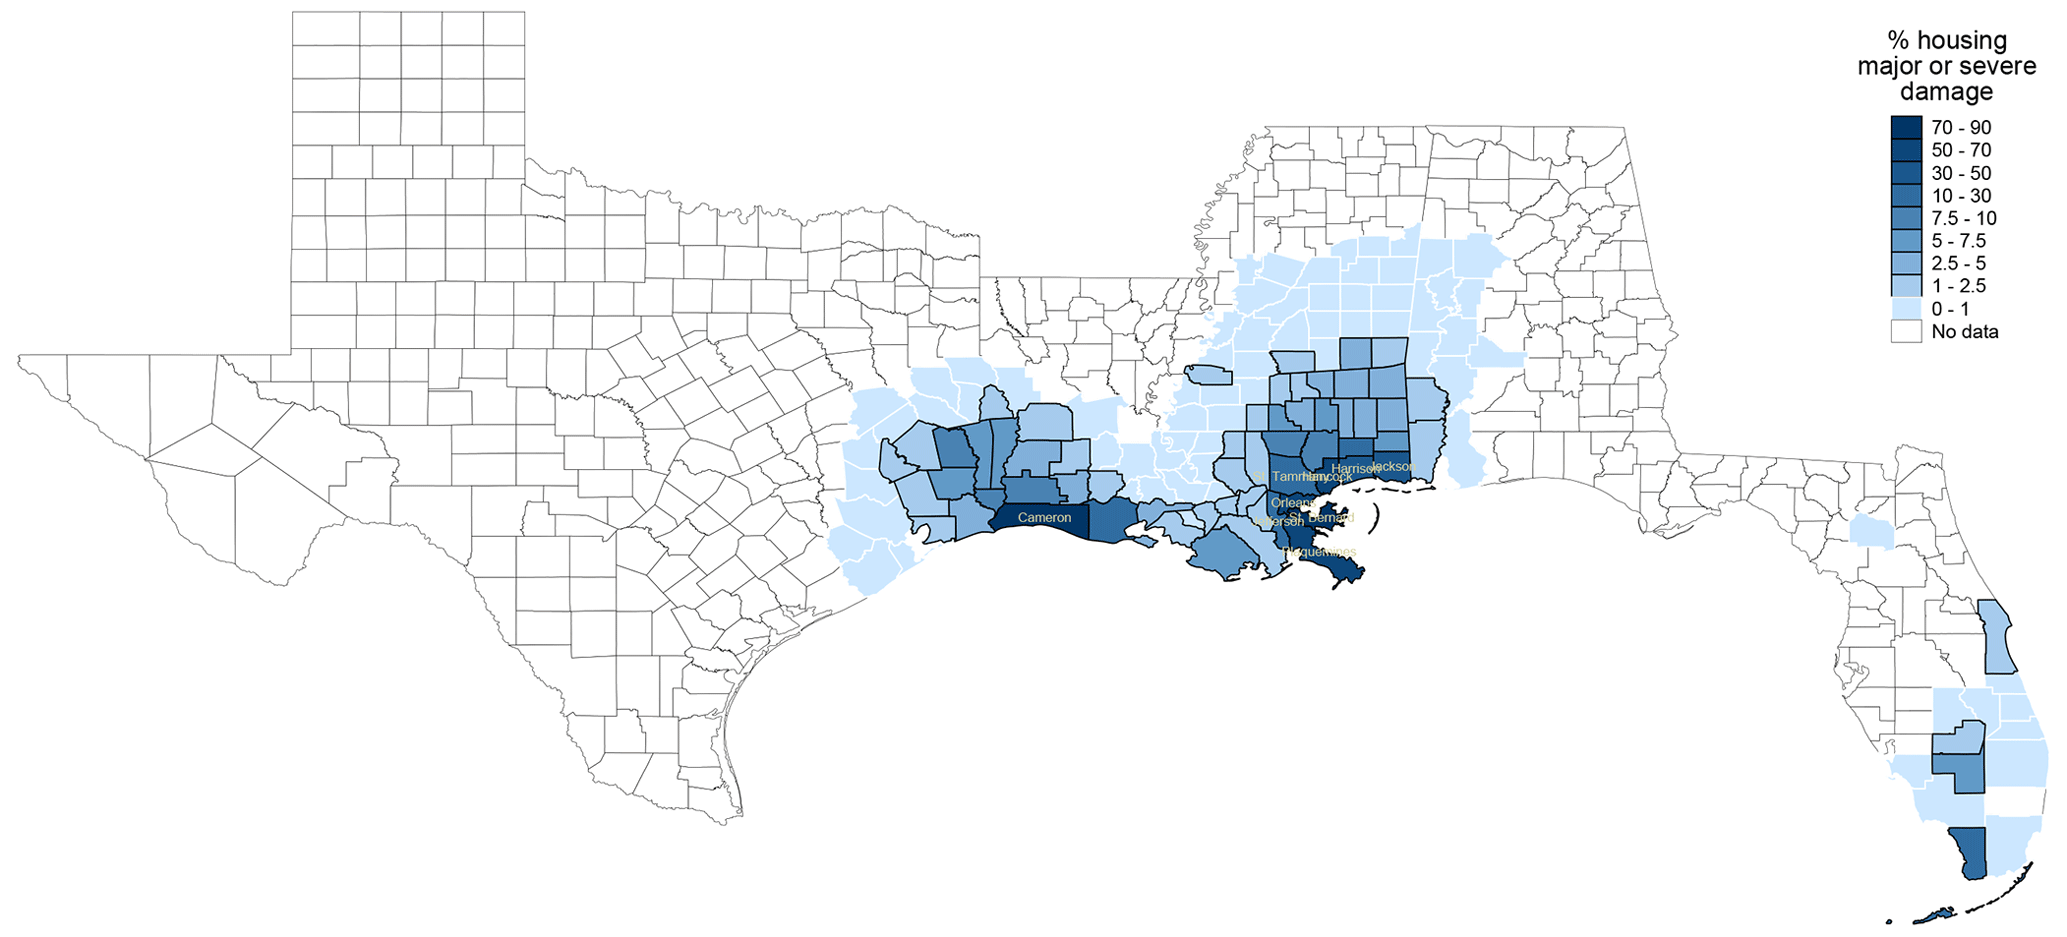
Figure A3Housing damage due to hurricanes Katrina, Rita, and Wilma. Data for the states of Texas, Louisiana, Mississippi, Alabama, and Florida. Own calculations, based on U.S. Department of Housing and Urban Development (2006) data from FEMA Individual Assistance registrants and Small Business Administration disaster loan applications. Counties with major/severe damage of 15 % or more are labeled in the map. Damages for the counties in western Louisiana are related to Hurricane Rita, which made landfall on the coastline of Texas on 24 September 2005. Most notable is Cameron County, with major or severe damage to over 70 % of its housing stock. Hurricane Wilma made landfall in the south of Florida on 24 October 2005, causing housing damage to several thousands of homes making up at most 10 % of the housing stock in affected counties.
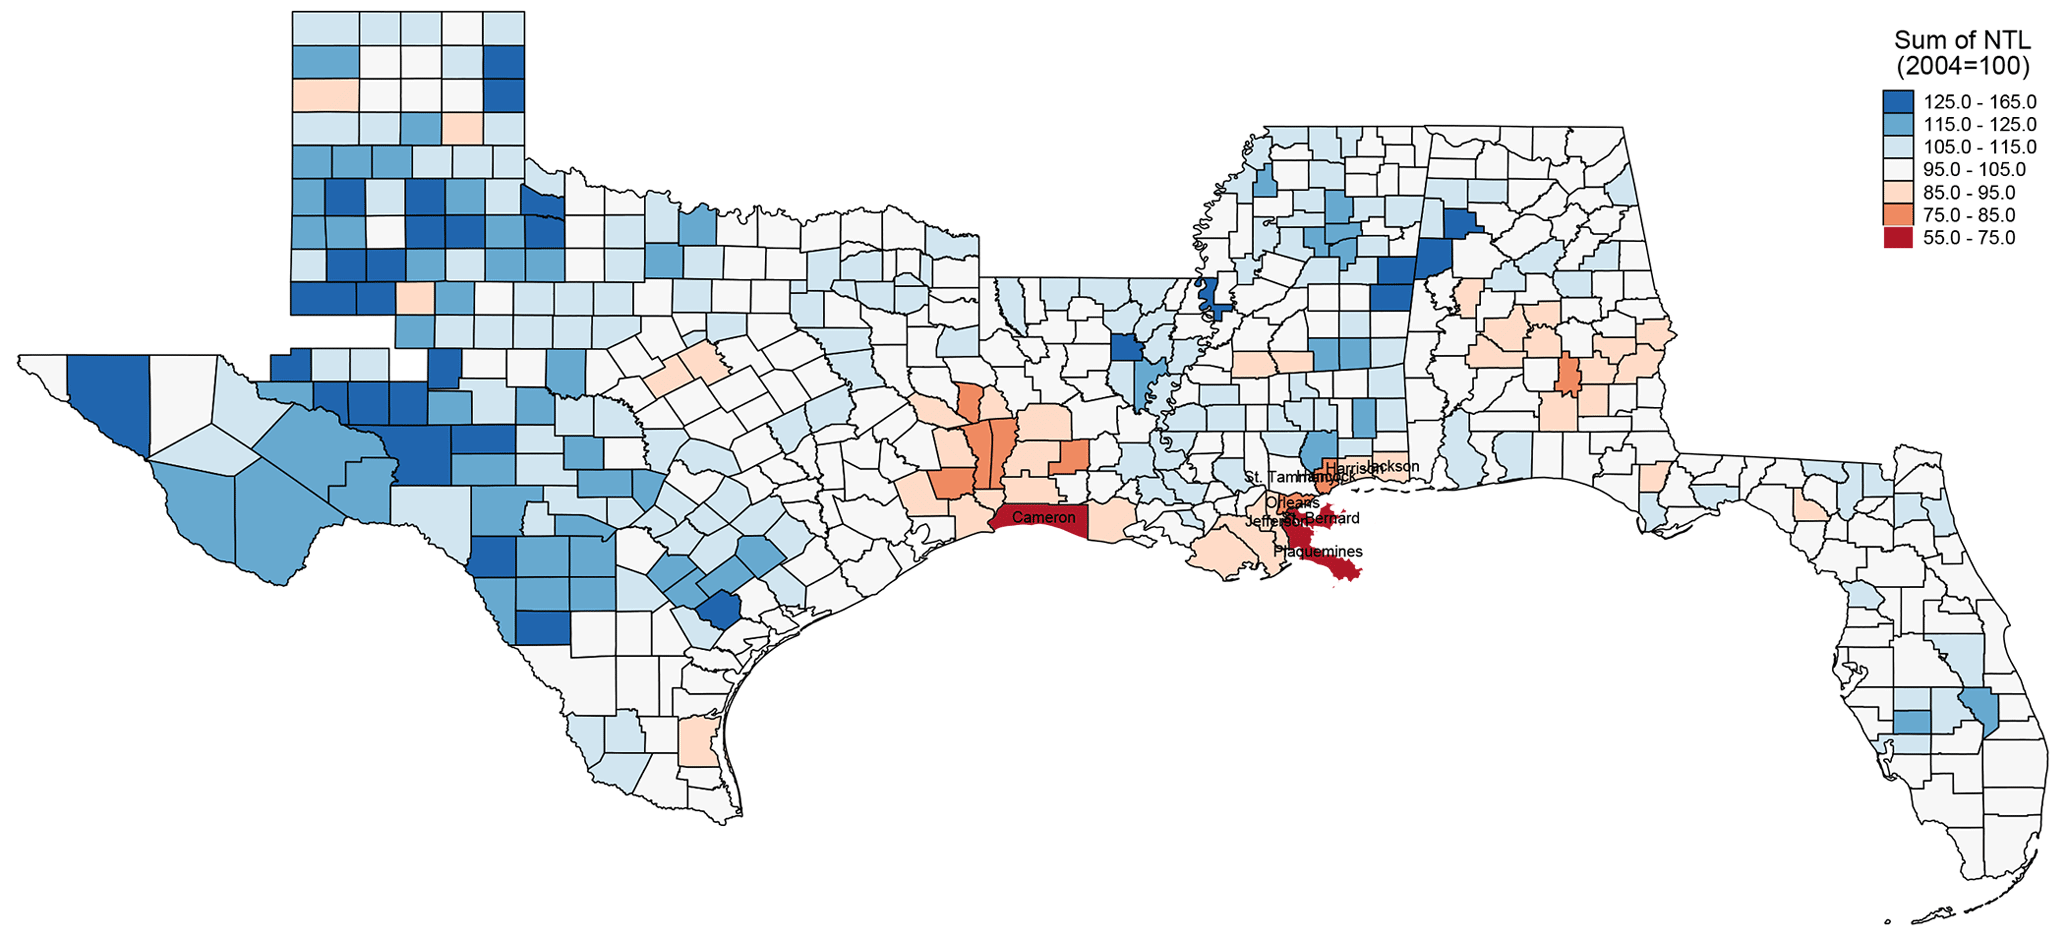
Figure A4Change in light intensity in 2005, including all states affected by hurricanes Katrina, Rita, and Wilma. Night light reduction by county between 2004 and 2005, with the sum of light intensity indexed to 2004 = 100. Values below 100 indicate a reduction in light intensity with respect to 2005, while values above 100 indicate an increase. Based on own calculations. Sum of night light is based on calibrated light series using the Elvidge et al. (2014) method, discussed in detail in Sect. 2.3. Note that the pattern for Hurricane Rita is similar to that of Hurricane Katrina in terms of damages and reduction in night light intensity reductions. In line with a lower degree of housing damage due to Hurricane Wilma in the south of Florida, we do not observe major reductions in light intensity there.
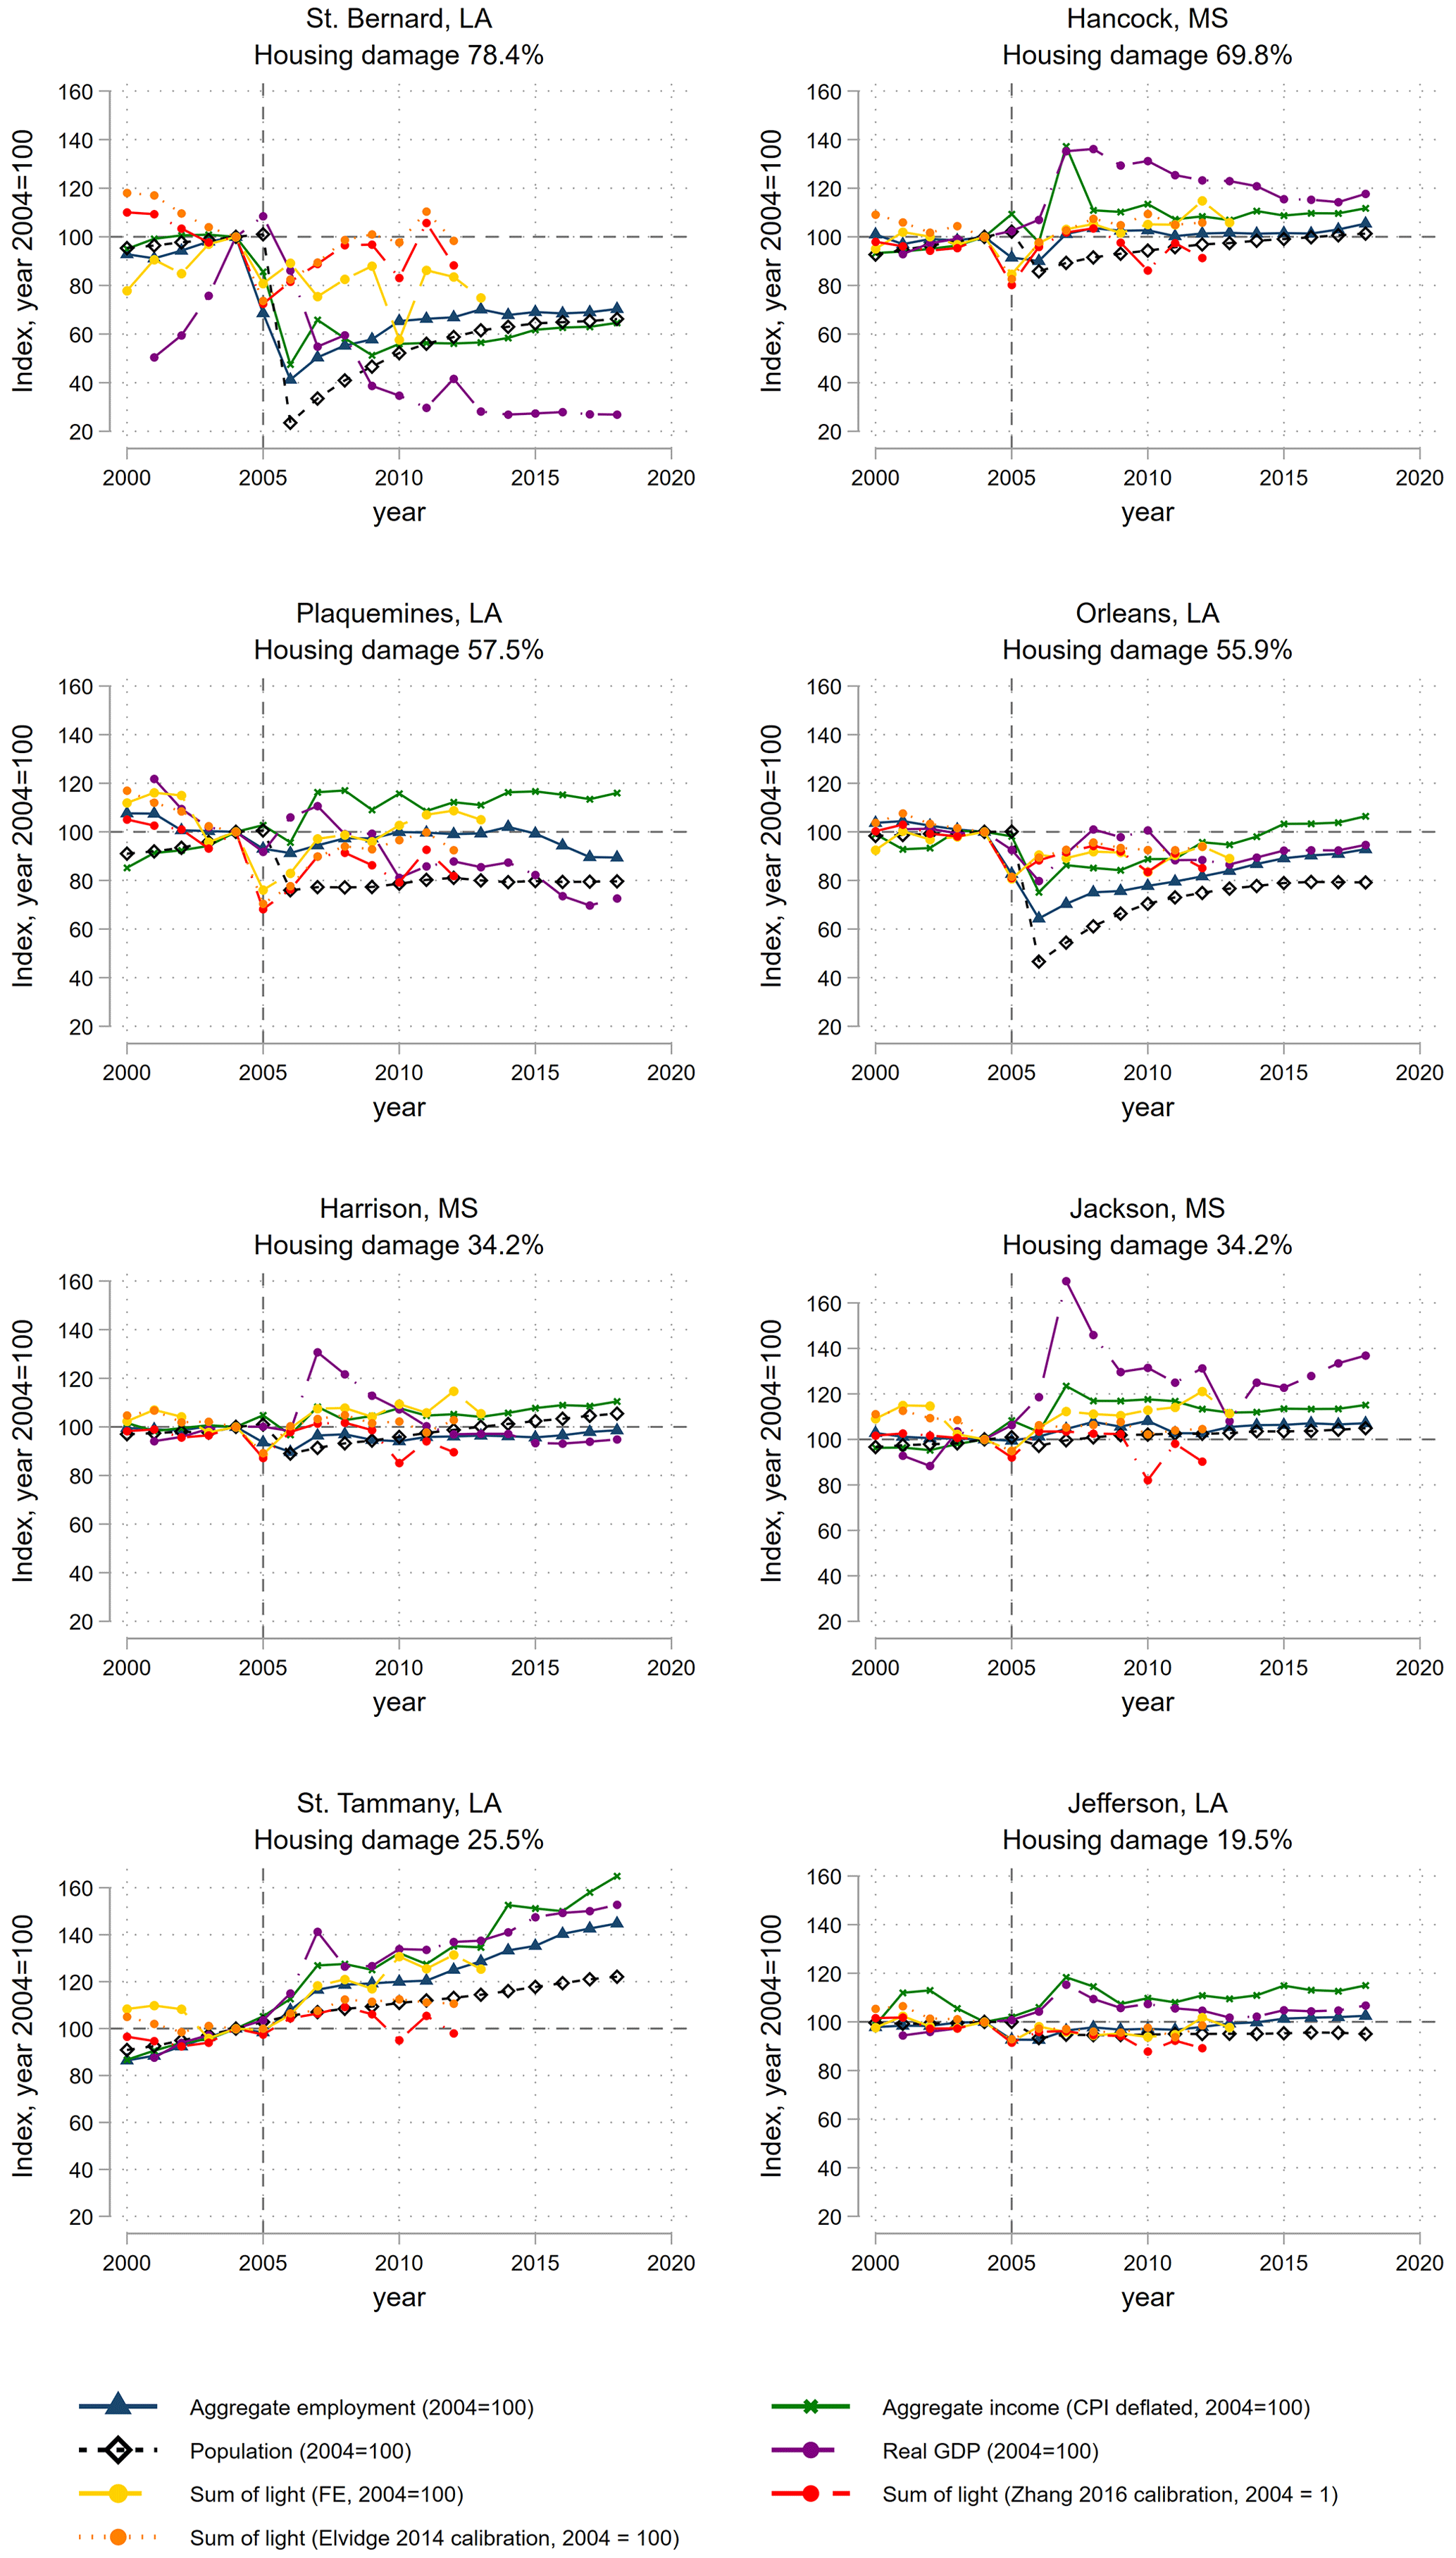
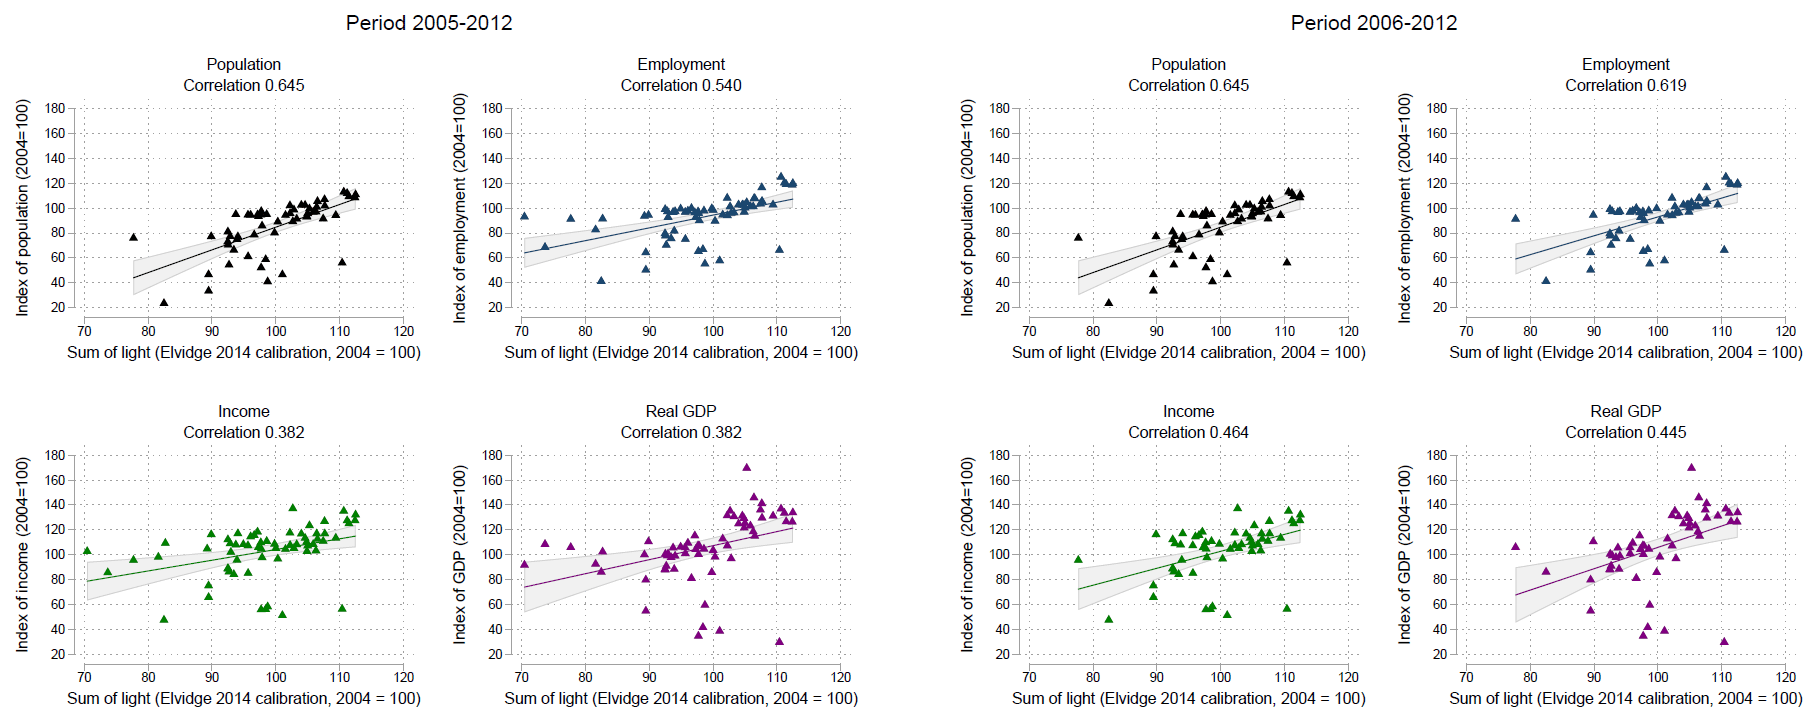
Figure A6Indexed economic indicators and total sum of light for the eight affected counties after Katrina (starting in 2005 vs. 2006). Correlations of economic indicators and night lights (varying years). Night lights based on Elvidge et al. (2014) calibration, indexed to 2004 = 100. Right panel: population data are for 2006–2012 only.
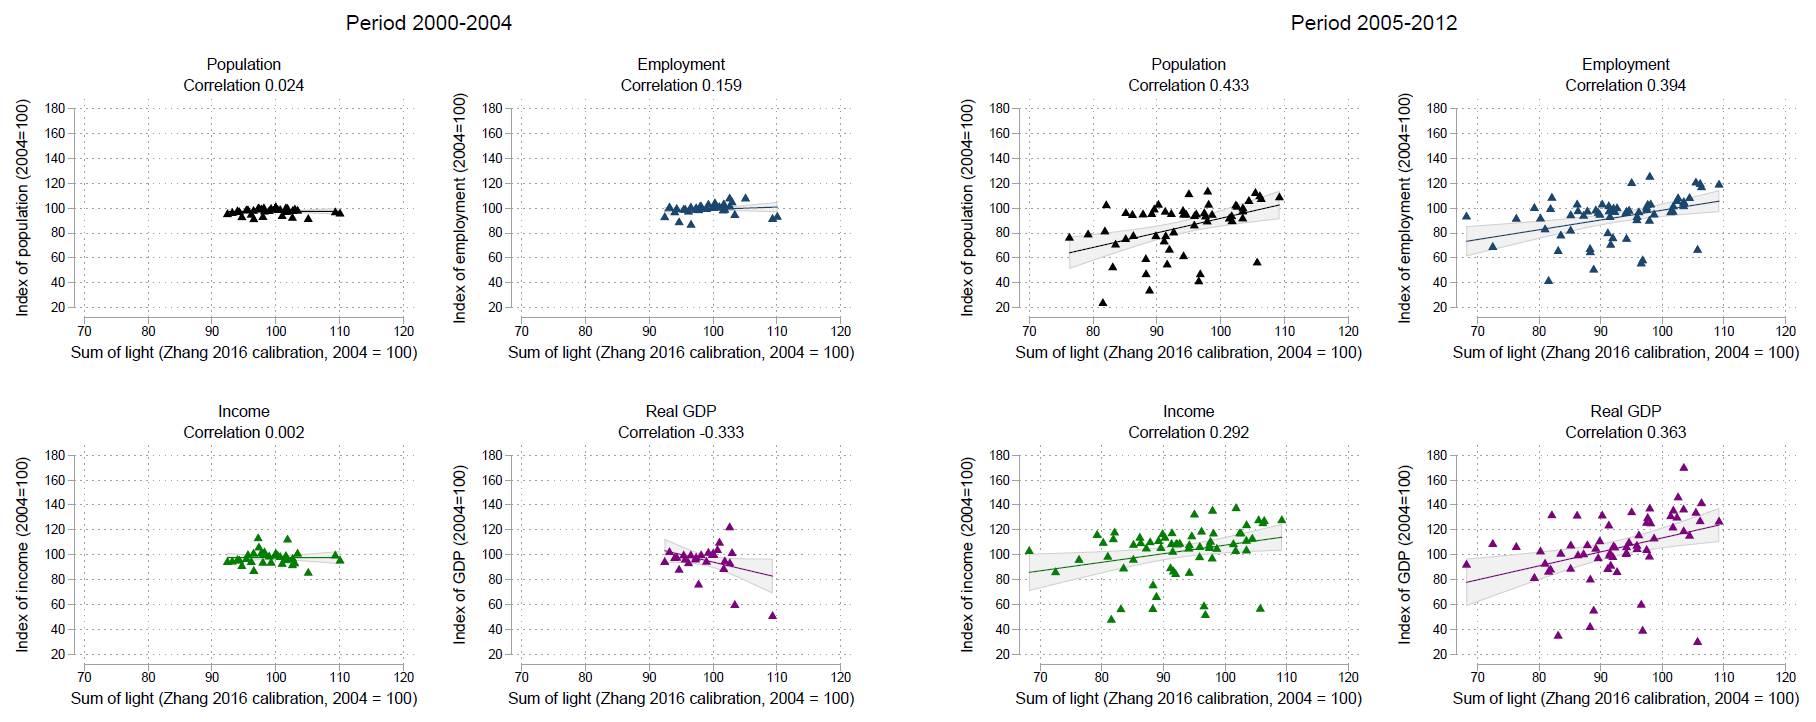
Figure A7Indexed economic indicators and total sum of light for the eight affected counties before Katrina. Correlations of economic indicators and night lights (Zhang calibration). Night lights based on Zhang et al. (2016) calibration, indexed to 2004 = 100. Right panel: population data are for 2006–2012 only.
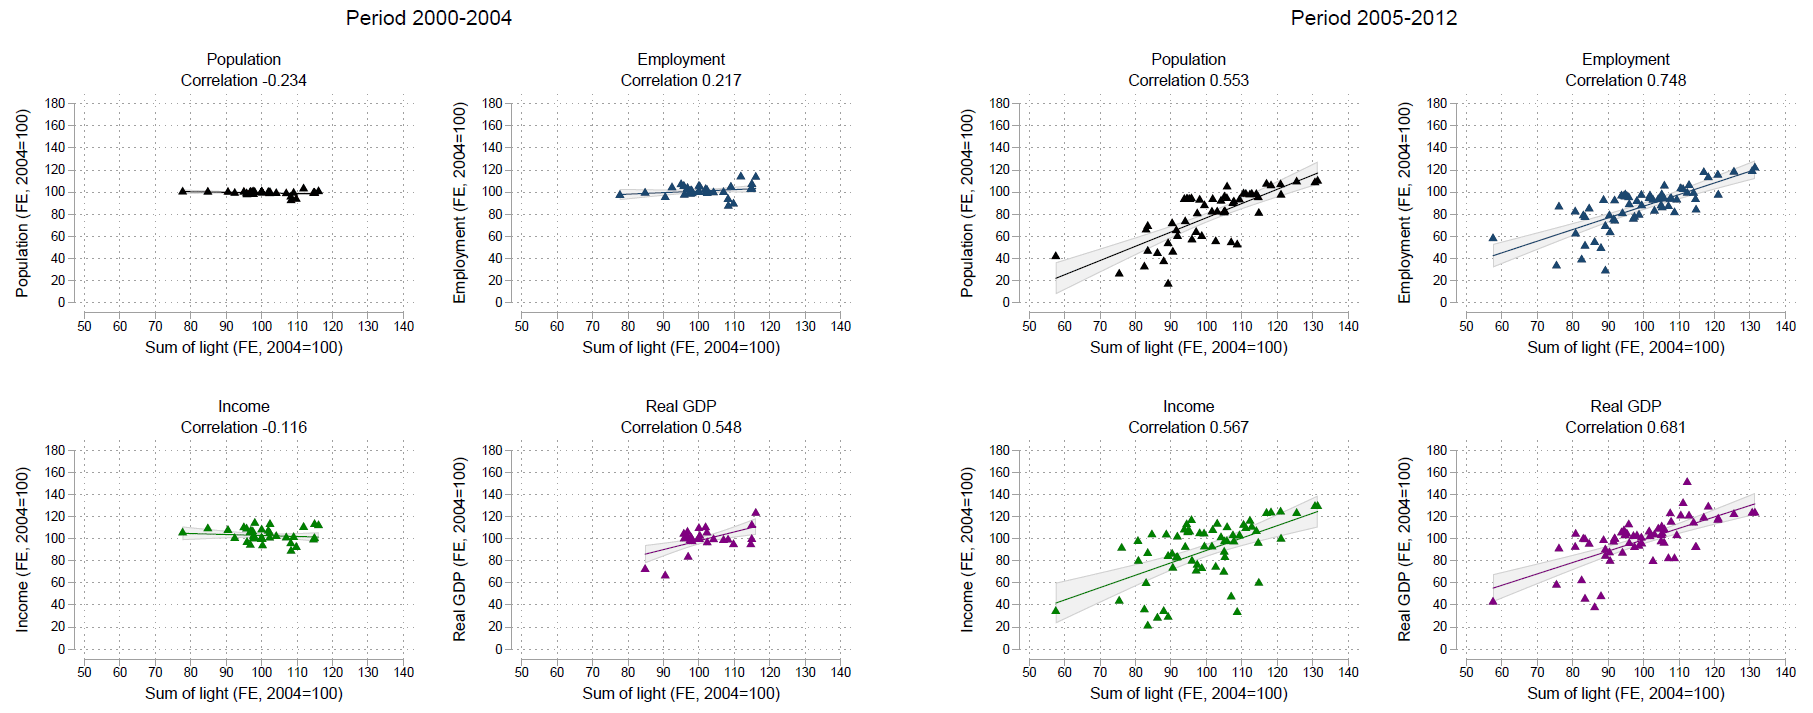
Figure A8Indexed economic indicators and total sum of light for the eight affected counties before Katrina. Night lights based on fixed-effects correction, indexed to 2004 = 100. See Appendix B for methodology. Right panel: population data are for 2006–2012 only.
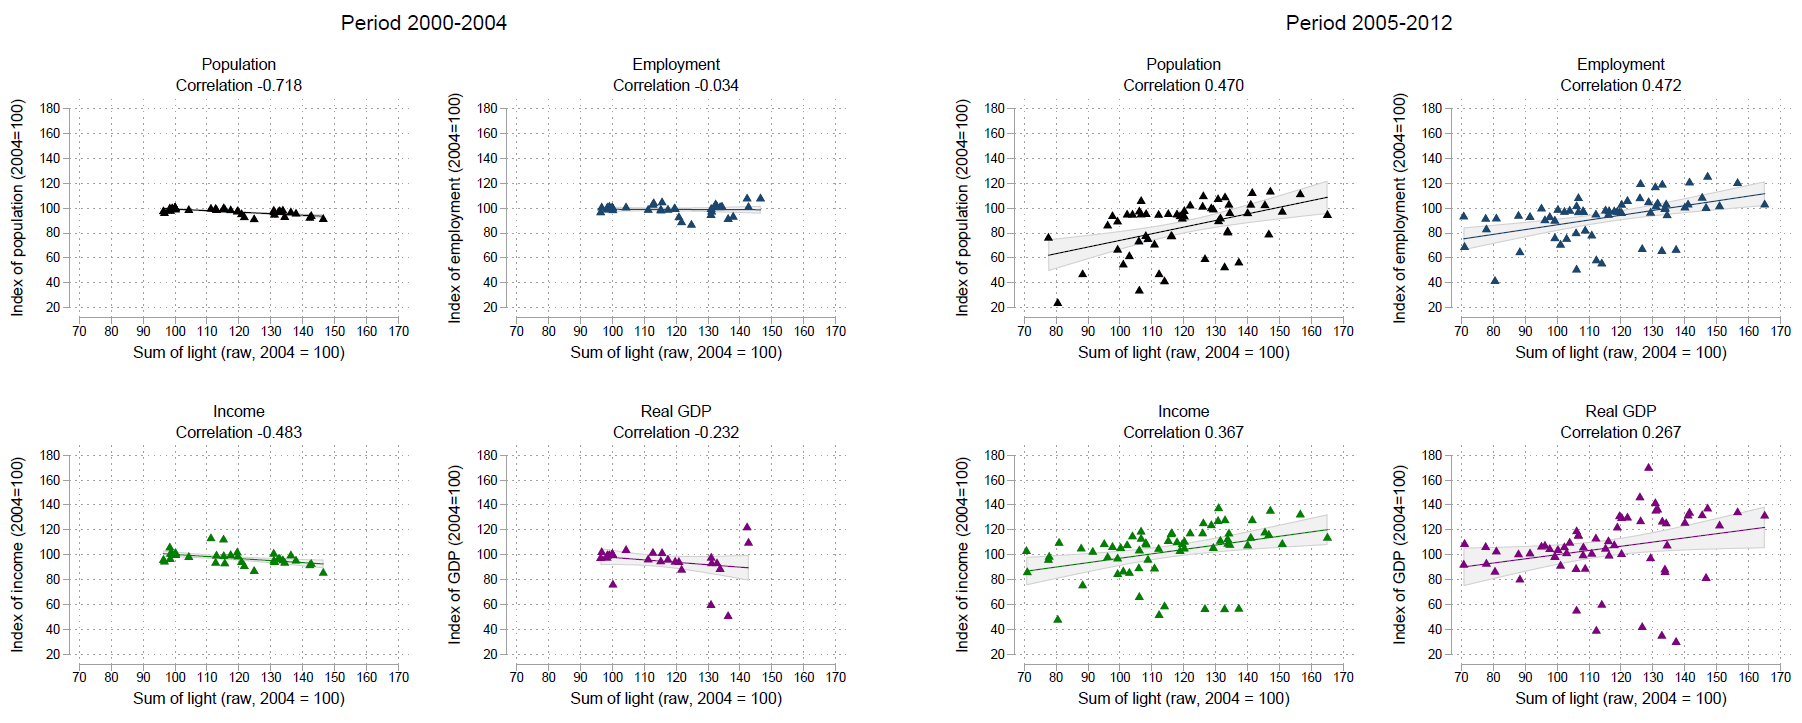
Figure A9Indexed economic indicators and total sum of light for the eight affected counties before Katrina (raw data). Correlations of economic indicators and night lights (raw data). Raw night light data, indexed to 2004 = 100. Right panel: population data are for 2006–2012 only.
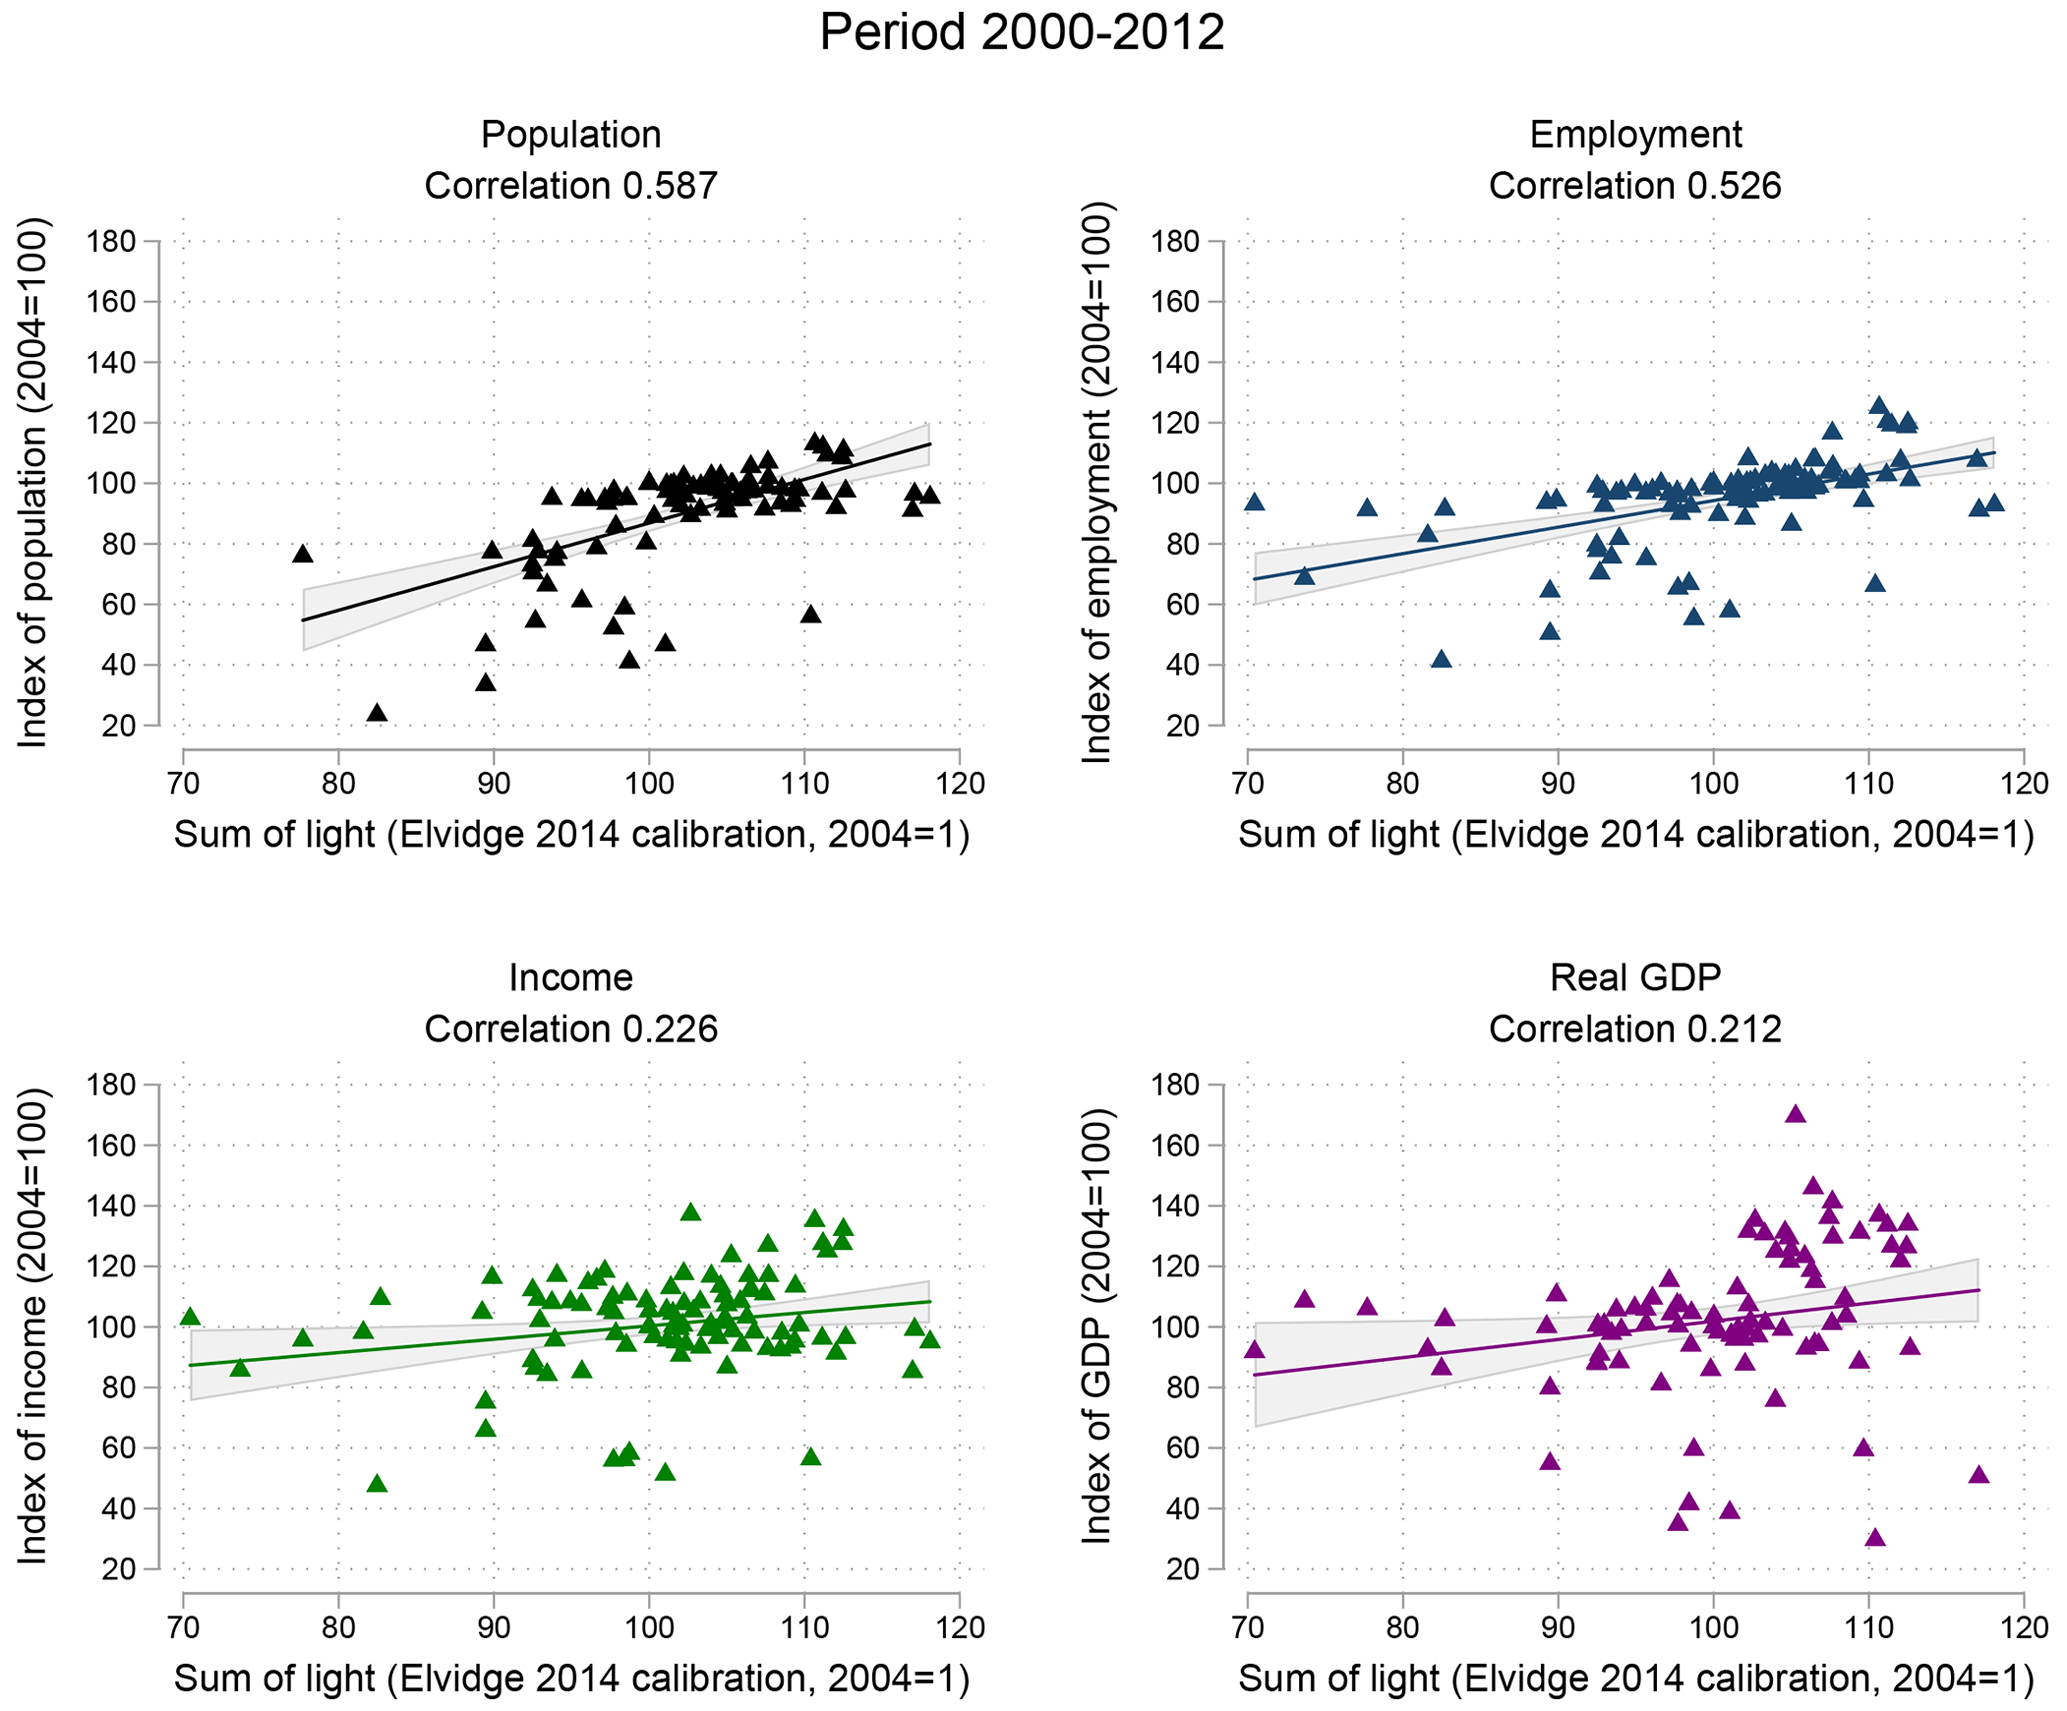
Figure A10Indexed economic indicators and total sum of light for the eight affected counties after Katrina (2000–2012). Correlations of economic indicators and night lights. Night lights based on Elvidge et al. (2014) calibration, indexed to 2004 = 100. Population data exclude the year 2005.
The DMSP annual composite data are known for their problematic intertemporal and between-satellite measurement differences, making it difficult to compare night light intensity over an area across time. The problem stems from the lack of systematic recording of changes in gain settings of the DMSP-OLS sensor that vary across time and between satellites. The reason for this is the main function of the satellite being to detect moonlit clouds rather than that of artificial night light per se (Elvidge et al., 2009a). As a result, while the annual composites retain a range of DN0 to DN63 (with DN meaning digital number), the true respective radiance associated with these digital numbers varies between the different satellite-year composites. This makes direct comparison of raw digital numbers across years problematic.
A number of approaches have been suggested in the literature, which can be generally grouped into two main classes. First, the approach from remote sensing is to calibrate the annual composite images to a reference image, being either an area that is assumed to have invariant night light intensity over time (e.g., Elvidge et al., 2009a, 2014; Wu et al., 2013) or by making use of a globally or regionally consistent bias across images (e.g., Zhang et al., 2016; Li et al., 2013). The basic idea of the invariant area method is that any differences in night light intensity between yearly images are the result of measurement error and thus contain the difference in gain settings between the various satellite-year images. By globally calibrating the year images to this reference area, a corrected time series is produced. A meta-analysis of this approach is discussed in detail by Pandey et al. (2017), who find that among the existing calibration studies Zhang et al. (2016) and Elvidge et al. (2014) produce the most consistent calibration results, with only marginal differences between the two when assessing the global images.20
The second approach finds its origin in the economic literature that makes use of night lights and applies a panel fixed-effect setting to address measurement error in night light intensity over time (e.g., Chen and Nordhaus, 2011; Henderson et al., 2012). The basic idea here is that the gain setting changes affect the images in a globally consistent manner, such that estimating a dummy coefficient for changes across years to a reference base year effectively takes out any difference in sensitivity to light intensity across satellite years.21 It is important to note that this correction is applied at the aggregated county level rather than at the pixel level, as is the case for the intercalibration methods. We thus first compute the sum of light intensity by county year based on the uncorrected images. We know from Strobl (2011) that hurricanes do not affect national GDP growth rates in the US and moreover that impacts at the county level net out at the state level within a year. It is therefore safe to assume that we can use the universe of US counties to control for common changes in night light intensity that are unrelated to the landfall of Hurricane Katrina. Note that this also takes out all other changes that are common to the entire United States in night light intensity, resulting from country-wide economic conditions, technological advancement, and energy costs (Henderson et al., 2012).22 While commonly accepted in the economic literature, the fixed-effect approach relies on the assumption that taking out the mean of changes across years is sufficient to correct for measurement changes across time, whereas the calibration method allows for a non-linear effect of the gain settings on the range of digital values in the light composites. This makes the two methods slightly different in their approach for correcting for the measurement differences across time. While not explicitly accounting for non-linearities, however, the fixed-effect approach does not rely on assumptions of an invariant area.
In this appendix we compare the results of the calibration and fixed-effects corrections to the raw data for the eight counties that were most heavily affected by Hurricane Katrina. The calibration series were produced with the coefficients for the second-order polynomial fits reported in Zhang et al. (2016) and Elvidge et al. (2014) respectively. The raw image digital values for each satellite-year composite are then recalculated using the coefficients from the respective studies. In both cases, values were truncated to DN0 at the lower end and to DN63 at the upper end, before aggregating the images to sum of light (SOL) for the US counties (following Elvidge et al., 2014; Pandey et al., 2017).
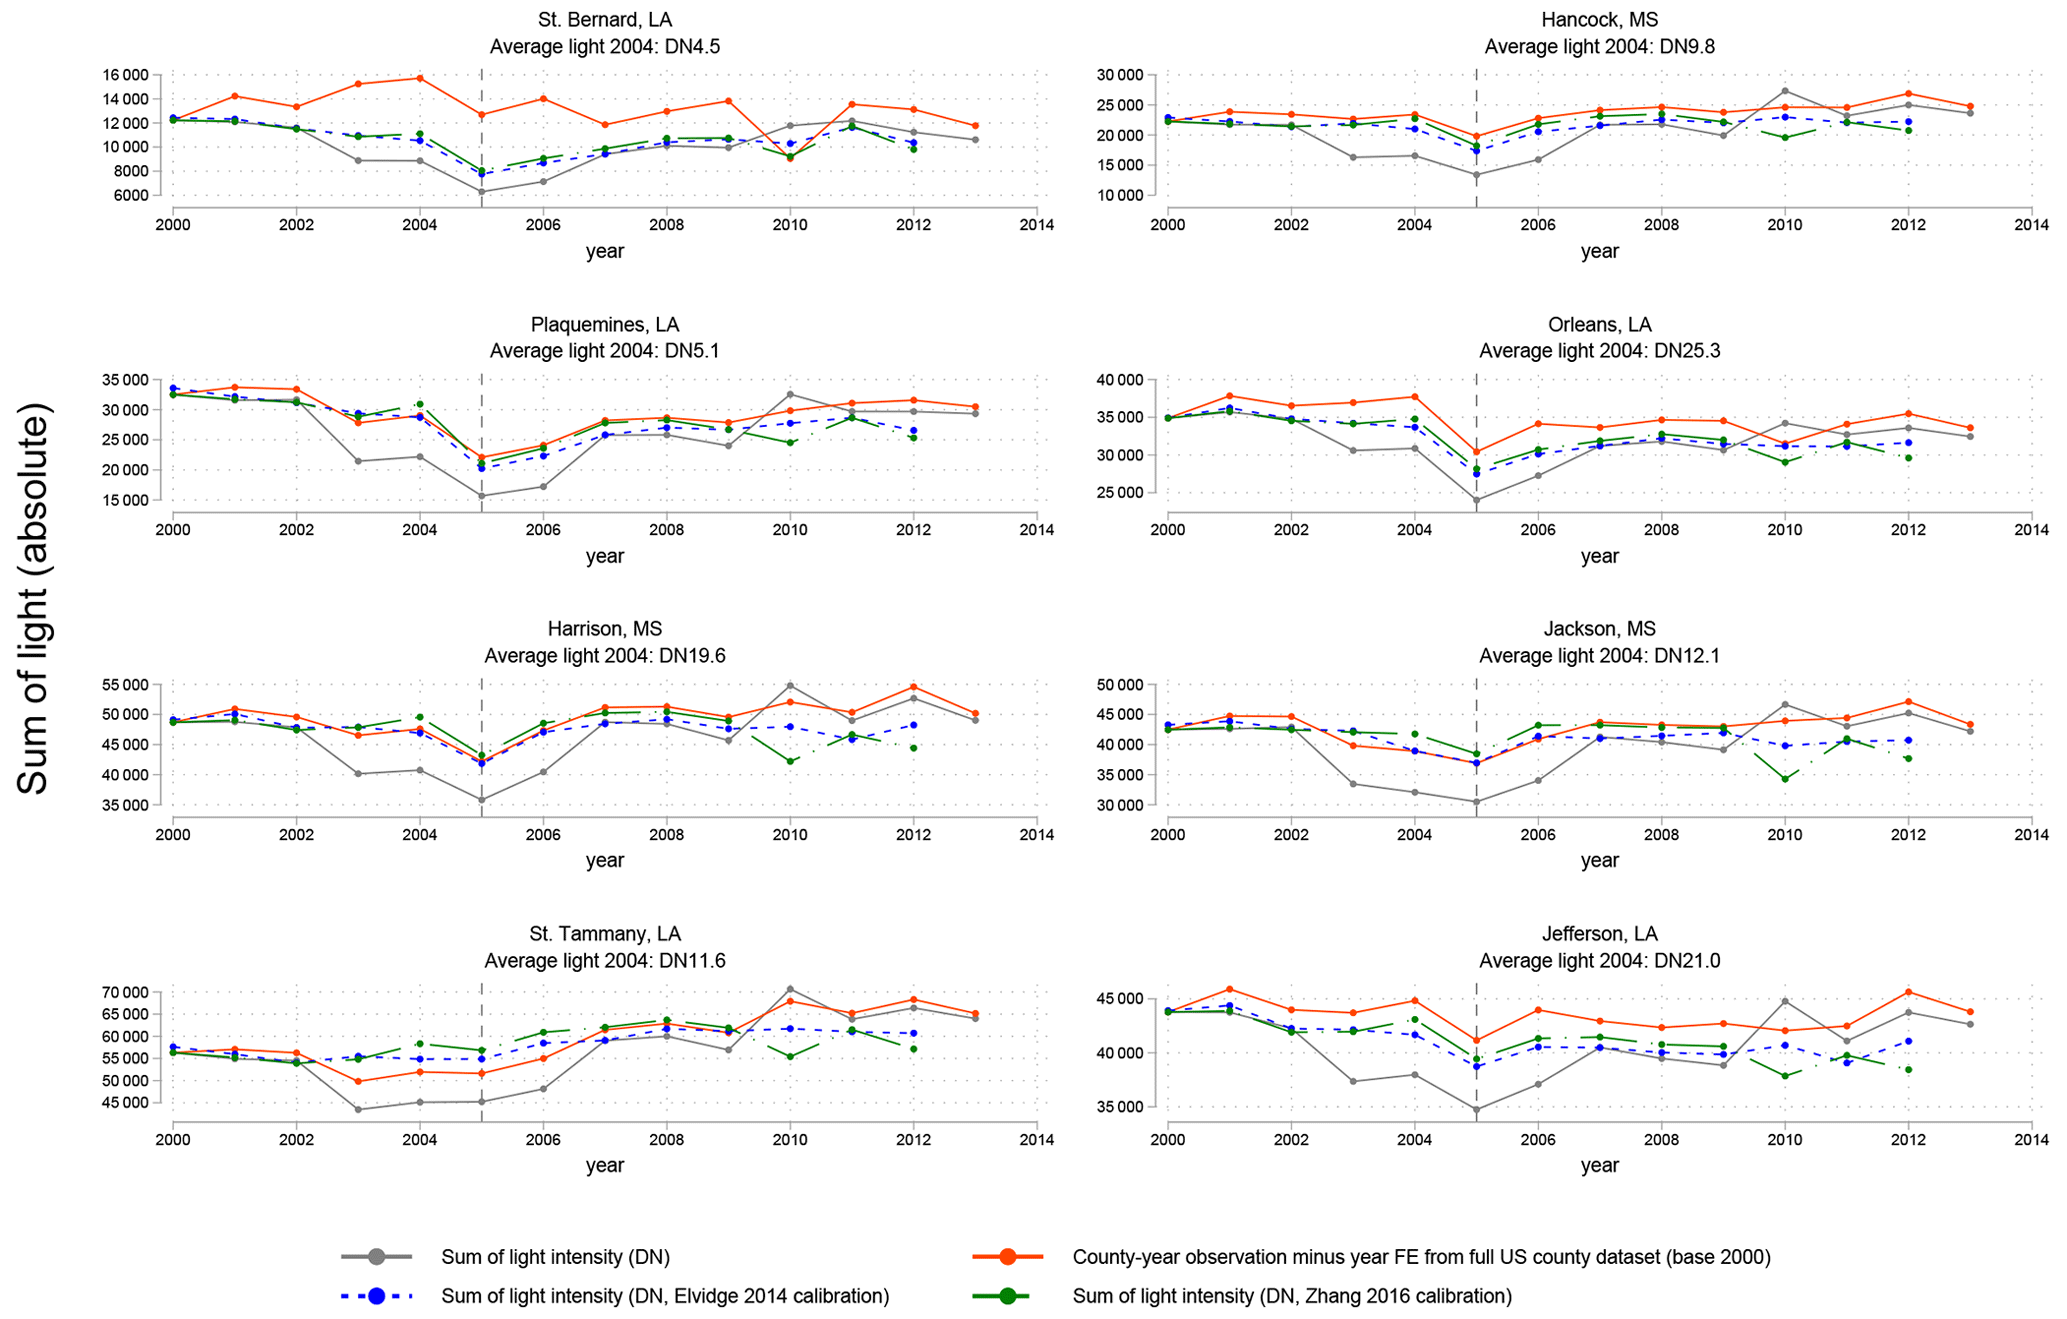
Figure B1Corrected night light data (absolute sum of light). Four series: raw data (gray), fixed-effect adjustment, invariant area calibration (Elvidge et al., 2014), and global consistent bias calibration (Zhang et al., 2016).
The series corrected with the year fixed-effect approach were constructed by first computing the SOL for all US counties (3079 in total) based on the raw images and then adjusted as follows: (1) we estimate a general OLS model, with SOL from the raw images as the dependent variable, and a set of year dummies as the explanatory variable; (2) from this linear model we compute corrected night light intensity by subtracting the estimated coefficients for the year dummies from each county-year observation.
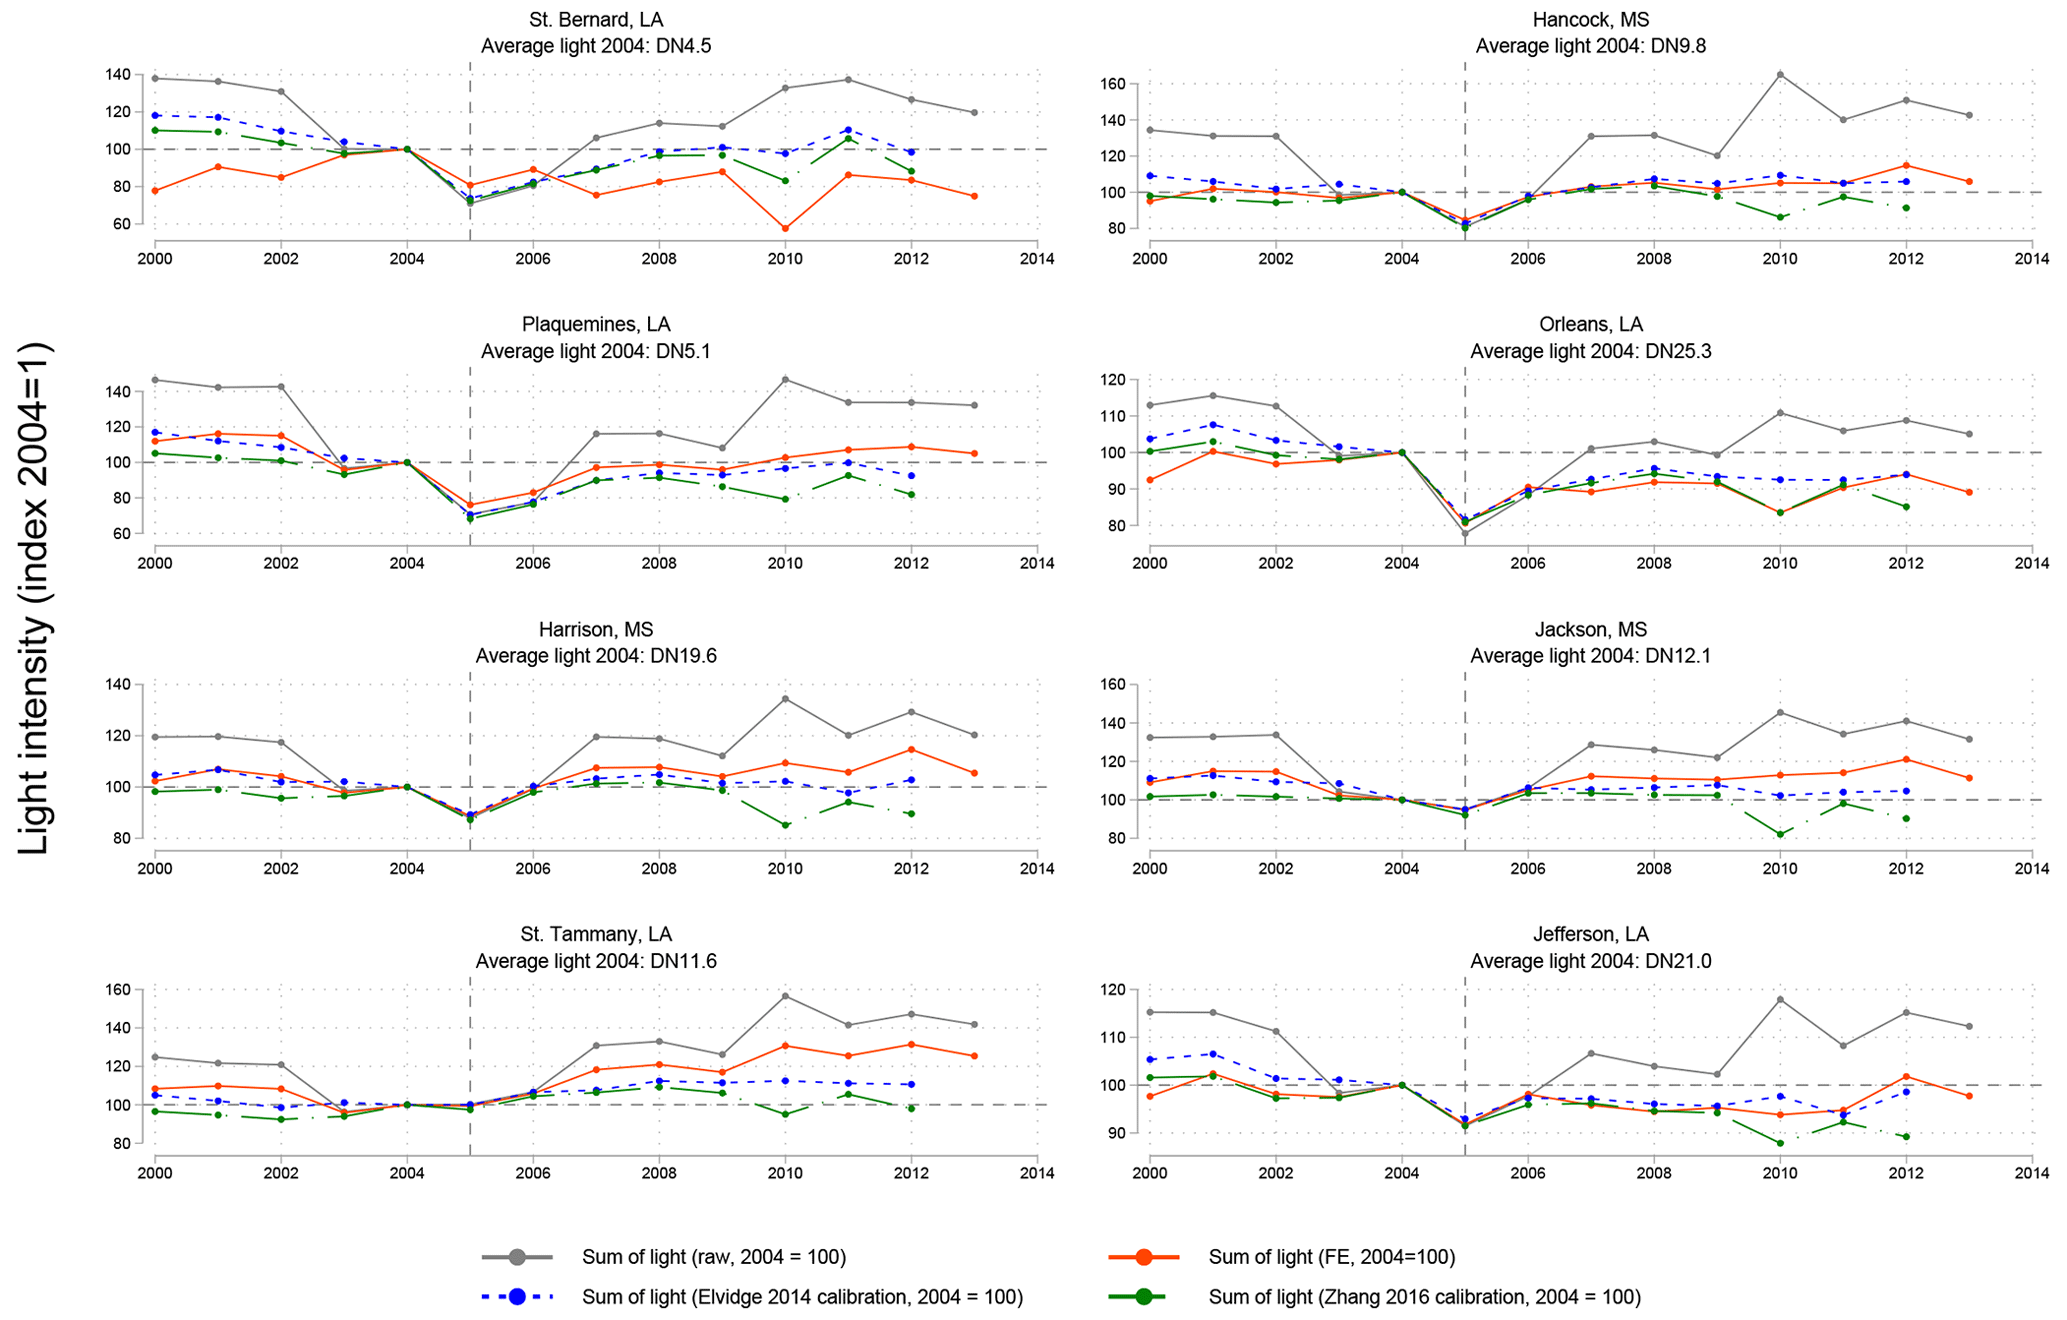
Figure B2Corrected night light data (indexed to 2004 = 100). Four series: raw data (gray), fixed-effect adjustment, invariant area calibration (Elvidge et al., 2014), and global consistent bias calibration (Zhang et al., 2016). Total sum of light by county, indexed to 2004 = 100.
We now discuss the results of the various correction methods. In Figs. B1 and B2 below, we plot the raw series combined with the two calibrated series and the series corrected with the year fixed effects. Figure B1 reports the total sum of light by county. The first and most important observation is that the three alternative corrections to the raw night light data show a high degree of similarity. Note how they are more stable over time than the raw series, notably in the period 2002–2007, and how – with the exception of St. Bernard – the two classes of correction methods follow each other closely. Especially the dip from 2003–2007 in the raw data is evident when compared to the corrected series. This dip is not specific to the affected counties but instead is a feature shared by the entire panel of US counties and is thus taken out in the corrected series.
The case of St. Bernard stands out, since its year fixed-effect correction deviates strongly from the other three series in both absolute terms and in terms of qualitative behavior. This can be explained by its low level of average light intensity with respect to the other counties. In 2004, St. Bernard has an average DN value of DN4.5, compared to the US mean of DN7.3, while the mean of the other seven main affected counties is DN14.9. As such, the fixed-effects correction likely under-corrects the digital values for the latter seven counties, while it overcorrects the values for St. Bernard. This also explains why we find no such deviations between the fixed-effects correction and the calibration corrections for the other counties. While the fixed-effect method relies on fewer assumptions and may be preferred in impact regression frameworks where the focus is on causal impact identification (such as in Bertinelli and Strobl, 2013; Elliott et al., 2015; Felbermayr et al., 2022), the calibration corrections prove more reliable in producing stable county-specific series for the current application. Since our focus is on absolute light levels, the excessive measurement error for individual cases – such as the clear overcorrection of light changes in low-light counties such St. Bernard – hinders the analysis.
Even though corrected absolute levels help us when assessing recovery after Katrina, we can show that regardless of the correction method the changes over time are fairly stable across the correction methods. Figure B2 reports changes over time in indexed series, with 2004 = 100. A number of observations are to be made: (1) the immediate impact of Katrina on the total sum of light in the eight affected counties is close to identical between the four series. That is, while absolute levels may differ, the relative change from 2004 to 2005 is identical across the various series; (2) again, the two calibration methods show striking similarity; (3) as with the absolute levels in Fig. B1, St. Bernard stands out with its fixed-effect correction clearly not performing as intended. Another important feature of the raw data becomes evident when setting it off against the corrected series: while the raw data suggest a relatively quick recovery from Katrina in the subsequent years, both the calibration and fixed-effect correction methods indicate that growth in night light intensity is not specific to these counties (suggesting a recovery from the negative shock) but is shared by the entire United States. Especially the year 2010 is associated with a massive increase in light intensity, which seems to stem mostly from the switch to a new satellite (F18) and thus a new instrument with different gain settings. Once we correct for this common feature in the data, recovery appears in fact slower, and for a number of counties the sum of light does not return to pre-Katrina levels at all within the available data period.
Although the two calibration methods produce comparable results, the years 2010 and 2012 are important exceptions. Pandey et al. (2017) report that in a global sample, the calibration methods by Zhang et al. (2016) and Elvidge et al. (2014) produce only marginally different results. However, for a subset of countries, among which importantly is the US, the Zhang et al. (2016) method performs worse than Elvidge et al. (2014) in smoothing the time series specifically for the years 2010 and 2012. This is reported in detail in Zhang et al. (2016, pp. 5826–5827). This pattern is clearly visible for the subset of counties considered in this study (see Figs. B1 and B2). While the Elvidge calibration produces rather smooth series for the period 2009–2012, the Zhang calibration series clearly show drops in 2010 and 2012, which for the Mississippi counties are comparable in size to the declines in night light intensity in 2005 as a result of Katrina. Comparison to county figures for population, income, and GDP indicate no apparent reason for this dip, and no other natural disaster or adverse event is able to explain this substantial reduction in night light intensity suggested by the Zhang calibration series. This is further supported by a similar stability in the fixed-effects-corrected series for the respective Mississippi counties. As a result of this, we use only the calibration method of Elvidge et al. (2014) in the main results and test robustness of our findings to the fixed-effects correction and to the alternative Zhang et al. (2016) calibration in Appendix A. Results prove to be rather stable.
Code and data are available upon request.
Contributions of VS are conceptualization, data curation, formal analysis, investigation, methodology, software, visualization, and writing of the original draft and editing. Contributions of WB are conceptualization, investigation, methodology, supervision, and writing of the original draft and editing.
The contact author has declared that neither of the authors has any competing interests.
Publisher's note: Copernicus Publications remains neutral with regard to jurisdictional claims in published maps and institutional affiliations.
We thank Mark Sanders, Bas van Bavel, and Bram van Besouw for helpful suggestions and feedback. All remaining errors are our own.
This paper was edited by Heidi Kreibich and reviewed by four anonymous referees.
Aerts, J. C., Botzen, W. W., Emanuel, K., Lin, N., De Moel, H., and Michel-Kerjan, E. O.: Evaluating flood resilience strategies for coastal megacities, Science, 344, 473–475, 2014. a
Basker, E. and Miranda, J.: Taken by storm: Business financing and survival in the aftermath of Hurricane Katrina, J. Econ. Geogr., 18, 1285–1313, 2018. a, b, c
Bennett, M. M. and Smith, L. C.: Advances in using multitemporal night-time lights satellite imagery to detect, estimate, and monitor socioeconomic dynamics, Remote Sens. Environ., 192, 176–197, 2017. a, b
Berlemann, M. and Wenzel, D.: Hurricanes, economic growth and transmission channels: Empirical evidence for countries on differing levels of development, World Dev., 105, 231–247, 2018. a
Bertinelli, L. and Strobl, E.: Quantifying the local economic growth impact of hurricane strikes: An analysis from outer space for the Caribbean, J. Appl. Meteorol Clim., 52, 1688–1697, 2013. a, b, c, d, e
Bluhm, R. and Krause, M.: Top lights-bright cities and their contribution to economic development, CESifo Working Paper No. 7411, https://EconPapers.repec.org/RePEc:ces:ceswps:_7411 (last access: 3 December 2019), 2018. a
Botzen, W. W., Deschenes, O., and Sanders, M.: The economic impacts of natural disasters: A review of models and empirical studies, Rev. Env. Econ. Policy, 13, 167–188, 2019. a, b
Cavallo, E. and Noy, I.: Natural disasters and the economy – A survey, International Review of Environmental and Resource Economics, 5, 63–102, https://doi.org/10.1561/101.00000039, 2011. a
Cavallo, E., Galiani, S., Noy, I., and Pantano, J.: Catastrophic Natural Disasters and Economic Growth, Rev. Econ. Stat., 95, 1549–1561, 2013. a
Ceola, S., Laio, F., and Montanari, A.: Satellite nighttime lights reveal increasing human exposure to floods worldwide, Geophys. Res. Lett., 41, 7184–7190, 2014. a
Chen, X. and Nordhaus, W.: A Test of the New VIIRS Lights Data Set: Population and Economic Output in Africa, Remote Sens., 7, 4937–4947, https://doi.org/10.3390/rs70404937, 2015. a
Chen, X. and Nordhaus, W. D.: Using Luminosity Data as a Proxy for Economic Statistics, P. Natl. Acad. Sci. USA, 108, 8589–8594, 2011. a, b, c
Dartmouth Flood Observatory: DFO Event 2005-114 – Hurricane Katrina: New Orleans area – Rapid Response Inundation Map 1, https://floodobservatory.colorado.edu/2005114.html (last access: 21 June 2021), 2005. a
Del Valle, A., Elliott, R. J., Strobl, E., and Tong, M.: The short-term economic impact of tropical cyclones: Satellite evidence from Guangdong province, Economics of Disasters and Climate Change, 2, 225–235, 2018. a
de Ruig, L. T., Barnard, P. L., Botzen, W. W., Grifman, P., Hart, J. F., de Moel, H., Sadrpour, N., and Aerts, J. C.: An economic evaluation of adaptation pathways in coastal mega cities: An illustration for Los Angeles, Sci. Total Environ., 678, 647–659, 2019. a
Deryugina, T., Kawano, L., and Levitt, S.: The economic impact of Hurricane Katrina on its victims: Evidence from individual tax returns, Am. Econ. J.-Appl. Econ., 10, 202–33, 2018. a, b, c, d, e
Donaldson, D. and Storeygard, A.: The View from Above: Applications of Satellite Data in Economics, J. Econ. Perspect., 30, 171–98, 2016. a
Earth Observation Group, Payne Institute for Public Policy, Colorado School of Mines: https://eogdata.mines.edu/products/dmsp, last access: 1 February 2021. a
Ebener, S., Murray, C., Tandon, A., and Elvidge, C. C.: From Wealth to Health: Modelling the Distribution of Income Per Capita at the Sub-National Level Using Night-Time Light Imagery, Int. J. Health Geogr., 4, 5, https://doi.org/10.1186/1476-072X-4-5, 2005. a
Elliott, R., Strobl, E., and Sun, P.: The Local Impact of Typhoons on Economic Activity in China: A View from Outer Space, J. Urban Econ., 88, 50–66, 2015. a, b, c, d, e, f
Elvidge, C. D., Baugh, K. E., Kihn, E. A., Kroehl, H. W., Davis, E. R., and Davis, C. W.: Relation Between Satellite Observed Visible-Near Infrared Emissions, Population, Economic Activity and Electric Power Consumption, Int. J. Remote Sens., 18, 1373–1379, 1997. a
Elvidge, C. D., Sutton, P. C., Ghosh, T., Tuttle, B. T., Baugh, K. E., Bhaduri, B., and Bright, E.: A Global Poverty Map Derived from Satellite Data, Comput. Geosci., 35, 1652–1660, 2009a. a, b, c
Elvidge, C. D., Ziskin, D., Baugh, K. E., Tuttle, B. T., Ghosh, T., Pack, D. W., Erwin, E. H., and Zhizhin, M.: A Fifteen Year Record of Global Natural Gas Flaring Derived from Satellite Data, Energies, 2, 595–622, 2009b. a
Elvidge, C. D., Baugh, K. E., Zhizhin, M., and Hsu, F.-C.: Why VIIRS data are superior to DMSP for mapping nighttime lights, Proceedings of the Asia-Pacific Advanced Network, 35, 5860–5879, https://doi.org/10.1080/01431161.2017.1342050, 2013. a, b
Elvidge, C. D., Hsu, F.-C., Baugh, K. E., and Ghosh, T.: National Trends in Satellite Observed Lighting, Global Urban Monitoring and Assessment through Earth Observation, 23, 97–118, 2014. a, b, c, d, e, f, g, h, i, j, k, l, m, n, o, p, q, r, s, t, u, v, w, x, y
Fan, X., Nie, G., Deng, Y., An, J., Zhou, J., and Li, H.: Rapid detection of earthquake damage areas using VIIRS nearly constant contrast night-time light data, Int. J. Remote Sens., 40, 2386–2409, 2019. a
Felbermayr, G. and Gröschl, J.: Naturally Negative: The Growth Effects of Natural Disasters, J. Dev. Econ., 111, 92–106, 2014. a
Felbermayr, G., Gröschl, J., Sanders, M. W., Schippers, V. G., and Steinwachs, T.: The Economic Impact of Weather Anomalies, World Dev., 151, 105745, https://doi.org/10.1016/j.worlddev.2021.105745, 2022. a, b, c, d, e, f
Fomby, T., Ikeda, Y., and Loayza, N. V.: The Growth Aftermath of Natural Disasters, J. Appl. Econom., 28, 412–434, 2013. a
Gao, S., Chen, Y., Liang, L., and Gong, A.: Post-earthquake night-time light piecewise (PNLP) pattern based on NPP/VIIRS night-time light data: A case study of the 2015 Nepal earthquake, Remote Sens., 12, 2009, https://doi.org/10.3390/rs12122009, 2020. a
Ghosh, T., L Powell, R., D Elvidge, C., E Baugh, K., C Sutton, P., and Anderson, S.: Shedding light on the global distribution of economic activity, Open Geography Journal, 3, 147–160, 2010. a
Ghosh, T., Anderson, S. J., Elvidge, C. D., and Sutton, P. C.: Using nighttime satellite imagery as a proxy measure of human well-being, Sustainability, 5, 4988–5019, 2013. a
Gibson, J., Olivia, S., and Boe-Gibson, G.: Night lights in economics: sources and uses, J. Econ. Surv., 34, 955–980, 2020. a
Gibson, J., Olivia, S., Boe-Gibson, G., and Li, C.: Which night lights data should we use in economics, and where?, J. Dev. Econ., 149, 102602, https://doi.org/10.1016/j.jdeveco.2020.102602, 2021. a, b
Gillespie, T. W., Frankenberg, E., Fung Chum, K., and Thomas, D.: Night-time lights time series of tsunami damage, recovery, and economic metrics in Sumatra, Indonesia, Remote Sens. Lett., 5, 286–294, 2014. a, b, c, d, e
Groen, J. A. and Polivka, A. E.: The effect of Hurricane Katrina on the labor market outcomes of evacuees, Am. Econ. Rev., 98, 43–48, 2008. a, b, c
Groen, J. A., Kutzbach, M. J., and Polivka, A. E.: Storms and jobs: The effect of hurricanes on individuals' employment and earnings over the long term, J. Labor Econ., 38, 653–685, 2020. a, b
Hallegatte, S.: An adaptive regional input-output model and its application to the assessment of the economic cost of Katrina, Risk Anal., 28, 779–799, 2008. a, b
Hallegatte, S., Green, C., Nicholls, R. J., and Corfee-Morlot, J.: Future flood losses in major coastal cities, Na. Clim. Change, 3, 802–806, 2013. a
Heger, M. P. and Neumayer, E.: The impact of the Indian Ocean tsunami on Aceh's long-term economic growth, J. Dev. Econ., 141, 102365, https://doi.org/10.1016/j.jdeveco.2019.06.008, 2019. a
Henderson, J. V., Storeygard, A., and Weil, D. N.: Measuring Economic Growth from Outer Space, Am. Econ. Rev., 102, 994–1028, 2012. a, b, c, d, e, f
Henderson, M., Yeh, E. T., Gong, P., Elvidge, C., and Baugh, K.: Validation of urban boundaries derived from global night-time satellite imagery, Int. J. Remote Sens., 24, 595–609, 2003. a
Hodler, R. and Raschky, P. A.: Regional Favoritism, Q. J. Econ., 129, 995–1033, 2014. a, b
Hornbeck, R. and Naidu, S.: When the levee breaks: black migration and economic development in the American South, Am. Econ. Rev., 104, 963–90, 2014. a
Hsiang, S. M. and Jina, A. S.: The causal effect of environmental catastrophe on long-run economic growth: Evidence from 6700 cyclones, Working Paper 20352, National Bureau of Economic Research, https://doi.org/10.3386/w20352, 2014. a
IPCC: Climate Change 2014: Synthesis Report, Contribution of Working Groups I, II and III to the Fifth Assessment Report of the Intergovernmental Panel on Climate Change, edited by: Core Writing Team, Pachauri, R. K., and Meyer, L. A., IPCC, Geneva, Switzerland, p. 151, ISBN 978-92-9169-143-2, 2014. a, b
Ishizawa, O. A., Miranda, J. J., and Strobl, E.: The Impact of Hurricane Strikes on Short-Term Local Economic Activity: Evidence from Nightlight Images in the Dominican Republic, Int. J. Disast. Risk Sc., 10, 362–370, 2019. a
Jarmin, R. S. and Miranda, J.: The impact of Hurricanes Katrina, Rita and Wilma on business establishments, Journal of Business Valuation and Economic Loss Analysis, 4, https://doi.org/10.2202/1932-9156.1040, 2009. a, b
Keola, S., Andersson, M., and Hall, O.: Monitoring Economic Development from Space: Using Night-Time Light and Land Cover Data to Measure Economic Growth, World Dev., 66, 322–334, 2015. a
Klomp, J. and Valckx, K.: Natural disasters and economic growth: A meta-analysis, Global Environ. Chang., 26, 183–195, 2014. a
Knabb, R. D., Rhome, J. R., and Brown, D. P.: Tropical Cyclone Report Hurricane Katrina, Technical report, National Hurricane Center, https://www.nhc.noaa.gov/data/tcr/AL122005_Katrina.pdf (last access: 1 February 2021), 2005. a, b, c
Kocornik-Mina, A., McDermott, T. K., Michaels, G., and Rauch, F.: Flooded cities, Am. Econ. J.-Appl. Econ., 12, 35–66, 2020. a, b, c, d, e, f, g, h
Kohiyama, M., Hayashi, H., Maki, N., Higashida, M., Kroehl, H., Elvidge, C., and Hobson, V.: Early damaged area estimation system using DMSP-OLS night-time imagery, Int. J. Remote Sens., 25, 2015–2036, 2004. a
Li, X. and Li, D.: Can night-time light images play a role in evaluating the Syrian Crisis?, Int. J. Remote Sens., 35, 6648–6661, 2014. a
Li, X., Chen, X., Zhao, Y., Xu, J., Chen, F., and Li, H.: Automatic intercalibration of night-time light imagery using robust regression, Remote Sens. Lett., 4, 45–54, 2013. a
Li, X., Zhang, R., Huang, C., and Li, D.: Detecting 2014 Northern Iraq Insurgency using night-time light imagery, Int. J. Remote Sens., 36, 3446–3458, 2015. a
Logan, J. R.: The impact of Katrina: Race and class in storm-damaged neighborhoods, unpublished manuscript. Spatial Structures in the Social Sciences, Brown University, https://wps.ablongman.com/wps/media/objects/6948/7114754/pdf/Report_2.pdf (last access: 11 January 2023), 2006. a, b, c, d, e, f
Ma, T., Zhou, C., Pei, T., Haynie, S., and Fan, J.: Quantitative estimation of urbanization dynamics using time series of DMSP/OLS nighttime light data: A comparative case study from China's cities, Remote Sens. Environ., 124, 99–107, 2012. a
Mård, J., Di Baldassarre, G., and Mazzoleni, M.: Nighttime light data reveal how flood protection shapes human proximity to rivers, Sci. Adv., 4, eaar5779, https://doi.org/10.1126/sciadv.aar5779, 2018. a
Michalopoulos, S. and Papaioannou, E.: Pre-Colonial Ethnic Institutions and Contemporary African Development, Econometrica, 81, 113–152, 2013. a, b
Miranda, J. J., Ishizawa, O. A., and Zhang, H.: Understanding the Impact Dynamics of Windstorms on Short-Term Economic Activity from Night Lights in Central America, Economics of Disasters and Climate Change, 4, 657–698, 2020. a
Mohan, P. and Strobl, E.: The short-term economic impact of tropical Cyclone Pam: an analysis using VIIRS nightlight satellite imagery, Int. J. Remote Sens., 38, 5992–6006, https://doi.org/10.1080/01431161.2017.1323288, 2017. a
National Hurricane Center: Costliest U.S. tropical cyclones tables updated, Tech. rep., National Hurricane Center, https://www.nhc.noaa.gov/news/UpdatedCostliest.pdf (last access: 30 October 2022), 2018. a
Nguyen, C. N. and Noy, I.: Measuring the impact of insurance on urban earthquake recovery using nightlights, J. Econ. Geogr., 20, 857–877, 2020. a
Noy, I.: The Macroeconomic Consequences of Disasters, J. Dev. Econ., 88, 221–231, 2009. a
Pandey, B., Zhang, Q., and Seto, K. C.: Comparative evaluation of relative calibration methods for DMSP/OLS nighttime lights, Remote Sens. Environ., 195, 67–78, 2017. a, b, c, d
Paxson, C. and Rouse, C. E.: Returning to New Orleans after Hurricane Katrina, Am. Econ. Rev., 98, 38–42, 2008. a, b
Pistrika, A. K. and Jonkman, S. N.: Damage to residential buildings due to flooding of New Orleans after hurricane Katrina, Nat. Hazards, 54, 413–434, 2010. a
Skoufias, E., Strobl, E., and Breivik Tveit, T.: Flood and Tsunami Damage Indices Based on Remotely Sensed Data: An Application to Indonesia, Nat. Hazards Rev., 21, 04020042, https://doi.org/10.1061/(ASCE)NH.1527-6996.0000325, 2020. a
Skoufias, E., Strobl, E., and Tveit, T.: Can we rely on VIIRS nightlights to estimate the short-term impacts of natural hazards? Evidence from five South East Asian countries, Geomat. Nat. Haz. Risk, 12, 381–404, 2021. a
Small, C., Pozzi, F., and Elvidge, C. D.: Spatial analysis of global urban extent from DMSP-OLS night lights, Remote Sens. Environ., 96, 277–291, 2005. a
Storeygard, A.: Farther on Down the Road: Transport Costs, Trade and Urban Growth in Sub-Saharan Africa, Rev. Econ. Stud., 83, 1263–1295, 2016. a
Strobl, E.: The Economic Growth Impact of Hurricanes: Evidence from US Coastal Counties, Rev. Econ. Stat., 93, 575–589, 2011. a, b
Strobl, E.: The economic growth impact of natural disasters in developing countries: Evidence from hurricane strikes in the Central American and Caribbean regions, J. Dev. Econ., 97, 130–141, 2012. a
Sutton, P. C. and Costanza, R.: Global Estimates of Market and Non-Market Values Derived from Night-Time Satellite Imagery, Land Cover, and Ecosystem Service Valuation, Ecol. Econ., 41, 509–527, 2002. a
Sutton, P. C., Elvidge, C. D., and Ghosh, T.: Estimation of Gross Domestic Product at Sub-National Scales Using Night-Time Satellite Imagery, International Journal of Ecological Economics and Statistics, 8, 5–21, 2007. a
U.S. Burea of Econonomic Analysis: Regional Economic Accounts, https://www.bea.gov/data/economic-accounts/regional (last access: 18 February 2020), 2020. a
U.S. Department of Housing and Urban Development: Current Housing Unit Damage Estimates: Hurricanes Katrina, Rita, and Wilma, https://www.huduser.gov/publications/pdf/gulfcoast_hsngdmgest.pdf (last access: 28 October 2022), 2006. a, b, c, d, e, f
Vigdor, J.: The economic aftermath of Hurricane Katrina, J. Econ. Perspect., 22, 135–54, 2008. a, b, c, d, e, f, g
Wu, J., Wang, Z., Li, W., and Peng, J.: Exploring Factors Affecting the Relationship Between Light Consumption and GDP Based on DMSP/OLS Night-Time Satellite Imagery, Remote Sens. Environ., 134, 111–119, 2013. a
Xiao, Y. and Nilawar, U.: Winners and losers: analysing post-disaster spatial economic demand shift, Disasters, 37, 646–668, 2013. a, b, c, d
Zhang, Q. and Seto, K. C.: Mapping urbanization dynamics at regional and global scales using multi-temporal DMSP/OLS nighttime light data, Remote Sens. Environ., 115, 2320–2329, 2011. a
Zhang, Q., Pandey, B., and Seto, K. C.: A robust method to generate a consistent time series from DMSP/OLS nighttime light data, IEEE T. Geosci. Remote, 54, 5821–5831, 2016. a, b, c, d, e, f, g, h, i, j, k, l, m, n
Zhao, X., Yu, B., Liu, Y., Yao, S., Lian, T., Chen, L., Yang, C., Chen, Z., and Wu, J.: NPP-VIIRS DNB daily data in natural disaster assessment: evidence from selected case studies, Remote Sens., 10, 1526, https://doi.org/10.3390/rs10101526, 2018. a, b
See Henderson et al. (2012), Ghosh et al. (2013), Donaldson and Storeygard (2016), and Gibson et al. (2021) for excellent overviews of the various applications of night lights in this literature.
This work is part of a growing literature that studies the local economic impacts of hurricanes and other natural disasters, often making use of nighttime lights as a proxy for local economic activity. Related papers on hurricanes are Bertinelli and Strobl (2013) on the local economic impact of hurricanes in the Caribbean, Mohan and Strobl (2017) on the short-term impact of Cyclone Pam in the South Pacific, Del Valle et al. (2018) on cyclone impacts in Guangdong, China, Ishizawa et al. (2019) on hurricane impacts in the Dominican Republic, and Miranda et al. (2020) on windstorm impacts in Central America more generally. Night lights have also been used to study earthquake impacts (Kohiyama et al., 2004; Fan et al., 2019; Nguyen and Noy, 2020) and a combination of disaster types globally (Felbermayr et al., 2022) and for Indonesia and Southeast Asia respectively (Skoufias et al., 2020, 2021).
For reviews of this literature, see Cavallo and Noy (2011), Klomp and Valckx (2014), and Botzen et al. (2019).
The worst-affected neighborhoods had substantially higher numbers of renters, households below the poverty line, and unemployed compared to undamaged communities (Logan, 2006).
This is reminiscent of the out-migration of black population after the Great Mississippi Flood in 1927 reported by Hornbeck and Naidu (2014).
Data provided by the Earth Observation Group: https://eogdata.mines.edu/products/dmsp/ (last access: 1 February 2021; Earth Observation Group, 2021).
Note that while the night light data are provided in a resolution of 30 arcsec, the sensor resolution is much coarser and represents a ground footprint at nadir of roughly 25 km2 (Elvidge et al., 2013). For this reason, we do not focus on pixel-level outcomes in this study but rather use the total sum of light per year at the county level.
Note that this implicitly controls for differences in total light intensity between counties in any year: changes are always expressed relative to the total sum of light of each respective county in 2004.
We also assess this pattern for the other two hurricanes that made landfall along the Gulf of Mexico in 2005: Hurricane Rita, which made landfall in southwest Louisiana in September, and Hurricane Wilma, which made landfall in southern Florida in October 2005. Reassuringly, we find a similar pattern of night light reduction for Rita, with a high degree of housing damage most notably in Cameron and surrounding counties. Lower degrees of housing damage related to Hurricane Wilma are not associated with reductions in night light intensity, similar to the counties less affected by Katrina in Louisiana. See Appendix Figs. A3 and A4.
Bluhm and Krause (2018) propose a method to impute true light values for top-coded pixels by assuming a Pareto distribution on top lights. Although this approach may be of great value to the general literature that studies economic growth and the spatial distribution of economic activity, we cannot make use of any imputed measures as we study a shock.
There is a third issue with the DMSP data that revolves around overglow, or otherwise referred to as blooming (Bennett and Smith, 2017; Gibson et al., 2020, 2021). Overglow, related to geolocation errors in the DMSP data, results in light intensity being recorded slightly away from its point source, resulting in urban areas having a larger extent of lit pixels than actual built-up land. This is an issue particularly in studies that use DMSP night light data at high spatial detail, up to the pixel level of the data (e.g., Bertinelli and Strobl, 2013; Kocornik-Mina et al., 2020). Moreover, local economic activity arguably does not reside on square kilometers but rather in larger economic and administrative (spatial) units. In order to be able to draw a parallel between measured economic activity and night lights, we therefore aggregate night light intensity to the sum of light at the county level. As such, the issue of blooming and geolocation errors is of limited concern in our context.
These reductions match closely with the damage maps from FEMA for this area, described in detail in Basker and Miranda (2018). Extensive damage along the coastline is reflected by large drops in light intensity, while milder reductions in light intensity are matched by mild damage from the FEMA maps. As with New Orleans city, we find close correspondence between flood zones, property damage, and night light reduction. For a detailed discussion on the FEMA damage maps, see Jarmin and Miranda (2009).
The DMSP night light series run up to 2012 only, following the calibration results of Elvidge et al. (2014). Note that the annual stable night light composites from the DMSP-OLS instrument were discontinued after 2013.
While employment is proportional to total population, displacement of population may affect the working population differently than the non-working population. As discussed in the effects of Katrina in New Orleans, we know that the low-income segment of New Orleans' population was displaced disproportionally (Logan, 2006).
Note that spatial differences in light intensity between counties are controlled for by indexing light intensity by county, as discussed in Sect. 2.2.
Including the 2005 data for population dramatically reduces the correlation from 0.65 to 0.34, purely as a result of the 2005 population figure being unresponsive to the Katrina shock in 2005 by construction – population estimates are midyear and thus precede the landfall of the hurricane.
Within the scope of our paper, we cannot answer why the relation between night light and economic activity is rather weak in equilibrium times before the disaster shock, as well as what can explain the negative correlation with population and income we observe prior to the shock. However, top coding in the night light data is arguably one important factor. This discussion speaks to a broader literature that uses night light intensity in equilibrium growth regimes to proxy GDP or economic activity more broadly at the subnational level (e.g., Michalopoulos and Papaioannou, 2013; Hodler and Raschky, 2014; Storeygard, 2016). Part of the explanation may be that top coding in much of the affected areas prior to the landfall of Katrina obscures otherwise meaningful relations between night lights and income and GDP. Future research can aim to answer these questions by focusing on an event that affected urban areas with a lower degree of top coding. Alternatively, the results presented in this paper may be indicative of a stronger relation between changes in night light intensity and economic indicators in shock times versus equilibrium times in a high-income country like the United States.
Similar to the baseline results, we exclude the year 2005 for population.
For example, Elvidge et al. (2009a, 2014) propose Sicily as a candidate invariant area. This area is found to have the best spread of night light intensity across the spectrum of DN0 to DN63. Moreover, and most importantly, true light intensity is found to be largely stable for 1992–2013 for this area. Relying on the resulting invariant area assumption, all images are then calibrated to the image for this area in 1999 (satellite F12) using a second-order polynomial fit. Calibrated digital values that exceed the maximum range of DN63 are truncated at DN63. When assessing the global performance of this calibration method, Pandey et al. (2017) also truncate the lower bound of the digital values at DN0. I follow their example here.
Chen and Nordhaus (2011) separately control for satellite fixed effects, besides the common year fixed effects. We do not do so here since we make use of single satellite years rather than taking the average of satellite years when multiple satellite images are available in a year (see Felbermayr et al., 2022, for a discussion on this issue). We use the following satellite years: F101992-94, F121995-98, F141999, F152000-06, F162007-09, and F182010-13.
- Abstract
- Introduction
- Direct and economic consequences Hurricane Katrina
- Relating night light changes to economic indicators
- Discussion and conclusion
- Appendix A: Figures and tables
- Appendix B: Cleaning of the night light series
- Code and data availability
- Author contributions
- Competing interests
- Disclaimer
- Acknowledgements
- Review statement
- References