the Creative Commons Attribution 4.0 License.
the Creative Commons Attribution 4.0 License.
 | 12 May 2023
Clustering of eruptive events from high-precision strain signals recorded during the 2020–2022 lava fountains at the Etna volcano (Italy)
Luigi Carleo
Alessandro Bonaccorso
Lava fountains at the Etna volcano are spectacular eruptive events characterized by powerful jets that expel hot mixtures of solid particles and volcanic gases, easily reaching stratospheric heights. Ash dispersal and fallout of solid particles affect the inhabited areas, often causing hazards both to infrastructure and to air and vehicular traffic.
We focus on the extraordinary intense and frequent eruptive activity at Etna in the period of December 2020–February 2022, when more than 60 lava fountain events occurred with various ejected magma volume and lava fountain height and duration. Differences among the events are also imprinted in tiny ground deformations caught by strain signals recorded concurrently with the lava fountain events, reflecting a strict relationship with their evolution. To characterize this variability, which denotes changes in the eruption style, we clustered the lava fountain events using the k-means algorithm applied on the strain signal. A novel procedure was developed to ensure a high-quality clustering process and obtain robust results. The analysis identified four groups of strain variations which stand out for their amplitude, duration and time derivative of the signal. The temporal distribution of the clusters highlighted a transition in different types of eruptions, thus revealing the importance of clustering the strain variations for monitoring the volcano activity and evaluating the associated hazards.
- Article
(2819 KB) - Full-text XML
- BibTeX
- EndNote


In the last decade, lava fountains represented a typical eruptive style at the Etna volcano (i.e. Calvari et al., 2018; Andronico et al., 2021). These eruptive events are powerful jets that can expel hot mixtures of solid particles and volcanic gases to heights ranging from tens to several hundred metres (Fig. 1a). The ash dispersal and fallout deposits of the solid particles, known as tephra, cause critical hazards to civil infrastructure and aviation, frequently provoking the temporary closure of southern Italy airports. The characterization of such eruptive events is thus fundamental for both monitoring the volcano activity and evaluating the associated hazards.
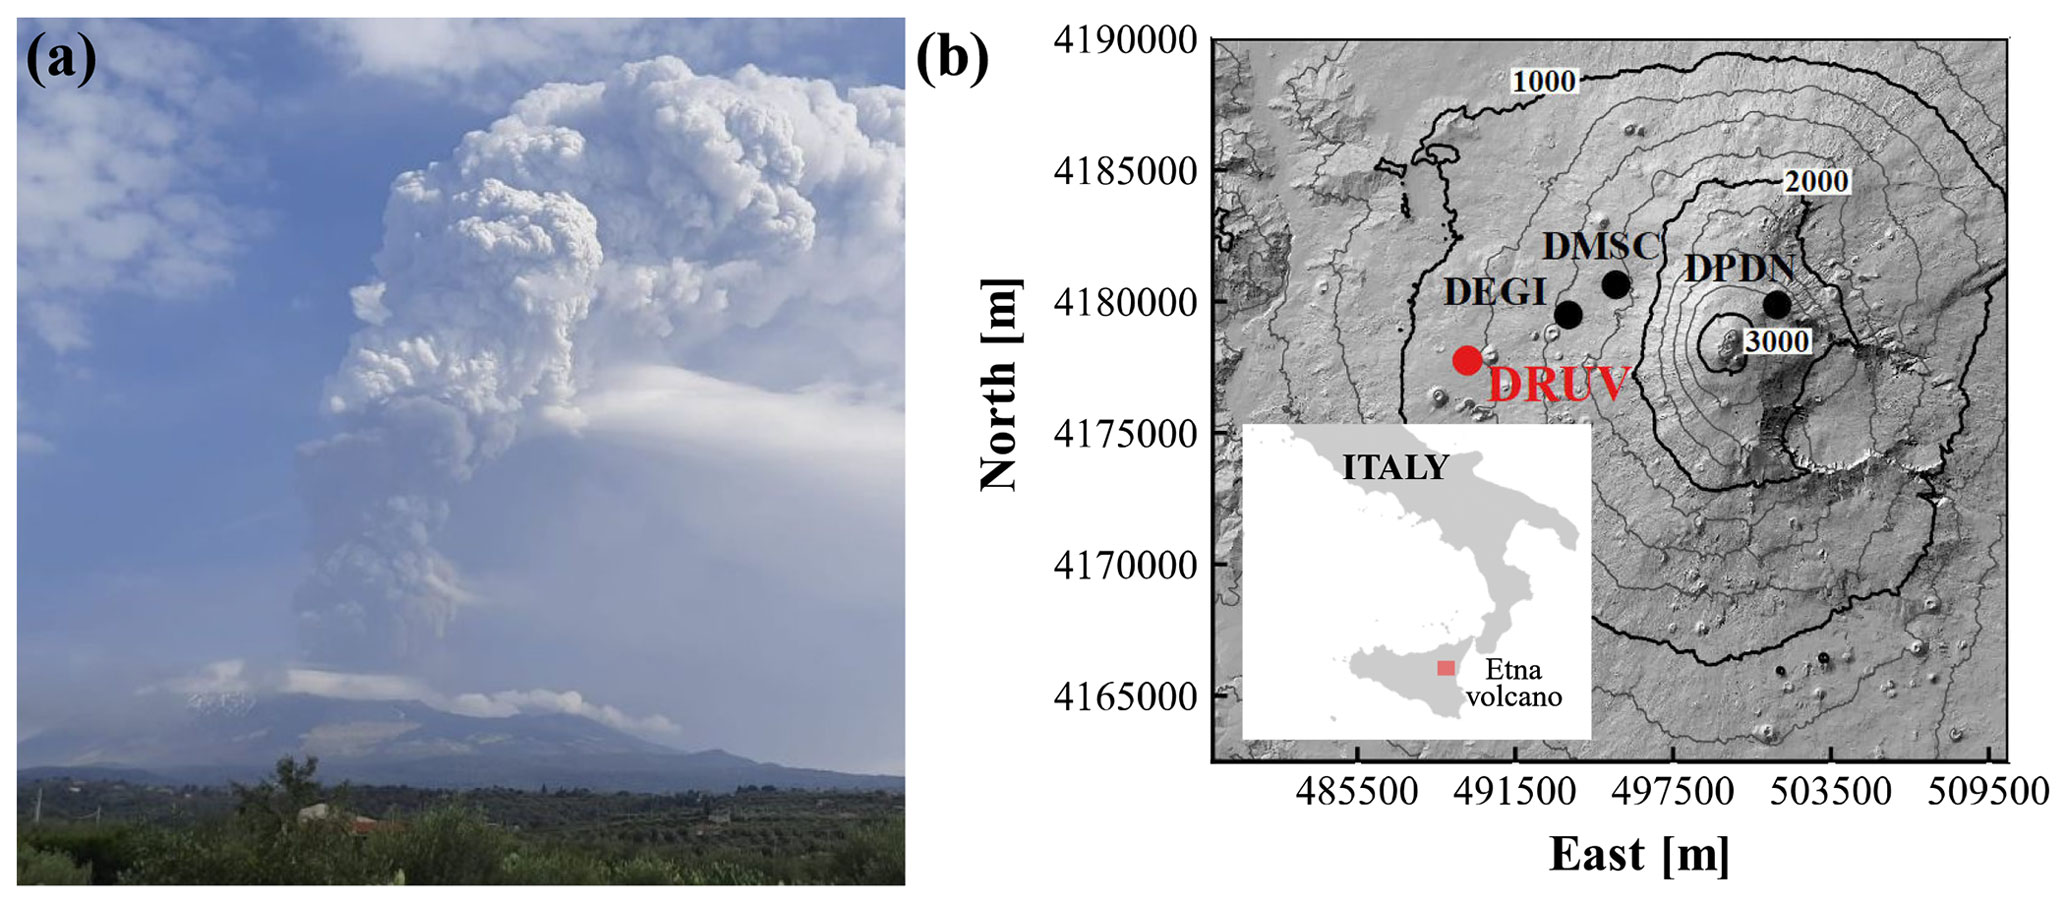
Figure 1(a) Lava fountain occurring on 23 October 2021 (photo from INGV internal report no. 43/2021). (b) Location of the borehole strainmeter stations installed at the Etna volcano. The coordinates system is WGS 84 UTM 33S.
At Etna, lava fountains produce short-term and small deformations of the ground (Bonaccorso and Calvari, 2017; Bonaccorso et al., 2013b, 2016, 2021) that are well-captured by the Sacks–Evertson dilatometer (Fig. 1b; Sacks et al., 1971), a widely employed geophysical instrument to study ground deformation processes associated with volcano unrest (Amoruso et al., 2015; Bonaccorso et al., 2012, 2020; Linde and Sacks, 1995; Linde et al., 2016, 1993; Voight et al., 2006). This dilatometer is particularly appropriate for monitoring lava fountains, since it measures the volumetric strain within a very wide frequency range (10−7 to > 20 Hz) and with the highest resolution (10−10 to 10−11) achievable among geophysical instruments (i.e. NASEM, 2017; Roeloffs and Linde, 2007). Other geodetic techniques such as GPS and InSAR are unable to detect the deformations associated with lava fountains because of their lower accuracy (GPS > 0.5 cm) or lower-frequency sampling (InSAR periodic passages). These technical characteristics make the strain measurements fundamental for monitoring explosive events, especially when images from surveillance cameras do not allow the event detection because of poor visibility (Carleo et al., 2022b; Calvari and Nunnari, 2022).

Figure 2The detrended recorded (a) and filtered (b) DRUV signals in the study period. Negative step-like strain variations, clearly detected in the filtered signal, occurred concurrently with the lava fountain episodes. The lava fountains on 29 August and 23 October 2021 were not recorded due to technical problems. The eruptive activity is divided into four periods: Pi (4 events), S1 (17 events), S2 (34 events) and Pf (5 events). The black arrow in panel (b) indicates the lava fountain events that occurred on 1–2 July 2021. The zoom of the filtered strain signal (c) and the related strain rate signal (d) during this event are shown as an example. ti and tf indicate the onset and the end of the strain variations. At the beginning of the lava fountain (I), expansion rate at the sensor gradually increases. In the central part (II), strain rate rapidly reaches its absolute maximum value. The expansion gradually diminishes up to a minimum, and the strain rate reaches the pre-event level during the final part of the eruptive episode (III).
From December 2020 to February 2022, Etna underwent intense eruptive activity, with more than 60 lava fountains from the South East Crater (Calvari and Nunnari, 2022). A variability in terms of duration, degree of explosiveness and portion of effusive flows has been observed (Calvari and Nunnari, 2022; Calvari et al., 2022), implying a different degree of the hazard associated with these eruptive events. Indeed, the onset and the dynamic of the lava fountain is usually a gradual growing process, starting from weak Strombolian activity, continuing with transitional explosive activity and eventually leading to sustained eruptive column. The intensity and the duration of these three main phases are not always the same, and they characterize the temporal evolution of the episodes. A preliminary inspection of the strain signal recorded during the lava fountains reveals a similar pattern for all the events and a strict relationship with their temporal evolution (Bonaccorso et al., 2021; Calvari et al., 2021), allowing for tracing of the waxing and waning of each episode and marking the onset and the end of the eruptions. On average, but not systematically, some differences arise in terms of amplitude and duration of the strain signal. For example, the lava fountains occurring in February–April 2021 were characterized by strain changes with high amplitudes (hundreds of nstrain) and temporal evolutions ranging from tens of minutes to 8–9 h. Conversely, the strain changes accompanying the eruptions in May–June 2021 were lower in amplitude (tens of nstrain) and developed in intervals from 1 h to less than 4 h (Fig. 2).
In the recent past, attempts to classify the lava fountains at Etna have been made manually by experts by comparing different geophysical and volcanological data. Andronico et al. (2021) manually found different eruptive styles at the Etna volcano on the basis of volcanological observations. Calvari et al. (2022) analysed three lava fountain episodes that occurred in 2021 with a multidisciplinary approach and gave insights into the different eruptive styles. Manual classification is time consuming since it involves a huge amount of data analysis, and it is prone to subjective biases. With the aim of avoiding a classification biased by experts' beliefs, we investigate whether an objective cluster analysis on instrumental dataset could help in discovering a group of events with similar characteristics. Clustering analyses on monitoring signals have already been performed in volcanology (Cirillo et al., 2022; Corradino et al., 2021; Langer et al., 2009; Nunnari, 2021; Romano et al., 2022; Unglert et al., 2016) but have never been applied to the strainmeter data for clustering eruptive events.
Here, we made use of clustering techniques applied on the strain variations recorded concurrently with the eruptive episodes from December 2020 to February 2022 in order to derive the key features that characterize the eruptive process and distinguish the events. In particular, we applied the k-means clustering algorithm, a widely employed unsupervised machine learning technique, to solve clustering problems in several domains (Lloyd, 1982; MacQueen, 1967). One of the drawbacks of such an algorithm is that the optimal number of the clusters and also the optimal set of key features which lead to a high-quality clustering are not known a priori. We developed a procedure to appropriately identify the features and the number of clusters which ensure high cohesion and separation. Moreover, since the clustering solution could depend on the initial position of the barycentre of the clusters (centroids) chosen to start the algorithm (Fränti and Sieranoja, 2019), we also investigated the influence of the initial position of the centroids on the k-means performance by comparing different initialization techniques. Lastly, we discuss the implications that this result entails in the assessment of volcanic activity and the associated eruptive style.
The December 2020–February 2022 eruptive activity of Etna was extraordinarily intense. It started with four lava fountains from 13 December 2020 to 16 January 2021 (period Pi). Successively, a first lava fountain sequence of 17 events took place up to 1 April 2021, with an average frequency of 0.39 events per day (sequence S1). After 49 d of repose, the Etna volcano reawakened, and a second lava fountain sequence of 34 episodes occurred till 10 August 2021, with a frequency of about 0.42 events per day (S2). Then, the eruptive activity diminished with five events occurring from 10 August 2021 to the end of February 2022 (Pf).
The borehole strainmeter network, operating at Etna since 2011 (Bonaccorso et al., 2016; Fig. 1b), was fundamental in investigating the dynamics of the eruptions (Bonaccorso et al., 2021) and monitoring the eruptive events in near real time for volcanic surveillance (Carleo et al., 2022b). In this study, we focus on the measurements recorded by the DRUV station, which is located quite far from the summit craters, at ∼ 11 km, and installed in a massive rock layer (at ∼ 180 m depth), guaranteeing high efficiency in transferring deformation from the rock to the sensor. The strainmeter was calibrated with three different techniques (Bonaccorso et al., 2013a, 2016; Currenti et al., 2017) that confirmed its high sensitivity (∼ 10−10). The DRUV strain signal was filtered from the disturbing effects of both the Earth tides and the barometric pressure to highlight small strain variations related to the volcano activity (Currenti and Bonaccorso, 2019). We used the procedure proposed by Carleo et al. (2022a) to highlight tiny volcano-related strain changes up to 10−10 for timescales less than 1 d. Furthermore, we removed the long-term drift component from the strain signal due to the effect of both the curing of the cement and the relaxation of the drilled hole (Canitano et al., 2021).
In Fig. 2a and b, both the recorded and the filtered DRUV signals are presented for the period of December 2020–February 2022. The near-real-time detection algorithm developed by Carleo et al. (2022b) allowed the automatic detection of 58 strain variations, all related to the eruptive episodes in the analysed period. Such strain variations are the response to the decompression of the magmatic source feeding the lava fountain (Bonaccorso et al., 2013b, 2016; Bonaccorso and Calvari, 2017; Bonaccorso et al., 2021; Currenti and Bonaccorso, 2019). The time derivative of the filtered strain signal (strain rate signal), like other high-precision geodetic signals (Kozono et al., 2013; Ichihara, 2016), is expected to be related to the rate of magma chamber decompression and, thus, to the speed of magma ascent (Hreinsdóttir et al., 2014). The Etna lava fountains grow gradually, starting from Strombolian activity and evolving towards a sustained eruptive column. As already found in previous studies (Calvari et al., 2021, 2022), the evolution of a lava fountain is well-represented by both the strain and the strain rate signals. In Fig. 2c and d, the filtered strain and the filtered strain rate signals during the lava fountain on 1–2 July 2021 are shown as an example of the recorded variations. Typically, the strain and the strain rate signals show a sigmoid and a V shape, respectively. The different lava fountain phases can be described by dividing the signals in three main parts: in the initial part (Part I), when the Strombolian activity takes place, both the strain and the strain rate gradually decrease with time, showing an elbow with a downward concavity; in the central part (Part II), the lava fountaining is persistent, and the strain rate changes its slope abruptly, reaching the absolute maximum value; and in the final part (Part III), the eruptive activity starts declining, and the strain rate inverts its trend, reaching the pre-event level. To identify the beginning of the event, we focused on the strain rate signal. We first evaluated the amplitude of the background noise of the strain rate signal, σ, as the mean standard deviation in an optimal moving time window of 3 h (Carleo et al., 2022a). We found a σ value of 0.93 nstrain per hour. The beginning of the variation ti was chosen concurrently with the time when the beginning of the deformation rate can be clearly identified, namely when the strain rate exhibits a value of one order of magnitude higher than σ. Therefore, we selected ti as the time when the strain rate reaches −10 nstrain per hour. The end of the variation tf was set when the sign of the strain rate becomes positive.
We characterized each lava fountain event by extracting the main features from both the strain and strain rate signals in the period ti and tf. In particular, we focused on Parts I and II of the signals. The extracted features transform each eruptive event into a strain data point in the feature domain, which forms a dataset that is going to be clustered.
The k-means is an unsupervised machine learning algorithm (Lloyd, 1982; MacQueen, 1967) designed to partition data points into clusters by minimizing the sum of the squared distances (SSE) between every data point and its nearest cluster mean (centroid). The data points are formed by a set of features which should be chosen by the following two rules: the features should identify the data point uniquely, and the smaller the feature vector, the better (Langer et al., 2009).
The k-means algorithm starts by selecting the initial centroid position in the feature domain. Each data point is assigned to the kth cluster, represented by the closest centroid to the data point. The initial positions of the centroids, which represent the barycentre of the related clusters, change on the basis of the assigned data points. Iteratively, new centroid positions are re-estimated, and the data points are eventually re-assigned to the closest cluster. The algorithm stops until centroids no longer move. The k-means algorithm has excellent fine-tuning capabilities (Fränti and Sieranoja, 2019). However, the goodness of the clustering solution depends on the choice of both the number of clusters, k, and the set of features, C, to cluster the data. Moreover, the results are influenced by the centroid positions chosen to start the algorithm.
To overcome the drawbacks of k-means, we tried different clustering solutions by varying the inputs of the algorithm, namely the number of clusters, the employed set of features and the initial centroid positions. The quality of the different clustering solutions was estimated by employing two methods: the “elbow method” and the silhouette value (Sil; Kaufman and Rousseeuw, 1990). The elbow method is one of the most widely used techniques to find the optimal number of clusters. It is a method based on the SSE value: the less the SSE of the clustering solution, the better the clustering. Normally, the higher the number of the clusters, the lower the SSE. In a k–SSE plot, the elbow of the curve represents the optimal number of clusters for the analysed dataset and corresponds to the most effective clustering solution in terms of k and SSE.
The silhouette value (Sil) for a single data point is defined as
where b is the average distance between the datum and the data of another cluster minimized over the clusters, and a is the average distance between the datum and the data within the cluster to which the datum belongs. The Sil value is a measure of how much a data point is cohesive within its own cluster (distance a) and, at the same time, separated from the other clusters (distance b). It ranges from −1 to 1, where −1 corresponds to a completely wrong clustering while 1 corresponds to a perfect clustering.
We designed an iterative procedure to find the optimal number of cluster, kopt, and the optimal set of features, Copt, that allow for a high-quality clustering solution for our dataset of strain variations. We analysed different clustering solutions (C, k) by varying the number of clusters, k, and the involved subset of features, C, and evaluated the quality of the clustering by using both the elbow method and the silhouette value. The initial centroid position was chosen randomly. To have a more robust result, for each analysed clustering solution, we performed n=104 repetitions of the k-means algorithm, setting different random initial seeds and keeping fixed the other inputs. Then, we chose the solution with the lowest SSE value. The robustness of the choice of n and of the initial random position of the centroids in providing reliable results was also proven.
The sets of the features used in the iterations of the procedure are extracted from a set of 15 potential features (Appendix A), where j represents the jth feature of X, which was taken into account to describe the strain variations in the Part I and II of both the strain and the strain rate signals. Since the features are in different units and ranges, we normalized them in the range [0, 1] to ensure a balanced weight in the clustering process (Langer et al., 2020). The procedure is organized in the following steps:
-
create the most basic subset of features, Cstart, composed by the amplitude, A, and the duration, D, of the strain variation;
-
if it is the first iteration of the procedure, the starting subset of feature related to the ith iteration, Ci, is Cstart or otherwise , defined at point 7;
-
consider a new set of features . Create all the possible subsets of features, Ci,j, composed by Ci plus one feature from Xleft;
-
cluster the dataset using Ci and all the Ci,j;
-
find the optimal number of clusters for the ith iteration of the procedure, kopt,i, by comparing all the k–SSE curves;
-
at kopt,i, calculate the silhouette values averaged over the clusters related to Ci and all the Ci,j, Sil and Sil respectively;
-
if > Sil, then define a new subset of features composed by Ci plus the feature that provides ; repeat from point 2 to point 7, updating Ci with . If ≤ Sil, stop the procedure and take Ci as the optimal set of features, Copt, and kopt,i as the optimal number of clusters, kopt.
The influence of the initialization was investigated by comparing two seeding techniques: the random centroid (RC) position (MacQueen, 1967) and the method proposed by Yedla et al. (2010) (YC). The former method is the most popular and consists of locating the centroids randomly in the range of variation of the features, namely, in our case, between 0 and 1. The latter method involves first sorting data points in accordance with their distance from the origin and then partitioning them in k clusters with an equal number of sorted points. Yedla et al. (2010) proposed to locate the initial centroid position in the barycentre of each cluster. We introduced more randomness by locating the centroids randomly in each cluster. The tests were performed using the optimal set of features, Copt, found with the iterative procedure previously described. To investigate the importance of performing repetitions of the k-means algorithm choosing different initial centroid positions, we repeated the algorithm n times, with n in the range [10, 106].
We used the k-means algorithm to characterize the 2020–2022 lava fountain events using the associated strain changes. The iterative procedure provided the optimal number of clusters, kopt, and the optimal subset of features, Copt, that allow for a high-quality clustering of the strain changes. The procedure converged in two steps, whose results are presented in Fig. 3. Figure 3a shows the k–SSE curves related to all the subsets of features analysed in the last step of the procedure. It can be seen that the elbow of most of the curves is at k = 4, which can thus be selected as the optimal number of clusters, kopt, for our dataset of strain variations. By exploring the silhouette values of all the analysed clustering solutions at kopt, the optimal subset of features Copt is selected in correspondence to the maximum Sil value. The optimal subset is composed by three elements: (i) the amplitude, A, and (ii) the duration, D, of the strain variation and (iii) the average strain rate in the time window ranging from ti to the time when the strain rate reaches the 75 % of the minimum strain rate, SS0–75. The Sil value of the (Copt, kopt) solution, obtained by averaging among all the single Sil values associated with the clustered data points, is very high and equal to 0.83, confirming the goodness of the clustering. Figure 3b shows the single Sil values, presented on the x axis, of all the data points grouped in the related cluster, indicated by the y axis, for the optimal clustering solution (Copt, kopt), where kopt = 4.

Figure 3(a) k–SSE curves related to all the clustering solutions (C, k) analysed in the last iteration when the procedure converged. (b) Silhouette values related to the optimal clustering solution (Copt, kopt), where kopt=4, for all the data points grouped in the related cluster indicated by the y axis.
The Sil values are all positives, indicating a good clustering for all the strain data points. Moreover, the silhouette values averaged among the points within the same cluster are very high and equal to 0.90, 0.71, 0.82 and 0.99 for Cluster 1, Cluster 2, Cluster 3 and Cluster 4, respectively. These values denote both a high cohesion in the same cluster and a high separation among the clusters.
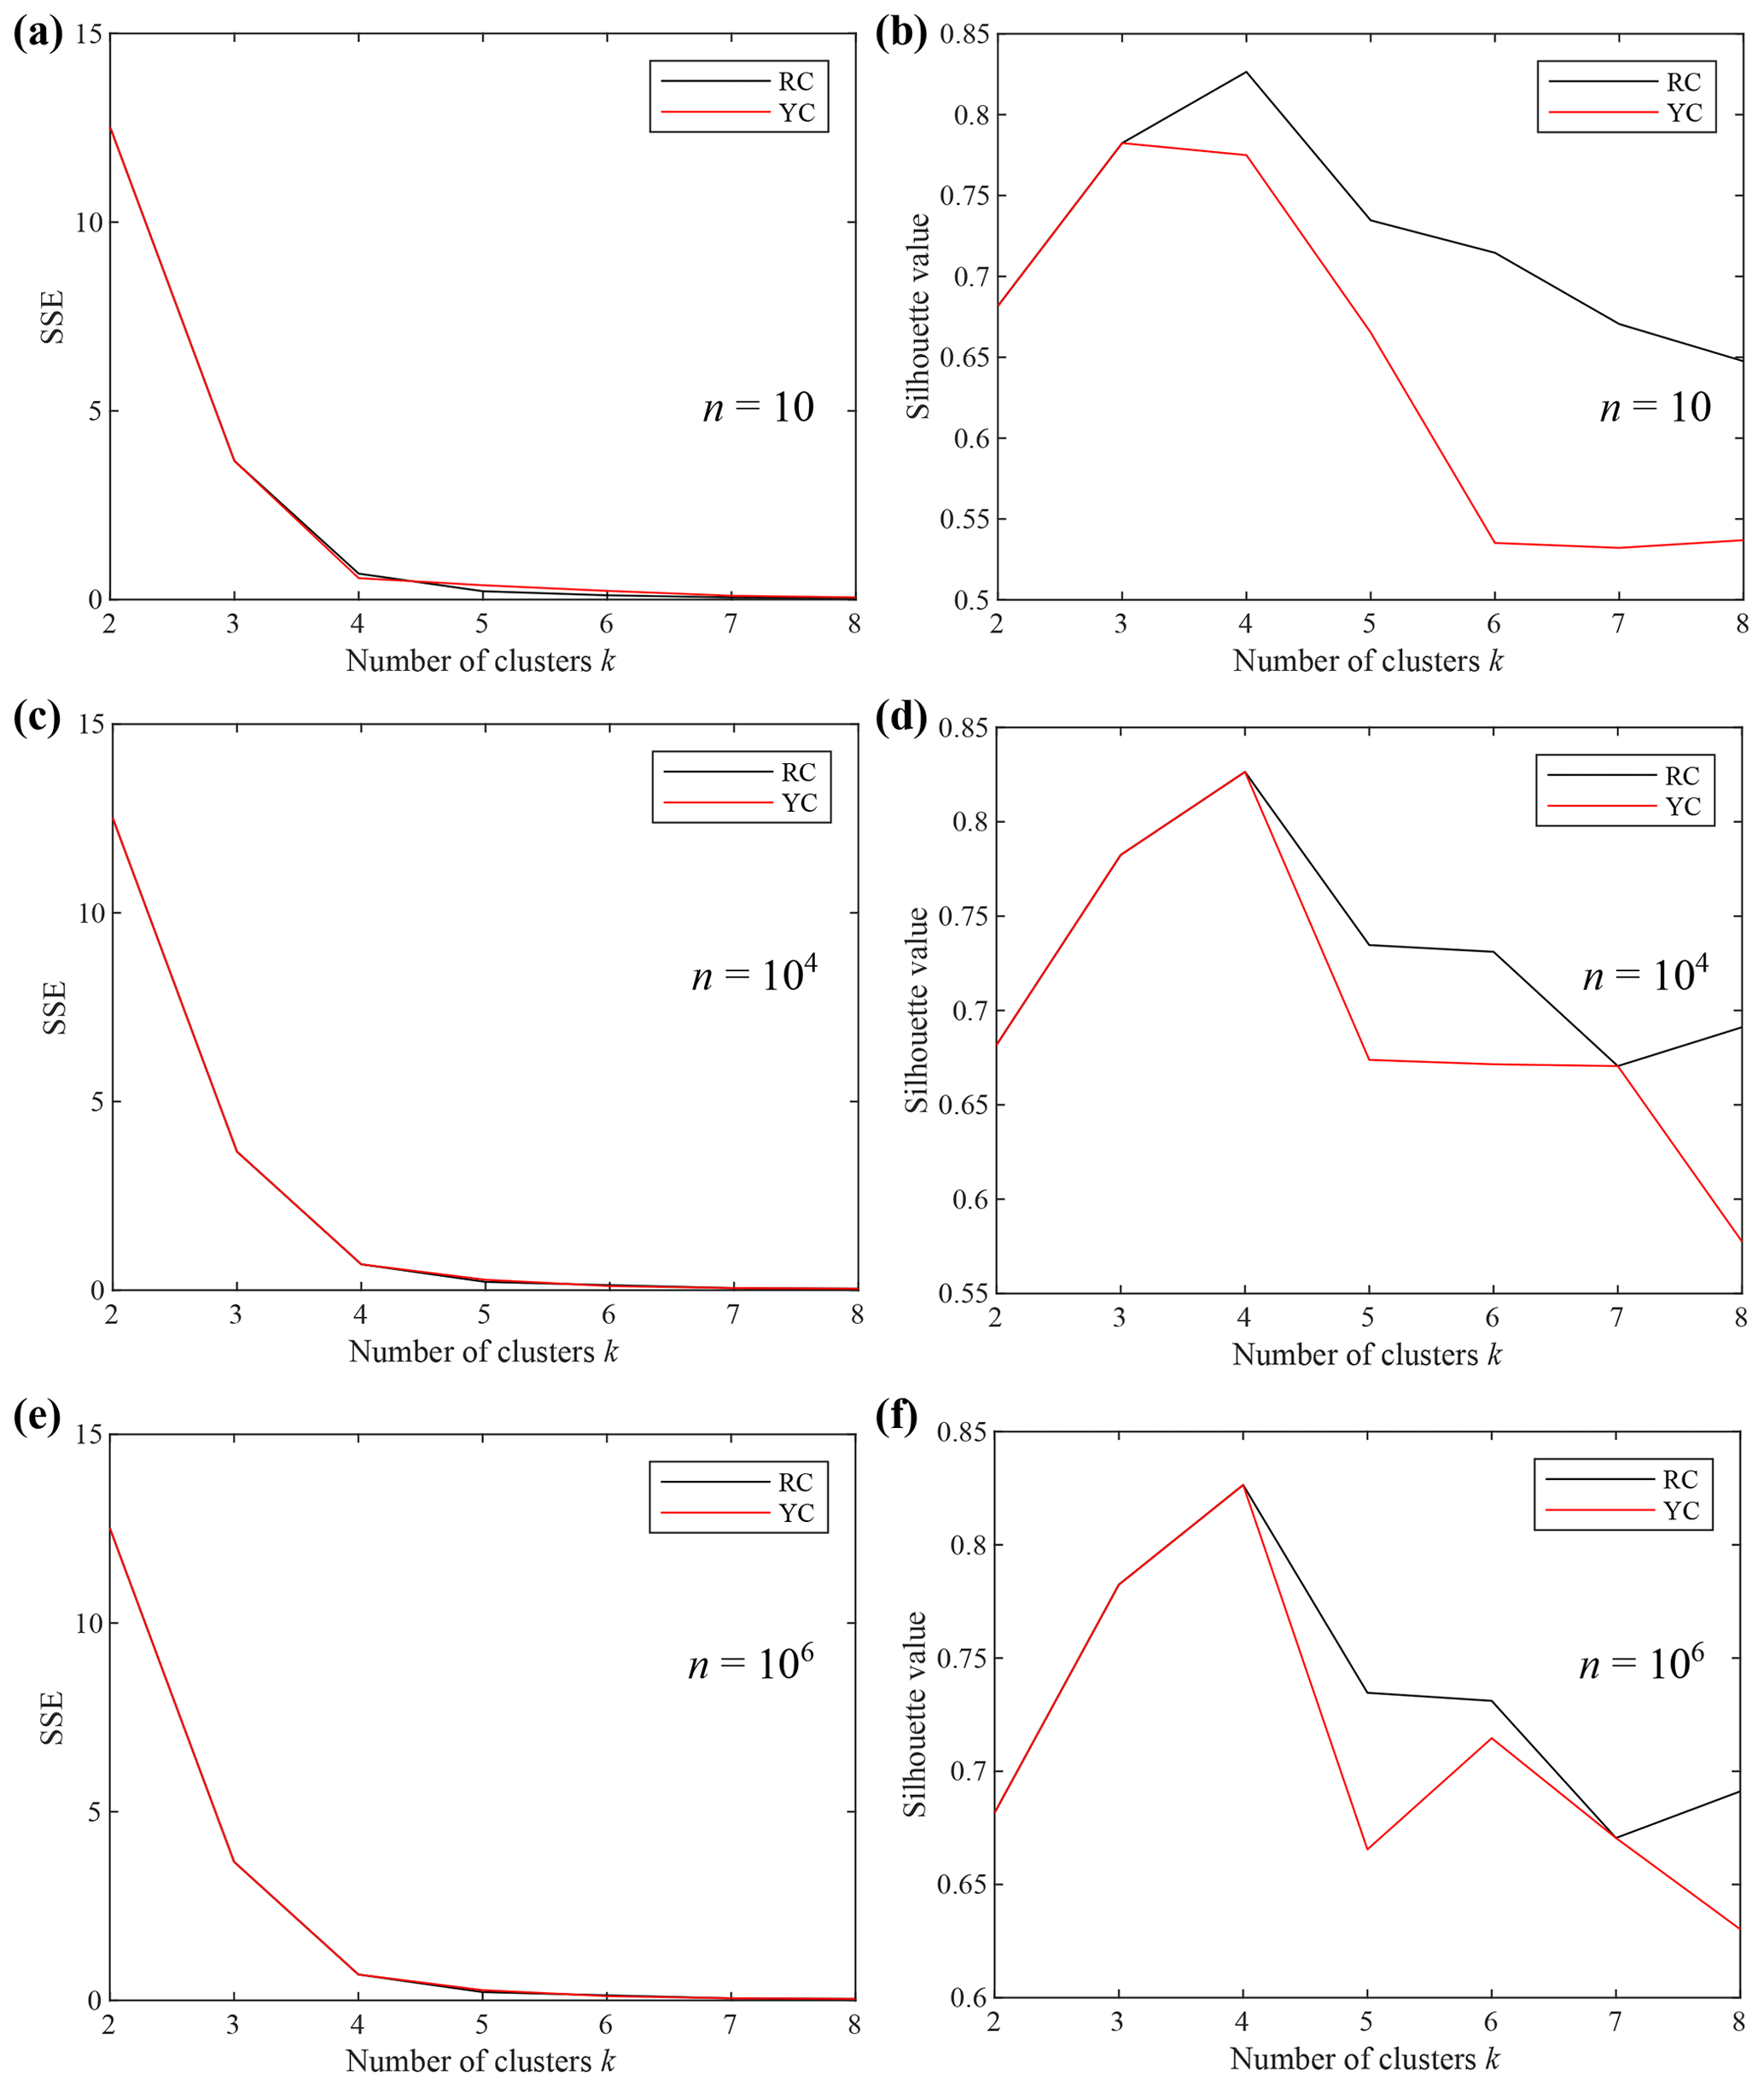
Figure 4k–SSE and k–Sil plots obtained using the optimal set of features, Copt. The SSE and silhouette values are presented considering the random initial centroid (RC) positions and centroids located as proposed by Yedla et al. (2010) (YC). The results obtained by performing a number of repetitions, n, equal to 10 (a, b), 104 (c, d) and 106 (e, f) are shown as an example.
The results of the analysis on the influence of the initial centroid position and on the number of repetitions of the k-means algorithm are summarized in Fig. 4. We reported the k–SSE and the k–Sil plots related to the optimal subset of feature Copt and initialized with the RC and YC methods for a number of repetitions, n, equal to 10, 104 and 106. The k–SSE plots for the different values of n (Fig. 4a, c, e) showed notably overlapped curves, indicating that the analysed initial centroid positions do not affect the shape of the curves and, hence, the choice of kopt. In Fig. 4b, d and f the number of cluster k is plotted against the Sil value for n equal to 10, 104 and 106, respectively. The figures highlight that a high number of repetitions is necessary to make the clustering independent from the analysed initialization techniques. Indeed, the k–Sil curves overlap only with n values higher than 104 and up to k = 4, which corresponds to kopt. Therefore, the outputs of the procedure, kopt and Copt, obtained with n = 104, can be considered reliable.

Figure 5(a) All the clustered strain data points plotted as circles in the domain of the optimal features: amplitude A, duration D and strain rate SS0–75. Stars represent the cluster centroids. Frequency distribution of A (b), D (c) and SS0–75 (d) for the different clusters. Mode values of the distributions are reported in Table 1. In panel (e), all the clustered strain variations are aligned with the initial time, ti.
Table 1Coordinates of the cluster centroids and mode values of the optimal features for each cluster.
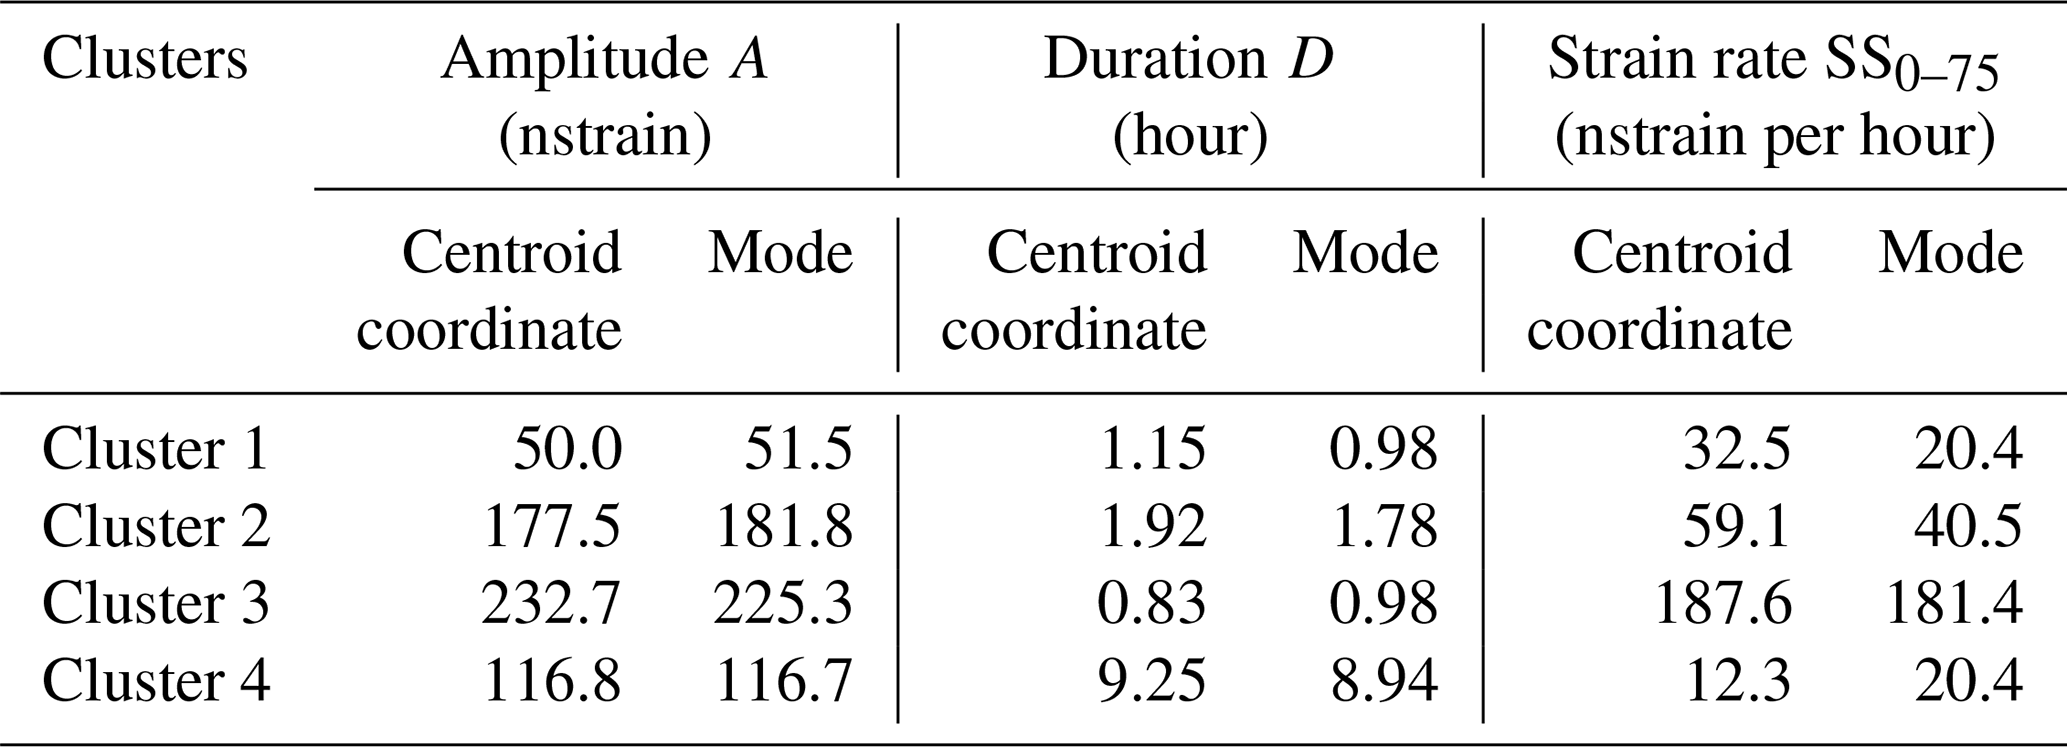
In Fig. 5a, the strain changes are presented in the Copt feature domain, where a very good clustering can also be observed visually, confirming the reliability of the procedure in providing high-quality results. The frequency distribution of the values of the Copt features A, D and SS0–75 are presented in Fig. 5b–d, respectively. The mode values of the frequency distributions of the Copt features are presented together with their centroids locations in Table 1. The analysis of the distributions of the cluster features allows us to identify the main characteristics of the events. Cluster 1 gathers lava fountain episodes of low strain amplitude and duration characterized by small initial strain rate changes. All the features of Cluster 1 are located in the lower range of variations. Cluster 2 groups events whose features cover more the intermediate part of their ranges. Cluster 3 gathers events characterized by high deformations evolving in a very short time window, less than 1 h. Furthermore, the mode value of the SS0–75 feature for Cluster 3 (181.4 nstrain per hour; Table 1) is 4.5 to 9 times higher than for the others. Cluster 4 groups the episodes with the highest mode value for the duration feature D, which is 5 to 11 times higher with respect to the ones related to the other clusters. The mode of the SS0–75 feature in Cluster 4 shows the lowest value among the clusters. In Fig. 5e, all the strain changes are plotted by aligning them with their initial time ti for a further visual comparison among the clustered variations.
For the first time, an automated clustering analysis was applied on strainmeter data to provide an objective quantitative measure of similarities and differences between explosive eruptive episodes. In particular, we studied the lava fountain events that occurred at Etna in the period of December 2020–February 2022. The number of lava fountains recognized by different volcanologists in the studied period may slightly vary. However, the discrepancy in the counting of the events is due to very few weak events, whose classification in a proper category was not simple for the experts themselves. Moreover, when the eruptive activity undergoes several phases of waning and waxing, close-in-time events could often be counted separately or as one (Calvari et al., 2022; Andronico et al., 2021). Despite these slight discrepancies among the experts' evaluations, the total number of lava fountains in the analysed period is at most 66 (Calvari et al., 2022). We used the protocol proposed by Carleo et al. (2022b) to automatically identify the eruptive events from the filtered strain signal. By testing the protocol on the long period from 20 November 2011 to 31 March 2021, Carleo et al. (2022b) obtained a true positive rate close to 1, which means that for each lava fountain event a strain change is associated. Thanks to this high ratio, we can discern, select and study the signals recorded concurrently with almost all the different explosive events. Using this protocol in the period December 2020–February 2022, we recognized 58 lava fountain events from the strain signal. Out of the eight not recognized events, two were not recorded by the DRUV strainmeter because of malfunctioning of the station, and the other six were very weak or counted as sub-events.

Figure 6Temporal distribution of the clusters in the analysed time period plotted over the filtered DRUV signal.
In the studied period, the eruptive events showed a high variability in their characteristics (Andronico et al., 2021; Calvari and Nunnari, 2022; Calvari et al., 2022) that is also noticed in the strain variations. Using the extraordinary 2020–2022 strain dataset, we investigated the use of an automated clustering analysis that allowed us to methodically identify three key features (A, D and SS0–75) that grouped the events in four distinct and coherent clusters. In particular, all the three features are required to distinguish Cluster 1 and 2 from the other clusters, while SS0–75 and D sharply identify Cluster 3 and Cluster 4, respectively.
The clustered events do not occur randomly but are grouped over time, as shown in Fig. 6, denoting a transition in the eruptive dynamic. It turns out that the clusters have an intimate relationship with the volcanic eruption style. In the period Pi+S1 (December 2020–March 2021), Andronico et al. (2021) manually identified three eruption styles classified as transitional activity (TA), sustained lava fountain (LF) and large-scale lava fountain (LSLF). Comparing the strain clustering and the eruption style classification reported in Andronico et al. (2021), we observed an interesting correspondence. The first events recorded in Pi and classified as TA are all grouped in Cluster 1, except the 21 December lava fountain, which falls into Cluster 2. Then, in the S1 lava fountain sequence, the eruptive style turned into LF with episodic LSLF events. As well, the clustering highlights a transition, grouping the S1 events in Cluster 2 and 3. The three events that belong to Cluster 3 are all classified as LSLF in Andronico et al. (2021) and occurred closely in time on 16 February, 28 February and 7 March 2021. At the end of S1 on 23 and 31 March, two LF events occurred that the k-means algorithm does not associate with Cluster 2 and requires the further Cluster 4, well-separated from Cluster 2. After a period of repose, the new sequence S2 restarted in May 2021 with events belonging to Cluster 1 that slowly over time turned into events belonging to Cluster 2. This transition is in agreement with a variation in the parameters estimated from the thermal camera images (Calvari and Nunnari, 2022). The comparison between the manual classification and the automatic clustering highlights that the strain signal is able to recognize and identify four classes of lava fountains, of which three are closely linked to the manual classification and a further one defines a distinctive class. In particular, Cluster 1 groups events that induce small deformation of the volcano edifice; Cluster 2 includes lava fountains to which, on average, higher deformation, higher strain rate and higher duration, with respect to Cluster 1, can be associated; and Cluster 3 groups fast events (duration less than 1 h) with high strain rate. Cluster 4 identifies two events well-separated from the others, since they were characterized by very long duration and very low-rate values. The peculiarity of the events in Cluster 4 was also noticed in previous studies. Calvari and Nunnari (2022) analysed thermal camera images and estimated the duration of all the 2020–2022 episodes with three different approaches. A close inspection of their results shows that the duration of the two events of Cluster 4 exhibits the largest values. Andronico et al. (2021) retrieved seismic parameters from volcanic tremor signals recorded during the eruptive episodes. The parameters related to the events of Cluster 4 show values higher than the average value estimated for the lava fountain events of the studied period.
The identification of clusters of lava fountain events has a strong impact on the alert system in place to manage volcanic crises. During lava fountains, which emit huge amounts of tephra into the atmosphere, knowledge on intensity and duration of the events has important implications, especially for civil aviation. The distinctive features of the clusters could be attributed to the degree of explosiveness and portion of effusive flows accompanying the event that define the eruptive style. Changes in the eruptive style are regulated by many interrelated magmatic properties and processes (Cassidy et al., 2018). The exsolved and dissolved gas content, overpressure at depth, magma composition, and conduit geometry of the plumbing system all control the speed at which magma ascends, decompresses and outgasses and, hence, determines eruptive style and evolution.
Our findings demonstrate that the clustering analysis on the strain signal may contribute to characterizing the different eruptive styles at the Etna volcano and highlighting persistence and transition in the eruptive style, providing indirect insights into the evolution of the magmatic plumbing system. The obtained results are very promising and encourage us to extend them to investigate other volcanic processes that engender strain changes, such as magmatic recharges and intrusions. A joint analysis, together with other geophysical, geochemical, volcanological and petrophysical data, may help in confirming the evolution of the magmatic system conditions and in identifying the most likely magmatic properties and/or processes that regulate the volcano activity at Etna.
| A | Amplitude of the strain change from ti to tf. |
| D | Duration of the strain change from ti to tf. |
| Srmin | Minimum strain rate from ti to tf. |
| SA0–75 | Amplitude from ti to the instant when 75 % of Srmin is reached. |
| SA0–100 | Amplitude from ti to the instant when 100 % of Srmin is reached. |
| SD0–75 | Length of the time window from ti to the instant when 75 % of Srmin is reached. |
| SD0–100 | Length of the time window from ti to the instant when 100 % of Srmin is reached. |
| SS0–75 | Average strain rate from ti to the instant when 75 % of Srmin is reached. |
| SS0–100 | Average strain rate from ti to the instant when 100 % of Srmin is reached. |
| AS0–50 | Average strain rate from ti to the instant when 50 % of A is reached. |
| AS0–75 | Average strain rate from ti to the instant when 75 % of A is reached. |
| ASr | Minimum strain rate from ti to the instant when 50 % of A is reached. |
| ASr | Minimum strain rate from ti to the instant when 75 % of A is reached. |
| AD0–50 | Length of the time window from ti to the instant when 50 % of A is reached. |
| AD0–75 | Length of the time window from ti to the instant when 75 % of A is reached. |
MATLAB scripts and data are available upon request to the corresponding author.
GC and LC conceived and conceptualized the study. LC developed the code and performed the analyses. AB managed and administrated the funding acquisition for conducting the research. All authors contributed to the writing of the manuscript and the discussion of the results.
The contact author has declared that none of the authors has any competing interests.
Publisher’s note: Copernicus Publications remains neutral with regard to jurisdictional claims in published maps and institutional affiliations.
We thank the reviewers and the editor for their helpful and constructive comments and suggestions.
This research has been supported by two projects: the EC H2020 – FET OPEN project “SiC nano for picoGeo” (grant agreement no. 863220) and the 2019–2021 Agreement between INGV and Italian Presidency of the Council of Ministers, Department of Civil Protection (DPC) Annex B2, WP2 – Task 9.
This paper was edited by Giovanni Macedonio and reviewed by two anonymous referees.
Amoruso, A., Crescentini, L., Scarpa, R., Bilham, R., Linde, A. T., and Sacks, S. I.: Abrupt magma chamber contraction and microseismicity at Campi Flegrei, Italy: Cause and effect determined from strainmeters and tiltmeters, J. Geophys. Res.-Sol. Ea., 120, 5467–5478, https://doi.org/10.1002/2015JB012085, 2015.
Andronico, D., Cannata, A., Di Grazia, G., and Ferrari, F.: The 1986–2021 paroxysmal episodes at the summit craters of Mt. Etna: Insights into volcano dynamics and hazard, Earth-Sci. Rev., 220, 103686, https://doi.org/10.1016/j.earscirev.2021.103686, 2021.
Bonaccorso, A. and Calvari, S.: A new approach to investigate an eruptive paroxysmal sequence using camera and strainmeter networks: Lessons from the 3–5 December 2015 activity at Etna volcano, Earth Planet. Sc. Lett., 475, 231–241, https://doi.org/10.1016/j.epsl.2017.07.020, 2017.
Bonaccorso, A., Calvari, S., Linde, A. T., Sacks, S. I., and Boschi, E.: Dynamics of the shallow plumbing system investigated from borehole strainmeters and cameras during the 15 March, 2007 Vulcanian paroxysm at Stromboli volcano, Earth Planet. Sc. Lett., 357–358, 249–256, https://doi.org/10.1016/j.epsl.2012.09.009, 2012.
Bonaccorso, A., Calvari, S., Currenti, G., Del Negro, C., Ganci, G., Linde, A. T., Napoli, R., Sacks, S. I., and Sicali, A.: From source to surface: dynamics of Etna's lava fountains investigated by continuous strain, magnetic, ground and satellite thermal data, B. Volcanol., 75, 1–12, https://doi.org/10.1007/s00445-013-0690-9, 2013a.
Bonaccorso, A., Currenti, G., Linde, A. T., and Sacks, S. I.: New data from borehole strainmeters to infer lava fountain sources (Etna 2011–2012), Geophys. Res. Lett., 40, 3579–3584, https://doi.org/10.1002/grl.50692, 2013b.
Bonaccorso, A., Linde, A. T., Currenti, G., Sacks, S. I., and Sicali, A.: The borehole dilatometer network of Mount Etna: A powerful tool to detect and infer volcano dynamics, J. Geophys. Res.-Sol. Ea., 121, 4655–4669, https://doi.org/10.1002/2016JB012914, 2016.
Bonaccorso, A., Currenti, G., Linde, A. T., Sacks, S. I., and Sicali, A.: Advances in Understanding Intrusive, Explosive and Effusive Processes as Revealed by the Borehole Dilatometer Network on Mt. Etna Volcano, Front. Earth Sci., 7, 357, https://doi.org/10.3389/feart.2019.00357, 2020.
Bonaccorso, A., Carleo, L., Currenti, G., and Sicali, A.: Magma Migration at Shallower Levels and Lava Fountains Sequence as Revealed by Borehole Dilatometers on Etna Volcano, Front. Earth Sci., 9, 740505, https://doi.org/10.3389/feart.2021.740505, 2021.
Calvari, S. and Nunnari, G.: Comparison between Automated and Manual Detection of Lava Fountains from Fixed Monitoring Thermal Cameras at Etna Volcano, Italy, Remote Sens., 14, 2392, https://doi.org/10.3390/rs14102392, 2022.
Calvari, S., Cannavò, F., Bonaccorso, A., Spampinato, L., and Pellegrino, A. G.: Paroxysmal Explosions, Lava Fountains and Ash Plumes at Etna Volcano: Eruptive Processes and Hazard Implications, Front. Earth Sci., 6, 107, https://doi.org/10.3389/feart.2018.00107, 2018.
Calvari, S., Bonaccorso, A., and Ganci, G.: Anatomy of a paroxysmal lava fountain at Etna volcano: The case of the 12 March 2021, episode, Remote Sens., 13, 3052, https://doi.org/10.3390/rs13153052, 2021.
Calvari, S., Biale, E., Bonaccorso, A., Cannata, A., Carleo, L., Currenti, G., Di Grazia, G., Ganci, G., Iozzia, A., Pecora, E., Prestifilippo, M., Sciotto, M., and Scollo, S.: Explosive Paroxysmal Events at Etna Volcano of Different Magnitude and Intensity Explored through a Multidisciplinary Monitoring System, Remote Sens., 14, 4006, https://doi.org/10.3390/rs14164006, 2022.
Canitano, A., Mouyen, M., Hsu, Y.-J., Linde, A. T., Sacks, S. I., and Lee, H.-M.: Fifteen Years of Continuous High-Resolution Borehole Strainmeter Measurements in Eastern Taiwan: An Overview and Perspectives, GeoHazards, 2, 172–195, https://doi.org/10.3390/geohazards2030010, 2021.
Carleo, L., Bonaccorso, A., Currenti, G., and Sicali, A.: Near real-time filtering of high precision borehole strainmeter signals for volcano surveillance, Ann. Geophys.-Italy, 65, 1–13, https://doi.org/10.4401/ag-8787, 2022a.
Carleo, L., Currenti, G., Bonaccorso, A., and Sicali, A.: Real-time signal processing of high-precision borehole strainmeters at Mt. Etna for volcanic surveillance and eruptive events detection, Nuovo Ciment. C, 45, 1–4, https://doi.org/10.1393/ncc/i2022-22185-5, 2022b.
Cassidy, M., Manga, M., Cashman, K., and Bachmann, O.: Controls on explosive-effusive volcanic eruption styles, Nat. Commun., 9, 2839, https://doi.org/10.1038/s41467-018-05293-3, 2018.
Cirillo, F., Avvisati, G., Belviso, P., Marotta, E., Peluso, R., and Pescione, R. A.: Clustering of Handheld Thermal Camera Images in Volcanic Areas and Temperature Statistics, Remote Sens., 14, 3789, https://doi.org/10.3390/rs14153789, 2022.
Corradino, C., Amato, E., Torrisi, F., Calvari, S., and Del Negro, C.: Classifying major explosions and paroxysms at Stromboli volcano (Italy) from space, Remote Sens., 13, 4080, https://doi.org/10.3390/rs13204080, 2021.
Currenti, G. and Bonaccorso, A.: Cyclic magma recharge pulses detected by high-precision strainmeter data: the case of 2017 inter-eruptive activity at Etna volcano, Sci. Rep.-UK, 9, 1–7, https://doi.org/10.1038/s41598-019-44066-w, 2019.
Currenti, G., Zuccarello, L., Bonaccorso, A., and Sicali, A.: Borehole Volumetric Strainmeter Calibration From a Nearby Seismic Broadband Array at Etna Volcano, J. Geophys. Res.-Sol. Ea., 112, 7729–7738, https://doi.org/10.1002/2017JB014663, 2017.
Fränti, P. and Sieranoja, S.: How much can k-means be improved by using better initialization and repeats?, Pattern Recogn., 93, 95–112, https://doi.org/10.1016/j.patcog.2019.04.014, 2019.
Hreinsdóttir, S., Sigmundsson, F., Roberts, M. J., Björnsson, H., Grapenthin, R., Arason, P., Árnadóttir, T., Hólmjárn, J., Geirsson, H., Bennett, R. A., Gudmundsson, M. T., Oddsson, B., Ófeigsson, B. G., Villemin, T., Jónsson, T., Sturkell, E., Höskuldsson, Á., Larsen, G., Thordarson, T., and Óladóttir, B. A.: Volcanic plume height correlated with magma-pressure change at Grímsvötn Volcano, Iceland, Nat. Geosci., 7, 214–218, https://doi.org/10.1038/ngeo2044, 2014.
Ichihara, M.: Seismic and infrasonic eruption tremors and their relation to magma discharge rate: A case study for sub-Plinian events in the 2011 eruption of Shinmoe-dake, Japan, J. Geophys. Res.-Sol. Ea., 121, 7101–7118, https://doi.org/10.1002/2016JB013246, 2016.
Kaufman, L. and Rousseeuw, P. J.: Finding groups in data: an introduction to cluster analysis, John Wiley and Sons, https://doi.org/10.1002/9780470316801, 1990.
Kozono, T., Ueda, H., Ozawa, T., Koyaguchi, T., Fujita, E., Tomiya, A., and Suzuki, Y. J.: Magma discharge variations during the 2011 eruptions of Shinmoe-dake volcano, Japan, revealed by geodetic and satellite observations, B. Volcanol., 75, 965, https://doi.org/10.1007/s00445-013-0695-4, 2013.
Langer, H., Falsaperla, S., Masotti, M., Campanini, R., Spampinato, S., and Messina A.: Synopsis of supervised and unsupervised pattern classification techniques applied to volcanic tremor data at Mt Etna, Italy, Geophys. J. Int., 178, 1132–1144, https://doi.org/10.1111/j.1365-246X.2009.04179.x, 2009.
Langer, H., Falsaperla, S., and Hammer, C.: Advantages and Pitfalls of Pattern Recognition – Selected Cases in Geophysics, Elsevier, https://doi.org/10.1016/C2016-0-00254-1, 2020.
Linde, A. T. and Sacks, S. I.: Continuous monitoring of volcanoes with borehole strainmeters, in: Mauna Loa Revealed: Structure, Composition, History, and Hazards, edited by: Rhodes, J. M. and Lockwood, J. P., American Geophysical Union, Washington D.C., 92, 171–185, https://doi.org/10.1029/GM092p0171, 1995.
Linde, A. T., Agustsson, K., Sacks, S. I., and Ragnar, S.: Mechanism of the 1991 eruption of Hekla from continuous borehole strain monitoring, Nature, 365, 737–740, https://doi.org/10.1038/365737a0, 1993.
Linde, A. T., Kamigaichi, O., Churei, M., Kanjo, K., and Sacks, S. I.: Magma chamber recharging and tectonic influence on reservoirs: The 1986 eruption of Izu-Oshima, J. Volcanol. Geoth. Res., 311, 72–78, https://doi.org/10.1016/j.jvolgeores.2016.01.001, 2016.
Lloyd, S. P.: Least Squares Quantization in PCM, IEEE T. Inform. Theory, 28, 129–137, https://doi.org/10.1109/TIT.1982.1056489, 1982.
MacQueen, J.: Some methods for classification and analysis of multivariate observation, in: Proceedings of the 5th Berkeley Symposium on Mathematical Statistics and Probability, 12–18 June 1965 and 27 December 1965–7 Januray 1966, University Of California, Berkeley, California, 281–297, http://projecteuclid.org/euclid.bsmsp/1200512992 (last access: 10 May 2023), 1967.
NASEM (National Academies of Sciences, Engineering, and Medicine): Volcanic Eruptions and Their Repose, Unrest, Precursors, and Timing, The National Academies Press, Washington, DC, https://doi.org/10.17226/24650, 2017.
Nunnari, G.: Clustering activity at Mt Etna based on volcanic tremor: A case study, Earth Sci. Inform., 14, 1121–1143, https://doi.org/10.1007/s12145-021-00606-5, 2021.
Roeloffs, E. A. and Linde, A. T.: Borehole observations of continuous strain and fluid pressure, in: Volcano deformation, Springer, Berlin, 305–322, https://doi.org/10.1007/978-3-540-49302-0_9, 2007.
Romano, P., Di Lieto, B., Scarpetta, S., Apicella, I., Linde, A. T., and Scarpa, R.: Dynamic strain anomalies detection at Stromboli before 2019 vulcanian explosions using machine learning, Front. Earth Sci., 10, 862086, https://doi.org/10.3389/feart.2022.862086, 2022.
Sacks, S. I., Suyehiro, S., Evertson, D. W., and Yamagishi, Y.: Sacks-Evertson Strainmeter, Its Installation in Japan and Some Preliminary Results Concerning Strain Steps, Pap. Meteorol. Geophys., 22, 195–208, 1971.
Unglert, K., Radić, V., and Jellinek, A. M.: Principal component analysis vs. self-organizing maps combined with hierarchical clustering for pattern recognition in volcano seismic spectra, J. Volcanol. Geoth. Res., 320, 58–74, https://doi.org/10.1016/j.jvolgeores.2016.04.014, 2016.
Voight, B., Linde, A. T., Sacks, S. I., Mattioli, G. S., Sparks, R. S. J., Elsworth, D., Hidayat, D., Malin, P. E., Shalev, E., Widiwijayanti, C., Young, S. R., Bass, V., Clarke, A., Dunkley, P., Johnston, W., McWhorter, N., Neuberg, J., and Williams, P.: Unprecedented pressure increase in deep magma reservoir triggered by lava-dome collapse, Geophys. Res. Lett., 33, L03312, https://doi.org/10.1029/2005GL024870, 2006.
Yedla, M., Pathakota, S. R., and Srinivasa, T. M.: Enhancing K-means Clustering Algorithm with Improved Initial Center, International Journal of Computer Science and Information Technologies, 1, 121–125, 2010.
- Abstract
- Introduction
- Strain changes during the Etna lava fountains in 2020–2022
- Clustering the strain variations with the k-means algorithm
- Clustering results
- Discussions and conclusion
- Appendix A: Features considered in the cluster analysis
- Code and data availability
- Author contributions
- Competing interests
- Disclaimer
- Acknowledgements
- Financial support
- Review statement
- References