the Creative Commons Attribution 4.0 License.
the Creative Commons Attribution 4.0 License.
 | 08 May 2023
The extremely hot and dry 2018 summer in central and northern Europe from a multi-faceted weather and climate perspective
Lauren S. Andersen
Florian N. Becker
Goratz Beobide-Arsuaga
Marcus Breil
Giacomo Cozzi
Jens Heinke
Lisa Jach
Deborah Niermann
Dragan Petrovic
Andy Richling
Johannes Riebold
Stella Steidl
Laura Suarez-Gutierrez
Jordis S. Tradowsky
Dim Coumou
André Düsterhus
Florian Ellsäßer
Georgios Fragkoulidis
Daniel Gliksman
Dörthe Handorf
Karsten Haustein
Kai Kornhuber
Harald Kunstmann
Joaquim G. Pinto
Kirsten Warrach-Sagi
Elena Xoplaki
The summer of 2018 was an extraordinary season in climatological terms for northern and central Europe, bringing simultaneous, widespread, and concurrent heat and drought extremes in large parts of the continent with extensive impacts on agriculture, forests, water supply, and the socio-economic sector. Here, we present a comprehensive, multi-faceted analysis of the 2018 extreme summer in terms of heat and drought in central and northern Europe, with a particular focus on Germany. The heatwave first affected Scandinavia in mid-July and shifted towards central Europe in late July, while Iberia was primarily affected in early August. The atmospheric circulation was characterized by strongly positive blocking anomalies over Europe, in combination with a positive summer North Atlantic Oscillation and a double jet stream configuration before the initiation of the heatwave. In terms of possible precursors common to previous European heatwaves, the Eurasian double-jet structure and a tripolar sea surface temperature anomaly over the North Atlantic were already identified in spring. While in the early stages over Scandinavia the air masses at mid and upper levels were often of a remote, maritime origin, at later stages over Iberia the air masses primarily had a local-to-regional origin. The drought affected Germany the most, starting with warmer than average conditions in spring, associated with enhanced latent heat release that initiated a severe depletion of soil moisture. During summer, a continued precipitation deficit exacerbated the problem, leading to hydrological and agricultural drought. A probabilistic attribution assessment of the heatwave in Germany showed that such events of prolonged heat have become more likely due to anthropogenic global warming. Regarding future projections, an extreme summer such as that of 2018 is expected to occur every 2 out of 3 years in Europe in a +1.5 ∘C warmer world and virtually every single year in a +2 ∘C warmer world. With such large-scale and impactful extreme events becoming more frequent and intense under anthropogenic climate change, comprehensive and multi-faceted studies like the one presented here quantify the multitude of their effects and provide valuable information as a basis for adaptation and mitigation strategies.
- Article
(5071 KB) - Full-text XML
-
Supplement
(698 KB) - BibTeX
- EndNote


Following an anomalously warm and dry spring, the summer of 2018 was characterized by record-breaking widespread heat and drought across Europe (Kennedy et al., 2019; Toreti et al., 2019) with intense heatwaves affecting large parts of Scandinavia (Sinclair et al., 2019) and central Europe (e.g., Vogel et al., 2019). In Germany, both the months of April–May, as well as the April–July period, and the entire year were identified as the warmest in the observational records starting in 1881. Moreover, Germany faced remarkably prolonged drought from February to November, with 2018 being the fourth driest year on record (after 1959, 1911, and 1921). A new record was also set for annual sunshine duration, amounting to 2015 h (Friedrich and Kaspar, 2019). In Finland, the peak temperature in summer exceeded 33 ∘C, which is extremely unusual for a region located near the Arctic Circle, breaking historical records of the past 40 years (Liu et al., 2020). In the UK, the summer of 2018 joined 2006 as the hottest on record since 1884. In England itself, this was the warmest on record, while June 2018 was the driest June for England since 1925 (Kendon et al., 2019). Over the Iberian Peninsula, a heatwave developed in early August 2018, with this month being the warmest in the region after 2003 (Barriopedro et al., 2020). The normal eastward propagation of weather systems was hindered in the summer of 2018 by the recurrent presence of blocking anticyclones, associated with a particularly meandering jet stream, which was reflected in the way the heatwave propagated, starting in Scandinavia (peaking mid-July), then developing in central Europe (end of July), and ending in Iberia (beginning of August). For the European continent, 2018 was the second warmest summer on record (following 2010), as estimated from the CRUTEM4 dataset (Kennedy et al., 2019), prior to being marginally surpassed by the 2021 summer (Climate Change Service, 2018, 2021).
In terms of amplitude, persistence, and spatial extent, the 2018 heatwaves were comparable to the “mega heatwaves” of 2003 and 2010 over Europe and Russia (Spensberger et al., 2020; Becker et al., 2022), during which more than 1 million square kilometers were simultaneously affected by heatwave conditions (Fink et al., 2004; Barriopedro et al., 2011). But, unlike 2003 and 2010, the exceptionally extreme heat in 2018 occurred under concurrent exceptionally dry conditions, thus making the events in 2018 a spatially and temporally compound extreme (Zscheischler et al., 2020; Bastos et al., 2021; Ionita et al., 2021). These co-occurring hot and dry extremes, not only in central Europe but also in multiple regions of the Northern Hemisphere midlatitudes (Vogel et al., 2019), caused vast aggregated impacts (Bakke et al., 2020), ranging from drought-inflicted forest mortality events of an unprecedented scale (Schuldt et al., 2020; Senf and Seidl, 2021), up to a 50 % reduction in agricultural yields (Toreti et al., 2019; Beillouin et al., 2020), and increased forest fire occurrence (San-Miguel-Ayanz et al., 2019) to excess heat-related human mortality (Pascal et al., 2021). Compared to previous droughts since 2000, the summer of 2018 occupied the largest extent of extreme and severe agriculture drought, centered around Germany, Poland, most of Scandinavia, and the Baltic countries, affecting a larger extent of boreal forests and high-latitude ecosystems (Peters et al., 2020). Further, from a temporal point of view, compared to other droughts of the past 40 years, 2018 was characterized by the sharpest transition from average-to-wet conditions in late winter to extremely strong soil water deficits in summer (Bastos et al., 2020).
Surface heatwaves are typically co-located with the center of the associated blocking system (Kautz et al., 2022; their Fig. 2b). If the blocking is intense and persistent, a heatwave will usually develop. On the other hand, unsteady weather conditions, like thunderstorms and heavy precipitation, are frequent on the flanks of the blocking system, which correspond to the air mass boundaries (Kautz et al., 2022). In fact, summer extremes can be exacerbated by different components of the Earth system, such as anomalous atmospheric circulation patterns, oceanic conditions, and the state of the land surface (Wehrli et al., 2019; Di Capua et al., 2021). The atmospheric circulation during the late spring and summer of 2018 was characterized by the frequent presence of atmospheric blocking and a persistent positive summer North Atlantic Oscillation (sNAO; Drouard et al., 2019; Li et al., 2020). Among the possible precursors of European heatwaves, here we analyzed spring sea surface temperatures (SSTs) over the North Atlantic and soil moisture anomalies over Europe. In particular, the tripolar North Atlantic SST anomaly pattern is known to be influenced by the winter NAO, persisting over spring and affecting European climate in summer (Herceg-Bulić and Kucharski, 2014). The North Atlantic tripolar pattern has been associated with the East Atlantic pattern (Gastineau and Frankignoul, 2015) and Atlantic ridges (Ossó et al., 2020), leading to decreased summer precipitation (Saeed et al., 2013; Rousi et al., 2021) and increased summer temperatures over Europe (Chen et al., 2016). Additionally, Duchez et al. (2016) argue that a cold anomaly over the North Atlantic subpolar gyre (SPG) may be associated with a stationary position of the jet stream, enhancing European summer heat extremes. Moreover, soil moisture–temperature feedbacks can amplify heat extremes (Seneviratne et al., 2010). Through a positive feedback, soil moisture depletion by hot and dry atmospheric conditions leads to a reduction of evaporative cooling and suppressed convective available potential energy (CAPE) values, subsequently limiting the rainfall potential and further increasing air temperatures (Miralles et al., 2014, 2018; Prodhomme et al., 2022). Further, Schumacher et al. (2019) highlighted the important role of upwind land–atmosphere feedbacks in addition to local feedbacks, as they can favor heat advection and intensify midlatitude mega heatwaves via soil desiccation.
Hot and dry summers in Europe are expected to occur more frequently under anthropogenic global warming (IPCC, 2021). McCarthy et al. (2019) conducted an attribution study for the 2018 summer heatwave in the UK based on Coupled Model Intercomparison Project Phase 5 (CMIP5) models and found that the present-day likelihood of such extremes is around 11 %, which has been made 30 times higher due to anthropogenic climate change, while this likelihood increases to 53 % by the 2050s. Given the increase in hot and dry extremes in Europe (Manning et al., 2019; Perkins-Kirkpatrick and Lewis, 2020; Markonis et al., 2021) and their further expected increase under continued unmitigated anthropogenic climate change (Russo et al., 2014, 2015; Spinoni et al., 2018, 2020), comprehensive weather and climate studies analyzing regional heatwave and drought characteristics, drivers, and impacts are particularly important.
Within the German research initiative ClimXtreme, about 140 scientists from 35 institutions joined 39 projects to further understand climate extremes, focusing on central Europe (https://climxtreme.net/index.php/en/, last access: 16 April 2023). Inter-disciplinary task forces were formed, among which one on heat and drought. This study brings together its members to study the 2018 European heat and drought from a multi-faceted weather and climate perspective, making it the first comprehensive and spatially exhaustive study looking at hot and dry summers over Europe using different analysis approaches to study (a) the extremeness of and attribution to anthropogenic climate change (climate perspective), as well as (b) the synoptic dynamics in concert with the role of slowly varying boundary conditions at the ocean and continental surfaces (seasonal and weather perspective). In the following, first, the data and methods are presented (Sect. 2). Different metrics for the detection and description of the 2018 summer extremes are shown in Sect. 3.1. Then, we present various features of the atmospheric circulation, including blocking, jet stream state, weather regimes, Rossby wave activity, and air mass trajectories (see Sect. 3.2). Next, the role of low-frequency precursors, i.e., SSTs and soil moisture in spring, in setting the scene and eventually shaping those extremes is investigated (see Sect. 3.3). Section 3.4 examines the event from a large ensemble climate model perspective, accompanied by a tailored attribution analysis that incorporates the length of the heatwave in Germany based on CMIP6 models. The “Discussion and conclusions” section completes this paper.
2.1 Data
In this paper we use a variety of datasets, including observational, reanalysis, and model data. We use a common spatial domain for Europe (30–70∘ N, 10∘ W–50∘ E) and the reference period 1981–2010 unless otherwise stated.
2.1.1 Reanalysis and observational datasets
ERA5 (Hersbach et al., 2020) and ERA5-HEAT (Di Napoli et al., 2021) reanalysis datasets were utilized for the calculation of heatwave metrics (see Sect. 3.1) and the dynamical drivers and their evolution, such as Rossby wave activity, backward trajectories, double jet streams, atmospheric blocking, and weather regimes (see Sect. 3.2), as well as for the calculation of precursors, i.e., SSTs and soil moisture (see Sect. 3.3). E-OBS gridded observational datasets (Haylock et al., 2008; Cornes et al., 2018) were used for the calculation of the drought index (standardized precipitation evapotranspiration index (SPEI), see Sect. 3.1) and to estimate the return period of the heatwave and select equivalent extreme events in CMIP6 model simulations for the attribution study (see Sect. 3.4). Observational datasets from the German Weather Service (DWD) stations (Kaspar et al., 2013) were used for the thermopluviogram for Germany (see Sect. 3.1).
2.1.2 General circulation models
The historical and RCP4.5 simulations of the Max Planck Institute Grand Ensemble (MPI-GE; Maher et al., 2019) were used to calculate the cumulative excess heat under recent climate (1979–2021) and future 1.5 ∘C (2020–2049) and 2 ∘C (2050–2079) warmer worlds (see Sect. 3.4). The advantage of this dataset is that, apart from the forced response, it provides an estimate of the internal natural variability. Historical simulations of several Coupled Model Intercomparison Project Phase 6 models (CMIP6; Eyring et al., 2016) and pre-industrial-type simulations (hist-nat) of the same models from the CMIP6-endorsed Detection and Attribution Model Intercomparison Project (DAMIP; Gillett et al., 2016) were used for the probabilistic attribution study (see Sect. 3.4). An overview of the analyzed CMIP6 models is given in Table S1 in the Supplement.
2.2 Methods
2.2.1 Heatwave metrics
Despite the fact that heatwaves have been a topic of active climate research for many decades, there is no universal heatwave definition, and there are multiple metrics and criteria depending on the region, season, and purpose of the study (Becker et al., 2022). Here, we define a heatwave as an event of at least 3 consecutive days during which the 90th percentile of the daily maximum temperature based on each calendar day is exceeded (Fischer and Schär, 2010). We chose two different metrics to characterize heatwave intensity, the cumulative heat, which uses temperature only, and the cumulative Universal Thermal Climate Index (cUTCI) that represents human thermal comfort, taking into account temperature, humidity, wind, and radiation. Cumulative heat and cUTCI refer to the integration of heat exceedance over the threshold for all heatwave days of a season. In the present study, only summer months (June to August; JJA) were considered, hence combining the intensity and persistence of heatwaves (Perkins-Kirkpatrick and Lewis, 2020). The cUTCI was calculated for each day as in Błazejczyk et al. (2013), and the 90th percentile of the daily time series was defined. The cumulative intensity was then calculated as the integration of the exceedance above this threshold for the whole season.
2.2.2 Drought indicator
For the characterization and detection of the 2018 drought we present the standardized precipitation evapotranspiration index (SPEI; Vicente-Serrano et al., 2014), a widely used drought indicator. We show two aggregation periods, of 3 and 6 months, so that two types of droughts can be considered, meteorological (SPEI3) and agricultural (SPEI6) (Heim, 2002; Zampieri et al., 2017). The SPEI was calculated with the SPEI R Package (Beguería and Vicente-Serrano, 2013), based on monthly precipitation sums and monthly mean maximum and minimum temperatures that are needed for the calculation of the potential evapotranspiration (PET). The PET was calculated based on the modified Hargreaves equation (Droogers and Allen, 2002), a method that corrects the PET by using the monthly rainfall amount as a proxy for insolation and that is based on the hypothesis that this amount can change the humidity levels (Vicente-Serrano et al., 2014). The values obtained by this method are similar to those obtained from the Penman–Monteith method (Allen et al., 2006).
2.2.3 Atmospheric circulation metrics
The large-scale atmospheric circulation patterns and the dynamical evolution of the atmosphere associated with the 2018 extremes were analyzed using various metrics. First, we looked at the weather regimes during summer in order to characterize large-scale circulation features. Five summer circulation regimes were computed with K-means clustering (Crasemann et al., 2017) applied to ERA5 sea-level pressure (SLP) anomalies for the time period 1979–2018 over the North Atlantic–European region (30–88∘ N, 90∘ W–90∘ E). Further, blocking frequency anomalies were calculated at a grid point level based on a hybrid, two-dimensional blocking index. Daily blocked grid points were identified based on the inversion of meridional gradients in the 500 hPa geopotential height (gph) field according to a modified version of the index from Scherrer et al. (2006) and on areas of strong positive gph anomalies associated with the blocking detection. Finally, blocking events of a duration of at least 4 d and an area of 1.5 × 10⁶ km2 were selected by a subsequent tracking algorithm described in Schuster et al. (2019).
Next, we looked at the state of the jet stream. Jet stream states were identified with the use of self-organizing maps (SOMs), a neural-network-based clustering algorithm (Kohonen, 2013; Rousi et al., 2015). SOMs were applied on daily ERA5 data of Eurasian (25–80∘ N, 25∘ W–180∘ E) zonal mean zonal wind data on different pressure levels (800–100 hPa) for the time period 1979–2020 (see details in Rousi et al., 2022). Moreover, we applied the methodology of Fragkoulidis and Wirth (2020) to identify Rossby wave packets and their amplitudes (E) for the 2018 summer. The method employs the meridional wind field (v) at 300 hPa at 2 × 2∘ resolution, which was taken from the ERA5 data. The visualization of E and v (see Fig. 4) is adaptive to the latitude location of strong Rossby wave packets, and only the latitudinal belt of 40–90∘ N was taken into account. For each longitude, E and v are averaged over 10 grid points that exceed the median of all values within that belt.
To analyze the origin of the air masses during the 2018 summer heatwave, we calculated backward trajectories using Lagrangian analysis and the LAGRANTO tool (Sprenger and Wernli, 2015). In particular, we calculated 10 d backward trajectories for the levels between 1000 and 500 hPa in steps of 25 hPa using ERA5 data for three starting locations in Europe on the respective peak heatwave days. As in Zschenderlein et al. (2020), starting points were also taken within the upper-tropospheric blocking anticyclone, in this case over Scandinavia. These were defined as the grid points where the anomaly of the vertically averaged potential vorticity (between 500 and 150 hPa, based on monthly climatology) was below −0.7 PVU (1 PVU = 10−6 K kg−1 m2 s−1). For all grid points that fulfilled this criterion, trajectories were initialized every 50 hPa between 500 and 150 hPa in the vertical dimension. To exclude starting points in the stratosphere, only grid points with potential vorticity (PV) < 1 PVU were considered.
2.2.4 Low-frequency precursors
In order to analyze low-frequency precursors of the summer of 2018 extremes, we considered SSTs, total precipitation, and soil moisture in the preceding months. The SST anomalies, compared to the reference period of 1981–2010, over the North Atlantic and the seas surrounding Europe (Mediterranean, North Sea, Baltic Sea) were analyzed for the spring (March to May; MAM) and summer (June to August; JJA) months of 2018 in ERA5 data. Precipitation and soil moisture anomalies over Europe were also calculated for the same seasons in ERA5.
Additionally, we derived time series for the soil-moisture-latent heat flux correlation in Germany based on ERA5 reanalysis data with a daily temporal resolution based on centered 92 d running windows. This approach was used because soil moisture limitation depends on various factors, such as the climatic conditions and vegetation characteristics (rooting depth, leaf area index (LAI), and stomatal conductance), which vary spatially and can change during the course of a year (Duan et al., 2020). Therefore, the limitation cannot be easily represented by a unified, fixed value. The time series were spatially averaged over all land points for northern Germany and surroundings (51–55∘ N and 4–16∘ E), as well as southern Germany and surroundings (48–51∘ N and 4–16∘ E). The German alpine region was not included in the southern German region because the complex topography that cannot be accounted for in this study influences the results.
2.2.5 Attribution of the 2018 extreme heat
Extreme event attribution typically addresses the question of whether and to what extent climate change has affected the severity and/or frequency of a specific extreme weather event (Shepherd, 2016). The most commonly used approach to extreme event attribution is probabilistic event attribution (Philip et al., 2020), which compares climate model simulations under different scenarios, i.e., a factual scenario which simulates the weather under current and past climate conditions and a counterfactual scenario which simulates weather under climate conditions excluding anthropogenic influences.
Here we present two kinds of attribution approaches. In the first, we used the MPI-GE to estimate the probability of exceedance of the 2018 summer heat levels in the whole European domain for present and future climates, and in the second, we present a tailored extreme event attribution study for Germany based on CMIP6 simulations to calculate probability ratios for the persistent 2018 heat event in Germany.
The MPI-GE (Maher et al., 2019) was used to estimate and compare the probabilities of exceeding the 2018 summer levels of cumulative heat in the reanalysis data (ERA5, 1979–2021) and under recent (1979–2021) climate, as well as future 1.5 ∘C (2020–2049) and 2 ∘C (2050–2079) warmer worlds. The same heatwave metric and parameters were used to calculate the cumulative heat as the ones described above (Sect. 2.2.1). The ERA5 data were regridded to a coarser resolution to match that of the MPI-GE, and the probabilities were normalized to percentages (i.e., divided by the total number of years in each period).
Then, to estimate how the occurrence probability of the 2018 heatwave in Germany has been affected by anthropogenic climate change, a tailored probabilistic attribution study was conducted using CMIP6 simulations. The historical CMIP6 simulations provide the factual scenario, while hist-nat simulations from DAMIP provide the counterfactual scenario. The analysis is based on an attribution system currently under development at DWD within the ClimXtreme project and involves (1) defining the extreme event, (2) analyzing observational data and estimating the probability/return period of such an event based on observations, (3) validating the climate model simulations, (4) preparing and analyzing the climate model simulations, and (5) calculating a probability ratio between the historical and hist-nat simulations.
Based on CMIP/DAMIP data available at the computing facility of the German Climate Computing Center (DKRZ) the most appropriate climate models were selected for the tailored attribution study by including the ones that had at least three initializations in the DAMIP archive and passed the validation tests outlined below for the maximum temperature (Tmax) that is analyzed in the attribution study. The climatology of Tmax and the spatial pattern of the yearly averaged maximum temperature were visually compared between the models and the gridded E-OBS dataset to evaluate whether the models are able to represent the climate conditions over Germany. Additionally, the parameters of a generalized extreme value (GEV) distribution fitted to the simulation data were compared with a fit to the E-OBS data to check whether they agree within their uncertainty bounds. Furthermore, a general consistency check was performed for each model ensemble. The evaluation procedure is similar to the one used in World Weather Attribution (WWA) studies (see e.g., Philip et al., 2020). Simulations of CMIP6 models that passed the validation were further analyzed (see Table S1 for a list of the models).
The following steps are required to calculate the risk ratio: CMIP and DAMIP Tmax data from all available initializations of the model were selected for the German region and for the 30-year timeframe from 1985–2014. The data were averaged over the region, and a 17 d running mean was calculated, based on the event definition which is further elaborated on in Sect. 3.4. The yearly block maxima were then selected from all initializations, and a GEV fit was used to estimate the probability of heatwaves in the simulation data that are equivalent to the observed event of 2018. To account for offsets between observed and simulated temperatures, we analyzed a simulated heat event which has – in the historical simulations – the same probability as the observed heatwave, i.e., while the simulated event may not reach the same temperature as was observed in 2018, the temperature threshold used to analyze the simulations has the same return period as the observed event (see also Philip et al., 2020; Tradowsky et al., 2022). To increase the robustness of the results a 1000-member bootstrap was used and a GEV distribution was fitted to each of these 1000 alternative time series. The probability ratios (PRs) were then calculated from the probabilities of such heatwaves in the historical and hist-nat simulations using the GEV fits to the original simulation time series and to the 1000 alternative time series, according to Eq. (1):
where Phistorical is the probability of the event to occur in the historical CMIP scenario, and Phist-nat is the probability in the naturalized DAMIP scenario in which anthropogenic greenhouse gas emissions are fixed to pre-industrial times.
A probability ratio > 1 indicates an increase in the probability of such an event due to anthropogenic climate change, a result which is typically found for recent heatwaves (see e.g., Stott et al., 2004; Philip et al., 2022).
3.1 Detection and description of the 2018 summer extremes
The 2018 summer was an extreme season from a climatological perspective for many regions in Europe. An intense heatwave first affected Scandinavia in mid-July and then extended towards central Europe and later Iberia, spanning a total period of 4 weeks. The maximum heatwave duration was seen in Scandinavian regions, reaching 20 consecutive days (Fig. 1a). Cumulative heat reached peak values in parts of Norway, Sweden, Germany, France, Ireland, and the UK (Fig. 1b). The cUTCI index showed periods of extreme heat stress in Portugal and southwestern Spain; very strong heat stress in northern and central Germany, central-western Poland, large parts of France and Iberia; and strong heat stress in most of eastern Europe, Finland, southern Scandinavia, and parts of the British Isles (Fig. 1c). The high intensities in Turkey and the Caucasian region were not caused by the same weather pattern as the event described in this paper and are thus not discussed here.
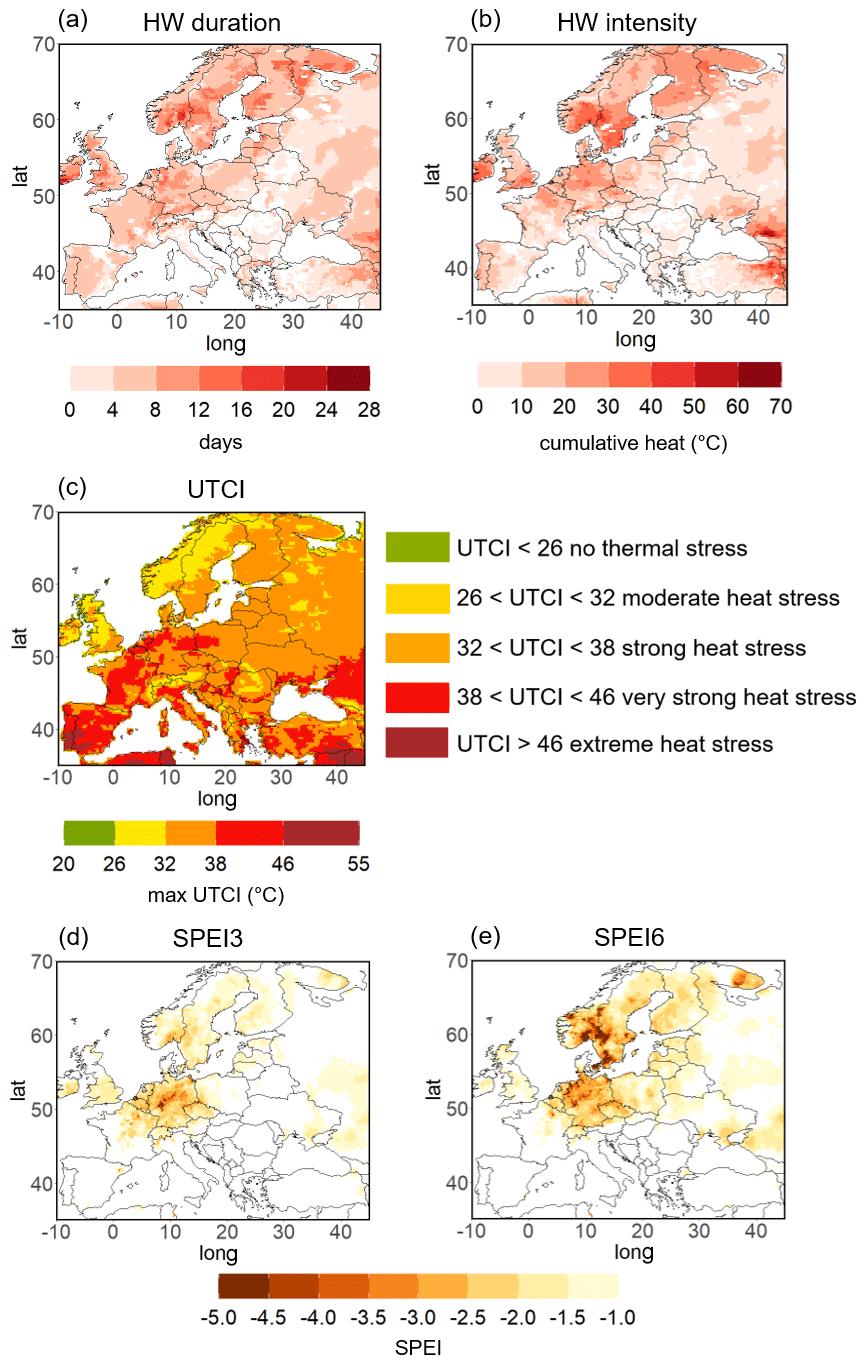
Figure 1Spatial representation of European heatwave (ERA5) and drought (E-OBS) in the 2018 summer. (a) Maximum heatwave duration in days (grid-point-based, exceedance of 90th percentile of daily maximum temperature). (b) Cumulative heat (in ∘C). (c) Maximum UTCI in the 2018 summer per grid point and respective heat stress category. (d) SPEI3 August. (e) SPEI6 August. Only SPEI values below −1 are shown in order to highlight drought conditions. Reference period used in all metrics: 1981–2010.
In northern and central Europe, the heatwave was preceded and accompanied by intense drought conditions. As an example, the meteorological drought is depicted in terms of the SPEI3 and SPEI6 values for August (Fig. 1d, e) that were particularly low in central and northern Europe. The cumulative effects of low precipitation and high evapotranspiration lead to lower values of the SPEI6 index in many European regions compared to SPEI3. The most extreme values (SPEI6 < −5) are identified for southern Norway and Sweden. The thermopluviogram for Germany depicts temperature and precipitation anomalies for Germany and confirms that the extended warm period of April to October 2018 was the most exceptional in terms of precipitation deficit and heat anomaly compared to the reference period (1981–2010) since 1881 (Fig. 2). When considering different seasonal periods, such as March to August or June to August only, 2018 remains a very extreme season (see Fig. S1). In summary, while the heatwave was most intense in southern Scandinavia, 2018 stood out as the most intense compound heat and dry event in the observational history for Germany, in agreement with Zscheischler and Fischer (2020).
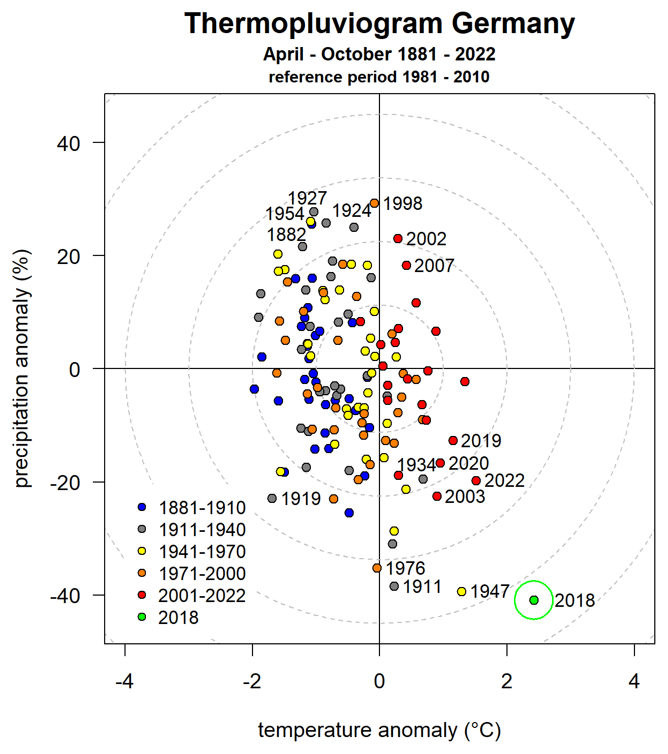
Figure 2Thermopluviogram for the growing season, April to October, of the years 1881–2022 for Germany, showing the temperature and precipitation anomalies from the climatological mean (DWD observational data, reference period 1981–2010). The year 2018 is highlighted with a light green color. Thermopluviograms for different periods can be found in the Supplement (Fig. S1).
3.2 Dynamical drivers and evolution
In order to characterize large-scale circulation features for the summer of 2018, we used a number of different and complementary metrics to describe the multi-faceted characteristics of the event. First, we analyzed the blocking conditions for this season, as the occurrence of heatwaves is directly associated with summer blocking or – for the lower latitudes in Europe – to atmospheric ridges (Woollings et al., 2018; Sousa et al., 2018; Kautz et al., 2022). Using the blocking detection algorithm, we confirm that for the 2018 summer, blocking is detected over Great Britain from late June into the first 10 d of July as well as over Scandinavian and Ural regions for most days of July (Fig. S2). Compared to the climatological occurrence of blocking frequency, the percentage of blocked days in June–July 2018 was 20 %–60 % higher in the mentioned areas (Fig. 3a, b), indicating blocking frequency values above the 90th percentile (Fig. S3). This large-scale setup for the summer time (see e.g., Kautz et al., 2022, their Fig. 2b) leads to the development of a heatwave collocated with the center of the blocking, while unsteady weather conditions may happen on the block edges.
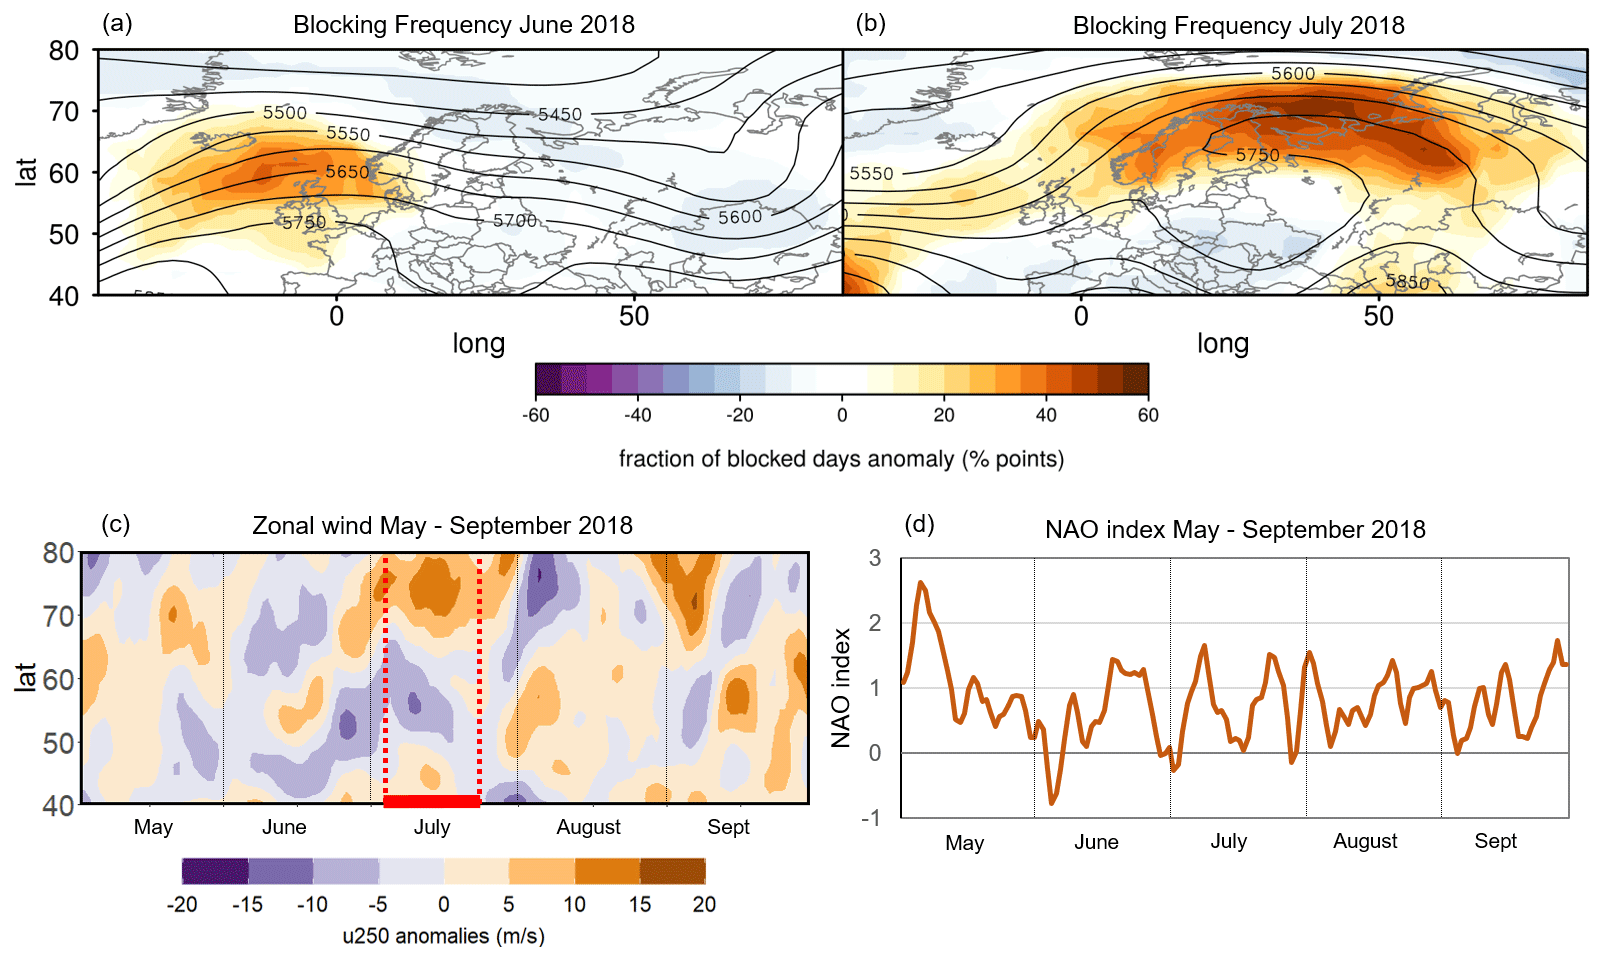
Figure 3Blocking frequency anomalies for (a) June and (b) July 2018 (shading; contour lines show mean geopotential height at 500 hPa plotted every 50 hPa). (c) Eurasian zonal mean zonal wind at 250 hPa for May–September 2018 (shading; 5 d running means centered on each day from 1 May–30 September 2018). The red lines mark the duration of the longest double jet event (4–25 July 2018). (d) NAO index for May–September 2018.
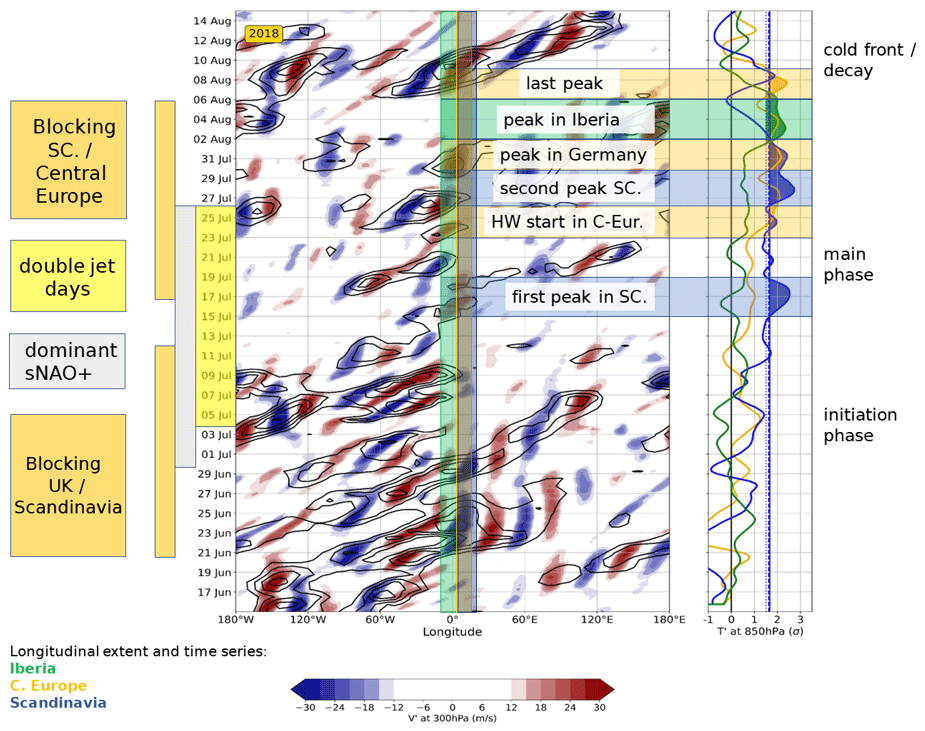
Figure 4Hovmöller diagram for the period of 15 June–15 August 2018. The longitudinal extent of three core heatwave regions (Iberia, central Europe, Scandinavia), as well as their temperature time series at the 850 hPa level as standardized anomalies (T′) on the right, are marked in green, orange, and blue, respectively. Periods when T′ was above the respective 95th percentiles are shaded. Both temperature (T′) and meridional wind at the 300 hPa level (v′) are anomalies with respect to their smoothed annual cycles. Rossby wave packet amplitude (E) is depicted in contours from 24 to 38 m s−1 in steps of 4 m s−1 and v′ as color shading from −30 to 30 m s−1. Both fields are weighted by the cosine of latitude and meridionally averaged over above-median grid points within the 40–80∘ N latitude band (self-adjusting, depending on the location of the largest amplitudes). Days with a dominant positive phase of the summer North Atlantic Oscillation (sNAO+) pattern, double jet days, and blocking days are marked on the left.
The establishment of a long-lived blocking anticyclone is consistent with the development of a double jet stream state over Eurasia, with two maxima of the zonal mean zonal wind at the 250 hPa level, which started as early as mid-May and persisted until the 25th of July, with only a few days in between not characterized by double jets (Fig. 3c). The period 4–25 July was characterized by a continuous persistent double-jet configuration, according to the SOM-based detection scheme of jet stream states. These 22 consecutive days of double jets make 2018 one of the longest such events in the study period (1979–2020), the longest being that of 2003 (Rousi et al., 2022; their Fig. 4). The initiation of the heatwave in Europe happened a few days after the initiation of this persistent double-jet event (see Fig. 4), highlighting the potential role of the double-jet structure in preconditioning the flow and favoring the onset of a heatwave in the region of weak winds between the two jets, where the blocking anticyclone lies (Rousi et al., 2022). This large-scale setup typically corresponds to the occurrence of the summer NAO+ (sNAO+) regime, as confirmed by the circulation regime approach applied on the 2018 summer. Indeed, most of July 2018 was dominated by a sNAO+ index (Fig. 3d) and a spatial pattern, typically characterized by a more northerly location and a smaller spatial scale than its winter counterpart (Folland et al., 2009). This is in agreement with previous studies (e.g., Drouard et al., 2019) showing a strong positive EOF-based NAO anomaly in this time period that is consistent with large parts of the seasonal anomalies observed during the summer of 2018.
The analysis of Rossby wave activity permits the evaluation of the development of the blocking, NAO+ phase, and the corresponding double-jet structure for the summer of 2018. Results show an eastward propagation of Rossby wave packets from the Pacific towards the Atlantic Ocean, the British Isles, and finally towards the European continent during the last 10 to 15 d of June and before the initiation of the heatwave over Scandinavia (Fig. 4). On the other hand, this was not the case for August, when the peak over Iberia occurred, which highlights the different mechanisms involved in this heatwave, rather than Rossby wave activity coming from the Pacific. Indeed, heatwaves and precipitation deficits in this location are primarily associated with amplified subtropical atmospheric ridges rather than midlatitude blocking situations (see Woollings et al., 2011; Sousa et al., 2017, 2018).

Figure 5The 10 d backward trajectories in 25 hPa steps between 1000 and 500 hPa for the three location coordinates. (a) Utsjoki, Finland, initialized on 18 July 2018. (b) Bernburg, Germany, initialized on 31 July 2018. (c) Alvega, Portugal, initialized on 4 August 2018. For every 100 hPa a different color is used for the trajectories. Each black dot is representative of a 24 h time step. (d) Geographical locations of the three points.
Further, a backward-trajectory analysis was conducted to determine the origins of the air masses that were present during the different heatwave phases and their evolution. Three grid points were chosen to represent the three affected areas and time segments of the heatwave: one over Scandinavia (Utsjoki, Finland) initialized on 18 July 2018, one over central Europe (Bernburg, Germany) on 31 July, and one over Iberia (Alvega, Portugal) on 4 August 2018 (Fig. 5). The backward trajectories showed the remote origin of the mid-troposphere air masses, especially in the case of Utsjoki (Fig. 5a), where it primarily originated over the central North Atlantic. This is also true for the mid-troposphere air masses in the case of Bernburg (Fig. 5b). However, in the last 48 h, descending air masses were observed, pointing to an adiabatic warming by compression. Trajectories starting in the lowest 200 hPa at Bernburg indicate that air masses stemmed from a region to the south and east close to the starting location, indicating relatively stagnant air masses as already discussed in Spensberger et al. (2020). In the case of Alvega (Fig. 5c), air masses starting between 700 and 1000 hPa experienced several rising and sinking motions on their way from the south and southeast (e.g., the Algerian desert, Atlas Mountains, Mediterranean Sea), towards the Iberian Plateau and coastal regions, thus documenting their local-to-regional origin, in contrast to the remote origin of the air masses seen in central and northern Europe, and largely stagnant conditions (in line with Santos et al., 2015; Sousa et al., 2019).
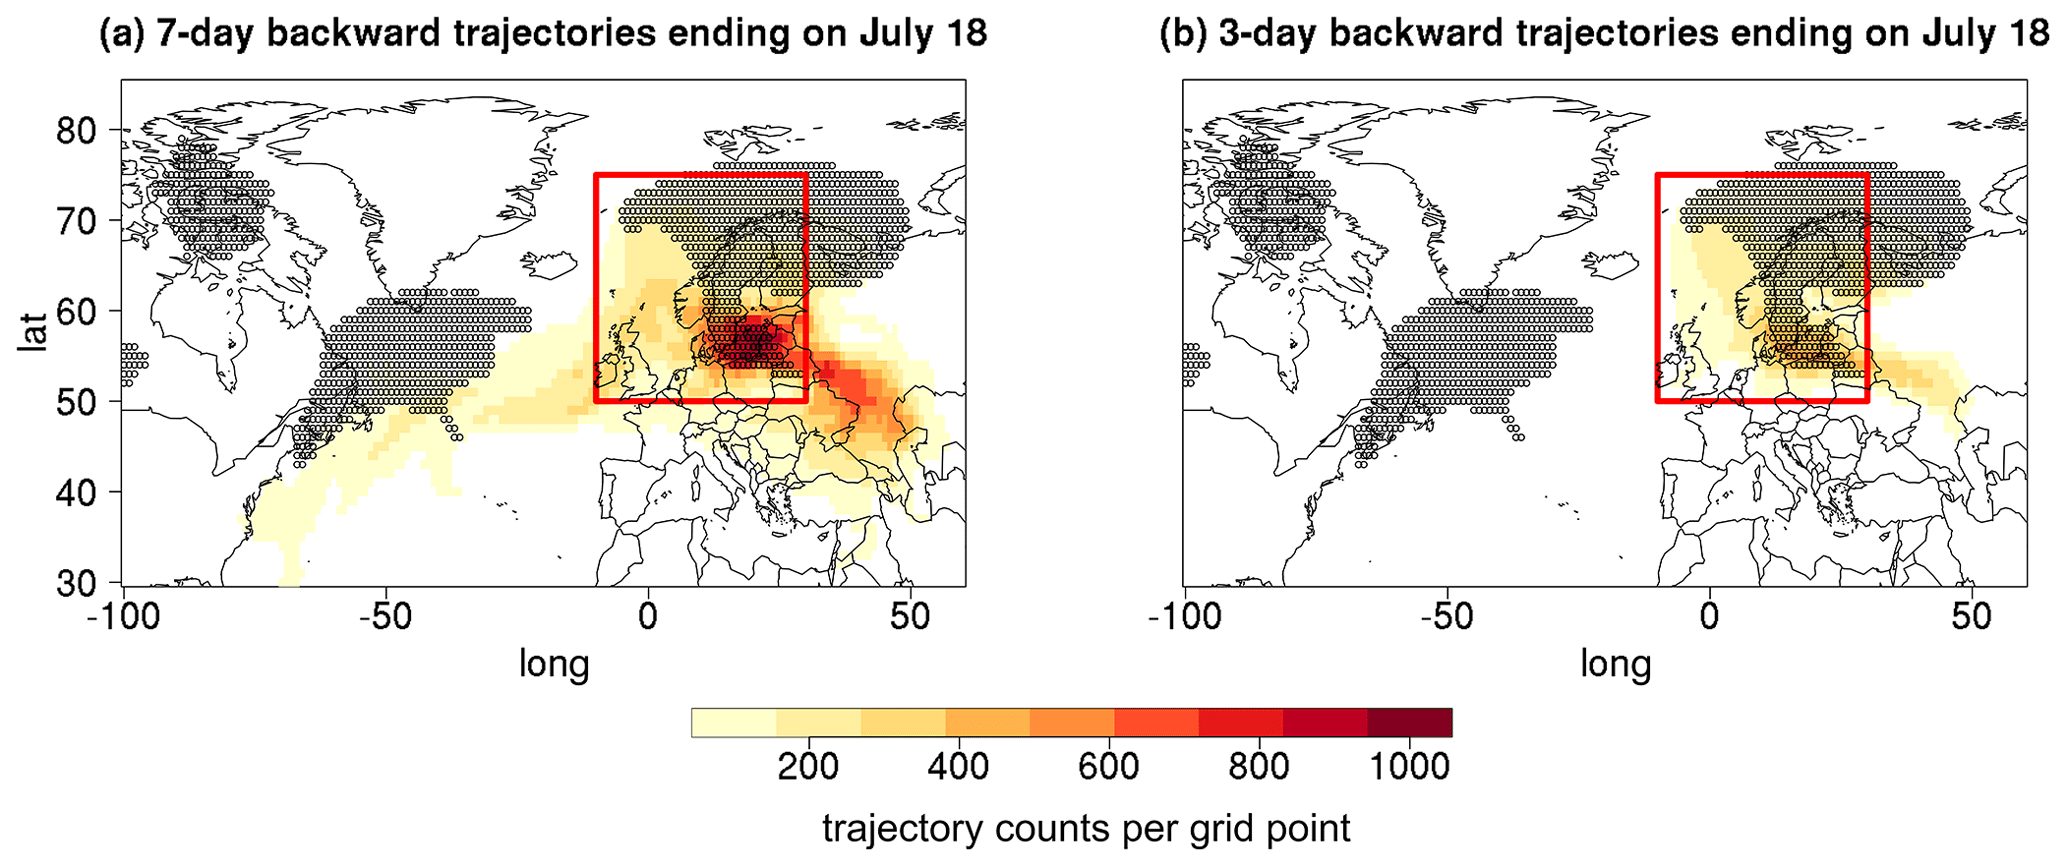
Figure 6Backward trajectories for 7 d (a) and 3 d (b). Backward-trajectory density maps ending on 18 July, initiated in 50 hPa steps between 150 and 500 hPa for grid points within the Scandinavian anticyclone (backward trajectories were initiated from the dotted points inside the red rectangle; the dotted points are those defined by vertically averaged PV anomaly based on monthly climatology < −0.7 PVU and PV < 1 PVU).
In order to infer causal hypotheses for the existence of the Scandinavian block, the trajectory approach was extended to obtain the origins of low potential vorticity (PV) air masses that formed the upper-tropospheric part of the Scandinavian anticyclone (see Sect. 2.2.3). For the sake of brevity, only maps of 7 and 3 d trajectory density on 18 July 2018, around the maximum heatwave day in Scandinavia, are shown in Fig. 6, but other days corroborate the inferences below (not shown). Figure 6a shows the density of 7 d backward trajectories, indicating that air masses were steered from the western North Atlantic over the British Isles to Scandinavia. This is in line with the propagation of the corresponding Rossby wave packet discussed above. Moreover, using the method described in Zschenderlein et al. (2020, their Fig. 4), the role of a remote warm conveyor belt is suggested by ascending, diabatically heated trajectories over the western Atlantic (not shown); PV is lowered in the warm conveyor belt and then transported in the upper troposphere into the Scandinavian anticyclone (termed “remote branch” by Zschenderlein et al., 2020). Interestingly, high trajectory densities over central to eastern Europe, which also strongly ascended and were diabatically heated (not shown), point towards an influence of moist convection observed under an upper-level trough in this area by feeding low-PV air towards the Scandinavian anticyclone. Such a “nearby branch” was also mentioned by Zschenderlein et al. (2020) to be important for anticyclone persistence over central Europe. However, in the 2018 case the nearby branch is located to the southeast, not to the southwest as for central Europe; 3 d before the peak of the heatwave, trajectories almost exclusively stem from this nearby branch, now located more to the south of the Scandinavian anticyclone (Fig. 6b). Clearly, determining causal pathways from this analysis is not possible, yet modeling studies with explicit convection could shed more light on the role of the remote branch (warm conveyor belt over the western Atlantic) versus the nearby branch over southeastern Europe for the establishment and maintenance of the Scandinavian anticyclone.
3.3 Low-frequency precursors
When addressing possible precursors for European heatwaves, SST anomalies over the North Atlantic (Dunstone et al., 2019; Ossó et al., 2020; Beobide-Arsuaga et al., 2023) and soil moisture anomalies over continental Europe (Quesada et al., 2012) are among the primary candidates, as outlined in the Introduction. A tripolar SST pattern with negative anomalies over the subpolar gyre (SPG) was evident in spring (MAM, northern box of Fig. 7a, b). At the same time, a pronounced precipitation deficit over Scandinavia in the spring of 2018 was present (Fig. 7c). The SST tripolar pattern persisted over time, with the cold SPG anomaly intensifying in summer (JJA, Fig. 7b), and the same is true for the precipitation deficit, which increased particularly in Germany and central Europe (Fig. 7d), as also discussed in Toreti et al. (2019). The soil moisture anomaly for the 2018 spring and summer (Fig. 7e, f) shows a pattern consistent with the precipitation anomaly.
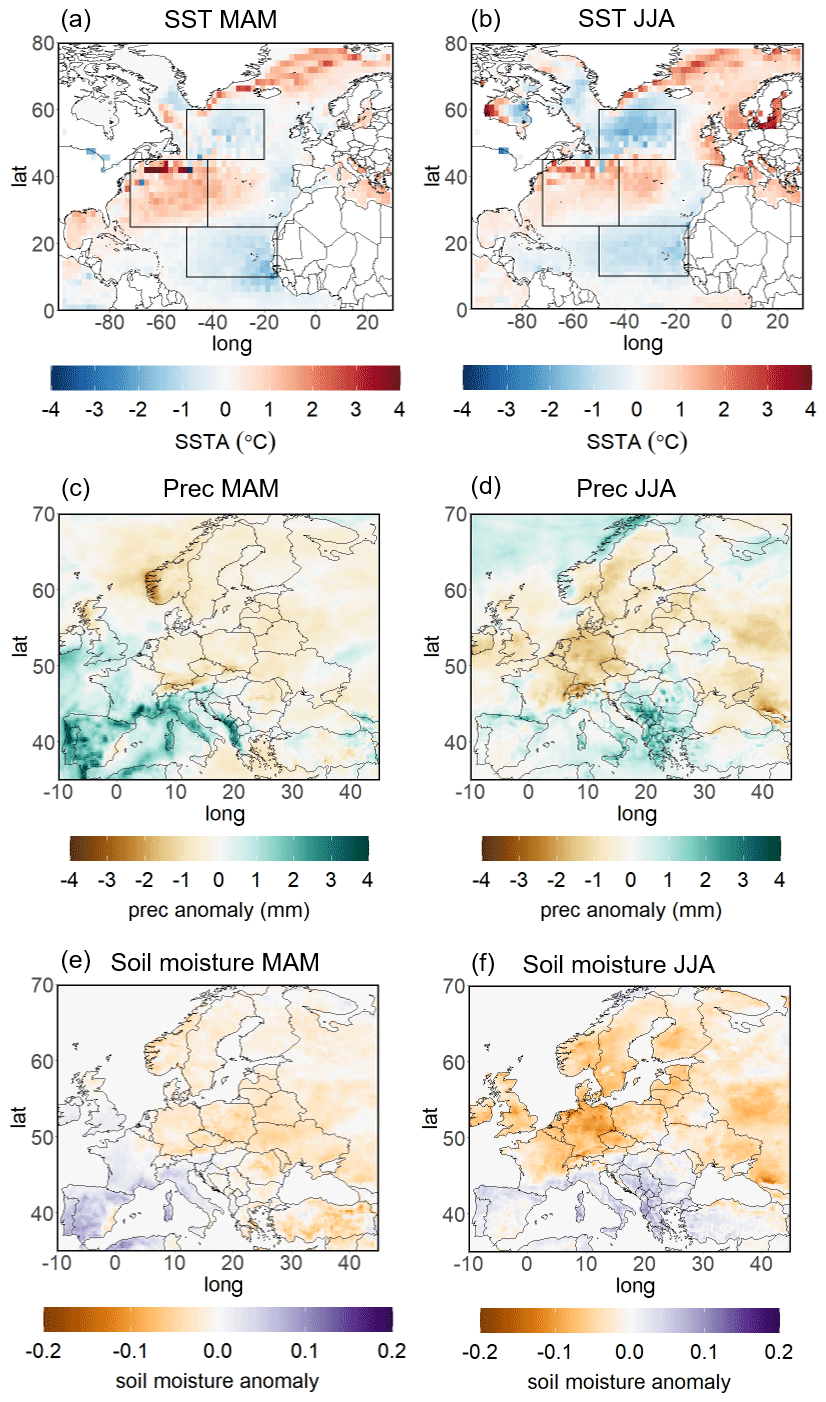
Figure 7Anomalies of sea surface temperature (SST; a, b), precipitation (c, d), and soil moisture (e, f) in the ERA5 reanalysis (compared to the reference period 1981–2010) for spring (March to May, MAM; a, c, e) and summer (June to August, JJA; b, d, f) months. Boxes in (a) and (b) indicate the regions for the tripolar SST pattern.

Figure 8(a) Time series of centered 92 d running mean soil moisture averaged over all land points of northern Germany (51–55∘ N and 4–16∘ E) for the period March–September of 1981–2020. The grey lines denote individual years, the black line denotes the average of 1981–2010, and the blue line denotes 2018. (b) The same as (a) but for southern Germany (48–51∘ N and 4–16∘ E). (c) Time series of soil-moisture-latent heat flux coefficients based on 92 d running periods for the growing period covering March to September for the years 1981–2020 for northern Germany. The grey lines denote individual years, the black line denotes the average of 1981–2010, and the red line denotes 2018. Energy limited is related to a correlation coefficient of −1, and moisture limited to a correlation coefficient of 1. (d) The same as (c) but for southern Germany.
Having established that the large-scale soil moisture anomaly is consistent with the SST and precipitation anomalies, we investigated the temporal development of the soil moisture pattern over Germany. Reduced soil moisture often facilitates the occurrence of summer drought and heatwaves (Teuling, 2018), as the soil moisture determinant for evapotranspiration (or lack thereof) directly links to the surface temperature and relative humidity at the land surface (Stéfanon et al., 2014; Miralles et al., 2018). Thus, soil moisture and latent heat flux were used to identify periods of moisture limitation (denoted by positive correlation coefficients between the two) and wet conditions (negative correlation coefficients), under which the latent heat flux is primarily controlled by the atmosphere. The derived time series for the soil-moisture-latent heat flux correlations are based on daily data centered on 92 d running periods for Germany (Fig. 8). Additionally, centered 92 d running mean soil moisture is shown. The time series were spatially averaged over all land points for northern (Fig. 8a, c) and southern Germany (Fig. 8b, d). Germany is usually not in the moisture-limited regime, but extraordinary hydrologic conditions can lead to a shift from an energy-limited evaporative regime to moisture-limited conditions (Lo et al., 2021), increasing the surface temperature and enhancing the sensible heat flux. The soil moisture anomaly in March 2018 was low all over Germany (Fig. 8a, b) and thus did not yet limit evapotranspiration and latent heat flux. Warm conditions in spring caused a high latent heat flux all over Germany, indicating a strong energy limitation (Fig. 8c, d). High latent heat fluxes, in turn, lead to a severe depletion of the soil moisture up to a depth of 1 m, starting at the end of March and continuing until July in northern Germany and mid-August in southern Germany. The precipitation deficit (Fig. 7c, d) further exacerbated the drying of the soils and shifted the evaporative regime from energy-limited to moisture-limited conditions. The latter prevailed between June and August 2018, indicating that the anomalously dry soils during the 2018 summer further augmented the hot surface temperatures (Dirmeyer et al., 2021; Orth, 2021).
In summary, the observed and modeled spring and early summer SST anomalies over the North Atlantic and European soil moisture anomaly patterns for 2018 are in line with those identified for other recent hot summers. Moreover, the dried-out soils and vegetation may have enhanced the maximum temperatures by leading to anomalous latent heat fluxes not only locally, but also downwind via advected sensible heat that can lead to abrupt increases in air temperatures, further enhancing local land–atmosphere feedbacks (Schumacher et al., 2022).
3.4 Attribution of the 2018 extreme heat
This section evaluates how anthropogenic climate change has affected the likelihood of similar heatwaves under present climate conditions and how it will affect their likelihood at global warming levels of +1.5 and +2 ∘C compared to pre-industrial times.
As defined by the cumulative heat metric, the 2018 summer was the second warmest summer over Europe following 2010, surpassed again in 2019 and 2021 (not shown), ranking it the fourth warmest by now. In the period of 1979–2021, ERA5 data exhibit a 7 % likelihood of 2018 cumulative heat levels (black PDF in Fig. 9). MPI-GE, which is shown to adequately represent the variability and forced anthropogenic changes in observed temperatures (Suarez-Gutierrez et al., 2018, 2021), is also able to capture cumulative heat well (gray PDF in Fig. 9), as compared to ERA5. Under recent climate (1979–2021) conditions, the 100 members of MPI-GE simulate a 9 % likelihood of exceeding 2018 levels, making this roughly a 1-in-10-year event. This is in line with an earlier attribution study by the World Weather Attribution (WWA) team who found return periods of about 1 in 10 years for Scandinavia and slightly less in the Netherlands (WWA, 2018). Vogel et al. (2019) also showed that events of this type, exhibiting concurrent hot temperature extremes over large parts of the Northern Hemisphere, were unprecedented before 2010, and it is virtually certain that the 2018 events would not have occurred without human-induced climate change. Under increased global warming, this likelihood reaches 69 % in a +1.5 ∘C world and 96 % in a +2 ∘C world (orange and red PDFs in Fig. 9). Thus, conditions as extreme as the summer of 2018 are projected to occur two out of every three summers in a 1.5 ∘C warmer world, while in a 2 ∘C warmer world they occur virtually every single summer. The extreme summer of 2018 represents a fairly average summer in a 1.5 ∘C warmer world. In a 2 ∘C warmer world, the cumulative heat during the average summer is twice as large as the 2018 levels, while the most extreme 2 ∘C warmer world summers could exhibit more than 4 times more excess heat compared to recent climate conditions.
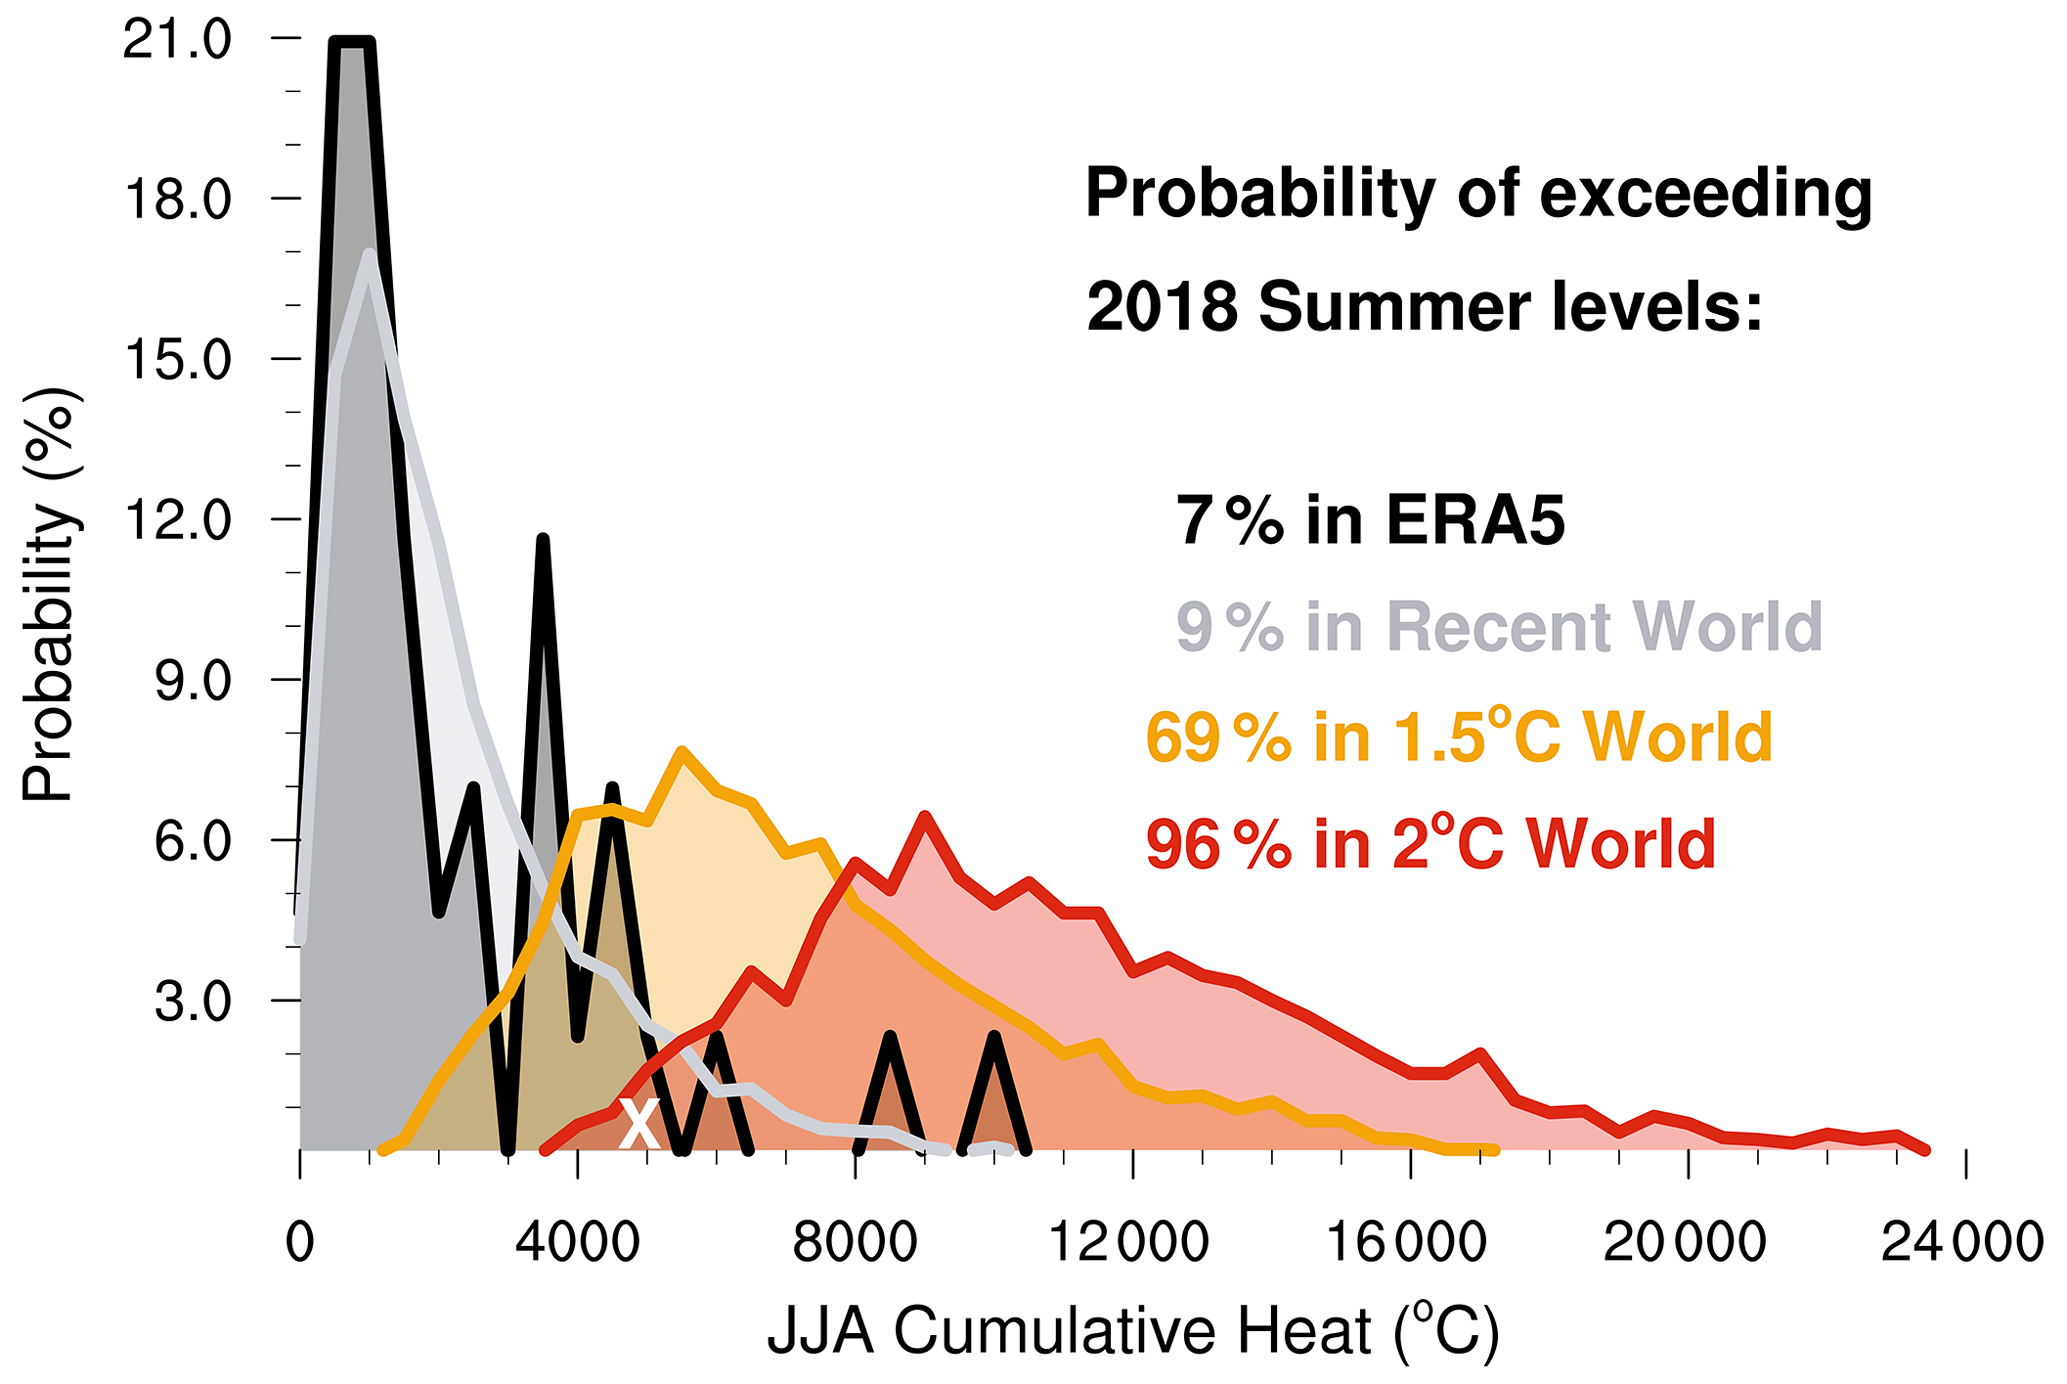
Figure 9European ERA5 (1979–2021; black) cumulative heat versus MPI-GE under recent (1979–2021; gray) climate and future +1.5 ∘C (2020–2049; orange) and +2 ∘C (2050–2079; red) warmer worlds compared to pre-industrial time warmer worlds. The 2018 summer from ERA5 data is marked with a white X. Daily maximum temperatures (Tmax) for summer months (June to August; JJA) over land grid points only. Anomalies with respect to 1981–2010. ERA5 data regridded to a coarser resolution of MPI-GE. Probabilities are normalized to percentages (divided by the total number of years in the period). Bin size is 500 ∘C.
To estimate how much more likely the heat event of 2018 has become in Germany in recent decades due to anthropogenic climate change, its probability ratio was calculated based on historical and hist-nat (pre-industrial-type) simulations from the CMIP6 archive. In the first step, we defined the extreme event for which the tailored attribution analysis for Germany was conducted. We analyzed the maximum daily temperature (Tmax) averaged for a box over Germany (47.5–55∘ N, 6–15∘ E), and to account for the prolonged heat of 2018, we used the Tmax as a spatial average over 17 d (Tmax17). This length was defined based on the longest period of consecutive days with Tmax above 30 ∘C in German weather stations on record. Using this length resulted in the longest return period. Thus, annual block maxima of this variable (Tmax17) were constructed within the GEV fit, and the return periods were calculated. The return period of the 2018 summer Tmax17 (approximately 31 ∘C in E-OBS) was estimated as 108 years, making it a heatwave that is expected less than once in a lifetime and which can therefore have considerable impacts. It should be acknowledged that such a return period estimate contains uncertainties, as the time series used to calculate it are shorter (about 70 years). Following the analysis of observation-based data, the following models were analyzed: CanESM5, CNRM-CM6-1, ACCESS-ESM1-5, IPSL-CM6A-LR, HadGEM3-GC31-LL, and MRI-ESM2-0 (see Table S1 for further details on the models used).
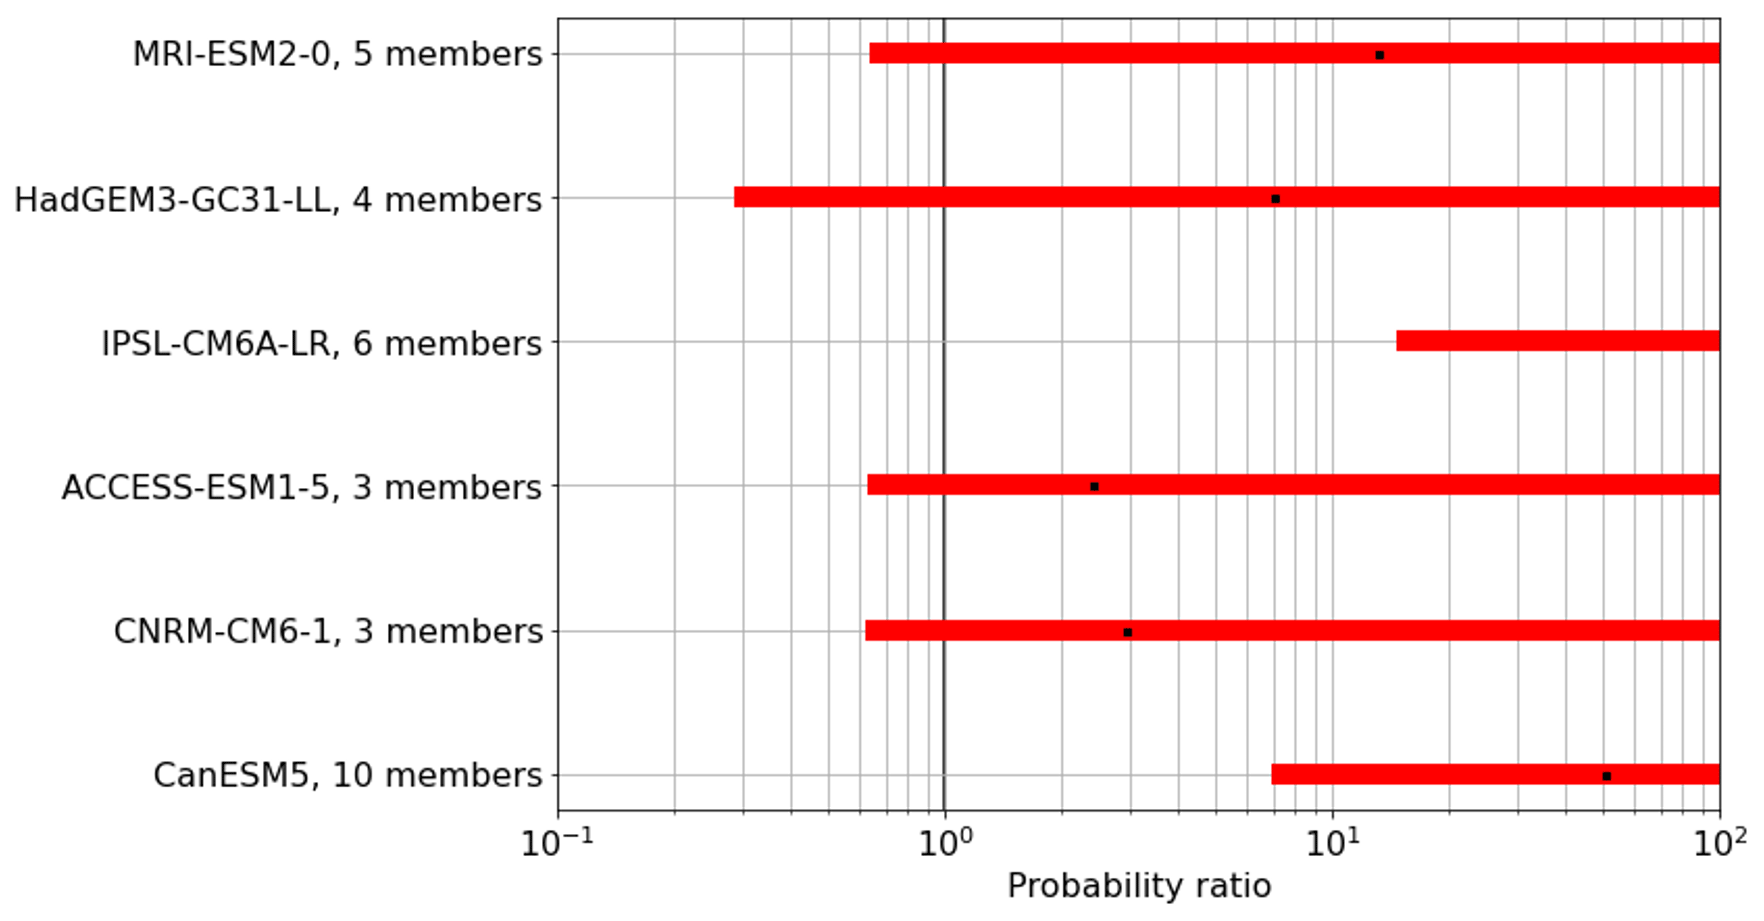
Figure 10Probability ratio (PR) of the 2018 summer heatwave occurrence in Germany in the analyzed CMIP6 models (see Table S1). The black squares show the PR estimated based on the original simulation time series, and the red bars show the 5th to 95th PR percentiles calculated from a 1000-member bootstrap. The number of available DAMIP ensemble members is given together with the model name and the originating institution on the y axis. The vertical thick black line indicates a PR = 1, above which the likelihood of such an event has increased compared to pre-industrial times.
The probability ratio of the 2018 summer heatwave occurrence in Germany is shown for all analyzed models in Fig. 10. For all models the probability ratio estimated on the original simulation data is larger than 1, meaning that the probability of such a heatwave has increased due to anthropogenic climate change. The red bars provide uncertainty ranges bases on the 1000 bootstraps. The best estimate in all analyzed CMIP6 models (black squares) is > 2, again in line with the WWA findings despite a rather different event definition (WWA, 2018). For readability of the results, the x axis in Fig. 10 is only extended to a value of 100, with larger values omitted due to the large uncertainties. In fact, the upper range of the probability ratios for some models is invalid, as the event had a zero probability of occurrence in the hist-nat scenario, indicating that such an extended heatwave would have been very improbable under pre-industrial conditions.
In summary, the analysis of the impact of anthropogenic climate change on the heatwave in the summer of 2018 shows that such heat events have already become more frequent, i.e., their probability has increased compared to pre-industrial conditions. Furthermore, it is expected that such heat events will become even more likely in a warmer world.
Drought attribution is notoriously difficult due to the fact that global models only crudely reproduce convective precipitation, which is the main mode of rainfall in summer. While evapotranspiration is increasing with warming, the question of whether or not this can be compensated by stronger downpours to avoid hydrological (or agricultural) drought cannot be answered with any degree of certainty at the moment. Drought episodes are expected to increase (IPCC, 2021) across the world, but the frequency of occurrence and the actual change in risk cannot be quantified yet. Nevertheless, it is likely that the prolonged 2018 drought, followed by two more below-average rainfall years in 2019 and 2020 in Germany, is partially attributable to human-induced climate change. Given that attributable global warming is approximately 1.1 ∘C (2011–2020), corresponding to 100 % of the observed warming, and warming over land is much more rapid, Europe has already warmed disproportionately by ∼ 2 ∘C compared to pre-industrial times, with summer warming being particularly amplified due to soil moisture feedbacks under increased sensible heat fluxes. Together with the potential dynamic feedback discussed above, the average summer Tmax in Europe may well exceed 3 ∘C above pre-industrial conditions already. This is corroborated by a recent WWA study, which analyzed the UK heat record during the exceptional 2022 heatwave (18–19 July 2022) and found that climate change added 4 ∘C to the observed record Tmax. What used to be a 36 ∘C day is now a 40 ∘C day (WWA, 2022).
The extreme heat and drought of the summer of 2018 have been studied from a multi-faceted weather and climate perspective. We looked at hot and dry summers over Europe using different analysis approaches to study the extremeness of and attribution to anthropogenic climate change (climate perspective), as well as synoptic dynamics in concert with slowly varying boundary conditions at the ocean and continental surfaces (seasonal and weather perspective). The 2018 summer is found to be a unique historical example of persistent heatwave and drought conditions in large parts of Europe. This is particularly true for northern and central Europe, regions which – unlike the seasonal drought in the Mediterranean – are historically not so accustomed to this kind of concurrent hot and dry summer extremes. The 2018 summer is one more case in a cluster of intense heatwaves facing Europe over the last few decades (Russo et al., 2015; Becker et al., 2022). The 2018 drought was an intense, large-scale event, promoting strong land–atmosphere coupling that exacerbated the heatwave (Dirmeyer et al., 2021).
Regarding the large-scale atmospheric conditions conducive of the summer of 2018 extremes, we provided detailed evidence on the blocking anticyclones, persistent double jet stream configurations, sNAO+ phase, Rossby wave activity, and different air mass origins. For example, the persistent double jet stream event, combined with record high positive sNAO (Drouard et al., 2019), seems to have played a role in the long duration of the 2018 heatwave. Additionally, according to Li et al. (2020), the collaborative (not mutually exclusive) roles of sNAO+ and European blocking could favor the frequency, persistence, and magnitude of heatwaves over Europe, as the positive sNAO-related blocking events are quasi-stationary and more persistent compared to the non-NAO+ related ones. New evidence is provided regarding the origin of the low-PV air masses in the upper-tropospheric blocking anticyclone over Scandinavia; while in its initiation phase, backward-trajectory analyses point to the role of a western North Atlantic warm conveyor belt, and we provide hints that its maintenance could be supported by low-PV air stemming from moist convection in the trough flanking the block to its southeast, i.e., over eastern Europe. However, further analysis is needed to address the direction of causality behind this link. On the other hand, our analysis suggests that the later heatwave phase over Iberia has different drivers, as the air masses originated locally or were advected from nearby areas (e.g., north Africa) and are not necessarily directly associated with the propagation and breaking of large-scale Rossby waves as over Scandinavia (Santos et al., 2015; Sousa et al., 2019).
The dominant oceanic and large-scale conditions of the North Atlantic might have supported the development of the 2018 heatwave (Dunstone et al., 2019). The physical reasoning in the relationship between the North Atlantic SST tripole and exceptionally cold North Atlantic ocean, the jet stream setup, and the occurrence of the heatwave was proposed by Duchez et al. (2016) based on the summer 2015 event. Here, we documented that similar anomalies were also observed during the spring of 2018. While the atmospheric forcing is associated with the anomalous jet stream positions and blocking, they in turn influence the precipitation patterns over Europe, leading to changes in the soil moisture content. Although such a process enhances the potential for a heat extreme, the meteorological factors are the ones that determine the timing and duration of the heatwave. Dedicated modeling experiments and causal inference algorithms will be key to test the hypothesis of a causal link between spring North Atlantic SSTs and subsequent summer extremes in Europe. Moreover, the patterns of North Atlantic SSTs are acting on top of the warming background climate, which may further modify the type or the magnitude of those relationships (McCarthy et al., 2019).
The severe soil moisture depletion in Germany between April and July of 2018 reflected the persistently warm and dry conditions and led to anomalously dry soils in summer. The drought conditions in the soil pushed its state into the transition zone conditions, in which soil wetness plays a direct role in influencing the climate by reducing the evaporative cooling effect at the land surface and thus enhancing hot and dry conditions. The moisture-limited conditions that prevailed between June and August 2018 indicated that the hot surface temperatures are directly linked to anomalously dry soils during the 2018 summer period (Dirmeyer et al., 2021; Orth, 2021).
We also showed that the summer of 2018 was extreme in the observational record for Europe and that heat anomalies of this magnitude are expected to occur much more often in a warmer world, being reached up to almost every year with global warming of +2 ∘C. Wehrli et al. (2020) provided evidence that the anthropogenic background warming was a strong contributor to the 2018 summer heatwave in the Northern Hemisphere, highlighting that future extremes under similar atmospheric circulation conditions at higher levels of global warming would reach dangerous levels. Our tailored attribution study, which analyzed how the maximum temperature, averaged over 17 d over Germany, has been impacted by anthropogenic climate change, showed that the probability of such a prolonged heat event has increased in all CMIP6 models analyzed here. This adds to previous attribution studies that analyzed the summer 2018 heatwave in other areas of Europe and also found an increase in its likelihood under anthropogenic climate change (McCarthy et al., 2019; Vogel et al., 2019; Leach et al., 2020).
Here, we presented a comprehensive study of the extreme hot and dry 2018 summer in Europe, investigating its emergence and evolution with a combination of conventional and more sophisticated metrics and methods, with an emphasis on their synoptic-scale atmospheric drivers and a reference to their potential precursors in spring. Moreover, by assessing the event from a climate perspective, we provided evidence that anomalous summers of such extremity have already, and will further, become much more frequent in a warming world. Overall, this study highlights the added value of multi-faceted approaches for the analysis of such extreme events and that collaboration among different fields is crucial both for the understanding of the process and for the subsequent quantification of impacts. The summer of 2022 was yet another very extreme hot and dry summer that affected Europe, corroborating the approach of this work and emphasizing the need to carry out multi-disciplinary impact studies.
Code is available from the authors upon request.
The ERA5 (https://doi.org/10.1002/qj.3803, Hersbach et al., 2020) and ERA5-HEAT (https://doi.org/10.1002/gdj3.102, Di Napoli et al., 2021) reanalysis data are publicly available via the Copernicus Climate Change Service (https://doi.org/10.24381/cds.adbb2d47, Hersbach et al., 2023). The gridded observational datasets E-OBS (https://doi.org/10.1029/2008JD010201, Haylock et al., 2008; and https://doi.org/10.1029/2017JD028200, Cornes et al., 2018) are publicly available on the European Climate Assessment & Dataset website (https://www.ecad.eu/download/ensembles/download.php, ECA&D, 2023). The observational datasets from the German Weather Service (DWD; https://doi.org/10.5194/asr-10-99-2013, Kaspar et al., 2013) are publicly available on the DWD website under their Open Data Portal (https://opendata.dwd.de/, DWD, 2023). The CMIP6 (https://doi.org/10.5194/gmd-9-1937-2016, Eyring et al., 2016; please refer to Table S1 and the reference list in the Supplement for all data citations of each CMIP6 model and run used in this study) and the Max Planck Institute Grand Ensemble (MPI-GE; Maher et al., 2019, https://doi.org/10.1029/2019MS001639) climate model data are publicly available via the Earth System Grid Federation portal (https://esgf-data.dkrz.de/projects/cmip6-dkrz/, DKRZ, 2022b; and https://esgf-data.dkrz.de/projects/mpi-ge/, DKRZ, 2022a). The North Atlantic Oscillation (NAO) index time series is publicly available on the National Weather Service Climate Prediction Center website (https://ftp.cpc.ncep.noaa.gov/cwlinks/norm.daily.nao.index.b500101.current.ascii, CPC, 2023).
The supplement related to this article is available online at: https://doi.org/10.5194/nhess-23-1699-2023-supplement.
ER and AHF coordinated the inter-disciplinary task force on heat and drought within ClimXtreme and this collaborative paper. ER did the jet stream analysis; prepared Figs. 1, 3c–d, 5d, and 7; curated most of the final figures with contributions from different co-authors (see below); and wrote the first draft of the manuscript with contributions from different co-authors. FNB calculated the UTCI; did the Rossby wave packet and the trajectory analysis; and prepared Figs. 4, 5a–c, and 6. GBA calculated the cumulative heat metric in ERA5 and the SST anomalies; DP calculated SPEI; DN and StS prepared Figs. 2 and S1; AR did the blocking analysis and prepared Figs. 3a, b, S2, and S3; JR did the weather regime analysis; LJ calculated precipitation and soil moisture anomalies in ERA5 and prepared Fig. 8; LSG did the MPI-GE attribution study and prepared Fig. 9; JST did the CMIP6 attribution study and prepared Fig. 10 and Table S1; and GC contributed to the CMIP6 attribution study. All authors followed the analysis from the beginning, contributed text, and edited/commented on the final version of the paper.
At least one of the (co-)authors is a member of the editorial board of Natural Hazards and Earth System Sciences. The peer-review process was guided by an independent editor, and the authors also have no other competing interests to declare.
Publisher’s note: Copernicus Publications remains neutral with regard to jurisdictional claims in published maps and institutional affiliations.
This article is part of the special issue “Past and future European atmospheric extreme events under climate change”. It is not associated with a conference.
This paper is a collaborative effort within the BMBF ClimXtreme project, for which the authors acknowledge funding (grant nos. 01LP1901A, 01LP1901C, 01LP191D, 01LP1901E, 01LP1901F, 01LP1902F, 01LP1903J, 01LP1902D, 01LP1902N, 01LP1903C, 01LP1902B, 01LP1904A). Laura Suarez-Gutierrez also received funding from the European Union’s Horizon Europe Framework Programme under the Marie Skłodowska-Curie Actions (grant agreement no. 101064940). André Düsterhus is supported by A4, funded by the Marine Institute (grant no. PBA/CC/18/01). Elena Xoplaki acknowledges support by the H2020 Project CLINT, the Academy of Athens, and the Greek National Network on Climate Change and its Impact (200/937). Georgios Fragkoulidis acknowledges the support of the German Research Foundation (DFG; project no. 445572993). Joaquim G. Pinto thanks the AXA Research Fund for support. We acknowledge the World Climate Research Programme, which, through its Working Group on Coupled Modelling, coordinated and promoted CMIP6. We thank the climate modeling groups for producing and making their model output available, the Earth System Grid Federation (ESGF) for archiving the data and providing access, and the multiple funding agencies who support CMIP6 and ESGF. We acknowledge the E-OBS dataset from the EU-FP6 project UERRA (http://www.uerra.eu, last access: 19 August 2022) and the Copernicus Climate Change Service, as well as the data providers in the ECA&D project (https://www.ecad.eu, last access: 19 August 2022). This work used resources of the Deutsches Klimarechenzentrum (DKRZ) granted by its Scientific Steering Committee (WLA) under project bb1152. Parts of the data were accessed through the XCES community evaluation system based on Freva technology (Kadow et al., 2021). We thank the two anonymous reviewers for their constructive feedback that substantially improved the manuscript.
This research has been supported by the Bundesministerium für Bildung und Forschung (grant nos. 01LP1901A, 01LP1901C, 01LP191D, 01LP1901E, 01LP1901F, 01LP1902F, 01LP1903J, 01LP1902D, 01LP1902N, 01LP1903C, 01LP1902B, and 01LP1904A), the Marine Institute (grant no. PBA/CC/18/01), the Deutsche Forschungsgemeinschaft (grant no. 445572993), the European Union’s Horizon Europe Framework Programme under the Marie
Skłodowska-Curie Actions (grant no. 101064940), the H2020 project CLINT, the Academy of Athens, the Greek National Network on Climate Change and its Impact (grant no. 200/937), and the AXA Research Fund (https://axa-research.org/en/project/joaquim-pinto, last access: 29 April 2023).
The article processing charges for this open-access publication were covered by the Potsdam Institute for Climate Impact Research (PIK).
This paper was edited by Ricardo Trigo and reviewed by two anonymous referees.
Allen, R. G., Pruitt, W. O., Wright, J. L., Howell, T. A., Ventura, F., Snyder, R., Itenfisu, D., Steduto, P., Berengena, J., Yrisarry, J. B., Smith, M., Pereira, L. S., Raes, D., Perrier, A., Alves, I., Walter, I., and Elliott, R.: A recommendation on standardized surface resistance for hourly calculation of reference ETo by the FAO56 Penman-Monteith method, Agr. Water Manage., 81, 1–22, https://doi.org/10.1016/J.AGWAT.2005.03.007, 2006.
Bakke, S. J., Ionita, M., and Tallaksen, L. M.: The 2018 northern European hydrological drought and its drivers in a historical perspective, Hydrol. Earth Syst. Sci., 24, 5621–5653, https://doi.org/10.5194/hess-24-5621-2020, 2020.
Barriopedro, D., Fischer, E. M., Luterbacher, J., Trigo, R. M., and García-Herrera, R.: The hot summer of 2010: Redrawing the temperature record map of Europe, Science, 332, 220–224, https://doi.org/10.1126/SCIENCE.1201224, 2011.
Barriopedro, D., Sousa, P. M., Trigo, R. M., García-Herrera, R., and Ramos, A. M.: The exceptional Iberian heatwave of summer 2018, B. Am. Meteorol. Soc., 101, S29–S34, https://doi.org/10.1175/BAMS-D-19-0159.1, 2020.
Bastos, A., Ciais, P., Friedlingstein, P., Sitch, S., Pongratz, J., Fan, L., Wigneron, J. P., Weber, U., Reichstein, M., Fu, Z., Anthoni, P., Arneth, A., Haverd, V., Jain, A. K., Joetzjer, E., Knauer, J., Lienert, S., Loughran, T., McGuire, P. C., Tian, H., Viovy, N., and Zaehle, S.: Direct and seasonal legacy effects of the 2018 heat wave and drought on European ecosystem productivity, Sci. Adv., 6, 24, https://doi.org/10.1126/sciadv.aba2724, 2020.
Bastos, A., Orth, R., Reichstein, M., Ciais, P., Viovy, N., Zaehle, S., Anthoni, P., Arneth, A., Gentine, P., Joetzjer, E., Lienert, S., Loughran, T., McGuire, P. C., O, S., Pongratz, J., and Sitch, S.: Vulnerability of European ecosystems to two compound dry and hot summers in 2018 and 2019, Earth Syst. Dynam., 12, 1015–1035, https://doi.org/10.5194/esd-12-1015-2021, 2021.
Becker, F. N., Fink, A. H., Bissolli, P., and Pinto, J. G.: Towards a more comprehensive assessment of the intensity of historical European heat waves (1979–2019), Atmos. Sci. Lett., 23, e1120, https://doi.org/10.1002/ASL.1120, 2022.
Beguería, S. and Vicente-Serrano, S. M.: SPEI: Calculation of Standardized Precipitation-Evapotranspiration Index, R package version 1.6, https://www.rdocumentation.org/packages/SPEI/versions/1.6/topics/SPEI-package (last access: 19 August 2022), 2013.
Beillouin, D., Schauberger, B., Bastos, A., Ciais, P., and Makowski, D.: Impact of extreme weather conditions on European crop production in 2018, Philos. Trans. R. Soc. B, 375, 20190510, https://doi.org/10.1098/RSTB.2019.0510, 2020.
Beobide-Arsuaga, G., Düsterhus, A., Müller, W. A., Barnes, E. A., and Baehr, J.: Spring Regional Sea Surface Temperatures as a Precursor of European Summer Heatwaves, Geophys. Res. Lett., 50, e2022GL100727, https://doi.org/10.1029/2022gl100727, 2023.
Błazejczyk, K., Jendritzky, G., Bröde, P., Fiala, D., Havenith, G., Epstein, Y., Psikuta, A., and Kampmann, B.: An introduction to the Universal thermal climate index (UTCI), Geogr. Pol., 86, 5–10, https://doi.org/10.7163/GPol.2013.1, 2013.
Chen, S., Wu, R., and Liu, Y.: Dominant Modes of Interannual Variability in Eurasian Surface Air Temperature during Boreal Spring, J. Climate, 29, 1109–1125, https://doi.org/10.1175/JCLI-D-15-0524.1, 2016.
Climate Change Service: Dry and warm spring and summer, https://climate.copernicus.eu/dry-and-warm-spring-and-summer (last access: 19 August 2022), 2018.
Climate Change Service: Warmest summer for Europe by small margin; August globally joint third warmest on record, https://climate.copernicus.eu/copernicus-warmest-summer-europe-small-margin-august-globally-joint-third-warmest-record (last access: 19 August 2022), 2021.
Cornes, R. C., van der Schrier, G., van den Besselaar, E. J. M., and Jones, P. D.: An Ensemble Version of the E-OBS Temperature and Precipitation Data Sets, J. Geophys. Res.-Atmos., 123, 9391–9409, https://doi.org/10.1029/2017JD028200, 2018.
CPC: National Weather Service Climate Prediction Center, Daily NAO index since January 1950, NOAA Center for Weather and Climate Prediction [data set], https://ftp.cpc.ncep.noaa.gov/cwlinks/norm.daily.nao.index.b500101.current.ascii, last access: 14 February 2023.
Crasemann, B., Handorf, D., Jaiser, R., Dethloff, K., Nakamura, T., Ukita, J., and Yamazaki, K.: Can preferred atmospheric circulation patterns over the North-Atlantic-Eurasian region be associated with arctic sea ice loss?, Polar Sci., 14, 9–20, https://doi.org/10.1016/J.POLAR.2017.09.002, 2017.
Di Capua, G., Sparrow, S., Kornhuber, K., Rousi, E., Osprey, S., Wallom, D., van den Hurk, B., and Coumou, D.: Drivers behind the summer 2010 wave train leading to Russian heatwave and Pakistan flooding, npj Clim. Atmos. Sci., 4, 55, https://doi.org/10.1038/s41612-021-00211-9, 2021.
Di Napoli, C., Barnard, C., Prudhomme, C., Cloke, H. L., and Pappenberger, F.: ERA5-HEAT: A global gridded historical dataset of human thermal comfort indices from climate reanalysis, Geosci. Data J., 8, 2–10, https://doi.org/10.1002/gdj3.102, 2021.
Dirmeyer, P. A., Balsamo, G., Blyth, E. M., Morrison, R., and Cooper, H. M.: Land-Atmosphere Interactions Exacerbated the Drought and Heatwave Over Northern Europe During Summer 2018, AGU Adv., 2, e2020AV000283, https://doi.org/10.1029/2020AV000283, 2021.
DKRZ: MPI Grand Ensemble datasets, MPI-M MPI-GE [data set], https://esgf-data.dkrz.de/projects/mpi-ge/, last access: 19 August 2022a.
DKRZ: WCRP Coupled Model Intercomparison Project (Phase 6) datasets, ESGF [data set], https://esgf-data.dkrz.de/projects/cmip6-dkrz/, last access: 19 August 2022b.
Droogers, P. and Allen, R. G.: Estimating Reference Evapotranspiration Under Inaccurate Data Conditions, Irrig. Drain. Syst., 16, 33–45, https://doi.org/10.1023/A:1015508322413, 2002.
Drouard, M., Kornhuber, K., and Woollings, T.: Disentangling Dynamic Contributions to Summer 2018 Anomalous Weather Over Europe, Geophys. Res. Lett., 46, 12537–12546, https://doi.org/10.1029/2019GL084601, 2019.
Duan, S. Q., Findell, K. L., and Wright, J. S.: Three Regimes of Temperature Distribution Change Over Dry Land, Moist Land, and Oceanic Surfaces, Geophys. Res. Lett., 47, e2020GL090997, https://doi.org/10.1029/2020GL090997, 2020.
Duchez, A., Frajka-Williams, E., Josey, S. A., Evans, D. G., Grist, J. P., Marsh, R., McCarthy, G. D., Sinha, B., Berry, D. I., and Hirschi, J. J. M.: Drivers of exceptionally cold North Atlantic Ocean temperatures and their link to the 2015 European heat wave, Environ. Res. Lett., 11, 1–9, https://doi.org/10.1088/1748-9326/11/7/074004, 2016.
Dunstone, N., Smith, D., Hardiman, S., Eade, R., Gordon, M., Hermanson, L., Kay, G., and Scaife, A.: Skilful Real-Time Seasonal Forecasts of the Dry Northern European Summer 2018, Geophys. Res. Lett., 46, 12368–12376, https://doi.org/10.1029/2019GL084659, 2019.
DWD: Open Data Portal, Deutscher Wetterdienst, Offenbach, Germany, https://opendata.dwd.de, last access: 26 April 2023.
ECA&D: E-OBS gridded dataset, ECA&D [data set], https://www.ecad.eu/download/ensembles/download.php, last access: 26 April 2023.
Eyring, V., Bony, S., Meehl, G. A., Senior, C. A., Stevens, B., Stouffer, R. J., and Taylor, K. E.: Overview of the Coupled Model Intercomparison Project Phase 6 (CMIP6) experimental design and organization, Geosci. Model Dev., 9, 1937–1958, https://doi.org/10.5194/gmd-9-1937-2016, 2016.
Fink, A. H., Brücher, T., Krüger, A., Leckebusch, G. C., Pinto, J. G., and Ulbrich, U.: The 2003 European summer heatwaves and drought – synoptic diagnosis and impacts, Weather, 59, 209–216, https://doi.org/10.1256/wea.73.04, 2004.
Fischer, E. M. and Schär, C.: Consistent geographical patterns of changes in high-impact European heatwaves, Nat. Geosci., 3, 398–403, https://doi.org/10.1038/ngeo866, 2010.
Folland, C. K., Knight, J., Linderholm, H. W., Fereday, D., Ineson, S., and Hurrel, J. W.: The summer North Atlantic oscillation: Past, present, and future, J. Climate, 22, 1082–1103, https://doi.org/10.1175/2008JCLI2459.1, 2009.
Fragkoulidis, G. and Wirth, V.: Local rossby wave packet amplitude, phase speed, and group velocity: Seasonal variability and their role in temperature extremes, J. Climate, 33, 8767–8787, https://doi.org/10.1175/JCLI-D-19-0377.1, 2020.
Friedrich, K. and Kaspar, F.: Rückblick auf das Jahr 2018 – das bisher wärmste Jahr in Deutschland, Deutscher Wetterdienst, https://www.dwd.de/DE/leistungen/besondereereignisse/temperatur/20190102_waermstes_jahr_in_deutschland_2018.pdf?__blob=publicationFile&v=2am:10.12.2021 (last access: 4 April 2022), 2019.
Gastineau, G. and Frankignoul, C.: Influence of the North Atlantic SST variability on the atmospheric circulation during the twentieth century, J. Climate, 28, 1396–1416, https://doi.org/10.1175/JCLI-D-14-00424.1, 2015.
Gillett, N. P., Shiogama, H., Funke, B., Hegerl, G., Knutti, R., Matthes, K., Santer, B. D., Stone, D., and Tebaldi, C.: The Detection and Attribution Model Intercomparison Project (DAMIP v1.0) contribution to CMIP6, Geosci. Model Dev., 9, 3685–3697, https://doi.org/10.5194/gmd-9-3685-2016, 2016.
Haylock, M. R., Hofstra, N., Klein Tank, A. M. G., Klok, E. J., Jones, P. D., and New, M.: A European daily high-resolution gridded data set of surface temperature and precipitation for 1950–2006, J. Geophys. Res.-Atmos., 113, 20119, https://doi.org/10.1029/2008JD010201, 2008.
Heim, R. R.: A Review of Twentieth-Century Drought Indices Used in the United States, B. Am. Meteorol. Soc., 83, 1149–1166, https://doi.org/10.1175/1520-0477-83.8.1149, 2002.
Herceg-Bulić, I. and Kucharski, F.: North Atlantic SSTs as a Link between the Wintertime NAO and the Following Spring Climate, J. Climate, 27, 186–201, https://doi.org/10.1175/JCLI-D-12-00273.1, 2014.
Hersbach, H., Bell, B., Berrisford, P., Hirahara, S., Horányi, A., Muñoz-Sabater, J., Nicolas, J., Peubey, C., Radu, R., Schepers, D., Simmons, A., Soci, C., Abdalla, S., Abellan, X., Balsamo, G., Bechtold, P., Biavati, G., Bidlot, J., Bonavita, M., De Chiara, G., Dahlgren, P., Dee, D., Diamantakis, M., Dragani, R., Flemming, J., Forbes, R., Fuentes, M., Geer, A., Haimberger, L., Healy, S., Hogan, R. J., Hólm, E., Janisková, M., Keeley, S., Laloyaux, P., Lopez, P., Lupu, C., Radnoti, G., de Rosnay, P., Rozum, I., Vamborg, F., Villaume, S., and Thépaut, J.-N.: The ERA5 global reanalysis, Q. J. Roy. Meteor. Soc., 146, 1999–2049, https://doi.org/10.1002/qj.3803, 2020.
Hersbach, H., Bell, B., Berrisford, P., Biavati, G., Horányi, A., Muñoz Sabater, J., Nicolas, J., Peubey, C., Radu, R., Rozum, I., Schepers, D., Simmons, A., Soci, C., Dee, D., and Thépaut, J.-N.: ERA5 hourly data on single levels from 1940 to present, Copernicus Climate Change Service (C3S) Climate Data Store (CDS) [data set], https://doi.org/10.24381/cds.adbb2d47, 2023.
Ionita, M., Caldarescu, D. E., and Nagavciuc, V.: Compound Hot and Dry Events in Europe: Variability and Large-Scale Drivers, Front. Clim., 3, 58, https://doi.org/10.3389/fclim.2021.688991, 2021.
IPCC: Climate Change 2021: The Physical Science Basis. Contribution of Working Group I to the Sixth Assessment Report of the Intergovernmental Panel on Climate Change, edited by: Masson-Delmotte, V., Zhai, P., Pirani, A., Connors, S. L., Péan, C., Berger, S., Caud, N., Chen, Y., Goldfarb, L., Gomis, M. I., Huang, M., Leitzell, K., Lonnoy, E., Matthews, J. B. R., Maycock, T. K., Waterfield, T., Yelekçi, O., Yu, R., and Zhou, B., Cambridge University Press, Cambridge, United Kingdom and New York, NY, USA, 2391 pp., https://report.ipcc.ch/ar6/wg1/IPCC_AR6_WGI_FullReport.pdf (last access: 16 April 2023), 2021.
Kadow, C., Illing, S., Lucio-Eceiza, E. E., Bergemann, M., Ramadoss, M., Sommer, P. S., Kunst, O., Schartner, T., Pankatz, K., Grieger, J., Schuster, M., Richling, A., Thiemann, H., Kirchner, I., Rust, H. W., Ludwig, T., Cubasch, U., and Ulbrich, U.: Introduction to Freva – A Free Evaluation System Framework for Earth System Modeling, J. Open Res. Softw., 9, 13, https://doi.org/10.5334/jors.253, 2021.
Kaspar, F., Müller-Westermeier, G., Penda, E., Mächel, H., Zimmermann, K., Kaiser-Weiss, A., and Deutschländer, T.: Monitoring of climate change in Germany – data, products and services of Germany's National Climate Data Centre, Adv. Sci. Res., 10, 99–106, https://doi.org/10.5194/asr-10-99-2013, 2013.
Kautz, L.-A., Martius, O., Pfahl, S., Pinto, J. G., Ramos, A. M., Sousa, P. M., and Woollings, T.: Atmospheric blocking and weather extremes over the Euro-Atlantic sector – a review, Weather Clim. Dynam., 3, 305–336, https://doi.org/10.5194/wcd-3-305-2022, 2022.
Kendon, M., McCarthy, M., Jevrejeva, S., Matthews, A., and Legg, T.: State of the UK climate 2018, Int. J. Climatol., 39, 1–55, https://doi.org/10.1002/joc.6213, 2019.
Kennedy, J. J., Killick, R. E., Dunn, R. J., McCarthy, M. P., Morice, C. P., Rayner, N. A., and Titchner, H. A.: Global and regional climate in 2018, Weather, 74, 332–340, https://doi.org/10.1002/wea.3600, 2019.
Kohonen, T.: Essentials of the self-organizing map, Neural Networks, 37, 52–65, https://doi.org/10.1016/j.neunet.2012.09.018, 2013.
Leach, N. J., Li, S., Sparrow, S., Oldenborgh, G. J. van, Lott, F. C., Weisheimer, A., and Allen, M. R.: Anthropogenic Influence on the 2018 Summer Warm Spell in Europe: The Impact of Different Spatio-Temporal Scales, B. Am. Meteorol. Soc., 101, S41–S46, https://doi.org/10.1175/BAMS-D-19-0201.1, 2020.
Li, M., Yao, Y., Simmonds, I., Luo, D., Zhong, L., and Chen, X.: Collaborative impact of the nao and atmospheric blocking on european heatwaves, with a focus on the hot summer of 2018, Environ. Res. Lett., 15, 114003, https://doi.org/10.1088/1748-9326/aba6ad, 2020.
Liu, X., He, B., Guo, L., Huang, L., and Chen, D.: Similarities and Differences in the Mechanisms Causing the European Summer Heatwaves in 2003, 2010, and 2018, Earth's Future, 8, e2019EF001386, https://doi.org/10.1029/2019EF001386, 2020.
Lo, M. H., Wu, W. Y., Tang, L. I., Ryu, D., Rashid, M., and Wu, R. J.: Temporal Changes in Land Surface Coupling Strength: An Example in a Semi-Arid Region of Australia, J. Climate, 34, 1503–1513, https://doi.org/10.1175/JCLI-D-20-0250.1, 2021.
Maher, N., Milinski, S., Suarez-Gutierrez, L., Botzet, M., Dobrynin, M., Kornblueh, L., Kröger, J., Takano, Y., Ghosh, R., Hedemann, C., Li, C., Li, H., Manzini, E., Notz, D., Putrasahan, D., Boysen, L., Claussen, M., Ilyina, T., Olonscheck, D., Raddatz, T., Stevens, B., and Marotzke, J.: The Max Planck Institute Grand Ensemble: Enabling the Exploration of Climate System Variability, J. Adv. Model. Earth Syst., 11, 2050–2069, https://doi.org/10.1029/2019MS001639, 2019.
Manning, C., Widmann, M., Bevacqua, E., Van Loon, A. F., Maraun, D., and Vrac, M.: Increased probability of compound long-duration dry and hot events in Europe during summer (1950–2013), Environ. Res. Lett., 14, 094006, https://doi.org/10.1088/1748-9326/AB23BF, 2019.
Markonis, Y., Kumar, R., Hanel, M., Rakovec, O., Máca, P., and Kouchak, A. A.: The rise of compound warm-season droughts in Europe, Sci. Adv., 7, eabb9668, https://doi.org/10.1126/SCIADV.ABB9668, 2021.
McCarthy, M., Christidis, N., Dunstone, N., Fereday, D., Kay, G., Klein-Tank, A., Lowe, J., Petch, J., Scaife, A., and Stott, P.: Drivers of the UK summer heatwave of 2018, Weather, 74, 390–396, https://doi.org/10.1002/WEA.3628, 2019.
Miralles, D. G., Teuling, A. J., van Heerwaarden, C. C., and Vilà-Guerau de Arellano, J.: Mega-heatwave temperatures due to combined soil desiccation and atmospheric heat accumulation, Nat. Geosci., 7, 345–349, https://doi.org/10.1038/ngeo2141, 2014.
Miralles, D. G., Gentine, P., Seneviratne, S. I., and Teuling, A. J.: Land–atmospheric feedbacks during droughts and heatwaves: state of the science and current challenges, Ann. N.Y. Acad. Sci., 1436, 19–35, https://doi.org/10.1111/nyas.13912, 2018.
Orth, R.: When the Land Surface Shifts Gears, AGU Adv., 2, e2021AV000414, https://doi.org/10.1029/2021av000414, 2021.
Ossó, A., Sutton, R., Shaffrey, L., and Dong, B.: Development, Amplification, and Decay of Atlantic/European Summer Weather Patterns Linked to Spring North Atlantic Sea Surface Temperatures, J. Climate, 33, 5939–5951, https://doi.org/10.1175/JCLI-D-19-0613.1, 2020.
Pascal, M., Lagarrigue, R., Tabai, A., Bonmarin, I., Camail, S., Laaidi, K., Le Tertre, A., and Denys, S.: Evolving heat waves characteristics challenge heat warning systems and prevention plans, Int. J. Biometeorol., 65, 1683–1694, https://doi.org/10.1007/S00484-021-02123-Y, 2021.
Perkins-Kirkpatrick, S. E. and Lewis, S. C.: Increasing trends in regional heatwaves, Nat. Commun., 11, 3357, https://doi.org/10.1038/s41467-020-16970-7, 2020.
Peters, W., Bastos, A., Ciais, P., and Vermeulen, A.: A historical, geographical and ecological perspective on the 2018 European summer drought, Philos. Trans. R. Soc. B, 375, 20190505, https://doi.org/10.1098/RSTB.2019.0505, 2020.
Philip, S., Kew, S., van Oldenborgh, G. J., Otto, F., Vautard, R., van der Wiel, K., King, A., Lott, F., Arrighi, J., Singh, R., and van Aalst, M.: A protocol for probabilistic extreme event attribution analyses, Adv. Stat. Clim. Meteorol. Oceanogr., 6, 177–203, https://doi.org/10.5194/ascmo-6-177-2020, 2020.
Philip, S. Y., Kew, S. F., van Oldenborgh, G. J., Anslow, F. S., Seneviratne, S. I., Vautard, R., Coumou, D., Ebi, K. L., Arrighi, J., Singh, R., van Aalst, M., Pereira Marghidan, C., Wehner, M., Yang, W., Li, S., Schumacher, D. L., Hauser, M., Bonnet, R., Luu, L. N., Lehner, F., Gillett, N., Tradowsky, J. S., Vecchi, G. A., Rodell, C., Stull, R. B., Howard, R., and Otto, F. E. L.: Rapid attribution analysis of the extraordinary heat wave on the Pacific coast of the US and Canada in June 2021, Earth Syst. Dynam., 13, 1689–1713, https://doi.org/10.5194/esd-13-1689-2022, 2022.
Prodhomme, C., Materia, S., Ardilouze, C., White, R. H., Batté, L., Guemas, V., Fragkoulidis, G., and García-Serrano, J.: Seasonal prediction of European summer heatwaves, Clim. Dynam., 58, 2149–2166, https://doi.org/10.1007/s00382-021-05828-3, 2022.
Quesada, B., Vautard, R., Yiou, P., Hirschi, M., and Seneviratne, S. I.: Asymmetric European summer heat predictability from wet and dry southern winters and springs, Nat. Clim. Change, 2, 736–741, https://doi.org/10.1038/nclimate1536, 2012.
Rousi, E., Anagnostopoulou, C., Tolika, K., and Maheras, P.: Representing teleconnection patterns over Europe: A comparison of SOM and PCA methods, Atmos. Res., 152, 123–137, https://doi.org/10.1016/j.atmosres.2013.11.010, 2015.
Rousi, E., Selten, F., Rahmstorf, S., and Coumou, D.: Changes in North Atlantic Atmospheric Circulation in a Warmer Climate Favor Winter Flooding and Summer Drought over Europe, J. Climate, 34, 2277–2295, https://doi.org/10.1175/JCLI-D-20-0311.1, 2021.
Rousi, E., Kornhuber, K., Beobide-Arsuaga, G., Luo, F., and Coumou, D.: Accelerated western European heatwave trends linked to more-persistent double jets over Eurasia, Nat. Commun., 13, 1–11, https://doi.org/10.1038/s41467-022-31432-y, 2022.
Russo, S., Dosio, A., Graversen, R. G., Sillmann, J., Carrao, H., Dunbar, M. B., Singleton, A., Montagna, P., Barbola, P., and Vogt, J. V.: Magnitude of extreme heat waves in present climate and their projection in a warming world, J. Geophys. Res.-Atmos., 119, 12500–12512, https://doi.org/10.1002/2014JD022098, 2014.
Russo, S., Sillmann, J., and Fischer, E. M.: Top ten European heatwaves since 1950 and their occurrence in the coming decades, Environ. Res. Lett., 10, 124003, https://doi.org/10.1088/1748-9326/10/12/124003, 2015.
Saeed, S., Van Lipzig, N., Müller, W. A., Saeed, F., and Zanchettin, D.: Influence of the circumglobal wave-train on European summer precipitation, Clim. Dynam., 43, 503–515, https://doi.org/10.1007/S00382-013-1871-0, 2013.
San-Miguel-Ayanz, J., Durrant, T., Boca, R., Libertà, G., Branco, A., De Rigo, D., Ferrari, D., Maianti, P., Artes, V. T., Pfeiffer, H., and Loffler, P.: Forest Fires in Europe, Middle East and North Africa 2018, EUR 29856 EN, Publications Office of the European Union, Luxembourg, ISBN 978-92-76-12591-4, https://doi.org/10.2760/561734, 2019.
Santos, J. A., Pfahl, S., Pinto, J. G., and Wernli, H.: Mechanisms underlying temperature extremes in Iberia: a Lagrangian perspective, Tellus A, 67, 26032, https://doi.org/10.3402/TELLUSA.V67.26032, 2015.
Scherrer, S. C., Croci-Maspoli, M., Schwierz, C., and Appenzeller, C.: Two-dimensional indices of atmospheric blocking and their statistical relationship with winter climate patterns in the Euro-Atlantic region, Int. J. Climatol., 26, 233–249, https://doi.org/10.1002/JOC.1250, 2006.
Schuldt, B., Buras, A., Arend, M., Vitasse, Y., Beierkuhnlein, C., Damm, A., Gharun, M., Grams, T. E. E., Hauck, M., Hajek, P., Hartmann, H., Hiltbrunner, E., Hoch, G., Holloway-Phillips, M., Körner, C., Larysch, E., Lübbe, T., Nelson, D. B., Rammig, A., Rigling, A., Rose, L., Ruehr, N. K., Schumann, K., Weiser, F., Werner, C., Wohlgemuth, T., Zang, C. S., and Kahmen, A.: A first assessment of the impact of the extreme 2018 summer drought on Central European forests, Basic Appl. Ecol., 45, 86–103, https://doi.org/10.1016/J.BAAE.2020.04.003, 2020.
Schumacher, D. L., Keune, J., van Heerwaarden, C. C., Vilà-Guerau de Arellano, J., Teuling, A. J., and Miralles, D. G.: Amplification of mega-heatwaves through heat torrents fuelled by upwind drought, Nat. Geosci., 12, 712–717, https://doi.org/10.1038/s41561-019-0431-6, 2019.
Schumacher, D. L., Keune, J., Dirmeyer, P., and Miralles, D. G.: Drought self-propagation in drylands due to land–atmosphere feedbacks, Nat. Geosci., 15, 262–268, https://doi.org/10.1038/s41561-022-00912-7, 2022.
Schuster, M., Grieger, J., Richling, A., Schartner, T., Illing, S., Kadow, C., Müller, W. A., Pohlmann, H., Pfahl, S., and Ulbrich, U.: Improvement in the decadal prediction skill of the North Atlantic extratropical winter circulation through increased model resolution, Earth Syst. Dynam., 10, 901–917, https://doi.org/10.5194/esd-10-901-2019, 2019.
Seneviratne, S. I., Corti, T., Davin, E. L., Hirschi, M., Jaeger, E. B., Lehner, I., Orlowsky, B., and Teuling, A. J.: Investigating soil moisture–climate interactions in a changing climate: A review, Earth-Sci. Rev., 99, 125–161, https://doi.org/10.1016/j.earscirev.2010.02.004, 2010.
Senf, C. and Seidl, R.: Persistent impacts of the 2018 drought on forest disturbance regimes in Europe, Biogeosciences, 18, 5223–5230, https://doi.org/10.5194/bg-18-5223-2021, 2021.
Shepherd, T. G.: A Common Framework for Approaches to Extreme Event Attribution, Curr. Clim. Chang. Reports, 2, 28–38, https://doi.org/10.1007/S40641-016-0033-Y, 2016.
Sinclair, V. A., Mikkola, J., Rantanen, M., and Räisänen, J.: The summer 2018 heatwave in Finland, Weather, 74, 403–409, https://doi.org/10.1002/WEA.3525, 2019.
Sousa, P. M., Trigo, R. M., Barriopedro, D., Soares, P. M. M., Ramos, A. M., and Liberato, M. L. R.: Responses of European precipitation distributions and regimes to different blocking locations, Clim. Dynam., 48, 1141–1160, https://doi.org/10.1007/S00382-016-3132-5, 2017.
Sousa, P. M., Trigo, R. M., Barriopedro, D., Soares, P. M. M., and Santos, J. A.: European temperature responses to blocking and ridge regional patterns, Clim. Dynam., 50, 457–477, https://doi.org/10.1007/s00382-017-3620-2, 2018.
Sousa, P. M., Barriopedro, D., Ramos, A. M., García-Herrera, R., Espírito-Santo, F., and Trigo, R. M.: Saharan air intrusions as a relevant mechanism for Iberian heatwaves: The record breaking events of August 2018 and June 2019, Weather Clim. Extrem., 26, 100224, https://doi.org/10.1016/j.wace.2019.100224, 2019.
Spensberger, C., Madonna, E., Boettcher, M., Grams, C. M., Papritz, L., Quinting, J. F., Röthlisberger, M., Sprenger, M., and Zschenderlein, P.: Dynamics of concurrent and sequential Central European and Scandinavian heatwaves, Q. J. Roy. Meteor. Soc., 146, 2998–3013, https://doi.org/10.1002/qj.3822, 2020.
Spinoni, J., Vogt, J. V., Naumann, G., Barbosa, P., and Dosio, A.: Will drought events become more frequent and severe in Europe?, Int. J. Climatol., 38, 1718–1736, https://doi.org/10.1002/JOC.5291, 2018.
Spinoni, J., Barbosa, P., Bucchignani, E., Cassano, J., Cavazos, T., Christensen, J. H., Christensen, O. B., Coppola, E., Evans, J., Geyer, B., Giorgi, F., Hadjinicolaou, P., Jacob, D., Katzfey, J., Koenigk, T., Laprise, R., Lennard, C. J., Kurnaz, M. L., Delei, L. I., Llopart, M., McCormick, N., Naumann, G., Nikulin, G., Ozturk, T., Panitz, H. J., da Rocha, R. P., Rockel, B., Solman, S. A., Syktus, J., Tangang, F., Teichmann, C., Vautard, R., Vogt, J. V., Winger, K., Zittis, G., and Dosio, A.: Future global meteorological drought hot spots: A study based on CORDEX data, J. Climate, 33, 3635–3661, https://doi.org/10.1175/JCLI-D-19-0084.1, 2020.
Sprenger, M. and Wernli, H.: The LAGRANTO Lagrangian analysis tool – version 2.0, Geosci. Model Dev., 8, 2569–2586, https://doi.org/10.5194/gmd-8-2569-2015, 2015.
Stéfanon, M., Drobinski, P., D'Andrea, F., Lebeaupin-Brossier, C., and Bastin, S.: Soil moisture-temperature feedbacks at meso-scale during summer heat waves over Western Europe, Clim. Dynam., 42, 1309–1324, https://doi.org/10.1007/S00382-013-1794-9, 2014.
Stott, P. A., Stone, D. A., and Allen, M. R.: Human contribution to the European heatwave of 2003, Nature, 432, 610–614, https://doi.org/10.1038/nature03089, 2004.
Suarez-Gutierrez, L., Li, C., Müller, W. A., and Marotzke, J.: Internal variability in European summer temperatures at 1.5 ∘C and 2 ∘C of global warming, Environ. Res. Lett., 13, 064026, https://doi.org/10.1088/1748-9326/AABA58, 2018.
Suarez-Gutierrez, L., Milinski, S., and Maher, N.: Exploiting large ensembles for a better yet simpler climate model evaluation, Clim. Dynam., 57, 2557–2580, https://doi.org/10.1007/S00382-021-05821-W, 2021.
Teuling, A. J.: A hot future for European droughts, Nat. Clim. Change, 8, 364–365, https://doi.org/10.1038/s41558-018-0154-5, 2018.
Toreti, A., Belward, A., Perez-Dominguez, I., Naumann, G., Luterbacher, J., Cronie, O., Seguini, L., Manfron, G., Lopez-Lozano, R., Baruth, B., van den Berg, M., Dentener, F., Ceglar, A., Chatzopoulos, T., and Zampieri, M.: The Exceptional 2018 European Water Seesaw Calls for Action on Adaptation, Earth's Future, 7, 652–663, https://doi.org/10.1029/2019EF001170, 2019.
Tradowsky, J. S., Bird, L., Kreft, P. V., Rosier, S. M., Soltanzadeh, I., Stone, D. A., and Bodeker, G. E.: Toward Near-Real-Time Attribution of Extreme Weather Events in Aotearoa New Zealand, B. Am. Meteorol. Soc., 103, S105–S110, https://doi.org/10.1175/BAMS-D-21-0236.1, 2022.
Vicente-Serrano, S. M., Azorin-Molina, C., Sanchez-Lorenzo, A., Revuelto, J., Morán-Tejeda, E., Lõpez-Moreno, J. I., and Espejo, F.: Sensitivity of reference evapotranspiration to changes in meteorological parameters in Spain (1961–2011), Water Resour. Res., 50, 8458–8480, https://doi.org/10.1002/2014WR015427, 2014.
Vogel, M. M., Zscheischler, J., Wartenburger, R., Dee, D., and Seneviratne, S. I.: Concurrent 2018 Hot Extremes Across Northern Hemisphere Due to Human-Induced Climate Change, Earth's Future, 7, 692–703, https://doi.org/10.1029/2019EF001189, 2019.
Wehrli, K., Guillod, B. P., Hauser, M., Leclair, M., and Seneviratne, S. I.: Identifying Key Driving Processes of Major Recent Heat Waves, J. Geophys. Res.-Atmos., 124, 11746–11765, https://doi.org/10.1029/2019JD030635, 2019.
Wehrli, K., Hauser, M., and Seneviratne, S. I.: Storylines of the 2018 Northern Hemisphere heatwave at pre-industrial and higher global warming levels, Earth Syst. Dynam., 11, 855–873, https://doi.org/10.5194/esd-11-855-2020, 2020.
Woollings, T., Pinto, J. G., and Santos, J. A.: Dynamical Evolution of North Atlantic Ridges and Poleward Jet Stream Displacements, J. Atmos. Sci., 68, 954–963, https://doi.org/10.1175/2011JAS3661.1, 2011.
Woollings, T., Barriopedro, D., Methven, J., Son, S. W., Martius, O., Harvey, B., Sillmann, J., Lupo, A. R., and Seneviratne, S.: Blocking and its Response to Climate Change, Curr. Clim. Chang. Reports, 4, 287–300, https://doi.org/10.1007/s40641-018-0108-z, 2018.
World Weather Attribution (WWA): Heatwave in northern Europe, summer 2018, https://www.worldweatherattribution.org/attribution-of-the-2018-heat-in-northern-europe/ (last access: 18 August 2022), 2018.
World Weather Attribution (WWA): Without human-caused climate change temperatures of 40 ∘C in the UK would have been extremely unlikely, https://www.worldweatherattribution.org/without-human-caused-climate-change-temperatures-of-40c-in-the-uk-would-have-been-extremely-unlikely/, last access: 18 August 2022.
Zampieri, M., Ceglar, A., Dentener, F., and Toreti, A.: Wheat yield loss attributable to heat waves, drought and water excess at the global, national and subnational scales, Environ. Res. Lett., 12, 064008, https://doi.org/10.1088/1748-9326/AA723B, 2017.
Zscheischler, J. and Fischer, E. M.: The record-breaking compound hot and dry 2018 growing season in Germany, Weather Clim. Extrem., 29, 100270, https://doi.org/10.1016/j.wace.2020.100270, 2020.
Zscheischler, J., Martius, O., Westra, S., Bevacqua, E., Raymond, C., Horton, R. M., van den Hurk, B., AghaKouchak, A., Jézéquel, A., Mahecha, M. D., Maraun, D., Ramos, A. M., Ridder, N. N., Thiery, W., and Vignotto, E.: A typology of compound weather and climate events, Nat. Rev. Earth Environ., 1, 333–347, https://doi.org/10.1038/s43017-020-0060-z, 2020.
Zschenderlein, P., Pfahl, S., Wernli, H., and Fink, A. H.: A Lagrangian analysis of upper-tropospheric anticyclones associated with heat waves in Europe, Weather Clim. Dynam., 1, 191–206, https://doi.org/10.5194/wcd-1-191-2020, 2020.