the Creative Commons Attribution 4.0 License.
the Creative Commons Attribution 4.0 License.
 | 31 Mar 2023
Brief communication: The potential use of low-cost acoustic sensors to detect rainfall for short-term urban flood warnings
Herminia Torelló-Sentelles
Grégoire Mariéthoz
Lionel Benoit
João P. Leitão
Francesco Marra
Floods in urban areas are one of the most common natural hazards. Due to climate change enhancing extreme rainfall and cities becoming larger and denser, the frequency, magnitude, and impact of these events are expected to increase. Pluvial floods can occur in urban areas within minutes. A fast and reliable rainfall detection system should thus be implemented in flood-prone cities to warn the public of upcoming floods and save lives and reduce damage. The purpose of this brief communication is to discuss the potential implementation of low-cost acoustic rainfall sensors in short-term flood warning systems.
- Article
(4308 KB) - Full-text XML
-
Supplement
(689 KB) - BibTeX
- EndNote


Most of the damage costs caused by natural hazards in cities are related to floods, one of the most common natural hazards (Kreibich et al., 2014). There are two types of urban flooding caused by rainfall: fluvial and pluvial. A fluvial flood occurs when a river flows over its banks or when a lake level rises over its shores. In most cases, it is caused by a prolonged event with medium- to high-intensity rainfall, which is not necessarily extreme, and therefore has a medium to high forecast potential (Richardson et al., 2020). A pluvial flood occurs when a large volume of rain falls during a short period of time and exceeds the capacity of the urban drainage system. There is greater difficulty forecasting short-duration, intense, and possibly very localized rainfalls that trigger pluvial floods because they are often convective in nature and can start directly over the urban area (Rözer et al., 2021).
There has been an increase in urban pluvial flood damage in recent years, and this trend is likely to continue in the future (Paprotny et al., 2018). The main reasons for this are twofold. First, cities are becoming larger and denser, which implies that the extent of impervious surface is growing, increasing fast runoff generation, and that there are high populations and more infrastructure that may be vulnerable to flooding. Second, global warming is increasing the frequency and intensity of short-duration heavy-rainfall events (Westra et al., 2014; Ali et al., 2021). In addition, the presence of high aerosol concentrations and extensive heat flux in cities could enhance the intensification of heavy rainfall even further (Huang et al., 2022).
Flood early warning systems help mitigate flood impacts by reducing populations' and authorities' unpreparedness, and therefore they have the potential to save lives and reduce damage. Short-term forecast systems typically combine numerical models (weather forecasting, precipitation nowcasting, and hydrodynamic) with ground (rain gauges) and remote sensing observations of precipitation (weather radars and satellites), and they are mainly operated by national meteorological or hydrological agencies. For example, the Bureau of Meteorology in Australia provides short-term rainfall forecasts and alerts at the continental scale (Bowler et al., 2006), while MeteoSwiss provides short-term extreme rainfall alerts at the country level (Sideris et al., 2020). A functional early warning system should not only forecast the upcoming flood but also communicate it rapidly and easily to the public using the media (e.g., radio and television) and mobile phones (using specially designed applications or SMS push messages).
The World Meteorological Organization estimates that one-third of the world's population is still unprotected by early warning systems, mainly in developing countries and on small islands; in March 2022, it launched a 5-year initiative to ensure the availability of early warning systems on a global scale (WMO, 2022). When predicting pluvial floods, high-resolution precipitation monitoring is crucial, since an intense convective storm, whose diameter can be as small as a few kilometers, can evolve, precipitate, and trigger a flood within minutes (Peleg et al., 2022). Maintaining and deploying ground-monitoring instruments, however, is a costly endeavor. To increase the accuracy of existing systems or extend their availability to cities where no system yet exists, one alternative is to qualitatively monitor the occurrence and space–time structure of storms using low-cost acoustic rainfall sensors.
There are three questions that should be answered before considering deploying a low-cost acoustic rainfall sensor network and implementing it within an early warning system: how accurate are these sensors; what are their advantages/limitations with respect to other rainfall monitoring devices; and ultimately, what value can acoustic sensors add to rainfall monitoring? In order to hint at the answers to these questions, we present laboratory and field results from three experiments at the rooftop, small-city, and large-city scales. As a final point, we discuss the potential of using low-cost acoustic rainfall sensors for flood warnings.
Acoustic rainfall sensors are simple devices. They usually consist of a small box (about 5–20 cm in size, Fig. 1b) with a flat-top surface (metal, plastic, or skin) that acts like a drum when raindrops fall on it, a microphone, a power supply (usually a 1.5–3 V battery), and a recording device (i.e., a logger). As acoustic sensors do not have mechanical components, they are less expensive to manufacture than, for example, tipping-bucket rain gauges. It is possible to set up the audio recording device to record individual raindrops hitting the drum or to record all the background noises continuously.
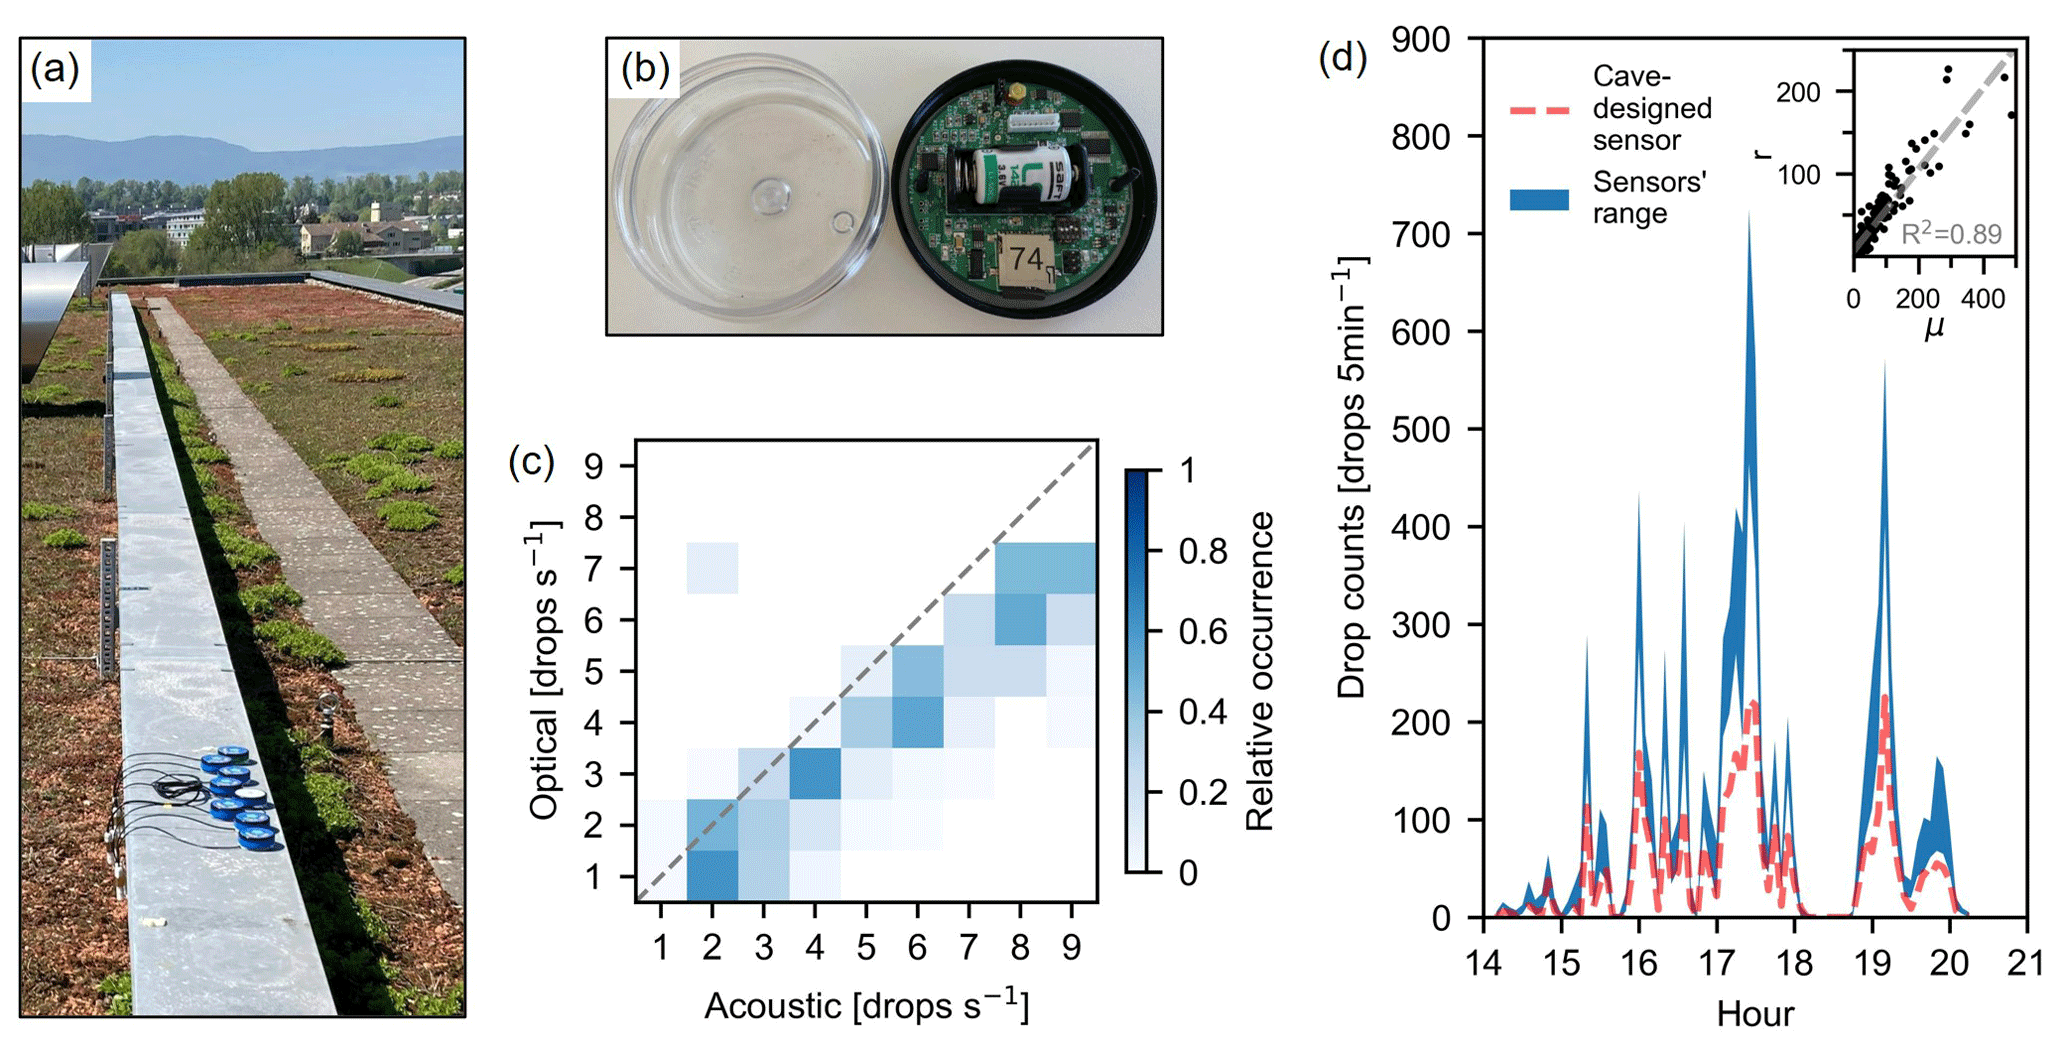
Figure 1(a) The rooftop experiment with eight acoustic sensors placed closely together. (b) A close-up of an acoustic sensor. (c) Laboratory dripping experiment results; the occurrence of the acoustic sensors' records is in relation to the optical sensor's records. (d) Raindrops recorded by the seven high-sensitivity acoustic sensors on the roof of the University of Lausanne (shown in panel a) during a rainfall event on 30 April 2022 (blue area indicates maximum–minimum records). The dashed red line depicts the records from a single low-sensitivity (cave-designed) sensor. Inset shows the sensor range (r) in relation to mean drop counts (μ) with a linear fit (gray line).
As early as the 1970s, acoustic sensors were used to monitor rainfall (Gray et al., 1974; Kampwerth and Rasmussen, 1974). Because the microphone quality was too low, resulting in low-accuracy measurements, and because the recording devices were too bulky and too expensive, acoustic sensors have not been widely used. But parts have become cheaper and smaller, and open-source electronics platforms, such as Arduino, have made it possible to design and build small and low-cost acoustic rainfall sensors (Trono et al., 2012; Dunkerley, 2020). As a rough comparison, the price of a low-cost acoustic sensor today is less than USD 100, whereas the cost of a commercial tipping bucket exceeds USD 500. The development of acoustic methods for recording rainfall intensity and occurrence is growing in popularity. For example, the sound recorded by opportunistic sensors in public spaces, such as security cameras, can be analyzed and converted to rainfall intensities (Dunkerley, 2022).
The purpose of this section is to illustrate how acoustic sensors can be used to monitor rainfall on a city scale (as evidenced in the pioneering study of Benoit et al., 2018). We used Goodsell Systems' BIG-DRIP acoustic sensors (http://www.goodsellsystems.co.uk/, last access: 26 March 2023) for this purpose (Fig. 1a, b). The sensors are small (70 mm diameter by 28 mm height) and are able to record raindrop counts at intervals between 1 s and 24 h. Originally designed to monitor water drops in caves, the sensors have a maximum sensitivity of 4 drops per second. Besides the original sensors, we examined a newer version designed for outdoor use that can record rates higher than 20 drops per second.
As a first step, we tested the sensors' ability to record drop rates against an independent digital counter in the laboratory under ideal conditions (e.g., no wind, full control of drip rate; Fig. 1c). Next, the recording uncertainty of the sensors was analyzed under natural conditions on the rooftop of the University of Lausanne by grouping several sensors together (Fig. 1d). Our last step was to deploy acoustic sensors in Zurich and Milan (Fig. 2). In Zurich, seven sensors were deployed in various parts of the city, each characterized by a unique local climate zone (LCZ, as defined by Stewart and Oke, 2012). Each of the sensors was located next to meteoblue AG's urban climate stations (equipped with tipping-bucket rain gauges – 0.2 mm per tip – and recording rainfall depths at 15 min intervals), which served as independent climate sensors (i.e., “ground truth” for validation). To estimate the sensors' ability to capture rainfall spatial variability at a large city scale, 30 acoustic sensors were deployed at 10 sites (2–3 sensors per site) in the city of Milan. No funnels were used to cover the acoustic sensors (e.g., Benoit et al., 2018). The following subsections provide a brief summary of the results from the different sites and experiments, as well as a concise discussion of the sensors' capabilities and limitations.
3.1 Lab and rooftop experiments
Vernier's drop counter (Go Direct Drop Counter; GDX-DC), an optical device that counts drops passing its sensor over a given time interval, was used as a reference for the laboratory experiment. By controlling the dropping rates, the acoustic sensors were tested for accuracy in recording drops between 1 and 9 per second. In the original version of the acoustic sensors (cave-designed, less sensitive microphones), recording results were unsatisfactory due to considerable underestimation of the number of drops (Fig. S1 in the Supplement). By increasing the sensitivity of the microphone, the acoustic sensors were able to record the drops well (Fig. 1c); in fact, at high dripping rates (over 7 drops per second), the acoustic sensors outperformed the recording ability of the optical sensor.
Next, we assessed the sensors' uncertainty in recording raindrops under natural conditions. This was achieved by grouping the sensors together on top of the Géopolis building at the University of Lausanne, a few centimeters apart (Fig. 1a). We left the cave-designed sensors recording raindrops for 3 weeks and then repeated the experiment with the high-sensitivity acoustic sensors, using a single cave-designed sensor as a proxy for comparison. We found that the raindrop record uncertainty linearly increases with rainfall intensity; thus the variability between maximum and minimum records can be meaningful in heavy rainfall (Fig. 1d). As an example, the records for the most intense rainfall peak in Fig. 1d range between 500 and 700 drops per 5 min. For the cave-designed sensors, record uncertainty is lower (not shown), but this is because its measurement ability is limited by its lower record sensitivity (Figs. S1 and 1d).
The following implications can be drawn regarding the acoustic sensor's ability to monitor rainfall based on our laboratory and rooftop experiments: (i) individual drops falling at a high frequency can be recorded satisfactorily by the sensors (Fig. 1c); (ii) the sensor's ability to record drops has been improved significantly by increasing the microphone sensitivity, and further improvements are possible in the future (Fig. S1 vs. Fig. 1c); (iii) with the current setup of the sensors, it would be advisable to have two to three sensors per location in order to assess and partly mitigate the recording uncertainty during intense rainfall (inset of Fig. 1d); (iv) it follows that the current sensor design prevents us from easily converting the drop rate into rainfall intensity; nevertheless, it appears that the sensors can provide meaningful information about how rainfall magnitudes are distributed in space and time; further, (v) the acoustic sensors capture the rainfall onset, cessation, and general temporal dynamics well (Fig. 1d).
3.2 Case studies: the cities of Zurich and Milan
The cities of Zurich and Milan were selected as case studies for testing the acoustic sensors across large spatial extents. Zurich is well monitored (a climate station per square kilometer) by meteoblue AG, while Milan is a large city, relatively flat, and easily accessible from the authors' hub. To have a sufficient number of sensors to monitor two case studies, we deployed both the low-sensitivity (cave-designed) and the high-sensitivity acoustic sensors (in Zurich and Milan, respectively). We deployed the acoustic sensor networks in April–May 2022 (Fig. 2), choosing sites to represent the urban microclimate (i.e., representing different LCZs).
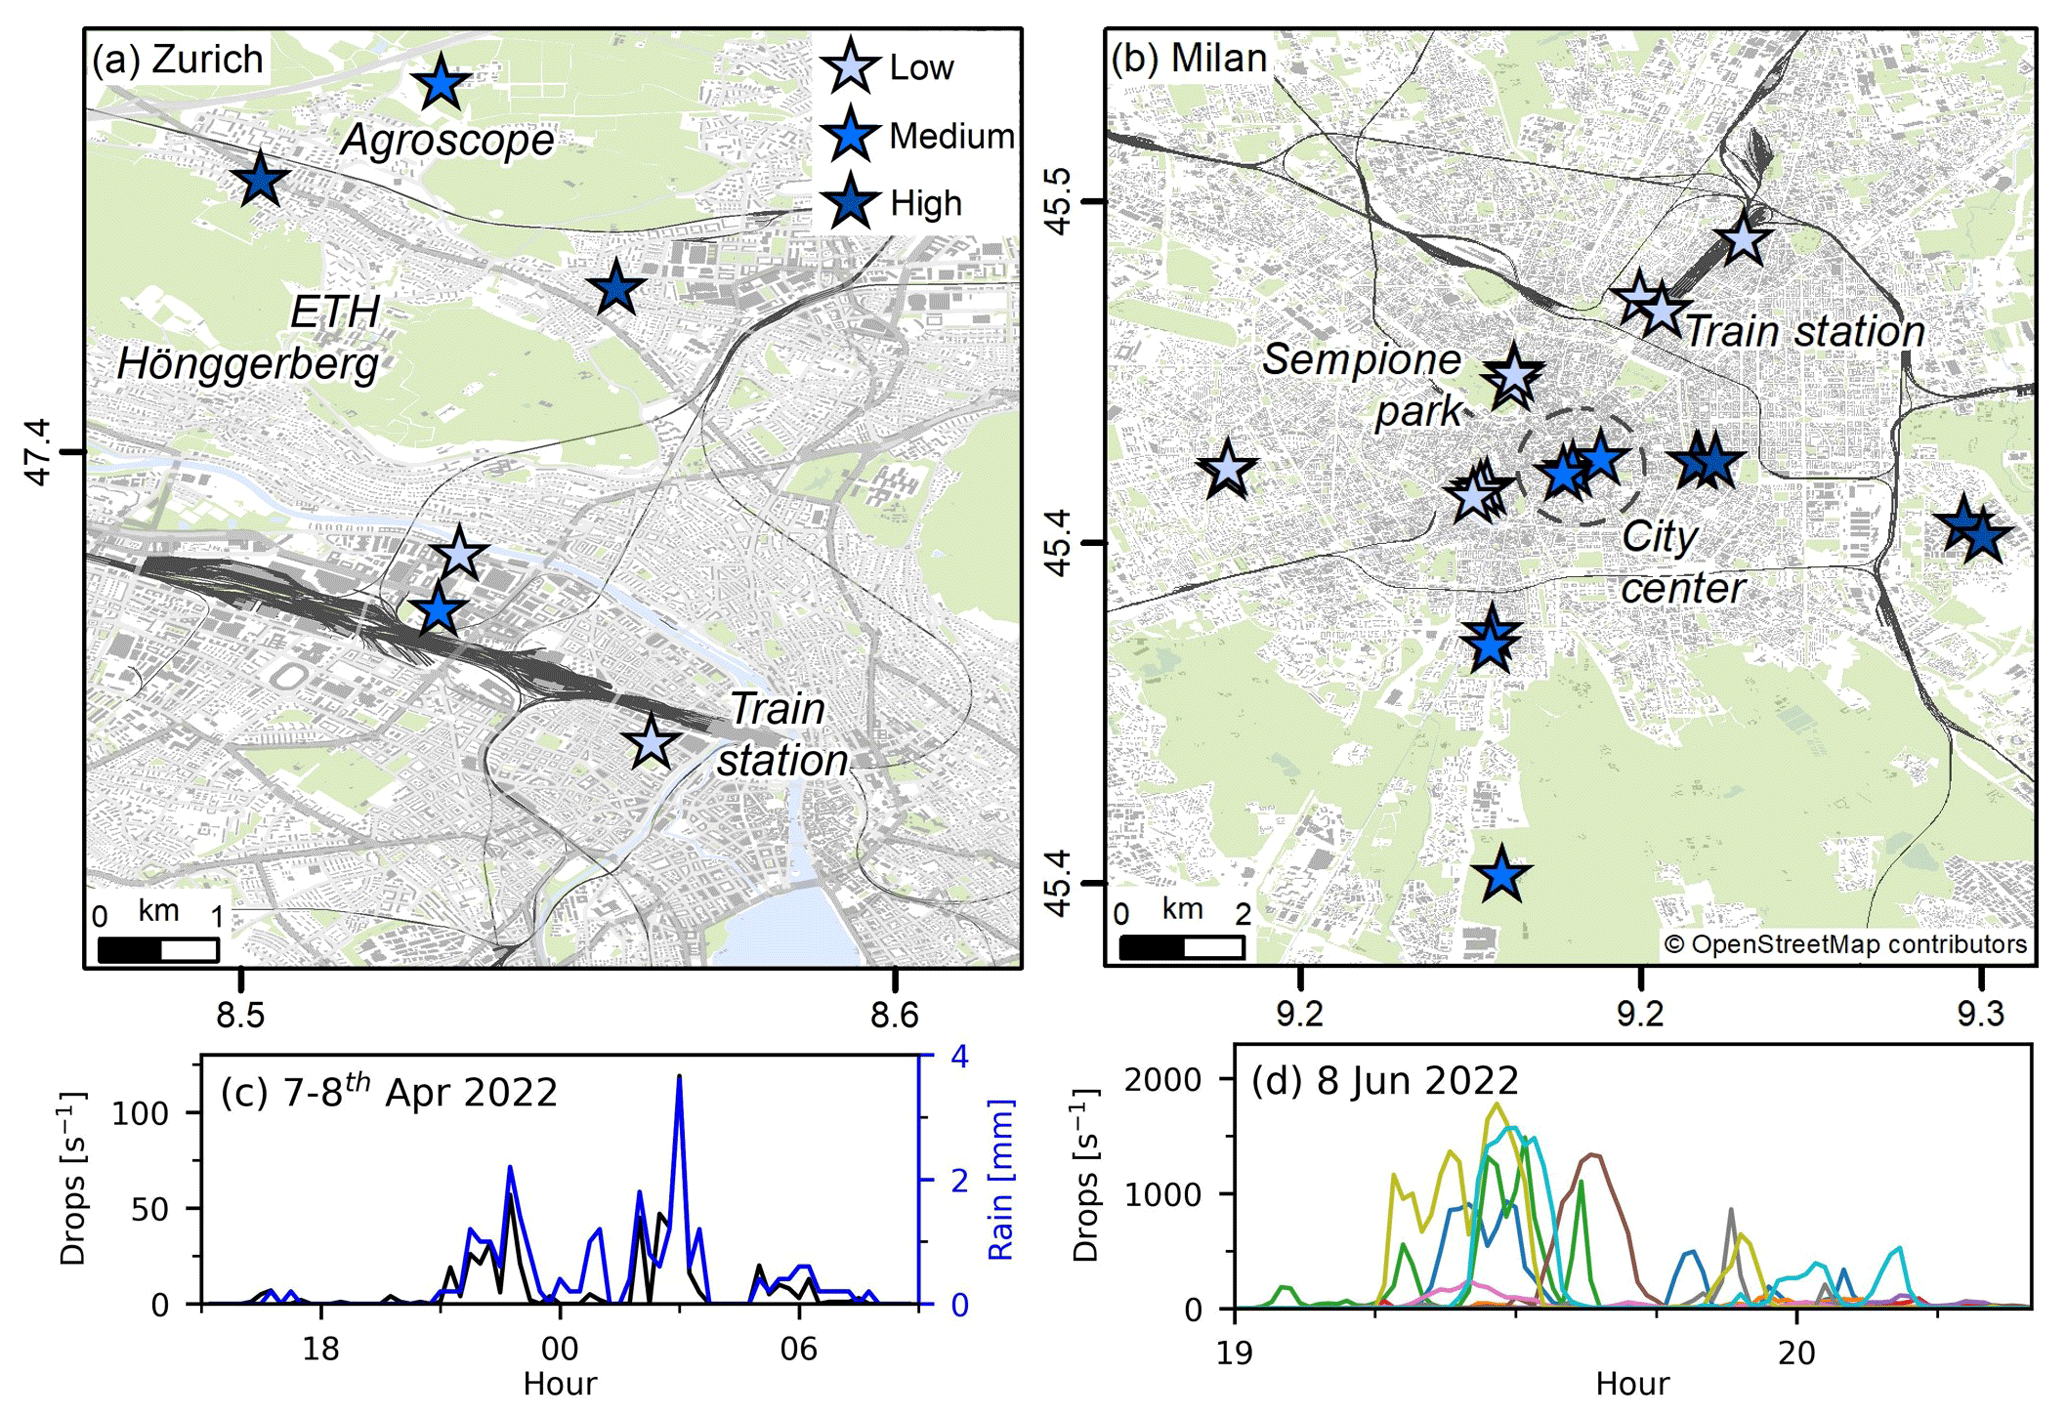
Figure 2Locations of 6 low-sensitivity (cave-designed) acoustic sensors in Zurich (a; a single sensor is located at each site) and 29 high-sensitivity acoustic sensors in Milan (b; 2–3 sensors are located at each site). The color of the star indicates how many raindrops were counted in April 2022 in Zurich (medium range: 28 000–32 000) and in June 2022 in Milan (medium range: 8000–33 000). Background city maps are based on OpenStreetMap data, which are available under the Open Database License. In panel (c), a rainfall event in Zurich is shown, comparing acoustic sensor data (black line, recording drops) with data obtained from the nearby meteoblue AG rain gauge (blue, recording rainfall depth). We present in panel (d) an example of spatial rainfall variability observed in Milan by the acoustic sensors (each color represents a different site).
Upon installation, we assumed a 10 %–20 % failure rate of the low-cost acoustic sensors due to hardware malfunctions. But the actual failure rate was much lower than expected, with only 2 low-cost sensors failing out of 37 deployed (5 % failure rate) for reasons unrelated to the power supply (e.g., microphone or logger failures).
By using Pearson correlation, we compared the temporal dynamics of the recorded raindrops by the acoustic sensors with the recorded rainfall intensities from the nearby meteoblue rain gauges in Zurich (Fig. S2). Correlation values ranged from 0.59 to 0.77, which is satisfactory, especially since the results are for less sensitive sensors. Interestingly, the lowest correlations were found in the vicinity of the train station, where fewer raindrops were recorded (Fig. S2). In view of the limited number of sensors deployed and the correlation computed for only a single month (April 2022), this interpretation should be considered with caution.
Next, we demonstrate the ability of the acoustic sensors to capture rainfall spatial variability within cities. The analysis in Zurich focuses on the month of April, with four rainfall events (a maximum of 35 000 raindrops counted in a single sensor), while in Milan, we examine the month of June, with five rainfall events (a maximum of 47 000 raindrops counted in a single sensor). In Zurich, two of the sensors indicate lower numbers of raindrops in densely built areas (along the train lines, Fig. 2a). In Milan, raindrop quantities are higher south and east of the city center, with less rainfall over and west of the train station and Sempione Park (Fig. 2b).
In addition, we compared the rainfall timing and magnitude between the raindrops recorded by the acoustic sensors and the rainfall depth recorded by the nearby meteoblue AG rain gauges (distances are reported in Table S1). In regard to, the timing of rainfall events, we found that both rain gauges and acoustic sensors recorded the onset and cessation of rain concurrently (Figs. 2c and S3). We found a good qualitative agreement between raindrops recorded by the acoustic sensors and rainfall intensities recorded by the gauges (e.g., Fig. 2c). Occasionally, the acoustic sensors overestimate the peak rainfall during an event (Fig. S3). By analyzing the timing and magnitude of rainfall recorded in multiple locations by the acoustic sensors in Milan (see example in Fig. 2d), we show that the sensors are capable of capturing the space–time variability of rainfall. It is clear from these examples that even if acoustic sensors do not convert raindrops to rain intensity, they can still provide valuable information about where rain is falling, its timing, and its general magnitude.
In order to understand how acoustic sensors might contribute to rainfall monitoring, we must first examine alternative monitoring methods. Figure 3a illustrates several monitoring devices that will be briefly discussed here (for a more comprehensive review see, e.g., Uijlenhoet et al., 2018). Satellites monitor rainfall at large spatial (101 km) and temporal (a few hours to days) scales, and they indirectly estimate rainfall by sensing the cloud top temperatures or by evaluating absorption and scattering properties of the clouds. Weather radars remotely sense rainfall at much finer space scales and timescales: 100 km and tens of minutes for the case of S-band or C-band radars and even 10−1 km and minutes for X-band radars; unlike satellites, they rely on the backscattering of hydrometeors at atmospheric levels closer to the cloud base. Both satellites and radars can be used to derive rainfall fields, which describe how rainfall evolves over time and space. Nevertheless, the spatial resolution of rainfall fields may be too coarse to represent small-scale variability in rainfall (Peleg et al., 2018) for hydrological processes relevant to urban flood forecasting (Ochoa-Rodriguez et al., 2015; Cristiano et al., 2017). X-band radars may address this issue, but their limited coverage (about 30 km range) and cost (on the order of USD 100 000) make them very expensive for monitoring individual cities. Moreover, rainfall estimates are not very precise, since the rainfall is not sensed at ground level and the estimate is indirect. Rainfall intensity near the ground can be estimated using commercial microwave links (CMLs) by quantifying the attenuation of the signal transmitted between cellular antennas. CMLs allow a high level of temporal accuracy (minutes), but the spatial resolution remains relatively coarse, often at the 101 km scale (exceptions are E-band CMLs, which are at the 100 km scale). It is most accurate to estimate rainfall using rain gauges. Even though rain gauges can record rainfall intensity at a high temporal resolution of minutes, their sparse distribution makes it difficult to accurately represent rainfall intensity in space. Low-cost acoustic sensors can be deployed with redundancy and in many places in order to record raindrops where rain gauges or commercial microwave links are not available or where radar beams are blocked. Thanks to their simple design and small size, they can be deployed easily and discretely on most flat surfaces or objects, near the ground. Furthermore, acoustic sensors are relatively easy to deploy and maintain, since they do not need balancing or frequent cleaning, both of which are required for example when deploying rain gauges.
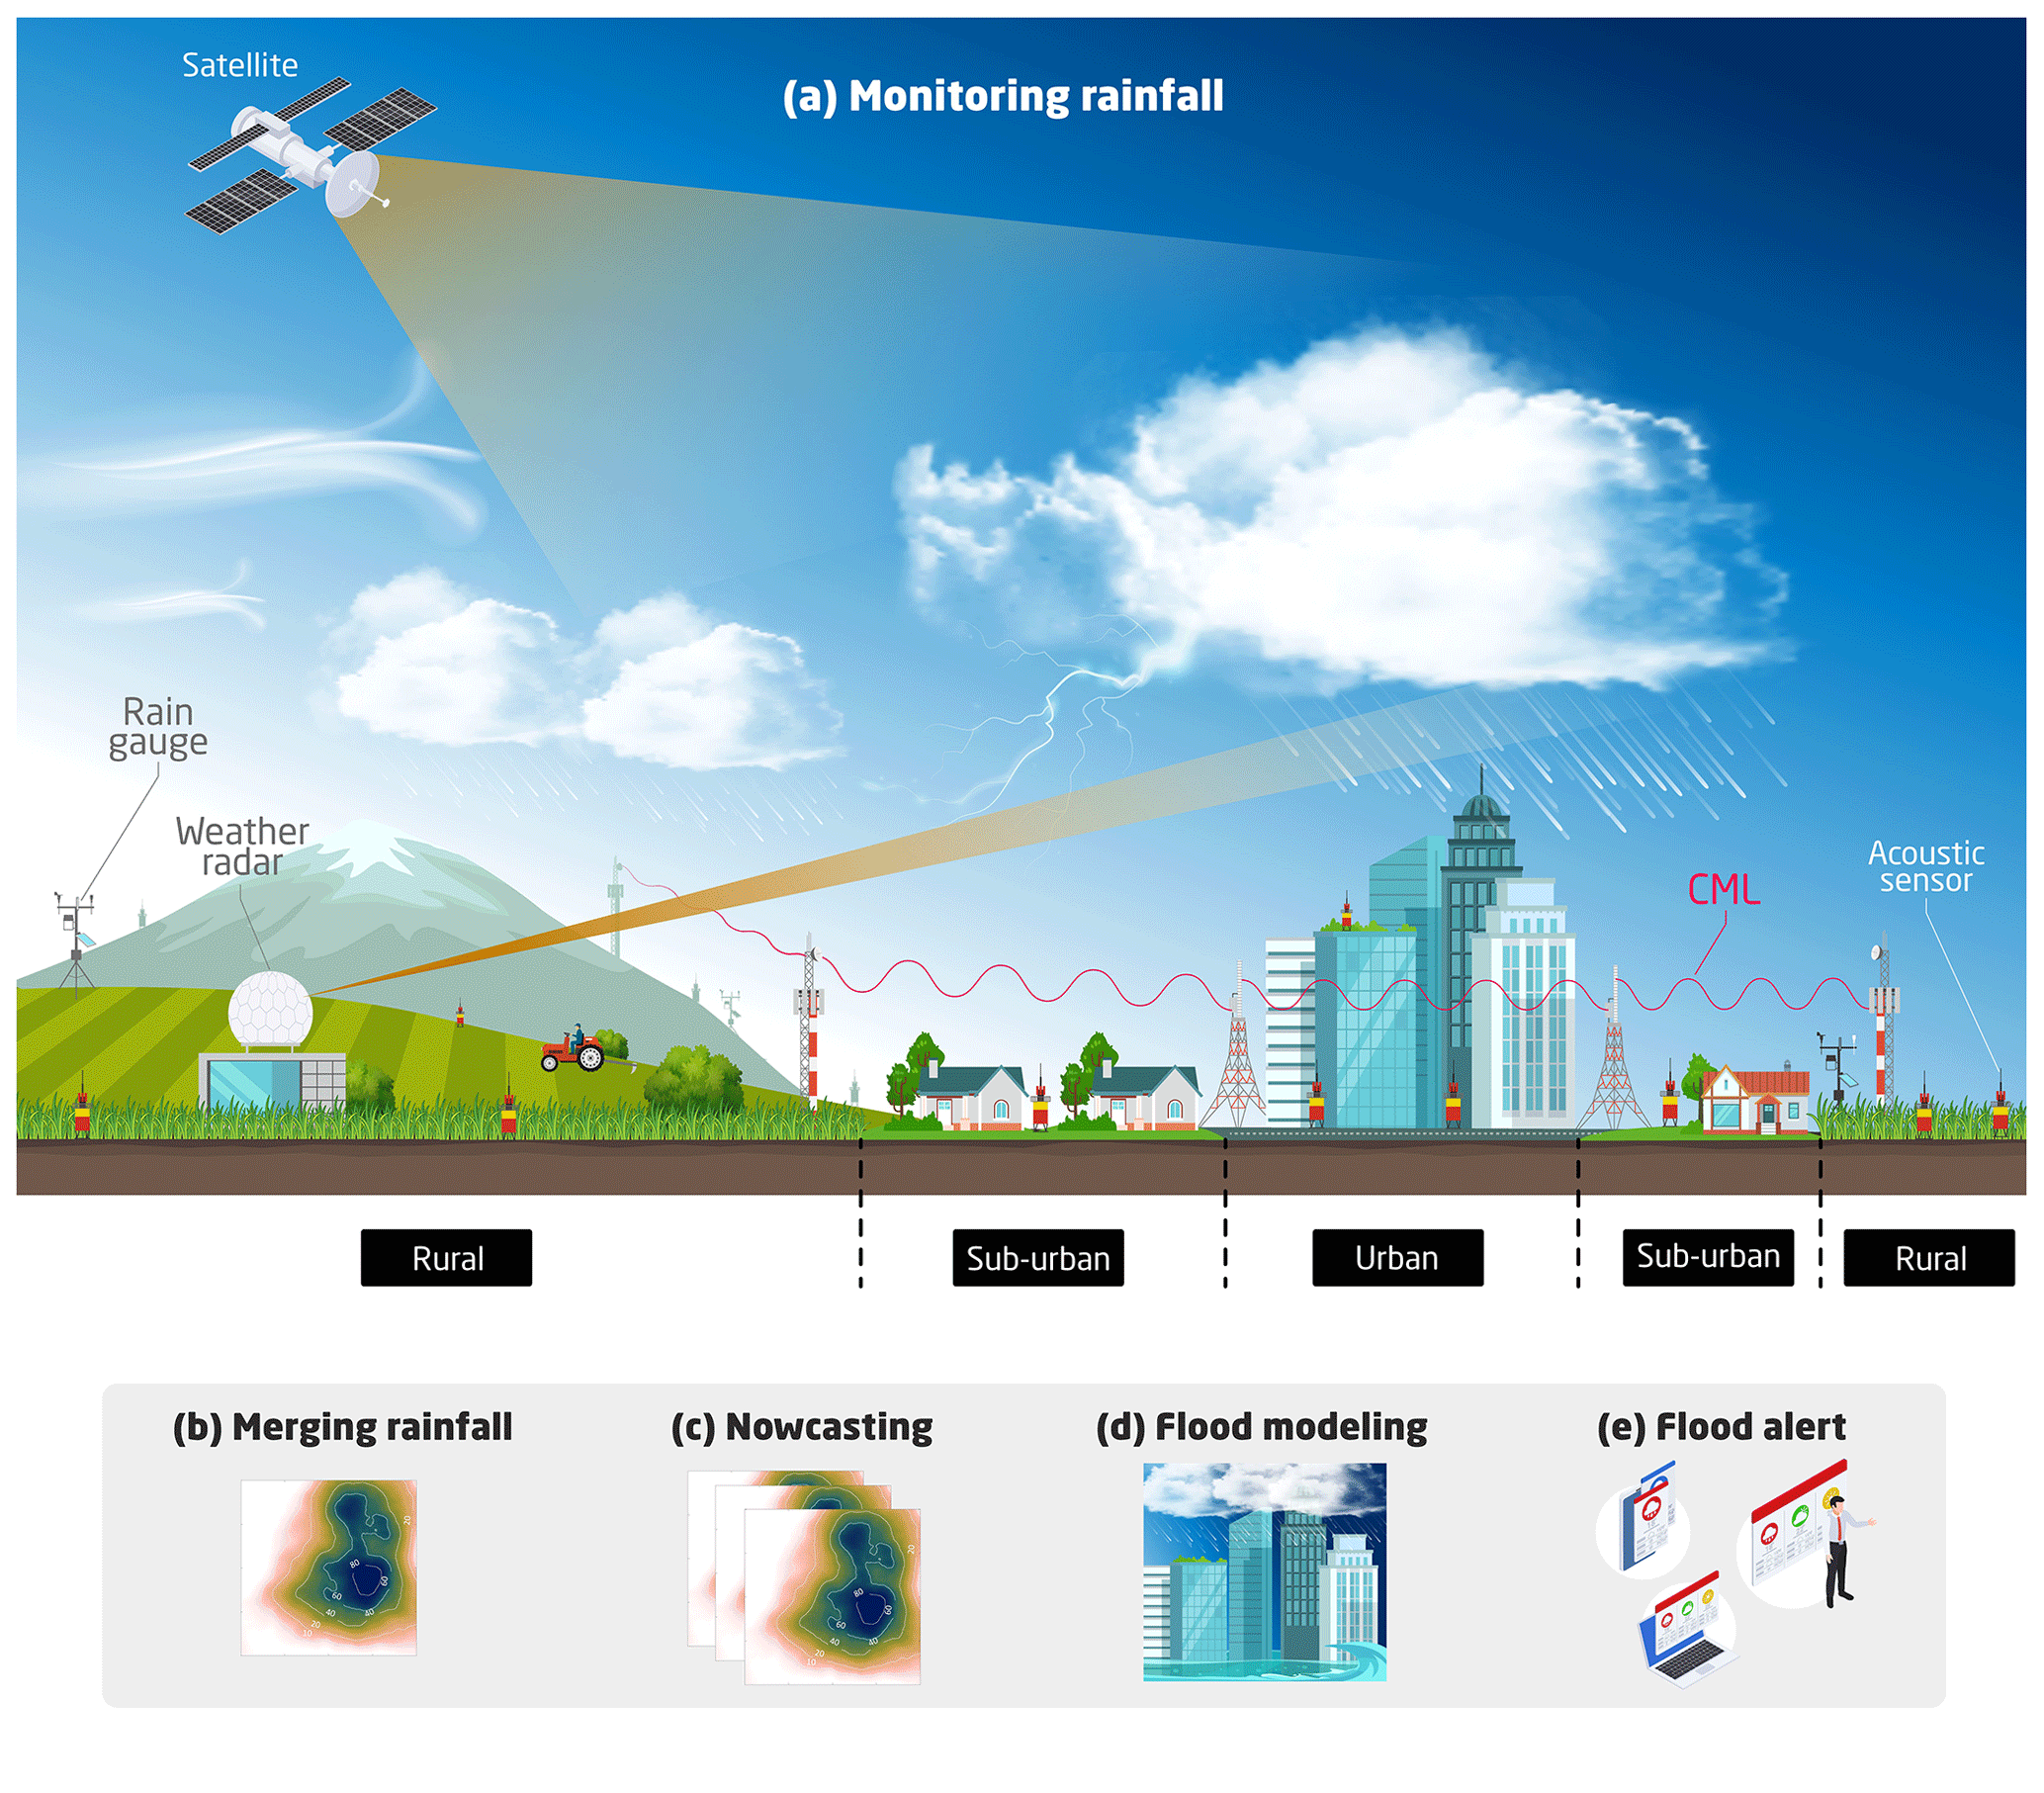
Figure 3From rainfall monitoring to flood alerts. (a) Schematic illustration of the most common rainfall monitoring devices at different spatial and temporal scales. Real-time records from panel (a) are merged to form a representative rain field (b), which is then used in near-real-time nowcasting (c). The simulated nowcast rainfall from panel (c) is then fed into a hydrodynamic model to forecast urban floods in the short term (d), and if necessary, flood alerts are sent out (e).
Can acoustic sensors provide useful information about rainfall? We found that acoustic sensors are capable of detecting well the onset and end of rainfall events. Furthermore, they can record raindrops at sub-minute intervals, allowing them to capture rainfall spatial variability at a higher temporal resolution than the other monitoring devices. There are, however, drawbacks to their use, including the fact that they record the number of raindrops hitting the drum, and the conversion from drops per time interval to rainfall intensity (e.g., from drops per minute to millimeter per hour) is not straightforward. Our preliminary comparison with rain gauge data (e.g., Figs. 2c and S3) suggests that this conversion can be theoretically approximated, but further research is needed in this direction. In particular, the effect of drop size distribution on this conversion should be explored. There is also a need to investigate the relationship between the type of rainfall (e.g., convective or stratiform) and the drop-intensity conversion. The acoustic sensors can also be covered with funnels (e.g., Benoit et al., 2018), which will slow the dripping rate and increase the accuracy of the measurements and potentially also the conversion to rainfall intensity, especially when examining rainfall rates at accumulation periods beyond the minute scale. Nevertheless, the high correlation we found between rainfall intensities (from rain gauges) and drop counts (acoustic sensors) implies that the differences in rainfall intensity between locations at a given time interval will be adequately reflected by the acoustic sensors. Another limitation is that the sensors cannot record solid precipitation, such as snow, but this kind of precipitation is less important in triggering pluvial flooding. As another point to consider, the accuracy of the acoustic records can be affected by ground vibrations, for example if placed near tram stops, typically found in urban areas. However, this can be solved by applying strict quality control to the data and removing white noise. The acoustic sensors require constant maintenance when they are deployed for a prolonged period of time, just like other monitoring devices. As an example, the acoustic sensors we used in this study require batteries to be replaced every 2 months (if measuring drop counts at 1 min intervals). A checkup and regular maintenance of the deployed sensors are recommended every month or so, but this is no different from what would be expected for other monitoring devices, such as ground climate stations. Moreover, while acoustic sensors are relatively easy to place, they can also be deployed in cities only during periods when intense short-duration rainfall bursts are anticipated, thus reducing some of the maintenance needs. Overall, it is our opinion that the advantages of using acoustic sensors to enrich an existing monitoring network or establish a new low-cost network outweigh these disadvantages.
The process of issuing a flood alert involves several steps (Fig. 3): (a) different monitoring devices are used in the area of interest to observe rainfall; (b) by combining the information from the devices, a rainfall field is constructed that estimates how rainfall is spatially distributed at a given time; (c) a nowcasting model is applied to describe how rainfall evolves in space and time within a short time frame (e.g., an hour); (d) potential flooding is assessed using the nowcasted rainfall; and (e) public flood alerts are issued when necessary.
The rainfall merging process (Fig. 3b) can benefit from the use of acoustic sensors. Rainfall information, even if indirect (i.e., expressed in drops per second and not in millimeters per hour), can contribute significantly to a better representation of rainfall's space–time variability as has been the case with weather radar observations at coarser scales (see, e.g., Sideris et al., 2014). Indeed, the merging process does not require the measurement units of the different monitoring devices to be unique. Therefore, even if rainfall information from acoustic sensors cannot be converted to rainfall intensity, it can still be merged. Acoustic sensors can also be deployed to support individual monitoring devices prior to merging (Fig. 3a). Low-cost acoustic sensors can, for example, be deployed on long commercial microwave link paths to improve the partitioning of rainfall intensities along the line. Last, acoustic sensors can potentially be used directly in flood forecasting (Fig. 3c). Theoretically, using a sufficiently large number of acoustic sensors covering a large area within and around a city, as well as using a sufficiently long training period, a machine learning model can be trained to forecast floods without the use of other rainfall monitoring devices. This could be a useful solution for many cities in low-income countries, for example, and could contribute to the WMO (2022) efforts to set up flood alerts worldwide. If acoustic sensors are to be used in future rainfall monitoring, further development of the acoustic sensors will be necessary, including minimization of recording uncertainties and the ability to transmit data in real time. Following our examination into using simple low-cost acoustic sensors, we can see the potential they hold.
The rainfall data collected by the acoustic sensors and by the meteoblue AG's rain gauges are publicly available via the following Zenodo repository: https://doi.org/10.5281/zenodo.7559671 (Peleg and Torelló-Sentelles, 2023).
The supplement related to this article is available online at: https://doi.org/10.5194/nhess-23-1233-2023-supplement.
At least one of the (co-)authors is a guest member of the editorial board of Natural Hazards and Earth System Sciences for the special issue “Hydro-meteorological extremes and hazards: vulnerability, risk, impacts, and mitigation”. The peer-review process was guided by an independent editor, and the authors also have no other competing interests to declare.
Publisher’s note: Copernicus Publications remains neutral with regard to jurisdictional claims in published maps and institutional affiliations.
This article is part of the special issue “Hydro-meteorological extremes and hazards: vulnerability, risk, impacts, and mitigation”. It is a result of the European Geosciences Union General Assembly 2022, Vienna, Austria, 23–27 May 2022.
The authors thank meteoblue AG (https://www.meteoblue.com, last access: 26 March 2023) for providing the rainfall data for the city of Zurich and Goodsell Systems Ltd. for their assistance and further developing the acoustic sensors used. We also thank Marika Koukoula, Tabea Cache, Wenyue Zou, and Zhaozhao Zeng for their assistance deploying the sensors in Zurich and Milan.
Nadav Peleg and Herminia Torelló-Sentelles were supported by the Swiss National Science Foundation (SNSF), grant no. 194649 (“Rainfall and floods in future cities”). Francesco Marra was partially supported by the Cariparo Foundation through the Excellence Grant 2021 to the “Resilience” project.
This paper was edited by Paolo Tarolli and reviewed by two anonymous referees.
Ali, H., Peleg, N., and Fowler, H. J.: Global Scaling of Rainfall With Dewpoint Temperature Reveals Considerable Ocean-Land Difference, Geophys. Res. Lett., 48, e2021GL093798, https://doi.org/10.1029/2021GL093798, 2021. a
Benoit, L., Allard, D., and Mariethoz, G.: Stochastic Rainfall Modeling at Sub-kilometer Scale, Water Resour. Res., 54, 4108–4130, https://doi.org/10.1029/2018WR022817, 2018. a, b, c
Bowler, N. E., Pierce, C. E., and Seed, A. W.: STEPS: A probabilistic precipitation forecasting scheme which merges an extrapolation nowcast with downscaled NWP, Q. J. Roy. Meteorol. Soc., 132, 2127–2155, https://doi.org/10.1256/qj.04.100, 2006. a
Cristiano, E., ten Veldhuis, M.-C., and van de Giesen, N.: Spatial and temporal variability of rainfall and their effects on hydrological response in urban areas – a review, Hydrol. Earth Syst. Sci., 21, 3859–3878, https://doi.org/10.5194/hess-21-3859-2017, 2017. a
Dunkerley, D.: Acquiring unbiased rainfall duration and intensity data from tipping-bucket rain gauges: A new approach using synchronised acoustic recordings, Atmos. Res., 244, 105055, https://doi.org/10.1016/j.atmosres.2020.105055, 2020. a
Dunkerley, D.: Acoustic methods in physical geography: Applications and future development, Progress in Physical Geography: Earth and Environment, 47, 74–104, https://doi.org/10.1177/03091333221111480, 2022. a
Gray, J., Hage, K. D., and Mary, H. W.: An automatic sequential rainfall sampler, Rev. Sci. Instrum., 45, 1517–1519, https://doi.org/10.1063/1.1686550, 1974. a
Huang, J., Fatichi, S., Mascaro, G., Manoli, G., and Peleg, N.: Intensification of sub-daily rainfall extremes in a low-rise urban area, Urban Climate, 42, 101124, https://doi.org/10.1016/j.uclim.2022.101124, 2022. a
Kampwerth, D. H. and Rasmussen, R. A.: Verification of Rainfall Estimates: An Analysis of Activation Patterns of ADSID and Acousid Seismic and Acoustic Intrusion Sensors to Determine Rainfall Rates, Technical report AWS-TR-74-253, 36 pp., Weather Wing (6TH), 1974. a
Kreibich, H., Bubeck, P., Kunz, M., Mahlke, H., Parolai, S., Khazai, B., Daniell, J., Lakes, T., and Schröter, K.: A review of multiple natural hazards and risks in Germany, Nat. Hazards, 74, 2279–2304, https://doi.org/10.1007/s11069-014-1265-6, 2014. a
Ochoa-Rodriguez, S., Wang, L.-P., Gires, A., Pina, R. D., Reinoso-Rondinel, R., Bruni, G., Ichiba, A., Gaitan, S., Cristiano, E., van Assel, J., Kroll, S., Murla-Tuyls, D., Tisserand, B., Schertzer, D., Tchiguirinskaia, I., Onof, C., Willems, P., and ten Veldhuis, M.-C.: Impact of spatial and temporal resolution of rainfall inputs on urban hydrodynamic modelling outputs: A multi-catchment investigation, J. Hydrology, 531, 389–407, https://doi.org/10.1016/j.jhydrol.2015.05.035, 2015. a
Paprotny, D., Sebastian, A., Morales-Nápoles, O., and Jonkman, S. N.: Trends in flood losses in Europe over the past 150 years, Nat. Commun., 9, 1985, https://doi.org/10.1038/s41467-018-04253-1, 2018. a
Peleg, N. and Torelló-Sentelles, H.: Rainfall data monitored by acoustic sensors in Zurich and Milan during spring and summer 2022, Zenodo [data set], https://doi.org/10.5281/zenodo.7559671, 2023. a
Peleg, N., Marra, F., Fatichi, S., Paschalis, A., Molnar, P., and Burlando, P.: Spatial variability of extreme rainfall at radar subpixel scale, J. Hydrol., 556, 922–933, https://doi.org/10.1016/j.jhydrol.2016.05.033, 2018. a
Peleg, N., Ban, N., Gibson, M. J., Chen, A. S., Paschalis, A., Burlando, P., and Leitao, J. P.: Mapping storm spatial profiles for flood impact assessments, Adv. Water Resour., 166, 104258, https://doi.org/10.1016/j.advwatres.2022.104258, 2022. a
Richardson, D., Neal, R., Dankers, R., Mylne, K., Cowling, R., Clements, H., and Millard, J.: Linking weather patterns to regional extreme precipitation for highlighting potential flood events in medium- to long-range forecasts, Meteorol. Appl., 27, e1931, https://doi.org/10.1002/met.1931, 2020. a
Rözer, V., Peche, A., Berkhahn, S., Feng, Y., Fuchs, L., Graf, T., Haberlandt, U., Kreibich, H., Sämann, R., Sester, M., Shehu, B., Wahl, J., and Neuweiler, I.: Impact-Based Forecasting for Pluvial Floods, Earth's Future, 9, 2020EF001851, https://doi.org/10.1029/2020EF001851, 2021. a
Sideris, I. V., Foresti, L., Nerini, D., and Germann, U.: Real‐time radar–rain‐gauge merging using spatio‐temporal co‐kriging with external drift in the alpine terrain of Switzerland, Q. J. Roy. Meteor. Soc., 140, 1097–1111, https://doi.org/10.1002/qj.2188, 2014. a
Sideris, I. V., Foresti, L., Nerini, D., and Germann, U.: NowPrecip: localized precipitation nowcasting in the complex terrain of Switzerland, Q. J. Roy. Meteor. Soc., 146, 1768–1800, https://doi.org/10.1002/qj.3766, 2020. a
Stewart, I. D. and Oke, T. R.: Local Climate Zones for Urban Temperature Studies, B. Am. Meteorol. Soc., 93, 1879–1900, https://doi.org/10.1175/BAMS-D-11-00019.1, 2012. a
Trono, E., Guico, M., Libatique, N., Tangonan, G., Baluyot, D., Cordero, T., Geronimo, F., and Parrenas, A.: Rainfall monitoring using acoustic sensors, in: TENCON 2012 IEEE Region 10 Conference, Cebu, Philippines, 19–22 November 2012, IEEE, 1–6, https://doi.org/10.1109/TENCON.2012.6412284, 2012. a
Uijlenhoet, R., Overeem, A., and Leijnse, H.: Opportunistic remote sensing of rainfall using microwave links from cellular communication networks, WIREs Water, 5, e1289, https://doi.org/10.1002/wat2.1289, 2018. a
Westra, S., Fowler, H. J., Evans, J. P., Alexander, L. V., Berg, P., Johnson, F., Kendon, E. J., Lenderink, G., and Roberts, N. M.: Future changes to the intensity and frequency of short-duration extreme rainfall, Rev. Geophys., 52, 522–555, https://doi.org/10.1002/2014RG000464, 2014. a
WMO: Early warning systems must protect everyone within five years, https://public.wmo.int/en/media/press-release/%E2%80%8Bearly-warning-systems-must-protect-everyone-within-five-years (last access: 23 March 2023), 2022. a, b
- Abstract
- Introduction
- Acoustic rainfall sensors
- Monitoring rainfall using acoustic sensors
- The added value of acoustic sensors in rainfall monitoring
- Future implementation in early warning systems
- Data availability
- Author contributions
- Competing interests
- Disclaimer
- Special issue statement
- Acknowledgements
- Financial support
- Review statement
- References
- Supplement