the Creative Commons Attribution 4.0 License.
the Creative Commons Attribution 4.0 License.
 | 21 Mar 2023
Deadly disasters in southeastern South America: flash floods and landslides of February 2022 in Petrópolis, Rio de Janeiro
José A. Marengo
José Mantovani
Luciana R. Londe
Rachel Lau Yu San
Edward Park
Yunung Nina Lin
Jingyu Wang
Tatiana Mendes
Ana Paula Cunha
Luana Pampuch
Marcelo Seluchi
Silvio Simões
Luz Adriana Cuartas
Demerval Goncalves
Klécia Massi
Regina Alvalá
Osvaldo Moraes
Carlos Souza Filho
Rodolfo Mendes
Carlos Nobre
On 15 February 2022, the city of Petrópolis in the highlands of the state of Rio de Janeiro, Brazil, received an unusually high volume of rain within 3 h (258 mm), generated by a strongly invigorated mesoscale convective system. It resulted in flash floods and subsequent landslides that caused the deadliest landslide disaster recorded in Petrópolis, with 231 fatalities. In this paper, we analyzed the root causes and the key triggering factors of this landslide disaster by assessing the spatial relationship of landslide occurrence with various environmental factors. Rainfall data were retrieved from 1977 to 2022 (a combination of ground weather stations and the Climate Hazards Group InfraRed Precipitation – CHIRPS). Remotely sensed data were used to map the landslide scars, soil moisture, terrain attributes, line-of-sight displacement (land surface deformation), and urban sprawling (1985–2020). The results showed that the average monthly rainfall for February 2022 was 200 mm, the heaviest recorded in Petrópolis since 1932. Heavy rainfall was also recorded mostly in regions where the landslide occurred, according to analyses of the rainfall spatial distribution. As for terrain, 23 % of slopes between 45–60∘ had landslide occurrences and east-facing slopes appeared to be the most conducive for landslides as they recorded landslide occurrences of about 9 % to 11 %. Regarding the soil moisture, higher variability was found in the lower altitude (842 m) where the residential area is concentrated. Based on our land deformation assessment, the area is geologically stable, and the landslide occurred only in the thin layer at the surface. Out of the 1700 buildings found in the region of interest, 1021 are on the slope between 20 to 45∘ and about 60 houses were directly affected by the landslides. As such, we conclude that the heavy rainfall was not the only cause responsible for the catastrophic event of 15 February 2022; a combination of unplanned urban growth on slopes between 45–60∘, removal of vegetation, and the absence of inspection were also expressive driving forces of this disaster.
- Article
(7583 KB) - Full-text XML
- BibTeX
- EndNote


The municipality of Petrópolis is nestled in the mountains, 68 km from the city of Rio de Janeiro. It presents a rugged relief with numerous cliffs, and it is populated by approximately 305 687 inhabitants. The city is predominantly urban (IBGE: https://cidades.ibge.gov.br/brasil/rj/petropolis/panorama, last access: 23 May 2022) (95.1 %) (Fig. 1). It has been ravaged yet again by mudslides and floods on February, 2022, when heavy rains triggered landslides that left hundreds dead or missing. On that day, there was an unusually high amount of rain within 3 h, 258 mm, as measured by rain gauges in the city. This was more than the prior 30 d accumulated rainfall and triggered the worst case of heavy rainfall in the city since 1932; these data were obtained by INMET (Brazilian Institute of Meteorology) using data from a rain gauge in Petrópolis (number 83804), which operates from 1 October 1912, to 1 August 1960. According to the National Center for Monitoring and Early Warning of Natural Disasters (Cemaden, http://www.cemaden.gov.br, last access: 7 June 2022), 250 mm of rain was recorded between 16:20 and 19:20 UTC (February climatology is 185 mm). The previous record occurred in January 2011, with accumulated rainfall on the order of 241.8 mm in 24 h and a peak of 61.8 mm in 1 h (Dourado et al., 2012).
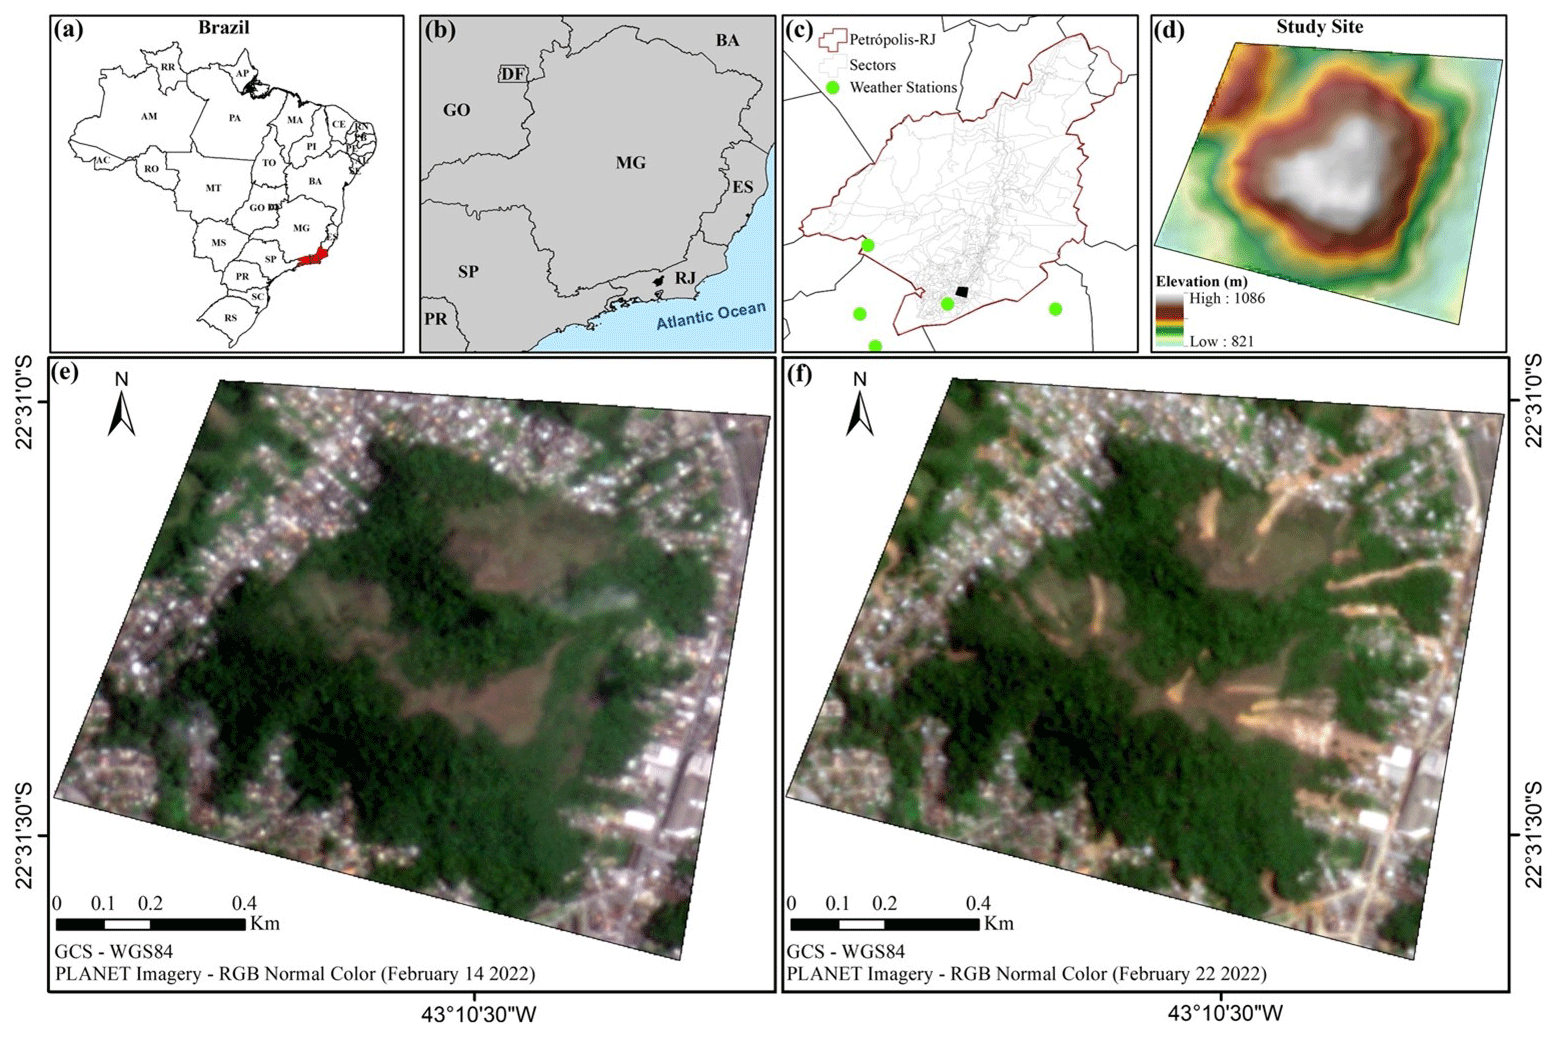
Figure 1Petrópolis and the study site. (a) Location of the state of Rio de Janeiro in Brazil, (b) location of the study site in the state of Rio de Janeiro. Panels (a)–(b) were based on the Brazilian Institute of Geography and Statistics (IBGE). (c) Location of the study site in the city of Petrópolis and the position of weather stations and (d) elevation map of the study site (ALOS PALSAR, https://asf.alaska.edu/data-sets/sar-data-sets/alos-palsar/, last access: 10 May 2022). (e) Planet image natural color from 14 February 2022 and (f) Planet image natural color from 22 February 2022.
The abundant precipitation caused flash floods and mudslides in various sectors of the city, tearing down dozens of homes on the hillsides and causing floods in the streets. Images and videos on social media showed rivers of mud rushing through the city's streets, sweeping away cars, trees, and people in its way. According to CNN (https://edition.cnn.com/2022/02/17/world/gallery/brazil-landslides/index.html, last access: 23 May 2022) and CPRM (2022), Brazil's Civil Defense Secretariat reported 269 landslides during this event. By the end of February, the death toll had risen to 231 (https://floodlist.com/america/brazil-floods-landslides-petropolis-february-2022, last access: 23 May 2022).
While this is the deadliest flood and mudslide in the history of Petrópolis, heavy rains are not uncommon during Brazil's austral summer months (November to March; warm/rainy season).
According to Guerra (1995), Petrópolis was impacted by 1161 catastrophic events between 1940 and 1990, which include landslides, mudslides, rockfalls, and floods. Most of these events were caused by torrential precipitation. The number of deaths appears to increase over time, and nearly 90 % of the events occurred within urban areas. Moreover, the human fatalities are also found to directly correlate with the spread of new urban settlements onto steep deforested hillsides. These disasters were responsible for the deaths of 526 people in the last 50 years, though seemingly worse over the last 20 years with 300 deaths.
On 5 February 1988, it poured rain in Petrópolis, which partially destroyed the city. This tragedy caused 171 deaths, leaving more than 4000 people homeless and thousands injured (Guerra, 1995). On 5 April 2010, precipitation in Rio de Janeiro was the highest recorded in the past 30 years: weather stations recorded 288 mm within 24 h, well over the average rainfall amount for April (140 mm). It caused 52 fatalities in the city of Rio de Janeiro, and the total death count in the state was over 200. Approximately 160 others were injured and 15 000 had to leave their homes across the state. By the time the rain stopped, several days later, 12 000 people were homeless (https://www.france24.com/en/20100406-rio-de-janeiro-flooding-death-toll-passes-100, last access: 23 May 2022).
The January 2011 disaster was one with the highest impact in the history of disasters in Brazil (Rosi et al., 2019). With over 260 mm pouring down in less than 24 h, the rain triggered a series of mudslides throughout the região serrana (mountainous region) northwest of the state of Rio de Janeiro, causing death and destruction in five nearby cities: Teresópolis, Petrópolis, Nova Friburgo, Sumidouro, and São José do Vale do Rio Preto. Nova Friburgo and Teresópolis each counted over 250 deaths with the final death toll of 900 and 300 still missing in the região serrana. In Teresópolis alone, 1000 people were left without homes (Rosi et al., 2019) and claimed the lives of 73 people in Petrópolis (Marengo and Alves, 2012). Such precipitation occurred because of the formation of an intense episode of rainfall generated by the action of the South Atlantic Convergence Zone (SACZ) that was intensified by a deep trough on the southeastern coast of Brazil. The SACZ is a typical meteorological system of the rainy season in the central area of Brazil, which normally develops between November and March. The scale of the disaster brought attention to the rapid urbanization, infrastructure, and housing rights issues within the context of disasters in Rio de Janeiro and Brazil, leading to the modernization of the civil defense structure in Brazil and the creation of CEMADEN.
Once again, on 20 March 2022, torrential rains caused flooding and landslides in the metropolitan area of Petrópolis and surrounding areas of the mountainous region of the state of Rio de Janeiro (https://floodlist.com/america/brazil-floods-landslides-petropolis-march-2022, last access: 20 April 2022). Petrópolis Civil Defense reported 415 mm of rain in the São Sebastião district in just 10 h, with 217.4 mm of that total falling in a 4 h period between 14:00 and 18:00 UTC. Around 100 incidents of landslides and floods have been reported across the city, including flooded roads and buildings damaged or destroyed, as well as seven deaths.
The above examples demonstrated the adverse impacts of extreme weather and subsequent landslides on the people of Petrópolis and highlight the importance of assessing the causes of these landslides for future disaster management. Therefore, this study aims to better understand the main triggers for landslides and flash floods in Petrópolis, specifically for the disaster in February 2022. To achieve this objective, we performed an integrated analysis of the urban sprawl over exposed areas, removal of vegetation, and shallow saturated soil.
2.1 Study area
Petrópolis is located within the Atlantic Forest biome, a biodiversity hotspot (Myers et al., 2000) (Fig. 1). Currently, only 13 % of the original cover remains (Fundação SOS Mata Atlântica, 2018), due to intense deforestation and human disturbance that mostly occurred in the first half of the 19th century (Dean, 1996). Historically, land degradation in the region is associated with a combination of different geomorphic processes, deforestation overexploitation (Nehren et al., 2018), and urban expansion (Guerra, 1995; Rosi et al., 2019).
Petrópolis is geologically located in the Rio Negro Complex, of Paleoproterozoic origin, formed mainly by migmatites and granitoids. This part of the state of Rio de Janeiro suffered the effects of several regional metamorphic phases, resulting in highly foliated rocks cut by large ductile shear zones. These rocks are severely sectioned by fractures and faults of regional extension, with a strong reflection on topography since the entire region was submitted to tectonic events during the Precambrian period (Penha et al., 1981; Fonseca et al., 1998; Gonçalves, 1998; IBGE 2018; Rosi et al., 2019). The drainage network of the region is strongly influenced by brittle regional structures, which play an essential role in its organization and the relief pattern and modeling. This set of geological characteristics, such as highly foliated and fractured rocks, triggers mass movements, mainly shallow landslides, and debris flow. Processes of folding, fault reactivation, and block remobilization resulted in Petrópolis's terrain (Gonçalves, 1998), which produced braided drainage pattern, with elongated hills which separate valleys. The soil is mostly occupied by clay with low fertility, is well drained, and has high aluminum saturation (Carvalho-Filho et al., 2000).
2.2 Rainfall data and analysis
To identify the extreme rainfall event in the municipality of Petrópolis on 15 February 2022, different precipitation datasets were retrieved from INMET and CEMADEN station data. CEMADEN has 17 rain gauges installed in Petrópolis, with measurements available from 2015 onwards, although some stations have a large amount of missing data for long periods, especially in the early years of the series. CEMADEN also has five geotechnical stations, installed at the end of 2021, consisting of sensors that monitor rainfall and soil moisture at different depths (0.5 to 3.0 m).
At the local scale, ground rain gauges provide direct-point estimations necessary for extreme rainfall analysis. However, a long precipitation time series is required for studying the extreme rainfall event in Petrópolis. Since there is no single weather station with enough temporal coverage, rainfall data from five different weather stations located up to 15 km from the highest accumulated rainfall location (Fig. 1c) were considered. The hourly rain gauge observations from June 1976 to February 2022 were obtained from the Rio de Janeiro State Environmental Institute – Inea (http://www.inea.rj.gov.br/ar-agua-e-solo/monitoramento-hidrometeorologico/, last access: 10 May 2022) and the Cemaden (https://www.gov.br/cemaden/pt-br, last access: 10 May 2022) databases.
While we initially considered using satellite-based products for studying rainfall, it proved to be inaccurate; thus, this approach was not carried on. Gridded data for global (Climate Hazards Group InfraRed Precipitation – CHIRPS; Funk et al., 2015) and regional domains (Satellite-based Global Precipitation Measurement (GPM) – Integrated Multi-satellite Retrievals for GPM (IMERG) combined with data from surface observations – MERGE, from the Center for Weather Forecasts and Climate Studies – CPTEC; Rozante et al., 2010) were found to exhibit poor capabilities in capturing the extreme rainfall event in Petrópolis (Huffman et al., 2020; Reis et al., 2020). Both products underestimated the storm-accumulated rainfall by 90 % on 15 February 2022, throughout the study site. Previous studies have also shown that retrieving rainfall extremes from satellite-based products can present certain uncertainties concerning accuracy probability due to instrument issues and retrieval algorithms or the interpolation process (Dembélé and Zwart, 2016; Hermance and Sulieman, 2018; Jiang and Bauer-Gottwein, 2019).
To examine the synoptic weather pattern that spawned the mesoscale convective system (MCS) with unprecedented torrential rainfall, the fifth generation of atmospheric reanalysis (ERA5) produced by European Centre for Medium-Range Weather Forecasts (ECMWF; Hersbach et al., 2020) is adopted for the analysis of the atmospheric environment. ERA5 features a horizonal resolution of 31 km and 137 vertical levels with hourly output frequency, which provides a detailed picture of the MCS-hatching synoptic background. Meanwhile, the morphology and organization of high-precipitation MCS is analyzed using the National Aeronautics and Space Administration (NASA) merged geostationary satellite half-hourly 4 km resolution infrared brightness temperature data (merged IR; Janowiak et al., 2017).
2.3 Terrain analysis using DEM
The terrain morphology of Petrópolis could have also influenced the slope stability (Costanzo et al., 2012), causing certain areas to be more susceptible to landslides than others. Terrain attributes widely used in landslide susceptibility assessments include elevation, slope angle, aspect, and curvature (Catani et al., 2013; Chen et al., 2017; Reichenbach et al., 2018; Dias et al., 2021). Different elevation creates diverse environmental conditions in temperature, rainfall regimes, and vegetation (Dai and Lee, 2002; Costanzo et al., 2012; Catani et al., 2013), which also influence human development (Chau and Chan, 2005). Slope angle affects the shear stress acting on the slope and has been considered one of the biggest determinants for landslide occurrences (Catani et al., 2013; Kanwal et al., 2017). Slope aspect refers to the direction of a slope and determines sunlight exposure, often correlating with moisture retention and vegetation cover and consequently landslide initiation (Guzzetti et al., 1999; Dai and Lee, 2002). Slope curvature is the rate of change of the slope, and this controls the direction of landslide motion by concentrating or dispersing surface runoff and gravitational stresses (Ohlmacher, 2007; Costanzo et al., 2012).
To assess the effects of terrain morphology on this landslide event, the digital elevation model (DEM) was obtained from ALOS PALSAR, available at the Alaska Satellite Facility (ASF). ALOS PALSAR images were resampled (cubic interpolation) from 30 to 12.5 m pixel size with orthometric altitude (EGM96 geoid model) before being converted to a geometrical altitude (ellipsoidal). The following terrain attributes were derived from the DEM: slope angle, slope aspect, and slope curvature. The spatial variation of the three slope attributes within this landslide extent was assessed. The slope angle was classified into five classes: 0–15, 15–25, 25–35, 35–45, and 45–60∘. Slope aspect was categorized into classes of 45∘ (Table 1).
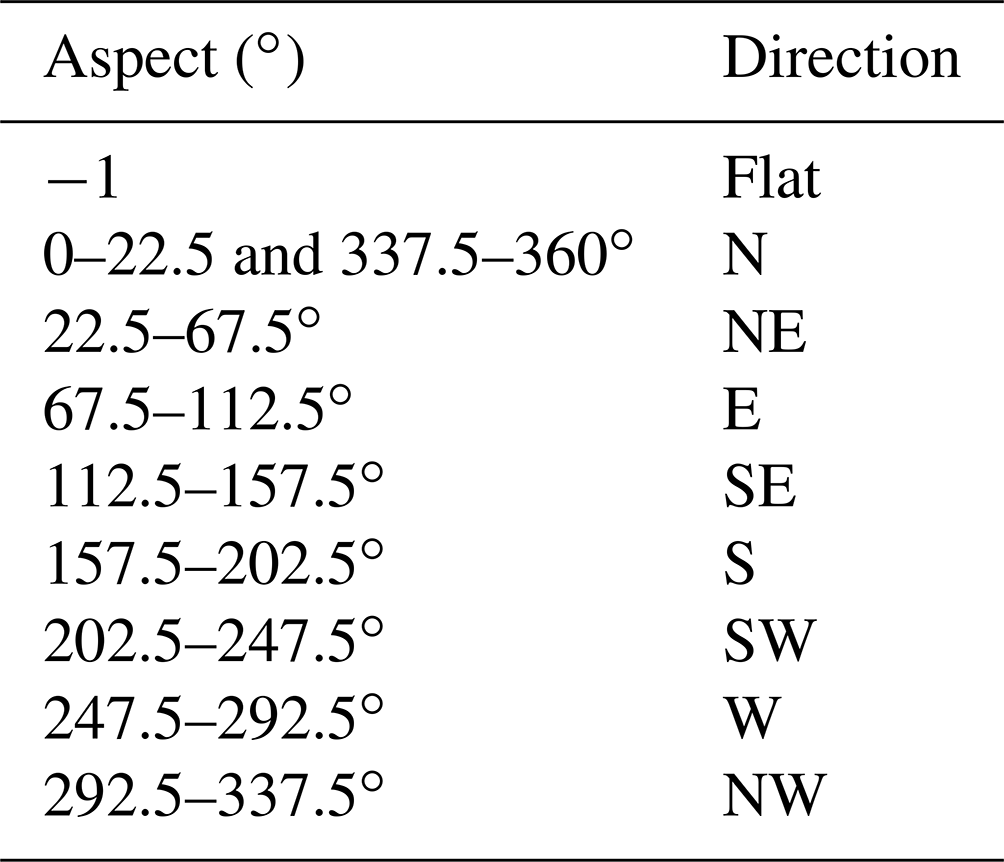
Slope curvature was reclassed into three categories – upwardly convex (negative), flat (zero), and upwardly concave (positive). To account for the slope morphology of the entire study area, the landslide extent within each class of slope angle, aspect, and curvature was calculated in terms of proportion to the study area.
2.4 Optical remote sensing data and soil moisture pattern
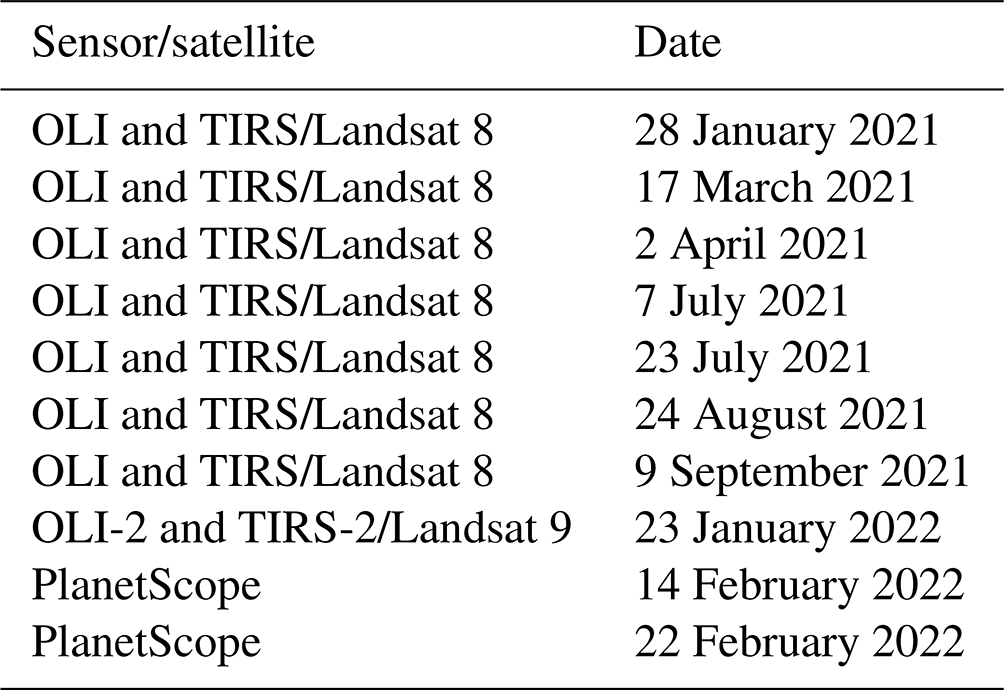
Soil moisture was analyzed through images from the Operational Land Imager (OLI) and the Thermal Infrared Sensor (TIRS) on board of the Landsat 8 and 9 satellites. Images from the Planet satellites were also selected (see Table 2). Images from Landsat satellites are surface reflectance products at 30 m resolution, which were obtained from the USGS Earth Explorer site (https://earthexplorer.usgs.gov, last access: 1 May 2022). The Planet constellation consists of more than 130 orbital Earth observation satellites acquiring daily images of the Earth on four bands in the visible and near-infrared wavelength range at 3–0 m spatial resolution.
The soil moisture index (SMI; Lambin and Ehrlich, 1996; Zhan et al., 2004) was used to reconstruct the dynamics of soil moisture from 2021 to the beginning of 2022. This index can be estimated from land surface temperature (LST) and normalized difference vegetation index (NDVI). According to Lambin and Ehrlich (1996), the scatterplot of LST vs. NDVI results in a trapezoidal shape, and all types of land cover fall within the trapezoid of the LST–NDVI space. The upper envelope of the trapezoid (upper limit of surface temperature for a given vegetation cover) represents the dry condition (warm edge), while the lower limit represents the wet condition (cold edge) (Parida et al., 2008).
Landsat 8 and 9 images were used to calculate the SMI. OLI/Landsat 8 and 9 Level-2 satellite images were obtained at the USGS Earth Explorer website (https://earthexplorer.usgs.gov) from 2021 to 2022. Level-2 data are atmospherically corrected and generated from the LASRC (Landsat 8 Surface Reflectance Code), which yields surface reflectance at a 30 m spatial resolution suitable for studying the dynamics of our study site (Silva et al., 2017). OLI images were used to calculate the NDVI, whereas TIRS/Landsat 8 and 9 were used to calculate LST. SMI values, at a range between 0 (drier soil) and 1 (wet soil), are calculated according to Zhan et al. (2004):
where LSTmax and LSTmin are, respectively, the maximum and minimum values of LST within the image for a given NDVI, expressed as
where a and b are empirical parameters defining the dry and wet edges modeled as a linear fit to the data (Parida et al., 2008).
2.5 Interferometric synthetic aperture radar (InSAR) analysis of ground deformation
Ground deformation was studied using a multi-temporal interferometric synthetic aperture radar (MTInSAR) time-series analysis. C-band Sentinel-1B SAR data of descending path 155 acquired between 8 May 2015 and 20 December 2021 were collected and processed in InSAR Scientific Computing Environment (ISCE) to form a coregistered stack of single look complex (SLC) images. No new images were acquired between 21 December 2021 and 22 February 2022, due to the Sentinel-1B anomaly, meaning that there are no data acquired right before and after the landslides in mid-February 2022. The coregistered SLC stack is then processed in Fine Resolution InSAR using Generalized Eigenvectors (FRInGE; Fattahi et al., 2019) to form a wrapped phase time series via a phase linking approach (Ansari et al., 2018), which is then unwrapped epoch by epoch using SNAPHU to generate the final displacement time series (Chen and Zebker, 2001). Tropospheric correction is carried out on the displacement time series using the ERA5 weather model (Jolivet et al., 2014). Line-of-sight (LOS) velocities and velocity errors are then estimated using the L1-norm iteratively reweighted least squares algorithm (Schlossmacher, 1973).
2.6 Mapping urban sprawling and forest losses
The urban sprawl analysis was performed using data available at the MapBiomas project – Collection 6 (http://mapbiomas.org, last access: 1 May 2022), with spatial resolution at 30 m. The MapBiomas project provides a historical series of land use and land cover (LULC) information and the transition data between 1985 and 2020 to the whole country, based on a random forest algorithm applied to Landsat archive using Google Earth Engine (Souza et al., 2020). The LULC data of eight years (1985, 1990, 1995, 2000, 2005, 2010, 2015, and 2020) were analyzed focusing on the urban area and forest formation classes to observe the growth of occupation in the Petrópolis municipality and the area of interest (AOI, see Fig. 1f). Urban sprawl and loss of vegetation (suppressed forest) were visual and quantitatively analyzed through the transition data for seven 5-year periods, from 1985 to 2020. According to Pisano et al. (2017) land cover can be considered the most important conditioning factor in landslide susceptibility analysis.
2.7 Deriving the landslide scar map
The building footprints were compared to landslide scars to quantify either impacted or destroyed buildings because of this event. Moreover, these building footprints were confronted with the slope data to obtain the slope range they occupy on the hill. The building footprints were obtained by the OpenStreetMap (OSM) database. The OSM is a crowdsourced mapping project that aims to create and provide a freely available geographical information database of the world (Minghini and Frassinelli, 2019; Goldblatt et al., 2020). The mapping of this area was performed as an urgent project after the event on 17 February, which resulted in flooding and landslides in several parts of the municipality.
3.1 Synoptic background analysis
Right before the onset of record-breaking rainfall, central Brazil was dominated by a widespread subtropical high-pressure center at 500 hPa level (Fig. 2a), whose southern boundary pushed to 22∘ S parallel above Petrópolis. As revealed in many previous studies (e.g., Maddox et al., 1978; Mitchell et al., 1995; Wang et al., 2019), the atmosphere directly under the subtropical high-pressure center is most stable because a subsidence inversion layer (capping inversion) is formed as a result of widespread descending air. However, the atmosphere becomes more unstable toward the edge of the high pressure because of the weakening inversion, which promotes the occurrence of convection. Consequently, a ring of precipitation area commonly forms at the periphery of the high pressure, known as a “ring of fire” pattern (Galarneau and Bosart, 2006). The 850 hPa specific-humidity distribution (Fig. 2b) echoes this pattern, as the warm and moist air is being pushed southeastward towards the edge of the subtropical high, and the moisture is further advected to Petrópolis, which fuels the convection there. Figure 2c exhibits the concurrent cloud distribution, where the cold colors (< 241 K) represent the presence of deep clouds whose cloud top temperature is cooler than the surrounding area without clouds, and an MCS is formed over Petrópolis. In addition to the influence of the high-pressure center, the MCS that affects Petrópolis is further intensified by a long-wave trough as indicated in Fig. 2a. The city is located at the bottom of the 500 hPa trough where there is a strong lifting of air that facilitates the intensification of convection. In summary, the edge of a subtropical high intersects with a long-wave trough over Petrópolis, forming a very favorable environment for the occurrence of high-precipitation MCS, which later produced the unprecedented torrential rainfall that caused the flood and landslide.
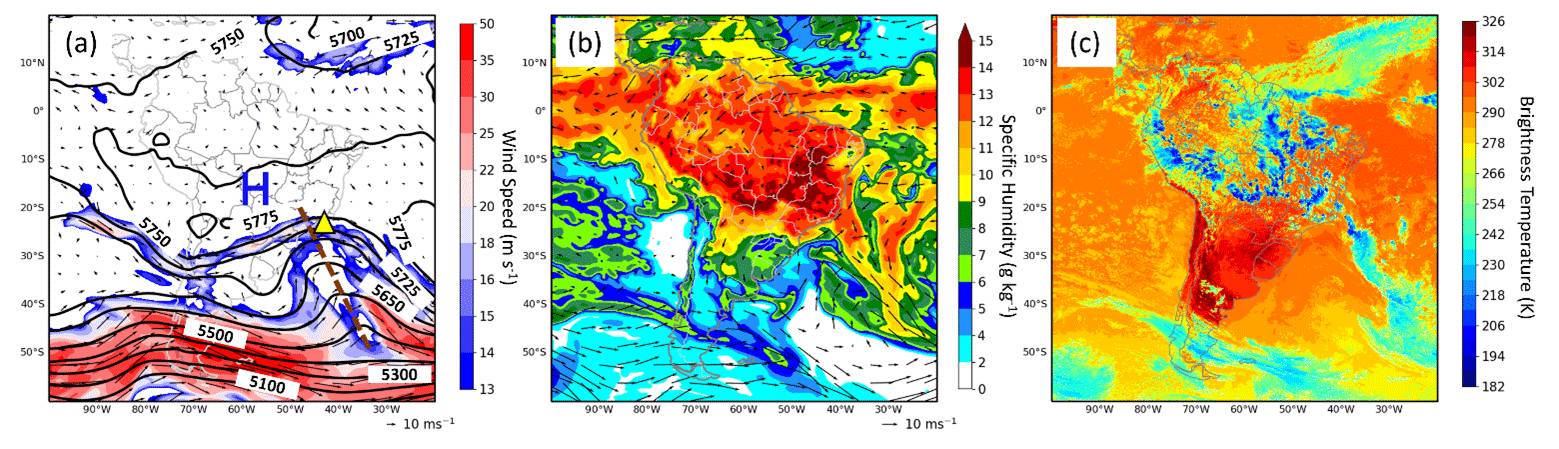
Figure 2Large-scale environmental variables and satellite observation at 16:00 LT. (a) Wind speed (shading), geopotential height (contour), and winds (arrow) at 500 hPa, where the trough line is indicated using a dashed brown line and the location of Petrópolis is highlighted by a yellow triangle. (b) Specific humidity (shading) and winds (arrow) at 850 hPa. (c) Merged IR brightness temperature, where cold color represents the presence of deep clouds.
3.2 Rainfall variability
Figure 3 shows the January–February daily rainfall distribution from 1977 to 2022. By comparing the shape of the boxplot for 2022 with the other years, the third quartile of 2022 was observed to be the biggest of the time series (22.35 mm). It indicates that in January and February 2022, 25 % of the days accumulated daily precipitation higher than 22.35 mm; 2022 also registered three outliers (circles). Compared with the other years, this number is not so expressive, but the records stand out for being abnormally high (rainfall accumulated of 88.8, 219.6, and 260 mm in one day). In 2022, the most intense outliers were also higher than in all other years of the series (only four events greater than 189.6 mm) (Fig. 3). The value registered on 15 February 2022 (260 mm) is the second largest value for that month in the 46-year series.

Figure 3The long-term precipitation time series was created from two weather stations from INMET (A603 – Duque de Caxias and A610 – Pico do Couto), two weather stations from INEA (2243238 – Xeren and 2243235 – Andorinhas), and one from Cemaden (São Sebastião).
An intense rainfall, starting on the evening of 15 February 2022, caused mudslides on the hillsides above downtown Petrópolis and produced flooding that did more damage in the streets below. Images and videos on social media showed rivers of mud rushing through the city's streets, sweeping everything along the way: cars, buses, trees, and sometimes people. Petrópolis recorded 252.8 mm of rain in just 3 h on 15 February (São Sebastião station – 330390604G) (locations 1 and 2 in Fig. 5). The average for the entire month of February is approximately 200 mm. Landslides and flooding events in Rio de Janeiro happen most frequently during the rainy season (from December to April austral summer). Such hourly rates and amounts have not been recorded in Brazil and are rare even for other parts of the world.
From our results, the mean precipitation for the region in January is 304.19 mm, while in February it is 229.28 mm (Fig. 4). January 2022 registered an accumulated rainfall of 581.4 mm, the second biggest value in entire series. In February, the accumulated rainfall was 650 mm, the largest value for the 46-year series and considered an outlier for the month (circle).
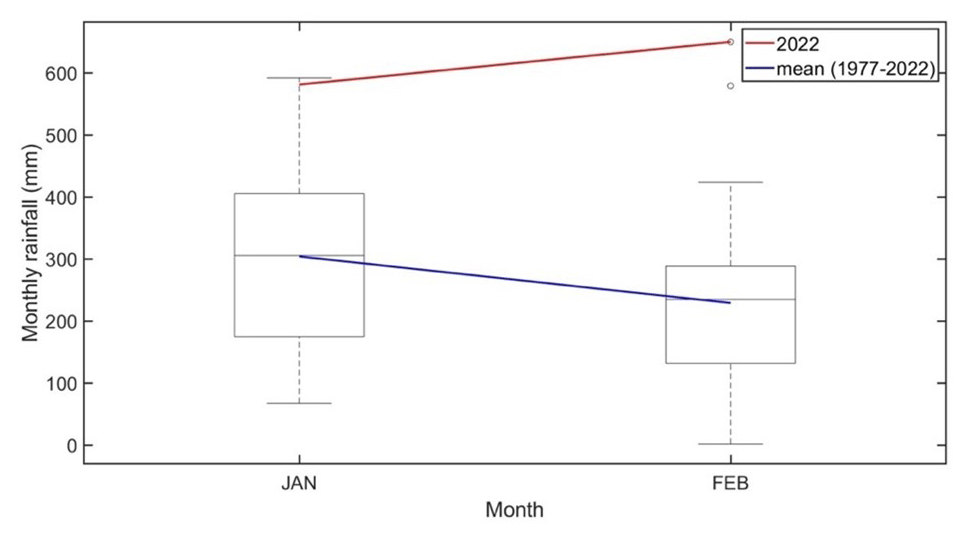
Figure 4January and February rainfall (mm) distribution (boxplot) for 1977–2022. The blue line indicates the mean value for the 1977–2022 period (for the months of January and February), and the red line represents the accumulated rainfall for 2022. Circles represent outliers.
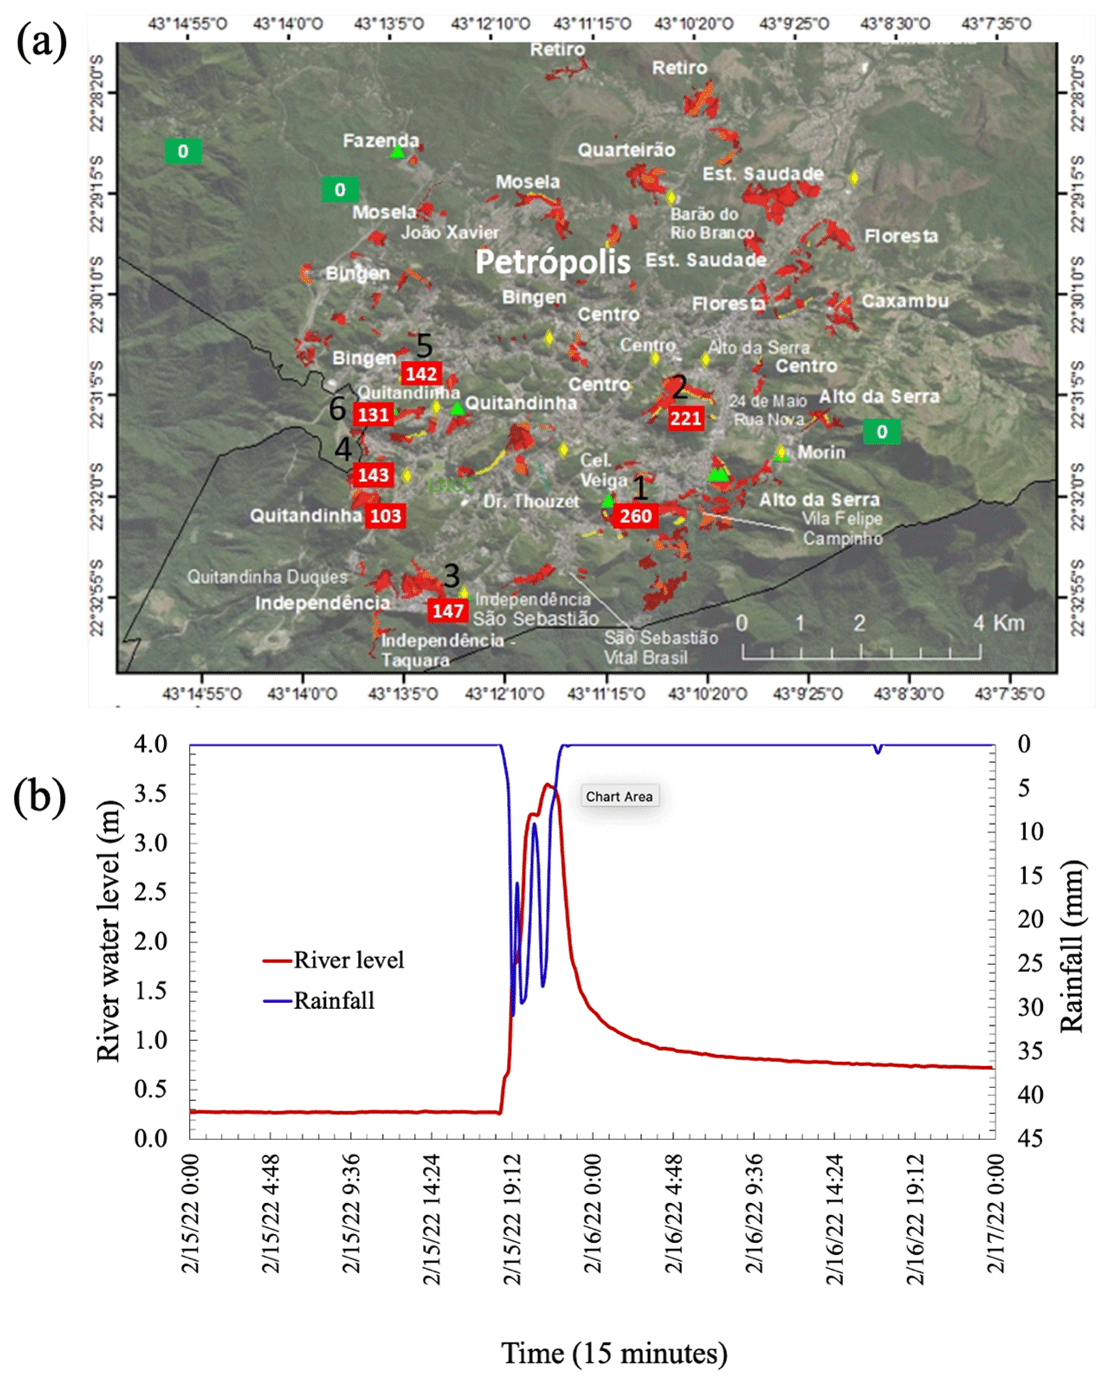
Figure 5(a) Accumulated precipitation in 24 h on 15 February 2022 at CEMADEN rain gauges. Red contours correspond to areas of risk for landslides at Petrópolis. The black line indicates the municipality limit. The cartographic base was obtained from © OpenStreetMap contributors 2022. Distributed under the Open Data Commons Open Database License (ODbL) v1.0. (b) Rainfall (blue) and river level (red) time series for 15 February 2022 time event, at Alto da Serra hydrological station (INEA).
For the 15 February 2022, event, Fig. 4a depicts the station-based 24 h accumulated rainfall over Petrópolis. The highest rainfall accumulation was observed at São Sebastião station (330390604G), flagged as “1” in Fig. 5.
It recorded about 260 mm in 24 h and approximately 230 mm in two 3 h intervals from 16:00 to 21:00 LT (local time). Another nearby station – Dr. Thouzet (330390603G) – also registered 221 mm in 24 h (flagged as “2” in Fig. 4). Other stations registered the following: Independencia 2 (330390612A), 147 mm (“3” in Fig. 4), Quitandinha (330390601G), 143 mm (“4” in Fig. 4), Bingen (30390605G), 142 mm (“5” in Fig. 4) and Rua Amazonas/Quitandinha (330390618A), 131 mm (“6” in Fig. 4). The INEA hydrological station, Alto da Serra (2243315), was the only one with available data for this event. The peak level was 3.59 m (Fig. 4b) for an accumulated rainfall of 207 mm until the peak (the total rainfall was 223 mm). The maximum peak previously registered was 2.58 m on 18 March 2013 (data period 2012–2021), for accumulated rainfall of 186 mm. It is noteworthy that a heavy precipitation particularly affected the urban part of the city, where risk areas are located. Further away, over the rural part of the municipality, no rainfall was recorded.
3.3 Characterization of the terrain to assess landslide susceptibility
Located in the mountainous regions, Petrópolis is at a relatively high elevation, 953.5 m from 821 to 1086 m (Fig. 6a).
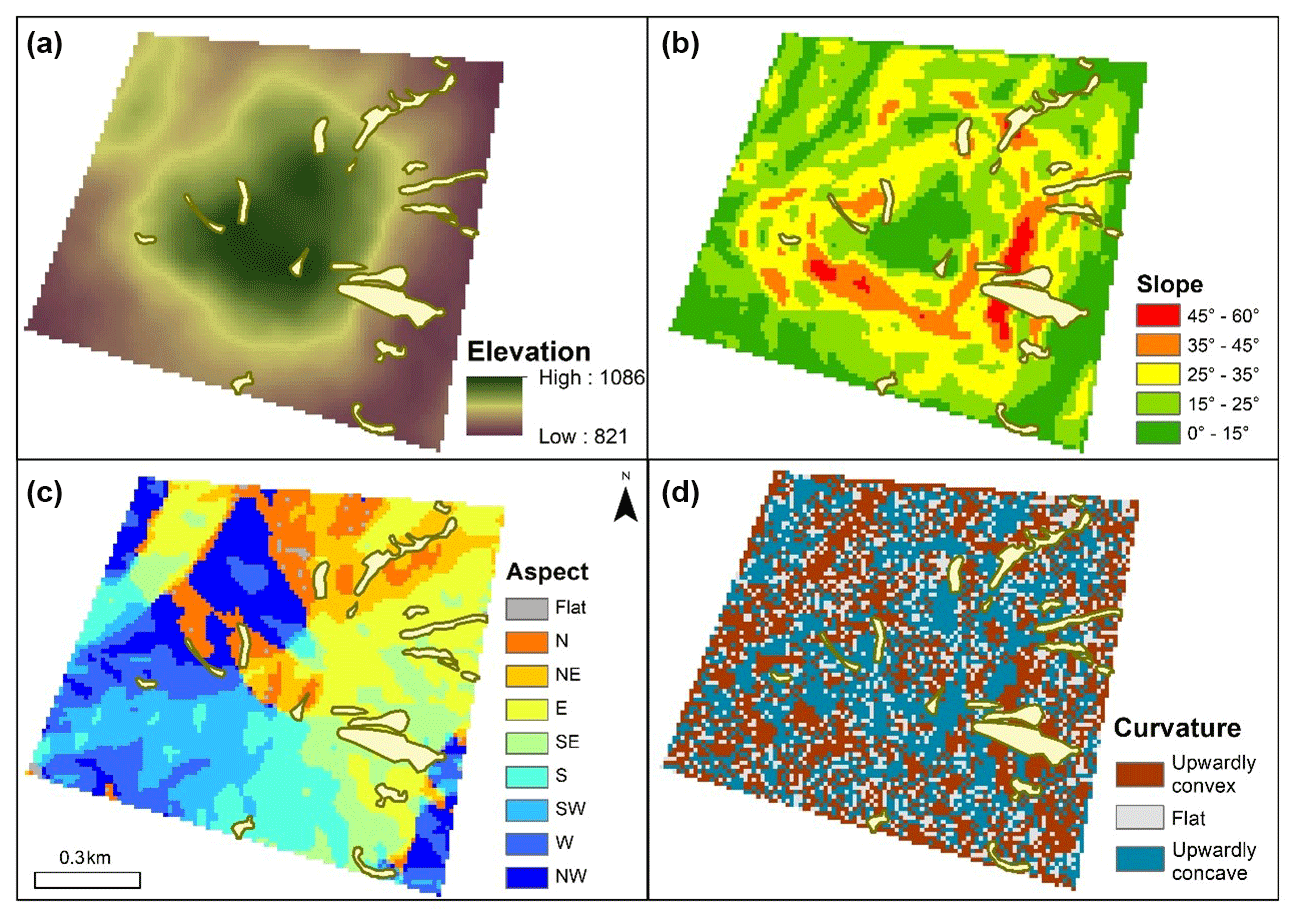
Figure 6Distribution map of terrain attributes in the study area of Petrópolis. (a) Elevation, (b) slope, (c) aspect, and (d) curvature of Petrópolis. Light-yellow polygons represent the extent of the February 2022 landslide patches.
Although the landslide scars were found all elevations, most of them were above 950 m elevation. As for the slope morphology, the highest slope angle recorded in this study area is approximately 60∘ (Fig. 6b), the east-facing slopes accounts for the largest area (Fig. 6c), and most of the slopes were either concave or convex (Fig. 6d). Spatial analysis revealed that, out of the five categories of slope angles, slope angles of 45–60∘ had the highest percentage of landslide occurrence with 23 % (Fig. 7a). There was also a distinct increasing trend in the proportion of landslide occurrences as the slope becomes steeper. This corresponds to numerous previous findings that steeper slopes increase slope instability due to greater resistance required to maintain stability (Catani et al., 2013; Reichenbach et al., 2018). It is often one of the most important factors when assessing landslide susceptibility (Costanzo et al., 2012; Reichenbach et al., 2018). However, complementary analysis is required for the occurrence of landslides in slopes lower than 25∘, as they may be associated with the execution of slopes of cuts and/or fills (Mendes et al., 2018a, b; Ávila et al., 2021).
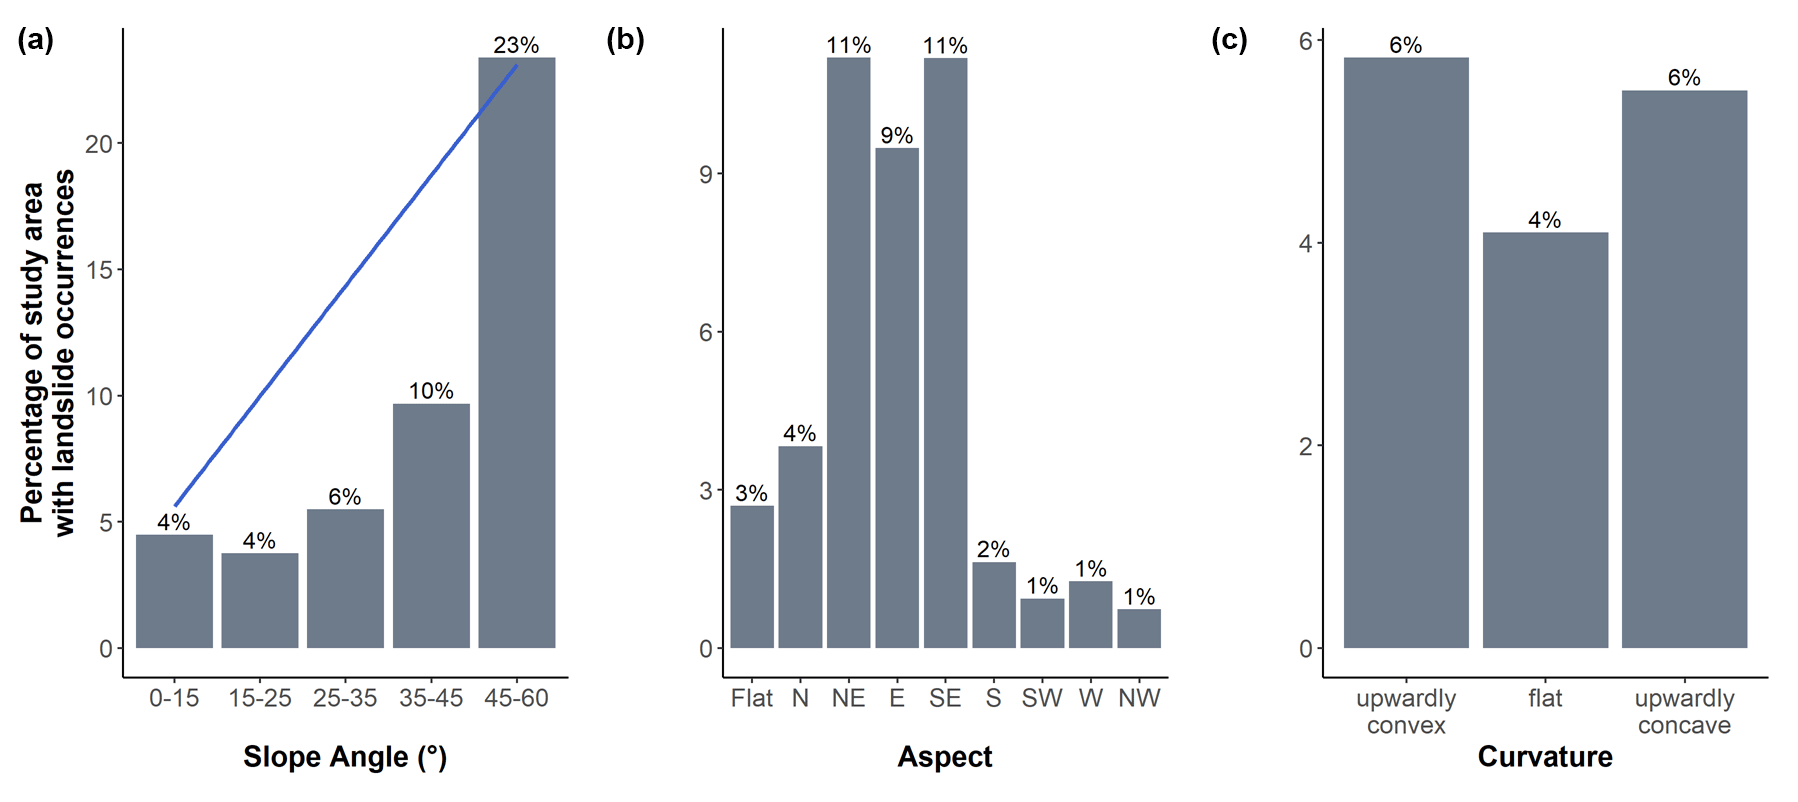
Figure 7Percentage of the landslide area in relation to the total study area, in each classification of (a) slope (blue trend line), (b) aspect, and (c) curvature.
For the aspect factor, the east-facing slopes appear to be the most conducive for landslides, as they account for more than 30 % of landslide occurrences (Fig. 7b). Conversely, west-facing slopes had the lowest landslide occurrence with only 1 % experiencing landslides. This could be attributed to multiple reasons such as the exposure of the surface to varying extents of wind and solar radiation prior to the landslide event (Guzzetti et al., 1999; Dai and Lee, 2002). This could have conditioned the soil moisture, humidity, as well as vegetation growth on the slopes (Catani et al., 2013; Reichenbach et al., 2018). Vegetation growth in Petrópolis was observed to be more abundant on west-facing slopes, which could have increased the slope stability in that direction due to their extensive root systems. Additionally, the rainfall direction during the storm could have also favored landslides in the eastward orientation.
In terms of slope curvature, these landslides did not appear to vary substantially between the different curvatures (Fig. 7c). While upwardly convex (negative curvature) and concave (positive curvature) slopes (6 %) had a higher percentage of landslide occurrences than flat curvatures (4 %), the difference is small at about 2 %. Based on the spatial analysis of the terrain morphology, this Petrópolis landslide event was likely associated with the terrain morphology of the mountain even though the trigger was induced by the intensive rainfall during the storm.
3.4 Soil moisture trend prior to the landslides
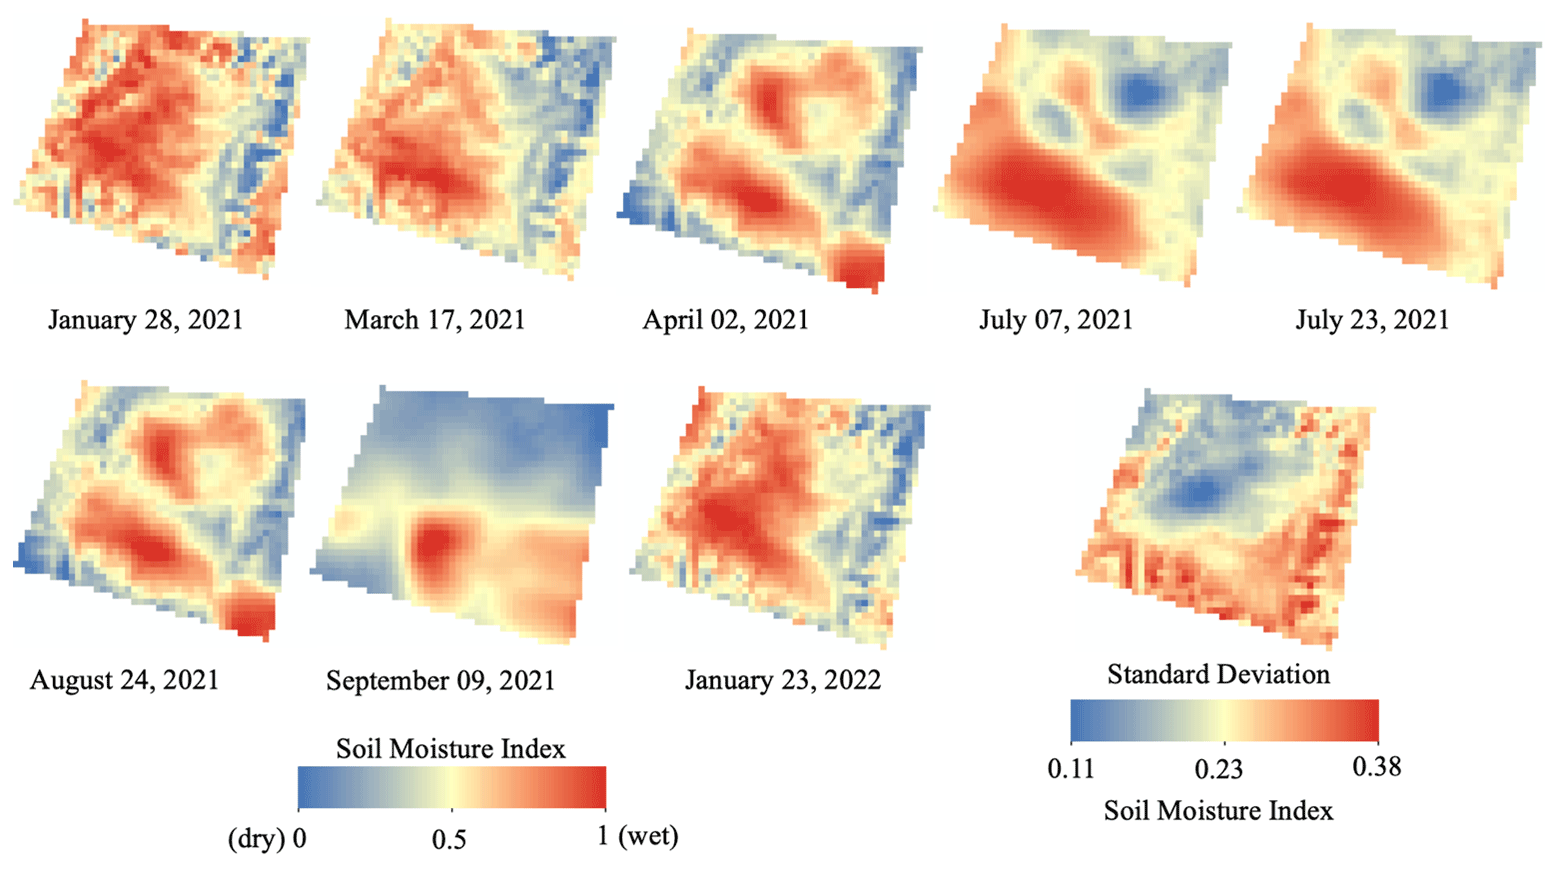
The estimations of SMI from January 2021 to January 2022 are shown in Fig. 8. Values near zero represent dry soil conditions, and values near 1 mean wet soil conditions. The results show that the wet soil conditions were more frequently in the highest altitude and dryer lower altitude during the summer from January 2021 to April 2021 (compare Fig. 6a for elevation). The soil moisture becomes higher in the south portion during the winter (July to September 2021), mainly lower altitude, with one exception in August, when it resembles the summer pattern. In January 2022, the moisture condition spread throughout the area, just like in January 2021. The spatial standard deviation image showed a higher variability in lower altitude than in higher altitude. The main concentration of buildings within our study site was also found within the region with higher moisture variability.
3.5 Interferometric synthetic aperture radar time series
InSAR time-series analysis revealed a narrow zone on the eastern slope of the study site with a continuous motion away from the satellite at a rate of 2–3 mm yr−1 (Fig. 9c). Given the line-of-sight (LOS) direction, the motion can be either westward or downward. Since westward motion is nearly impossible on an east-facing slope, we interpreted the motion as a continuous down-slope movement with part of the downward motion (negative LOS velocity) canceled by the eastward motion (positive LOS velocity).
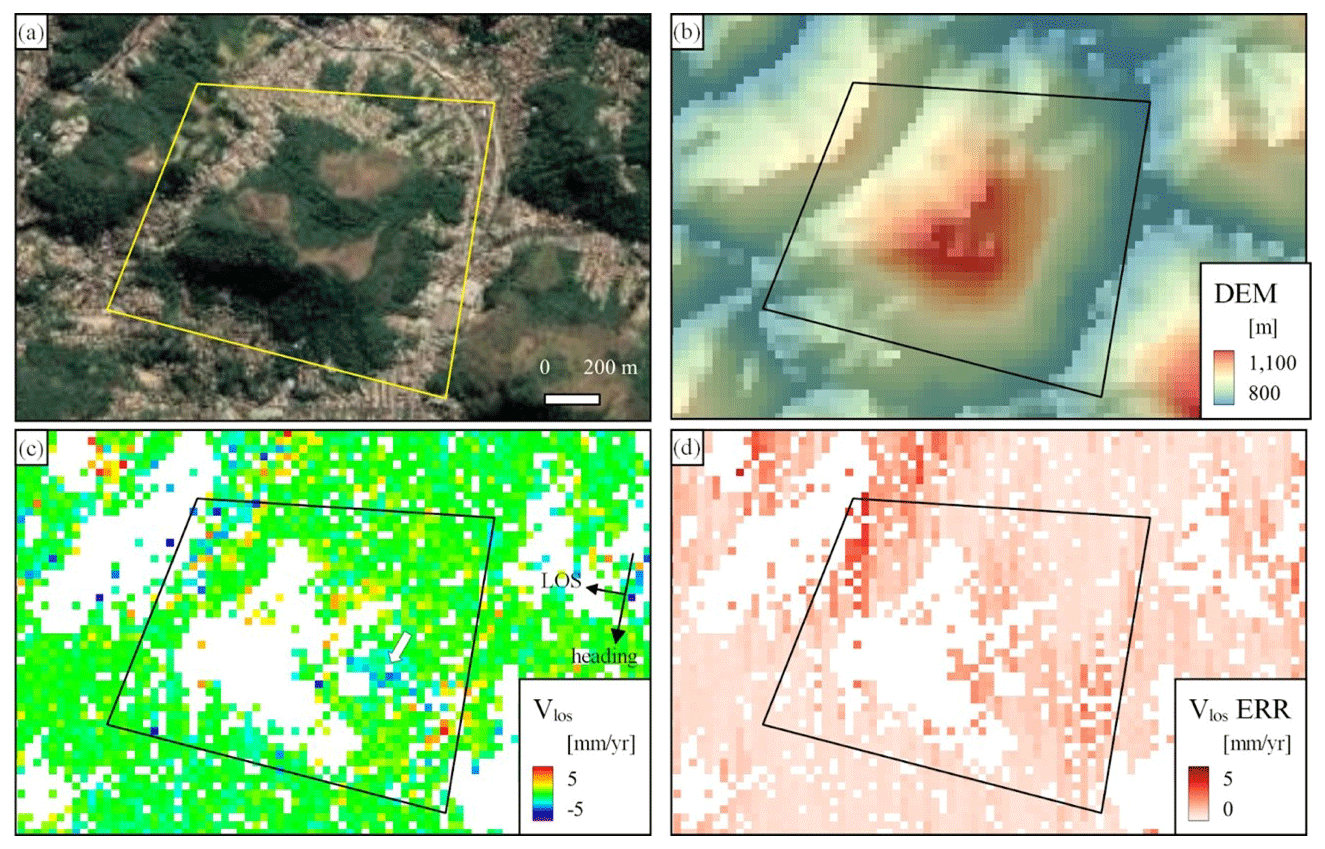
Figure 9(a) Optical image before February 2022 landslides (image from Google Earth Pro). (b) Digital elevation map (ALOS PALSAR). (c) InSAR line-of-sight (LOS) velocity between 8 May 2015 and 20 December 2021. Note that most areas have nearly zero deformation except for the eastern slope (pointed by a white arrow). (d) Standard deviation of LOS velocity.
This interpretation means that the actual down-slope velocity needs to be larger than the LOS velocity. Considering the slope angle (about 50–60∘; see Fig. 6) and the satellite angle (about 38∘), the actual down-slope velocity within this zone can reach as high as 10–15 mm yr−1. The rest of the study site showed little ground deformation between May 2015 and December 2021.
3.6 Urban sprawling, forest losses and landslide scars
During the last 35 years, forest formation in the municipality of Petrópolis has been increasing (7.08 %: from 410.55 to 439.64 km2) and urban areas have largely expanded (58.78 %: from 32.07 to 50.93 km2), while pasture and agriculture have lost cover (14.73 %: from 336.70 to 287.09 km2). However, when analyzing during a 5-year interval, forest cover mostly increased from 1985–2010 (Table 2: there was a small decrease from 1995–2000). Since 2010, though, there has been a loss of 1.50 % in vegetation cover (6.72 km2). Pasture and agriculture consistently decreased during the study interval (exceptions were 1995–2000 and 2010–2015; Table 3). Regarding urban areas, 1985 to 1990 was the period with the highest increase (about 22 %), and the urban expansion has stayed at a constant rate of 2 %–7 % since then, accruing a total increase of 58 % in 35 years.
Table 3Percentage of change in LULC classes over 5-year periods for the Petrópolis municipality.
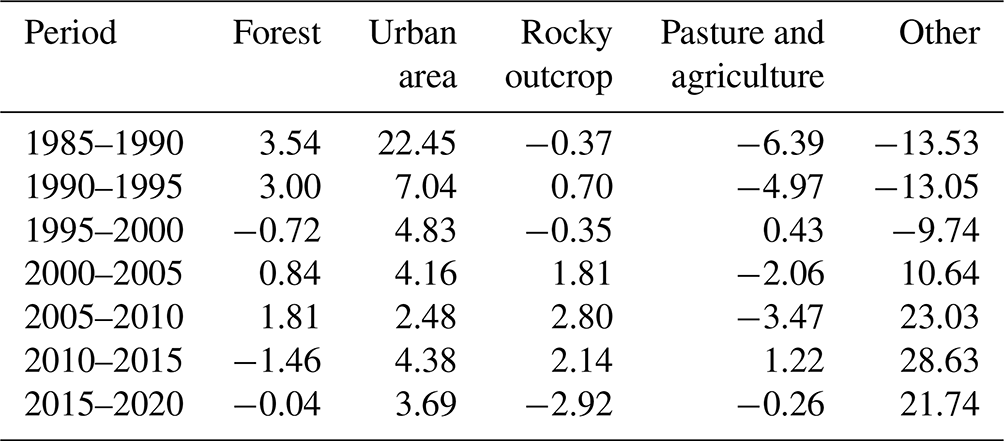
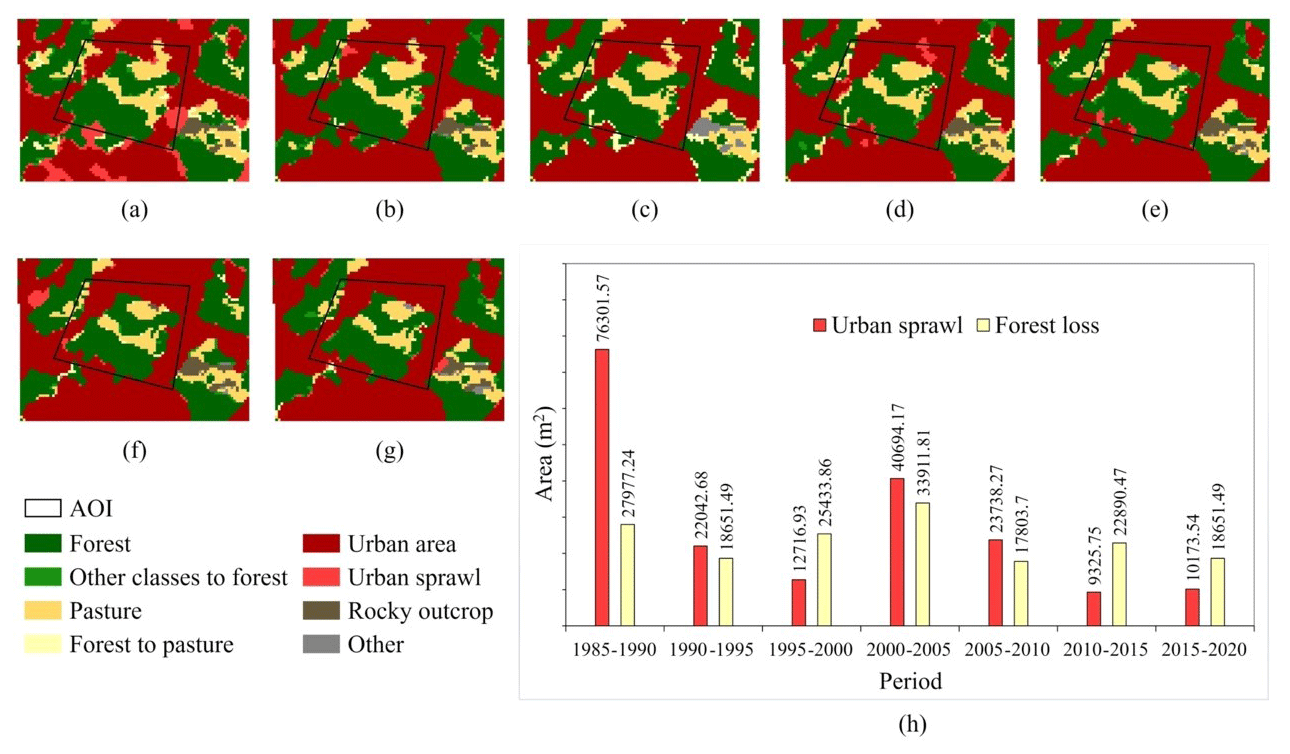
Figure 10Transition classes for the study area: (a) 1985–1990, (b) 1990–1995, (c) 1995–2000, (d) 2000–2005, (e) 2005–2010, (f) 2010–2015, (g) 2015–2020, and (h) area (m2) of urban sprawl and forest loss over the analyzed period.
In Petrópolis municipality, forest cover has historically been replaced mostly by pasture and agriculture (3.38 %), followed by urbanization (0.77 %). Looking closer to the study area, forest loss was constant over the entire study interval, reaching about 16.6 ha by 2020 (Fig. 10 and Table 4). When the urban expansion data for the study area are observed (Fig. 10 and Table 3), it is verified that this study area reflects the data presented for the municipality, with an increase in the urban area over the periods and a higher urban expansion for the period of 1985 to 1990. The urban sprawl can be seen in Fig. 10, which presents the transition information between classes for the study area.
Table 4Urban sprawl and forest loss classes in the area of interest.
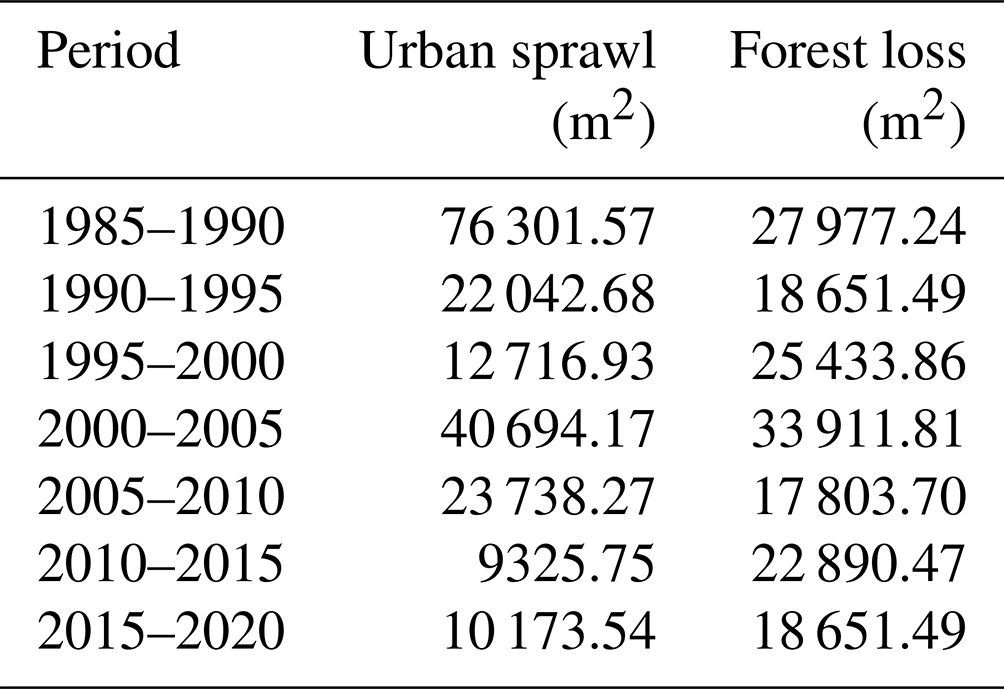
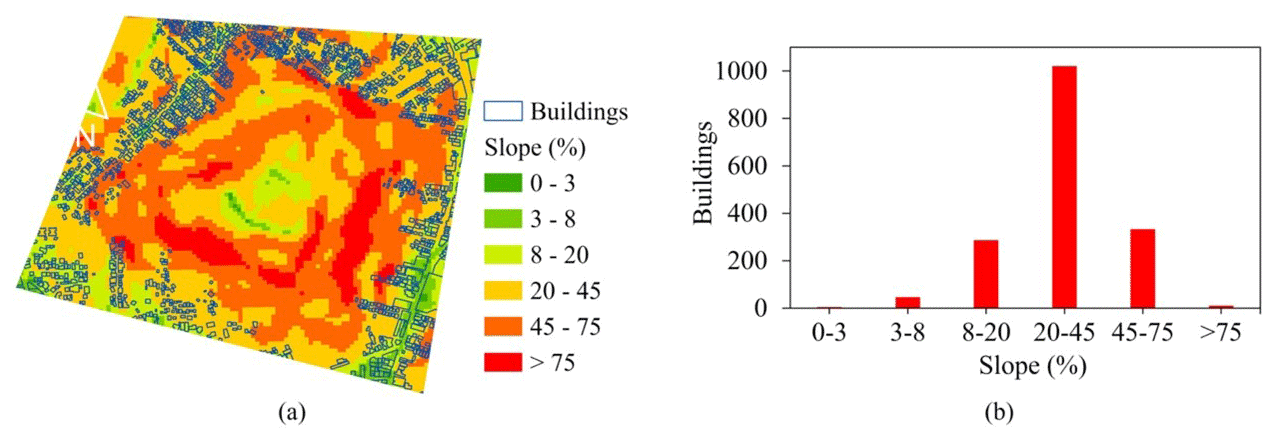
Figure 11Building footprints and slope in the area of interest (a) and (b) number of buildings per slope interval.
For the study area, approximately 1700 buildings that occupy the area around the hill were counted. When the buildings were confronted with landslide scars, it was found that at least 60 houses were affected by landslides. Due to the characteristics of the relief in the region, occupation on hillside areas is very common. Most of them (1021 buildings) are on the slope range of 20 % to 45 % (Fig. 11). It was observed that 343 buildings occupy areas with slopes above 45 %, which are considered “Permanent Preservation Areas”, according to Brazilian Environmental Legislation (Law no. 12.651/2012; Brasil, 2012). Considering the use and occupation of the study area, further stability analysis is recommended to verify the possibility of variation in the safety factor of the slopes due to the execution of slopes of cuts and fills (Mendes et al., 2018a, b).
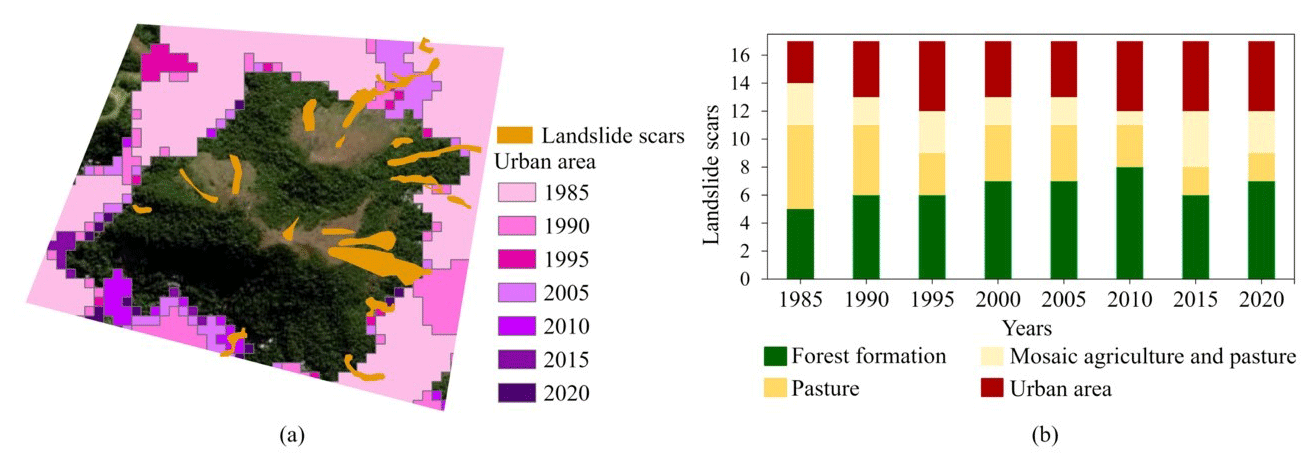
Figure 12(a) Landslide scars superimposed in the urban area classes (the background image is from Planet) and (b) zonal statistics based on LULC classes (for every 5 years, from 1985 to 2020).
The landslide area coinciding with the urban area totaled about 17 000 m2 (Fig. 12a). The scars occurred in areas of forested area, urban area, pasture, and agriculture, common classes in the urban region of the municipality. From the zonal statistics considering the landslide scars of this event and the LULC class as the majority in its interior, it was verified that there were comparatively fewer landslide scars in urban areas in 1985. Over the years, more scars were found with urban area predominance, and fewer scars were found in agriculture and pasture. This finding may be an indication that urban sprawl at the beginning of the analysis period (1985) is sufficient for landslides to cause destruction, material damage, and loss of life in the region. The graph in Fig. 12b shows the zonal statistic result for the 17 landslide scars (2022-year event) and LULC classes for the years of analysis.
4.1 Origin/cause of the extreme rainfall, subsequent flood and landslide
The weather forecasts issued by INMET and CEMADEN for the mountainous region of Rio de Janeiro, released earlier on 14 February, warned about isolated convective rainfall, which could occur in some areas of the city. However, no meteorological model predicted such significant amounts of rainfall over the region. The heavy rainfall that occurred in the city of Petrópolis on 15 February was caused by the action of a meteorological phenomenon known as mesoscale convective cell, with extraordinary characteristics without known recorded antecedents. The situation was influenced by the presence of the South Atlantic Convergence Zone (SACZ), which at the time was positioned over the state of Rio de Janeiro and created a favorable environment for atmospheric convection. A similar analysis on meteorological evolution leading to landslides can be found in Martinotti et al. (2017). The authors studied a period of intense rainfall from 1 to 6 September 2014 in the Gargano Promontory, a karst area in Puglia, southern Italy; heavy rainfall is known to cause multiple geohydrological hazards, including inundations, flash floods, landslides, and sinkholes.
The other key element that led to the extraordinary rains in the center of Petrópolis was the passage of a cold front, with very particular characteristics, which occurred at the exact moment the rain showers began to form over the city. This cold front, on the one hand, was weak to dissipate the instability related to the storm clouds, and, on the other hand, it was strong enough to change the wind direction, which came from the south, exactly perpendicular to the mountainous region of Petrópolis. As a result of this combination of factors, the mesoscale convective cell cloud (technically called of cumulonimbus), which should have lasted a few minutes, lasted several hours due to the interaction of the southerly winds associated with the cold front in the mountain. Figure 13 shows the surface winds and temperature for the 18:00 UTC on 15 February. It is noticed that there is a cold front with a temperature gradient and changes in wind direction. Southerly winds on the mountain region where the urban part of the city of Petrópolis (region prone to landslides) turned the “orographic cloud” (cloud that positions on the top of mountains for hours and that normally do not precipitate) into a convective cell, which is very rare. Due to the sudden formation and the null displacement of the storm, the weather radars also did not allow its anticipated tracking. It is noteworthy that the current state of knowledge and meteorological forecast do not allow predicting where each individual cloud will form, with which this event could not be predicted in advance.
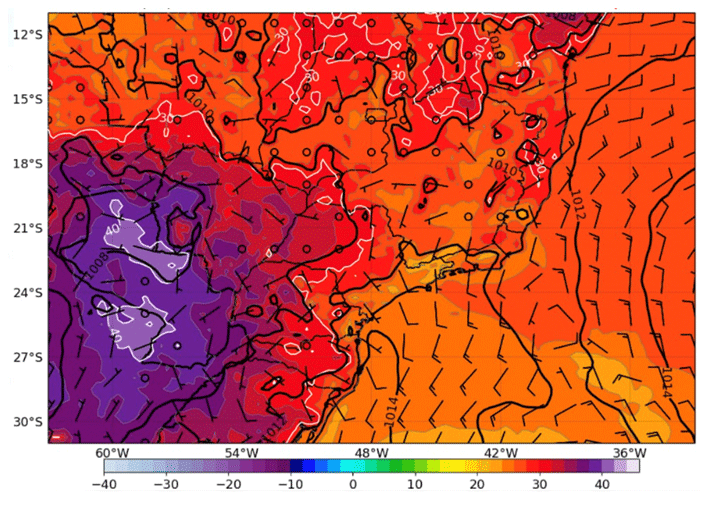
Figure 13Global Forecast System (GFS) analysis at 18:00 UTC on 15 February 2022, for the Petrópolis region. The shaded areas represent surface temperature, the isolines depict sea level pressure, and the wind speed is indicated by barbs (in knots). Source: http://atmosferalivre.com/ (last access: 5 May 2022).

Figure 14Hourly rainfall for various CEMADEN's weather station in the city of Petrópolis during 13–16 February 2022 (a); radar images at the Pico do Couto site, taken at 19:00 UTC (b); 19:30 UTC (c); 20:00 UTC (d); and 20:30 UTC for 15 February 2022 (source: CEMADEN).
Figure 14 (lower side) shows the radar images of Pico do Couto site, where the formation of the cloud can be seen exactly above the center of the city of Petrópolis. It should be noted that only the residential area of the municipality was affected by the rain, which lasted more than 3 h. The accumulated rainfall over the Petrópolis station (Fig. 14, upper side) shows the most intense rain between 19:00 and 21:00 UTC. The highest record of 260 mm in just 4 h, which occurred between the afternoon and evening of 15 February, is unprecedented in the city. The curvature of the storm produced by the southerly winds (represented by blue arrows in the figure) is also noted, which resulted in its long persistence.
According to CEMADEN, from a hydrological point of view, the events recorded on 15 February 2022 in the city of Petrópolis were characterized as landslide, flood, and flash flood typologies. Flash floods in Petrópolis occur mostly after heavy rainfall associated with unplanned land and poor uses of land. According to Avelar et al. (2013) the most frequent landslides in Petrópolis are translational of layers, with varying thickness from 0.5 to 2 m. The municipality's hydrography indicates the convergence of rivers and streams, which are in an anthropized hydrographic basin, while its topographic characteristics resulted in high speed and energy surface runoff. Due to these characteristics and the meteorological event that hit the municipality, there was an increase in the levels of rivers and streams during the intense and concentrated rains. The drainage systems were overloaded, and, as a result, the rainwater runs off the surface, causing flash floods and floods.
Regarding the occurrence of landslides, the geotechnical stations of CEMADEN installed in the municipality of Petrópolis indicate that there was a significant increase in soil moisture during the rainfall event that occurred between 15:30 and 19:00 UTC on 15 February 2022. The monitoring station also indicated that prior to the event, soil moisture was already high since the previous rains exceeded 220 mm per 14 d and 350 mm per 21 d (recorded in some of the CEMADEN stations). The preceding rise in soil moisture was an inducing, preparatory factor for the occurrence of landslides. The abrupt elevation of soil moisture in a short time interval, due to intense and concentrated precipitation and, consequently, the oversaturation of the ground, provided the triggering of mass movement processes. On the other hand, it was also verified that very high soil moisture was not recorded at deep levels (sensors in depths 2.0, 2.5, and 3.0 m). In other words, a priori, the processes were closely related to intense surface runoff and percolation with very high positive pressure in fractures. The high fracture density favors the formation of large blocks of rocks on the slopes. Blocks of rocks and colluvial soil deposits were incorporated into the mass of debris and deposited in the valley bottom as a poorly sorted material.
4.2 Tackle urban sprawling for disaster risk management
Other than rainfall being the contributing factor, land use change likely worsened the effect of the landslide event. While we verified an increase in forest cover and urban area and a decrease in agriculture and pasture along the study interval in the municipality of Petrópolis, the forest located in urbanized region has substantially decreased, as another study has shown (Rosi et al., 2019). Petrópolis is in a mountainous region with lower deforestation, compared to less hilly sites (Silva et al., 2017), and natural regeneration may be happening there (especially replacing old, abandoned pastures), as observed in other parts of the southeastern Atlantic Forest (Silva et al., 2017). In addition, the municipality is part of a protected area (sustainable use: APA Federal da Região Serrana de Petrópolis), which may help forest conservation and restoration with its management actions. However, the forest located in places of interest, within the urbanized region, has substantially decreased in extent (Rosi et al., 2019). At the same time, irregular and unplanned urbanization has been increasing (Guerra, 1995). Thus, public policies, such as a master plan, are needed to prevent land use changes that might consequently lead to disasters.
In Petrópolis, urbanization has been intensifying since the 1930s, increasing the rural-to-urban migration and unequal urban development. The population increased rapidly, reaching 75 000 inhabitants in 1940 and 255 000 in 1990. The growth of tourism and the development of a land market for second homes for citizens from Rio de Janeiro increased the real estate speculation. This speculation excluded low-income households from the formal land market, driving them to occupy hazardous zones. The rate and form of urbanization expansion overcame precipitation as the most important driver of landslides. Slope areas were unsuitably incorporated into the urban network. In the 1980s, the number of mass movements was larger than those of the 1960s and 1970s, in contrast to rainfall values which were lower than the previous decade (Guerra, 1995). Our study revealed that most of the buildings are located in areas of high slope (above 20∘), which is not suitable for human settlements. As such, better management is required to ensure that people inhabit safer areas.
Despite not being an official data source, the OpenStreetMap platform – OSM – is able to generate geographic information about human settlements with high quality (Albuquerque et al., 2016). With the need for rapid disaster response, the crowdsourced data have made it possible to estimate the impact caused by human settlements in areas without cadastral data available. Examples include the Wenchuan (2008) and Haiti (2010) earthquakes (2008) and Cyclone Idai and Cyclone Kenneth (2019) in Mozambique (Li et al., 2020).
Dias et al. (2018) created a methodology to associate demographic census data with disaster-prone areas with risk of landslides and floods, from 1999 to 2012. They found that, out of the total population exposed to risk in Petrópolis, 8.19 % were children, 11.24 % were elderly, 48.20 % male, and 51.80 % female. In addition, an estimated 26 % of the at-risk population was living in subnormal agglomerates (slums), from which 54 % had no water supply and 14 % had inadequate sanitation services (Dias et al., 2018). This important information about the conditions of use and occupation of the studied area reinforces the potential contribution of anthropic inducing factors (leaks in pipes, for example) in the deflagration of landslides, and its detailed investigation may even be possible from stability modeling coupled with transient flow analyses (Mendes et al., 2018a, b). Currently there are no data for 2022 using the same methodology, nor updated data from IBGE – the Brazilian Institute for Geography and Statistics. We retrieved some numbers from the local press and from the municipality's official communications. Beyond the impacts on human lives and injuries, the economic consequences are also serious, with estimates around BRL 78 000 000 (FIRJAN, 2022).
Marchezini and Wisner (2017) described a series of dynamic pressures when analyzing disaster risks in Petrópolis: societal deficiencies (lack of planning and investments), business cycles, dense urbanization with population change, deforestation, poor governance, weakening of environmental legislation, real estate speculation, and land use change. They also described root causes (social and economic structures, history and culture heritage and ideologies) and factors related to unsafe locations, such as sewage leaking into soil, limited skills and formal education, marginalized groups and individuals, lack of access to formal credit, and lack of disaster preparedness.
Disasters have serious consequences, like deaths, injuries, and economic losses. Preventive actions to tackle risks and disasters may be structural and non-structural. Structural aspects refer to drainage, slope contention, urban services, and engineering works in general. Non-structural actions refer to environmental education, community meetings, and prevention advice and are as important as the structural ones. Early warnings of disasters are essential to significantly reduce death toll and injuries. For instance, the 20 March event had no more than 4 % of the death toll compared to the 15 February event, despite the meteorological drivers of the heavy rainfall in March being of high magnitude. A detailed study is currently underway to go into depth to explain the difference between the two events and the significance of early warnings in saving lives.
In Petrópolis, there are ongoing preventive works, such as the NUPDEC Vale do Cuiabá: a group of people who live in risk areas and are in contact with the local civil defense to have coordinated actions during a disaster. Complementing the early warnings of disasters, issued by federal, state, and local authorities, Petrópolis also counts on sound warnings (sirens). The National Centre for Monitoring and Early Warnings of Natural Disasters (CEMADEN) is responsible for issuing the warnings, which are forwarded to the federal civil defense, which distributes the early warnings to state and municipal civil defense agencies. The local civil defense is responsible for evacuating risk areas and addressing rescue activities and shelter establishment. Concerning the civil defense activities, the main needs, according to a recent survey, are related to financial support, structure, and capacity building. Another recurrent theme among the civil defense professionals was the lack of acknowledgement of their work. The actions to improve prevention and response to disasters, therefore, should necessarily consider the improvement of these mentioned deficiencies.
Contrary to what the media reported, the seriousness of the Petrópolis disaster under analysis in the current study was not exclusively due to the large volume of rain. The large death toll had to do with the lack of a precise early warning due to the unpredictable nature of the meteorological event that hit the region and due to the large number of areas of risk. A set of drivers were responsible for the deadliest disaster in Petrópolis: the heavy rainfall, combined with the already saturated soil, increased unplanned urban sprawl, replacement of vegetation for surfaces with lower capacity of infiltration, and the lack of early warnings, was responsible for the disaster that occurred on 15 February 2022.
By utilizing available precipitation and human settlement datasets, as well as employing multiple remote sensing data in our analysis, including optical and radar images, we showed that urban sprawling could have a significant effect on slope stability and consequently landslide susceptibility. Several spatial patterns of the 15 February 2022 landslide event were identified. Other than the average rainfall for February 2022 being the heaviest recorded since 1932, the urban part of the city was particularly affected by heavy rainfalls compared to the rural regions. Rainfall evidently influenced soil moisture saturation, although there was higher spatial variability of soil moisture in lower altitudes than in higher altitudes. In our land use assessment, we also recognized that urban sprawling was occurring, accompanying forest losses in urban areas. Together with the mountainous terrain of Petrópolis and the lack of ground deformation detected prior to the landslide, our findings have led us to the conclusion that both rainfall, which weakens slopes and washes materials downhill, and human alterations to slopes and surfaces are the main factors contributing to the landslide event.
We further emphasize the need for a master plan to improve the disaster risk management in Petrópolis. This should include restricting human settlements to within 20∘ slopes, providing financial support and capacity building for the local civil defense, and limiting land-use changes in landslide-prone regions such as Petrópolis. In the face of climate change, where extreme weather events are expected to become more frequent, it is paramount for Petrópolis to increase its resilience to such disasters. The recent events in 2022 clearly showed that the municipality is still focused on the management of post-impact consequences, instead of actions for disaster risk reduction (DRR). In this sense, efforts should be put into providing a better structure for the civil defense, integrating the population into prevention planning, strengthening land use regulations, and improving the risk communication flow.
Our focus is only on the 15 February 2022 event. However, in another event on 20 March 2022 the rainfall totals were similarly high and there were a large number of landslides, mudslides, and floods. Despite this, the number of deaths was very small. An ongoing study investigates the reasons of such differences. One of the reasons was the meteorological nature of the 15 February event being a mesoscale convective cell that is not predicted (or even predictable) by weather prediction models. Therefore, the CEMADEN warning system did not manage to issue earlier warnings but only when heavy rain started pouring down. On the other hand, the 20 March event was predicted some days before its occurrence. CEMADEN issued precise warnings. The civil defense had enough time to remove many residents living in areas of risk, and car and bus drivers were informed of the risks and did not take vehicles to low-lying areas at risk of flooding. It is suggested that the 15 February disaster reduced the number of risky areas for the 20 March event. These are ideas for further discussion.
All data produced in this work are available from the corresponding author upon request (enner.alcantara@unesp.br).
EA and JAM developed the study concept. All co-authors contributed to the discussion and the writing process and approved the final version of this text.
The contact author has declared that none of the authors has any competing interests.
Publisher’s note: Copernicus Publications remains neutral with regard to jurisdictional claims in published maps and institutional affiliations.
Enner Alcântara acknowledges the Brazilian National Council for Scientific and Technological Development (CNPq) for research grant 302575/2021-9. This research was supported by the Singapore Ministry of Education (grant no. Tier2 MOE-T2EP402A20-0001) and the Earth Observatory of Singapore (EOS) via its funding from the National Research Foundation (NRF) of Singapore and the Singapore Ministry of Education (MOE) under the Research Centers of Excellence initiative. José Mantovani, Ana Paula Cunha, and Regina Alvalá were funded by the National Institute of Science and Technology for Climate Change Phase 2 under CNPq (grant no. 465501/2014-1), Fundação de Amparo à Pesquisa do Estado de São Paulo (FAPESP) (grant no. 2014/50848-9), and the National Coordination for Advanced Education and Training (CAPES) (grant no. 88887.136402/2017-00).
This research has been supported by the Conselho Nacional de Desenvolvimento Científico e Tecnológico (grant no. 302575/2021-9), the Singapore Ministry of Education (grant no. Tier2 MOE-T2EP402A20-0001), the Earth Observatory of Singapore (EOS) via its funding from the National Research Foundation (NRF) of Singapore and the Singapore Ministry of Education (MOE) under the Research Centers of Excellence initiative, the National Institute of Science and Technology for Climate Change Phase 2 under CNPq (grant no. 465501/2014-1), Fundação de Amparo à Pesquisa do Estado de São Paulo (FAPESP) (grant no. 2014/50848-9), and the National Coordination for Advanced Education and Training (CAPES) (grant no. 88887.136402/2017-00).
This paper was edited by Mario Parise and reviewed by three anonymous referees.
Albuquerque, J. P. D., Herfort, B., and Eckle, M.: The Tasks of the Crowd: A Typology of Tasks in Geographic Information Crowdsourcing and a Case Study in Humanitarian Mapping, Remote Sens., 8, 1–22, https://doi.org/10.3390/rs8100859, 2016.
Ansari, H., Zan, F. D., and Bamler, R.: Efficient Phase Estimation for Interferogram Stacks, IEEE T. Geosci. Remote, 56, 4109–4125, 10.1109/TGRS.2018.2826045. 2018.
Avelar, A. S., Netto, A. L. C., Lacerda, W. A, Becker, L. B., and Mendonça, M. B.: Mechanisms of the recent catastrophic landslides in the mountainous range of Rio de Janeiro, Brazil, in: Landslide science and practice. Springer, Berlin Heidelberg, 265–270, ISBN 978-3-642-31337-0-34, 2013.
Ávila, F. F., Alvalá, R. C., Mendes, R. M., and Amore, D. J.: The influence of land use/land cover variability and rainfall intensity in triggering landslides: a back-analysis study via physically based models, Nat. Hazards, 105, 1139–1161, https://doi.org/10.1007/s11069-020-04324-x, 2021.
Brasil: Lei no 12.651, de 25 de maio de 2012, https://www.planalto.gov.br/ccivil_03/_ato2011-2014/2012/lei/l12651.htm (last access: 1 May 2022), 2012.
Carvalho-Filho, A., Lumbreras, J. F., and Santos, R. D.: Os Solos do Estado do Rio de Janeiro, CPRM, Brasília, Brazil, 36 pp., https://www.embrapa.br/busca-de-publicacoes/-/publicacao/1090208/os-solos-do-estado-do-rio-de-janeiro (last access: 6 May 2022), 2000.
Catani, F., Lagomarsino, D., Segoni, S., and Tofani, V.: Landslide susceptibility estimation by random forests technique: sensitivity and scaling issues, Nat. Hazards Earth Syst. Sci., 13, 2815–2831, https://doi.org/10.5194/nhess-13-2815-2013, 2013.
Chau, K. T. and Chan, J. E.: Regional bias of landslide data in generating susceptibility maps using logistic regression: Case of Hong Kong Island, Landslides, 2, 280–290, https://doi.org/10.1007/s10346-005-0024-x, 2005.
Chen, C. W. and Zebker, H. A.: Two-dimensional phase unwrapping with use of statistical models for cost functions in nonlinear optimization, J. Opt. Soc. Am. A, 18, 338–351, https://doi.org/10.1364/JOSAA.18.000338, 2001.
Chen, W., Xie, X., Wang, J., Pradhan, B., Hong, H., Bui, D. T., Duan, Z., and Ma, J.: A comparative study of logistic model tree, random forest, and classification and regression tree models for spatial prediction of landslide susceptibility, Catena, 151, 147–160, https://doi.org/10.1016/j.catena.2016.11.032, 2017.
Costanzo, D., Rotigliano, E., Irigaray, C., Jiménez-Perálvarez, J. D., and Chacón, J.: Factors selection in landslide susceptibility modelling on large scale following the gis matrix method: application to the river Beiro basin (Spain), Nat. Hazards Earth Syst. Sci., 12, 327–340, https://doi.org/10.5194/nhess-12-327-2012, 2012.
CPRM (Geological Survey of Brazil): Avaliação técnica pós-desastre, Petropolis, RJ 2022, Ministry of Mines and Energy MME, 9 pp., https://rigeo.cprm.gov.br, last access: 1 May 2022.
Dai, F. C. and Lee, C. F.: Landslide characteristics and slope instability modeling using GIS, Lantau Island, Hong Kong, Geomorphology, 42, 213–228, https://doi.org/10.1016/s0169-555x(01)00087-3, 2002.
Dean, W.: A ferro e fogo: a história e a devastação da Mata Atlântica brasileira, Companhia das Letras, São Paulo, ISBN 9788571645905, 1996.
Dembélé, M. and Zwart, S. J.: Evaluation and Comparison of Satellite-Based Rainfall Products in Burkina Faso, West Africa, Int. J. Remote Sens., 37, 3995–4014, https://doi.org/10.1080/01431161.2016.1207258, 2016.
Dias, H. C., Hölbling, D., and Grohmann, C. H.: Landslide Susceptibility Mapping in Brazil: A Review, Geosciences, 11, 1–15, https://doi.org/10.3390/geosciences11100425, 2021.
Dias, M. C. A., Saito, S. M., Alvalá, R. C., Stenner, C., Pinho, G., Nobre, C. A., Fonseca, M. R. S., Santos, C., Amadeu, P., Silva, D., Lima, C. O., Ribeiro, J., Nascimento, F., and Corrêa, C. O.: Estimation of exposed population to landslides and floods risk areas in Brazil, on intra-urban scale, Int. J. Disast. Risk Re., 31, 449–459, https://doi.org/10.1016/j.ijdrr.2018.06.002, 2018.
Dourado, F., Arraes, T. C., and Silva, M. F.: The “Megadesastre” in the Mountain Region of Rio de Janeiro State – Causes, Mechanisms of Mass Movements and Spatial Allocation of Investments for Reconstruction Post Disaster, Anuário do Instituto de Geeociências, 35, 43–54, https://doi.org/10.11137/2012_2_43_54, 2012.
Fattahi, H., Agram, P. S., Tymofyeyeva, E., and Bekaert, D. P.: FRInGE; Full-Resolution InSAR time series using Generalized Eigenvectors, American Geophysical Union, Fall Meeting 2019, 9–13 December 2019, San Francisco, CA, USA, abstract #G11B-0514, https://agu.confex.com/agu/fm19/meetingapp.cgi/Paper/497561 (last access: 6 May 2022), 2019.
FIRJAN: Firjan estima perda de R$ 665 milhões no PIB de Petrópolis após a forte chuva da última semana, FIRJAN, https://firjan.com.br/noticias/firjan-estima-perda-de-r-665-milhoes-no-pib-de-petropolis-apos-a-forte-chuva-da-ultima-semana-1.htm, last access: 20 March 2022.
Fonseca, M. J. G., Derze, G. R., Barreto, A. M., and Williams, G. H.: Mapa Geológico do Estado do Rio de Janeiro, Technical report, Departamento Nacional de Produção Mineral (DPMN), Rio de Janeiro, Brazil, 141 pp., http://www.cprm.gov.br/publique/Gestao-Territorial/Geologia%2C-Meio-Ambiente-e-Saude/Projeto-Rio-de-Janeiro-3498.html (last access: 6 May 2022), 1998.
Fundação SOS Mata Atlântica: Atlas dos Remanescentes Florestais da Mata Atlântica período 2016–2017, Technical report, Fundação SOS Mata Atlântica, Instituto Nacional de Pesquisas Espaciais, São Paulo, https://cms.sosma.org.br/wp-content/uploads/2021/05/SOSMA_Atlas-da-Mata-Atlantica_2019-2020.pdf(last access: 6 May 2022), 2018.
Funk, C., Peterson, P., Landsfeld, M., Pedreros, D., Verdin, J., Shukla, S., Husak, G., Rowland, J., Harrison, L., Hoell, A., and Michaelsen, J.: The climate hazards infrared precipitation with stations – a new environmental record for monitoring extremes, Sci. Data, 2, 150066, https://doi.org/10.1038/sdata.2015.66, 2015.
Galarneau, T. J. and Bosart, L. F.: Ridge Rollers: Mesoscale disturbances on the periphery of cutoff anticyclones, 21st Conf. on Weather Analysis and Forecasting/17th Conf. on Numerical Weather Prediction, 28 July–5 August 2005, Atlanta, GA, USA, Amer. Meteor. Soc., 3.2, https://ams.confex.com/ams/WAFNWP34BC/techprogram/paper_94414.htm (last access: 2 May 2022), 2006.
Goldblatt, R., Jones, N., and Mannix, J.: Assessing OpenStreetMap Completeness for Management of Natural Disaster by Means of Remote Sensing: A Case Study of Three Small Island States (Haiti, Dominica and St. Lucia), Remote Sens., 12, 1–25, https://doi.org/10.3390/rs12010118, 2020.
Gonçalves, L. F. H.: Avaliação e Diagnóstico da Distribuição Espacial e Temporal dos Movimentos de Massa com a Expansão da Área Urbana em Petrópolis-RJ, PhD Thesis, Universidade Federal do Rio de Janeiro-UFRJ, Rio de Janeiro, Brazil, 1998.
Guerra, A.: Catastrophic events in Petrópolis city (Rio de Janeiro state), between 1940 and 1990, GeoJournal, 37, 349–354, https://doi.org/10.1007/BF00814015, 1995.
Guzzetti, F., Carrara, A., Cardinali, M., and Reichenbach, P.: Landslide hazard evaluation: A review of current techniques and their application in a multi-scale study, Central Italy, Geomorphology, 31, 181–216, https://doi.org/10.1016/s0169-555x(99)00078-1, 1999.
Hermance, J. F. and Sulieman, H. M.: Adequacy of the daily TMPA 3B42 high-resolution satellite precipitation product for monitoring hydrometeorological hazards in the Southeast Sahel of Africa, Int. J. Remote Sens., 39, 2579–2596, https://doi.org/10.1080/01431161.2018.1430405, 2018.
Hersbach, H., Bell, B., Berrisford, P., Hirahara, S., Horányi, A., Muñoz-Sabater, J., Nicolas, J., Peubey, C., Radu, R., Schepers, D., Simmons, A., Soci, C., Abdalla, S., Abellan, X., Balsamo, G., Bechtold, P., Biavati, G., Bidlot, J., Bonavita, M., Chiara, G., Dahlgren, P., Dee, D., Diamantakis, M., Dragani, R., Flemming, J., Forbes, R., Fuentes, M., Geer, A., Haimberger, L., Healy, S., Hogan, R. J., Hólm, E., Janisková, M., Keeley, S., Laloyaux, P., Lopez, P., Lupu, C., Radnoti, G., Rosnay, P., Rozum, I., Vamborg, F., Villaume, S., and Thépaut, J.-N.: The ERA5 global reanalysis, Q. J. Roy. Meteor. Soc., 146, 1999–2049, 2020.
Huffman, G. J., Bolvin, D. T., Braithwaite, D., Hsu, K.-L., Joyce, R. J., Kidd, C., Nelkin, E. J., Sorooshian, S., Stocker, E. F., Tan, J., Wolff, D. B., and Xie, P.: Satellite Precipitation Measurement: Volume 1, edited by: Levizzani, V., Kidd, C., Kirschbaum, D. B., Kummerow, C. D., Nakamura, K., and Turk, F. J., 343–353, Springer Cham, ISBN 978-3030245672, 2020.
IBGE: Cidades, Instituto Brasileiro de Geografia e Estatística, https://cidades.ibge.gov.br/brasil/retropolisis/panorama, last access: 25 September 2018.
Janowiak, J., Joyce, B., and Xie, P.: NCEP/CPC L3 Half Hourly 4km Global (60S – 60N) Merged IR V1, edited by: Savtchenko, A., Greenbelt, MD, Goddard Earth Sciences Data and Information Services Center (GES DISC) [data set], https://doi.org/10.5067/P4HZB9N27EKU, 2017.
Jiang, L. and Bauer-Gottwein, P.: How do GPM IMERG precipitation estimates perform as hydrological model forcing? Evaluation for 300 catchments across Mainland China, J. Hydrol., 572, 486–500, https://doi.org/10.1016/j.jhydrol.2019.03.042, 2019.
Jolivet, R., Agram, Piyush, S., Lin, Y. N., Simons, M., Doin, M.-P., Peltzer, G., and Li, Z.: Improving InSAR geodesy using Global Atmospheric Models, J. Geophys. Res.-Sol. Ea., 119, 2324–2341, https://doi.org/10.1002/2013JB010588, 2014.
Kanwal, S., Atif, S., and Shafiq, M.: GIS based landslide susceptibility mapping of northern areas of Pakistan, a case study of Shigar and Shyok Basins, Geomat. Nat. Hazards Risk, 8, 348–366, https://doi.org/10.1080/19475705.2016.1220023, 2017.
Lambin, E. F. and Ehrlich, D.: The surface temperature-vegetation index space for land cover and land-cover change analysis, Int. J. Remote Sens., 17, 463–487, https://doi.org/10.1080/01431169608949021, 1996.
Li, H., Herfort, B., Huang, W., Zia, M., and Zipf, A.: Exploration of OpenStreetMap missing built-up areas using twitter hierarchical clustering and deep learning in Mozambique, ISPRS J. Photogramm., 166, 41–51, https://doi.org/10.1016/j.isprsjprs.2020.05.007, 2020.
Maddox, R. A., Hoxit, L. R., Chappell, C. F., and Caracena, F.: Comparison of meteorological aspects of the Big Thompson and Rapid City flash floods, Mon. Weather Rev., 106, 375–389, 1978.
Marchezini, V. and Wisner, B.: Challenges for vulnerability reduction in Brazil: Insights from the PAR framework, in: Reduction of vulnerability to disasters: From knowledge to action, edited by: Marchzini, V., Wisner, B., Londe, L., RIMA, ISBN 978-85-7656-050-0, 2017.
Marengo, J. A. and Alves, L. M.: The 2011 intense rainfall and floods in Rio de Janeiro, B. Am. Meteorol. Soc., 93, S176, https://doi.org/10.1175/2012BAMSStateoftheClimate.1, 2012.
Martinotti, M. E., Pisano, L., Marchesini, I., Rossi, M., Peruccacci, S., Brunetti, M. T., Melillo, M., Amoruso, G., Loiacono, P., Vennari, C., Vessia, G., Trabace, M., Parise, M., and Guzzetti, F.: Landslides, floods and sinkholes in a karst environment: the 1–6 September 2014 Gargano event, southern Italy, Nat. Hazards Earth Syst. Sci., 17, 467–480, https://doi.org/10.5194/nhess-17-467-2017, 2017.
Mendes, R. M., Andrade, M. R. M., Graminha, C. A., Prieto, C., Ávila, F. F., Camarinha, P. I.: Stability Analysis on Urban Slopes: Case Study of an Anthropogenic-Induced Landslide in São José dos Campos, Brazil, Geotech. Geol. Eng., 36, 599–610, https://doi.org/10.1007/s10706-017-0303-z, 2018a.
Mendes, R. M., de Andrade, M. R. M., Tomasella, J., de Moraes, M. A. E., and Scofield, G. B.: Understanding shallow landslides in Campos do Jordão municipality – Brazil: disentangling the anthropic effects from natural causes in the disaster of 2000, Nat. Hazards Earth Syst. Sci., 18, 15–30, https://doi.org/10.5194/nhess-18-15-2018, 2018b.
Minghini, M. and Frassinelli, F.: OpenStreetMap history for intrinsic quality assessment: Is OSM up-to-date?, Open Geospatial Data Softw. Stand., 4, 1–17, https://doi.org/10.1186/s40965-019-0067-x, 2019.
Mitchell, M. J., Arritt, R. W., and Labas, K.: A climatology of the warm season Great Plains low-level jet using wind profiler observations, Weather Forecast., 10, 576–591, https://doi.org/10.1175/1520-0434(1995)010<0576:ACOTWS>2.0.CO;2, 1995.
Myers, N., Mittermeier, R. A., Mittermeier, C. G., Fonseca, G. A. B., and Kent, J.: Biodiversity hotspots for conservation priorities, Nature, 403, 853–858, https://doi.org/10.1038/35002501, 2000.
Nehren, U., Schlüter, S., Raeding, C., Sattler, D., and Hissa, H. (Eds.): Strategies and Tools for a Sustainable Rural Rio de Janeiro, Springer Series on Environmental Management, https://doi.org/10.1007/978-3-319-89644-1_20, 2018.
Ohlmacher, G. C.: Plan curvature and landslide probability in regions dominated by Earth flows and Earth Slides, Eng. Geol., 91, 117–134, https://doi.org/10.1016/j.enggeo.2007.01.005, 2007.
Parida, B. R., Collado, W. B., Borah, R., Hazarika, M. K., and Samarakook, L.: Detecting drought-prone areas of rice agriculture using a MODIS-derivd soil moisture index, GIScience and Remote Sensing, 45, 109–129, 2008.
Penha, M. M., Ferrari, A. L., Junho, M. C. B., Souza, S. L. A., and Brennes, T. L.: Projeto Carta Geológica do Estado do Rio de Janeiro: Folha Itaipava, Technical report, vol. 1, Convênio DRM/IG-UFRJ, Rio de Janeiro, Brazil, http://www.cprm.gov.br/publique/Gestao-Territorial/Geologia%2C-Meio-Ambiente-e-Saude/Projeto-Rio-de-Janeiro-3498.html (last access: 3 May 2022), 1981.
Pisano, L., Zumpano, V., Malek, Z., Rosskopf, C. M., and Parise, M.: Variations in the susceptibility to landslides, as a consequence of land cover changes: a look to the past, and another towards the future, Sci. Total Environ., 601–602, 1147–1159, 2017.
Reichenbach, P., Rossi, M., Malamud, B., Mihir, M., and Guzzetti, F.: A review of statistically-based landslide susceptibility models, Earth-Sci. Rev., 180, 60–91, https://doi.org/10.1016/j.earscirev.2018.03.001, 2018.
Reis, A. A., Fernandes, W. S., and Ramos, M.-H.: Assessing two precipitation data sources at basins of special interest to hydropower production in Brazil, Brazilian Journal of Water Resources, 25, 1–16, https://doi.org/10.1590/2318-0331.252020190068, 2020.
Rosi, A., Canavesi, V., Segoni, S., Nery, T. D., Catani, F., and Casagli, N.: Landslides in the Mountain Region of Rio de Janeiro: A Proposal for the Semi-Automated Definition of Multiple Rainfall Thresholds, Geosciences, 9, 1–15, https://doi.org/10.3390/geosciences9050203, 2019.
Schlossmacher, E. J.: An Iterative Technique for Absolute Deviations Curve Fitting, J. Am. Stat. Assoc., 68, 857–859, https://doi.org/10.2307/2284512, 1973.
Silva, R. F. B., Batistella, M., Moran, E. F., and Liu, D.: Land changes fostering Atlantic Forest transition in Brazil: Evidence from the Paraíba Valley, Prof. Geogr., 69, 80–93, https://doi.org/10.1080/00330124.2016.1178151, 2017.
Souza Jr., C. M., Shimbo, J. Z., Rosa, M. R., Parente, L. L., Alencar, A. A., Rudorff, B. F. T., Hasenack, H., Matsumoto, M., Ferreira, L. G., Souza-Filho, P. W. M., de Oliveira, S. W., Rocha, W. F., Fonseca, A. V., Marques, C. B., Diniz, C.,G., Costa, D., Monteiro, D., Rosa, E. R., Vélez-Martin, E., Weber, E. J., Lenti, F. E. B., Paternost, F. F., Pareyn, F.,G.,C., Siqueira, J. V., Viera, J. L., Neto, L. C. F., Saraiva, M. M., Sales, M. H., Salgado, M. P. G., Vasconcelos, R., Galano, S., Mesquita, V. V., and Azevedo, T.: Reconstructing Three Decades of Land Use and Land Cover Changes in Brazilian Biomes with Landsat Archive and Earth Engine, Remote Sens., 12, 1–17, https://doi.org/10.3390/rs12172735, 2020.
Wang, J., Dong, X., Kennedy, A., Hagenhoff, B., and Xi, B.: A regime-based evaluation of southern and northern great plains warm-season precipitation events in WRF, Weather Forecast., 34, 805–831, 2019.
Zhan, Z., Qin, Q., and Wang, X.: The Application of LST/NDVI Index for Monitoring Land Surface Moisture in Semiarid Area, Geoscience and Remote Sensing, IGARSS 2004, 2004 IEEE International Geoscience and Remote Sensing Symposium, 20–24 September 2004, Anchorage, AK, USA, IEEE, 3, 1551–1555, https://doi.org/10.1109/IGARSS.2004.1370609, 2004.