the Creative Commons Attribution 4.0 License.
the Creative Commons Attribution 4.0 License.
 | 16 Mar 2023
A non-extensive approach to probabilistic seismic hazard analysis
Sasan Motaghed
Mozhgan Khazaee
Nasrollah Eftekhari
Mohammad Mohammadi
We modify the probabilistic seismic hazard analysis (PSHA) formulation by replacing the Gutenberg–Richter power law with the SCP (Sotolongo-Costa and Posadas) non-extensive model for earthquake size distribution and call it NEPSHA. The SCP claimed to model the regional seismicity better than the classical models. The proposed method (NEPSHA) is implemented in the Tehran region, and the results are compared with the classic PSHA method. The hazard curves show that NEPSHA gives a higher hazard, especially in the range of practical return periods. The uniform hazard spectra of NEPSHA provide more spectral accelerations, especially for the medium-height buildings, which are the most common urban structures.
- Article
(3055 KB) - Full-text XML
- BibTeX
- EndNote


PSHA (probabilistic seismic hazard analysis) is the most widely used approach to estimate the seismic load for use in engineering design processes. The main objective of PSHA computations is to calculate ground motions with different exceedance probabilities during a specific time interval (Anbazhagan et al., 2019). This information is the gateway to defining the possible scenario earthquakes and is used to develop instructions for seismic codes and standard regulations (Iervolino, 2022).
In the PSHA procedure, the average annual rate of exceeding a particular threshold value, x, of a ground motion intensity measure (IM), is computed as (Cornell, 1968)
where nflt is the number of causative faults, and υ is the mean annual frequency of occurrence of earthquakes with magnitudes between a lower-bound threshold value, mmin, and an upper-bound threshold value, mmax. Also, M and R denote the moment magnitude and the source-to-site distance, respectively. The term GIM|M,R provides the probability that an IM exceeds a value of x given the occurrence of an earthquake of magnitude m at distance r. This term can be calculated using ground motion prediction equations. The term fM represents the probability density function (PDF) of the earthquake magnitude and fR|M denotes the PDF of distance r conditional on m.
Determining the function of fM is a challenging task in PSHA computations. This function should be calculated using the frequency–magnitude relationship, which represents the background seismicity of the study region. Previous studies showed that the characteristics of such a relationship significantly affect the results of PSHA (Yazdani et al., 2015; Motaghed et al., 2021). Thus, there has been a continued interest in selecting the best representative expression for the frequency–magnitude relation.
Currently, the most commonly used model to reflect the frequency–magnitude distribution in the PSHA procedure is based on the Gutenberg–Richter (GR) law (Gutenberg and Richter, 1956). This model represents a linear relationship between the logarithm of the frequency and magnitude as log10N(m)=a-bM, where N is the number of events with a magnitude greater than or equal to m in a given region and specified time period, and a and b are constants. So magnitudes obey the power law distribution. The total number of earthquakes with magnitudes greater than mmin is represented by 10a, and b (commonly referred to as b value) is the slope of the fitted line. The b value describes the specific relationship between the magnitude and the total number of earthquakes commonly close to 1.0 in seismically active regions. This simple linear relation can also be written in the form of N(m)= exp(α-βM), in which α=aln(10) and β=bln(10). The PDF of N(m) is then given by
This function is a double truncated form of the GR law (Žalohar, 2018).
Contrary to the widespread use of the GR model in the PSHA studies, some researchers reported that earthquake magnitudes do not always follow this distribution (Schwartz and Coppersmith, 1984; Youngs and Coppersmith, 1985; Wesnousky, 1994; Ishibe and Shimazaki, 2008). This is especially the case in situations where the seismic region consists of individual faults or fault segments with regular geometries (Ishibe and Shimazaki, 2008). In these situations, the GR model may not represent the seismicity over the entire magnitudes range. Also, while the GR recurrence model may well represent the distribution of small earthquake magnitudes, it underestimates the frequency of large earthquakes (Kramer, 1996; Youngs and Coppersmith, 1985; Parsons and Geist, 2009).
To cope with these problems, some alternative models to the power law have been developed by researchers, such as bilinear (Staudenmaier et al., 2018), quadratic law (Merz and Cornell, 1973), generalized Pareto distribution-based model, and random GR model (Dutfoy and Senfaute, 2021). Nevertheless, one of the most exciting models for earthquake recurrence has been proposed by Sotolongo-Costa and Posadas (2004), which is named the SCP model. The framework of this model has been developed based on the Tsallis non-extensive approach (Tsallis, 1988). Generally, the non-extensive Tsallis entropy has been the focus of much attention over the last 4 decades (Vallianatos et al., 2016a). It is thought that this non-extensive formulation presents an appropriate tool for investigating complex systems, especially in their nonequilibrium stationary states (Silva et al., 2006; Vallianatos et al., 2016a, 2018). Vallianatos et al. (2014) use the Tsallis entropy approach to identify precursors in the earthquake generation process. The SCP model characterizes two profiles interacting via fragments filling the gap between them. This model has the advantage of representing the size distribution of fragments on the energy distribution of earthquakes. Also, the SCP model deduced an energy distribution function, which gives the GR law as a particular case (Telesca, 2012).
Despite its unique features, the SCP model has not yet been included directly in PSHA computations. This study aims to address this gap by providing a practical framework. To this end, the PDF form of the SCP model should be calculated and substituted in the classical PSHA integral. The details of this approach will be described in the following sections. This PSHA procedure that considers the seismicity model based on the non-extensive statistical physics is called here a non-extensive PSHA (NEPSHA). Finally, to investigate the differences between the results of the NEPSHA and the classical framework of PSHA, we compare these approaches via a practical example.
This section describes the non-extensive theoretical basis of the SCP model. Generally, statistical mechanics uses statistical methods to describe systems with high degrees of freedom. In this way, the randomness and chaos resulting from internal imperfections can be processed (Englman et al., 1988). To use this concept in the representation of fault rupture, the Boltzmann–Gibbs statistics can be used. The Boltzmann–Gibbs entropy, S, is given by
where pi is the probability of the microscopic state i, k is Boltzmann's constant, and W is the total number of small-scale states (Sotolongo-Costa et al., 2000). Tsallis' statistics generalizes the Boltzmann–Gibbs statistics in what concerns the concept of entropy. It should be noted that fractioning is a paradigm of non-extensivity, since the fractured object can be regarded as a collection of divided parts with larger entropy than their union. So, if the parts or fragments in which the object is denoted by Ai (s), its entropy, S, is , where U is the “Union” symbol. This inequality defines a “superextensivity” (Tsallis et al., 1998) in the system. So, it is necessary to use non-extensive statistics instead of Boltzmann–Gibbs statistics (Sotolongo-Costa et al., 2000). Such formalism has been proposed by Tsallis (Tsallis, 1988) as
where kB is the Boltzmann constant, p denotes the probability of finding a fragment of surface σ (defined as a characteristic surface of the system), and q is the non-extensive parameter. Accordingly, the q logarithmic function is defined as
The mechanism of triggering earthquakes is established through the combination of the irregularities of the fault planes and the distribution of fragments between them. The basic idea in the SCP model is the fact that the surfaces of the fault planes (interface) are irregular, and the fragments filling the space between them have diverse irregular shapes. Previous studies reveal that the Boltzmann–Gibbs statistics cannot account for the presence of scaling in the size distribution of fragments (Englman et al., 1988). So, violent fractioning is a nonextensive phenomenon, and a nonextensive representation is necessary for its explanation. In the SCP model, the fragment distribution function emerges naturally from a non-extensive framework. So, the energy distribution function is given by (Sotolongo-Costa and Posadas, 2004)
where aSCP is the constant of proportionality between released energy and fault rupture length. This expression describes the energy distribution in all detectable ranges of magnitudes very well, unlike the empirical formula of GR (Sotolongo-Costa and Posadas, 2004).
Non-extensive models have attracted the attention of researchers in various branches of earth science. Some researchers have made modifications in the SCP model and tried to improve the seismicity description (Silva et al., 2006; Telesca, 2012). Due to the advantage of the non-extensive methods, researchers have tried to fit them to the regional data, calculate the parameters of the models, and describe the seismicity (Sarlis et al., 2010; Matcharashvili et al., 2011; Valverde-Esparza et al., 2012; Vallianatos and Michas, 2020). Also, models based on Tsallis entropy have been used to determine the precursors (Eftaxias, 2010). Interestingly, these models have also been used to describe marsquakes (da Silva and Corso, 2021). Vallianatos et al. (2016b, 2018) have provided two comprehensive reviews of these methods. In this way, trying to rewrite the well-known PSHA method based on the non-extensive approach can be helpful.
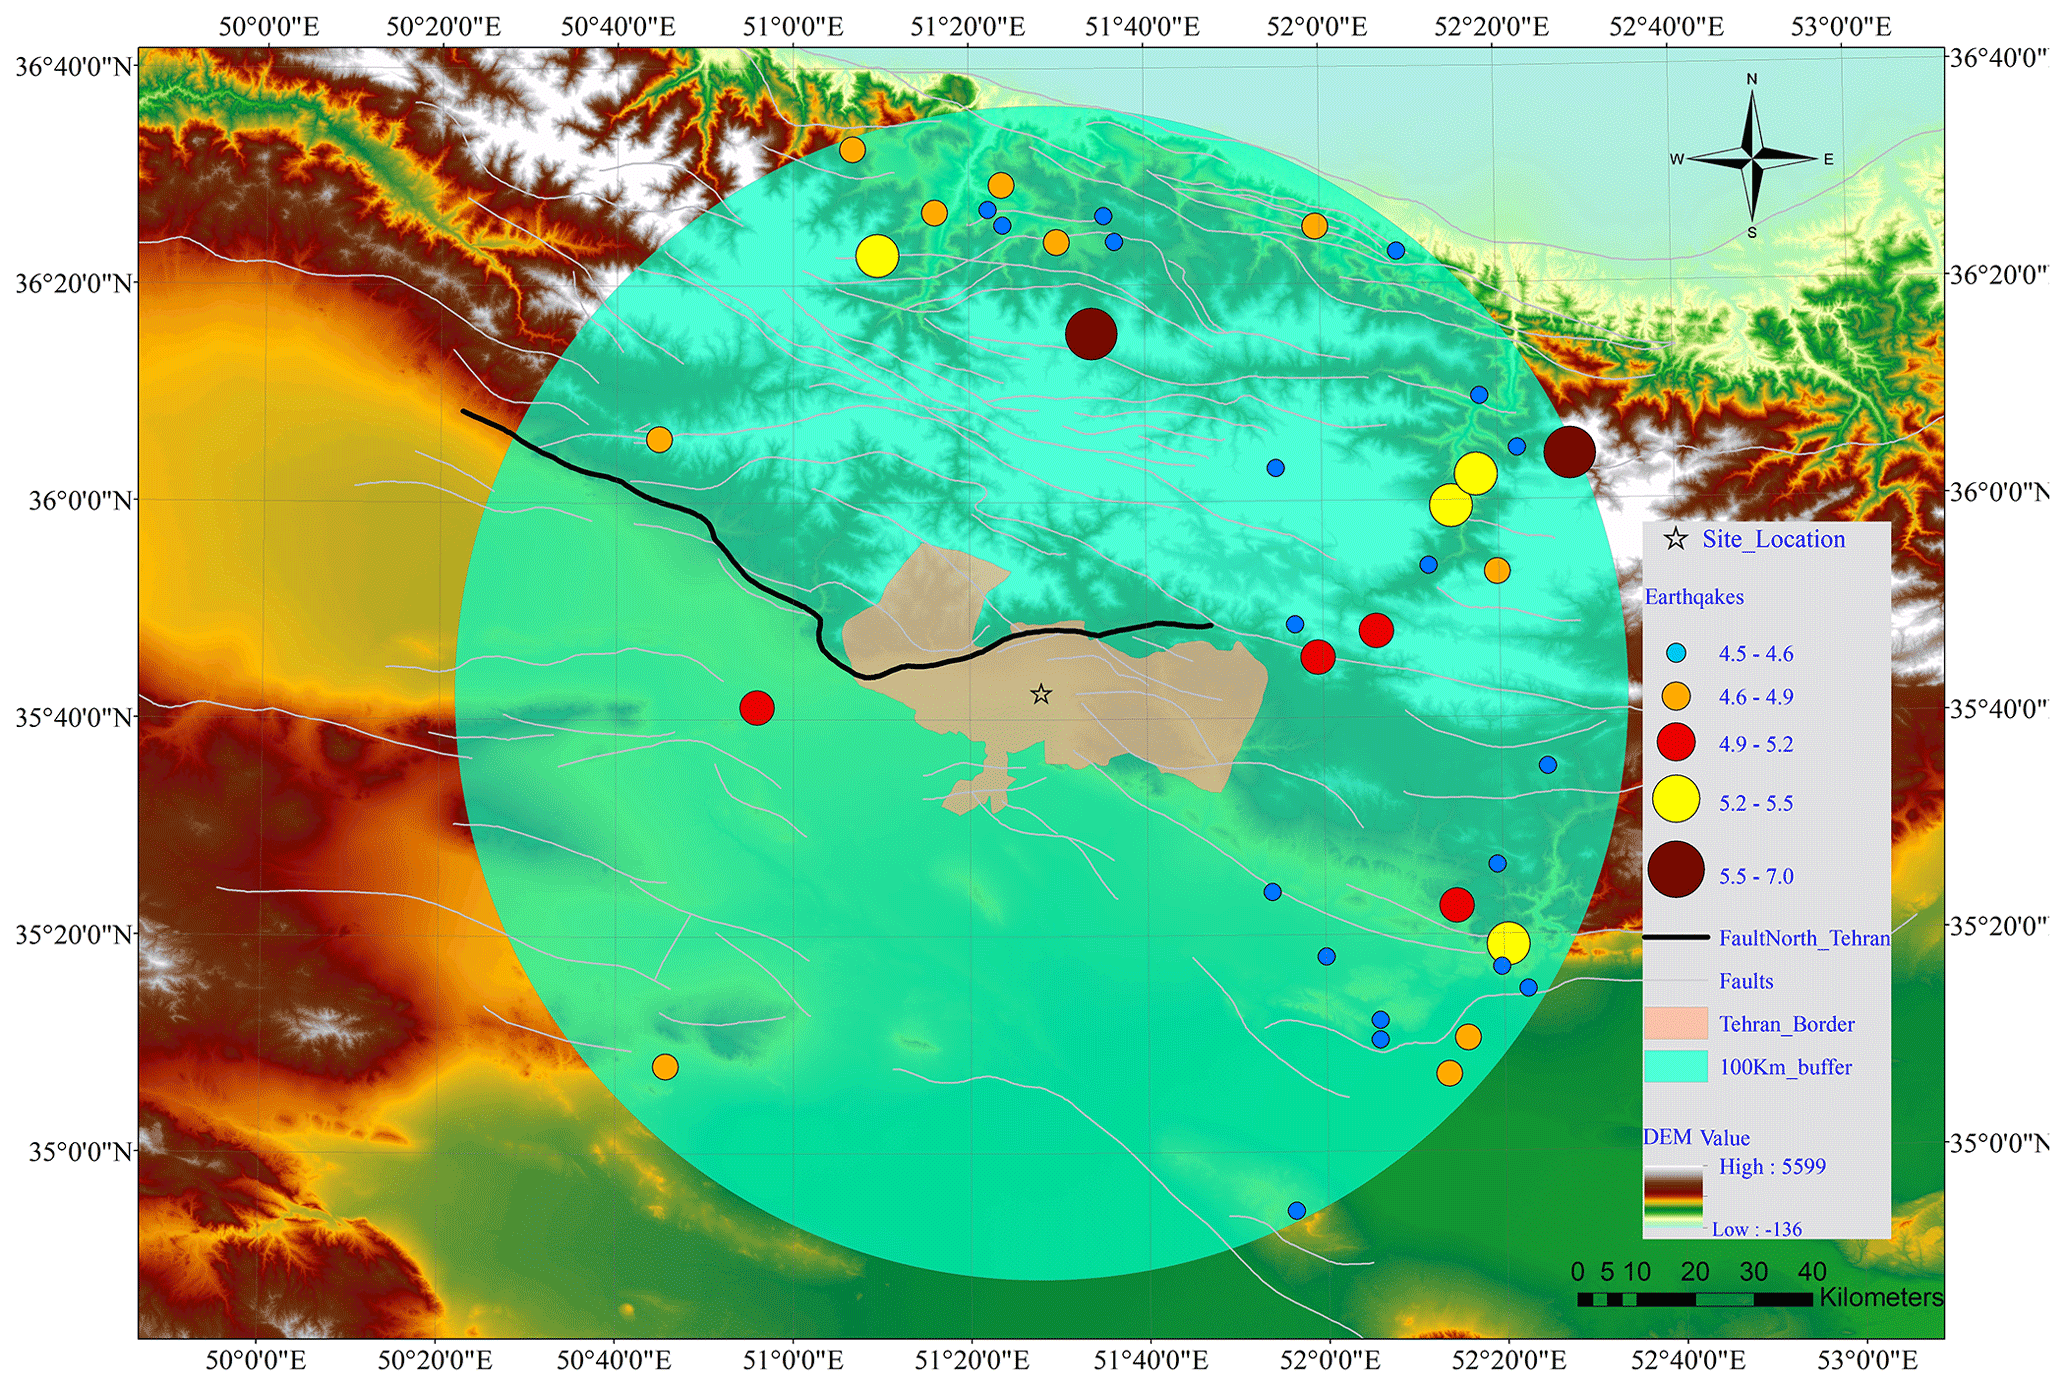
Figure 1The location of the North Tehran fault, the border of the city, and selected sites for seismic hazard analysis. The spatial distribution of earthquakes used in the analysis (within a 100 km buffer around the site) is also shown in this figure.
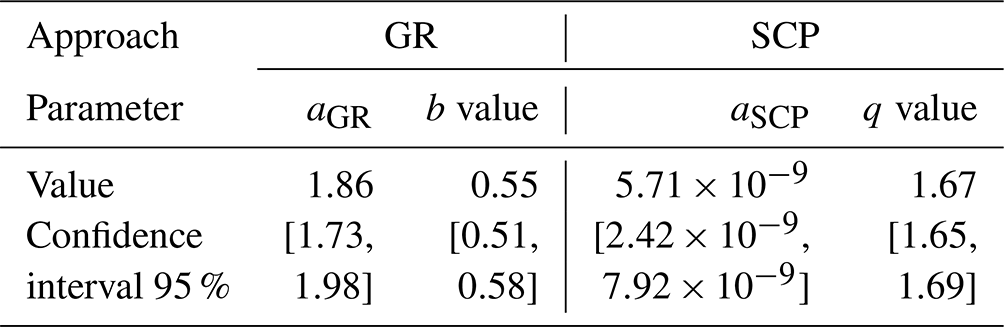
Table 1Calculated seismicity parameters for the study area for GR and SCP.
Equation (6) indicates the number of earthquakes in magnitude bins. In order to include this relationship in the PSHA calculations, it must be written as a distribution function, which is the core of this research and will be described in this section.
Tectonic faults produce earthquakes of various sizes (i.e. magnitudes). Regarding Eq. (6), the SCP model describes the size distribution of earthquakes as
If m=mmin, this equation yields
Therefore, the cumulative distribution function (CDF) of the magnitudes of earthquakes, FM(m), larger than mmin can be written as
where and . This equation is similar to the non-extensive expression of Telesca (Telesca, 2012), except that it uses the minimum magnitude, mmin, instead of the completeness magnitude. We can compute the PDF of M by taking the derivative of the CDF, as
where fM(m) denotes the PDF of M. Note that the PDF given in Eq. (10) relies on the SCP formulation of Eq. (8), which represents magnitudes without an upper limit. Earthquake magnitude essentially has an upper limit (mmax). Rewritten Eq. (8) with the mmax is
and Eq. (10) becomes
This doubly truncated magnitude distribution can be termed a bounded SCP recurrence law.

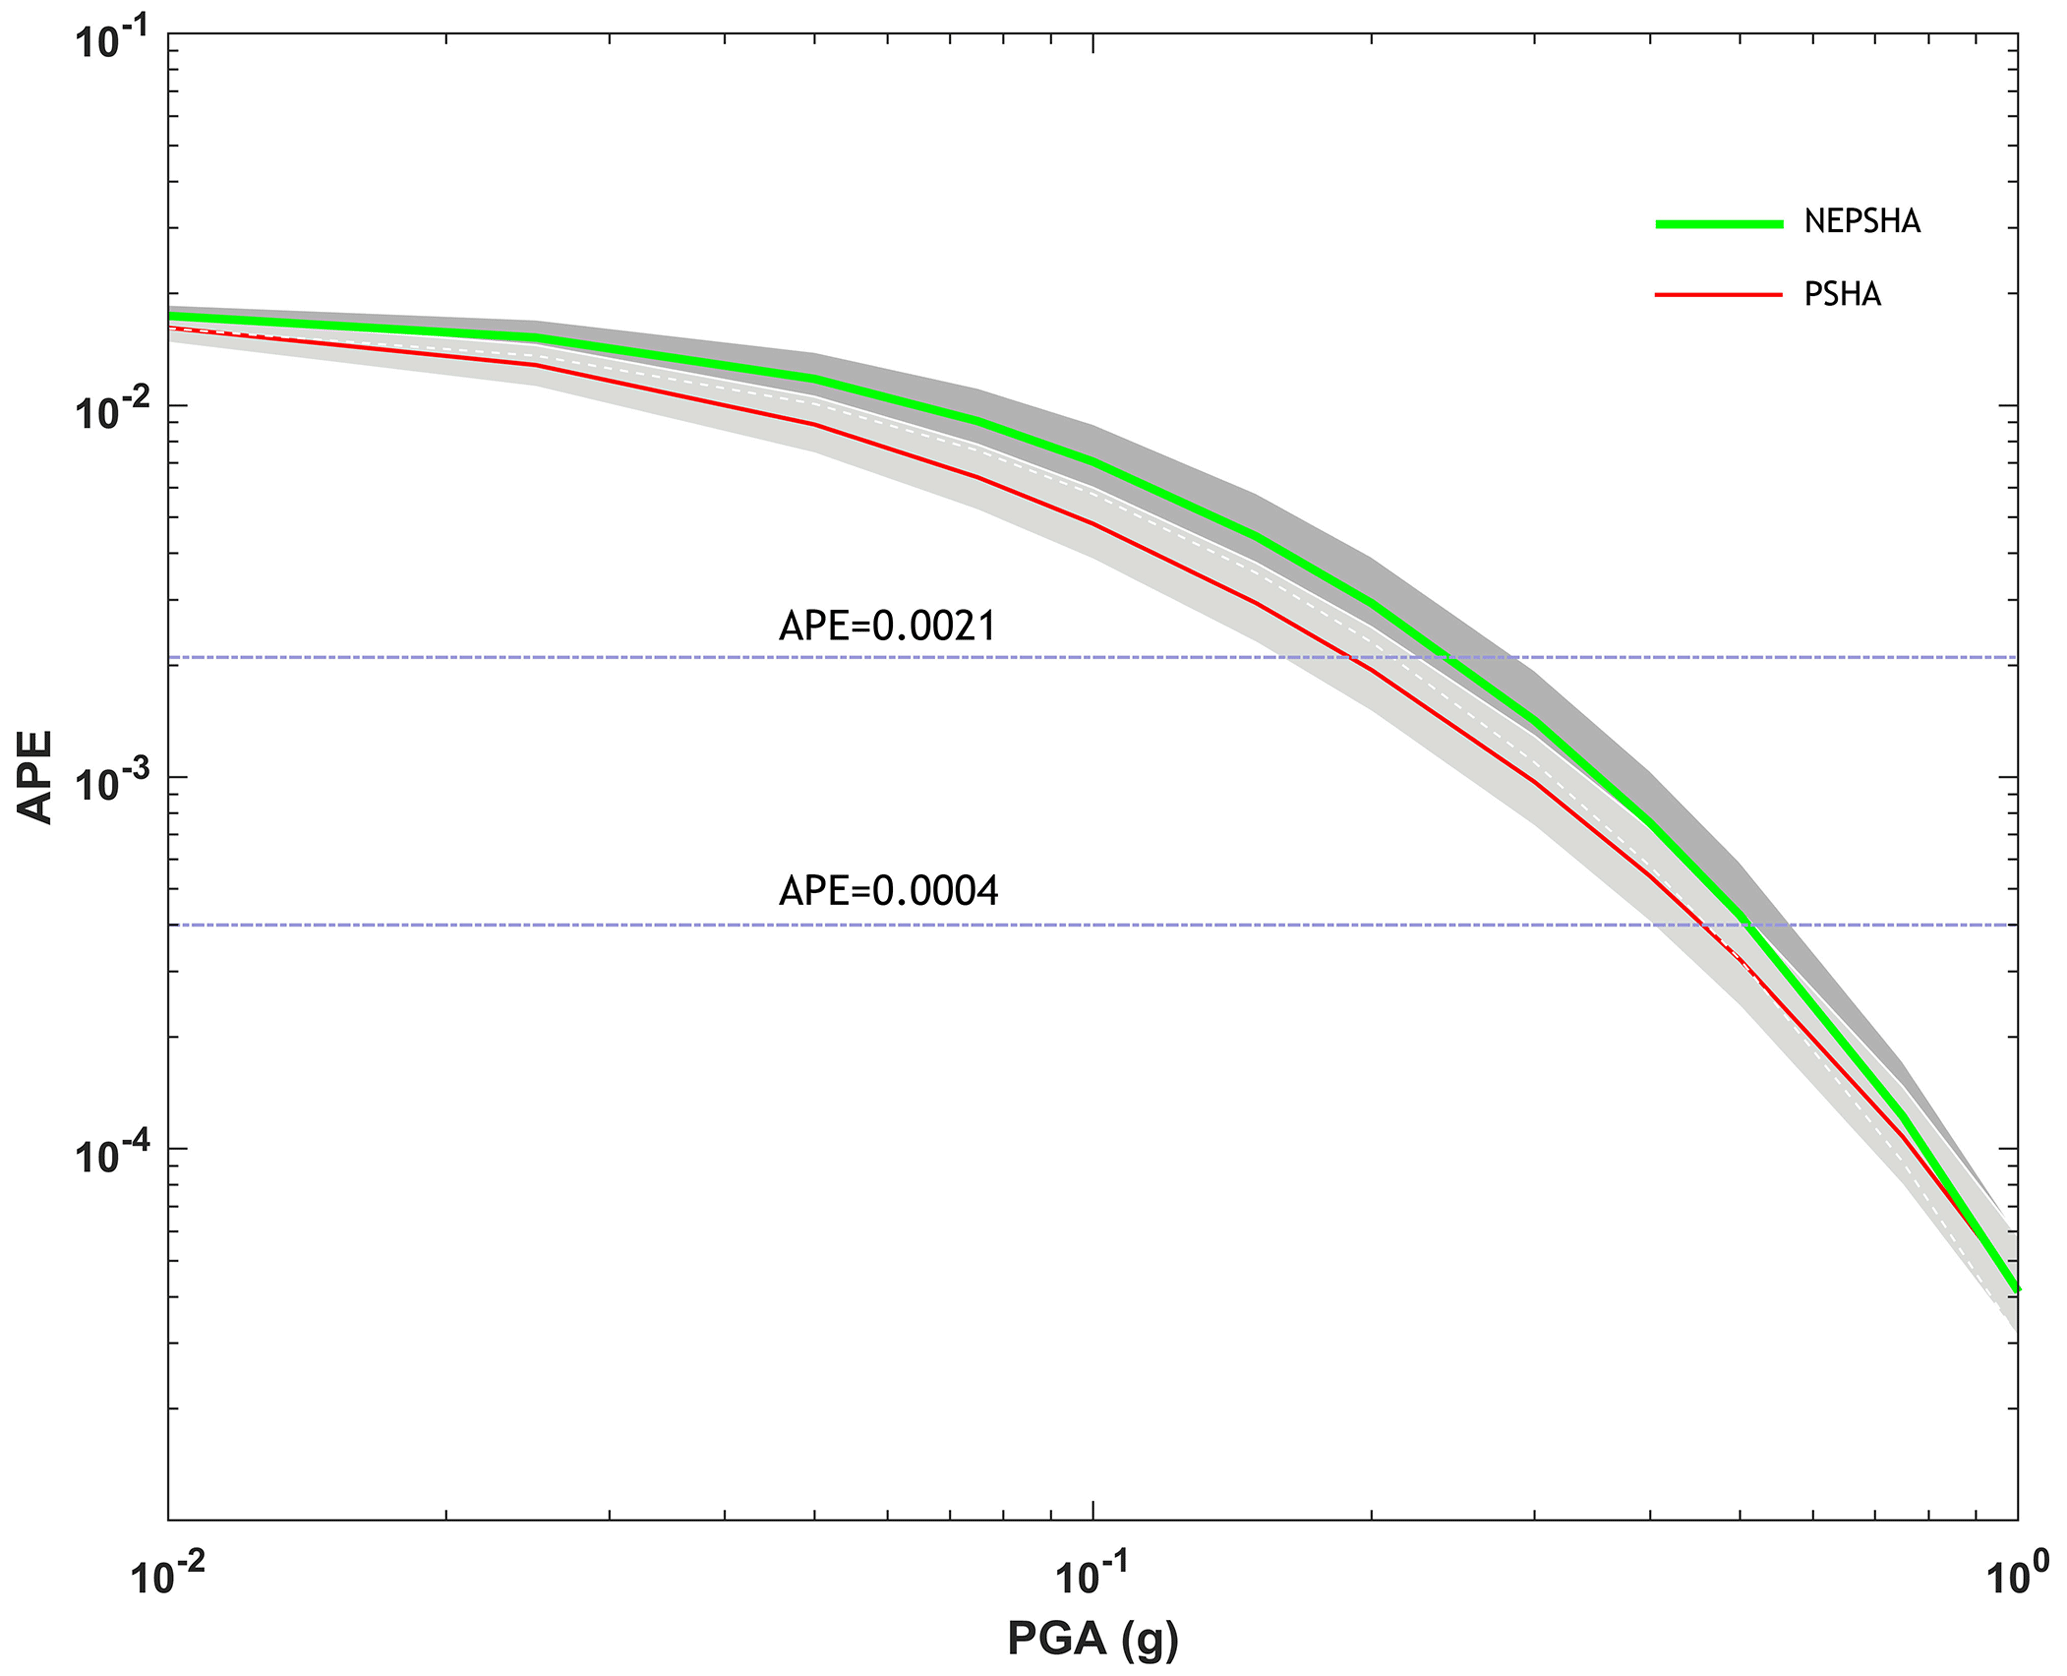
Figure 3Hazard curves and 95 % confidence intervals based on PSHA and NEPSHA approaches for peak ground acceleration (PGA).
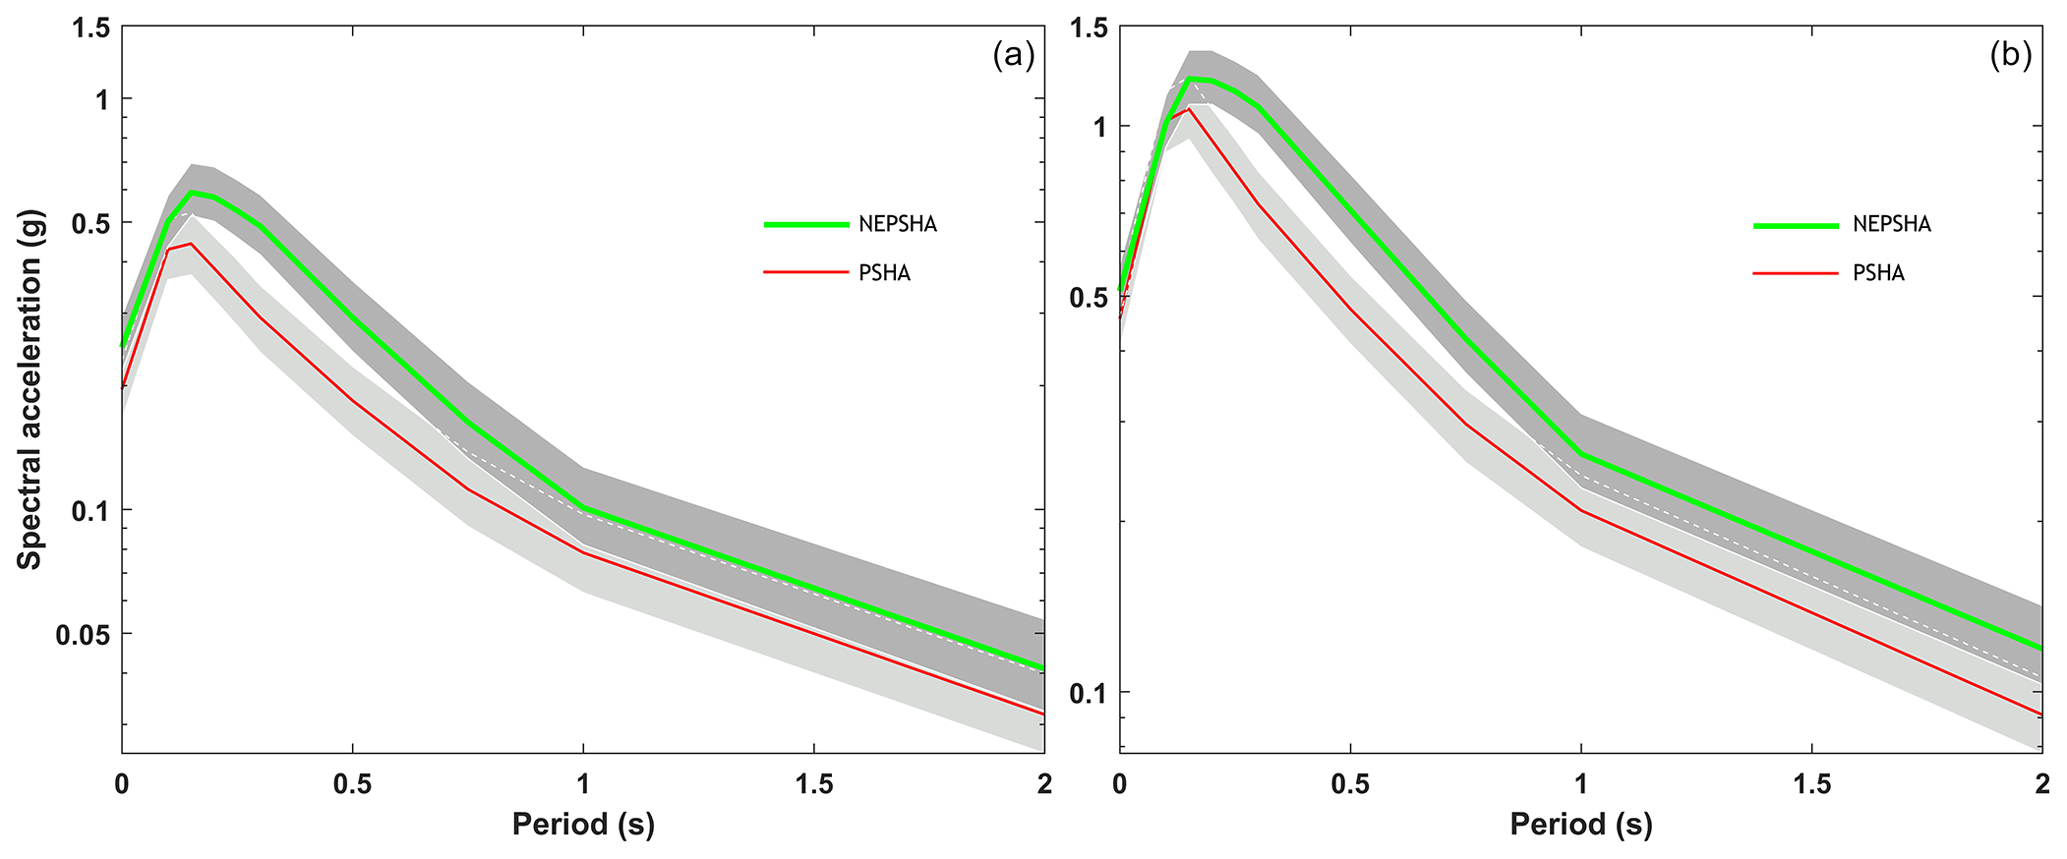
Figure 4The uniform hazard spectra and 95 % confidence intervals based on NEPSHA and PSHA for the probability of exceedance of (a) 10 % in 50 years and (b) 2 % in 50 years.
The appropriateness of this relationship can be evaluated by its compliance with regional data. This issue is later examined in the practical example.
For our later PSHA equations, we will convert the continuous distribution of magnitudes into a discrete set of magnitudes. Probabilities of occurrence of these discrete sets of magnitudes, assuming that they are the only possible magnitudes, are computed as follows:
where mj is the discrete set of magnitudes, ordered so that . This calculation assigns the probabilities associated with all magnitudes between mj and mj+1 to the discrete value mj. As long as the discrete magnitudes are closely spaced, the approximation will not affect numerical results. In practice, magnitude spacing of 0.1 or less is appropriate.
Now, by substituting Eq. (12) instead of Eq. (2) in the classical PSHA (i.e. Eq. 1), we present a non-extensive entropy-based approach to PSHA. We call the new approach non-extensive probabilistic seismic hazard analysis (NEPSHA). In this way, the physics-based recurrence law of the non-extensive SCP method will be entered into the hazard calculations. As mentioned before, if the bounded SCP recurrence law shows a better match with regional data, the use of NEPSHA will be on a more correct basis than the classical PSHA. It therefore may lead to more correct results of regional hazard. Thus, this approach provides a new possibility for modeling regional seismic conditions and hazard calculation.
As mentioned in the previous section, some modifications have been suggested for the SCP model (Silva et al., 2006; Telesca, 2012; Vallianatos et al., 2016a, b; da Silva and Corso, 2021). Although these modifications are very helpful in improving the method, the purpose of this paper is to provide a framework for incorporating the non-extensive models into the seismic hazard analysis process. Therefore, the basic approach of the SCP method is used as the basis of the work in this article. Obviously, by providing such a framework, it will be also possible to use modified SCP methods.
To highlight the effect of the proposed method on the hazard results, we implement the proposed method as a case study in the Tehran metropolitan area. This city is located in one of the most active zones in the south of the Alborz seismic zone (Berberian and Yeats, 1999). For simplicity, in this study, the hazard of a single site from a single seismic fault was considered. Therefore, only one of the major active faults near Tehran, i.e. the North Tehran fault, was considered. Figure 1 shows the location of the North Tehran fault seismic source. The selected site for PSHA was located at latitude and longitude coordinates of [35.59∘ N, 51.41∘ E].
In order to have a reliable estimate of the seismicity parameters, a homogeneous and complete earthquake catalog is required. In this study, the data were elicited from the USGS catalog (USGS, 2022), which covers the earthquake events from the fourth century BCE to 2022. However, since there is no clear approach to include historical earthquakes in the estimation of seismicity parameters using the SCP method, it was decided to neglect the historical earthquakes in this study. So only instrumental earthquakes (i.e. those earthquakes recorded after 1900 AD) are considered here. After unifying magnitude units using the Mousavi-Bafrouei et al. (2014) relationships, the dependent shocks have been removed from the earthquake catalog using the time and distance windows methods proposed by Gardner and Knopof (1974) and Uhrhammer (1986).
The GR seismicity parameters (i.e. the rate of seismicity and b value) are computed using the Kijko's maximum likelihood method (Kijko and Sellevoll 1989; Kijko, 2004). For this end, a MATLAB program (HA3) written by Kijko et al. (2016) has been utilized. Also, the SCP seismicity parameters have been calculated using a code written in the R language (R Core Team, 2021) based on the maximum likelihood method (Telesca, 2012). In this study, the parameters of both GR and SCP methods have been calculated based on the same data and assumptions. Table 1 demonstrates the seismicity parameters of the GR and SCP methods. Figure 2 shows the fitted curves of GR and SCP. In this figure, the empirical cumulative distribution function (ECDF) of observed data and declustered data is also shown. Note the initial curvature of the SCP model which differs from the GR model. Visually, the SCP has a better fit for the data. The residual sum of squares of SCP and GR models are 0.01453 and 0.03563, respectively, which supports the previous conclusion.
Other required information for seismic hazard analysis, including the fault geometry and location, the earthquake magnitude limits in the given region, Mmin,and Mmax, and local site characteristics, were considered identical in both PSHA and NEPSHA and extracted from eligible studies (Gholipour et al., 2008; Yazdani et al., 2017). In this study, the ground motion prediction equation of Yazdani and Kowsari (2013) is used in hazard calculation. This relationship provides spectral acceleration at different spectral periods.
Figure 3 shows the results of PSHA and NEPSHA for the selected site in the Tehran metropolitan area in terms of hazard curves for the selected site in Tehran. As shown in Fig. 3, the annual probability of exceedance (APE) is identical for both approaches (PGA = 0.01 g). As the PGA increases, the difference between the two hazard approaches also increases. The APE obtained from the NEPSHA is greater than the value obtained from the PSHA. For PGAs greater than 0.1 g, the difference is approximately constant. Therefore, it can be concluded that the NEPSHA approach gives higher results, especially in higher PGAs. The 95 % confidence intervals for PSHA and NEPSHA are also shown in this figure.
Also, the uniform hazard spectra (UHS) with 5 % damping, based on the classic PSHA and NEPSHA with a probability of exceedance of 10 % and 2 % in 50 years, are shown in Fig. 4. These spectra are essentially derived from hazard curves and cover a broad range of spectral periods. To construct UHS from a set of hazard curves, one can conceptualize this process as simply extracting from multiple hazard curves all of the intensity measure levels for a given APE. In the hazard spectrum curves for 2 % exceedance probability in 50 years (Fig. 4a), the values obtained based on NEPSHA are higher than those obtained from classic PSHA. The difference is considerable in the period range of 0.2 to 1 s, corresponding to the height range of usual urban buildings. The difference gets smaller for tall buildings. In the uniform hazard spectra for 10 % exceedance in 50 years (Fig. 4b), the same behavior is observed, but in the high periods, the two curves are closer to each other than in the previous case. The 95 % confidence intervals for PSHA and NEPSHA are also shown in this figure.
Magnitude-frequency or recurrence relationship is an essential component of PSHA, which provides the cumulative rate of occurrence of earthquakes within a seismic source zone as a function of magnitude. For many years, the Gutenberg–Richter relationship has been the governing paradigm in the energy distribution of earthquakes. However, the Gutenberg–Richter relationship still fits well with medium-sized earthquakes, but in small and large magnitude earthquakes it deviates significantly. The core idea of this paper is that replacing the statistics-based equation of Gutenberg–Richter's with an equation based on the physics of events can improve the hazard results. Here, the model presented by Sotolongo-Costa and Posadas (2004) on the interaction of barrier and asperity (SCP model) was developed and included in the PSHA process. The irregular geometry of the interacting plates and the fragments filling the space between them is the main factor considered in the numerical modeling of the SCP model. To this end, first, we derived the bounded SCP recurrence law. Then, by fitting this curve to the regional seismicity data, regional seismicity parameters are extracted. The better fit of this curve can be measured compared to the Gutenberg–Richter law. We founded the NEPSHA approach by rewriting the PSHA equation with a bounded SCP recurrence law. The numerical example in the Tehran region shows the significant increase in the hazard of NEPSHA compared to PSHA. The difference is more considerable in the range of ordinary building height.
Code used in this research can be obtained from the first author upon reasonable request.
The resulting data can be obtained from the first author upon reasonable request.
SM, MK, and MM conceptualized this study. MM and NE developed the software and carried out the formal analysis; NE and SM prepared the paper.
The contact author has declared that none of the authors has any competing interests.
Publisher's note: Copernicus Publications remains neutral with regard to jurisdictional claims in published maps and institutional affiliations.
This paper was edited by Filippos Vallianatos and reviewed by two anonymous referees.
Anbazhagan, P., Bajaj, K., Matharu, K., Moustafa, S. S. R., and Al-Arifi, N. S. N.: Probabilistic seismic hazard analysis using the logic tree approach – Patna district (India), Nat. Hazards Earth Syst. Sci., 19, 2097–2115, https://doi.org/10.5194/nhess-19-2097-2019, 2019.
Berberian, M. and Yeats, R. S: Patterns of historical earthquake rupture in the Iranian Plateau, Bull. Seismol. Soc. Am., 89, 120–139, https://doi.org/10.1016/b978-0-444-63292-0.00016-8, 1999.
Cornell, C. A.: Engineering seismic risk analysis, Bull. Seismol. Soc. Am., 58, 1583–1606, https://doi.org/10.1785/BSSA0580051583, 1968.
da Silva, S. L. E. and Corso, G.: Nonextensive Gutenberg–Richter law and the connection between earthquakes and marsquakes, Eur. Phys. J. B., 94, 1–5, https://doi.org/10.1140/epjb/s10051-020-00015-5, 2021.
Dutfoy, A. and Senfaute, G.: A New Generation of Earthquake Recurrence Models Based on The Extreme Value Theory and Impact on Probabilistic Seismic Hazard Assessments, PREPRINT (Version 3), Research Square, https://doi.org/10.21203/rs.3.rs-293705/v1, 2021.
Eftaxias, K.: Footprints of nonextensive Tsallis statistics, selfaffinity and universality in the preparation of the L'Aquila earthquake hidden in a pre-seismic EM emission, Phys. A Stat. Mech. App., 389, 133–140, https://doi.org/10.1016/j.physa.2009.08.034, 2010.
Englman, R., Rivier, N., and Jaeger, Z.: The problem of priors in the maximum entropy derivation of fragment-size distributions, Nucl. Phys. B (Proc. Suppl.), 5, 345–349, https://doi.org/10.1016/0920-5632(88)90067-9, 1988.
Gardner, J. K. and Knopof, L.: Is the sequence of earthquakes in Southern California, with aftershocks removed, Poissonian?, Bull. Seismol. Soc. Am., 64, 1363–1367, https://doi.org/10.1785/bssa0640051363, 1974.
Gholipour, Y., Bozorgnia, Y., Rahnama, M., Berberian, M., and Shojataheri, J: Probabilistic seismic hazard analysis, phase I–greater Tehran regions, Final report, Faculty of Engineering, University of Tehran, Tehran, Iran, 2008.
Gutenberg, B. and Richter, C.: Magnitude and energy of earthquakes, Annali de Geofisica, v. 9, https://doi.org/10.4401/ag-5590, 1956.
Iervolino, I.: Ground-Motion Observations and Probabilistic Seismic Hazard: Frequently Asked Questions, Seis. Res. Lett., 93, 2360–2366, https://doi.org/10.1785/0220210321, 2022.
Ishibe, T. and Shimazaki, K.: The Gutenberg-Richter relationship vs. the Characteristic Earthquake model: effects of different sampling methods, Bull. Earth. Res. Insti, 83, 131–151, https://doi.org/10.1002/essoar.10505896.1, 2008.
Kijko, A.: Estimation of the maximum earthquake magnitude, mmax, Pure Appl. Geophys., 161, 1655–1681, https://doi.org/10.1007/s00024-004-2531-4, 2004.
Kijko, A. and Sellevoll, M. A.: Estimation of earthquake hazard parameters from incomplete data Bles. Part I. Utilization of extreme and complete catalogs with different threshold magnitudes, Bull. Seismol. Soc. Am., 79, 645–654, https://doi.org/10.1785/BSSA0790030645, 1989.
Kijko, A., Smit, A., and Sellevoll, M. A.: Estimation of earthquake hazard parameters from incomplete data Bles. Part III. Incorporation of uncertainty of earthquake-occurrence model, Bull. Seismol. Soc. Am., 106, 1210–1222, https://doi.org/10.1785/0120150252, 2016.
Kramer, S. L.: Geotechnical earthquake engineering, Pearson Education India, Prentice-Hall, Inc., 1996.
Matcharashvili, T., Chelidze, T., Javakhishvili, Z., Jorjiashvili, N., and Paleo, U. F.: Non-extensive statistical analysis of seismicity in the area of Javakheti, Georgia. Comp. Geos., 37, 1627–1632, https://doi.org/10.1016/j.cageo.2010.12.008, 2011.
Merz, H. A. and Cornell, C. A.: Seismic risk analysis based on a quadratic magnitude-frequency law, Bull. Seismol. Soc. Am., 63, 1999–2006, https://doi.org/10.1016/0148-9062(74)90731-1, 1973.
Motaghed, S., Khazaee, M., and Mohammadi, M.: The b-value estimation based on the artificial statistical method for Iran Kope-Dagh seismic province, Arab. J. Geo., 14, 1–9, https://doi.org/10.1007/s12517-021-07970-y, 2021.
Mousavi-Bafrouei, S. H., Mirzaei, N., and Shabani, E.: A declustered earthquake catalog for the Iranian Plateau, Anna. Geoph., 57, 6, S0653-1-25, https://doi.org/10.4401/ag-6395, 2014.
Parsons, T. and Geist, E. L.: Is there a basis for preferring characteristic earthquakes over a Gutenberg–Richter distribution in probabilistic earthquake forecasting?, Bull. Seismol. Soc. Am., 99, 2012–2019, https://doi.org/10.1785/0120080069, 2009.
R Core Team: R – A language and environment for statistical computing, R Foundation for Statistical Computing, Vienna, Austria, available at: https://www.R-project.org/ (last access: 25 January 2022), 2021.
Sarlis, N. V., Skordas, E. S., and Varotsos, P. A.: Nonextensivity and natural time: The case of seismicity, Phys. Rev. E., 82, 021110, https://doi.org/10.1103/PhysRevE.82.021110, 2010.
Schwartz, D. P. and Coppersmith, K. J.: Fault behavior and characteristic earthquakes: Examples from the Wasatch and San Andreas fault zones, J. Geo. Res. Solid Earth, 89, 5681–5698, https://doi.org/10.1029/JB089iB07p05681, 1984.
Silva, R., França, G. S., Vilar, C. S., and Alcaniz, J. S.: Non-extensive models for earthquakes, Phys. Rev. E, 73, 026102., https://doi.org/10.2478/s11600-012-0010-3, 2006.
Sotolongo-Costa, O. and Posadas, A.: Fragment-asperity interaction model for earthquakes, Phys. Rev. Lett., 92, 048501, https://doi.org/10.1103/physrevlett.92.048501, 2004.
Sotolongo-Costa, O., Rodriguez, A. H., and Rodgers, G. J.: Tsallis entropy and the transition to scaling in fragmentation, Entropy, 2, 172, https://doi.org/10.3390/e2040172, 2000.
Staudenmaier, N., Tormann, T., Edwards, B., Deichmann, N., and Wiemer, S.: Bilinearity in the Gutenberg-Richter relation based on ML for magnitudes above and below 2, from systematic magnitude assessments in Parkfield (California), Geop. Res. Lett., 45, 6887–6897, https://doi.org/10.1029/2018gl078316, 2018.
Telesca, L.: Maximum likelihood estimation of the nonextensive parameters of the earthquake cumulative magnitude distribution, Bull. Seis. Soc. Am., 102, 886–891, https://doi.org/10.1785/0120110093 ,2012.
Tsallis, C.: Possible generalization of Boltzmann-Gibbs statistics, J. Stat. Phys., 52, 479–487, https://doi.org/10.1007/bf01016429, 1988.
Tsallis, C., Mendes, R., and Plastino, A. R.: The role of constraints within generalized nonextensive statistics, Physica A, Mech. Its Appl., 261, 534–554, https://doi.org/10.1016/s0378-4371(98)00437-3, 1998.
Uhrhammer, R. A.: Characteristics of northern and central California seismicity, Earthquake Notes, 57, 21, https://doi.org/10.1130/dnag-csms-neo.99, 1986.
USGS (The United States Geological Survey): “Search Earthquake Catalog”, http://earthquake.usgs.gov/earthquakes/search, last access: February, 2022.
Vallianatos, F. and Michas, G.: Complexity of fracturing in terms of non-extensive statistical physics: from earthquake faults to arctic sea ice fracturing, Entropy, 22, 1194, https://doi.org/10.3390/e22111194, 2020.
Vallianatos, F., Michas, G., and Papadakis, G.: Non-extensive and natural time analysis of seismicity before the Mw 6.4, October 12, 2013 earthquake in the South West segment of the Hellenic Arc, Physica A, 414, 163–173, https://doi.org/10.1016/j.physa.2014.07.038, 2014.
Vallianatos, F., Michas, G., and Papadakis, G.: A description of seismicity based on non-extensive statistical physics: A review, Earthquakes and their Impact on Society, 1–41, https://doi.org/10.1007/978-3-319-21753-6_1, 2016a.
Vallianatos, F., Papadakis, G., and Michas, G.: Generalized statistical mechanics approaches to earthquakes and tectonics, P. R. Soc. A, 472, 20160497, https://doi.org/10.1098/rspa.2016.0497, 2016b.
Vallianatos, F., Michas, G., and Papadakis, G.: Nonextensive statistical seismology: An overview. Complexity of seismic time series, 25–59, https://doi.org/10.1016/B978-0-12-813138-1.00002-X, 2018.
Valverde-Esparza, S. M., Ramírez-Rojas, A., Flores-Márquez, E. L., and Telesca, L.: Non-extensivity analysis of seismicity within four subduction regions in Mexico, Acta Geoph., 60, 833–845, https://doi.org/10.2478/s11600-012-0012-1, 2012.
Wesnousky, S. G.: The Gutenberg-Richter or characteristic earthquake distribution, which is it?, Bull. Seismol. Soc. Am., 84, 1940–1959, https://doi.org/10.1785/bssa0840061940, 1994.
Yazdani, A. and Kowsari, M.: Earthquake ground-motion prediction equations for northern Iran, Nat. Hazards, 69, 1877–1894, https://doi.org/10.1007/s11069-013-0778-8, 2013.
Yazdani, A., Nicknam, A., Khanzadi, M., and Motaghed, S.: An Artificial Statistical Method to Estimate Seismicity Parameter from Incomplete Earthquake Catalogs, a Case Study in Metropolitan Tehran, Iran, Sci. Iran., 22, 400–409, 2015.
Yazdani, A., Nicknam, A., Dadras, E. Y., and Eftekhari, S. N.: Near-field probabilistic seismic hazard analysis of metropolitan Tehran using region-specific directivity models, Pur. Appl. Geop, 174, 117–32, https://doi.org/10.1007/s00024-016-1389-6, 2017.
Youngs, R. R. and Coppersmith, K. J.: Implications of fault slip rates and earthquake recurrence models to probabilistic seismic hazard estimates, Bull. Seismol. Soc. Am., 75, 939–964, https://doi.org/10.1016/0148-9062(86)90651-0, 1985.
Žalohar, J.: Gutenberg-Richter's law. In Developments in Structural Geology and Tectonics, Vol. 2, 173–178, Elsevier, https://doi.org/10.1016/b978-0-12-814580-7.00014-9, 2018.