the Creative Commons Attribution 4.0 License.
the Creative Commons Attribution 4.0 License.
 | 15 Mar 2023
Multi-event assessment of typhoon-triggered landslide susceptibility in the Philippines
Joshua N. Jones
Georgina L. Bennett
Claudia Abancó
Mark A. M. Matera
Fibor J. Tan
There is a clear need to improve and update landslide susceptibility models across the Philippines. This is challenging, as landslides in this region are frequently triggered by temporally and spatially disparate typhoon events, and it remains unclear whether such spatially and/or temporally distinct typhoon events cause similar landslide responses, i.e. whether the landslide susceptibility for one typhoon event is similar for another. Here, we use logistic regression to develop four landslide susceptibility models based on three typhoon-triggered landslide inventories for the 2009 Typhoon Parma (local name Typhoon Pepeng), the 2018 Typhoon Mangkhut (local name Typhoon Ompong), and the 2019 Typhoon Kammuri (local name Typhoon Tisoy). The 2009 and 2018 inventories were mapped across the same 150 km2 region of Itogon in Benguet Province, whilst the 2019 event was mapped across a 490 km2 region of Abuan in Isabela Province. The four susceptibility models produced are for the 2009, 2018, and 2019 inventories separately, as well as for the 2009 and 2018 inventories combined. Using the area under the receiver operator curve (AUROC) validation, the accuracy of the models is found to be 78 %–82 % for the Itogon models and 65 % for the Abuan model. To assess landslide time dependency, we use the AUROC validation and the Itogon models to quantify the degree to which susceptibility models derived from one event(s) in time can forecast/hindcast the landslides triggered by another. We find that using a susceptibility model for a typhoon event in one year to forecast/hindcast a typhoon in another leads to a 6 %–10 % reduction in model accuracy compared to the accuracy obtained when modelling and validating each event separately. This suggests some degree of time dependency in typhoon-triggered landslides in the Philippines. However, using a susceptibility model for two combined typhoon events (2018 + 2009) to forecast/hindcast each typhoon event separately led to just a 1 %–3 % reduction in model accuracy. This suggests that combined multi-event typhoon-triggered landslide susceptibility models will be more accurate and reliable for the forecasting of future typhoon-triggered landslides. Finally, by undertaking a high-level comparison of the Abuan and Itogon susceptibility models through space, we preliminarily suggest that there may be spatial dependency in typhoon-triggered landslides in the Philippines but that further work into issues of spatial dependency in this region is required.
- Article
(8574 KB) - Full-text XML
- BibTeX
- EndNote


In the Philippines, landslide occurrences and hazards are high (Kirschbaum et al., 2015; Lin et al., 2017; Abancó et al., 2021), with hydrological hazards and associated landslides causing thousands of fatalities and millions of pesos in damage every year. Indeed, across Southeast Asia, approximately 46 % of all rainfall-triggered landslides occur in the Philippines, of which 42 % are triggered by typhoons (Froude and Petley, 2018). However, despite the pervasiveness of landslides in the Philippines, high-quality country-wide typhoon-triggered landslide susceptibility maps are lacking, thus representing a major resource gap in efforts aimed at better managing and mitigating future landslide hazard across the country. For example, whilst statistical landslide susceptibility studies have been undertaken in the Philippines (e.g. Oh and Lee, 2011; Javier and Kumar, 2019; Nolasco-Javier and Kumar, 2021), these remain geographically limited and insufficient for use in planning purposes. Indeed, as illustrated by Fig. 1a, the susceptibility maps currently held by the Philippines Mines and Geosciences Bureau (MGB) use a heuristic approach and so only show very broad categorisations of landslide susceptibility. Similarly, whilst the landslide hazard maps held and produced by the Philippines National Operational Assessment of Hazards (NOAH), which are based on various landslide studies (e.g. Rabonza et al., 2015; Lagmay and Eco, 2016; Luzon et al., 2016), show more detail than the MGB maps (see Fig. 1b), the categorisation of the hazard remains very broad, with limited catchment-scale detail.
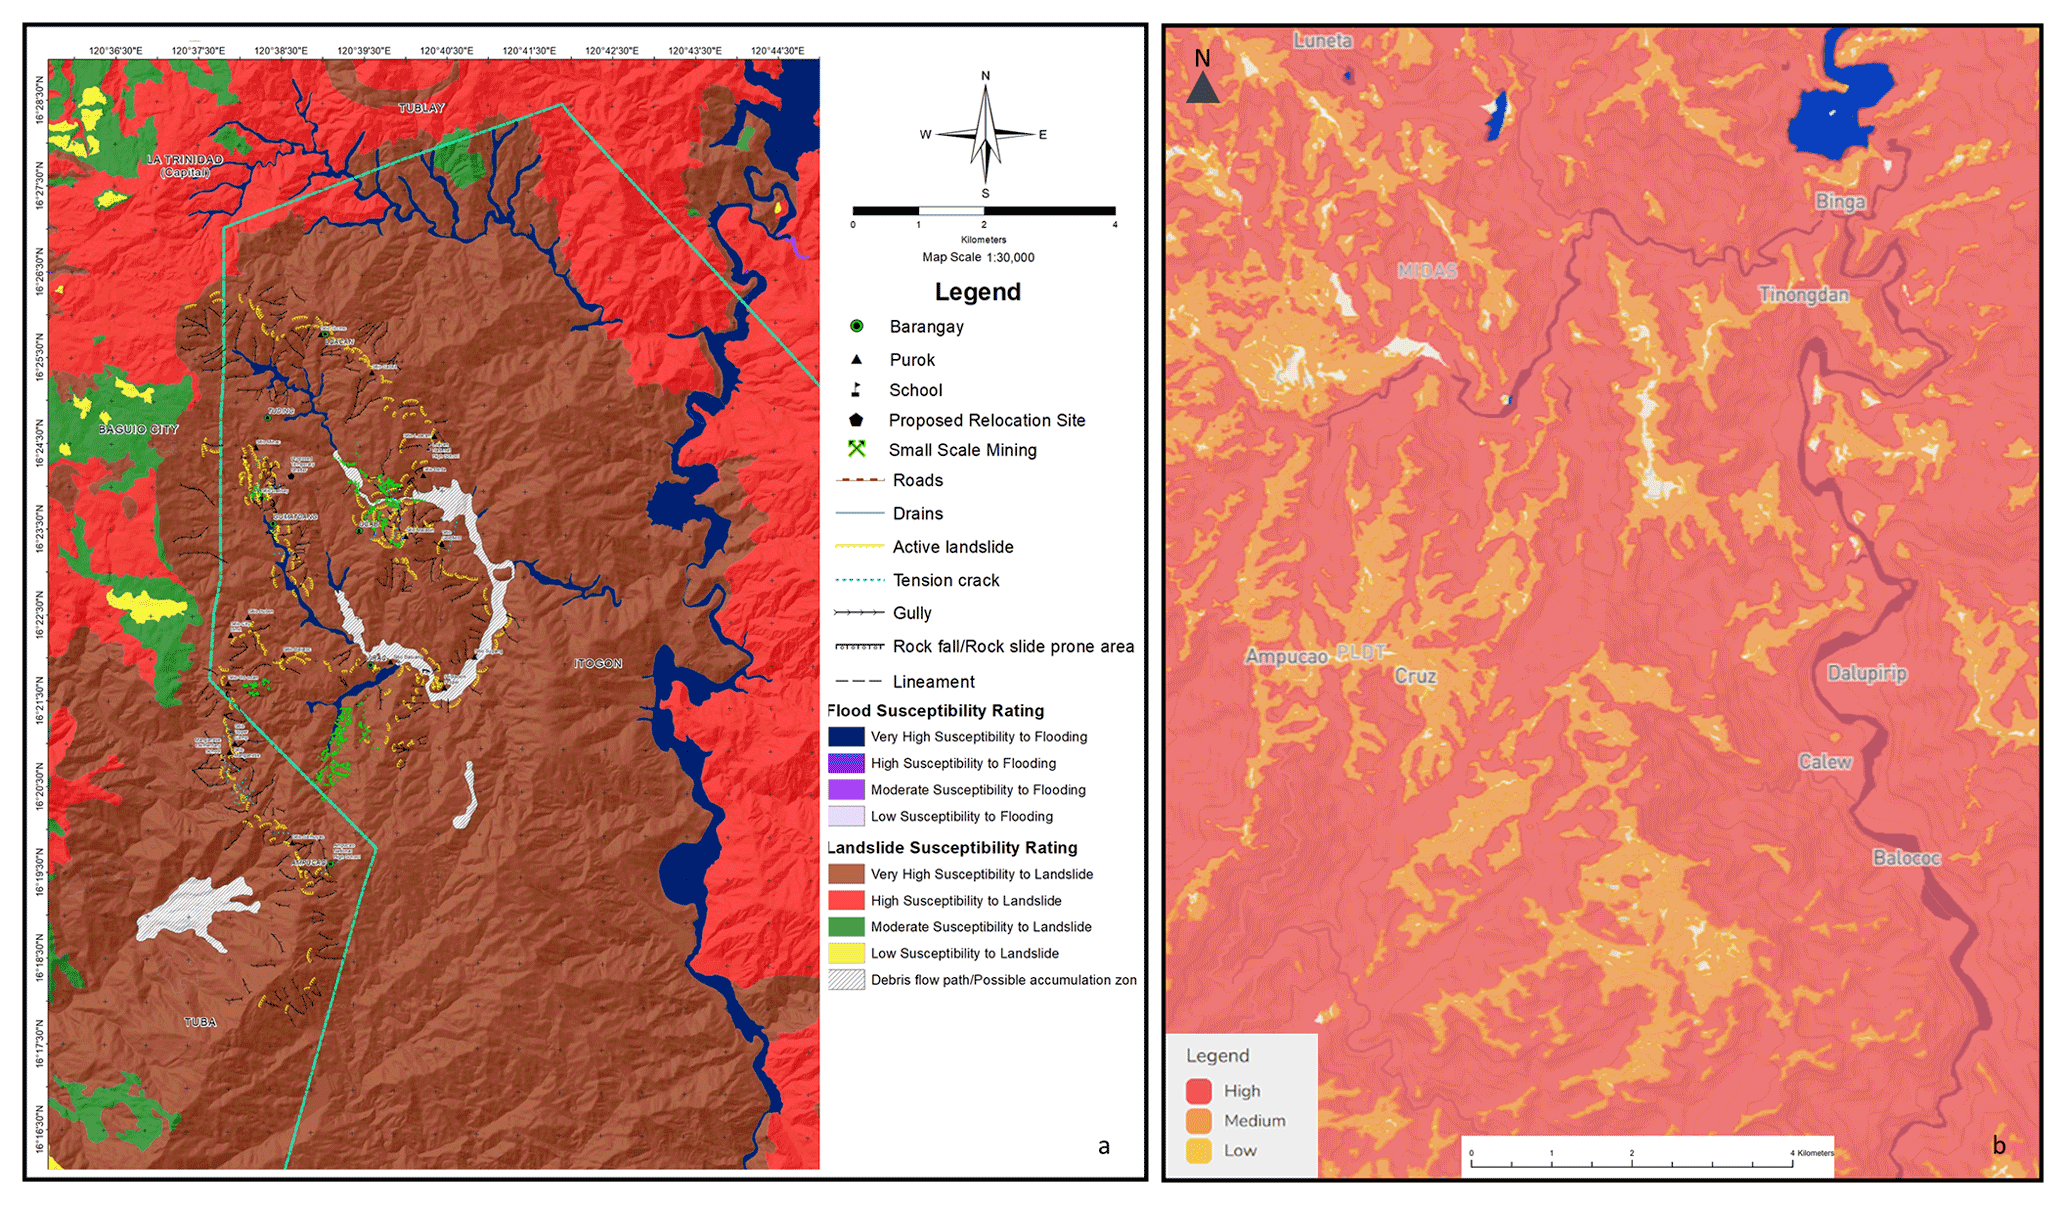
Figure 1(a) Current landslide susceptibility map of the Itogon region held by the Philippines Mines and Geosciences Bureau (Mines and Geosciences Bureau, MGB, 2018). (b) Sample landslide hazard map from the NOAH National Operational Assessment of Hazards Portal for the same approximate region of Benguet as shown in (a).
One of the major challenges in developing improved typhoon-triggered landslide susceptibility models is that it is currently unclear whether spatially and temporally distinct typhoons trigger landslides with similar distributions and susceptibilities, i.e. whether typhoon-triggered landslide susceptibility in the Philippines is spatially and/or temporally dependent. The concept of rainfall-triggered landslide spatial and temporal dependence is now well established within the literature. For example, recent research by Jones et al. (2021a, b) shows how landslides triggered by different monsoon seasons and cloud outburst storms in Nepal have distinctly different rates, spatial distributions, and susceptibility through time.
Similarly, landslides in Italy have been shown to exhibit transient spatial and temporal dependencies relating to the locations of past landslides, a process termed “landslide path dependency” (Temme et al., 2020; Samia et al., 2020), with several other papers also highlighting how landslide susceptibility is commonly both spatially and/or temporally dependent (e.g. Gorsevski et al., 2006; Meusburger and Alewell, 2009; Lombardo et al., 2020; Ozturk et al., 2021b). However, to date, it remains unclear whether typhoon-triggered landslides in the Philippines are also spatially and temporally dependent. This is a problem because if typhoon-triggered landslide susceptibility is spatially and/or temporally dependent, then it will not be appropriate to use landslide susceptibility models developed from one typhoon event to forecast landslides triggered by future typhoon events or by typhoon events in other regions. This uncertainty is particularly concerning as rainfall in the Philippines is predicted to increase by 22 %–32 % between 2006–2035 in Benguet Province (Nolasco-Javier et al., 2015), with extreme rainfall projected to increase in provinces such as Luzon (PAGASA, 2022). Therefore, rainfall-triggered landslides are likely to become more frequent, and thus it will become increasingly important to be able to understand, forecast, and mitigate this hazard.
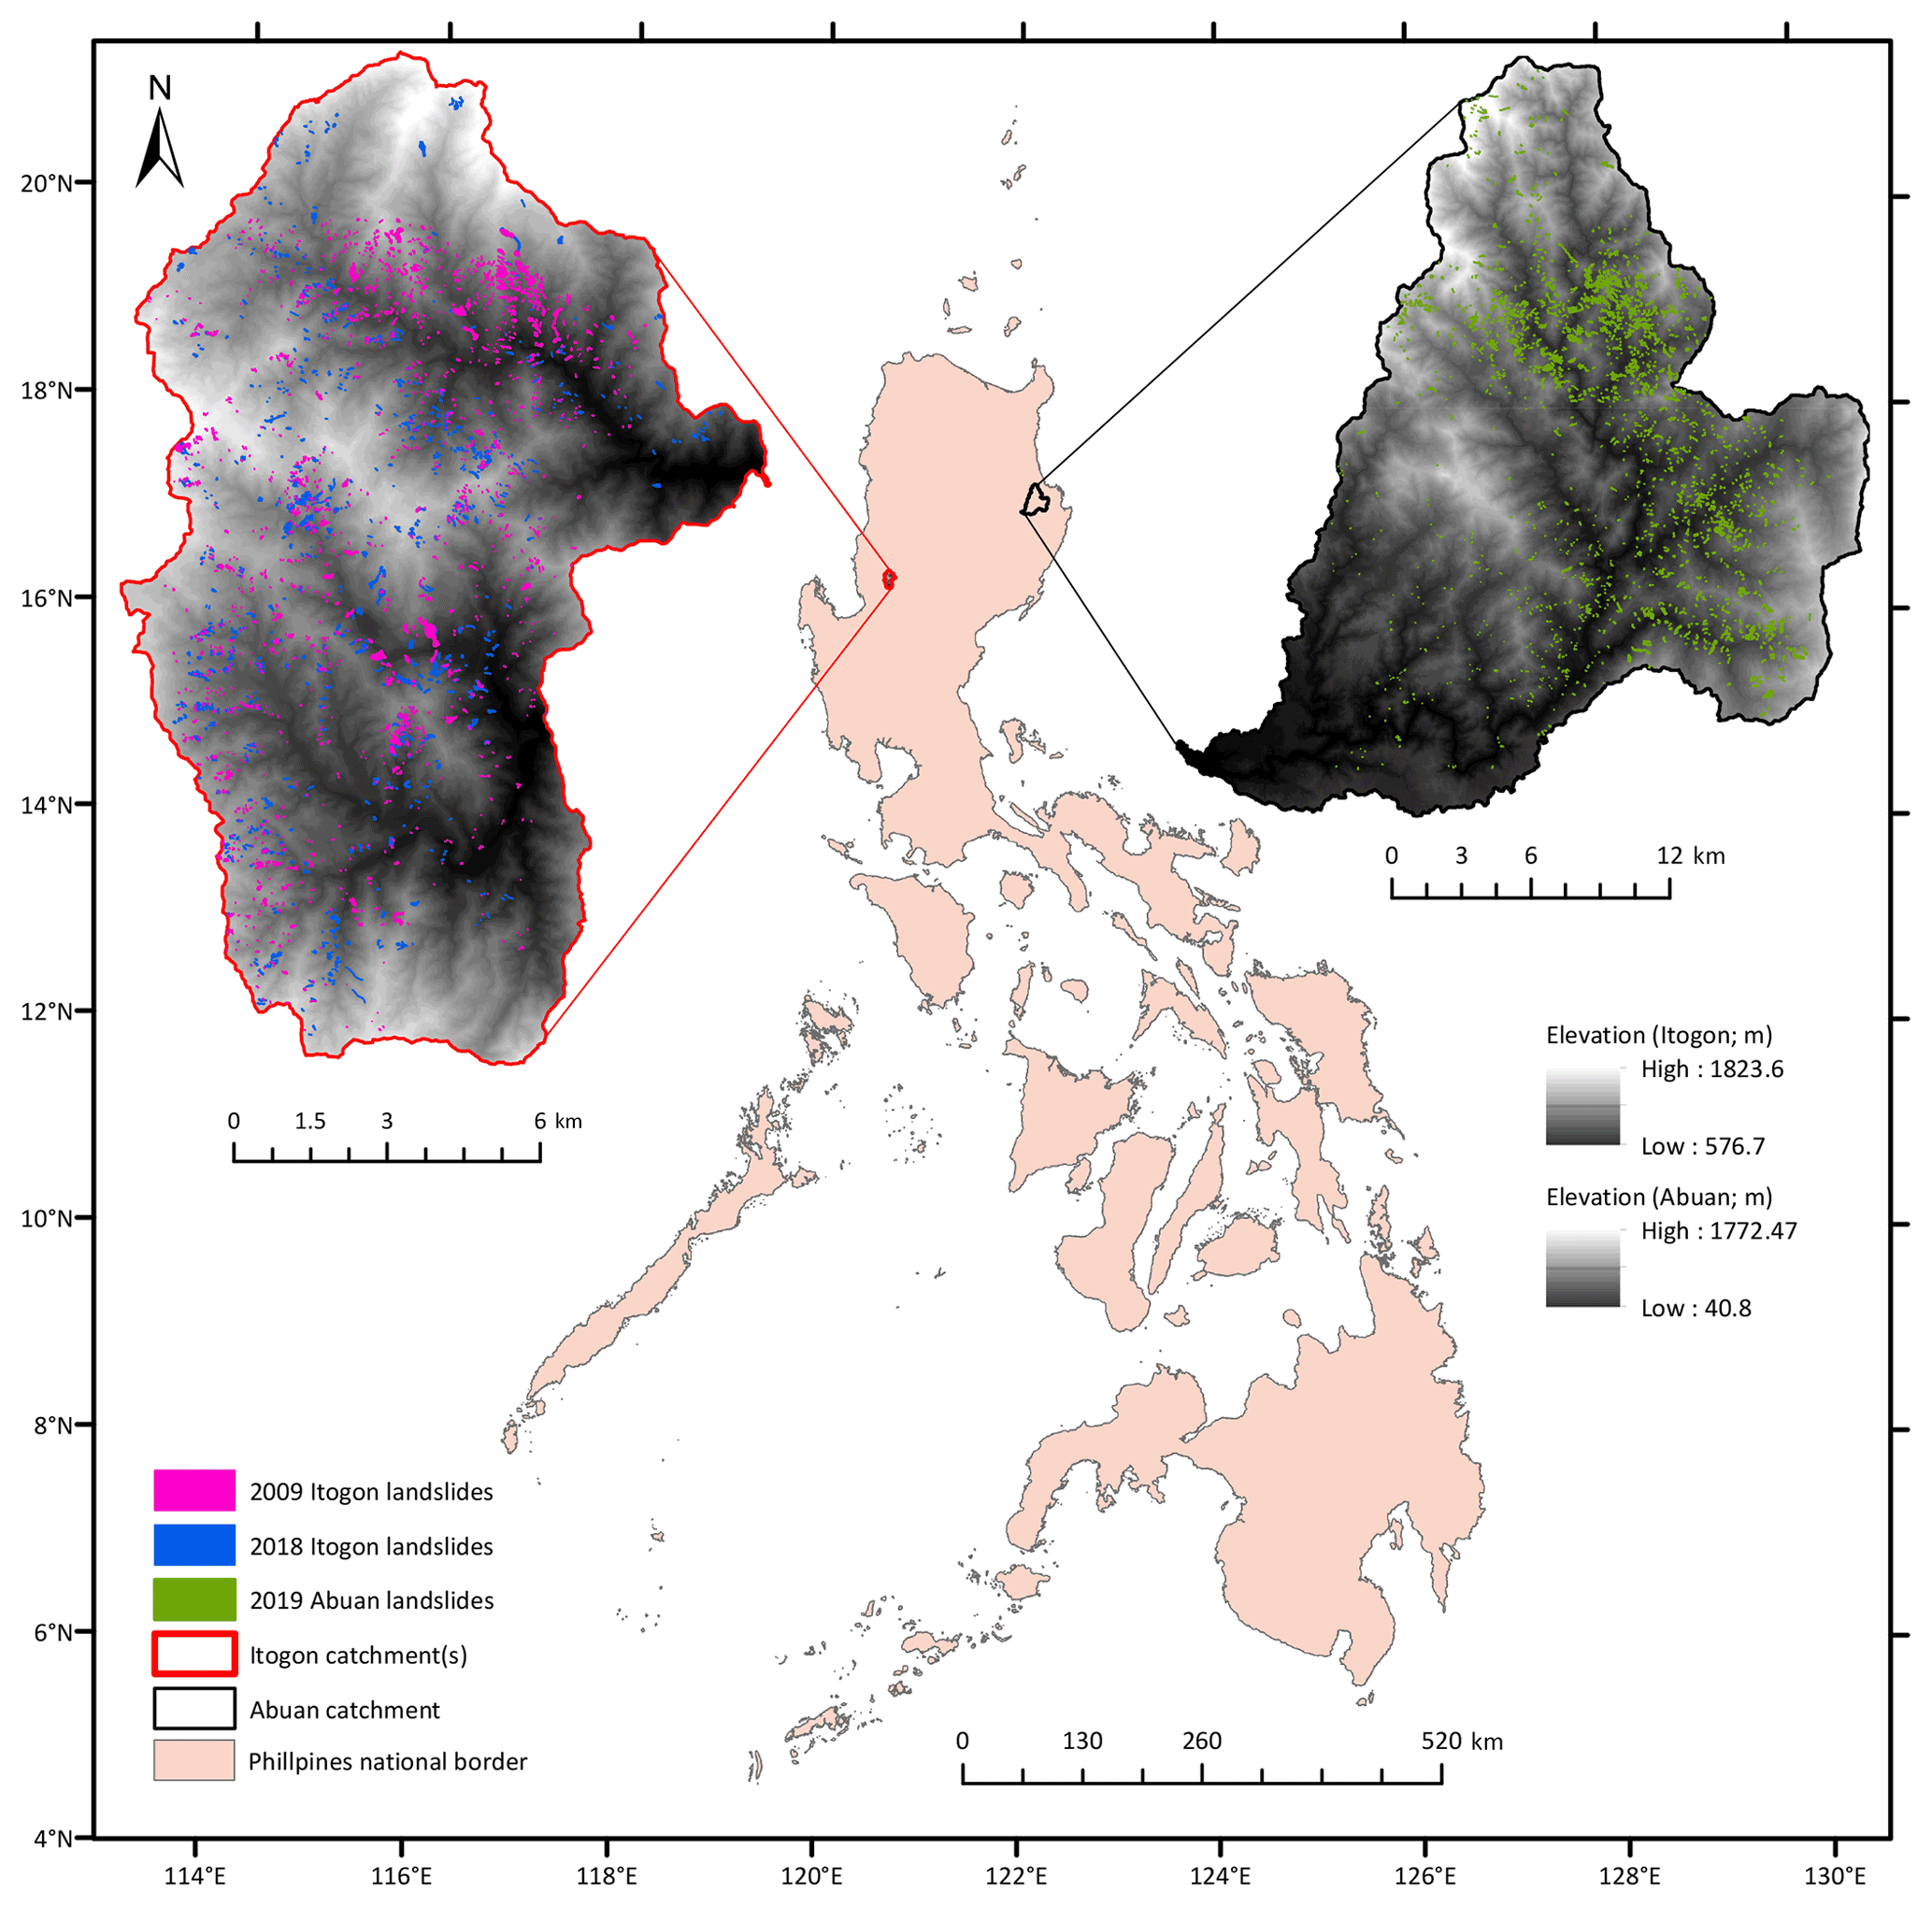
Figure 2Locations of the two study regions, including the three landslide inventories used throughout this paper.
The overall aim of this paper is to use data from multiple typhoon events to assess the temporal, and to a lesser degree spatial, characteristics of typhoon-triggered landslide susceptibility in the Philippines. The specific objectives are as follows.
-
The first is to use binary logistic regression (BLR) techniques to develop four landslide susceptibility models across two regions (Itogon and Abuan; Fig. 2) using data from three typhoon events: the 2009 Typhoon Parma and the 2018 Typhoon Mangkhut that occurred in Itogon and the 2019 Typhoon Kammuri that occurred in Abuan. The four models we developed are for each typhoon event separately and for the 2009 and 2018 Itogon events combined (2018 + 2009).
-
The second is to assess the similarities and differences between the susceptibility results obtained from each model. This will include discussion of the general differences in model accuracy and consistency in the context of the use of landslide susceptibility models in hazard and risk planning and mitigation.
-
The third is to use the area under the receiver operator curve (AUROC) validation to quantify whether the models developed for the 2018, 2009, and 2018 + 2009 models can be used to accurately classify (or forecast/hindcast) the landslides triggered by the other individual typhoon event, i.e. to assess whether time-independent modelling of typhoon-triggered landslides in the Philippines is appropriate. This objective essentially operates under the hypothesis that if typhoon-triggered landslides are time dependent, then in a given region there will be a reduced model accuracy when using a model developed from one typhoon event to classify another. It should be noted that we here use the term “time dependent” to include landslides that exhibit some form of temporal change/dependency across a multi-typhoon-season period.
-
The fourth is to compare the results of the Itogon and Abuan models to make some preliminary comments about potential regional spatial dependencies in landslide susceptibility assessment and outline the need for further study on this topic.
As well as allowing the development of improved and updated landslide susceptibility maps for two regions of the Philippines, the completion of these aims will provide important wider insight into the spatial and temporal dependence of landslide susceptibility modelling.
The climate in the Philippines is controlled by a variety of interacting systems including the southeast monsoon, summer typhoons/cyclones, El Niño and La Niña cycles, and the Intertropical Convergence Zone (ITCZ) (Nolasco-Javier et al., 2015). The interplay between these systems typically leads to drier conditions from November to April and wetter conditions from May to October. As stated above, the focus of this paper is on typhoon-triggered landslides. As such, the specific subregions selected for this study are a group of catchments in Itogon Municipality, Benguet Province, and a catchment of Abuan in Ilagan Municipality, Isabela Province (Fig. 2). The Itogon region is located along the southern portion of the Cordillera Central mountains. These catchments all drain into the Agno River, which flows broadly north–south along the eastern side of the study region. This region is located to the northeast of the city of Baguio, which has a population of ∼ 350 000 people. The Abuan catchment forms the northeast part of the Pinacanauan de Ilagan catchment, which is a major tributary of the Cagayan River. The catchment is estimated to have a population of ∼ 14 000 people and supports large areas of agriculture (Balderama et al., 2016). These regions were selected for this study as both have experienced particularly significant landslide-triggered typhoon events over the past few decades, most notably, the 2009 Typhoon Parma (known locally as Pepeng) and the 2018 Typhoon Mangkhut (known locally as Ompong) in Itogon and the 2019 Typhoon Kammuri (known locally as Tisoy) in Abuan. The following paragraphs describe the key characteristics and known landslide information of each of these three typhoon events, before outlining the geological and geomorphological setting of the Itogon and Abuan subregions.
2.1 Typhoon Parma (Pepeng)
Typhoon Parma formed on 27 September 2009 and dissipated on 14 October 2009. The main impacts of this typhoon occurred in northern Luzon, particularly across the Itogon region, between 3 and 9 October, when the total rainfall reached over 1868 mm (Nolasco-Javier et al., 2015) and there were wind speeds of 195 to 241 km h−1 near the centre (NDCC, 2009). The impacts of this typhoon were severe, with some 500 reported fatalities, over USD 635 million in damages, and at least 60 damaging landslide occurrences (Nolasco-Javier et al., 2015; Liou and Pandey, 2020). The severity of these impacts was in part due to the simultaneous occurrence of Typhoon Melor. The interaction between Parma and Melor led to a phenomenon called the Fujiwhara effect, whereby Typhoon Melor caused Typhoon Parma to slow, rotate, and loop such that it actually made landfall over northern Luzon three times (Shimokawa et al., 2011; Nolasco-Javier et al., 2015; Liou and Pandey, 2020). Furthermore, these typhoons occurred following several months of El Niño-induced higher than average rainfall, including storm Koppu in September (Yumul et al., 2013). This resulted in high antecedent rainfall prior to the start of the typhoon season, which likely enhanced the triggering of landslides (Nolasco-Javier et al., 2015). In terms of specific landslide impacts, at least 60 damaging landslides have been reported (National Disaster Coordinating Council 2009). A limited (rapid response) landslide assessment for this event has been conducted in the Baguio region, with the predominant observed landslide types being slides, debris flows, and earth flows, as well as a tentative minimum triggering rainfall threshold of 70 mm in 24 h (Nolasco-Javier et al., 2015).
2.2 Typhoon Mangkhut (Ompong)
Typhoon Mangkhut formed on 6 September 2018, made landfall on the Philippines between 12–15 September, and dissipated on 17 September. In terms of rainfall, the highest recorded total precipitation was 794 mm at the city of Baguio's PAGASA (Philippine Atmospheric, Geophysical and Astronomical Services Administration) weather station (Abancó et al., 2021). With maximum winds of 195–241 km h−1 when it made landfall (PAGASA, 2018), the impacts of this typhoon were severe, with extensive reported damage to buildings and homes, loss of power, and over 100 reported fatalities (Sassa 2018; Niu et al., 2020). Furthermore, Mangkhut is known to have triggered thousands of landslides, including one large complex failure that caused 94 casualties alone (Abancó et al., 2021; Kim et al., 2021). Recent research by Abancó et al. (2021) presents a detailed inventory of over 1100 landslides triggered by Mangkhut, most of which occurred across a region of Itogon affected by 360 mm of rainfall over a 44 h period, according to satellite-based Integrated Multi-satellite Retrievals for Global Precipitation Measurement (IMERG) rainfall records. These landslides were of all different types, though dominated by shallow translational landslides and mud and debris flows, with many of the landslides exhibiting complex behaviour, whereby they initiated as shallow slides before transitioning into flows. Most of these landslides occurred on grassland or wooded east- to southeast-facing slopes underlain by superficial clays (Abancó et al., 2021). Further details of the mapping methodology and characteristics of this inventory are provided in Sect. 3.
2.3 Typhoon Kammuri (Tisoy)
Typhoon Kammuri formed on 24 November 2019, made landfall on 2 December, and dissipated on 6 December 2019. When Kammuri made landfall, it was a category 4 storm with wind speeds of up to 112–143 km h−1 (Sevieri and Galasso, 2020; PAGASA, 2019). Between 2 and 4 December this event reportedly damaged or destroyed over 561 000 buildings, caused at least 17 fatalities, and led to economic losses in excess of USD 116 million (LeComte 2020; Sevieri and Galasso, 2020). In terms of landslides, initial reports from aid groups suggested that landslide-induced damage to roads and other infrastructure was widespread (NDRRMC, 2019; IFRC, 2020). However, there appears to have been no subsequent mapping or assessment of the landslides triggered by this event.
2.4 Geological and geomorphological setting
The Itogon catchments are dominated by a bedrock geology of Cretaceous and Tertiary quartz diorite and andesite–basalt (DENR-MGB, 1995, 2000), with the remainder of the catchment underlain by Quaternary sandstone, claystone, and conglomerates. The bedrock is typically overlain by superficial deposits of clays, silty/sandy loams, and mountain soils, with a land cover dominated by shrubland–grassland and open forest. Geomorphologically, the hillslopes across the Itogon catchment have a mean elevation of 1140 m, mean and maximum hillslope angles of 28 and 71∘, an equal distribution of hillslope aspects, and predominantly (60 %) concave morphologies. The Abuan catchment is almost 100 % characterised by Cretaceous and Tertiary metamorphosed basic intermediate flows and/or pyroclastics and metamorphosed andesites and basalts (DENR-MGB, 1991a, b, 1976). These are overlain by superficial deposits of mountain soil and a vegetation dominated by open forest. Geomorphologically, the region is dominated by steep uplands and rugged hills, with a lower mean elevation than Itogon of 560 m and similar hillslope angle (mean of 23∘ and max of 73∘) and aspect distributions but with hillslopes that are dominated (60 %) by convex morphologies.
As outlined in subsequent sections, BLR landslide susceptibility modelling requires data on both landslide and predisposing factors (e.g. geology, soil, land cover, topography). The following sections outline the key datasets used throughout this paper, including the mapping procedures and key characteristics associated with each landslide inventory and descriptions of all predisposing factor datasets (topographical, geological, land use, etc.).
3.1 Landslide inventories
This paper uses three landslide inventories (Fig. 2), each associated with one of the typhoons in 2018, 2009, and 2019. The 2018 Mangkhut inventory is a slightly clipped version (to maintain catchment boundaries for the modelling) of the inventory presented by Abancó et al. (2021), whilst the 2009 Parma and 2019 Kammuri inventories are presented here for the first time.
The employed mapping procedure was the same for all three inventories. In each case, the landslides were initially mapped by one or two mappers and then independently reviewed, checked, and amended as appropriate by a different mapper. All landslides were mapped manually via the visual inspection of pre- and post-typhoon imagery. The 2009 Parma inventory was predominantly mapped with Google Earth imagery dated 31 December 2003 for pre-event images and 31 December 2009 for post-event images. The 2018 Mangkhut inventory was mapped using a combination of 0.5 m WorldView-2, 10 m Sentinel-2, and 3 m Planet Labs imagery, with pre-typhoon images dated between 18 February 2018 and 6 September 2019 and post-typhoon images dated between 19 September 2018 and 2 March 2019. Finally, the 2019 Kammuri inventory was predominantly mapped using 3–5 m resolution Planet Labs imagery, with pre-typhoon images dated between 2 October 2019 and 28 October 2019 and post-typhoon images dated between 7 January 2020 and 31 March 2020. For all inventories, the limited availability of cloud-free imagery resulted in gaps of several months between the pre- and post-typhoon imagery used. As rainfall-triggered landslides in the Philippines are so common, it is therefore possible that some of the landslides visible in the imagery actually occurred before or after the respective typhoon either due to other rainfall events that occurred within the imagery window or due to human activity such as construction or mining. This issue was unavoidable but mitigated where possible by cross-checking each inventory with other imagery (e.g. available Google Earth images) and by qualitative comparisons with local reports and field surveys carried out by the Philippines Mines and Geosciences Bureau (MGB) (Abancó et al., 2021).
For all inventories, landslides were delineated as polygons that included the scar, deposition, and runout zones of each event. Care was taken to avoid landslide amalgamation, e.g. combining multiple overlapping or contiguous landslides into one unionised polygon (Marc and Hovius, 2015), and to avoid the erroneous mapping of non-landslide features such as anthropogenic cut-and-fill- or road-tip-associated mass wasting and processes such as channel bank erosion. In total, 1912 landslides were in the 2009 Parma inventory, 956 in the 2018 Mangkhut inventory, and 1964 in the 2019 Kammuri inventory. In terms of a comparison to other inventories in this region, the 2018 Mangkhut inventory of Emberson et al. (2022) included 458 landslides compared to the 956 mapped here.
For each of the three inventories, to estimate landslide types, the aspect ratios (ARs) of all landslides were calculated. ARs give the ratio between the length (longest) and width (shortest) axes of each landslide. Landslides with AR values between 1 and 2 are more isometric, and thus more likely to be slumps or slides, whereas landslides with AR vales > 4 are more likely to be long-runout flow-type landslides. For these inventories, 30 %, 21 %, and 35 % of the landslides in the Parma, Mangkhut, and Kammuri inventories, respectively, had AR values < 2, with 17 %, 28 %, and 13 % > 4. Unfortunately, due to recent travel restrictions it was not possible to ground truth these inventories and their estimated characteristics in the field.
3.2 Predisposing factor datasets
For both study regions, all topographic data were derived from 5 m resolution digital elevation models (DEMs) that were obtained in 2013 using IFSAR (interferometric synthetic aperture radar) techniques and provided by the Philippines Department of Environment and Natural Resources' National Mapping and Resource Information Authority (DENR-NAMRIA). Topographic datasets including slope, aspect, and curvature were derived from the DEM using the Spatial Analyst toolbox in ArcGIS. Distance to streams was also derived from the DEMs using the “STREAMobj” function in the MATLAB TopoToolBox (Schwanghart and Scherler, 2014). Finally, datasets on bedrock geology, soil cover, and land use were obtained from the following sources.
-
Itogon Geology Map. Provided by the Department of Environment and Natural Resources' Mines and Geosciences Bureau (DENR-MGB), this included the geological maps of the Baguio City Quadrangle, Sheet 3169 III (1995), and the Sison Quadrangle, Sheet 3168 IV (2000).
-
Abuan Geology Map. Provided by the Department of Environment and Natural Resources' Mines and Geosciences Bureau (DENR-MGB), this included the geological map of the Ilagan Quadrangle, Sheet 3371 II (1991), the Tumauini Quadrangle, Sheet 3371 I (1991), and the municipality of Ilagan, Isabela, 1 : 90 000 scale (1976).
-
Soil cover (both regions). This was provided by the Department of Agriculture's Bureau of Soils and Water Management (DA-BSWM) (Carating 2013).
-
Land cover (both regions). This was provided by the Department of Environment and Natural Resources' National Mapping and Resource Information Authority (DENR-NAMRIA). The data are from 2015.
The first objective of this section is to use binary logistic regression (BLR) techniques to develop four typhoon-triggered landslide susceptibility models and maps for two regions of the Philippines using landslide data from three different typhoon events. The third objective is to use the AUROC validation to quantify whether each model can be used to accurately forecast/hindcast independent landslides triggered by each other typhoon event. The following sections will therefore describe the relevant BLR and AUROC methodologies used throughout this paper.
4.1 Binary logistic regression (BLR) modelling
BLR models can be understood as classification algorithms that are used to classify the binary outcome (0 or 1) of a dependent (or response) variable (e.g. landslide absence/presence in a given grid cell) given a set of independent predictor variables (e.g. landslide predisposing factors such as elevation and geology). The key BLR equation to be used in this paper is given in Eq. (1), which essentially describes how the probability of landsliding (π; the dependent variable) is linked to a model intercept (β0) and combinations of regression coefficients (βi) and independent variables (xi):
BLR models are commonly used within the literature to assess landslide susceptibility (Pourghasemi et al., 2018; Reichenbach et al., 2018). As such, the mathematics behind Eq. (1) are well described elsewhere (e.g. Appendix A of Lombardo and Mai, 2018) and will not be re-described here. In this paper, we use the glmnet package (Hastie et al., 2021) in the statistical software R to develop BLR models that are implemented alongside a LASSO (least absolute shrinkage and selection operator) (e.g. Lombardo and Mai, 2018; Jones et al., 2021a) for variable selection.
The LASSO is an algorithm that automatically determines which independent predictor variables are most important for classifying the response of the dependent variable. Full mathematical descriptions of the LASSO can be found in Friedman et al. (2010), Hastie et al. (2021), and Lombardo and Mai (2018) and so will not be repeated here. However, in effect, the LASSO works by cycling through different combinations of increasingly more independent variables by systematically setting different independent variables to zero until it converges on a user-defined optimal solution (Friedman et al., 2010). In this case, the optimal solution was to maximise the model success as defined by the AUROC (area under the receiver operator curve; see Sect. 4.2), i.e. the success of that model in classifying the data used to train the model. The advantage of this methodology is that it provides objective information on which combinations of independent variables are having the most dominant influences on landslide occurrence, as well as the usual information on independent variable regression coefficients.
Before running the glmnet BLR models, datasets of combined landslide and predisposing factor data were obtained using the following steps.
-
We divide each study region into 5 m × 5 m grids (2.4 × 10⁷ cells in Itogon, 3.9 × 10⁷ cells in Abuan).
-
We take each landslide inventory and convert the polygons to “highest points” at the assumed triggering location of each landslide. Then, we combine the 2018 and 2009 high points so that we now have four inventories of high points, one each for 2018, 2009, 2019, and 2018 + 2009.
-
Using each of the four inventories, we then assign each cell in the relevant study region a value of 1 if it observed a landslide high point (landslide presence cell) and a value of zero if not (landslide absence cell).
-
For each region, we then use the datasets described in Sect. 3.2 to also assign each cell in each study region a value for each predisposing factor of interest. In total, there were nine predisposing factors, of which four were categorical (geology, soil type, aspect, and land use) and the rest were continuous (distance to channels, elevation, planform curvature, profile curvature, and slope angle).
-
For each case, we then extract 50 random balanced training sub-datasets, where each subset includes a random selection of 70 % all of the landslide presence data and an equal number of randomly selected landslide absence cells. Note that 50 sub-datasets were used for each model to get an appreciation of error and uncertainty within each model.
-
Finally, 50 random balanced testing sub-datasets were also extracted for each case, where the testing subsets included the 30 % of landslides not selected for the training sets and an equal number of randomly selected landslide absence cells. These testing sets were used for the model AUROC validation; see Sect. 4.2.
Once the 50 subsets per model had been obtained, there were also several processing steps that had to be completed before running the models.
-
To ensure that the final regression coefficients assigned to the different independent variables were objectively comparable, all continuous variables were scaled using zero-mean unit variance (e.g. Lombardo and Mai, 2018).
-
As the models were to include several continuous independent variables, it was possible that some variables would actually be collinear. This is potentially problematic, as inter-variable collinearity can make regression models unstable and inaccurate (Zuur et al., 2010). Consequently, we tested for collinearity between all continuous variables in all 200 sub-datasets (50 per model) using the variance inflation factor (VIF) functions of Zuur et al. (2010). VIFs are a commonly used approach to quantifying collinearity. VIFs were calculated for every continuous variable of interest, where a VIF value > 5 suggests that the associated variable is collinear with at least one other variable in the model and so should be removed. However, in this case, no variables had VIFs > 2, suggesting that none of the independent variables were collinear.
With these data subsetting and processing steps completed, the 50 datasets per case were run through the glmnet model. The resulting intercept values, LASSO selection percentages, and associated regression coefficients were then averaged for each case based on the 50 respective model runs. These averaged values were then inputted into Eq. (1) alongside the relevant predisposing factor datasets (the xi parts of Eq. 1) and applied across the entirety of the respective study regions to obtain the final landslide susceptibility maps for each case. This was done using the ArcGIS raster calculator.
4.2 AUROC validation
The AUROC is a commonly used method to assess the accuracy and validity of landslide susceptibility maps (Pourghasemi et al., 2018; Reichenbach et al., 2018). In this paper, AUROC methods are used to assess the initial accuracy of each susceptibility model, as well as to investigate how well one model can classify independent landslide data from the same or other typhoon events. A receiver operator curve (ROC) is a probability curve obtained by plotting the true positive rate (TPR), or sensitivity, against the false positive rate (FPR), or 1 − specificity, where in this case the TPR is the proportion of landslide presence cells correctly classified as landslide presence cells by a model, and the FPR is the proportion of landslide absence cells incorrectly classified as landslide presence cells by a model. The area under the ROC (the AUROC value) indicates the accuracy with which a given binary model was able to correctly classify the observed classes (in this case the landslide presences and absences). An AUROC value of 1 means that a model was 100 % accurate, whilst an AUROC value of 0.5 indicates that a model has zero classification capacity (i.e. is no better than a random guess). An AUROC value < 0.5 indicates that a model is actively inverting the classification (i.e. classifying landslide presences as absences and vice versa), whilst values of 0.7–0.75 are generally taken to represent a good model and values > 0.8 a very good model (e.g. Marjanović, 2013; Vakhshoori and Zare, 2018; Jones et al., 2021a). In this paper, all AUROC values were calculated using 10-fold cross-validation, whereby 100 AUROC validations between the 50 models developed for a given inventory and the 50 independent testing sets from a given inventory were used to calculate an average AUROC value and associated standard deviation.
5.1 BLR modelling
As outlined in the methods, four BLR models were developed: three for the Itogon region based on the 2018 inventory, 2009 inventory, and combined 2018 + 2009 inventory and one for the Abuan region based on the 2019 inventory. The key outputs from the BLR models are the average intercepts, average regression coefficients, LASSO selection percentages, and initial model accuracies (as determined by AUROC analysis), as well as the resulting landslide susceptibility maps.
Table 1Summary of the BLR LASSO results obtained for each of the four developed models. All numbers are the mean of the 50 runs undertaken for each model. The AUROC value is the accuracy of the model at classifying the landslide data used to train the model. Grey highlighted cells are all those with > 50 % selection by the LASSO. Bold cells are those with a positive influence on landslide occurrence.
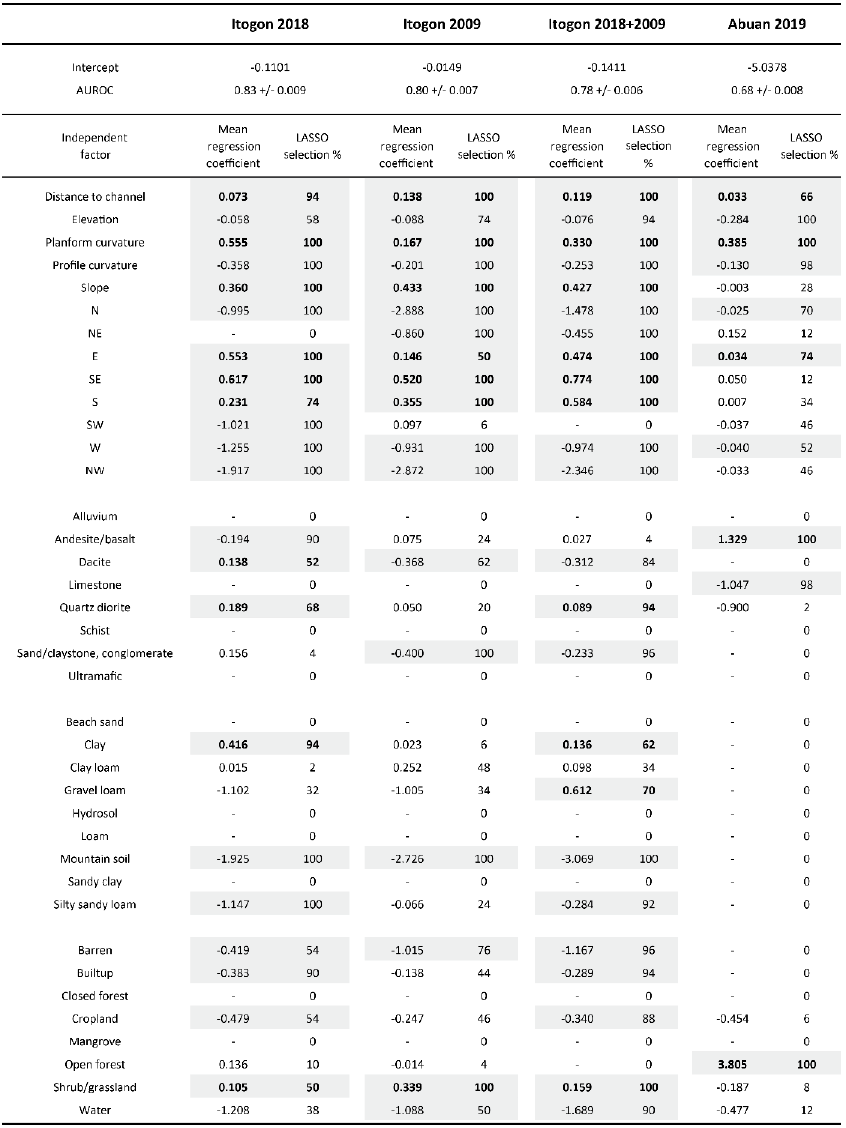
Table 1 summarises the average intercepts, regression coefficients, LASSO selection percentages, and initial model accuracies of each model. The regression coefficients and LASSO selection percentages essentially describe the influences of each independent factor on the model. A larger-magnitude coefficient and higher selection percentage suggest that a factor is more dominant in controlling landslide occurrence, with a negative regression coefficient meaning a factor is making landsliding less likely and a positive regression coefficient meaning a factor is making landsliding more likely. The regression coefficients and LASSO selections highlight several similarities and differences between the landslides triggered by each typhoon event. The following paragraphs will discuss the key results for the Abuna (2019) and Itogon (2009, 2018, 2018 + 2009) regions.
In Itogon, the landslides from both the 2009 and 2018 typhoon events have similar relationships with distance to channels, planform curvature, profile curvature, elevation, slope angle, and aspect, all of which were consistently selected factors by the LASSO. Increasing distance to channels and planform curvature are found to make landslides slightly more likely to occur, whilst increasing elevation and profile curvature make landslides less likely to occur. It is unclear why increasing distance from channels makes landslides more likely, but this could be related to rainfall distributions or slopes being steeper further from channels. Future work should consider this result in more detail. As expected, higher slope angles made landslides more likely in both Itogon typhoons. The control of aspect was also similar for both typhoons, with north-, northwest-, and west-facing slopes being consistently selected by the LASSO and found to make landslides less likely, and east-, southeast-, and south-facing slopes also being consistently selected but found to make landslides more likely. For the categorical model factors (geology, soil type, and land cover), the influences on landsliding are less consistent across the two Itogon typhoon events. One of the few similarities is that mountain soil and barren land both had > 50 % LASS0 selection rates and negative regression coefficients in 2018 and 2009, whilst shrubland–grassland also had high selection rates and positive regression coefficients in both years. The other notable result from the models in these years is that in 2018 the clay unit and silty/sandy loam units had 100 % LASSO selection rates, with the former making landslides more likely and the latter making them less likely.
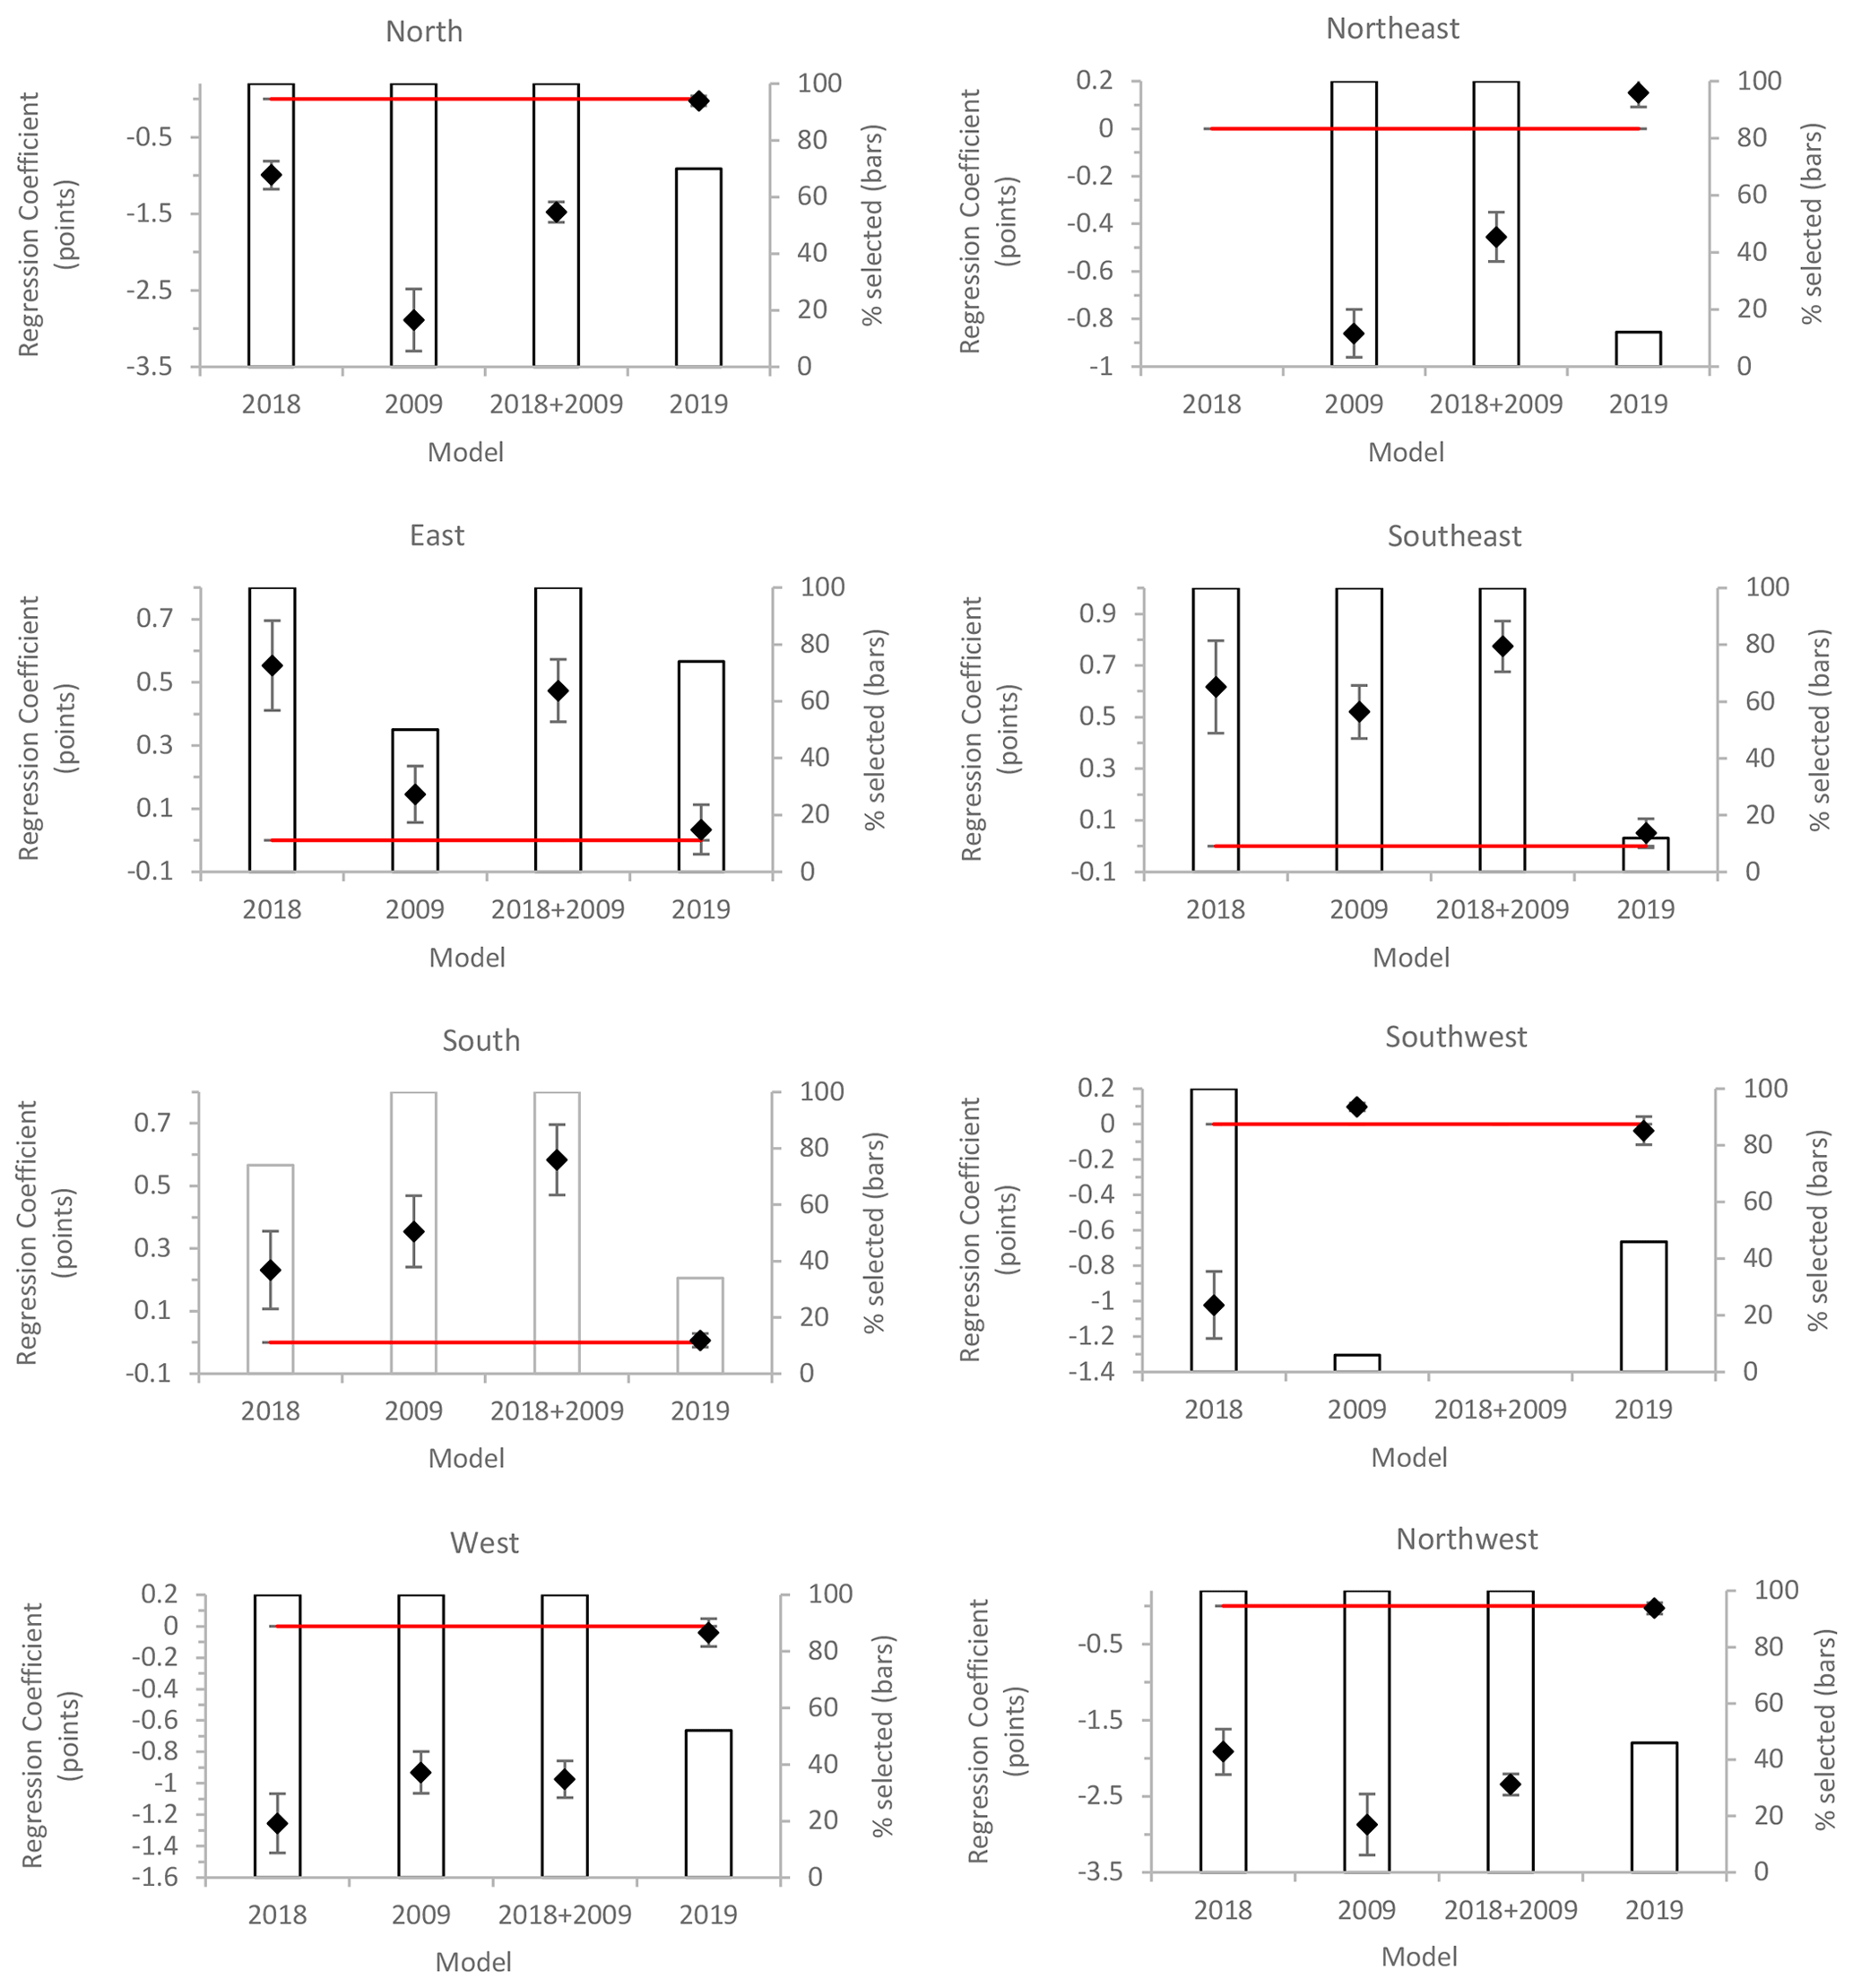
Figure 3Graphical display of the aspect regression coefficients presented in Table 1. Red line shows the “zero line” for the regression coefficients, black markers show the regression coefficients and associated ±1 SDs, and the bars show the selection percentages.
For the 2019 Typhoon Abuan (which was both spatially and temporally distinct to the 2009 and 2018 events), the model had relatively similar relationships as observed in the Itogon models for distance to channels, planform curvature, profile curvature, and elevation, which were again consistently selected factors by the LASSO. However, it should be noted that the regression coefficient for elevation during 2019 was notably larger (−0.28 compared to −0.06 and −0.09), and thus more dominant, than it was in 2018 and 2009 in Itogon. However, for the other topographical factors included in the modelling, it is evident that their impacts on landsliding were different in 2019 compared to 2009 and 2018. For example, as outlined above, in 2018 and 2009, higher slope angles made landslides more likely. However, in 2019, even though slope angles lower than 10∘ made landslides less likely, slope angle was not found to be a dominant control on landsliding, with less than 30 % of the model runs selecting slope as an important factor and those that did assigning it a coefficient value near zero (i.e. it has little to no effect on landsliding). Similarly, unlike in 2009 and 2018, the regression coefficients for all aspects were near zero in 2019, suggesting that aspect was not exerting a dominant control on landsliding in this case. This result is highlighted in Fig. 3, which graphically displays the aspect regression coefficient and LASSO selection results presented in Table 1. For the categorical factors (geology, soil type, and land cover), the 2019 Abuan event was markedly different to the Itogon events. For example, no soil units were selected as controlling landslide distributions. In fact, the only categorical factors to be selected consistently by the LASSO in 2019 were andesite–basalt and open forest, which had strong positive coefficients, and limestone, which had a strong negative coefficient.
5.2 Landslide susceptibility maps
Figure 4 shows the final landslide susceptibility maps resulting from the model parameters presented in Table 1. As shown in Table 1, these maps had initial accuracies (i.e. the accuracies of classifying the data used to train them) of 68 %–83 %. However, to properly validate the accuracies of these maps it was necessary to use AUROC analysis to assess how well each model could classify independent testing data from each of the respective events. The resulting AUROC curves and AUROC values are shown in Fig. 5, which show that the independently tested accuracies of each model are 65 %–82 %. As highlighted in Sect. 4.2, these AUROC values suggest that the three Itogon models are good to very good (accuracies of 78 %–82 %) but that the Abuan model is poor (accuracy of 65 %).
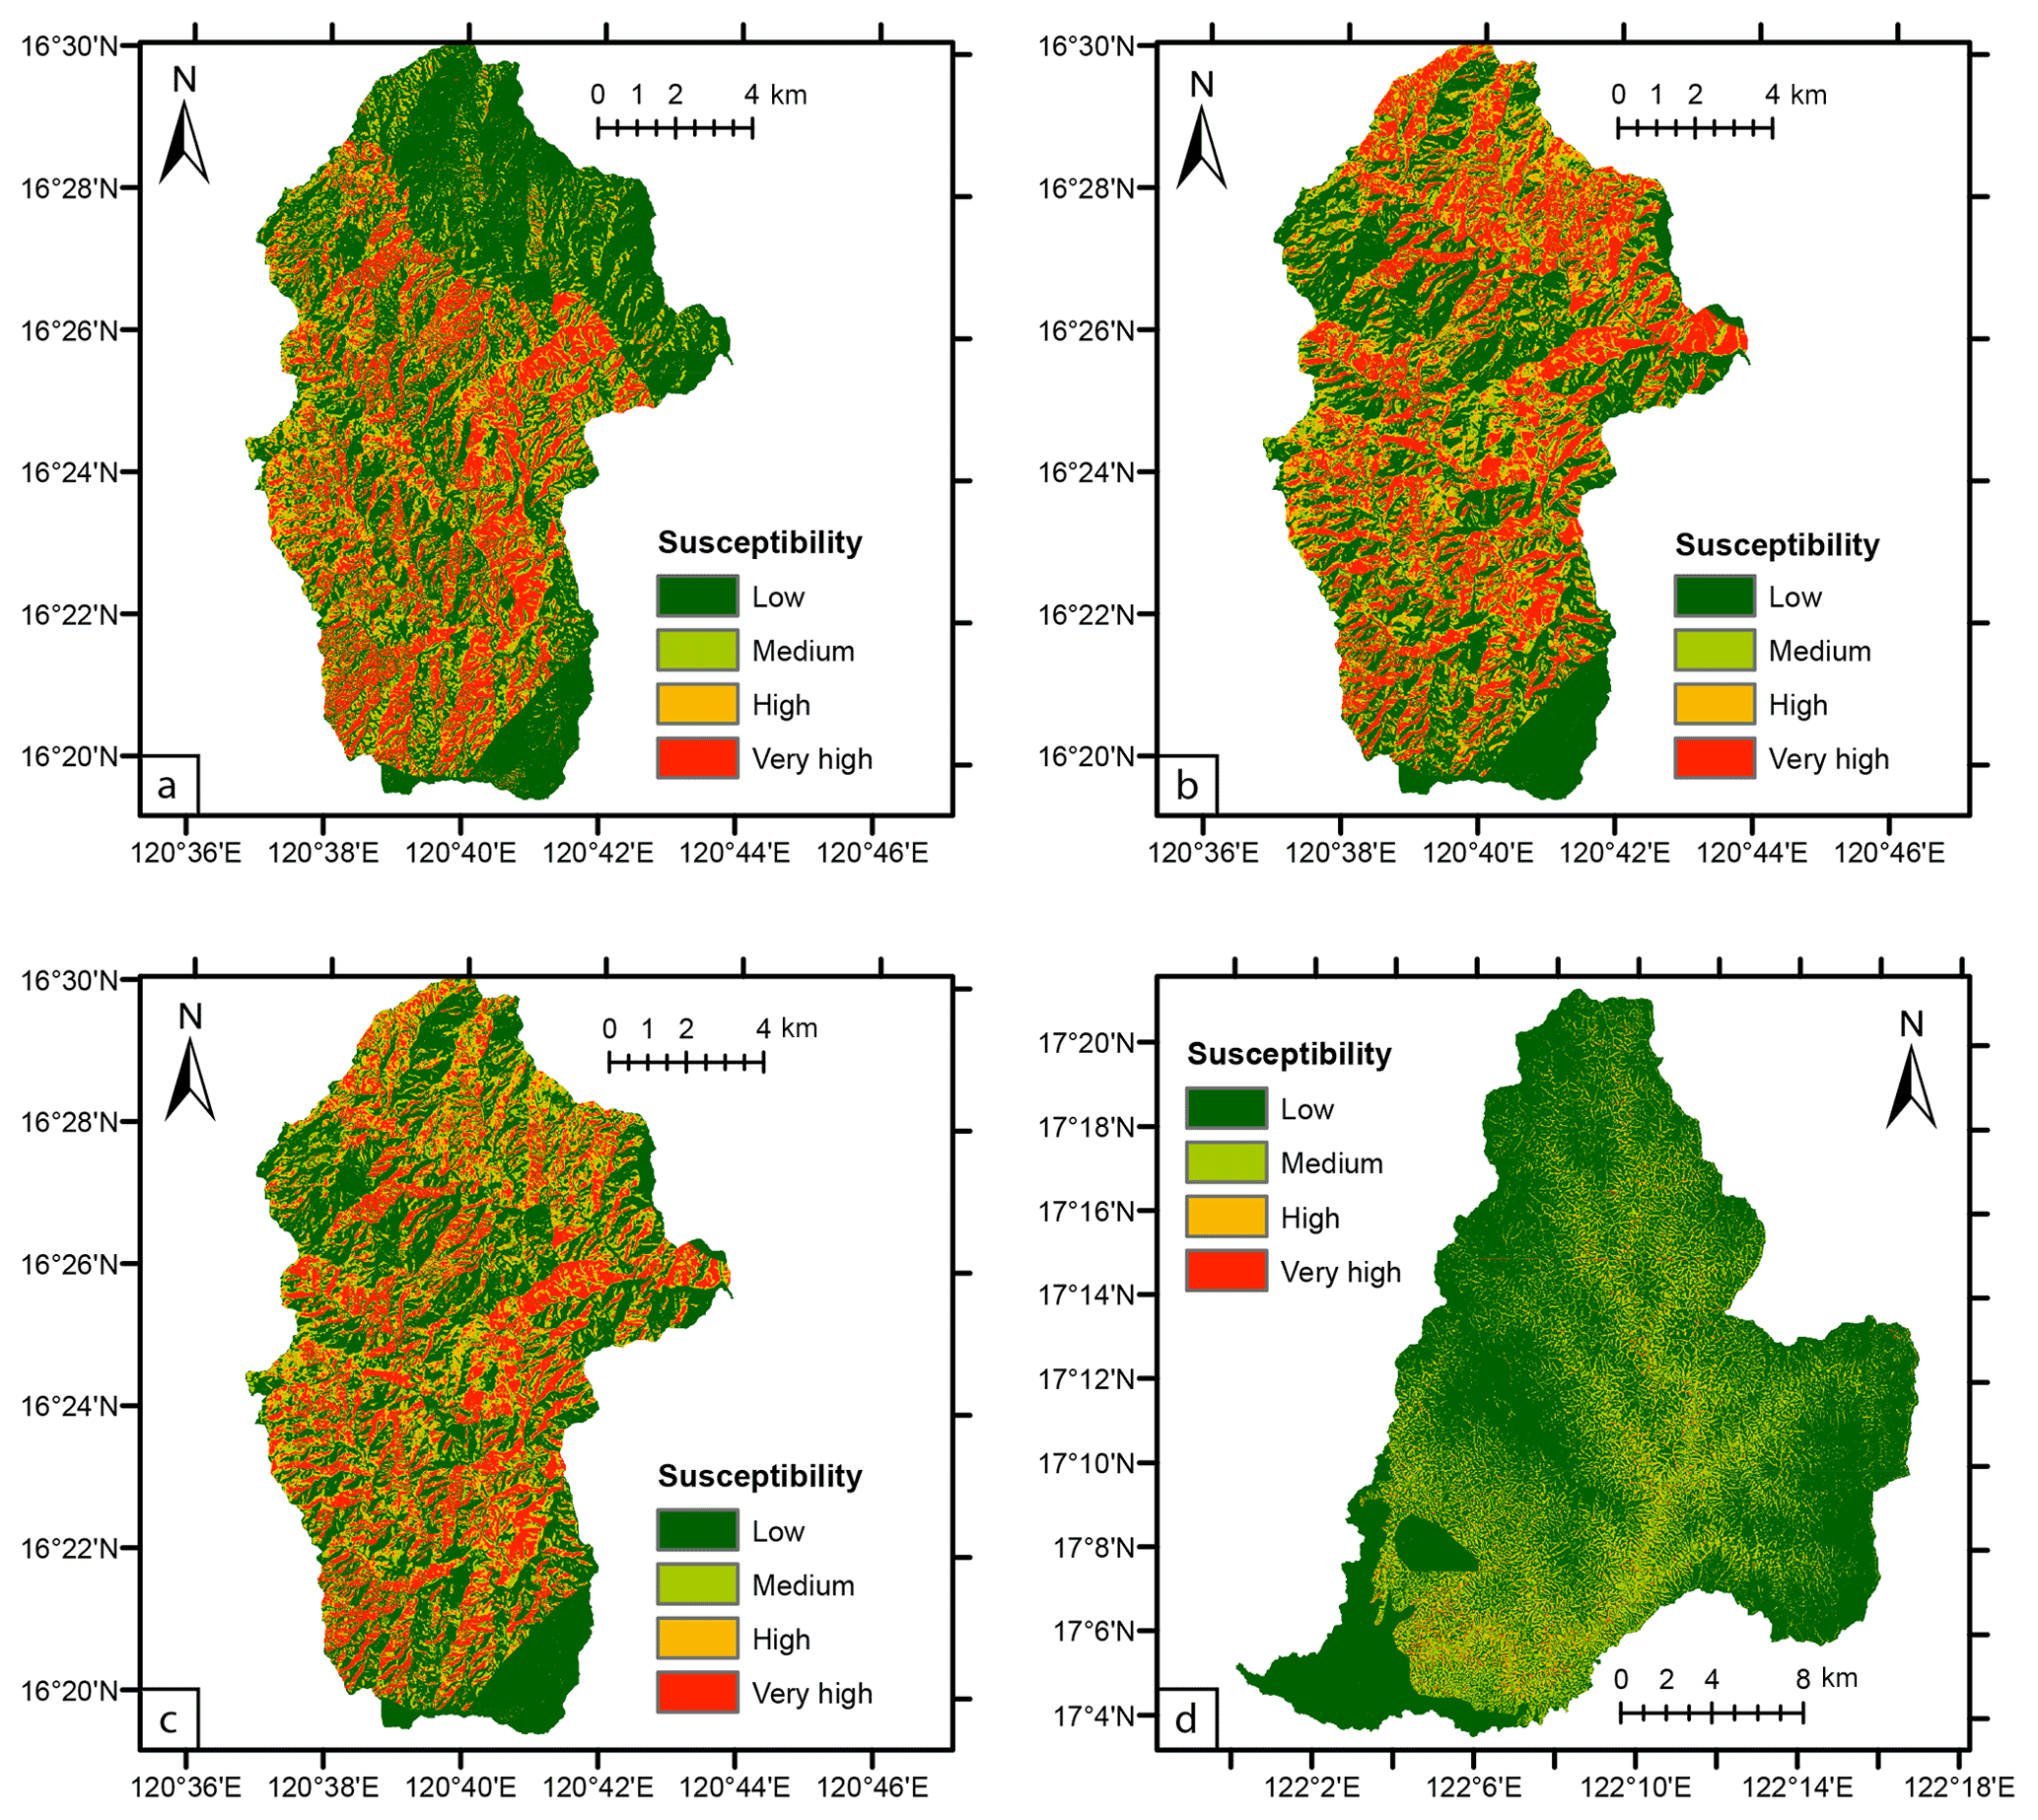
Figure 4The final susceptibility maps produced from (a) the 2018 landslide inventory, (b) the 2009 landslide inventory, (c) the combined 2018 and 2009 inventories, and (d) the 2019 inventory. Here (a)–(c) correspond to the Itogon region and (d) to the Abuan region.
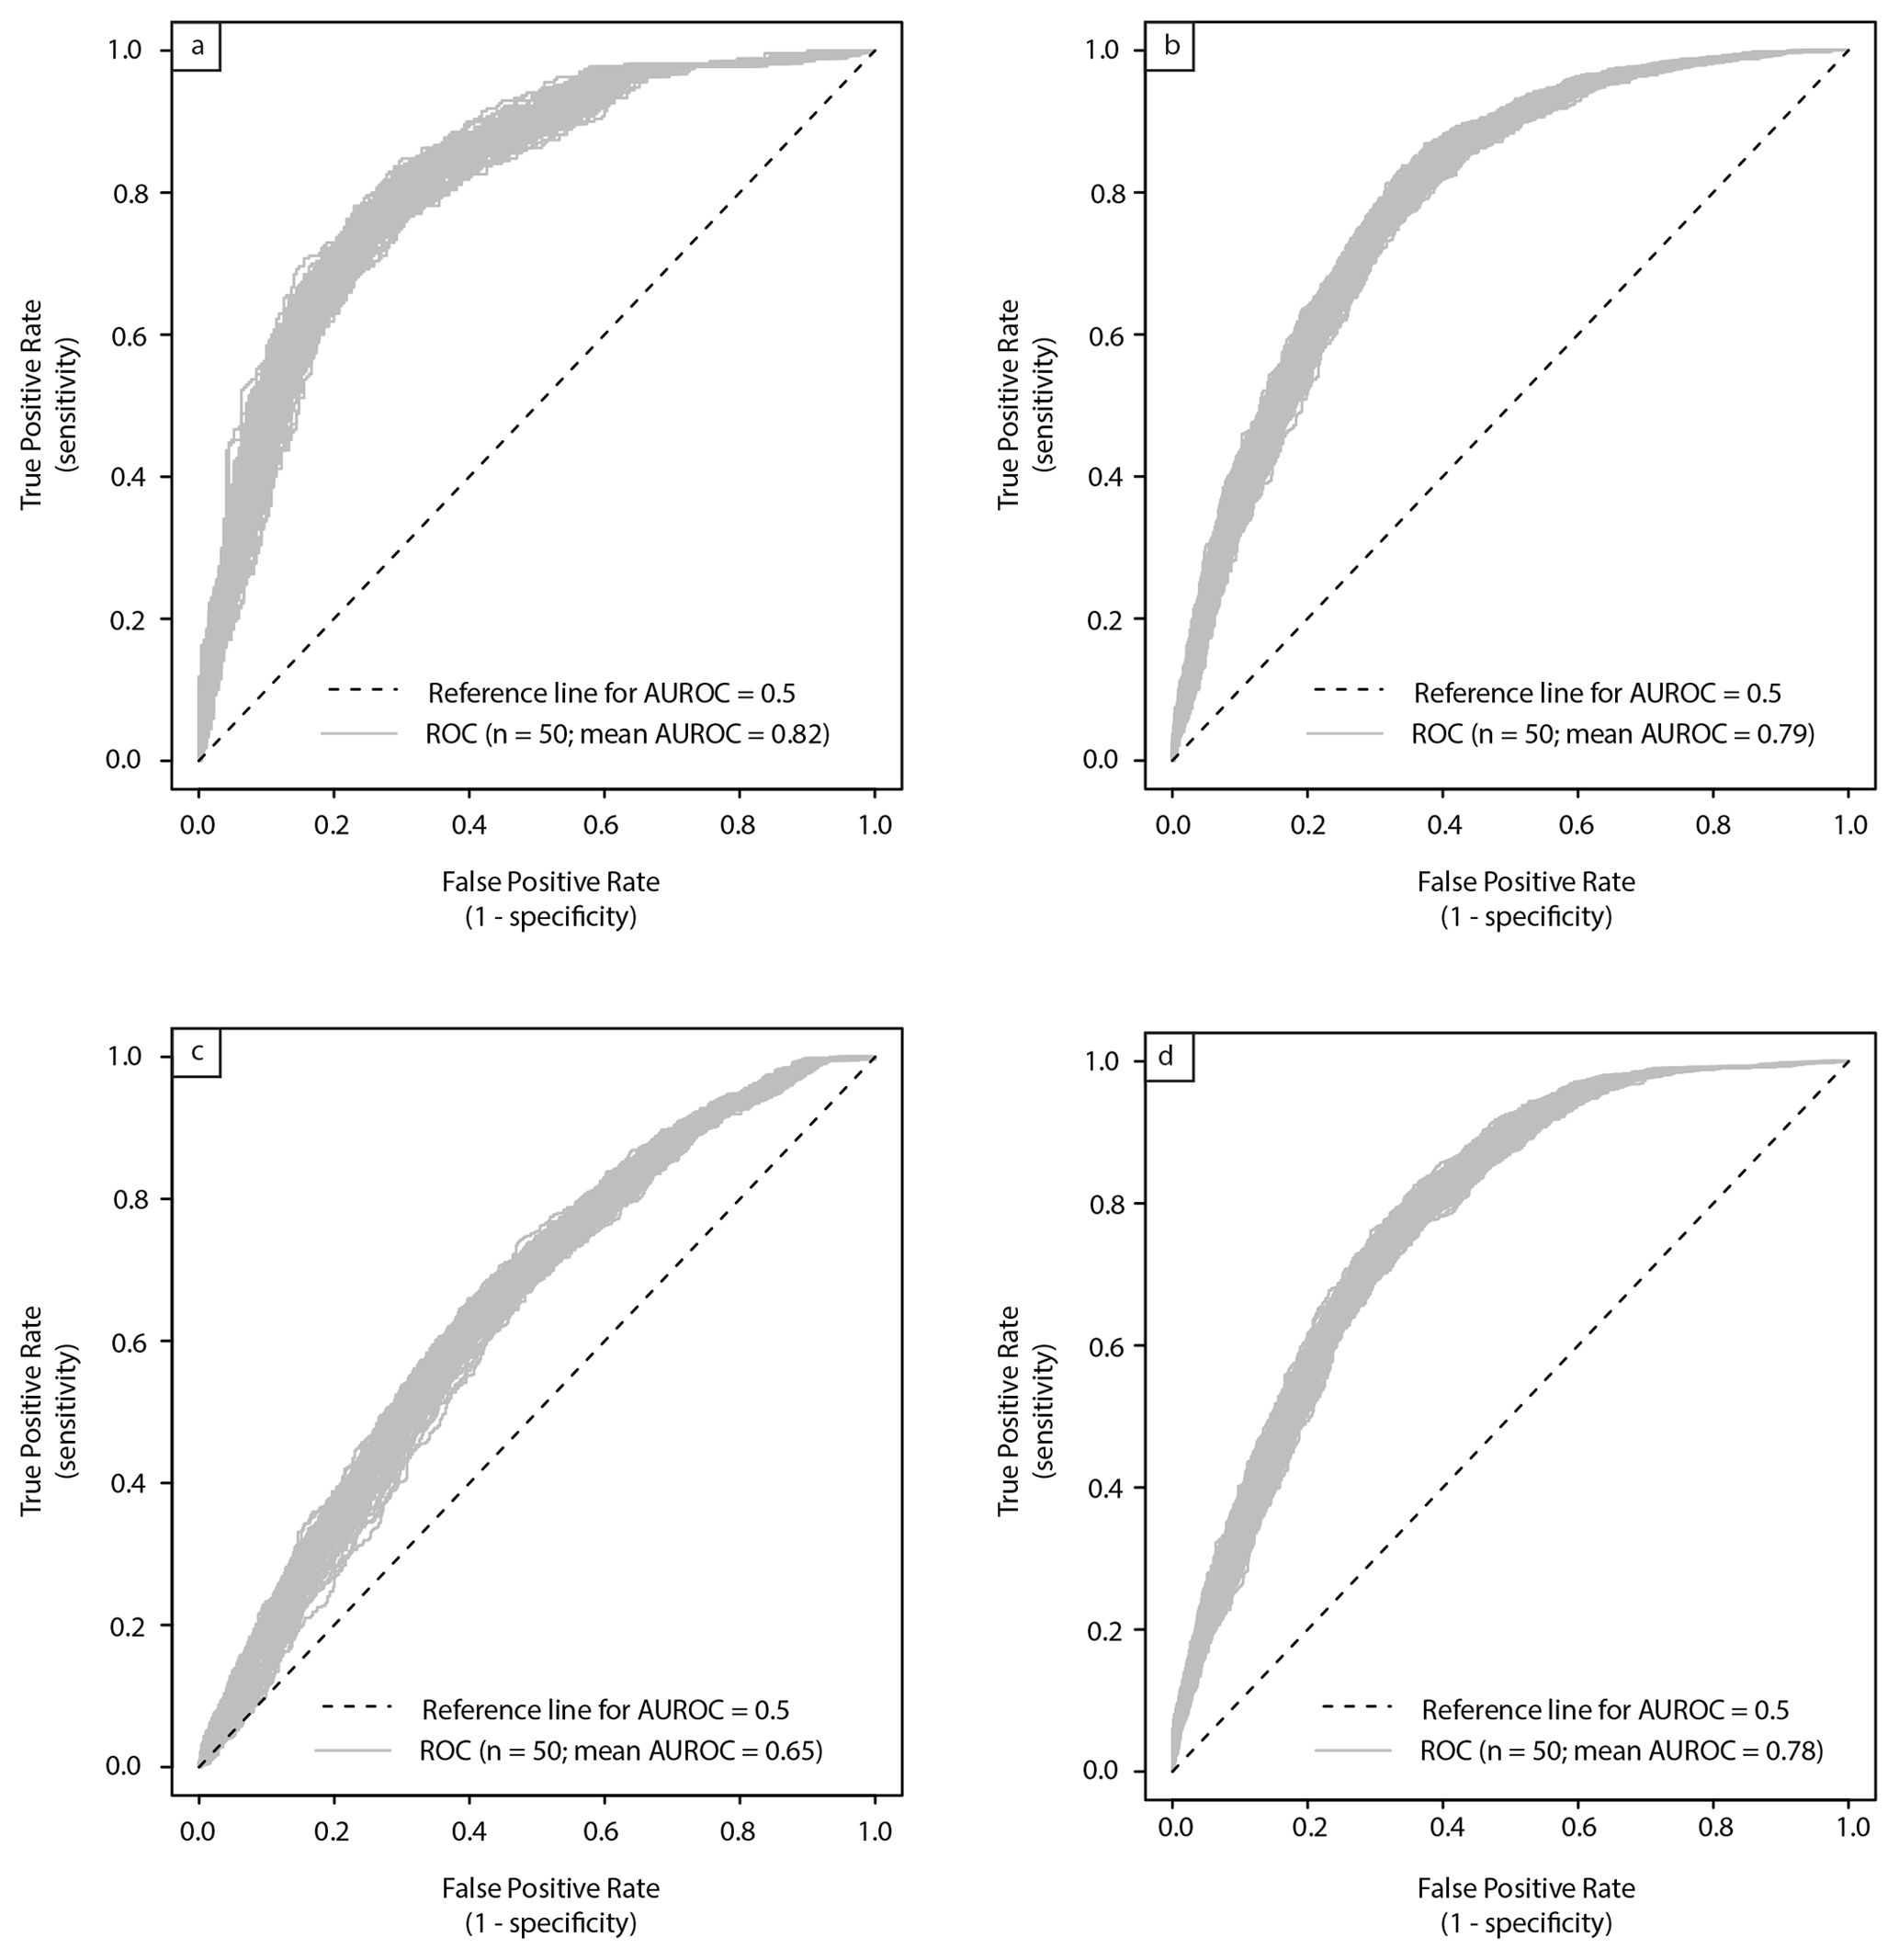
Figure 5Receiver operator curves (ROCs) showing the success of (a) the 2018 model classifying the independent 2018 testing data, (b) the 2009 model classifying the independent 2009 testing data, (c) the 2019 model classifying the independent 2019 testing data, and (d) the 2018 + 2009 model classifying the independent 2018 + 2009 testing data. In each case the reference ROC for a “random” model with 50 % accuracy is shown, as is the mean area under the receiver operator curve (AUROC) value for all ROCs.
5.3 Cross-model AUROC validation
To assess the temporal dependency of typhoon-triggered landslides, we used cross-model AUROC validation to investigate how well one model could predict independent landslide testing data from the other typhoon event(s); i.e. we assessed the AUROC for the 2018 + 2009 model's ability to classify independent landslide data from the 2018, 2009, and 2019 typhoon events (Fig. 6); the AUROC for the 2018 model's ability to classify the 2009 and 2019 events (Fig. 7a and b); and the AUROC for the 2009 model's ability to classify the 2018 and 2019 events (Fig. 7c and d). Note that, as the 2019 model had low initial accuracy even when trying to classify the landslides used to train it, we did not cross-validate this model against the 2018 or 2009 landslide data.
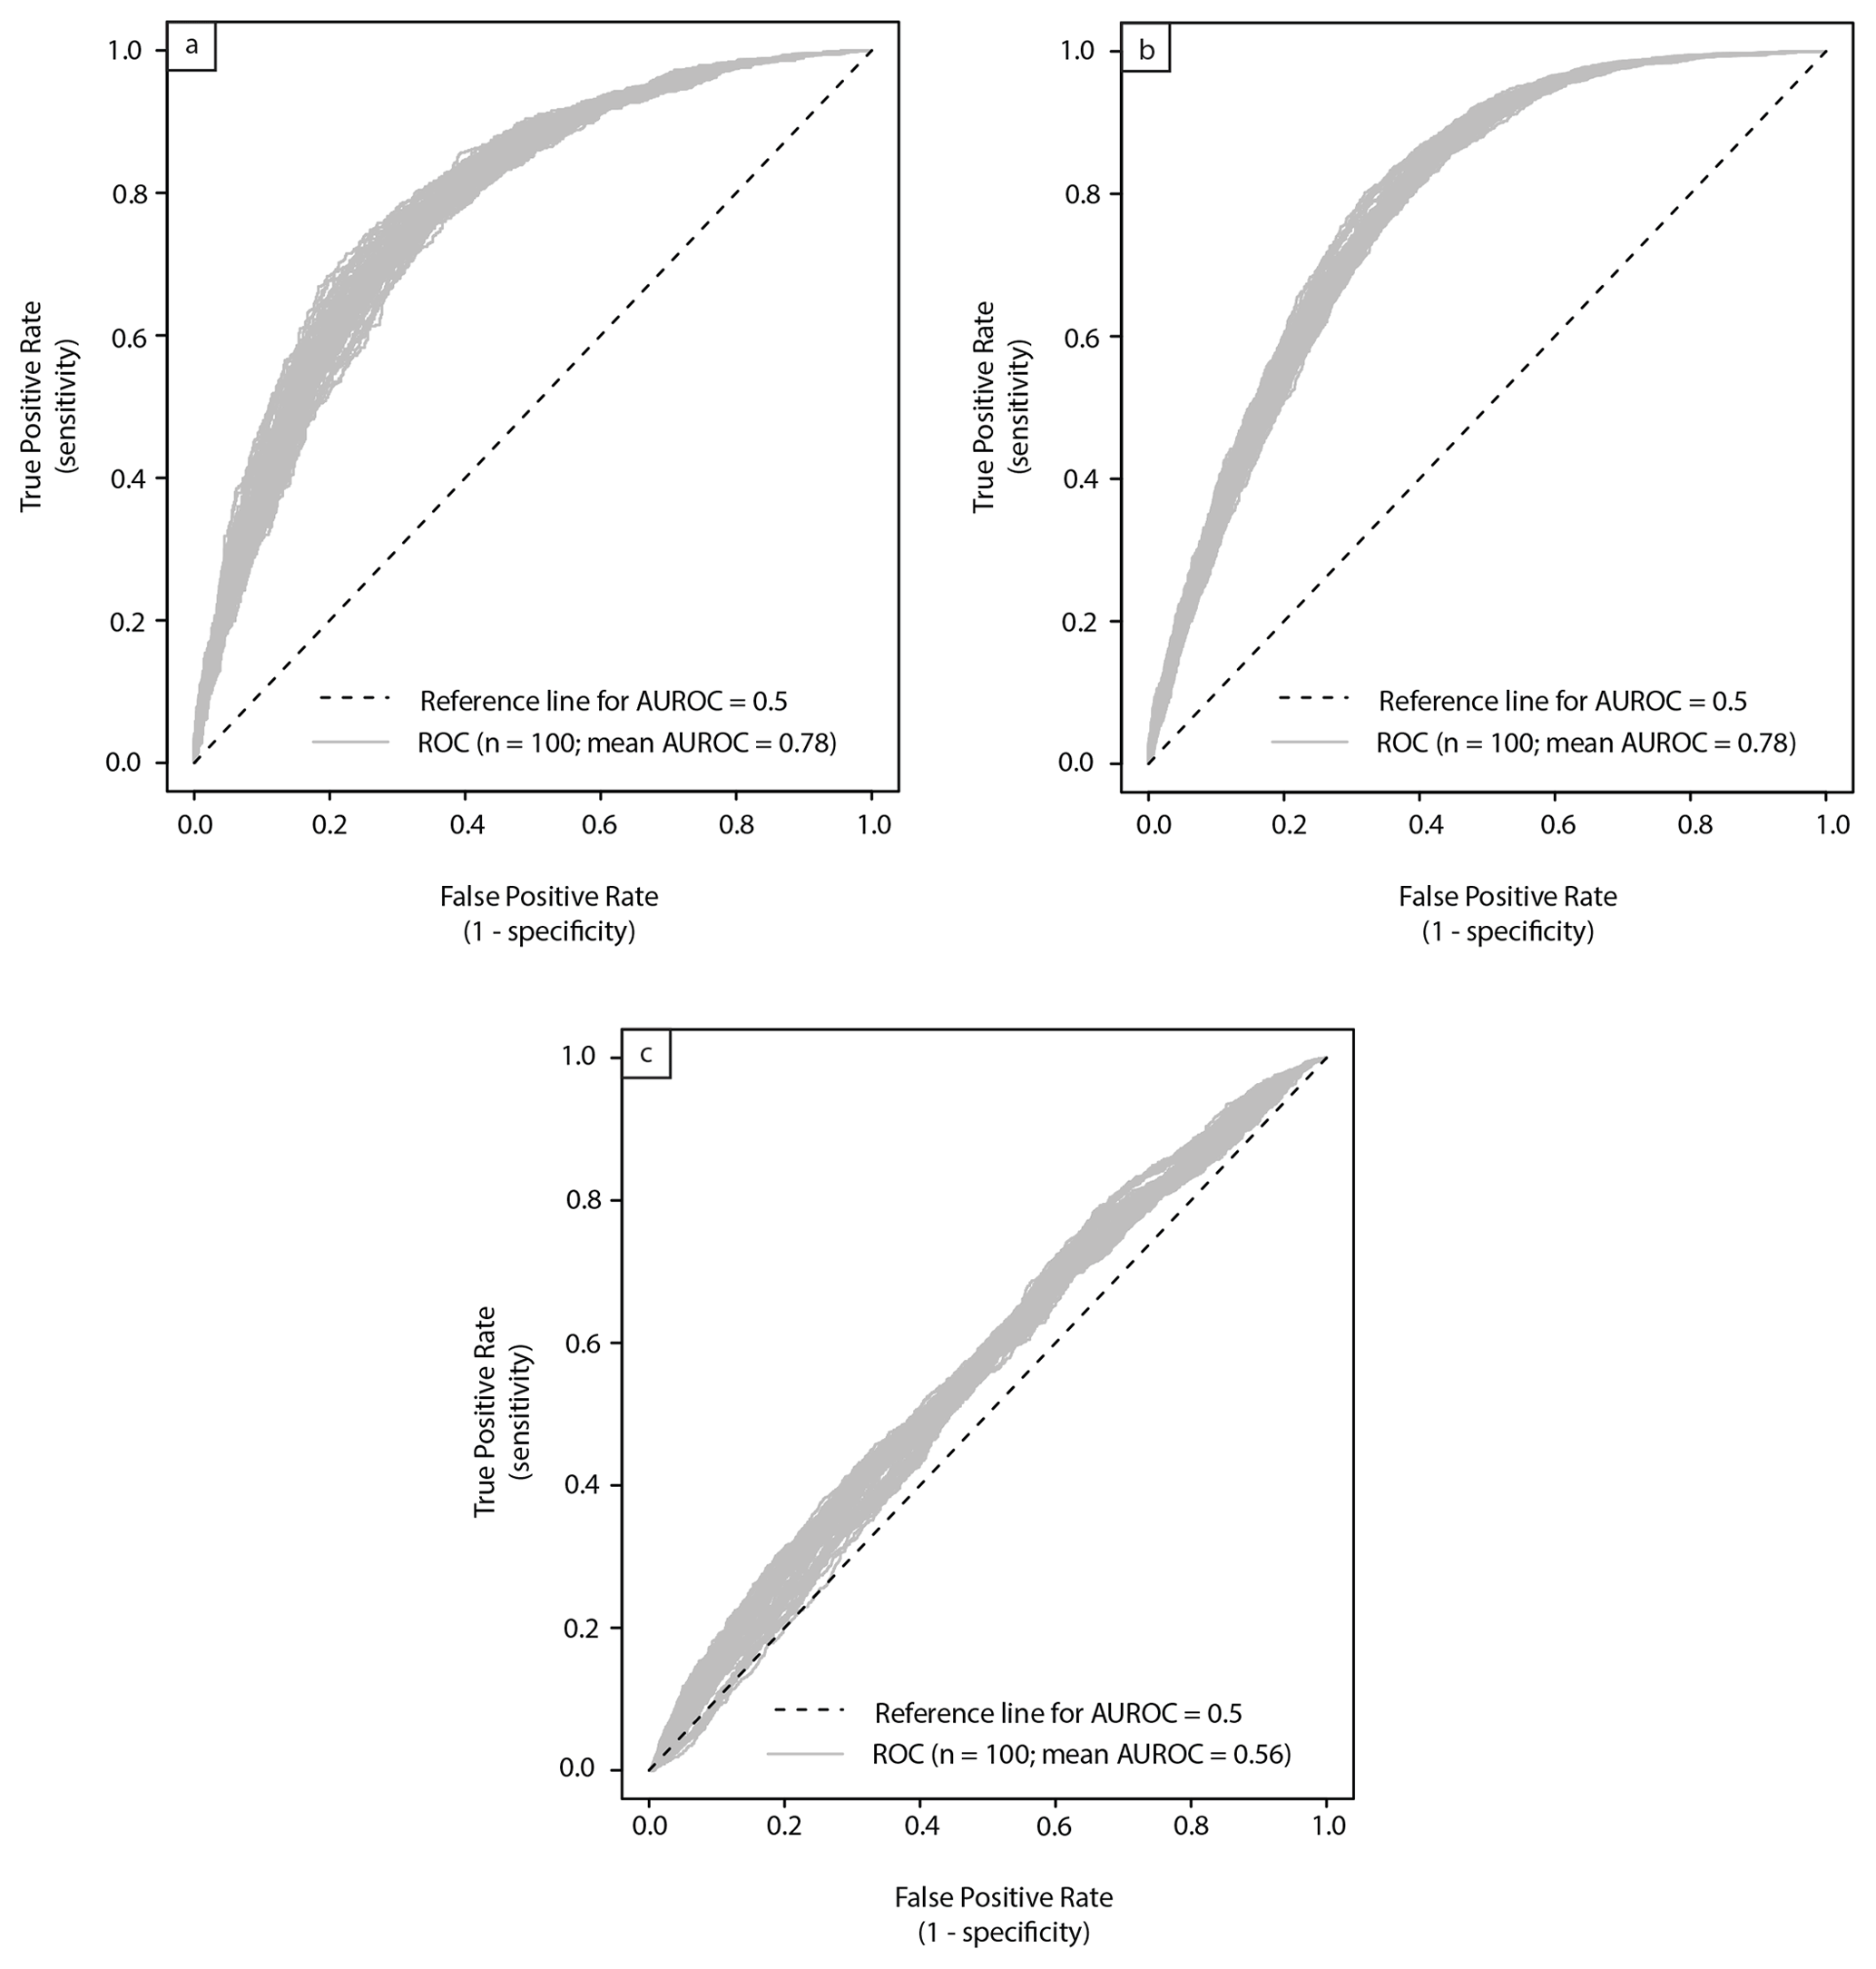
Figure 6Receiver operator curves (ROCs) showing the performance of the 2018 + 2009 model at classifying independent testing data from (a) 2018, (b) 2009, and (c) 2019. In each case the reference ROC for a “random” model with 50 % accuracy is shown, as is the AUROC value for all ROCs.
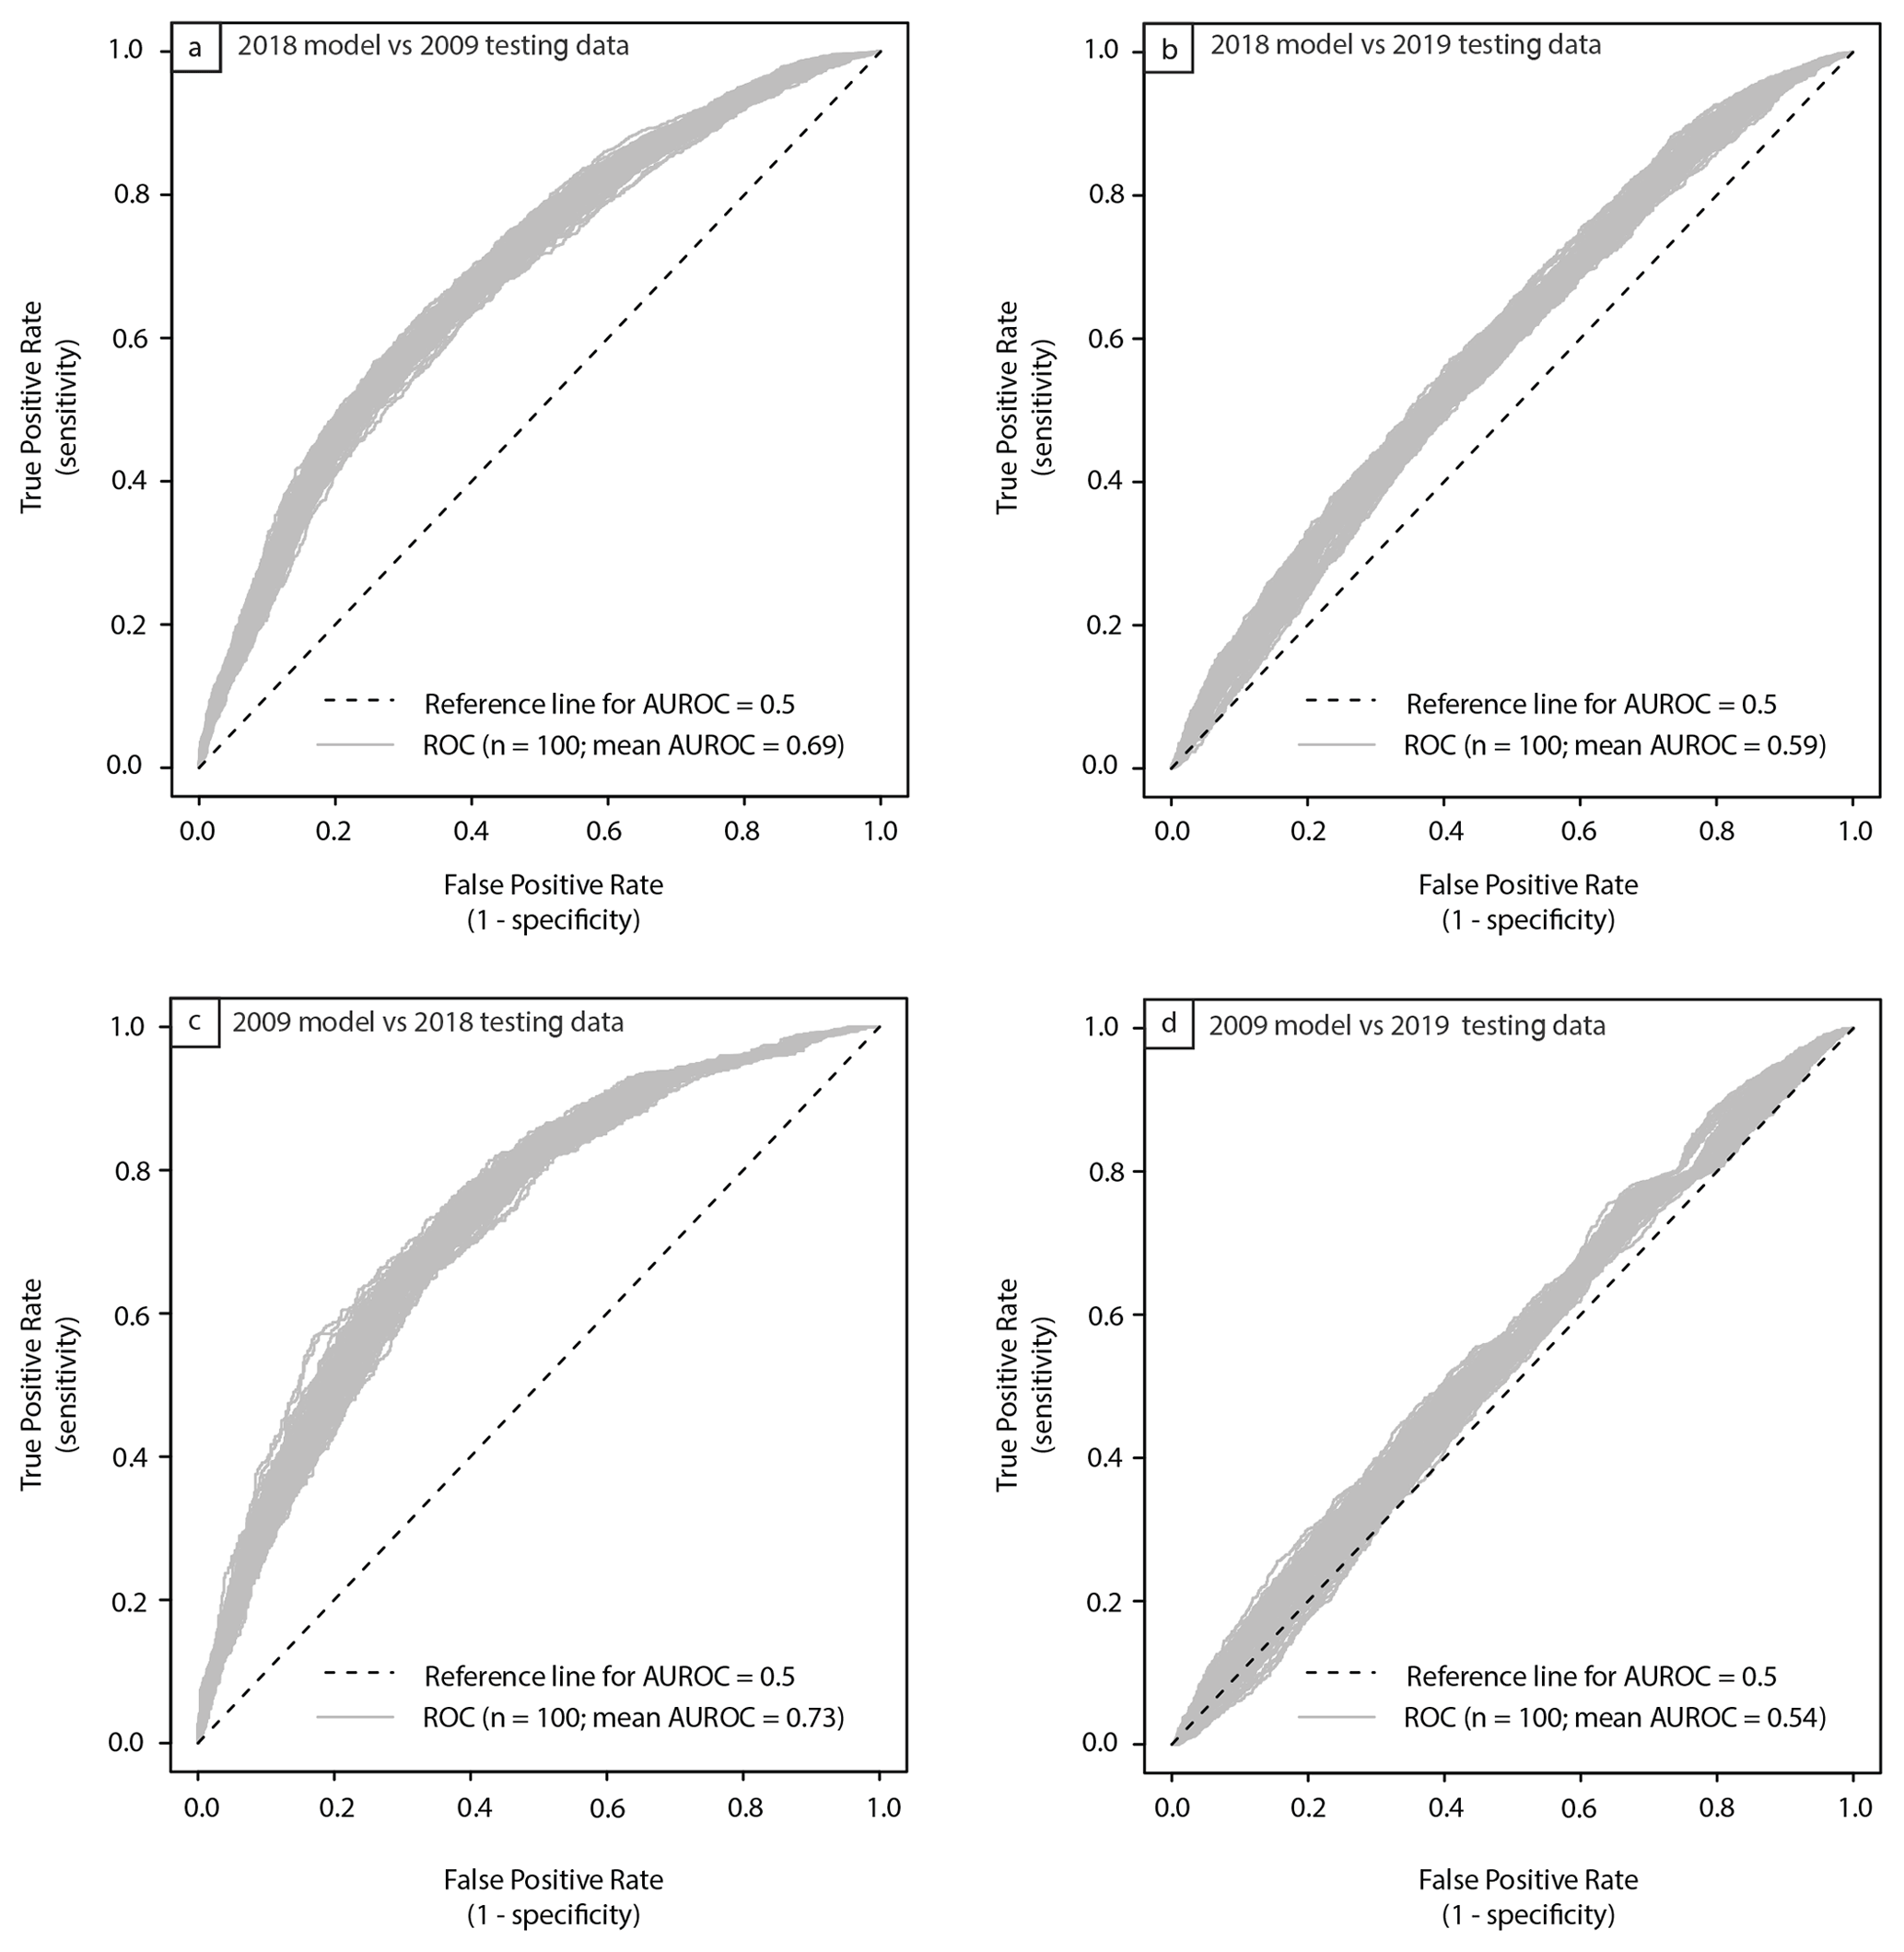
Figure 7Receiver operator curves (ROCs) showing the performance of (a) the 2018 model classifying independent testing data from 2009, (b) the 2018 model classifying independent testing data from 2019, (c) the 2009 model classifying independent testing data from 2018, and (d) the 2009 model classifying independent testing data from 2019. In each case the reference ROC for a “random” model with 50 % accuracy is shown, as is the AUROC value for all ROCs.
This shows that the 2018 and 2009 models are 6 %–10 % worse at classifying the other individual typhoon events compared to the models developed specifically for those events (e.g. Fig. 5). Conversely, the 2019 model is 32 %–33 % worse at classifying the 2018 and 2009 models compared to the models developed specifically for those events, with AUROC values > 0.6 in both cases. Finally, the 2018 + 2009 model is 8 % worse at classifying the 2019 event compared to the model developed specifically for 2019 but only 1 %–3 % worse at classifying the 2009 and 2018 events compared to the models developed specifically for those events.
6.1 Landslide susceptibility modelling
The first and second aims of this paper were to develop new and updated susceptibility models and maps for two regions of the Philippines using three typhoon-triggered landslide events and to assess the similarities and differences between the susceptibility results of the different models. As shown by the AUROC values, in the Itogon region this aim has been met, with three models developed with good to very good AUROC values of 78 %–82 %. The maps for Itogon can be compared to the existing NOAH and MGB maps for this region presented in Fig. 1. By comparing the existing and new maps, it is evident that these maps agree on the broad-scale susceptibility classification, i.e. that much of the Itogon region has high to very high landslide susceptibilities. However, even when compared to the NOAH maps, the new maps presented here have much more slope-scale detail, whereby it is possible to distinguish differential susceptibility across different topographical characteristics of the landscape. Indeed, as also highlighted by the regression coefficients (Table 1), it is clear that typhoon-triggered landslide susceptibility in Itogon is highest at eastern, southeastern, and southern aspects; slope angles of 30–40∘; convex curvatures; clay soil; and shrubland–grassland use but lower at western, northwestern, and northern aspects; slope angles < 30∘; concave curvatures; and mountain soil. These results are unsurprising given the observations of Abancó et al. (2021) who found similar topographical and geological relationships between the landslides associated with the 2018 Typhoon Mangkhut. As such, due to the increased detail and information provided, the new Itogon maps should be much more useful for the purposes of hazard zonation and management than the existing MGB map.
Conversely, the model developed for the Abuan region is significantly less accurate, with AUROC values of just 65 %–68 %. As discussed in Sect. 6.1.1, it is therefore not appropriate to conclude that a reliable susceptibility map has been developed for this case. This raises the question of why the Abuan model is so much less accurate than those developed for Itogon. One explanation is that the model inaccuracies are due to biases and incompleteness in the 2019 Kammuri landslide inventory. Work by Steger et al. (2016, 2017, 2021) outlines how inconsistent, biased, incomplete, or otherwise inaccurate landslide inventories can lead to the development of statistical susceptibility models with incorrect or unfeasible regression coefficients. It is difficult to quantify whether this issue is relevant in this case. However, given that the 2019 inventory was mapped, checked, and reviewed by four different people, and mapping was conducted using the same methodology as was used for the 2018 and 2009 inventories, it seems unlikely that mapping error can explain the significant model inaccuracies. Furthermore, whilst the inventories were based on imageries with slightly varying resolutions, the number of landslides mapped for the Abuan case suggests that this did not affect the completeness or accuracy of the landslides in the inventory.
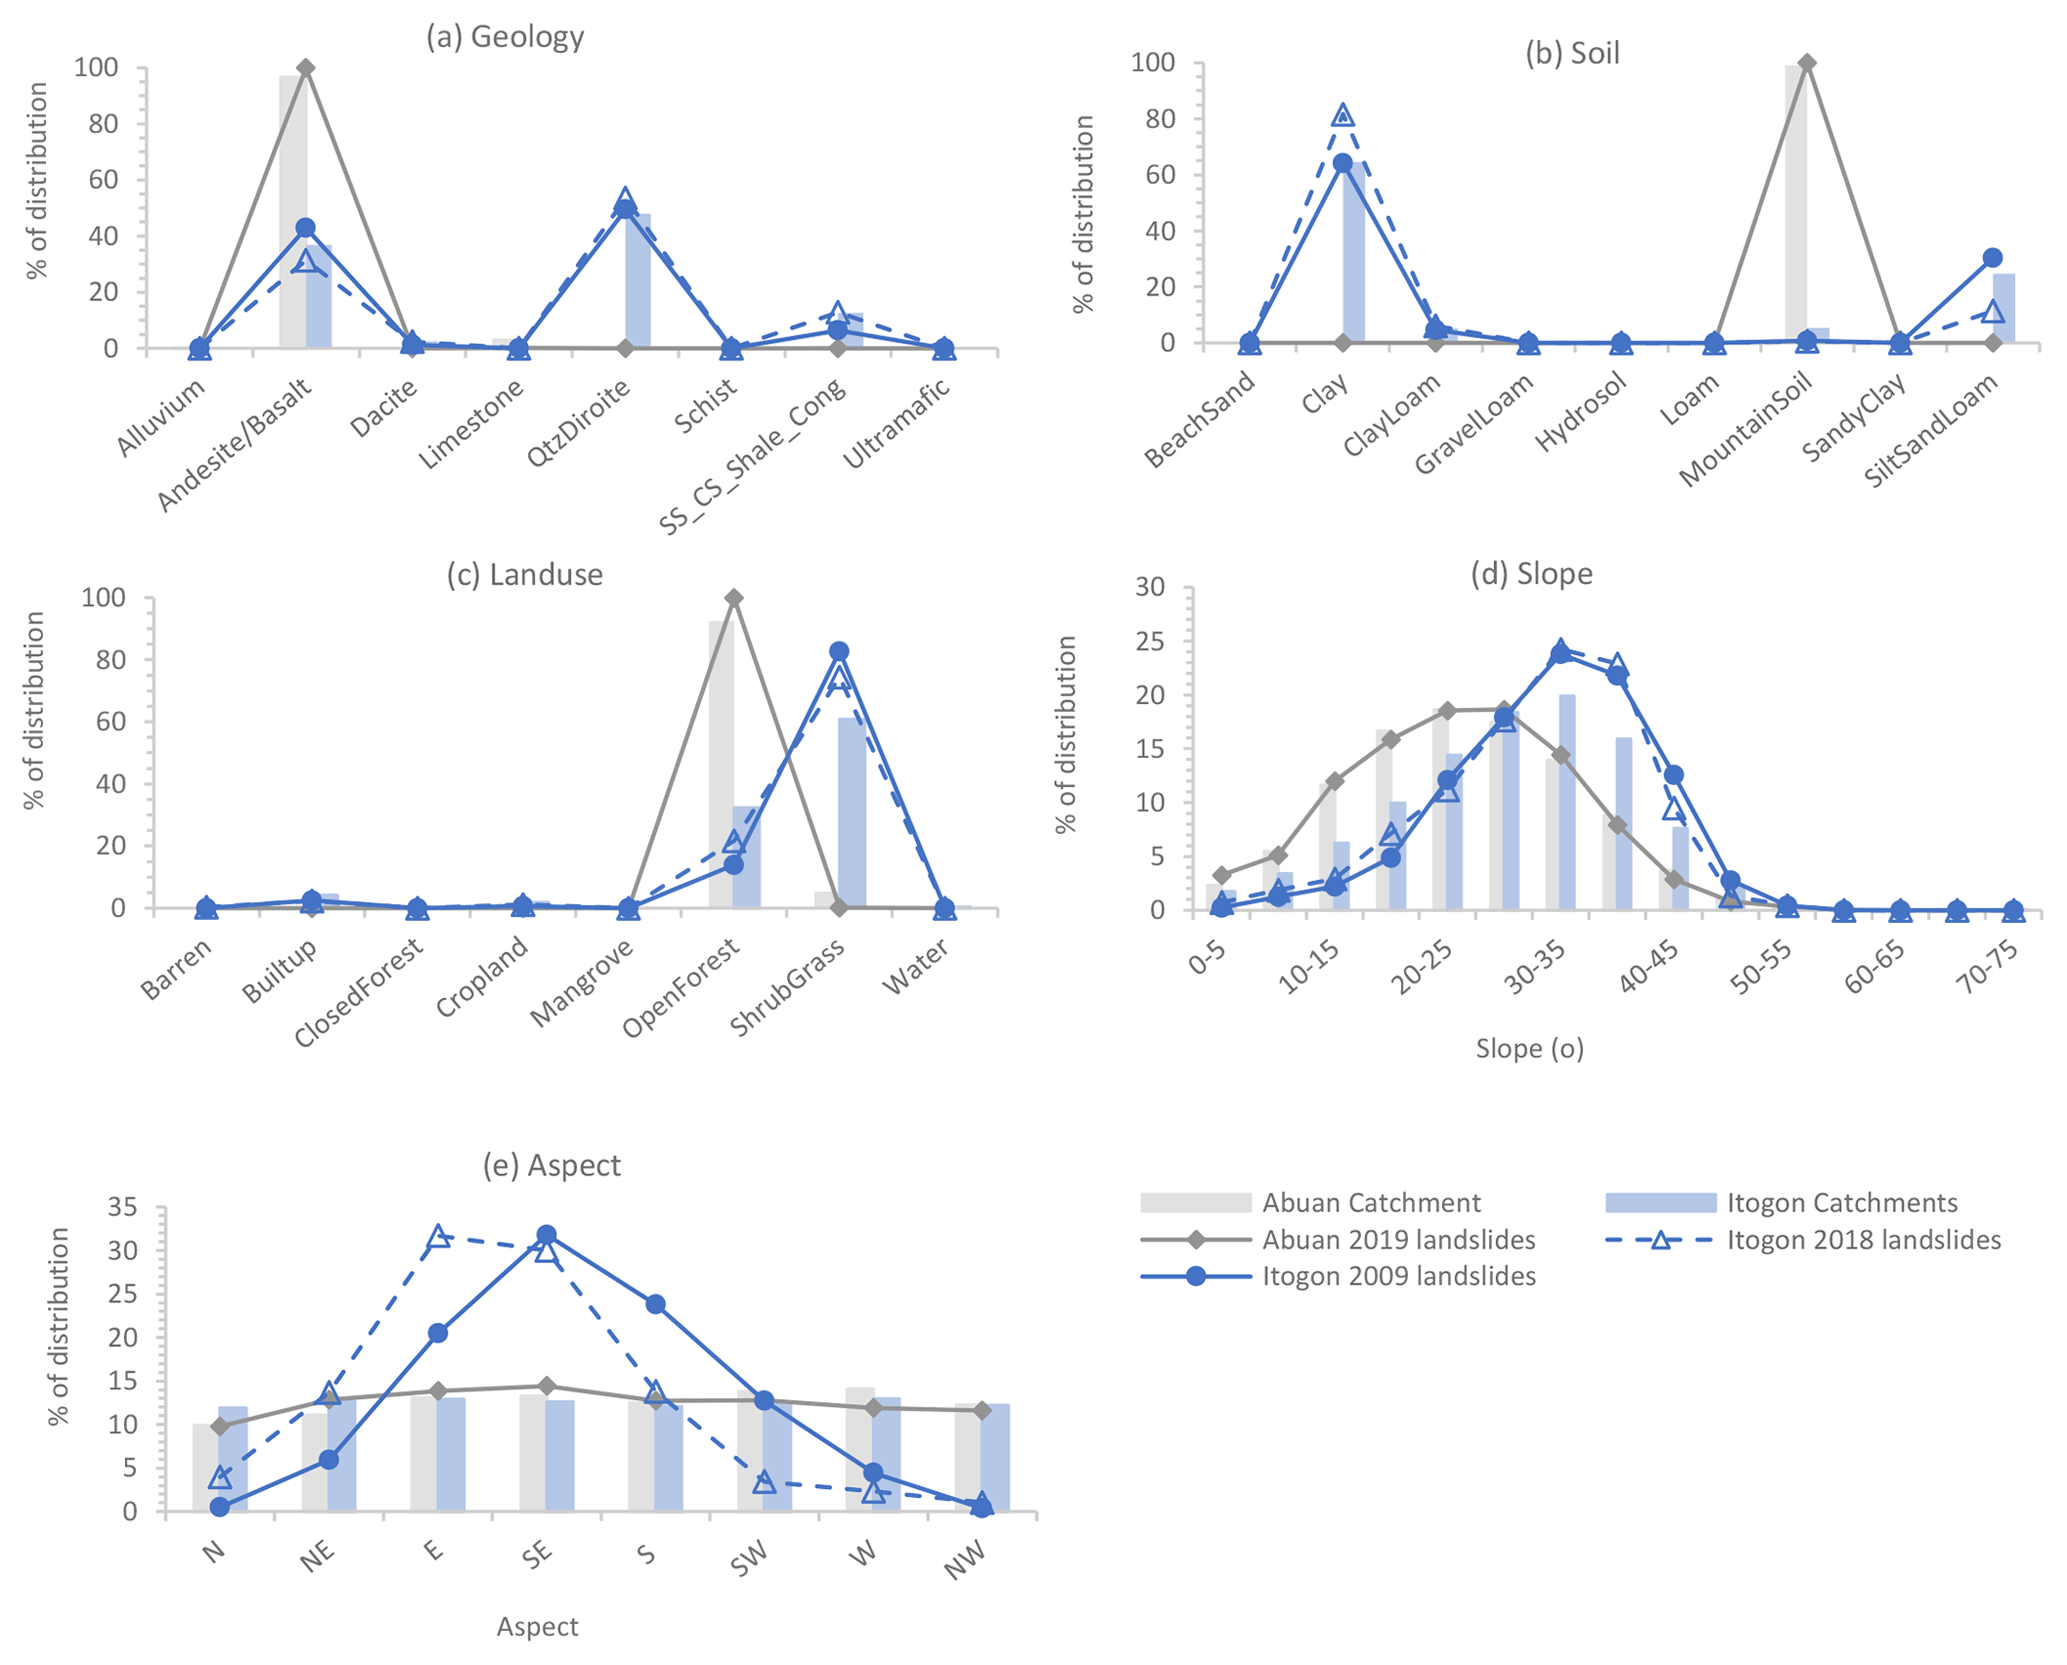
Figure 8The distributions of each study region and of different landslide datasets with respect to (a) geology, (b) soil, (c) land use, (d) hillslope angle, and (e) hillslope aspect. Note that if a landslide distribution deviates above or below the catchment distribution, then that suggests that a factor is having a positive or negative influence on landslide occurrence.
Another explanation for the reduced accuracy of the 2019 model could lie in the input data. For the Itogon region, the categorical inputs for geology, soil, and land cover included multiple classes, with landslides occurring within several of these classes (Fig. 8a–c). However, in the Abuan region, these inputs were of a lower resolution, with near-homogenous classes across the entire region and almost all landslides just occurring in one class of each variable (Fig. 8a–c). Indeed, in Abuan there is only one soil type, “mountain soil”, so it is impossible for the regression model to use soil as an input type (hence why there are no regression coefficient values for soils in Abuan in Table 1). Consequently, there were far fewer input data available for the BLR model to use in the Abuan case compared to the Itogon case. Indeed, the Itogon region has several soils, which will all likely have different geotechnical characteristics (e.g. shear resistance), which may aid the model in differentiating landslide susceptibility classes. Similarly, it is evident that the landslides included in the 2019 inventory had significantly different distributions to the landslides associated with the 2018 and 2009 typhoons. Whilst the 2018 and 2009 landslides were preferentially distributed at certain aspects and slope angles (e.g. Fig. 8d and e), with these factors proving very important for the BLR model classifications, the 2019 landslides occurred across the whole landscape, with no preferential occurrence at any aspects or slope angles (e.g. Fig. 8d and e). This, combined with the homogenous categorical input data, meant that there was very little spatial information for the BLR model to use when attempting to classify landslide occurrence and non-occurrence.
However, whilst this may offer an explanation as to why the 2019 model was inaccurate, it raises the question of why the landslides in 2019 were so evenly distributed across the landscape. One potential explanation is based on the landslide storm cell model proposed by Crozier (2017). This model describes patterns of landsliding associated with atmospheric storms cells, whereby landslides are assumed to occur in a circular pattern radiating from the storm centre. The model defines three main zones. The core zone is where a storm has maximum rainfall totals and intensity (typically > 500 mm of total rainfall) and associated landslides that are distributed at all landscape locations regardless of variations in land use, geology, and topography. The middle zone has enough rainfall to trigger widespread landsliding but only where the landscape is particularly susceptible to failure due to factors such as higher slope angles, as well as more failure-prone lithologies, land use, and soil cover. The peripheral zone is where landslide occurrence is restricted by insufficient rainfall, and therefore only limited landsliding occurs in portions of the landscape where rainfall can accumulate. In this case, if the Abuan catchment occurred within the core zone of Typhoon Kammuri, then this could explain why the landslides occurred across all portions of the landscape. To test this, daily PERSIANN-CCS-CDR (Precipitation Estimation from Remotely Sensed Information using Artificial Neural Networks and Cloud Classification System Climate Data Record) rainfall data for the 2019 Typhoon Kammuri in Abuan and the 2018 Typhoon Mangkhut and the 2009 Typhoon Parma in Itogon were obtained. These data show that the maximum daily rainfall across Abuan during the 2019 Typhoon Kammuri was actually lower than that which occurred across Itogon during both the 2018 and 2009 typhoons (78 mm compared to 97 and 108 mm). This suggests either that the PERSIANN-CCS-CDR data are significantly underestimating the 2019 event rainfall, which such satellite-derived rainfall products are prone to doing (Zhu et al., 2016; Jiang et al., 2017), or that particularly intense rainfall is not the cause of the observed landslide distributions. Given that the Abuan region was never in the centre of the path of Typhoon Kammuri (where you would expect the core zone to occur), the latter is potentially more likely. Another factor that could be causing the unexpected relationships with rainfall is the fact that rainfall products struggle to capture spatial rainfall patterns and locate storm centres (Ozturk et al., 2021a), and as such it may not appear to spatially correlate with the highest landslide densities.
Another possible explanation for the 2019 landslide distributions could be the directionality of the 2019 typhoon. It has been proposed that the direction of storm wind circulations influences the aspects at which landslides occur (e.g. Gorokhovich and Vustianiuk, 2021). As such, if the 2019 Typhoon Kammuri changed direction several times, and thus wind circulations changed orientation, then this could explain why landslides occurred at all aspects and slope angles. However, for several reasons this explanation also seems unlikely. First, rainfall analysis by Abancó et al. (2021) found that typhoon rain and wind direction could not explain the aspect response of the 2018 Mangkhut landslides, suggesting that typhoon directionality is not as important a process as might be expected. Second, we could find no evidence that the 2019 typhoon changed direction, with it seemingly following a relatively constant east to west path.
As such, overall, it is suggested that the inaccuracies in the 2019 model are due to a combination of poor input data and the fact that the 2019 Kammuri landslides were distributed evenly across the landscape (therefore giving little spatial correlation for the BLR method to use for classification). However, it remains unclear why the landslides triggered by the 2019 typhoon were distributed like this, with the rainfall in 2019 being no more intense than the other events and there being no obviously strange directional behaviour of Typhoon Kammuri. Future work should investigate this issue further, with a particular focus on an analysis of the 2019 event rainfall, as understanding why certain typhoon events may trigger unpredictable landslides has important implications for the forecasting and managing of future landslide hazard.
Implications of an unreliable susceptibility map for hazard management
Another question raised by the inaccuracies of the 2019 Abuan model is a general point about whether it is better to have no susceptibility map or a poor susceptibility map. Instinct may be to assume a mantra of “something is better than nothing”. However, in reality, this is unlikely to be the case. Susceptibility maps are commonly used for important hazard management purposes. As such, inaccurate or unreliable landslide susceptibility maps could lead to ineffective, inappropriate, or insufficient hazard management strategies being implemented. Not only is this likely to waste resources, but it could also present a danger to life and development. For example, if regions incorrectly classified as low susceptibility are subsequently built on, then human and infrastructure vulnerability could be increased. As such, in this case, given the poor overall accuracy and reliability of the Abuan model (which is likely linked predominantly to the quality of the available input data), it may be better to conclude that a new reliable susceptibility model was not produced rather than that a “poor” model was produced.
6.2 Landslide time dependency and its implications for hazard management
As described in the aims, the final objective of this paper is to provide insight into the potential time-dependent nature of typhoon-triggered landslide susceptibility in the Philippines. This objective essentially operates under the hypothesis that if typhoon-triggered landslides are time dependent, then in a given region there will be a reduced model accuracy when using a model developed from one typhoon event to classify another. In this case, we tested this by using AUROC cross-validation to compare the 2018, 2009, and 2018 + 2009 typhoon-triggered landslide susceptibility models. It should be noted that we do not consider the 2019 Abuan model here as this event occurred in a different region, which would therefore introduce issues of spatial dependency, which, whilst briefly considered, are not the focus of this paper.
As outlined in the results, we see a 9 %–10 % reduction in model accuracies when using the single-event models from 2018 or 2009 to classify independent landslide data from the other typhoon event compared to the accuracies obtained when training/testing using each typhoon event separately (Figs. 5 and 7). This therefore supports our initial hypothesis, suggesting that, as observed in other regions and landslides (e.g. monsoon-triggered landslides in Nepal: Jones et al., 2021b), there is some degree of time dependency in the susceptibility of typhoon-triggered landslides. It is challenging to quantify exactly what causes this temporal change. As outlined in the previous sections, it could be due to differences in rainfall distributions between the two events. A further complication in the case of comparing the differences between 2009 and 2018 through time is that the 2009 event was impacted by the Fujiwhara effect, whereby two nearby typhoons interacted to worsen their effects. The lack of high-resolution rainfall data for these events makes it challenging to determine what effect this might have had, but it is nevertheless important to point out that it may have had an impact. The apparent time dependency between the 2009 and 2018 events could also stem from temporal changes in the other factors used within the modelling. For example, Itogon is estimated by the Global Forest Watch to have had significant tree cover loss since 2010 (Hansen et al., 2013). The results of our modelling do not directly support this accounting for the differences between the two models (with tree cover being a largely unselected factor across all models), but it highlights how changes in input factors through time could account for observed temporal dependencies. For example, path dependency (the transient impacts on the landscape of past landslide locations) could also be having an effect. This could be particularly pertinent in this case as the impacts of smaller passing tropical cyclones and typhoons between 2009 and 2018 will have triggered other landslides not included in this assessment. As we do not yet have inventories for events between 2009 and 2018, we cannot at this stage present a full assessment of path dependency in this region. As such, future work should focus on mapping landslides in between 2009 and 2018 to allow a more robust assessment of the specific causes of temporal dependency such as land-use change and path dependency.
But what are the implications of this for landslide hazard management? It is well described that landslide susceptibility models are regularly used for purposes that involve the forecasting of future landslide events (Reichenbach et al., 2018; Palau et al., 2020). Consequently, in the Philippines, issues of time dependency mean that a hazard manager cannot be confident that a landslide susceptibility model developed from a single past typhoon event will actually be accurate and reliable when forecasting landslides associated with a future typhoon. This is clearly a problem, as it fundamentally affects the use of susceptibility models for their primary (or at least common) application. So what are the solutions to this problem?
One solution could be to ensure that typhoon-triggered landslide susceptibility models are always developed using landslide data from multiple typhoon events. As shown in Fig. 6, the susceptibility model developed using the training landslide data from the 2018 and 2009 events combined had higher overall accuracies when classifying the independent data from each event separately. Indeed, the 2018 + 2009 model was only 1 % less accurate at classifying the 2009 data than the 2009 model was and only 4 % less accurate at classifying the 2018 data than the 2018 model was. Statistically, this result is logical, as, in effect, the combined 2018 + 2009 model coefficients will be an average of the optimum coefficients that would be obtained when modelling each event in isolation, and therefore the multi-event model has a more generalised ability to classify both events. In contrast, the single-event-model coefficients are very specific to one event and therefore are notably less accurate when used to classify a different event. This suggests that whilst a single-event model will likely be more accurate at classifying the specific event used to train that model, a multi-event model will be more generalisable and thus appropriate for forecasting an unknown future typhoon event. Furthermore, it would be logical to assume that the more events there are combined in the training of a susceptibility model, the more generalisable that model will be. This idea is corroborated by several other studies. For example, Ozturk et al. (2021b) find that susceptibility model accuracy increases with increasing landslide inputs until a saturation point occurs when a large enough portion of a study region has observed a landslide and been included in the model training. Similarly, Jones et al. (2021a) found that monsoon-triggered susceptibility model accuracy increased significantly as you moved from using a single monsoon season of data to using approximately 10 monsoon seasons of data, with a levelling off of the accuracy as you added more seasons of landslide data beyond this. In this case, it is therefore reasonable to assume that given more typhoon-triggered landslide data, the generalisability and overall forecasting reliability of the multi-event model could be improved. This of course requires robust testing in future work when more typhoon-triggered landslide data become available.
6.3 Landslide spatial dependency
Though not the main focus of this paper, our results still have some important “high-level” insights into landslide spatial dependency. The results from Sect. 5 suggest that there are some significant differences in landslide susceptibility through space, particularly relating to topographical factors such as slope aspect and rock and soil types (Table 1). Unfortunately, given the aforementioned overall poor accuracy and reliability of the Abuan map, it is challenging to make any concrete conclusions from the inter-model AUROC analysis presented in Sect. 5. This analysis suggests similar reductions in model accuracy when comparing the Itogon to Abuan models through space (Fig. 7), as were observed when comparing the Itogon models through time. However, as the Abuan model already had a low baseline accuracy even when attempting to model independent data from the same typhoon, the impact of applying susceptibility models through space cannot definitely be assessed. However, anecdotally, from our experience of working in countries such as the Philippines, it is commonplace for regional maps from one area to be applied to other regions. As such, it is recommended that future studies take a more detailed consideration of potential spatial dependencies in the Philippines using additional landslide inventories.
In conclusion, using BLR techniques we have developed new and updated susceptibility maps for the Itogon and Abuan regions of the Philippines, with the 2009, 2018, and combined 2018 + 2009 models being considerably more accurate (78 %–82 %) than the 2019 model (65 %). We find that the three typhoon events caused quite different landslide responses. Most notably, landslides in Itogon were heavily distributed across east-, southeast-, and south-facing slopes and at slope angles > 30∘, whereas landslides in Abuan occurred across all aspects and slope angles. The uniform distribution of 2019 landslides across all parts of the landscape combined with homogenous input datasets for geology, soil, and land cover is likely to be the cause of the lower accuracy of the 2019 model. Given the low accuracy and reliability of the Abuan model, from a hazard management perspective, it may be better to conclude that an acceptable model was not developed in this case. Finally, the AUROC validation shows that using a susceptibility model for one typhoon event to forecast/hindcast another through time leads to a 6 %–10 % reduction in model accuracy compared to the accuracy obtained when modelling and validating each event separately. This suggests that typhoon-triggered landslides in the Philippines display some degree of time dependency. However, using a susceptibility model for two combined typhoon events (2018 + 2009) to forecast/hindcast each typhoon event separately led to just a 1 %–3 % reduction in model accuracy. This suggests that combined multi-event typhoon-triggered landslide susceptibility models will be more accurate and reliable for the forecasting of future typhoon-triggered landslides.
The landslide inventories developed as part of this paper are available at the NERC Environmental Information Data Centre (EIDC) depository: https://eidc.ac.uk/ (last access: 12 March 2023; Environmental Information Data Centre). No custom developed code is used in this research; all code used was derived directly from the existing glmnet package: https://cran.r-project.org/web/packages/glmnet/ (Friedman et al., 2022). The soil and geological data used within this paper were obtained from https://www.geoportal.gov.ph/ (geoportal PH, 2023).
GLB and FJT conceived the project. MAMM and CA led the development of the landslide inventories. JNJ led the data analysis, modelling, and predisposing factor data collection, with input from GLB, CA, and MAMM. JNJ wrote up the manuscript, which was edited and reviewed by GLB, FJT, CA, and MAMM.
The contact author has declared that none of the authors has any competing interests.
Publisher's note: Copernicus Publications remains neutral with regard to jurisdictional claims in published maps and institutional affiliations.
We would like to thank Rose Ann F. Amado and Paolo A. Antazo for their assistance with mapping the 2019 Kammuri inventory. We are also grateful to the Mines and Geosciences Bureau (MGB) for providing the hazard map shown in Fig. 1 and the geological data for both Itogon and Abuan. The researchers based in the UK (Joshua N. Jones, Georgina L. Bennett, and Clàudia Abancó) have been funded by the NERC Newton Agham fund (contract NE/S003371/1, project SCaRP), and the researchers based in the Philippines (Mark A. M. Matera and Fibor J. Tan) have been funded by the Department of Science and Technology – Philippine Council for Industry, Energy, and Emerging Technology Research and Development (DOST-PCIEERD, project no. 07166).
This research has been supported by the Newton Fund (grant no. NE/S003371/1) and the Philippine Council for Industry, Energy, and Emerging Technology Research and Development (grant no. 07166; SCaRP project).
This paper was edited by Andreas Günther and reviewed by Joaquin Vicente Ferrer and one anonymous referee.
Abancó, C., Bennett, G. L., Matthews, A. J., Matera, M. A. M., and Tan, F. J.: The role of geomorphology, rainfall and soil moisture in the occurrence of landslides triggered by 2018 Typhoon Mangkhut in the Philippines, Nat. Hazards Earth Syst. Sci., 21, 1531–1550, https://doi.org/10.5194/nhess-21-1531-2021, 2021.
Balderama, O. F., Alejo, L. A., and Tongson, E.: Calibration, validation and application of CERES-Maize model for climate change impact assessment in Abuan Watershed, Isabela, Philippines, Climate, Disaster and Development Journal, 2.1, 11–20, https://doi.org/10.18783/cddj.v001.i02.a02, 2016.
Carating, R.: PHILIPPINES: Final Report on the Harmonized World Soil Database Project, DigitalSoilMap.Net Project, funded by the Institute of Soil Science Chinese Academy of Science, Nanjing, China, https://www.academia.edu/20867911/PHILIPPINES_Final_Report_on_the_Harmonized_World_Soil_Database_Project_DigitalSoilMap_Net_Project?auto=download (last access: 14 March 2023), 2013.
Crozier, M. J.: A proposed cell model for multiple-occurrence regional landslide events: Implications for landslide susceptibility mapping, Geomorphology, 295, 480–488, https://doi.org/10.1016/J.GEOMORPH.2017.07.032, 2017.
DENR-MGB: Geological Map of Municipality of Ilagan, Isabela, 1 : 90 000 Scale, Department of Environment and Natural Resources-Mines and Geosciences Bureau, Quezon City, Philippines, 1976.
DENR-MGB: Geological Map of Tumauini Quadrangle (1 : 10 000), Sheet 3371 I, Department of Environment and Natural Resources-Mines and Geosciences Bureau, Quezon City, Philippines, 1991a.
DENR-MGB: Geological Map of Ilagan Quadrangle (1 : 10 000), Sheet 3371 II, Department of Environment and Natural Resources-Mines and Geosciences Bureau, Quezon City, Philippines, 1991b.
DENR-MGB: Geological Map of Baguio City Quadrangle (1 V 50000), Sheet 3169 III, Department of Environment and Natural Resources-Mines and Geosciences Bureau, Quezon City, Philippines, 1995.
DENR-MGB: Geological Map of Sison Quadrangle, Sheet 3168 IV, Department of Environment and Natural Resources-Mines and Geosciences Bureau, Quezon City, Philippines, 2000.
Emberson, R., Kirschbaum, D. B., Amatya, P., Tanyas, H., and Marc, O.: Insights from the topographic characteristics of a large global catalog of rainfall-induced landslide event inventories, Nat. Hazards Earth Syst. Sci., 22, 1129–1149, https://doi.org/10.5194/nhess-22-1129-2022, 2022.
Friedman, J., Hastie, T., and Tibshirani, R.: Regularization paths for generalized linear models via coordinate descent, J. Stat. Softw., 33, 1–22, https://doi.org/10.18637/jss.v033.i01, 2010.
Friedman, J., Hastie, T., Tibshirani, R., Narasimhan, B., Tay, K., Simon, N., Qian, J., and Yang, J.: glmnet: Lasso and Elastic-Net Regularized Generalized Linear Models, CRAN [code], https://cran.r-project.org/web/packages/glmnet/ (last access: 12 March 2023), 2022.
Froude, M. J. and Petley, D. N.: Global fatal landslide occurrence from 2004 to 2016, Nat. Hazards Earth Syst. Sci., 18, 2161–2181, https://doi.org/10.5194/nhess-18-2161-2018, 2018.
geoportal PH: geoportal PH Soil Type Layer, Geoportal Philippines [data set], https://www.geoportal.gov.ph/, last access: 12 March 2023.
Gorokhovich, Y. and Vustianiuk, A.: Implications of slope aspect for landslide risk assessment: A case study of Hurricane Maria in Puerto Rico in 2017, Geomorphology, 391, 107874, https://doi.org/10.1016/J.GEOMORPH.2021.107874, 2021.
Gorsevski, P. V., Gessler, P. E., Boll, J., Elliot, W. J., and Foltz, R. B.: Spatially and temporally distributed modeling of landslide susceptibility, Geomorphology, 80, 178–198, https://doi.org/10.1016/j.geomorph.2006.02.011, 2006.
Hansen, M. C., Potapov, P. V., Moore, R., Hancher, M., Turubanova, S. A., Tyukavina, A., Thau, D., Stehman, S. V., Goetz, S. J., Loveland, T. R., Kommareddy, A., Egorov, A., Chini, L., Justice, C. O., and Townshend, J. R. G.: High-resolution global maps of 21st-century forest cover change, Science, 342, 850–853, 2013.
Hastie, T., Qian, J., and Tay, K.: An Introduction to glmnet, https://glmnet.stanford.edu/articles/glmnet.html (last access: 12 March 2023), 2021.
IFRC: DREF Final Report, Philippines: Typhoon Kammuri, International Federation of Red Cross and Red Crescent Societies, https://reliefweb.int/report/philippines/philippines-typhoon-kammuri-dref-final-report-mdrph037 (last access: 14 March 2023), 2020.
Javier, D. N. and Kumar, L.: FREQUENCY RATIO LANDSLIDE SUSCEPTIBILITY ESTIMATION IN A TROPICAL MOUNTAIN REGION, Int. Arch. Photogramm. Remote Sens. Spatial Inf. Sci., XLII-3/W8, 173–179, https://doi.org/10.5194/isprs-archives-XLII-3-W8-173-2019, 2019.
Jiang, S., Liu, S., Ren, L., Yong, B., Zhang, L., Wang, M, Lu, Y., and He, Y.: Hydrologic Evaluation of Six High Resolution Satellite Precipitation Products in Capturing Extreme Precipitation and Streamflow over a Medium-Sized Basin in China, Water, 10, 25, https://doi.org/10.3390/W10010025, 2017.
Jones, J. N., Boulton, S. J., Bennett, G. L., Stokes, M., and Whitworth, M. R. Z.: Temporal Variations in Landslide Distributions Following Extreme Events: Implications for Landslide Susceptibility Modeling, J. Geophys. Res.-Earth, 126, e2021JF006067, https://doi.org/10.1029/2021JF006067, 2021a.
Jones, J. N., Boulton, S. J., Bennett, G. L., Stokes, M., and Whitworth, M. R. Z.: 30-year record of Himalaya mass-wasting reveals landscape perturbations by extreme events, Nat. Commun., 12, 6701, https://doi.org/10.1038/s41467-021-26964-8, 2021b.
Kim, K. G., Emmanuel Q. Angeles, J., Lim, P. K. I., Buluran, J. S., and Tan, F. J.: Slope Stability Analysis as Applied to Rainfall-triggered Landslide in Itogon, Benguet Province, Philippines, 2021 IEEE Conference on Technologies for Sustainability, SusTech 2021, 22–24 April 2021, Irvine, CA, USA, IEEE, Institute of Electrical and Electronics Engineers, https://doi.org/10.1109/SUSTECH51236.2021.9467461, 2021.
Kirschbaum, D., Stanley, T., and Zhou, Y.: Spatial and temporal analysis of a global landslide catalog, Geomorphology, 249, 4–15, https://doi.org/10.1016/J.GEOMORPH.2015.03.016, 2015.
Lagmay, A. M. F. and Eco, R. N.: Shallow Landslide Hazard Mapping for Davao Oriental, Philippines Using a Deterministic GIS Model, in: Communicating Climate Change and Natural Hazard Risk and Cultivating Resilience: Case Studies for a Multidisciplinary Approach, edited by: Kontar, Y. Y., Springer, Cham, ISBN 978-3-319-20160-3, https://doi.org/10.1007/978-3-319-20161-0_9, 2016.
LeComte, D.: International Weather Events 2019: Historic Heat, Hurricanes, and Fires, Weatherwise, 73, 24–31, https://doi.org/10.1080/00431672.2020.1736467, 2020.
Lin, L., Lin, Q., and Wang, Y.: Landslide susceptibility mapping on a global scale using the method of logistic regression, Nat. Hazards Earth Syst. Sci., 17, 1411–1424, https://doi.org/10.5194/nhess-17-1411-2017, 2017.
Liou, Y. A. and Pandey, R. S.: Interactions between typhoons Parma and Melor (2009) in North West Pacific Ocean, Weather and Climate Extremes, 29, 100272, https://doi.org/10.1016/J.WACE.2020.100272, 2020.
Lombardo, L. and Mai, P. M.: Presenting logistic regression-based landslide susceptibility results, Eng. Geol., 244, 14–24, https://doi.org/10.1016/j.enggeo.2018.07.019, 2018.
Lombardo, L., Opitz, T., Ardizzone, F., Guzzetti, F., and Huser, R.: Space-time landslide predictive modelling, Earth-Sci. Rev., 209, 103318, https://doi.org/10.1016/j.earscirev.2020.103318, 2020.
Luzon, P. K., Montalbo, K., Galang, J., Sabado, J. M., Escape, C. M., Felix, R., and Lagmay, A. M. F.: Hazard mapping related to structurally controlled landslides in Southern Leyte, Philippines, Nat. Hazards Earth Syst. Sci., 16, 875–883, https://doi.org/10.5194/nhess-16-875-2016, 2016.
Marc, O. and Hovius, N.: Amalgamation in landslide maps: effects and automatic detection, Nat. Hazards Earth Syst. Sci., 15, 723–733, https://doi.org/10.5194/nhess-15-723-2015, 2015.
Marjanović, M.: Comparing the performance of different landslide susceptibility models in ROC space, in: Landslide Science and Practice: Landslide Inventory and Susceptibility and Hazard Zoning, edited by: Margottini, C., Canuti, P., and Sassa, K., Springer Science and Business Media Deutschland GmbH, 579–584, https://doi.org/10.1007/978-3-642-31325-7_76, 2013.
Meusburger, K. and Alewell, C.: On the influence of temporal change on the validity of landslide susceptibility maps, Nat. Hazards Earth Syst. Sci., 9, 1495–1507, https://doi.org/10.5194/nhess-9-1495-2009, 2009.
NDCC: Final Report on Tropical Storm Ondoy (Ketsana) and Typhoon Pepeng (Parma), National Disaster Coordinating Council, The Government of the Philippines, https://reliefweb.int/report/philippines/philippines-ndcc-update-final-report-tropical-storm-ondoy-and-typhoon-pepeng (last access: 14 March 2023), 2009.
NDRRMC: Situational Report No. 19 Regarding Response Actions and Effects of Typhoon “Tisoy” (i.n. Kammuri), National Disaster Coordinating Council, The Government of the Philippines, https://reliefweb.int/report/philippines/ndrrmc-update-situational-report-no-19-regarding-response-actions-and-effects (last access: 14 March 2023), 2019.
Niu, Y., Fang, J., Chen, R., Xia, Z., and Xu, H.: Network Modeling and Dynamic Mechanisms of Multi-Hazards – A Case Study of Typhoon Mangkhut, Water, 12, 2198, https://doi.org/10.3390/W12082198, 2020.
Nolasco-Javier, D. and Kumar, L.: Landslide Susceptibility Assessment Using Binary Logistic Regression in Northern Philippines, in: Understanding and Reducing Landslide Disaster Risk, edited by: Guzzetti, F., Mihalić Arbanas, S., Reichenbach, P., Sassa, K., Bobrowsky, P. T., and Takara, K., WLF 2020, ICL Contribution to Landslide Disaster Risk Reduction, Springer, Cham, ISBN 978-3-030-60226-0, https://doi.org/10.1007/978-3-030-60227-7_20, 2021.
Nolasco-Javier, D., Kumar, L., and Tengonciang, A. M. P.: Rapid appraisal of rainfall threshold and selected landslides in Baguio, Philippines, Nat. Hazards, 78, 1587–1607, https://doi.org/10.1007/s11069-015-1790-y, 2015.
Oh, H. J. and Lee, S.: Landslide susceptibility mapping on Panaon Island, Philippines using a geographic information system, Environ. Earth Sci., 62, 935–951, https://doi.org/10.1007/s12665-010-0579-2, 2011.
Ozturk, U., Saito, H., Matsushi, Y., Crisologo, I., and Schwanghart, W.: Can global rainfall estimates (satellite and reanalysis) aid landslide hindcasting?, Landslides, 18, 3119–3133, https://doi.org/10.1007/s10346-021-01689-3, 2021a.
Ozturk, U., Pittore, M., Behling, R., Roessner, S., Andreani, L., and Korup, O.: How robust are landslide susceptibility estimates?, Landslides, 18, 681–695, https://doi.org/10.1007/s10346-020-01485-5, 2021b.
PAGASA: DOST-PAGASA Annual Report on Philippine Tropical Cyclones, Philippine Atmospheric, Geophysical and Astronomical Services Administration, https://pubfiles.pagasa.dost.gov.ph/pagasaweb/files/tamss/weather/tcsummary/ARTC2018.pdf (last access: 12 March 2023), 2018.
PAGASA: Annual Report on Philippine Tropical Cyclones, Philippine Atmospheric, Geophysical and Astronomical Services Administration, https://pubfiles.pagasa.dost.gov.ph/pagasaweb/files/tamss/weather/tcsummary/ARTC2019_web.pdf (last access: 12 March 2023), 2019.
PAGASA: Climate Change in the Philippines, Philippine Atmospheric, Geophysical and Astronomical Services Administration, https://www.pagasa.dost.gov.ph/information/climate-change-in-the-philippines (last access: 12 March 2023), 2022.
Palau, R. M., Hürlimann, M., Berenguer, M., and Sempere-Torres, D.: Influence of the mapping unit for regional landslide early warning systems: comparison between pixels and polygons in Catalonia (NE Spain), Landslides, 17, 2067–2083, https://doi.org/10.1007/s10346-020-01425-3, 2020.
Pourghasemi, H. R., Teimoori Yansari, Z., Panagos, P., and Pradhan, B.: Analysis and evaluation of landslide susceptibility: a review on articles published during 2005–2016 (periods of 2005–2012 and 2013–2016), Arab. J. Geosci., 11, 1–12, https://doi.org/10.1007/s12517-018-3531-5, 2018.
Rabonza, M. L., Felix, R. P., Lagmay, A. M. F., Eco, R. N., Ortiz, I. J., ang Aquino, D. K.: Shallow landslide susceptibility mapping using high-resolution topography for areas devastated by super typhoon Haiyan, Landslides, 13, 201–210, 2015.
Reichenbach, P., Rossi, M., Malamud, B. D., Mihir, M., and Guzzetti, F.: A review of statistically-based landslide susceptibility models, Earth-Sci. Rev., 180, 60–91, https://doi.org/10.1016/j.earscirev.2018.03.001, 2018.
Samia, J., Temme, A., Bregt, A., Wallinga, J., Guzzetti, F., and Ardizzone, F.: Dynamic path-dependent landslide susceptibility modelling, Nat. Hazards Earth Syst. Sci., 20, 271–285, https://doi.org/10.5194/nhess-20-271-2020, 2020.
Sassa, K.: Foreword by Flavia Schlegel for the Journal of the International Consortium on Landslides, Landslides, 16, 1–1, https://doi.org/10.1007/S10346-018-1120-Z, 2018.
Schwanghart, W. and Scherler, D.: Short Communication: TopoToolbox 2 – MATLAB-based software for topographic analysis and modeling in Earth surface sciences, Earth Surf. Dynam., 2, 1–7, https://doi.org/10.5194/esurf-2-1-2014, 2014.
Sevieri, G. and Galasso, C.: Typhoon fragility analysis and climate change impact assessment of Filipino cultural heritage asset roofs, in: XI International Conference on Structural Dynamics, 23–26 November 2020, Athens, Greece, edited by: Papadrakakis, M., Fragiadakis, M., and Papadimitriou, C., 4763–4776, 2020.
Shimokawa, S., Iizuka, S., Kayahara, T., Suzuki, S., and Murakami, T.: Fujiwhara effect; the interaction between T0917 and T0918, Natural Disaster Research Report of the National Research Institute for Earth Science and Disaster Prevention, No. 45, 23–26, 2011.
Steger, S., Brenning, A., Bell, R., and Glade, T.: The propagation of inventory-based positional errors into statistical landslide susceptibility models, Nat. Hazards Earth Syst. Sci., 16, 2729–2745, https://doi.org/10.5194/nhess-16-2729-2016, 2016.
Steger, S., Brenning, A., Bell, R., and Glade, T.: The influence of systematically incomplete shallow landslide inventories on statistical susceptibility models and suggestions for improvements, Landslides, 14, 1767–1781, https://doi.org/10.1007/s10346-017-0820-0, 2017.
Steger, S., Mair, V., Kofler, C., Pittore, M., Zebisch, M., and Schneiderbauer, S.: Correlation does not imply geomorphic causation in data-driven landslide susceptibility modelling – Benefits of exploring landslide data collection effects, Sci. Total Environ., 776, 145935, https://doi.org/10.1016/j.scitotenv.2021.145935, 2021.
Temme, A., Guzzetti, F., Samia, J., and Mirus, B. B.: The future of landslides' past – A framework for assessing consecutive landsliding systems, Landslides, 17, 1519–1528. https://doi.org/10.1007/s10346-020-01405-7, 2020.
Vakhshoori, V. and Zare, M.: Is the ROC curve a reliable tool to compare the validity of landslide susceptibility maps?, Geomatics, Natural Hazards and Risk, 9, 249–266, https://doi.org/10.1080/19475705.2018.1424043, 2018.
Yumul, G. P., Dimalanta, C. B., Servando, N. T., and Cruz, N. A.: Abnormal weather events in 2009, increased precipitation and disastrous impacts in the Philippines, Climatic Change, 118, 715–727, https://doi.org/10.1007/s10584-012-0661-8, 2013.
Zhu, Q., Xuan, W., Liu, L., and Xu, Y. P.: Evaluation and hydrological application of precipitation estimates derived from PERSIANN-CDR, TRMM 3B42V7, and NCEP-CFSR over humid regions in China, Hydrol. Process., 30, 3061–3083, https://doi.org/10.1002/hyp.10846, 2016.
Zuur, A. F., Ieno, E. N., and Elphick, C. S.: A protocol for data exploration to avoid common statistical problems, Methods Ecol. Evol., 1, 3–14, https://doi.org/10.1111/j.2041-210x.2009.00001.x, 2010.