the Creative Commons Attribution 4.0 License.
the Creative Commons Attribution 4.0 License.
 | 13 Mar 2023
Antecedent rainfall as a critical factor for the triggering of debris flows in arid regions
Shalev Siman-Tov
Francesco Marra
In arid regions, debris flows (DFs) are occasionally observed when heavy rainfall hits steep slopes with unconsolidated materials. Despite the related hazards, not much is yet known about the critical rainfall conditions for DF initiation in dryland areas mainly due to a lack of observations and data. In this study, we use high-resolution digital surface models and orthophotos to detect DFs on the arid slopes of the Dead Sea's northwestern margins, as well as weather radar rainfall estimates for the characterization of the triggering and non-triggering storms. We identify deposits from over 40 relatively small DFs that occurred between 2013 and 2019. We divide them into four groups based on their spatial distribution and triggering period, and we identify the most likely triggering storms based on weather radar data and additional information. We show that the DFs were likely triggered by an intense convective cell (lasting less than 45 min) which was preceded by non-negligible rainfall amounts (about 10 mm) delivered during the storm. Comparing triggering and non-triggering storms, we observed that rain intensity alone is insufficient to explain the phenomena and discuss the possibility that antecedent rainfall could represent a critical factor for the triggering of DFs on steep slopes of arid environments.
- Article
(12722 KB) - Full-text XML
- BibTeX
- EndNote


Debris flows (DFs) are gravity-driven, downslope flows of water and sediment mixtures (Takahashi, 2014; Iverson, 1997). They constitute one of the most impactful natural hazards in mountainous regions, with casualties and damage to infrastructure. Debris flows commonly follow pre-existing channels and often end at lower gradients, where lobes of sediments are deposited at the mountain front. Cohesionless sediments that cover steep mountain slopes (e.g., colluvium or pyroclastic deposits) usually provide the debris material. The typical morphological characteristics of DFs include levees along the channel sides, terminal lobes, coarse and poorly sorted grains, and U-shaped flow channels with a low depth / width ratio (Costa, 1988; Pierson, 2005; Wells and Harvey, 1987). Debris flows are typically triggered by heavy precipitation or, more rarely, by sudden snowmelt or ice melt in mountainous and volcanic areas. Short-duration convective storms constitute a key factor in DF triggering because high rain intensities may easily exceed the soil infiltration capacity causing surface runoff, leading to the triggering (Church and Miles, 1987; Iverson, 2000; Mostbauer et al., 2018; Dunkerley, 2021; Caine, 1980).
Debris flows can occur in arid and semiarid regions (Webb et al., 1989; Blackwelder, 1928; Stolle et al., 2015; Coe et al., 1997; Moreiras and Sepúlveda, 2022; Sepúlveda et al., 2006, 2014) as a result of the heavy rainfall extremes characterizing these areas (Marra and Morin, 2015) and of the quick runoff response typical of arid and unvegetated soils (Zoccatelli et al., 2019). In arid northern Chile, Sepulveda et al. (2006) identified possible relationships between large-scale climatic drivers, such as El Niño episodes, and debris flow triggering. Similarly, Sepulveda et al. (2014) closely examined a debris flow triggering by an extreme rainstorm in the same region. In addition, DFs were extensively studied in the semiarid to arid regions of the Grand Canyon slopes in northern Arizona, where they mostly occur when runoff triggers failures in colluvium during intense rainfall (Griffiths, 2004; Melis et al., 1995; Webb et al., 1989). Based on the available data, sustained intensity exceeding 20 mm h−1 and a total rainfall of 25 to 50 mm can be considered the minimal threshold for DF triggering in this area (Melis et al., 1995; Webb et al., 1989; Melis and Webb, 1993).
This study is conducted along the steep arid slopes of the eastern Judean Desert on the western margins of the Dead Sea. DF activity in this region can be particularly dangerous to human settlements, main roads and nature reserve infrastructure. In addition to their destructive potential, DFs have here a major influence on slope morphology and alluvial fan buildup (Ben David-Novak et al., 2004; Ben David-Novak, 1998; Ahlborn et al., 2018; Enzel, 2001). Ahlborn et al. (2018), in particular, examined graded layers deposited during the Holocene associated with DFs and observed periods with drier conditions and increased DF activity and periods with wetter conditions and lower DF activity. They associated this counterintuitive observation to changes in the synoptic conditions of the eastern Mediterranean, raising the question of whether the future occurrence of DFs, and therefore of the related hazards, could be affected by the ongoing climate change. While most of the critical environmental conditions for DF triggering are met, e.g., unconsolidated sediments on steep slopes, it seems that the most limiting factor in this area is precipitation (Ben David-Novak et al., 2004). The only studies about modern DFs in the area focused on a few rainstorms that occurred between the years 1987–1997 (Ben David-Novak, 1998; Ben David-Novak et al., 2004). They suggest that minimum conditions for DF triggering consist of rainfall intensity exceeding 30 mm h−1 for a duration of at least 1 h, although the typical lifetime of convective cells in the area is shorter (around 20–40 min according to Belachsen et al., 2017). Moreover, the characteristics of the rainfall that occurred before the triggering cells were not considered in previous studies (e.g., Ben David-Novak et al., 2004).
The possible importance of antecedent rainfall on landslide triggering was extensively studied for non-arid environments (e.g., Glade et al., 2000; Aleotti 2004; Guzzetti et al., 2008; Frattini et al., 2009; Kim et al., 2021). It was suggested that in areas where slopes are covered by permeable soils or sediments, antecedent rainfall is less important in reducing the potential of failure (Rahardjo et al., 2001; Brand, 1992; Corominas and Moya, 1999). To the best of our knowledge, however, the effect of antecedent rainfall on DF triggering in arid regions has not yet been explored, probably due to the lack of DF observations and of adequate rainfall data. An improved knowledge of the rainfall characteristics leading to DFs in arid regions is critical for the understanding of the triggering mechanisms and for improving our ability to provide effective early warnings. In this paper we aim at improving our understanding of the critical conditions for DF triggering in arid areas by combining high-resolution topography models, field surveys and an advanced archive of high-resolution gauge-adjusted radar rainfall estimates which comprise both triggering and non-triggering events.
The paper is organized as follows. After introducing the reader to the study area (Sect. 2), we present our mapping of DFs in the study area (Sect. 3) and the identification of the most likely triggering rainfall (Sect. 4). We close by discussing the role of antecedent rainfall for DF triggering and the potential implications for DF frequency in the region (Sect. 5). We close with a collection of the main conclusions (Sect. 6).
The study area is located on the east side of the northern Judean Desert, on the northwestern escarpment of the Dead Sea basin (Fig. 1). We focus on the portion of the escarpment limited to the north by the Wadi Og and to the south by the Wadi Hever (Fig. 1). The slopes are mostly composed of carbonate rock layers including hard limestone and dolomites, interbedded with weak marl layers. These exposed carbonate rocks of the Judean group units were deposited on the regional carbonate platform during the Cretaceous (Sneh et al., 2000; Raz, 1983; Mor, 1987; Roth, 1969). The slope angle is usually gentle (5–30∘) at the bottom and becoming steep (above 30∘) or vertical at its upper parts (Fig. 2). This escarpment is a result of normal faulting followed by ongoing erosional processes along the margins of the Dead Sea basin since the late Miocene to early Pliocene (Garfunkel and Ben-Avraham, 1996; Garfunkel et al., 1981; Haviv et al., 2006).
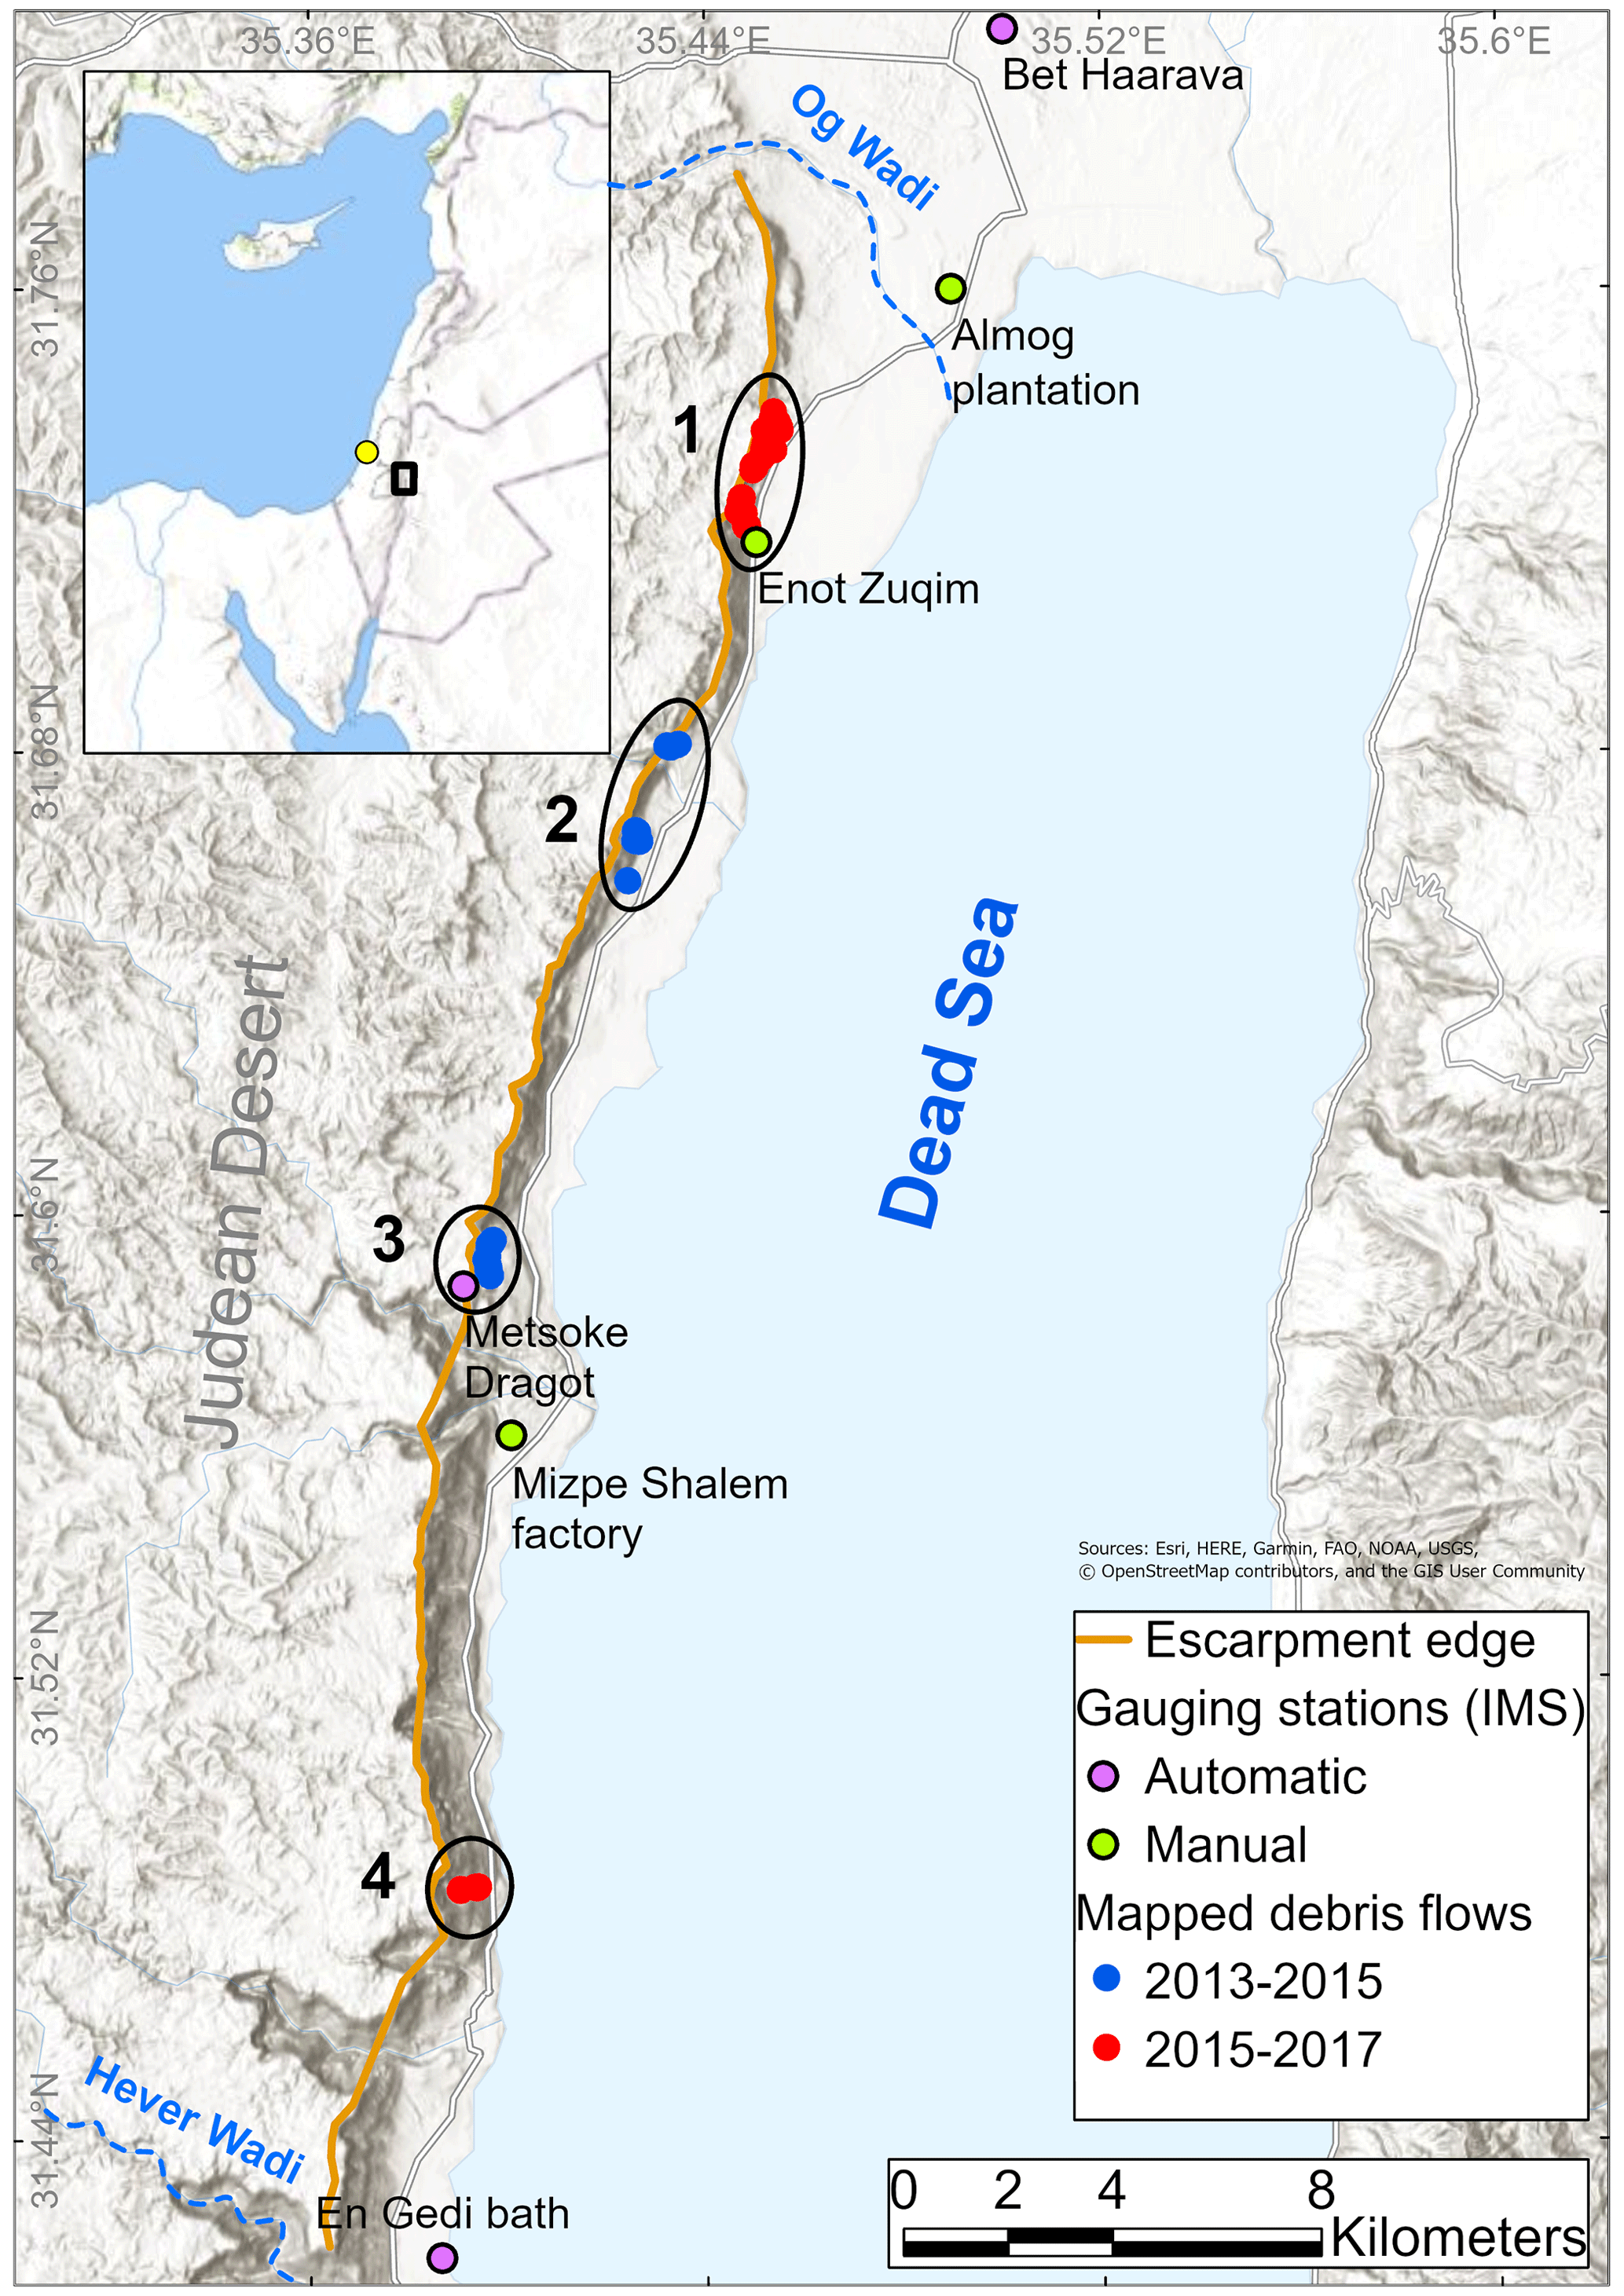
Figure 1Map of the study area. An inset shows the location of the study area (black rectangle) and of the weather radar (yellow point) on a map of the eastern Mediterranean. The 43 DF deposits were mapped using elevation difference maps from the years 2013–2015 (in blue) and 2015–2017 (in red). The deposits were classified into four groups (black ellipse). Rain gauge stations of the Israel Meteorological Service are marked by purple and green points for automatic (10 min) and manual (daily) stations, respectively.
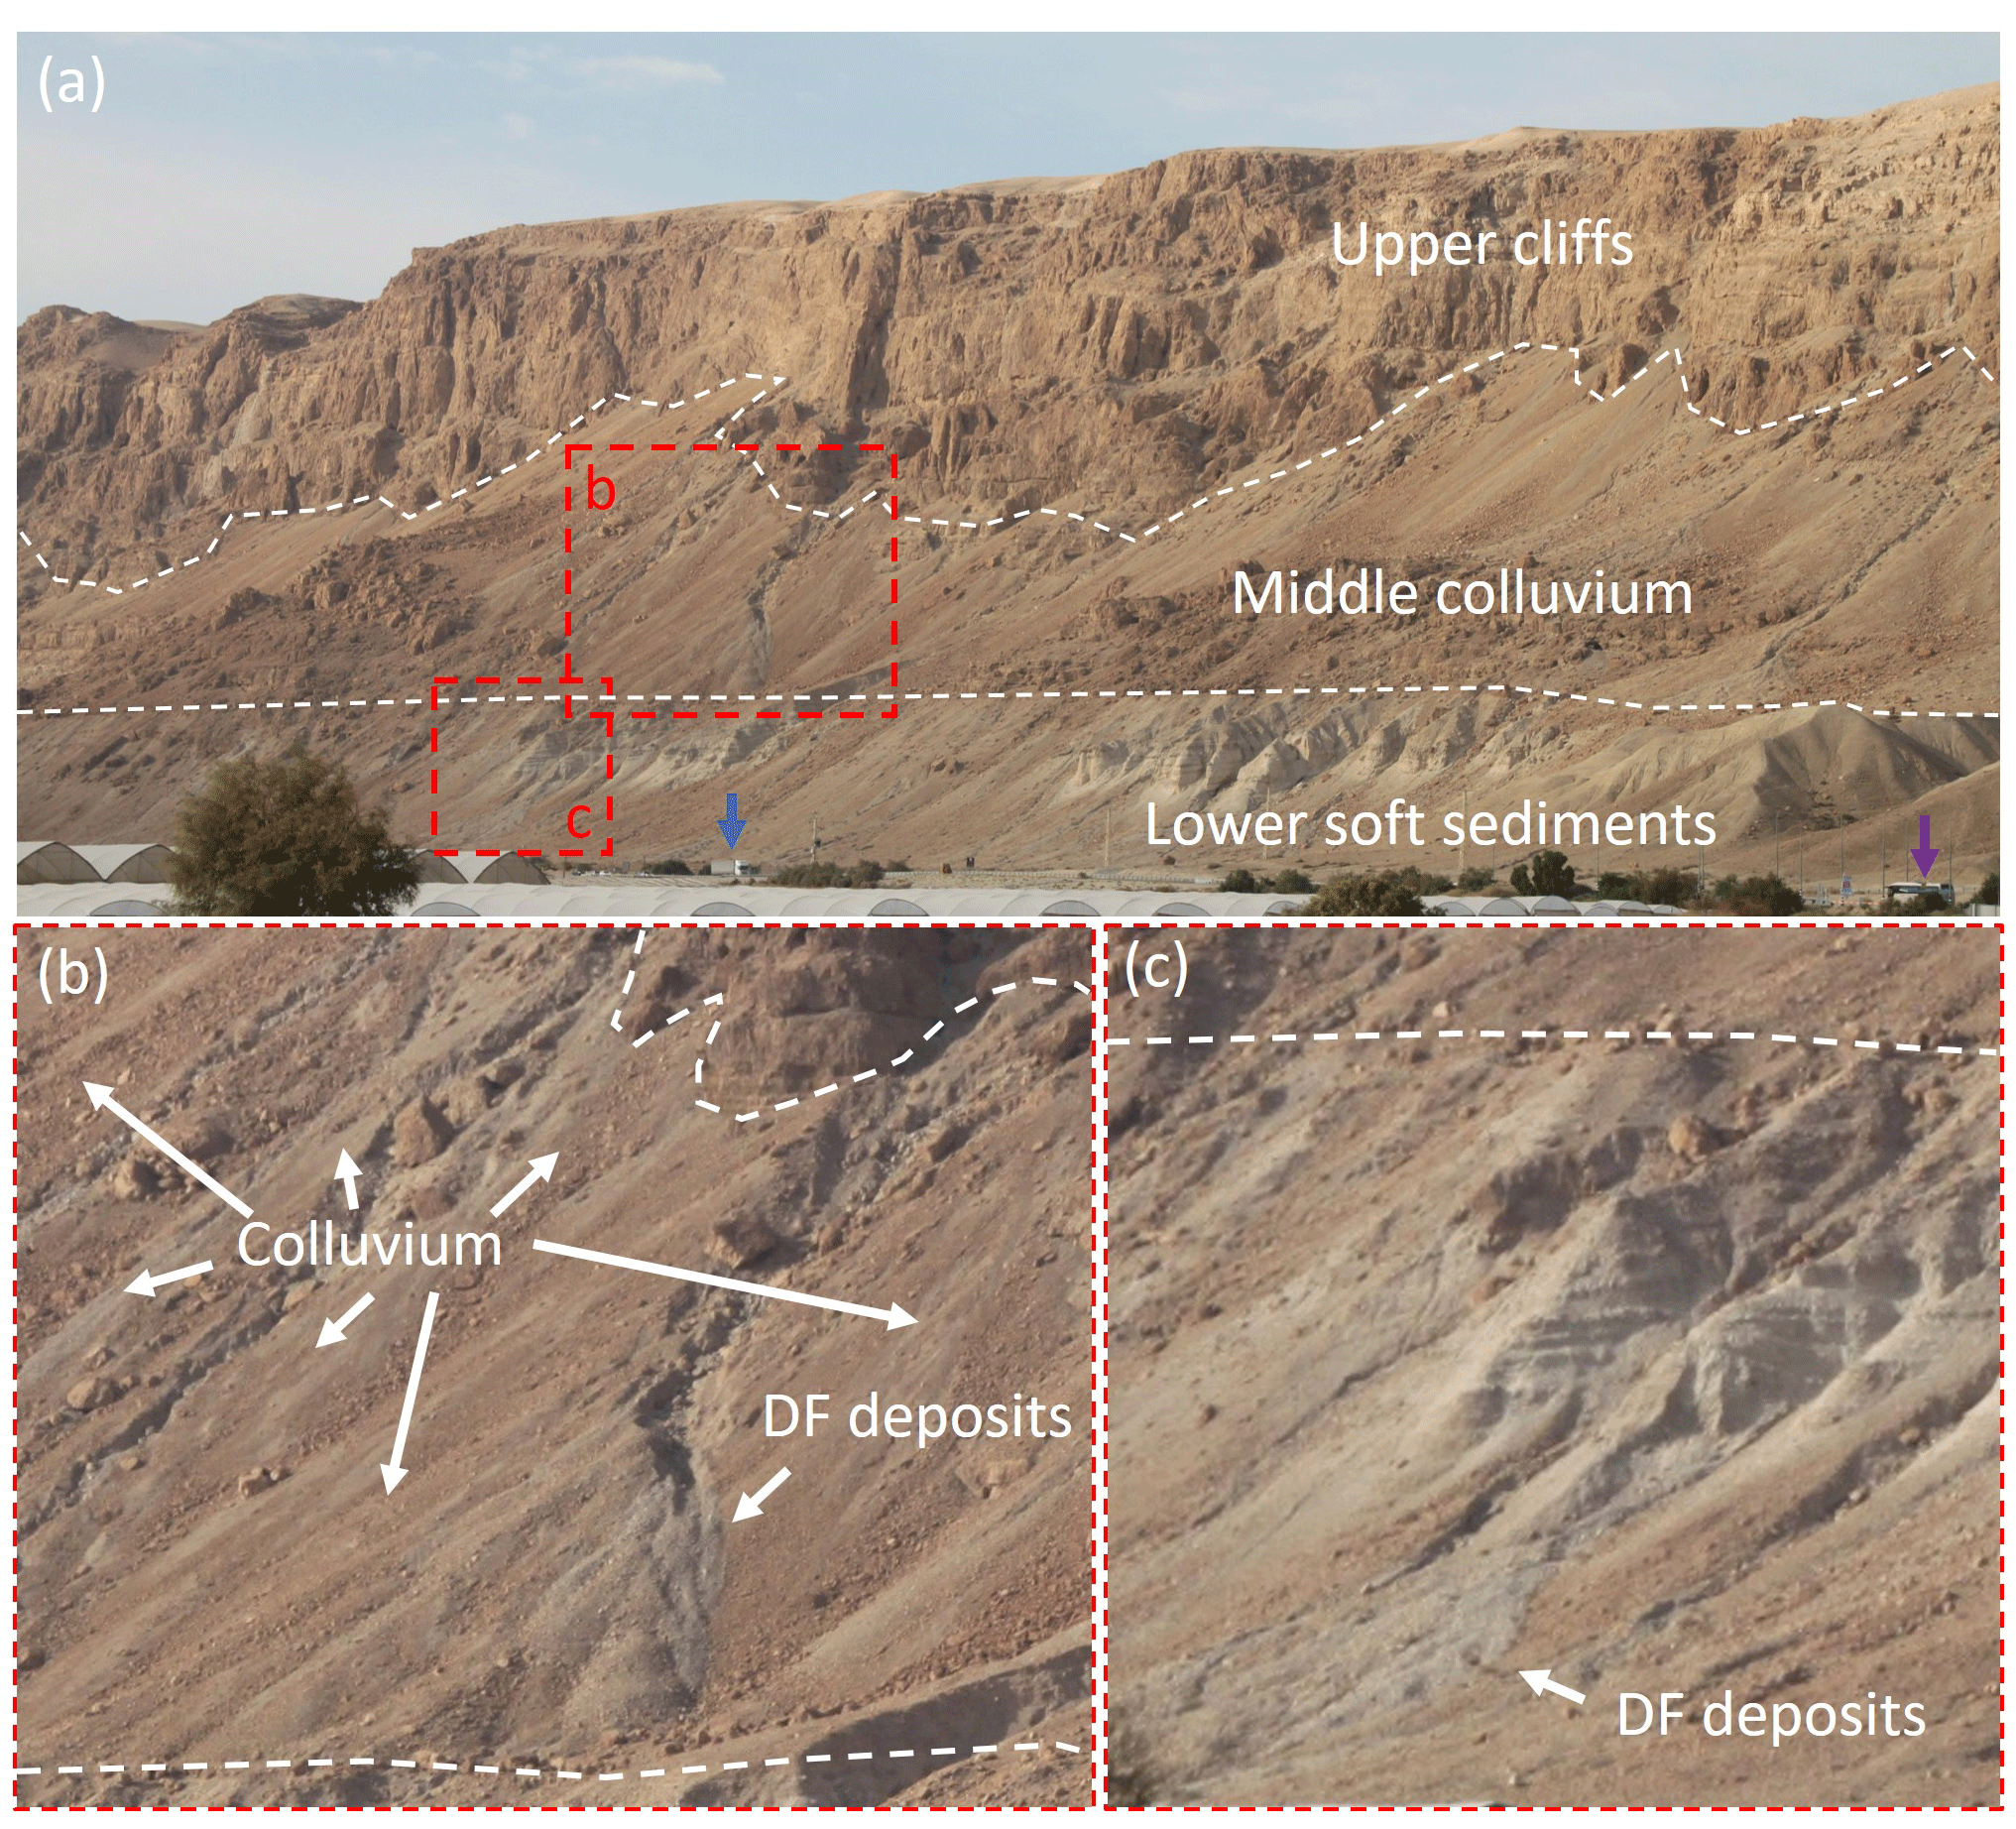
Figure 2The studied escarpment and the observed DF deposits. (a) The northern part of the study area where group 1 DFs were observed. The escarpment is generally divided into three parts: the upper cliffs, middle colluvium and lower soft sediments. A truck and a bus are marked for scale by blue and purple arrows, respectively. The extents of the zoomed-in photos are marked by red rectangles. (b) A section of the middle colluvium part of the escarpment. Colluvium cover (some are pointed out by white arrows) with some large boulders is cut by small ephemeral streams that end with DF deposits. The source material is usually clearly seen in the colluvium above these deposits. (c) A DF lobe at the end of a short ephemeral stream. The deposits source from the light-color lacustrine sediments.
The 40 km long studied escarpment can be generally divided into three parts: lower soft sediments, middle colluvium and upper cliffs (Fig. 2). In many places along the lower parts of the escarpment (altitude over 300 m below the mean sea level), the carbonate rock slopes are covered by lacustrine and fluvial sediments (Fig. 2c) deposited during high lake stands in the Pliocene–Pleistocene periods (Bartov et al., 2002, 2007; Sneh, 1979; Begin et al., 1980). Many of these exposures are soft and/or cohesionless and mostly composed of carbonate pebbles. The upper third of the escarpment, usually the steepest, is rocky and composed of hard carbonate rocks (mostly dolomites). The middle part of the escarpment is mostly covered by colluvium composed of fragments originated from the rock mass above (Fig. 2b). While the colluvium coverage may change from place to place along the escarpment, it is still abundant and does not represent a limiting factor for DF triggering in the study area. The colluvium thickness is changing laterally with an observed maximum value of a few meters. At the surface, the colluvial material is usually grain-supported with increasing amounts of fine particles at depths of a few tens of centimeters. The colluvium fine fraction (less than 2 mm) is dominated by crushed dolomites and some quartz, calcite and phyllosilicates probably from an eolian source. This fine material becomes muddy and unstable once exposed to water. The lacustrine and fluvial sediments, together with the colluvial deposits, constitute the typical source material of DFs in the study area (Ben David-Novak et al., 2004).
In the study area, the average annual precipitation ranges between 50 to 100 mm, based on constantly recording rain gauges for the years 1991–2020 (https://ims.gov.il/en/ClimateAtlas, last access: 6 March 2023; see Fig. 1 for station locations). This variation in precipitation has a clear geographic gradient, with lower amounts observed in the southern part caused by the decreasing frequency of precipitation, as well as in the eastern part caused by the orographic shading of the Judean Mountains. The rainy season is between October and May, with more frequent rainstorms during the winter (December to February), generally related to Mediterranean cyclones. Some less frequent but more intense rainstorms occur during the autumn and spring months, generally related to Active Red Sea Troughs (ARSTs). While Mediterranean cyclones are characterized by regional-scale rainfall that decreases southward and eastward in the study area, ARSTs produce heavy and localized convective rain cells which tend to occur more uniformly across our domain (Armon et al., 2019; Hochman et al., 2022). On rare occasions, systems of tropical origin, termed tropical plumes, may hit the region with large amounts of precipitation at the regional scale (Tubi and Dayan, 2014).
3.1 Mapping methods
Aiming to detect modern, natural changes resulting from mass-wasting processes along the studied escarpment, we compared aerial photos and high-resolution digital surface models that were available for the years 2013–2019. During that period, no additional instrumentation was installed in the study area to identify triggered DFs. We therefore used the available orthophotos and digital surface models to map new DF deposits and to minimize the time interval of triggering. The digital surface models are the product of airborne light detection and ranging (lidar) scans, having a spatial resolution of 0.5 m per pixel with spatial uncertainty lower than 1 m. In the vertical dimension, the digital surface models' absolute elevation error is lower than 0.35 m. We obtained digital surface models for every second year: 2013 (scan date 29–31 May 2013), 2015 (April–May 2015), 2017 (12 May 2017) and 2019 (29–30 September 2019). In order to identify topography changes, we subtract the earlier digital surface model from the more recent one. The new raster of elevation differences, also known as digital elevation model of difference (DoD), should have positive values if material added, negative for deficiency and around zero for no change (Williams, 2012; Morino et al., 2019). In general, this is the case apart from two exceptions: (1) the average difference value for stationary areas is non-zero, suggesting a vertical offset of a few tens of centimeters; and (2) noisy results around high relief lines (cliffs). The first issue, probably caused by a systematic error in the digital surface model elevation, is expected to have a minor influence on our results: to ensure a better detection we computed the mean offset by averaging several stationary areas and subtracted it from the DoD. The second issue mostly affects the cliff area, and the cliff lineaments in particular, and consists of noisy raster values (neighboring cells with values above and below zero). This artifact is not expected to affect our detection because DFs are recognized by nearby regions with similar values, so noisy areas can be easily excluded. However, some tiny DF deposits are possibly missed by this procedure, especially those with an area smaller than 25 m2 and average thickness smaller than 0.6 m.
In order to narrow our uncertainty in the estimated time of triggering (otherwise only limited by the time interval between airborne lidar scans), we used orthophotos, media and social network documentation. In terms of aerial photos, we mostly use geometrically corrected orthophotos with a resolution of 0.25 m per pixel from the years 2015 (photos taken in June–July 2015) and 2016 (photos taken 15–30 April 2016). Nevertheless, for most cases, the exact timing of the DF triggering was unknown, and we had to identify the most probable triggering date as described below.
3.2 Identified debris flows and field observations
We identified 43 DF deposits that occurred between the years 2013–2019. Two additional deposits were classified as rockfalls and removed from the analyses. The DF deposits are located along small ephemeral streams that drain the cliff area above them and present evidence of previous DF activity. This suggests that they were mobilized by flow events and therefore considered DFs, as suggested by Hungr et al. (2001). The DFs we examine are small-sized, with a maximum runout distance (between the source location and deposit) of a few tens of meters. The areal extent of each DF deposit ranges between 10 and 1000 m2 with an average value of 150 m2 and elongated shapes of about 30 m in length and 5 m in width. Although during the studied period (2013–2019) only small-sized and short-runout-distance DFs could be clearly mapped, longer-runout-distance DFs from past events are observed along the studied escarpment (Fig. 3). In principle, it is possible that larger DFs did occur during the studied period (2013–2019), but subsequent road construction and floods blurred the DF tracks. This made it impossible for us to detect them by means of DoDs and to verify the nature of the phenomena (e.g., distinguishing between DFs and flash floods) based on field surveys. This is to emphasize that, although the studied DFs are relatively small, their triggering mechanism is similar to potentially more hazardous DFs. All the mapped DFs in this study are of the first to second stream order, following the “top down” system division. Their drainage basins are extremely small, usually limited to the cliff itself or to a kilometer west of the clifftop at most. The spatial extent of each DF deposit was mapped into a polygon based on the DoDs (positive values for added material). These polygons were primarily grouped according to the time interval they were triggered (2-year intervals based on the lidar scans): 17 DFs between 2013 and 2015 and 26 DFs between 2015 and 2017, while no deposits were identified for the period 2017–2019 (Fig. 1).
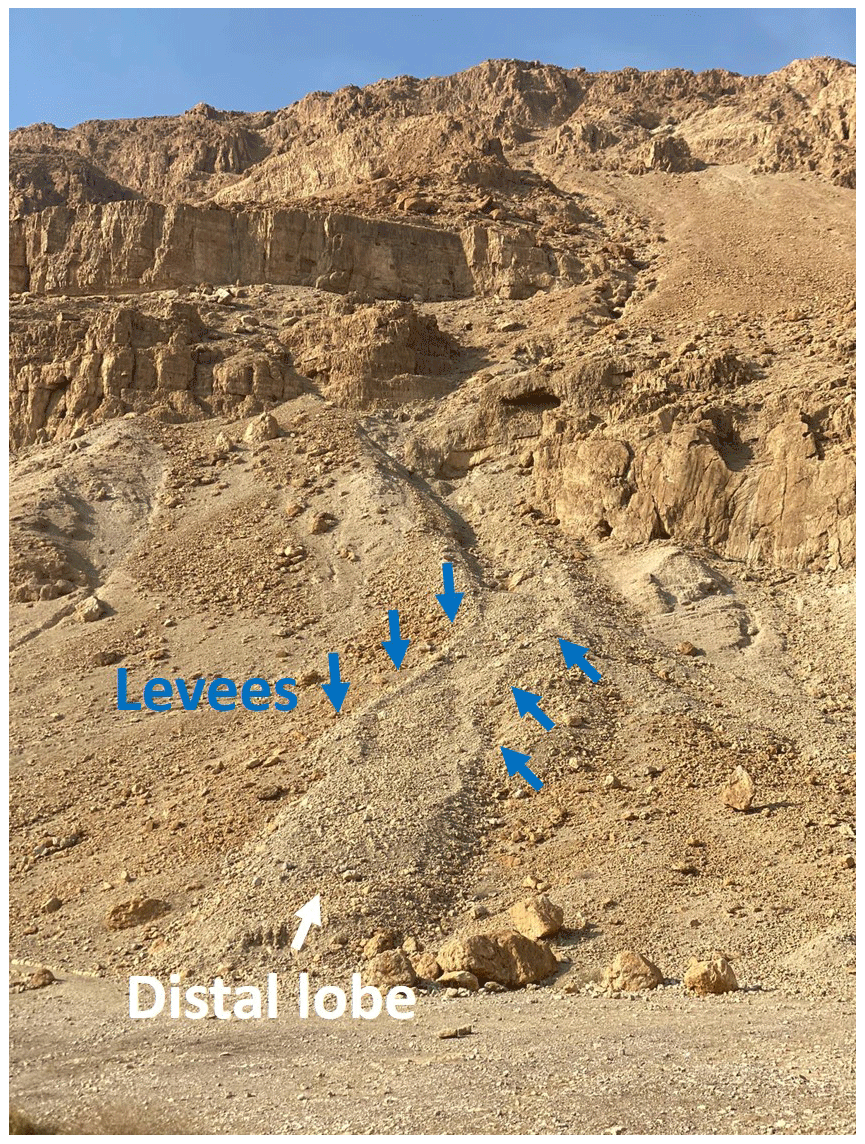
Figure 3An example of debris flow deposits triggered prior to 2013. A distal lobe (white arrow), two levees (blue arrows), and a wide and shallow channel in between them at the end of the ephemeral stream drained the cliff area.

Figure 4Mapping and characterization of debris flows in the field and the topographic models. (a) Natural changes on the steep slope east to Metsoke Dragot village as reflected from the DoD of the years 2013–2015. Brown shades suggest newly deposited materials while dark green shades represent new depressions. More details on the DF in the purple rectangle are shown in panels (b) to (f). Arrows mark three additional DF deposits. (b) Zoom-in on the DF area, where the source of the debris material and the elongated deposits are clearly seen on the map. Upper-slope cliffs (black lines) are noisier in the DoD. (c) A channel (dashed line shows its path) incised in the unconsolidated colluvium. (d) The DF channel with parallel levees on its margins. (e) Deposits of the lobe complex. (f) The distal lobe.
Aiming to verify that the mapped deposits are indeed the result of DFs, we explored their structure and morphology in the field (Fig. 4). In many cases, the DFs are located on very steep slopes (20–40∘) with limited access. All mapped deposits and their related upstream erosional scours (i.e., depressions along the streams where the missing material is the source for the debris material) are located along or at the edge of short ephemeral streams that drain the cliff. The deposited sediments are poorly sorted, a principal characteristic that distinguished DFs from water-laid sediments. Distal lobes, also known as depositional lobes, are observed for all the mapped deposits at the toe of the flow. For some cases, also side lobes are observed upstream along the flow path (Fig. 4e and f). Levees, usually a few tens of centimeters high, are occasionally observed on both sides of the channel, although they are barely seen in the DoDs. In the field, the greyish levees are clearly distinguished from the surrounding brownish colluvium (Figs. 3 and 4d). These levees consist of relatively large fragments, similar to those found in the lobes. All these elements suggest that these deposits were caused by DFs.
For most of the mapped DFs (37 cases), the deposits consist of unsorted dolomite and limestone angular fragments with a maximum size of a few tens of centimeters. This deposit composition reflects the colluvium composition above it, which is mostly composed of the upper-escarpment cliffs and some eolian fine particles. Hence, the source for the debris material is the talus at the base of these cliffs (Fig. 2b). In contrast, in fewer DFs (six cases) located at the bottom of the lower step on the escarpment, the deposits consisted of rounded fragments, apparently derived from the nearby cliff of lacustrine and conglomerate sediments (Fig. 2c). These same two sources of debris materials were also reported by a previous study in the region (Ben David-Novak et al., 2004).
We divided the mapped DFs into four groups based on the triggering time interval and on their spatial distribution across the study area, with the assumption that each group has been triggered by an individual convective cell (Fig. 1). While it is in theory possible that nearby DFs were triggered by different storms over a short period of time, we deem this possibility highly unlikely due to the rare occurrence of DFs in the region. Conversely, a specific storm that may last for a few days, could represent the trigger of several groups. However, since the distances between groups observed in the same 2-year time intervals are always greater than 8 km and the typical scale of convective cells in the region is smaller (Belachsen et al., 2017; Marra and Morin, 2018), these groups were likely triggered by different convective cells. As we will see, this is possibly the case of our groups 1 and 4, which occurred in the northern and southern parts of the study area, respectively (Fig. 1).
We introduce here three concepts that we will use to characterize the properties of the rainfall that led to DF initiation (see Fig. 5). We define “triggering storm” as the storm event during which a DF is initiated. To this end, storms are defined as wet periods separated by at least 5 d of dry weather (i.e., 120 h with less than 0.1 mm h−1 in the radar data; note that given the climatology of the area with very few storms per year, there is little sensitivity to this choice). We define “triggering cell” as the high-intensity convective cell that likely provided the final trigger to the DF initiation. Last, we define “antecedent rainfall” as the rainfall observed before the triggering cell and during the triggering storm (i.e., between the beginning of the triggering storm and the beginning of the triggering cell).

Figure 5Schematic representation of the triggering storms showing triggering storm, triggering cell and antecedent rainfall. The colored triangles represent the rainfall throughout the triggering storm: antecedent rainfall (yellow), triggering cell (orange) and rainfall after the DF triggering in blue.
4.1 Rainfall data
Our mapping of natural changes along the steep escarpment between the years 2013–2019 suggests that the majority of mass-wasting events were caused by DFs. We used both rainfall stations located within or in close proximity to the study area and the weather radar of the Israel Meteorological Service (Fig. 1) to identify and characterize the triggering storms. We used the rainfall data from two types of stations (https://ims.gov.il/en/stations, last access: 6 March 2023) as shown in Fig. 1: (1) automatic rain gauges with a time resolution of 10 min (from north to south: Bet Haarava, Metsoke Dragot, En Gedi bath); (2) daily rain gauges (from north to south: Almog plantation, Enot Zuqim, Mitzpe Shalem factory). Weather radar data are used to assess the rainfall conditions above the DFs, and rain gauge data are used to constrain and validate the radar data on a regional scale.
The weather radar (https://ims.gov.il/en/node/193, last access: 6 March 2023) gives rainfall intensity maps every 5 min at 500 m resolution, and allows for the spatial analysis of the event. In particular, weather radar data are essential to capture the DF-triggering rainfall conditions especially in convective environments. In fact, rain gauges tend to systematically underestimate the DF-triggering rainfall because they sample precipitation fields away from the triggering locations and because these fields are characterized by sharp spatial variability and necessarily have high intensities over the triggering locations (Marra et al., 2016, 2014; Destro et al., 2017; Nikolopoulos et al., 2014, 2015). Weather radar data were provided by the Israel Meteorological Service and elaborated following the procedures described in Marra et al. (2022), which include physically based corrections and empirical adjustments based on rain gauge climatology. In addition, in order to reduce the bias typically observed in our study area (e.g., see Marra et al., 2022), we gauge-adjusted the radar data of each storm (see definition above) using data from the daily rain gauges described above (e.g., see Rinat et al., 2021). Despite these careful adjustments, the radar samples the study area about 3 km above the ground (see Marra et al., 2022), so rainfall at the ground could be misplaced by a few hundreds of meters in the case of strong winds in the lower atmosphere. This may cause some errors in the estimation of rain intensities; in particular, because of the typical characteristics of DF-triggering convective rainfall (Marra et al., 2016), we expect that in these cases, our evaluation could be underestimated. While this does not affect our findings, some caution should be taken regarding the rain intensity values we report. It is worth noting that the previous studies in the region (e.g., Ben David-Novak et al., 2004) were based on data from a different weather radar, which was, however, located not far from the one used here; thus, the same caveats are to be used in interpreting those quantitative estimates.
4.2 Identification of the most likely triggering storms
Since the study area was documented by airborne lidar roughly every second year, we searched for all the potential triggering storms that could have triggered the DFs during the time intervals between two subsequent scans (Fig. 6). For the analysis, we consider the location of each DF at the center of its mapped deposit. The many streams that drain the cliff have a very small drainage area (maximum distance between the deposits and the basin head is 750 m). As the weather radar resolution is 500 × 500 m2, we can assume that the rainfall observed by the radar corresponding to the deposit location represents a good approximation of the rainfall over the drainage basin (Marra et al., 2014).
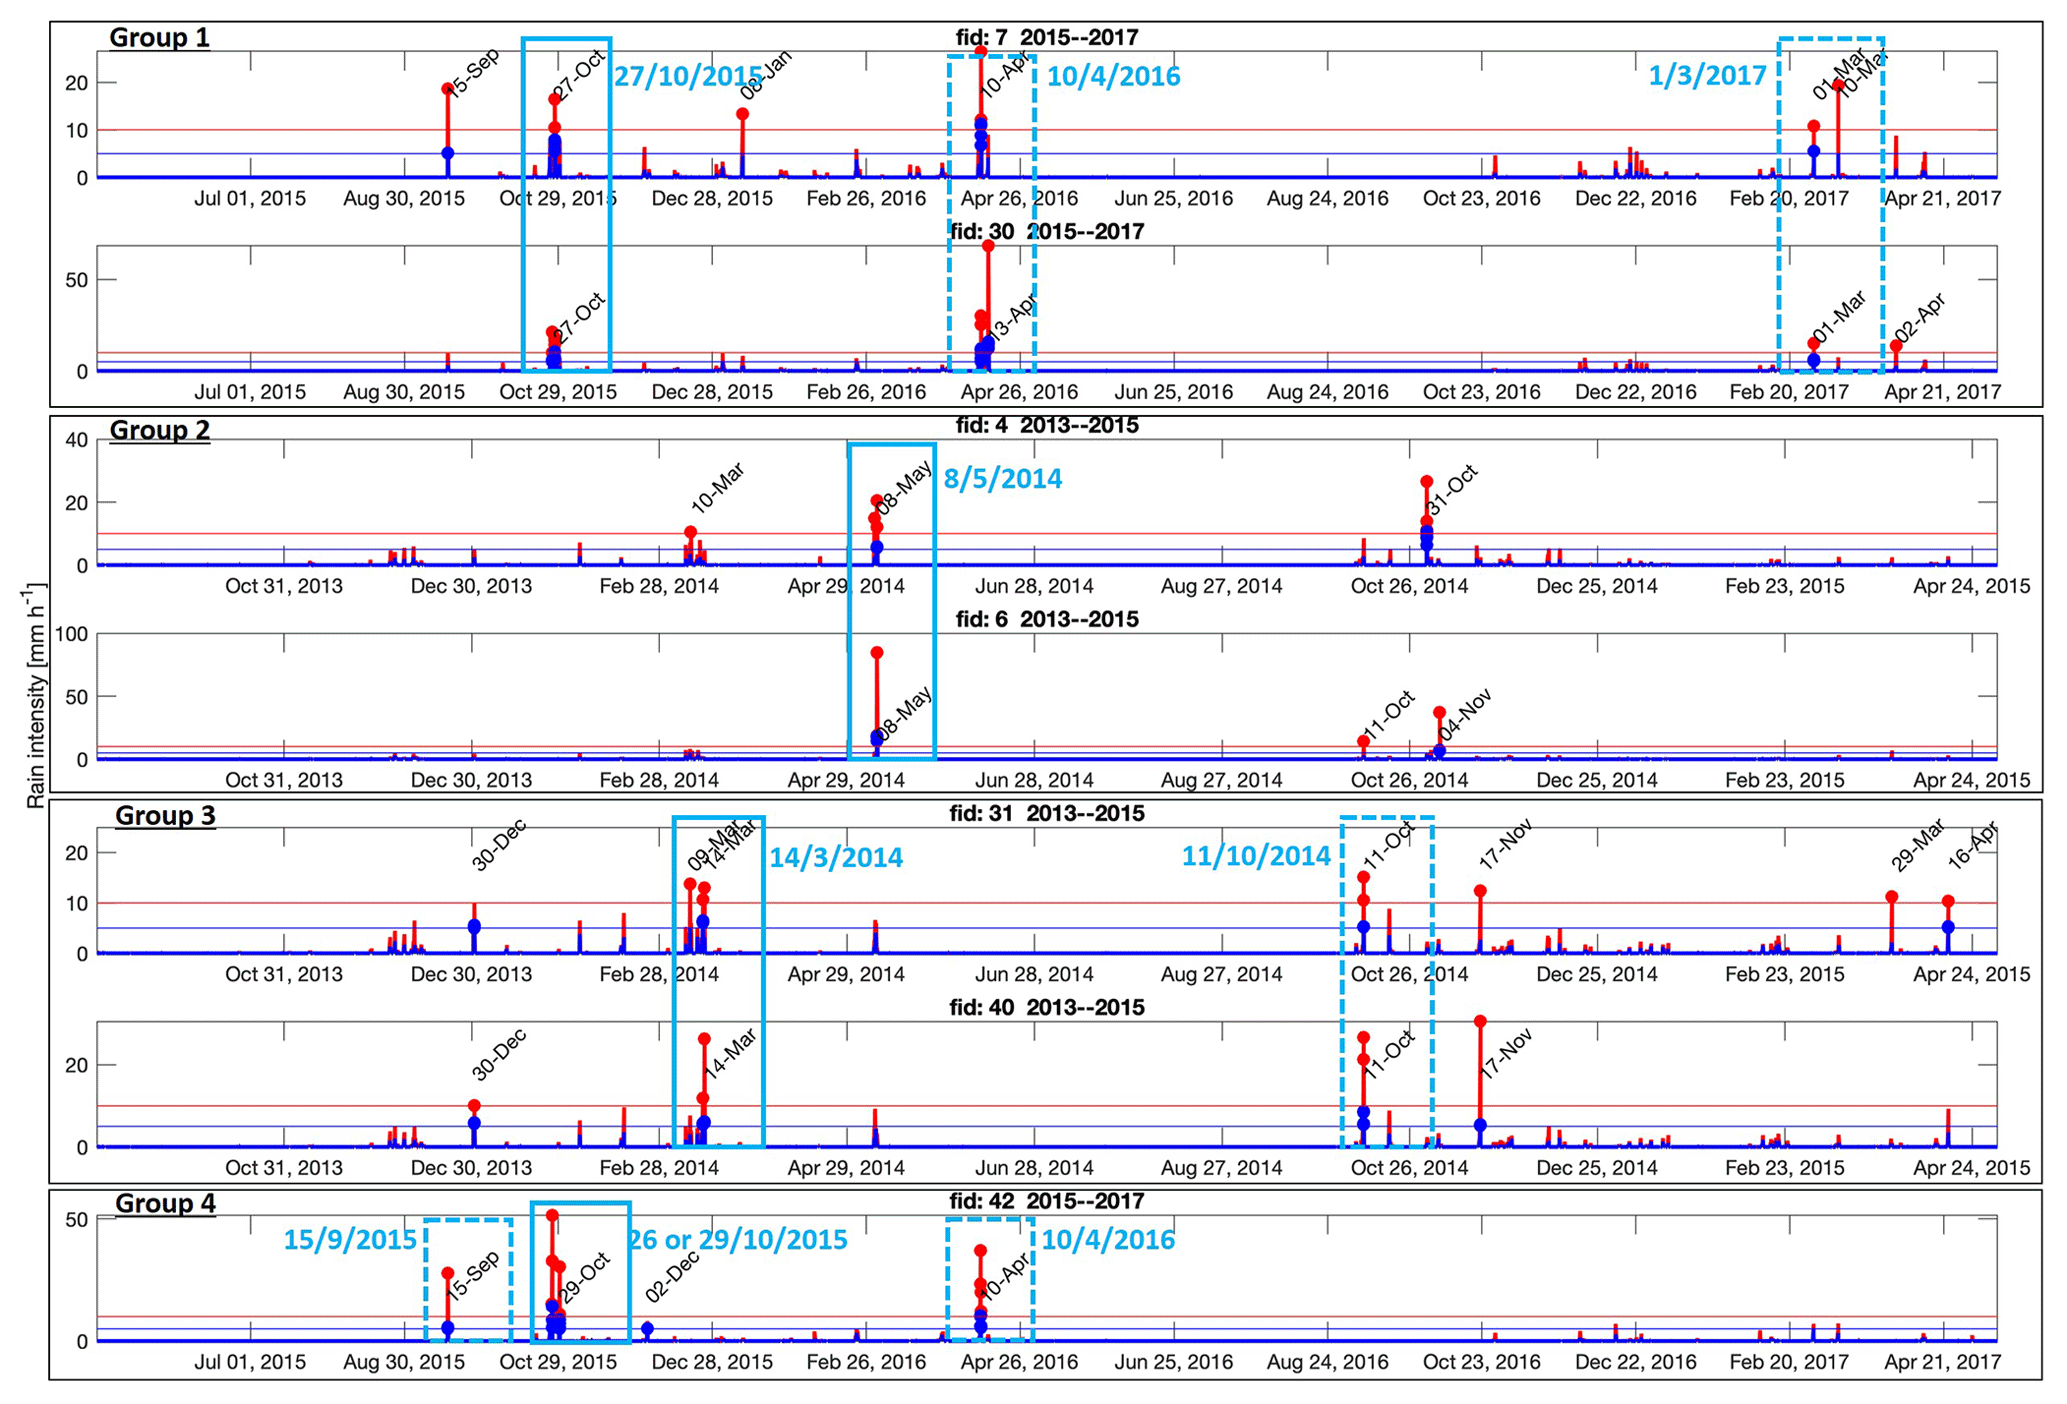
Figure 6Time series of rainfall events over the four groups of DFs. Seven sub-plots of the rainfall intensity versus time (for 2-year intervals) for seven DFs related to four different groups. In each sub-plot two graphs are shown: the rain intensity in 5 min intervals (in red) and the smoothed intensity observed over 30 min moving windows (in blue). Horizontal lines mark the two thresholds of 10 mm h−1 (red) and 5 mm h−1 (blue). Any storm during which the 5 min intensity exceeds the 10 mm h−1 threshold or the 30 min intensity overcomes the 5 mm h−1 threshold is marked by a red or blue dot, respectively. Storms exceeding both thresholds for all the DFs of a group are considered potential triggering storms (marked by dashed light blue box); among them, the chosen storms are marked by solid light blue box.
Following this procedure, we plot for each DF the 5 min rainfall intensity versus time for its relevant 2-year interval (Fig. 6). For example, for a DF from group number 3, mapped east to Metsoke Dragot, we used the radar data for the years 2013–2015. Note that gaps in the radar data are possible because of technical issues and because during dry periods the radar is often turned off. In order to make sure that we did not miss critical storms, we compared the radar data with rain gauge stations. During the period of 2013–2017, we found only two storms (8–9 January 2016 and 27–29 January 2017) during which the radar was off.
We picked potential triggering storms by isolating those storms in which the peak rainfall intensities exceeded 10 mm h−1 and the peak 30 min intensity (average intensity over 30 min periods) exceeded 5 mm h−1 (Fig. 6). Recalling that previous studies reported thresholds of 30 mm h−1 over 1 h periods and that 10 mm h−1 is often regarded as a threshold for defining convective precipitation (e.g., Peleg and Morin, 2012), this selection is based on rather low intensities; i.e., it ensures we will select all the potential triggering storms, and it diminishes the possible impact of radar underestimation mentioned above. It is worth noting that this selection is only based on intensity, and no other condition on rainfall amounts or rainfall preceding the high-intensity is used.
Table 1Potential triggering storms and suspected triggering convective cells for the 43 DFs, organized into four groups. The DFs are numbered by Fid, which is the object ID of a shapefile in ArcGIS Desktop, and in parenthesis the total number of DFs in a group is given. The weather system that produced the storms is also reported. Bold fonts indicate the potential triggering storms.
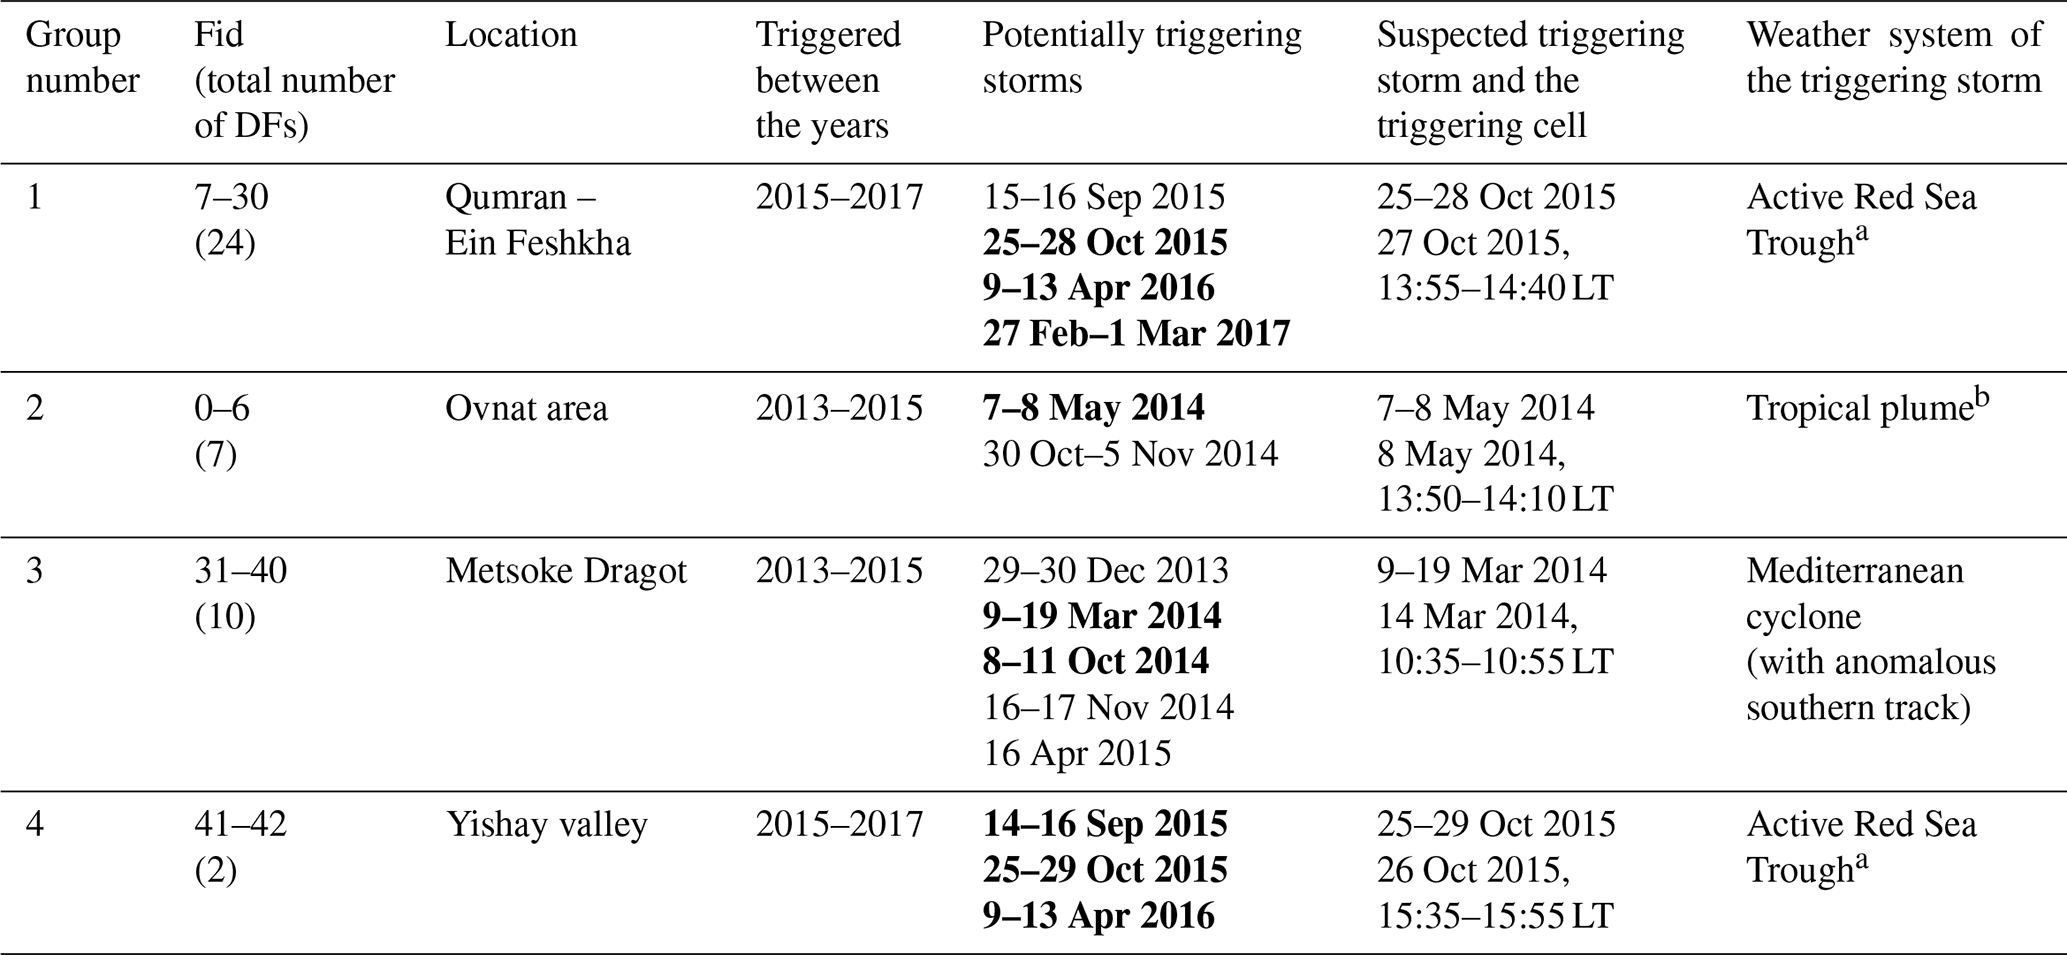
a See also Marra and Morin (2018); b see also Armon et al. (2018).
In total, we identified 11 potential triggering storms that satisfy the above intensity conditions over the DFs during the periods of interest (Table 1). Nevertheless, only 7 of these 11 storms satisfied the conditions over all the mapped DFs of a group of interest (marked by bold text in Table 1 and blue rectangles in Fig. 6). Therefore, only seven storms can be considered potential triggering storms. Note that one of them (26–29 October 2015) is a potential triggering storm for the DFs of two groups. We should remember that the process of identifying the triggering cell could be subject to errors, so a different storm or cell or more than a single convective cell may have triggered the mapped DFs in a group. The procedure we adopt, however, closely follows our knowledge of DF triggering in general and of local climatology of storms in particular, so this possibility is expected to be unlikely.
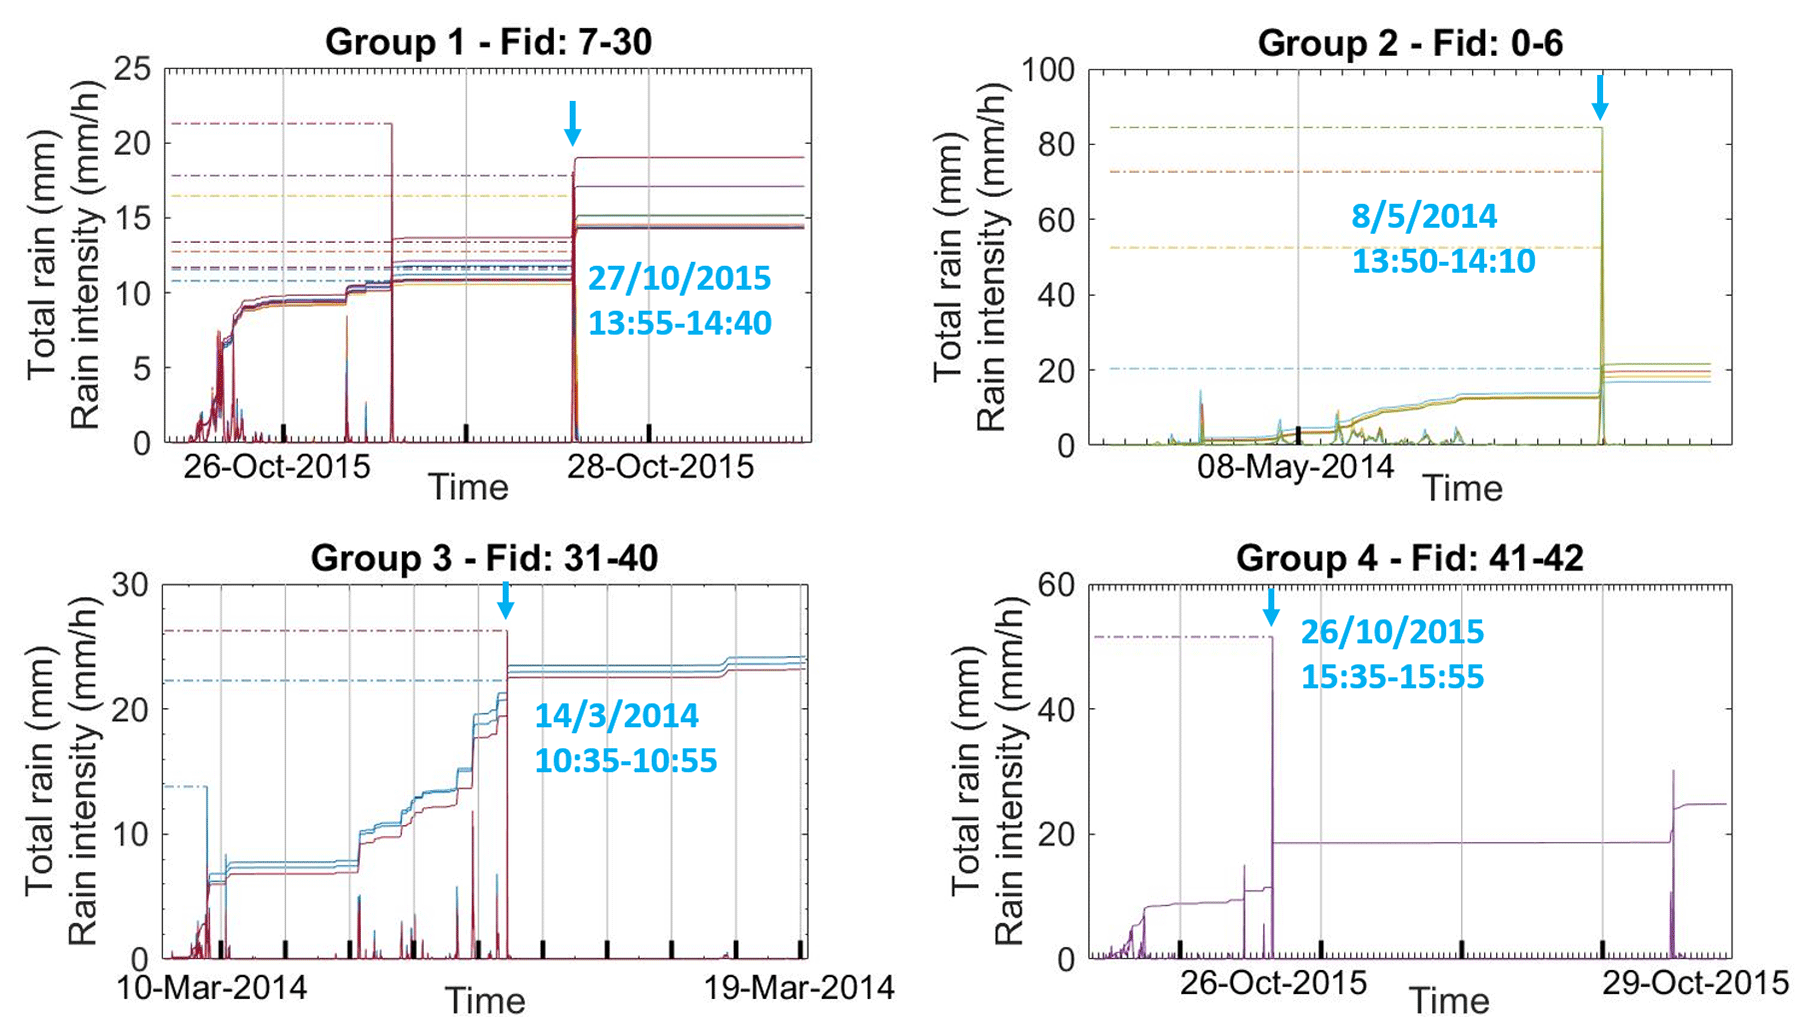
Figure 7Rainfall evolution over the DF locations during the triggering storms (see Table 1). For each group we plot the intensity (spikes) and cumulative rain (stairs graph) during the triggering storm for all DF locations (where “Fid” is the identification number of the DF) in the group (the different line colors). Dashed lines mark the peaks of rain intensity. A blue arrow marks the triggering cell during each storm. Note that the y axis shows both rain intensity (in mm h−1) and total cumulative rain during the storm (in mm).
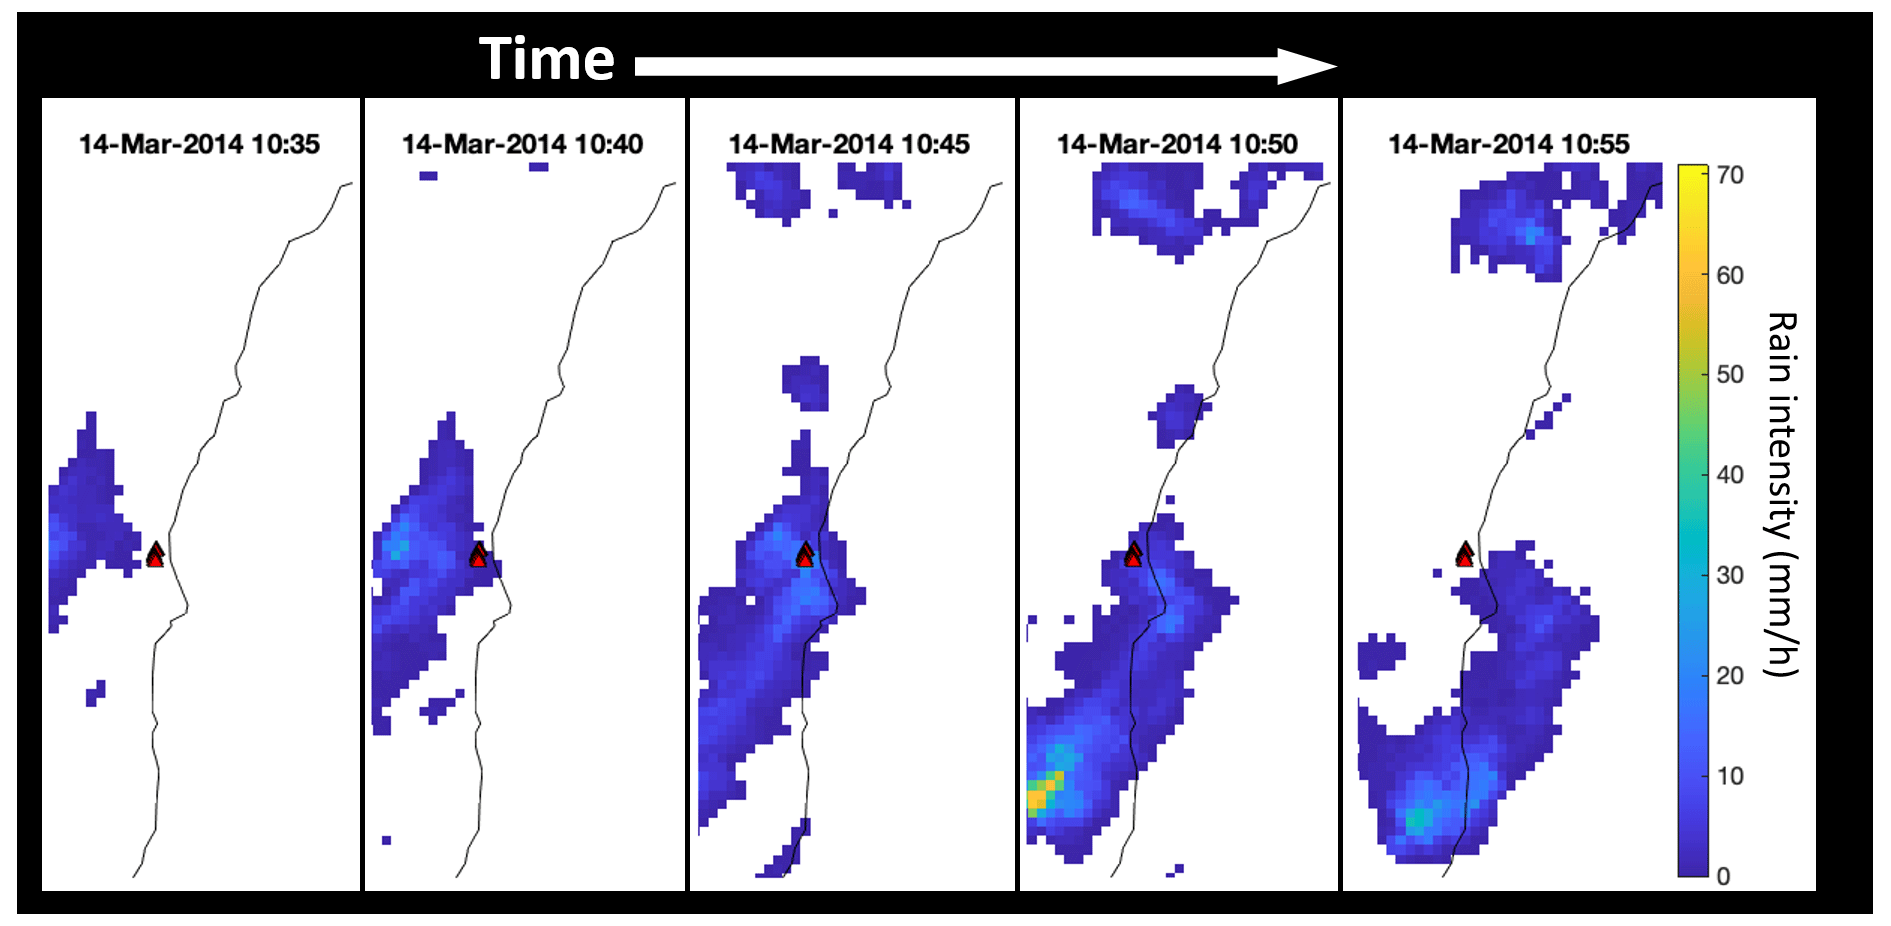
Figure 8Weather radar maps. Time snapshots (time increases rightward) of the rain intensity over the study area during the time of the triggering cell that triggered group 3 DFs (red triangles). A black line marks the Dead Sea shoreline. The highest rain intensities overlap the group DFs at 10:45 LT (UTC+2), while the whole event is shorter than 30 min.
Once we identified the potential triggering storms, we needed to narrow down our choice to the most probable storm that triggered each DF group. To achieve that, we used additional analysis of the radar data, orthophotos, and online reports from social media and news websites. For each of the seven potential triggering storms we examined the event time series in terms of total rainfall and rainfall intensity versus time for a period of hours to a few days (Fig. 7). We also produced the 5 min resolution rain intensity maps such as the one shown in Fig. 8. Using those, we followed the candidate convective cells of each storm in time and examined their spatiotemporal behavior with respect to (i) the mapped deposits and (ii) areas with similar slopes and/or sediment availability but no observed DF. This allowed us to narrow our choice. In some cases, such as group 1 in the northern part of the study area, we could not clearly pinpoint a single triggering cell for the DFs in the group, and we needed additional information. Using two orthophotos from the years 2015–2016 we limited our search for two out of three storms: 26–27 October 2015 and 10–13 April 2016 (Table 1). We manually searched several websites (including Facebook, YouTube and newspapers) for relevant photos and videos of floods that could help us determine the flow characteristics (debris flow or flash flood) and identify the exact timing of the event. We could only find a Facebook video showing deposits on the main road (route no. 90) (https://www.facebook.com/chen.sason.75/videos/1155321937831332, last access: 6 March 2023) that crosses the most southern stream of mapped deposits from group 1 on 27 October 2015. We could use this information to pinpoint a specific event and a most likely triggering cell for group 1 DFs: 27 October 2015 between 13:55–14:40 LT (UTC+2). Combining the above information, we ended up identifying the four triggering cells that, based on the information at hand, most likely triggered the DFs in the four groups (Table 1).
4.3 Characterization of the rainfall leading to debris flows
The characteristics of the rainfall during the triggering storms were examined to evaluate the critical conditions for DF triggering in the study area. The triggering cells are intense and short: intensities are in the range of 10–85 mm h−1 and durations between about 20 min (groups 2–4) and 45 min (group 1; Table 1 and Fig. 7). Interestingly, for all DFs, significant antecedent rainfall was observed for the triggering storms during the hours preceding the triggering cell (usually more than 10 mm; Fig. 7). To further explore this point, we plotted for each group the spatial distribution of antecedent rainfall over the study area and compared it with the spatial distribution of the total rainfall yield of the triggering cells, as well as with their maximum intensities over 5 and 30 min intervals (an example of such a plot is given in Fig. 9). Figure 9b–d present the triggering cell characteristics of group 3 (in the center of the map) and suggest that two additional convective cells (warmer colors) north and south to the main cell passed through the studied area at the same time. While the maximum intensities of all three cells exceed 10 mm h−1, only the central one triggered the DFs (of group 3). Although the southern cell covers the steep slopes well (meet the steep slope and sediment conditions) and is similar in rainfall intensity, no DF was triggered. We suggest that this is related to lower amounts of antecedent rainfall. In contrast, for the northern cell it seems that the antecedent rainfall condition is available, but the cell only marginally crossed the steep slopes (the cell at its peak intensity did not cross the cliff area).
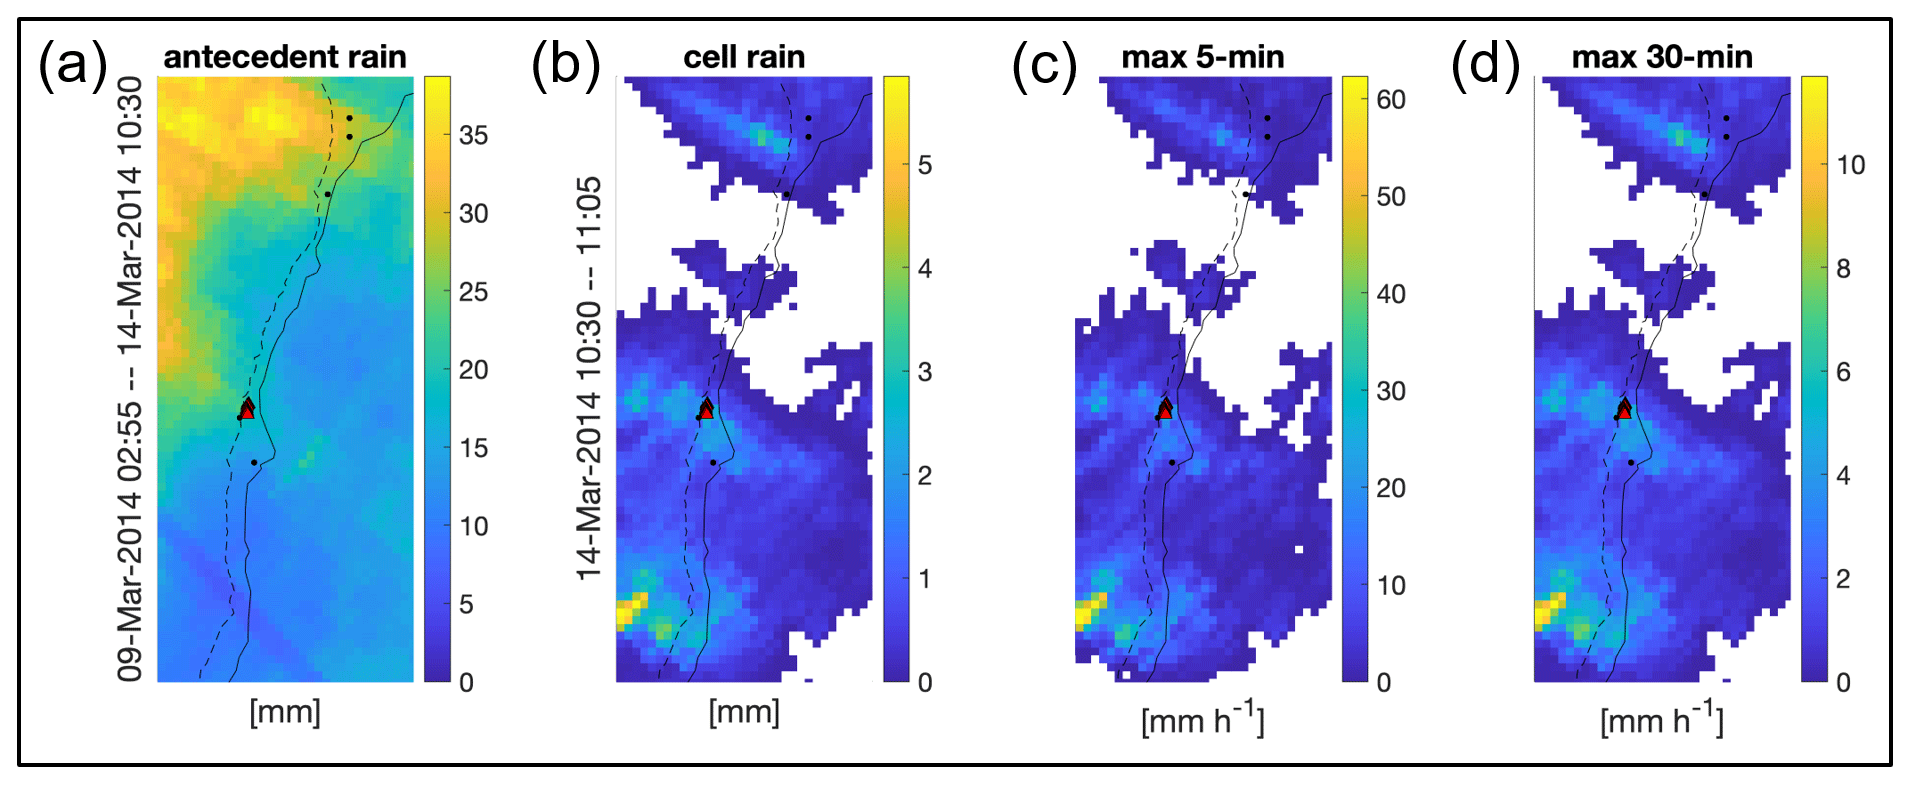
Figure 9Rainfall leading to DFs for the event shown in Fig. 8. The clifftop (dashed line), together with the Dead Sea shoreline (solid line), marks the narrow band of steep escarpment where debris flows may potentially be triggered. Black dots show the location of the rain gauges. (a) Antecedent rainfall – map of the total rainfall during the March 2014 event until the onset of the trigging cell. (b) The total rainfall observed during the triggering cell (10:30–11:05 LT). (c) Peak intensity of the triggering cell (5 min time interval). (d) Peak intensity of the triggering cell (30 min time interval).
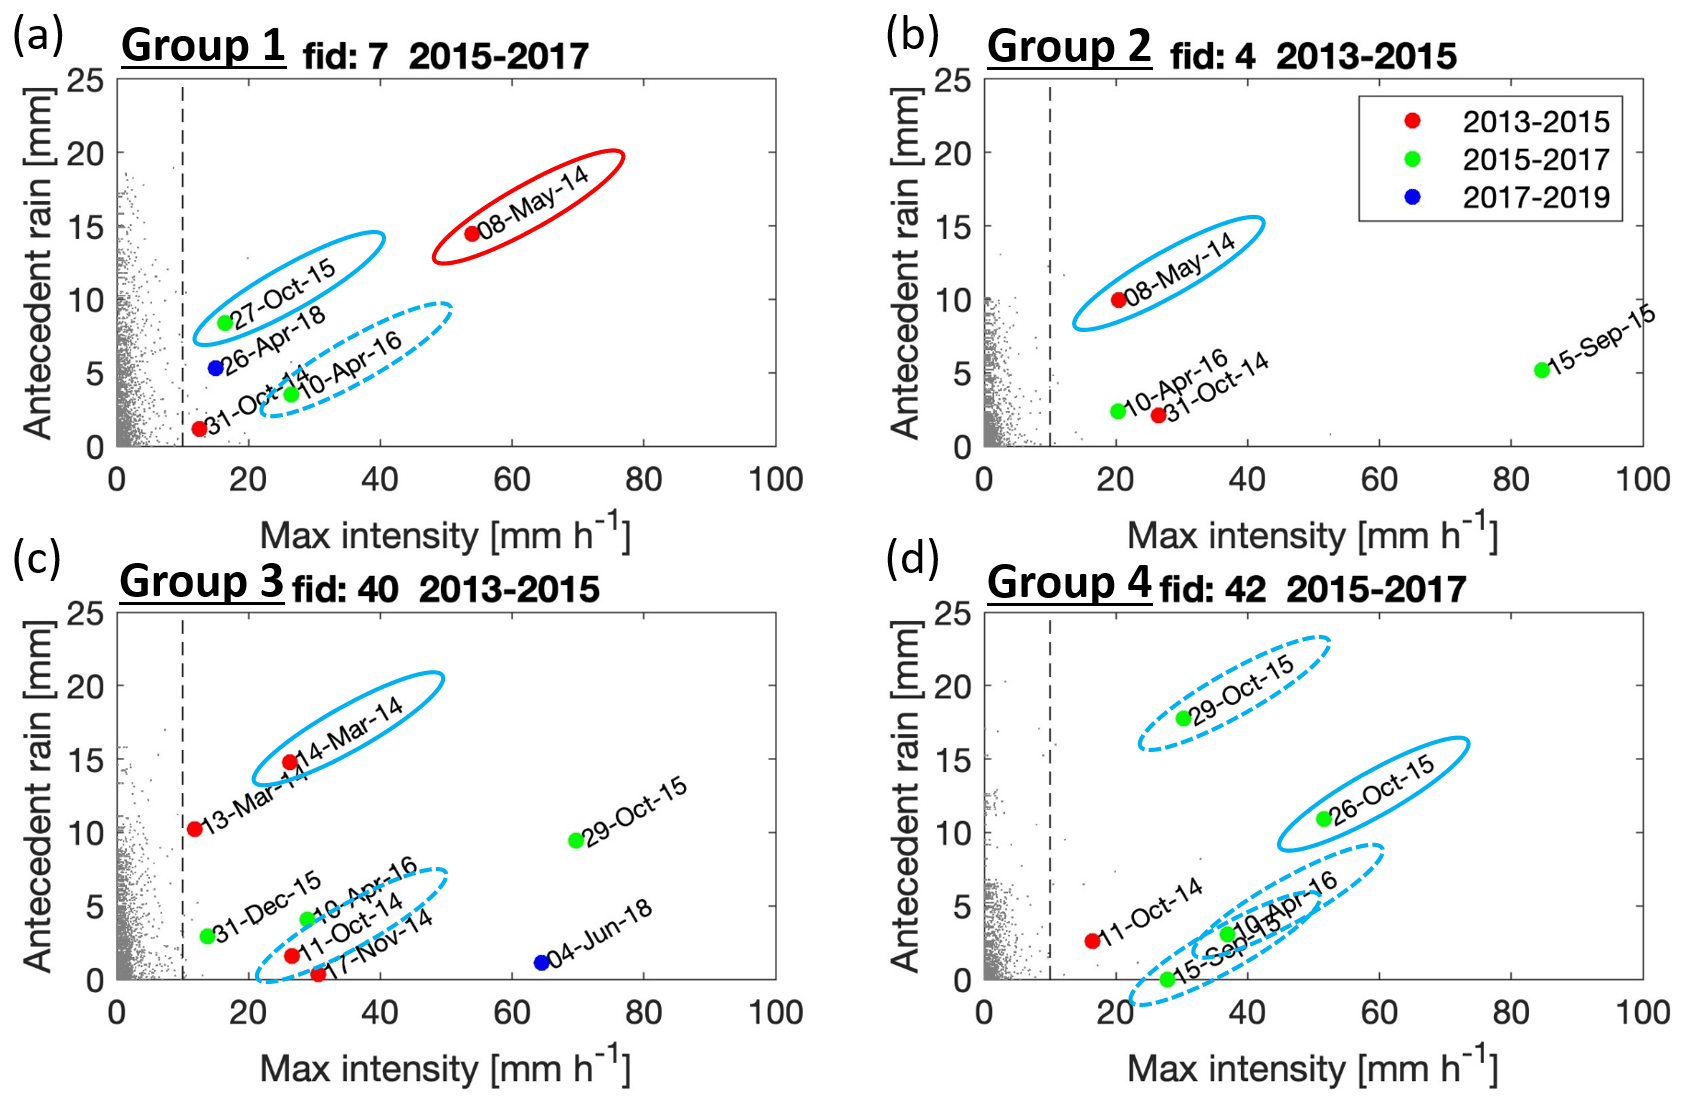
Figure 10Scatter plots of antecedent rainfall versus maximum 5 min rain intensity observed over four DFs representative of the four groups (a–d) for all the storms observed in the radar archive in the period 2013–2019. Data points exceeding the intensity of 10 mm h−1 for 5 min intensity and 5 mm h−1 for 30 min intensity are marked by color and classified according to the time interval specified by the DoDs. Potential triggering storms (bolded text in Table 1) are marked with dashed blue ellipses, whereas the most likely triggering storms identified in this study are marked with a continuous blue ellipse. The red ellipse in group 1 marks the storm of 8 May 2014, discussed at the end of this section.
In order to validate the hypothesis that antecedent rainfall is an important factor in DF triggering in the study area, we examined the whole period between 2013 and 2019 with the aim of identifying storms which could potentially trigger DFs in terms of rain intensity but did not. We focused on the triggering locations of our DFs in order to ensure the susceptibility conditions are met. In Fig. 10 we plot the antecedent rainfall versus the 5 min rain intensity for a representative DF deposit from each group. Here, the antecedent rainfall is calculated automatically over the entire time series as all the rain accumulated on the deposit pixel over the 120 h preceding the specific measured intensity. This automatic definition provides estimates of the antecedent rainfall that are equivalent to the ones used earlier, except for the rare storms lasting longer than 5 d prior to the peak intensity; in these cases, this automatic definition might underestimate rainfall. For most cases, in these new graphs we picked the same potential triggering events as we previously showed (Table 1). Interestingly, for extreme-intensity rainfall events (exceeding 60 mm h−1), like the 15 September 2015 event in group 2 (Fig. 10b) and events on 4 June 2018 and 29 October 2015 in group 3 (Fig. 10c), no DF deposits were observed even after re-checking the target area in our DoD.
An interesting additional story is told by Fig. 10a: the event on 8 May 2014 shows relatively high antecedent rainfall (more than 10 mm), as well as peak intensity (more than 50 mm h−1), compared to the likely triggering event on 27 October 2015 but occurred before the DFs in group 1 were triggered (they were not observed in the lidar flight between these two storms). Given the strong characteristics of this cell in terms of both antecedent rainfall and peak intensity and since the mapping could not be fully effective for small DFs, we further examined the region around group 1 looking for potential signatures of the 8 May 2014 storm. Indeed, some tiny shallow deposits appeared during the period 2013–2015. They are located on the western edge of the group 1 area in close proximity to the 8 May 2014 cell peak. While these mass movements are small with respect to the DFs examined so far in this paper, they show similar DF-like properties. The fact that we could find new mass movements based on the requirement of both antecedent rainfall and peak intensity constitutes an additional element supporting our hypothesis.
5.1 Characterization of the rainfall leading to debris flows in arid regions
As mentioned in Sect. 4.3, the investigated triggering cells are intense (10–85 mm h−1) and short (20–45 min) (Table 1 and Fig. 7). Both their intensities and durations are lower than the previously suggested threshold for DF triggering in the study area (intensities greater than 30 mm h−1 for duration of 1 h or longer; Ben David-Novak et al., 2004). A previous study conducted on the arid slopes of the Grand Canyon, Arizona, cautiously suggested that sustained intensity exceeding 20 mm h−1 and a total rainfall of 25 to 50 mm may be a minimum requirement for DF triggering, without mentioning a minimum duration (Melis et al., 1995). In our study, only two out of the four triggering cells have maximum intensities exceeding 30 mm h−1, but these intensities were observed only for a short period (less than 10 min), much shorter than what was previously reported (Fig. 7). While for most of our mapped DFs, intensity was indeed greater than 20 mm h−1, the total rainfall for all triggering cells was lower than 25 mm (Fig. 7). Quantitative accuracy of radar data, however, is not perfect, and, as mentioned above, possible underestimation cannot be excluded. Considering the limited datasets available for arid regions, it is still impossible to determine a unique threshold for DF triggering. More attempts should focus on data collection in these regions and on carefully considering the spatiotemporal distribution of rainfall during the triggering storms. Hints towards the importance of the temporal rain distribution during a storm could already be found in Ben David-Novak et al. (2004), as their data showed that for both studied events the triggering cells reached the area only hours after a significant antecedent rainfall.
We speculate that antecedent rainfall or the flow of water in the steep channels caused by antecedent rainfall could reduce the sediment strength by wetting. The effects of pore pressure increase and the reduction in apparent cohesive strength most likely cause this strength reduction (Takahashi, 2014; Terzaghi, 1943). The strength reduction may be followed by enhanced incision or direct failure of the sediments within the channel. Such slope instability can initiate the DFs once the high intensities provided by a triggering cell cause a significant water flow at these channels. Shmilovitz et al. (2020) showed that the threshold for runoff flow on nearby desert slopes is 14–22 mm h−1 for a duration of 5 min. This threshold is met by all the four triggering cells that we consider the most likely trigger for the mapped DF deposits, but it is also met by many other storms among the ones we identify as possible candidates (Table 1). We hypothesize that, due to the lack of antecedent rainfall, no DFs were triggered by these cells. At the same time, however, flash floods could indeed have been generated, as frequently observed along the cliff during heavy storms (Belachsen et al., 2017).
5.2 Implications for debris flow occurrence in the region
The need for antecedent rainfall could also help explain the low incidence of DFs in the area. To date, only seven modern DF-triggering storms are reported in the study area: four events reported for the 10-year period between October 1987 and October 1997 (Ben David-Novak, 1998; Ben David-Novak et al., 2004) and three identified in the current study – roughly equivalent to one triggering storm every 2–3 years. Given the vast sediment availability, the rarity of DFs in the area is usually explained by the dry weather (i.e., low number of storms) and the small areal extent of the susceptible steep slopes: only convective cells hitting the small susceptible area can trigger a DF. However, while storms in the area are indeed not frequent, each storm usually brings numerous convective cells. Belachsen et al. (2017) identified 424 storms in the area in the period 1990–2014, about 20 per year, associated with over 10 000 convective cells, an average of over 24 cells per storm. Similarly, Marra and Morin (2018) showed that individual storms can bring even hundreds of high-intensity convective cells. With these numbers, it is more difficult to explain the rarity of DFs just using the reasoning above. Conversely, the here-suggested need for antecedent rainfall as a prerequisite for the triggering implies a need for an intense convective cell to hit an area where non-negligible precipitation already occurred during the same storm.
The need for antecedent rainfall as a critical triggering condition also in arid areas could facilitate the prediction of such events. Heavy rain intensity remains a key trigger of DFs, but the trajectory and intensity of convective cells cannot be forecasted with sufficient accuracy even with the most advanced weather models (e.g., see Rinat et al., 2021). In addition, the short distance between the debris sources and the vulnerable structures drastically reduces the effectiveness of warnings based on radar nowcasting (e.g., Sideris et al., 2020). Conversely, antecedent rainfall can be monitored more easily during the storm, for example using weather radar observations, and then used to highlight areas more susceptible to possible incoming convective cells. This information could be used to send targeted warnings to the relevant locations and structures at risk.
5.3 Limitations of this study
Our results are based on a relatively small sample of small-sized DFs detected in an arid region of the eastern Mediterranean. Although we extensively explored the region in Fig. 1, this inventory cannot be considered complete because DFs could have been missed due to noise in the lidar data or other data issues (e.g., see Sect. 4.3). In addition, weather radar uncertainties may affect the precipitation estimates (e.g., see Marra et al., 2022). One source of uncertainty in particular is worth mentioning: the possible advection of precipitation during its falling from the height of the radar sampling volume (about 3 km above the ground level) to the ground could lead to the misplacement of the radar estimates by a few hundreds of meters; this would typically lead to an underestimation of the rainfall amounts (Marra et al., 2016). In addition, it is important to recall that the adjustment of the radar data is based on only a few available stations: some level of uncertainty in the quantitative estimates is thus to be expected. While our qualitative results are robust with respect to these sources of error and support our reasoning in terms of process description and understanding, the numbers are subject to residual uncertainty, and caution is advised against their direct use in warning systems.
In this paper, we investigate the rainfall conditions leading to DFs on steep arid slopes, where the lack of DF observations and rainfall data still hinders our understanding of the typical triggering conditions. We use high-resolution topography and field surveys to map over 40 deposits that resulted from DFs in the arid region of the Dead Sea's western escarpment during 2013–2019. We then use high-resolution weather radar rainfall to pick the most likely triggering storms and estimates to investigate the rainfall conditions leading to the triggering of DFs in terms of peak intensity and rainfall amounts prior to the triggering convective cell.
The spatial and temporal analysis of the mapped deposits and of weather radar data over the triggering locations suggests that the 43 identified DFs were triggered by three storms that occurred during the spring of 2014 and the autumn of 2015. The mapped deposits were likely triggered by short convective cells which usually lasted less than 30 min and could show peak intensities lower than 30 mm h−1. These numbers are lower compared to previous studies based on two events in the area (> 30 mm h−1 for over 1 h). Comparing triggering and non-triggering storms, we suggest that antecedent rainfall during the hours to days prior to the triggering convective cells may play a critical role for DF triggering on steep arid slopes. We speculate that wetting of the slope sediments could reduce their strength and allow their massive drift during the channel flow caused by the main convective cell. Our hypothesis is supported by the observation of numerous convective cells with intensities similar to or greater than the triggering ones, but no DF signature appears in the topography even in susceptible locations, such as the location of DFs triggered by subsequent storms. In addition, our hypothesis could help explain the very low occurrence frequency of DFs in an area with high susceptibility and relatively frequent high-intensity convective cells. Our findings bring new information to our understanding of DF triggering in arid regions and could be included in regional-scale warning systems to help minimize the hazard potential of these events.
Rain gauge data were provided by IMS and can be requested from them at https://ims.gov.il/en/data_gov (last access: 6 March 2023). Corrected weather radar data were made available by the Hydrometeorology Lab at the Hebrew University of Jerusalem and cannot be directly shared by the authors; the data can be requested from the Hydrometeorology Lab at https://hydrometeorology-lab.huji.ac.il/book/contact-us (last access: 6 March 2023). Orthophotos are the product of the Survey of Israel and are available according to their policy. For further information, please contact the survey by email: tatsa@mapi.gov.il. Airborne lidar scans were ordered by the Geological Survey of Israel from Ofek Aerial Photography. The original scans cannot be shared online. Please contact the corresponding author for further information.
SST conducted mapping and fieldwork, data curation and formal analysis, and funding acquisition and wrote the original draft. FM was responsible for rainfall data curation and formal analysis. Both authors conceptualized the study and contributed to the writing – review and editing.
The contact author has declared that neither of the authors has any competing interests.
Publisher's note: Copernicus Publications remains neutral with regard to jurisdictional claims in published maps and institutional affiliations.
We thank Efrat Morin, Yehuda Enzel and Oded Katz for fruitful discussions and Moshe Armon for the synoptic classification of the storms. We also thank Yair Rinat, Hallel Lutsky and Jonathan Levy for their assistance in the fieldwork.
This research has been supported by the Geological Survey of Israel, Dead Sea project (no. 40832). Francesco Marra was supported by internal funds of the Institute of Atmospheric Sciences and Climate of the National Research Council of Italy (CNR-ISAC) and by the Cariparo Foundation through the Excellence Grant 2021 to the “Resilience” project.
This paper was edited by David J. Peres and reviewed by two anonymous referees.
Ahlborn, M., Armon, M., Ben Dor, Y., Neugebauer, I., Schwab, M. J., Tjallingii, R., Shoqeir, J. H., Morin, E., Enzel, Y., and Brauer, A.: Increased frequency of torrential rainstorms during a regional late Holocene eastern Mediterranean drought, Quaternary Res., 89, 425–431, https://doi.org/10.1017/qua.2018.9, 2018.
Aleotti, P.: A warning system for rainfall-induced shallow failures, Eng. Geol., 73, 247–265, https://doi.org/10.1016/j.enggeo.2004.01.007, 2004.
Armon, M., Dente, E., Smith, J. A., Enzel, Y., and Morin, E.: Synoptic-scale control over modern rainfall and flood patterns in the Levant drylands with implications for past climates, J. Hydrometeorol., 19, 1077–1096, https://doi.org/10.1175/JHM-D-18-0013.1, 2018.
Armon, M., Morin, E., and Enzel, Y.: Overview of modern atmospheric patterns controlling rainfall and floods into the Dead Sea: Implications for the lake's sedimentology and paleohydrology, Quaternary Sci. Rev., 216, 58–73, https://doi.org/10.1016/j.quascirev.2019.06.005, 2019.
Bartov, Y., Stein, M., Enzel, Y., Agnon, A., and Reches, Z.: Lake levels and sequence stratigraphy of Lake Lisan, the late Pleistocene precursor of the Dead Sea, Quaternary Res., 57, 9–21, https://doi.org/10.1006/qres.2001.2284, 2002.
Bartov, Y., Enzel, Y., Porat, N., and Stein, M.: Evolution of the Late Pleistocene–Holocene Dead Sea basin from sequence statigraphy of fan deltas and lake-level reconstruction, J. Sediment. Res., 77, 680–692, https://doi.org/10.2110/jsr.2007.070, 2007.
Begin, Z. B., Nathan, Y., and Ehrlich, A.: Stratigraphy and facies distribution in the Lisan Formation—new evidence from the area south of the Dead Sea, Israel, Israel J. Earth Sci., 29, 182–189, 1980.
Belachsen, I., Marra, F., Peleg, N., and Morin, E.: Convective rainfall in a dry climate: relations with synoptic systems and flash-flood generation in the Dead Sea region, Hydrol. Earth Syst. Sci., 21, 5165–5180, https://doi.org/10.5194/hess-21-5165-2017, 2017.
Blackwelder, E.: Mudflow as a geologic agent in semiarid mountains, Bull. Geol. Soc. Am., 39, 465–484, https://doi.org/10.1130/GSAB-39-465, 1928.
Ben David-Novak, H.: Modern and Holocene debris flows along the western escarpment of the Dead-Sea, The Hebrew University of Jerusalem, 129 pp., 1998 (in Hebrew).
Ben David-Novak, H., Morin, E., and Enzel, Y.: Modern extreme storms and the rainfall thresholds for initiating debris flow on the hyperarid western escarpment of the Dead Sea, Israel, Bull. Geol. Soc. Am., 116, 718–728, https://doi.org/10.1130/B25403.2, 2004.
Brand, E. W.: Slope instability in tropical areas, in: Proceedings of the 6th International Symposium on Landslides, 10–14 February 1992, Christchurch, New Zealand, A.A. Balkema, Rotterdam, 3, 2031–2051, 1992.
Caine, N.: The rainfall intensity-duration control of shallow landslides and debris flows., Geogr. Ann. A, 62, 23–27, https://doi.org/10.1080/04353676.1980.11879996, 1980.
Church, M. and Miles, M. J.: Meteorological antecedents to debris flow in southwestern British Columbia; some case studies, Rev. Eng. Geol., IVV, 63–80, 1987.
Coe, J. A., Glancy, P. A., and Whitney, J. W.: Volumetric analysis and hydrologic characterization of a modern debris flow near Yucca Mountain, Nevada, Geomorphology, 20, 11–28, https://doi.org/10.1016/s0169-555x(97)00008-1, 1997.
Corominas, J. and Moya, J.: Reconstructing recent landslide activity in relation to rainfall in the Llobregat River basin, Eastern Pyrenees, Spain, Geomorphology, 30, 79–93, https://doi.org/10.1016/S0169-555X(99)00046-X, 1999.
Costa, J. E.: Rheologic, geomorphic, and sedimentologic differentiation of water floods, hyperconcentrated flows, and debris flows, in: Flood Geomorphology, edited by: Baker, V. R., Kochel, R. C., and Patton P. C., Wiley, New York, 113–122, ISBN 0-471-62558-2, 1988.
Destro, E., Marra, F., Nikolopoulos, E. I., Zoccatelli, D., Creutin, J. D., and Borga, M.: Spatial estimation of debris flows-triggering rainfall and its dependence on rainfall return period, Geomorphology, 278, 269–279, https://doi.org/10.1016/j.geomorph.2016.11.019, 2017.
Dunkerley, D.: Rainfall intensity in geomorphology: Challenges and opportunities, Prog. Phys. Geog., 45, 488–513, https://doi.org/10.1177/0309133320967893, 2021.
Enzel, Y.: Holocene debris flows along the western escarpment of the Dead Sea basin, Earth Sciences Administration Report ES-53-2001, Israel Ministry of Infrastructure, 28 pp., 2001 (in Hebrew).
Frattini, P., Crosta, G., and Sosio, R.: Approaches for defining thresholds and return periods for rainfall-triggered shallow landslides, Hydrol. Process., 23, 1444–1460, https://doi.org/10.1002/hyp.7269, 2009.
Garfunkel, Z. and Ben-Avraham, Z.: The structure of the Dead Sea basin, Tectonophysics, 266, 155–176, 1996.
Garfunkel, Z., Zak, I., and Freund, R.: Active faulting in the dead sea rift, Tectonophysics, 80, 1–26, 1981.
Glade, T., Crozier, M., and Smith, P.: Applying probability determination to refine landslide-triggering rainfall thresholds using an empirical “Antecedent Daily Rainfall Model,” Pure Appl. Geophys., 157, 1059–1079, https://doi.org/10.1007/s000240050017, 2000.
Griffiths, P. G.: Frequency and initiation of debris flows in Grand Canyon, Arizona, J. Geophys. Res., 109, F04002, https://doi.org/10.1029/2003jf000077, 2004.
Guzzetti, F., Peruccacci, S., Rossi, M., and Stark, C. P.: The rainfall intensity-duration control of shallow landslides and debris flows: An update, Landslides, 5, 3–17, https://doi.org/10.1007/s10346-007-0112-1, 2008.
Haviv, I., Enzel, Y., Whipple, K. X., Zilberman, E., Stone, J., Matmon, A., and Fifield, L. K.: Amplified erosion above waterfalls and oversteepened bedrock reaches, J. Geophys. Res.-Earth, 111, F04004, https://doi.org/10.1029/2006JF000461, 2006.
Hochman, A., Marra, F., Messori, G., Pinto, J. G., Raveh-Rubin, S., Yosef, Y., and Zittis, G.: Extreme weather and societal impacts in the eastern Mediterranean, Earth Syst. Dynam., 13, 749–777, https://doi.org/10.5194/esd-13-749-2022, 2022.
Hungr, O., Evans, S. G., Bovis, M. J., and Hutchinson, J. N.: A review of the classification of landslides of the flow type, Environ. Eng. Geosci., 7, 221–238, https://doi.org/10.2113/gseegeosci.7.3.221, 2001.
Iverson, R. M.: The physics of debris flows, Rev. Geophys., 35, 245–296, https://doi.org/10.1029/97RG00426, 1997.
Iverson, R. M.: Landslide triggering by rain infiltration, Water Resour. Res., 36, 1897–1910, https://doi.org/10.1029/2000WR900090, 2000.
Kim, S. W., Chun, K. W., Kim, M., Catani, F., Choi, B., and Il Seo, J.: Effect of antecedent rainfall conditions and their variations on shallow landslide-triggering rainfall thresholds in South Korea, Landslides, 18, 569–582, https://doi.org/10.1007/s10346-020-01505-4, 2021.
Marra, F. and Morin, E.: Use of radar QPE for the derivation of Intensity-Duration-Frequency curves in a range of climatic regimes, J. Hydrol., 531, 427–440, https://doi.org/10.1016/j.jhydrol.2015.08.064, 2015.
Marra, F. and Morin, E.: Autocorrelation structure of convective rainfall in semiarid-arid climate derived from high-resolution X-Band radar estimates, Atmos. Res., 200, 126–138, https://doi.org/10.1016/j.atmosres.2017.09.020, 2018.
Marra, F., Nikolopoulos, E. I., Creutin, J. D., and Borga, M.: Radar rainfall estimation for the identification of debris-flow occurrence thresholds, J. Hydrol., 519, 1607–1619, https://doi.org/10.1016/j.jhydrol.2014.09.039, 2014.
Marra, F., Nikolopoulos, E. I., Creutin, J. D., and Borga, M.: Space–time organization of debris flows-triggering rainfall and its effect on the identification of the rainfall threshold relationship, J. Hydrol., 541, 246–255, https://doi.org/10.1016/j.jhydrol.2015.10.010, 2016.
Marra, F., Armon, M., and Morin, E.: Coastal and orographic effects on extreme precipitation revealed by weather radar observations, Hydrol. Earth Syst. Sci., 26, 1439–1458, https://doi.org/10.5194/hess-26-1439-2022, 2022.
Melis, T. S. and Webb, R. H.: Debris flows in Grand Canyon National Park, Arizona: magnitude, frequency and effects on the Colorado River, in: Proceedings – National Conference on Hydraulic Engineering, San Francisco, CA, USA, 25–30 July 1993, ASCE, 1290–1295, ISBN 0872629201, 1993.
Melis, T. S., Webb, R. H., Griffiths, P. G., and Wise, T. W.: Magnitude and frequency data for historic debris flows in Grand Canyon National Park and vicinity, Arizona, U.S. Geological Water-Resources Investigations Report 94-4214, 285 pp., https://doi.org/10.3133/wri944214, 1995.
Mor, U.: The geology of the Judean Desert in the area of Nahal Darga, MSc thesis, The Hebrew University of Jerusalem, 1987 (in Hebrew).
Moreiras, S. M. and Sepúlveda, S. A.: Landslides in Arid and Semi-Arid Environments, in: Treatise on Geomorphology, edited by: Shroder, J. F., Elsevier, 322–337, https://doi.org/10.1016/b978-0-12-818234-5.00105-x, 2022.
Morino, C., Conway, S. J., Balme, M. R., Hillier, J., Jordan, C., Sæmundsson, Þ., and Argles, T.: Debris-flow release processes investigated through the analysis of multi-temporal LiDAR datasets in north-western Iceland, Earth Surf. Proc. Land., 44, 144–159, https://doi.org/10.1002/esp.4488, 2019.
Mostbauer, K., Kaitna, R., Prenner, D., and Hrachowitz, M.: The temporally varying roles of rainfall, snowmelt and soil moisture for debris flow initiation in a snow-dominated system, Hydrol. Earth Syst. Sci., 22, 3493–3513, https://doi.org/10.5194/hess-22-3493-2018, 2018.
Nikolopoulos, E. I., Crema, S., Marchi, L., Marra, F., Guzzetti, F., and Borga, M.: Impact of uncertainty in rainfall estimation on the identification of rainfall thresholds for debris flow occurrence, Geomorphology, 221, 286–297, https://doi.org/10.1016/j.geomorph.2014.06.015, 2014.
Nikolopoulos, E. I., Borga, M., Creutin, J. D., and Marra, F.: Estimation of debris flow triggering rainfall: Influence of rain gauge density and interpolation methods, Geomorphology, 243, 40–50, https://doi.org/10.1016/j.geomorph.2015.04.028, 2015.
Peleg, N. and Morin, E.: Convective rain cells: Radar-derived spatiotemporal characteristics and synoptic patterns over the eastern Mediterranean, J. Geophys. Res., 117, D15116, https://doi.org/10.1029/2011JD017353, 2012.
Pierson, T.: Distinguishing between debris flows and floods from field evidence in small watersheds, U.S. Geological Survey, Report, 4, https://pubs.er.usgs.gov/publication/fs20043142 (last access: 6 March 2023), 2005.
Rahardjo, H., Li, X. W., Toll, D. G., and Leong, E. C.: The effect of antecedent rainfall on slope stability, Geotech. Geol. Eng., 19, 371–399, https://doi.org/10.1023/A:1013129725263, 2001.
Raz, E.: The geology of the Judean Desert, Ein Gedi area, GSI/S3/1983, Geological Survey of Israel, Jerusalem, 110 pp., 1983 (in Hebrew).
Rinat, Y., Marra, F., Armon, M., Metzger, A., Levi, Y., Khain, P., Vadislavsky, E., Rosensaft, M., and Morin, E.: Hydrometeorological analysis and forecasting of a 3 d flash-flood-triggering desert rainstorm, Nat. Hazards Earth Syst. Sci., 21, 917–939, https://doi.org/10.5194/nhess-21-917-2021, 2021.
Roth, I.: The geology Wadi el-Qilt area, MSc thesis, The Hebrew University of Jerusalem, 82 pp., 1969 (in Hebrew).
Sepúlveda, S. A., Rebolledo, S., and Vargas, G.: Recent catastrophic debris flows in Chile: Geological hazard, climatic relationships and human response, Quaternary Int., 158, 83–95, https://doi.org/10.1016/j.quaint.2006.05.031, 2006.
Sepúlveda, S. A., Rebolledo, S., McPhee, J., Lara, M., Cartes, M., Rubio, E., Silva, D., Correia, N., and Vásquez, J. P.: Catastrophic, rainfall-induced debris flows in Andean villages of Tarapacá, Atacama Desert, northern Chile, Landslides, 11, 481–491, https://doi.org/10.1007/s10346-014-0480-2, 2014.
Shmilovitz, Y., Morin, E., Rinat, Y., Haviv, I., Carmi, G., Mushkin, A., and Enzel, Y.: Linking frequency of rainstorms, runoff generation and sediment transport across hyperarid talus-pediment slopes, Earth Surf. Proc. Land., 45, 1644–1659, https://doi.org/10.1002/esp.4836, 2020.
Sideris, I. V, Foresti, L., Nerini, D., and Germann, U.: NowPrecip: localized precipitation nowcasting in the complex terrain of Switzerland, Q. J. Roy. Meteor. Soc., 146, 1768–1800, https://doi.org/10.1002/qj.3766, 2020.
Sneh, A.: Late Pleistocene fan-deltas along the Dead Sea Rift, Soc. Econ. Paleontol. Mineral. Spec. Publ., 49, 541–552, 1979.
Sneh, A., Bartov, Y., and Weissbrod, T.: Stratigraphic chart of exposed rock-units in Israel, in: Current Research – Geological Survey of Israel, vol. 12, edited by: Bogoch, R., Geological Survey of Israel, https://eurekamag.com/research/020/102/020102535.php (last access: 6 March 2023), 2000.
Stolle, A., Langer, M., Blöthe, J. H., and Korup, O.: On predicting debris flows in arid mountain belts, Global. Planet. Change, 126, 1–13, https://doi.org/10.1016/j.gloplacha.2014.12.005, 2015.
Takahashi, T.: Debris Flow: Mechanics, Prediction and Countermeasures, 2nd edn., CRC Press, 572 pp., ISBN 9781138073678, 2014.
Terzaghi, K.: Theoretical soil mechanics, J. Wiley and Sons, Inc., New York, 510 pp., https://doi.org/10.1002/9780470172766, 1943.
Tubi, A. and Dayan, U.: Tropical Plumes over the Middle East: Climatology and synoptic conditions, Atmos. Res., 145–146, 168–181, https://doi.org/10.1016/j.atmosres.2014.03.028, 2014.
Webb, R. H., Pringle, P. T., and Rink, G. R.: Debris Flows from Tributaries of the Colorado River, Grand Canyon National Park, Arizona, USGS, https://doi.org/10.3133/pp1492, 1989.
Wells, S. G. and Harvey, A. M.: Sedimentologic and geomorphic variations in storm-generated alluvial fans, Howgill Fells, northwest England., Geol. Soc. Am. Bull., 98, 182–198, https://doi.org/10.1130/0016-7606(1987)98<182:SAGVIS>2.0.CO;2, 1987.
Williams, R. D.: DEMs of Difference, Geomorphol. Tech., 2, 1–17, 2012.
Zoccatelli, D., Marra, F., Armon, M., Rinat, Y., Smith, J. A., and Morin, E.: Contrasting rainfall-runoff characteristics of floods in desert and Mediterranean basins, Hydrol. Earth Syst. Sci., 23, 2665–2678, https://doi.org/10.5194/hess-23-2665-2019, 2019.