the Creative Commons Attribution 4.0 License.
the Creative Commons Attribution 4.0 License.
 | 06 Mar 2023
Characterizing the evolution of mass flow properties and dynamics through analysis of seismic signals: insights from the 18 March 2007 Mt. Ruapehu lake-breakout lahar
Braden Walsh
Charline Lormand
Jon Procter
Glyn Williams-Jones
Monitoring for mass flows on volcanoes can be challenging due to the ever-changing landscape along the flow path, which can drastically transform the properties and dynamics of the flow. These changes to the flows require the need for detection strategies and risk assessments that are tailored not only between different volcanoes but at different distances along flow paths as well. Being able to understand how a flow event may transform in time and space along the channel is of utmost importance for hazard management. While visual observations and simple measuring devices in the past have shown how volcanic mass flows transform along the flow path, these same features for the most part have not been described using seismological methods. On 18 March 2007, Mt. Ruapehu produced the biggest lahar in Aotearoa / New Zealand in over 100 years. At 23:18 UTC the tephra dam holding the Crater Lake water back collapsed causing 1.3×10⁶ m3 of water to flow out and rush down the Whangaehu channel. We describe here the seismic signature of a lake-breakout lahar over the course of 83 km along the Whangaehu River system using three three-component broadband seismometers installed <10 m from the channel at 7.4, 28, and 83 km from the Crater Lake source. Examination of three-component seismic amplitudes, frequency content, and directionality, combined with video imagery and sediment concentration data, was carried out. The seismic data show the evolution of the lahar as it transformed from a highly turbulent out-burst flood (high peak frequency throughout), to a fully bulked-up multi-phase hyperconcentrated flow (varying frequency patterns depending on the lahar phase), to a slurry flow (bedload dominant). Estimated directionality ratios show the elongation of the lahar with distance down the channel, where each recording station depicts a similar pattern but for differing lengths of time. Furthermore, using directionality ratios shows extraordinary promise for lahar monitoring and detection systems where streamflow is present in the channel.
- Article
(10168 KB) - Full-text XML
-
Supplement
(1038 KB) - BibTeX
- EndNote


Volcanic mass flows (e.g., debris flows, pyroclastic density currents, debris avalanches, hyperconcentrated flows) are one of the greatest threats to communities, industry, recreation, etc. on and around volcanoes. Volcanic mass flows are particularly dangerous as they are fast-moving turbulent flows that can occur without any warning or an eruption transpiring (Capra et al., 2010). These flows can move a sizable amount of liquid and debris great distances which can critically impact locations hundreds of kilometers from the volcano or source. Lake breakout or outburst flood events can be particularly destructive because they tend to be larger and can cause long-lasting changes to the landscape and surrounding ecosystems (O'Connor et al., 2022; Procter et al., 2021). Furthermore, unlike eruption or rain-triggered mass flows, outburst floods have very little to no warning. Eruption triggered flows can be prepared for by the onset of the eruption and/or the monitoring of the volcano through various methods (e.g., seismology, infrasound, gravity, and gas and water chemistry). Likewise, for rain-induced flows, using techniques such as measuring the amount or intensity of rain (e.g., Capra et al., 2010, 2018) or by monitoring the amount of available material (e.g., Iguchi, 2019) can help forecast when an event may occur.
In Aotearoa / New Zealand, there have been numerous cases of large damaging mass flows in modern times. For example, in October 2012, a lake-breakout lahar originating from Te Maari, destroyed hiking trails and forestry, eventually flowing over 4.5 km to damage and block off Highway 46 (Procter et al., 2014; Walsh et al., 2016). Moreover, on 24 December 1953, the deadliest volcanic mass flow in Aotearoa / New Zealand history occurred, killing 151 people when a lahar struck a train crossing at the Tangiwai rail bridge, 39.8 km from the Crater Lake on top of Mt. Ruapehu (O'Shea, 1954). The ability to predict and investigate the changing dynamics and properties of large volcanic mass flows as they progress down channel is the first step in beginning to understand flow mechanisms better and ultimately address the hazards involved to mitigate the risk.
In order to better characterize and understand these flow events, many in situ applications and instruments have been used in the past (e.g., trip wires, stage gauge, load cells, pore pressure). While many of these tools can yield quick assessments and provide ample warning (e.g., current meters, trip wires), they can sometimes be at risk of false detections and equipment damage or loss, and/or they can lack the capability to evaluate multiple pulses or flow events (Arattano et al., 1999). Geophysical instruments (e.g., seismometers, geophones, infrasound) on the other hand can be installed at a safe distance away from the channel and have not only shown signs of being capable warning systems (e.g., Coviello et al., 2019), but of having the ability to accurately estimate flow properties (e.g., Arattano and Marchi, 2005; Doyle et al., 2010; Schimmel et al., 2021) as well as flow dynamics (e.g., Gimbert et al., 2014; Coviello et al., 2018; Walsh et al., 2020). However, in order to fully utilize these instruments, improved interpretation, comprehension, assessment, and universality is needed. One technique to increase the ability to predict, warn, and estimate the properties and dynamics of flow events is to use all three components of the seismic recording. Recently, several studies have shown that using all three components is effective in characterizing flow events (e.g., snow-slurry lahars, Cole et al., 2009; snow avalanches, Kogelnig et al., 2011; streamflow, Roth et al., 2016; landslides, Surinach et al., 2005; lahars, Walsh et al., 2020; rockfalls, Kuehnert et al., 2021; hyperconcentrated flows, Walsh et al., 2016). Using the horizontal components along with the vertical component can yield additional information about the flow that is not utilized if only the vertical component is used. Notably, directionality (cross-channel over channel-parallel) analysis (e.g., Doyle et al., 2010; Walsh et al., 2020) can provide information about the wetted perimeter, sediment concentration, and number of particle collisions. Furthermore, differing energies and frequency outputs from channel-parallel and channel-perpendicular signals can point to specific changes within the flow that can provide insights into the internal dynamics (Burtin et al., 2010; Roth et al., 2016).
1.1 Anatomy of lahars
When a lahar is created from a lake breakout or outburst flood event, the transition from flood or streamflow torrent depends on the erosivity of the channel and the supply of sediment being entrained within the flow (e.g., Scott, 1988; Doyle et al., 2011). An event may start as a highly turbulent low-sediment flow, then transform into a hyperconcentrated flow, and may even eventually “bulk up” to exhibit characteristics of a debris flow with the possibility of plug-like (limited internal motion and collisions) or laminar behavior (Scott, 1988, Pierson et al., 1990). At Mt. Ruapehu, the propagational differences of lahars down channel have been observed and characterized in the past (e.g., Cronin et al., 1996, 1999, 2000; Manville et al., 2000; Procter et al., 2010a; Lube et al., 2012). From these studies, models of how lahars bulk up and transition throughout the run-out distance have been postulated. For the lahars in the Whangaehu channel, Cronin et al. (1999) created three four-phase conceptual models based on source distances of 23.5, 42, and >55 km. The first two models are for lahar regimes, whereas the third model describes a lahar almost at its peak run-out distance. In each model, the first phase consists of a super charged streamflow pulse that flows ahead of the head of the flow and is considered the front of the lahar. This phenomenon has also been noted for debris flows interacting with streamflow (Arattano and Moia, 1999). Furthermore, discharge is maximum at the transition between phase 1 and phase 2 (Cronin et al., 1999) and is described as the head of the flow. Phase 2 is described as a mixing zone between streamflow and increasing sediment content, where the peak sediment concentration usually occurs at the end of phase 2 or at the beginning of phase 3 (e.g., Pierson and Scott, 1985). Cronin et al. (1999) defined phase 3 as the lahar body, which has the least amount of the original streamflow contained within. Phase 3 is also characterized by coarse sediment suspensions and is the most likely location for debris flow rheology. Finally, phase 4 is the tail of the lahar where debulking and dilution occurs transforming the lahar back into a hyperconcentrated, mixed, or streamflow.
1.2 18 March 2007 lake-breakout event
Mt. Ruapehu (2797 ) is the largest stratovolcano in the central North Island of Aotearoa / New Zealand (Fig. 1), which sits at the southwestern end of the Taupō Volcanic Zone (TVZ). The volcano has a volume of 110 km3, which is composed of several overlapping cone-building formations and surrounding ring plain volcaniclastics (Carrivick and Manville, 2009; Pardo et al., 2012). On top of the volcano, above the currently active vent sits a 1×10⁷ m3 acidic crater lake (Procter et al., 2010a). The Whangaehu channel is the preferred outlet for Crater Lake water and lahars in recent history (Procter et al., 2012, 2021). The Whangaehu channel is on the eastern flank of Mt. Ruapehu where it runs down across the volcanic ring plane and eventually heads southwest for ∼200 km reaching the Tasman Sea (Fig. 1).
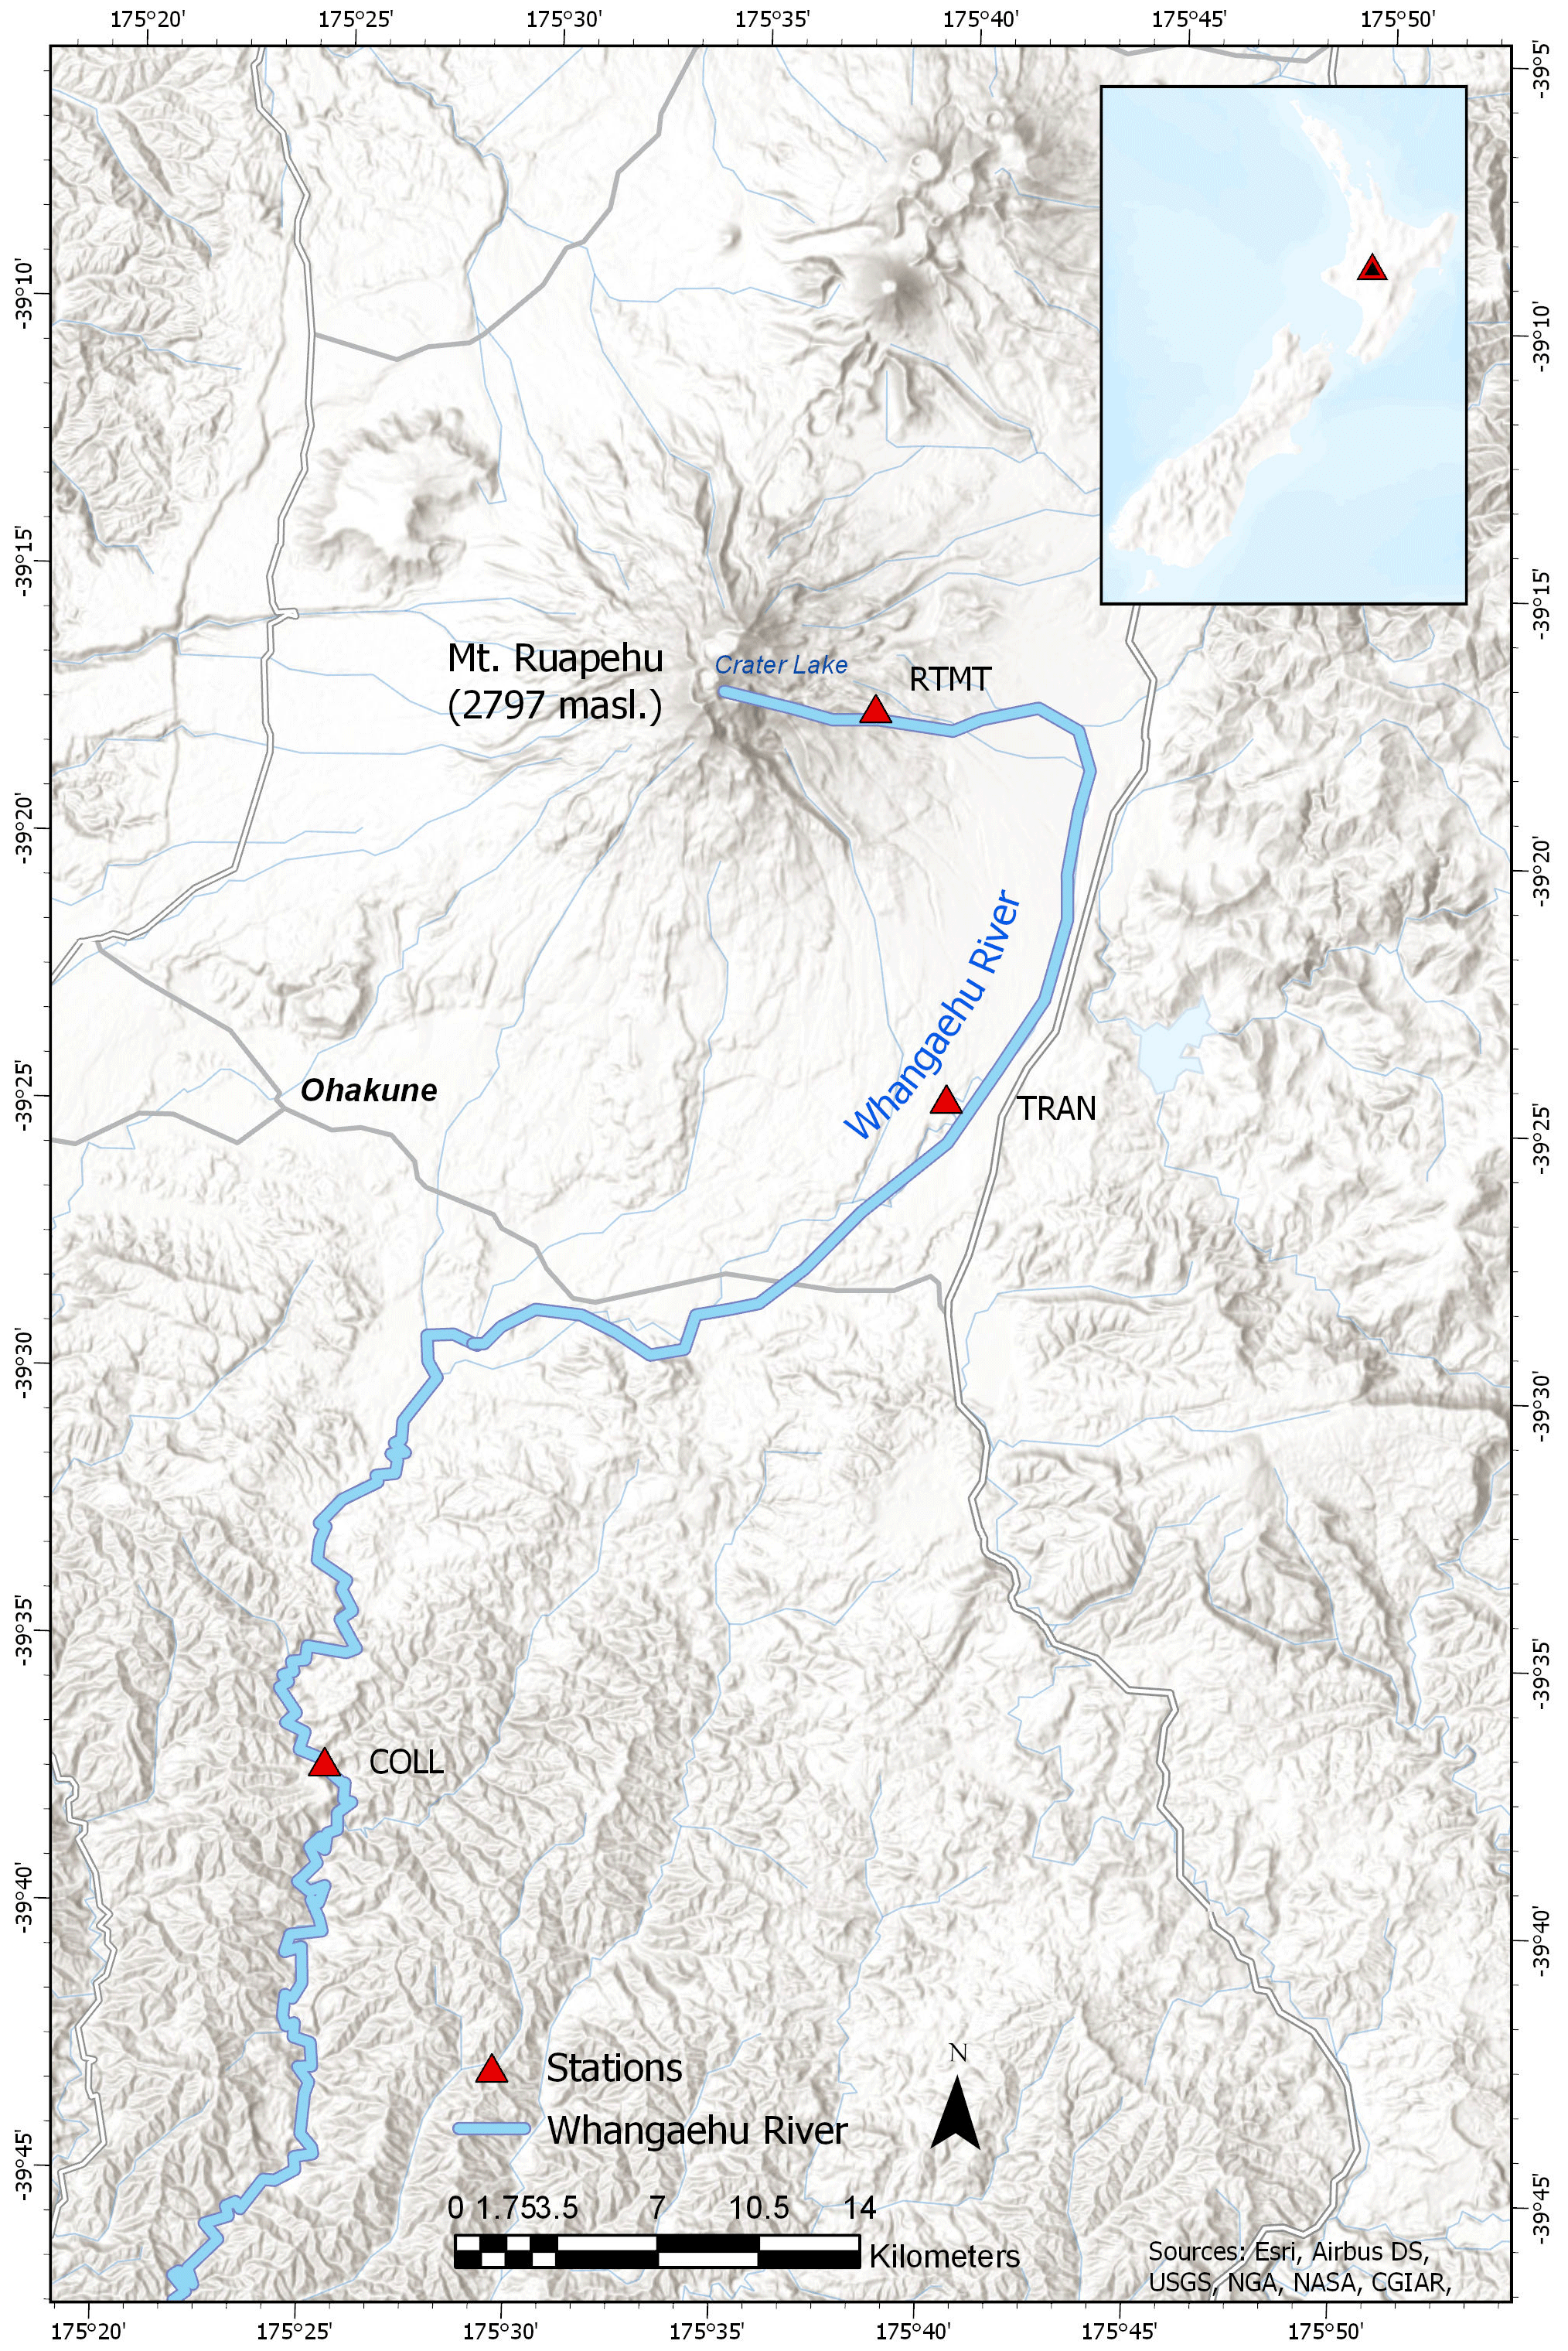
Figure 1Map of Mt. Ruapehu and the surrounding area located on the central North Island of Aotearoa / New Zealand. The blue outline represents the Whangaehu channel and the path the 18 March 2007 lahar traveled down. Red triangles denote the three monitoring stations along the Whangaehu channel at 7.4, 28, and 83 km.
Prior to the events that took place in the morning local time on 18 March 2007, a heavy rainstorm occurred accumulating about 256 mm of water over the 10 h prior to the dam breach that led to the outburst flood (Massey et al., 2010). The intense rain caused the Crater Lake level to rise an extra 6.4 m, which caused seepage and extra water to overtop the natural lava formation ledge and enter the Whangaehu channel (Carrivick and Manville, 2009). At ∼ 23:18 UTC, the tephra dam collapsed causing 1.3×10⁶ m3 of water to flow out of the lake and into the Whangaehu channel (Procter et al., 2010a). The dam was eroded and undercut in multiple stages resulting in a series of retrogressing landslides along with the main lahar.
Since the lahar was caused by lake-breakout dynamics and thus contained an abundance of water, the event was classified as a hyperconcentrated streamflow (Procter et al., 2010b). At ∼8.0 km from source, the lahar velocity was recorded at ∼9.5 m s−1 and had an estimated 6 m of downcutting, showing the capability of the lahar to deposit and erode massive amounts of material (Procter et al., 2010a, b). Furthermore, the 18 March 2007 lahar was one of the most thoroughly monitored lahars ever (Manville and Cronin 2007). In total there were 21 monitoring locations (only three of which had three-component seismometers) set up to measure various lahar properties (e.g., flow monitor, camera, stage height, flow sampling, pore pressure, seismic) along the channel (Keys and Green, 2008; Lube et al., 2012), with the lahar taking over 16 h to eventually travel out to the Aotearoa / New Zealand coast, ∼200 km from the original crater lake source.
Here, we delve into the properties of the 18 March 2007 lake-breakout hyperconcentrated streamflow that bulked up to a volume of m3 (Procter et al., 2010a) over the course of 83 km along the Whangaehu channel, originating from Mt. Ruapehu, Aotearoa / New Zealand. The combination of seismic analysis (frequency and directionality) with supplementary measurements (e.g., video, sediment concentration) shows how a lahar transforms over time and distance and how using these seismic techniques can help monitor the ever-changing dynamics and properties of a flow event. Furthermore, we examine previous models of the evolution of a lahar and compare the model with the seismic data available.
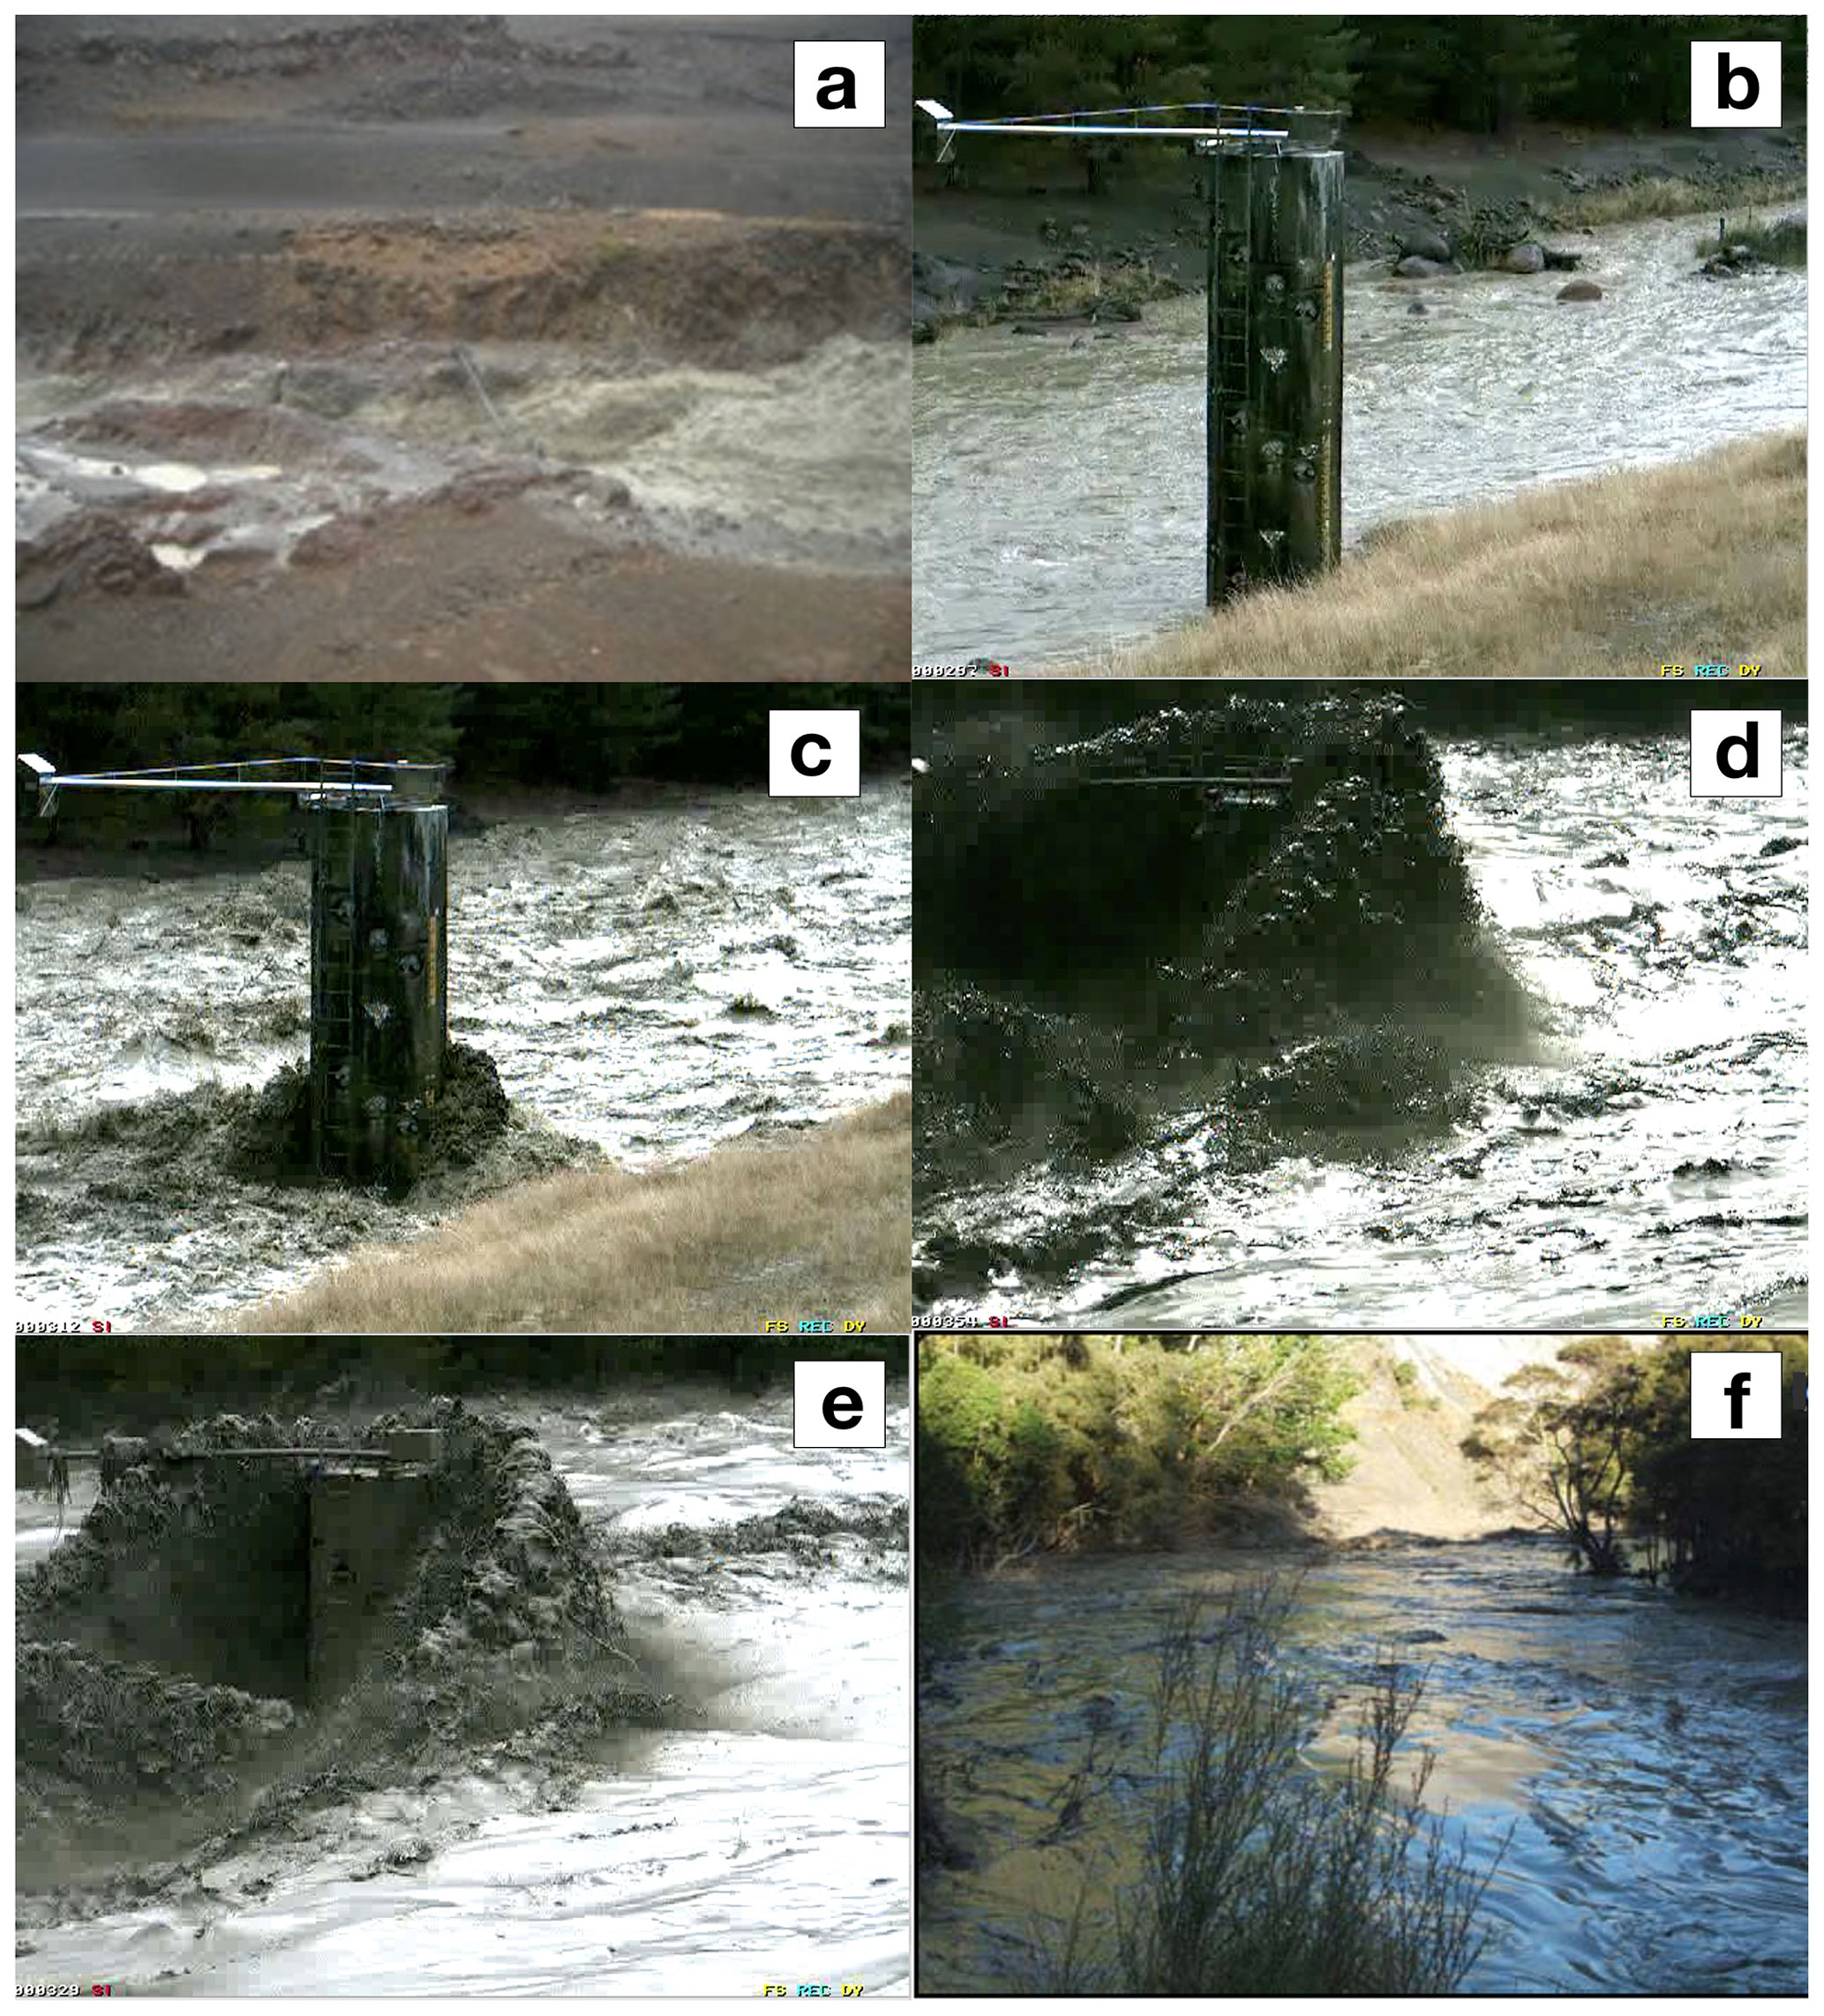
Figure 2Images from the 18 March 2007 lake break-out lahar from RTMT (a), TRAN (b–e), and COLL (f). Note the transformation of the lahar at TRAN from streamflow (b), increased discharge pre-lahar phase 1 pulse/flow front (bow wave) (c), head of the lahar (peak seismic amplitude) (d), and low PSF beginning of the lahar body (see Fig. 4 after 15 min mark) (e).
The seismic data for the 18 March 2007 lahar were recorded on three seismometers installed at various distances (7.4, 28, 83 km) along the Whangaehu channel (Fig. 1). The data from the three three-component broadband Guralp 6T sensors (COLL, RTMT, TRAN) were recorded using a sampling rate of 100 Hz and GPS time stamps (Walsh et al., 2022). For each site, the seismometer axes were installed to true north and the recorded data were rotated to align north as flow parallel (P) and east as the cross-channel direction (T). The seismic data were rotated to align with the channel in order to determine the differences in energy output between the cross-channel and flow-parallel directions (e.g., directionality). The monitoring station Round the Mountain Track (RTMT) was installed 4 m from the channel and 7.4 km downstream from the source of the lahar. The lahar arrived at RTMT at 23:36 UTC and had an average velocity of 9.3 m s−1 (Fig. 2a). The Trans Rail Gauge (TRAN) station was installed 28 km from source and 10 m from the channel, which also included a video camera that captured an image every 30 s. The lahar arrived at TRAN at 24:35 UTC and had an average velocity of 5.6 m s−1 (Fig. 2d). The Colliers Bridge (COLL) station was installed 10 m from the channel and 83 km from the source. The lahar arrived at COLL at 04:13 UTC and had an average velocity of 4.8 m s−1 (Fig. 2f). Arrival times are based off of images and eye witnesses at each of the monitoring stations. The flow velocity was estimated at RTMT and COLL from imagery and at TRAN from a flow meter. Sediment concentration at COLL was measured manually through dip buckets.
To examine the multi-component dynamics of the 18 March 2007 lake-breakout event along the Whangaehu channel at three monitoring locations, the data were corrected for instrument response and split into 10 s time windows. At each recording location, peak spectral frequency (PSF), root mean squared (rms) amplitude, and directionality ratios (DRs) are estimated for each of the 10 s time windows (Table S1 in the Supplement). At each monitoring station the first hour of the lahar including 5 min prior to the arrival is shown in all the results except when indicated.
3.1 Frequency analysis
In order to examine the PSFs for all three components at each site along the channel, we use the frequency recorded at the maximum amplitude of the frequency spectra for each 10 s running time window (i.e., non-overlapping windowed FFT). The PSF for RTMT (7.4 km from source) shows similar patterns between all three components (Fig. 3). The 5 min prior to the arrival of the front of the lahar is characterized by scattered PSFs between 20–40 Hz for the cross-channel (Fig. 3a) and parallel (Fig. 3b) directions, while in the vertical direction (Fig. 3c) the PSF is ∼30 Hz. When the front (streamflow pulse/bow wave) of the lahar arrives at the station, the PSF in all three components decreases to ∼ 5–10 Hz for about 1 min before increasing again to higher frequencies. After the head (peak seismic amplitude) of the lahar passes the station, the PSF in the cross-channel and parallel directions remain between 30 and 40 Hz for the rest of the recording window. In the vertical component, the PSF is scattered between 20 and 40 Hz for ∼15 min after the arrival of the head of the lahar and then becomes narrower, similar to both the cross-channel and parallel components with PSFs between 30 and 40 Hz.
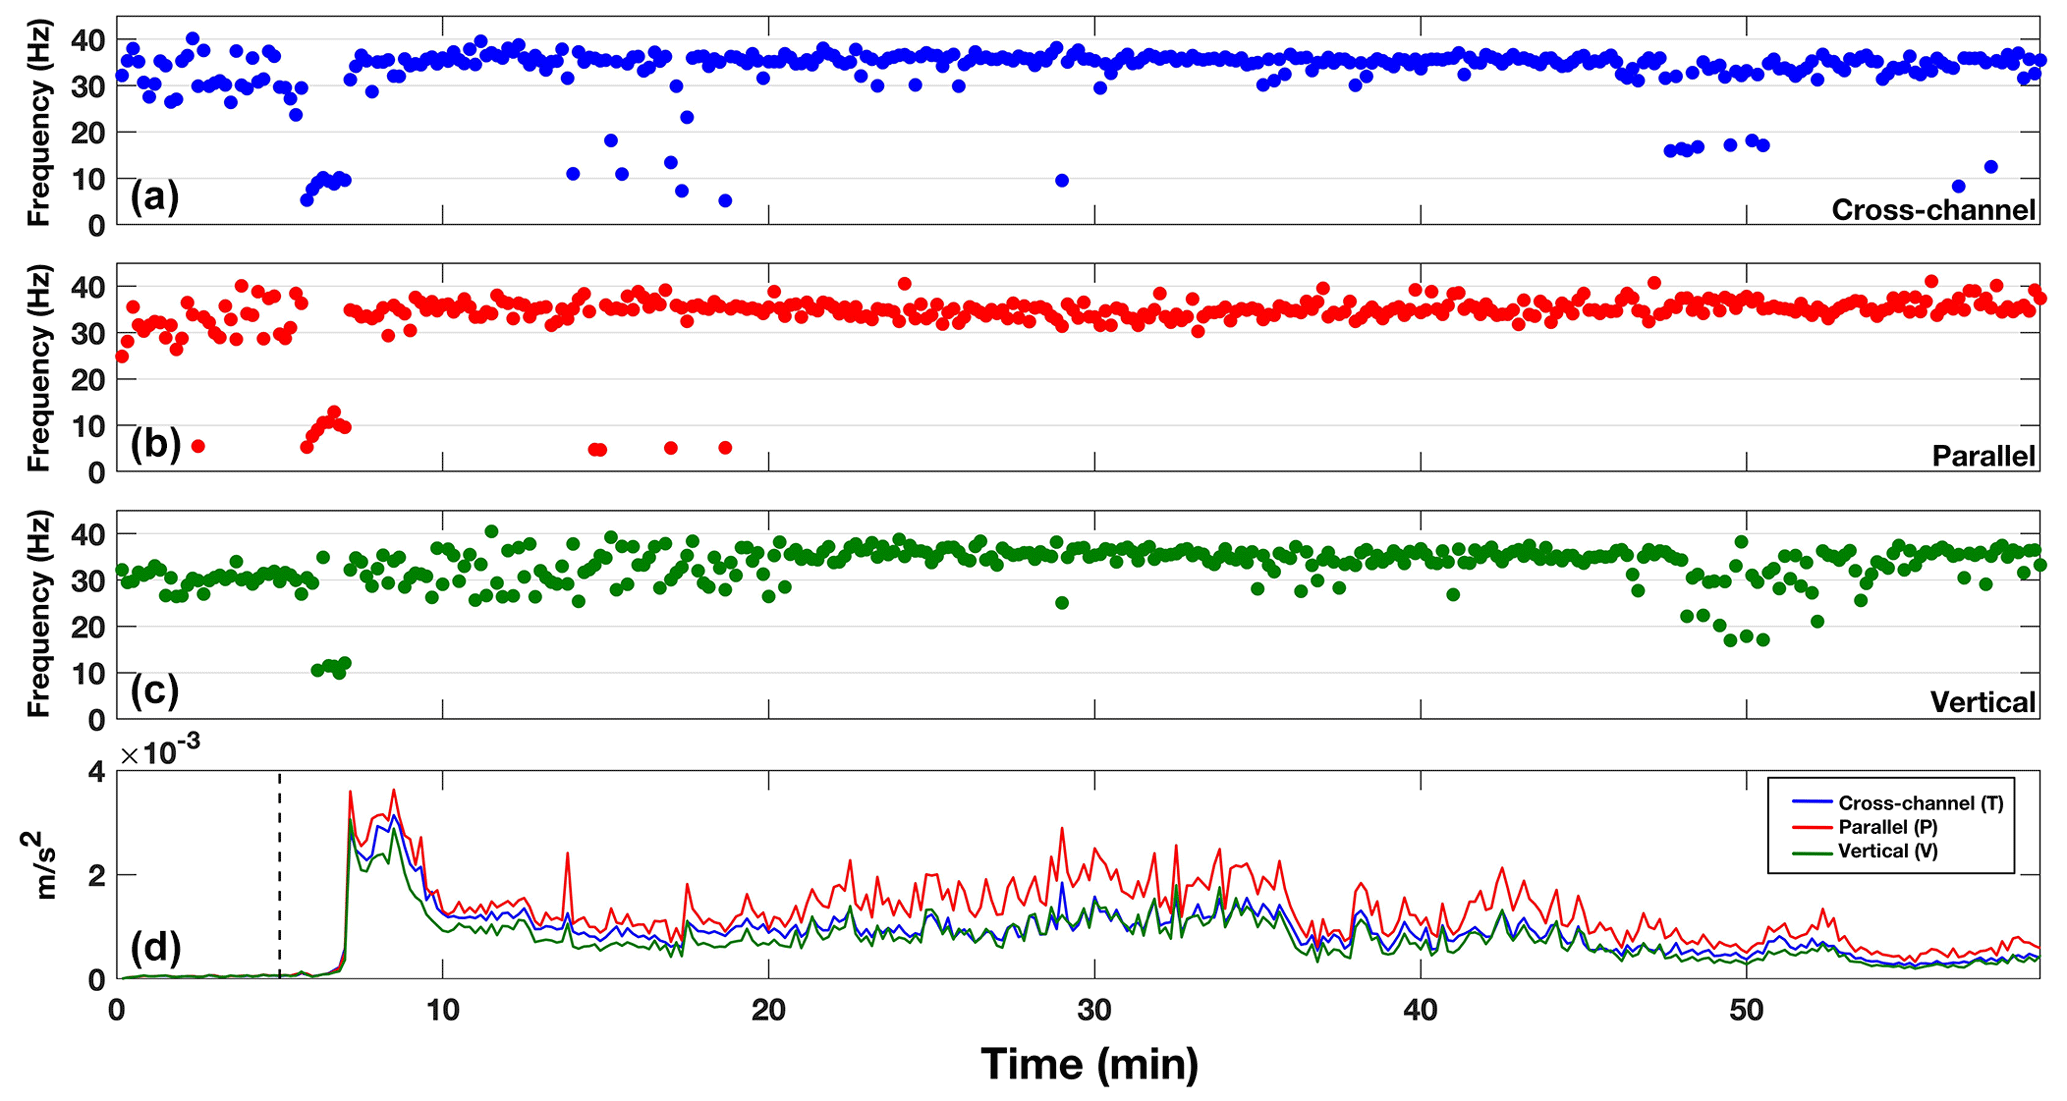
Figure 3Peak spectral frequencies for RTMT (7.4 km from source) for (a) cross-channel (blue), (b) flow-parallel (red), and (c) vertical (green) directions. Bottom row (d) depicts the rms amplitude of the lahar color coded to the same colors as the PSF. The dashed vertical line marks the timing of the lahar front passing the monitoring station. All PSFs and rms amplitudes were calculated using 10 s time windows.
Further down the channel at station TRAN (28 km from source), the PSFs for all three components show a similar overall pattern (Fig. 4). The pre-lahar PSF distribution in all three components is between 20 and 32 Hz. Like RTMT higher up the channel, the PSF for the front of the lahar at TRAN drops down to around 10 Hz, and when the lahar head arrives (∼10 min, Fig. 4) the PSF increases to ∼30 Hz for parallel (Fig. 4b) and cross-channel (Fig. 4a) directions and between 20 and 30 Hz in the vertical component (Fig. 4c). This decrease to lower frequencies before the head of the lahar at TRAN lasts for about 5 min. After the head of the lahar passes the recording station, the PSF content decreases for ∼ 15 min to 10–20 Hz for the parallel and cross-channel components and between 10 and 25 Hz for the vertical components. The PSF after the 30 min mark in Fig. 4 displays a bimodal pattern with frequencies between 10 and 35 Hz, with PSF time windows concentrating most at ∼30 Hz.
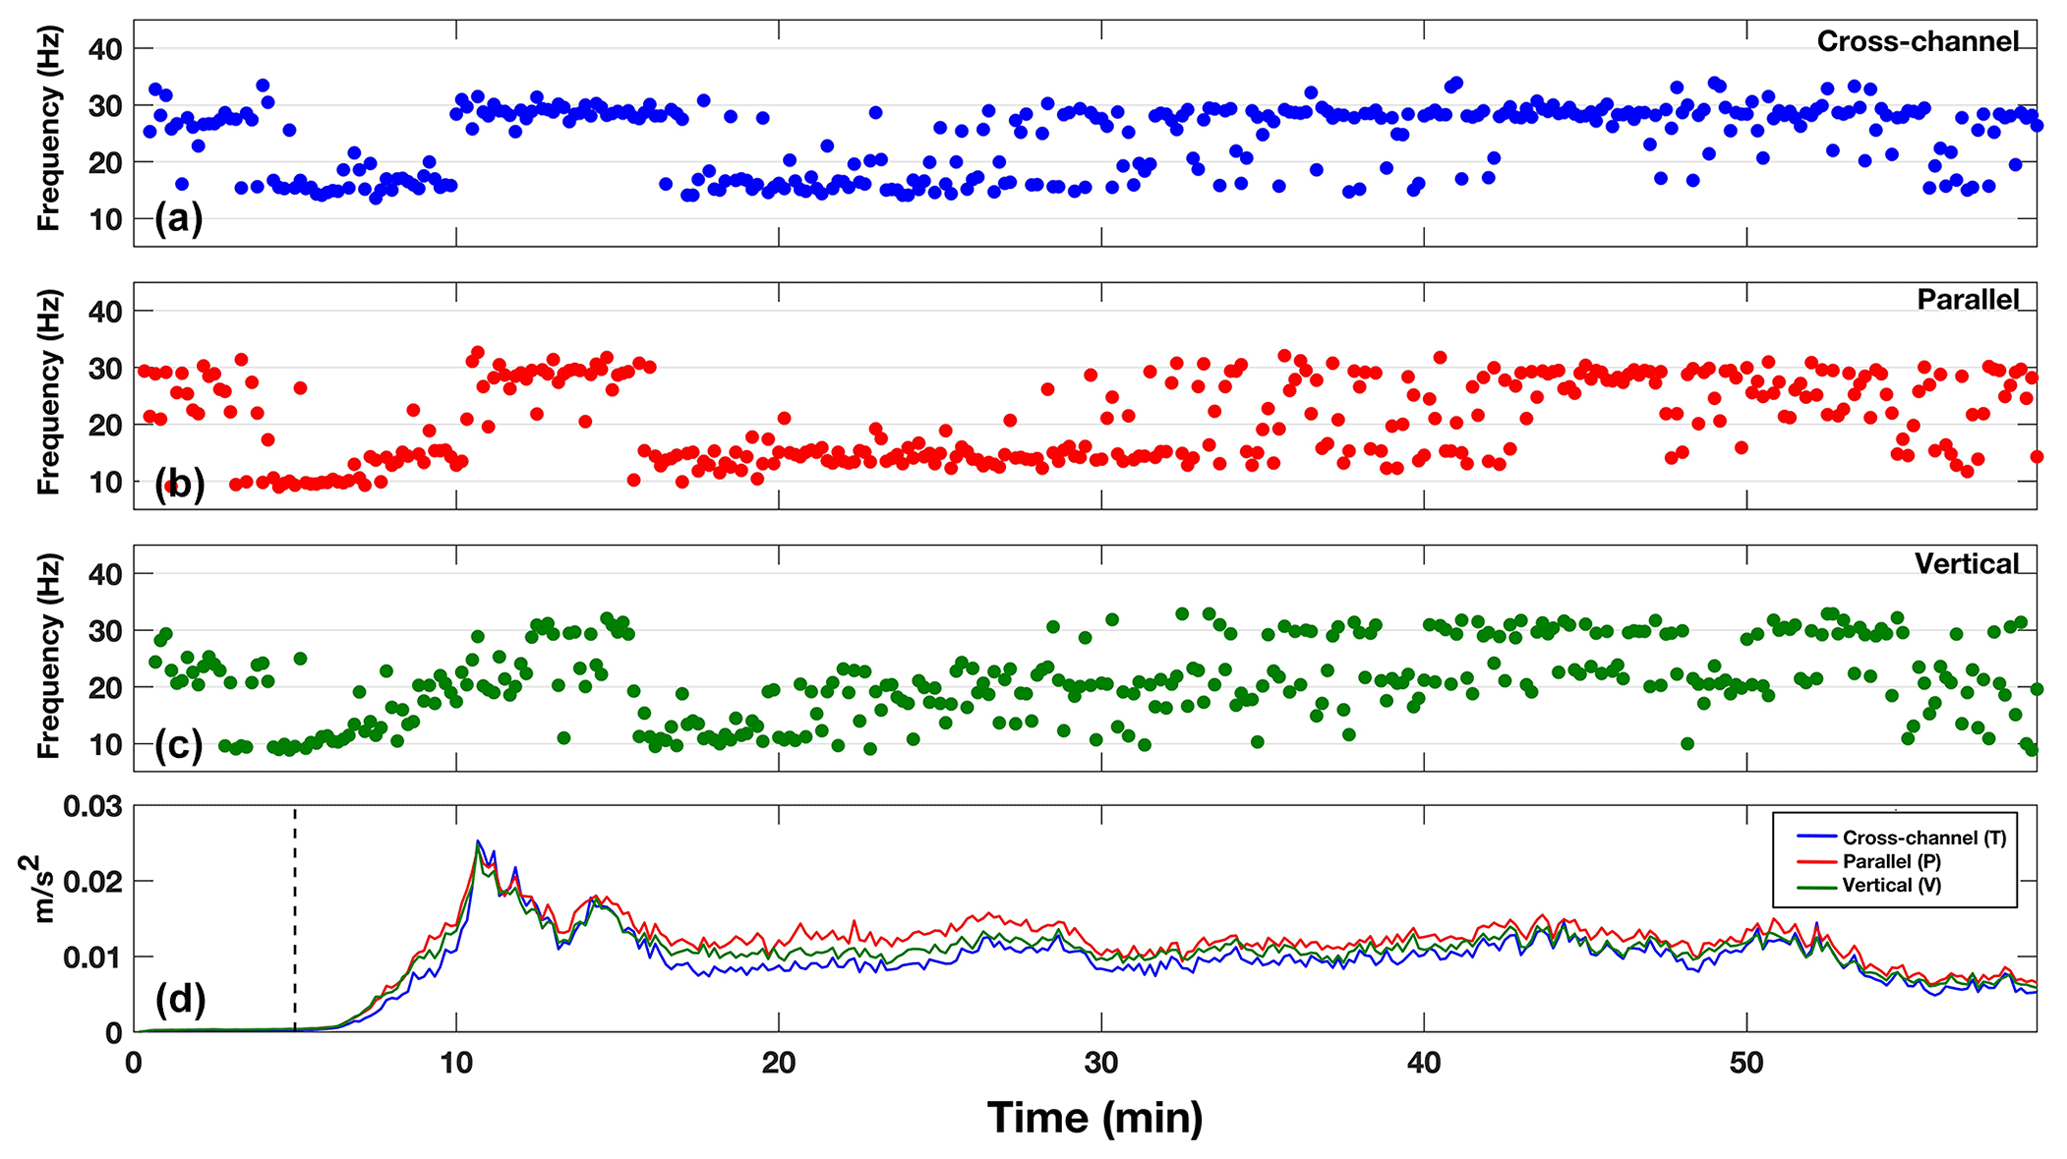
Figure 4Peak spectral frequencies for TRAN (28 km from source) for (a) cross-channel (blue), (b) flow-parallel (red), and (c) vertical (green) directions. Bottom row (d) depicts the rms amplitude of the lahar color coded to the same colors as the PSF. The dashed vertical line marks the timing of the lahar front passing the monitoring station. All PSFs and rms amplitudes were calculated using 10 s time windows.
At the COLL recording station (83 km from source), the PSF distribution shows differing patterns for all three components (Fig. 5). The PSF in the cross-channel direction (Fig. 5a) depicts a bimodal pattern throughout with a strong lower concentration of time windows at ∼18 Hz and a higher PSF at ∼25 Hz. For the parallel component (Fig. 5b), the pre-lahar signal has a wide PSF range between 12 and 30 Hz. When the lahar arrives, the PSF becomes concentrated at ∼22 Hz for ∼8 min before transforming into a bimodal pattern similar to that of the cross-channel PSF, with frequencies between 20 and 30 Hz. In the vertical component (Fig. 5c), the pre-lahar PSF is scattered between 22 and 30 Hz, then as the front of the lahar passes the station the PSF stabilizes around 28 Hz for about 12 min. When the lahar head arrives, the PSF again transitions to more of a scattered pattern during the highest energy stage of the lahar (Fig. 5, 25–40 min).
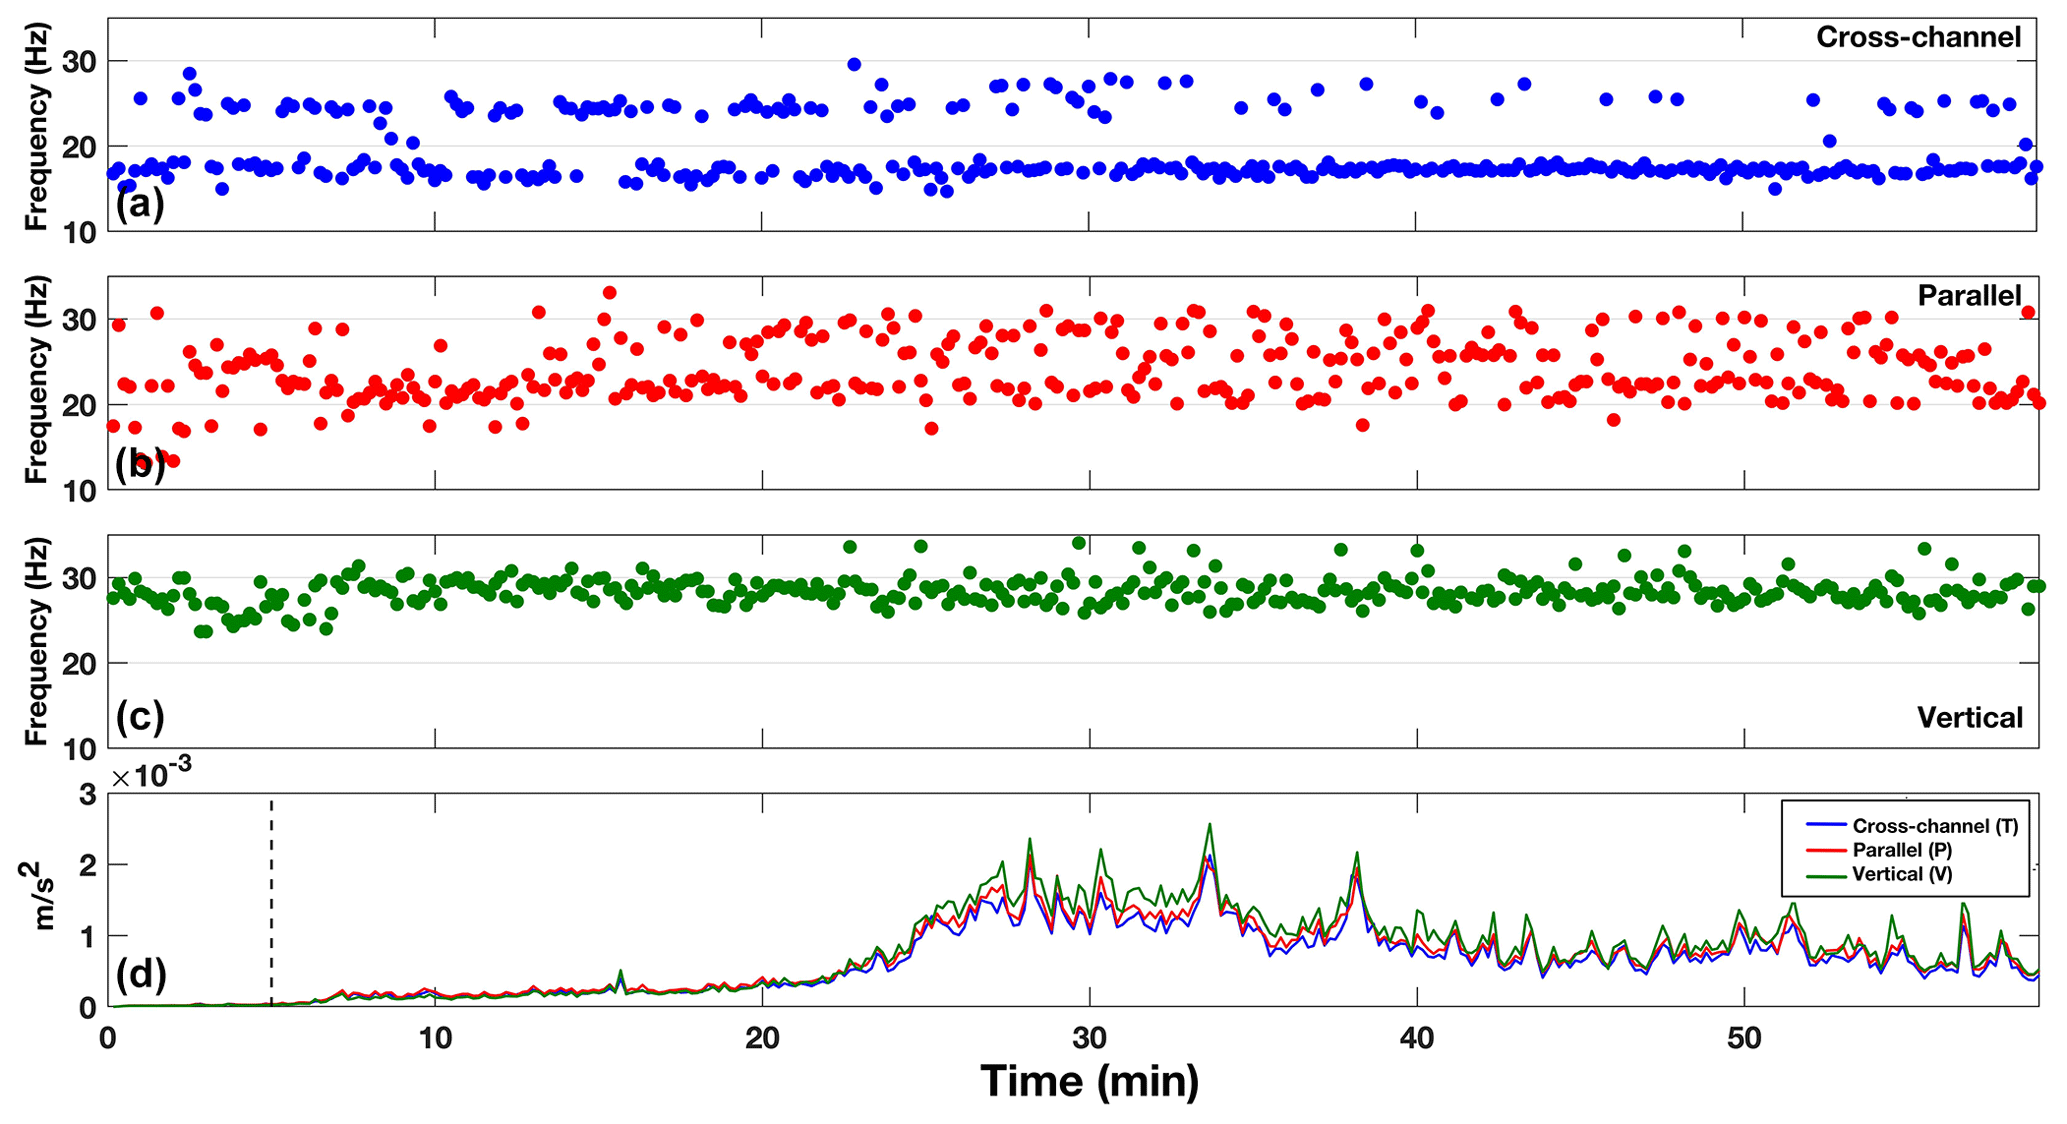
Figure 5Peak spectral frequencies for COLL (83 km from source) for (a) cross-channel (blue), (b) flow-parallel (red), and (c) vertical (green) directions. Bottom row (d) depicts the rms amplitude of the lahar color coded to the same colors as the PSF. The dashed vertical line marks the timing of the lahar front passing the monitoring station. All PSFs and rms amplitudes were calculated using 10 s time windows.
3.2 Directionality
When recording mass flows with three-component sensors, the directionality may be examined due to the sensor being able to record signals in the two horizontal directions. The directionality ratio allows for the determination of which horizontal component has stronger energy over the course of the recording window. This is possible because, in channel side deployments for mass flow monitoring systems, the sensor is either installed so that the north component is aligned to be parallel and the east component aligned as perpendicular to the flow, or the components are rotated during the data processing stage to align with the channel orientation. Furthermore, with the channel side installations, attenuational factors can mostly be ignored due to the close proximity to the channel and energy output of the flow event. The directionality ratio (DR) can be defined as the cross-channel amplitude divided by the flow-parallel amplitude. A DR > 1 indicates that the cross-channel amplitude is larger than that of the flow parallel, and vice versa for a DR <1. Directionality ratios have been used in the past to show rheology changes within flows, where the DR increases when streamflow transitions into a lahar (Walsh et al., 2020), and have been hypothesized to be an indicator for flow properties such as sediment concentration, wetted perimeter, and/or the number of particle collisions within a lahar (Doyle et al., 2010).
The directionality ratios estimated from 10 s non-overlapping running time windows of the rms amplitudes at each seismic station for the 18 March 2007 lake-breakout lahar are shown in Fig. 6. The DR for RTMT (Fig. 6a) displays a DR ≤1 (0.8–1.0) pre-lahar, then decreases (0.7–0.8) as the lahar arrives at the recording station (Fig. 6, dashed line), then as soon as the lahar head arrives, the DR increases to above DR =1 for ∼2 min. After the peak lahar flood pulse passes RTMT, the DR then proceeds to decrease below a DR =1 for the rest of the recording window. Similar to RTMT, the DR for TRAN starts out with a DR <1 (0.7–0.8) and as the lahar front passes, the DR similarly decreases to 0.6–0.7 before increasing to a DR >1 for ∼5 min when the lahar is at peak energy output starting at about the 10 min mark (Fig. 6d, red line). After the passing of the peak energy, the DR for TRAN decreases below 1 again for the remainder of the recording window. Further down the channel at COLL (Fig. 6c), the DR before the lahar arrives has a wide range of values between 0.8 and 1.2. When the front of the lahar passes (Fig. 6, dashed line), the DR stabilizes between 0.8 and 1, before increasing slightly when the peak energy of the lahar passes the monitoring site at about the 25 min mark.
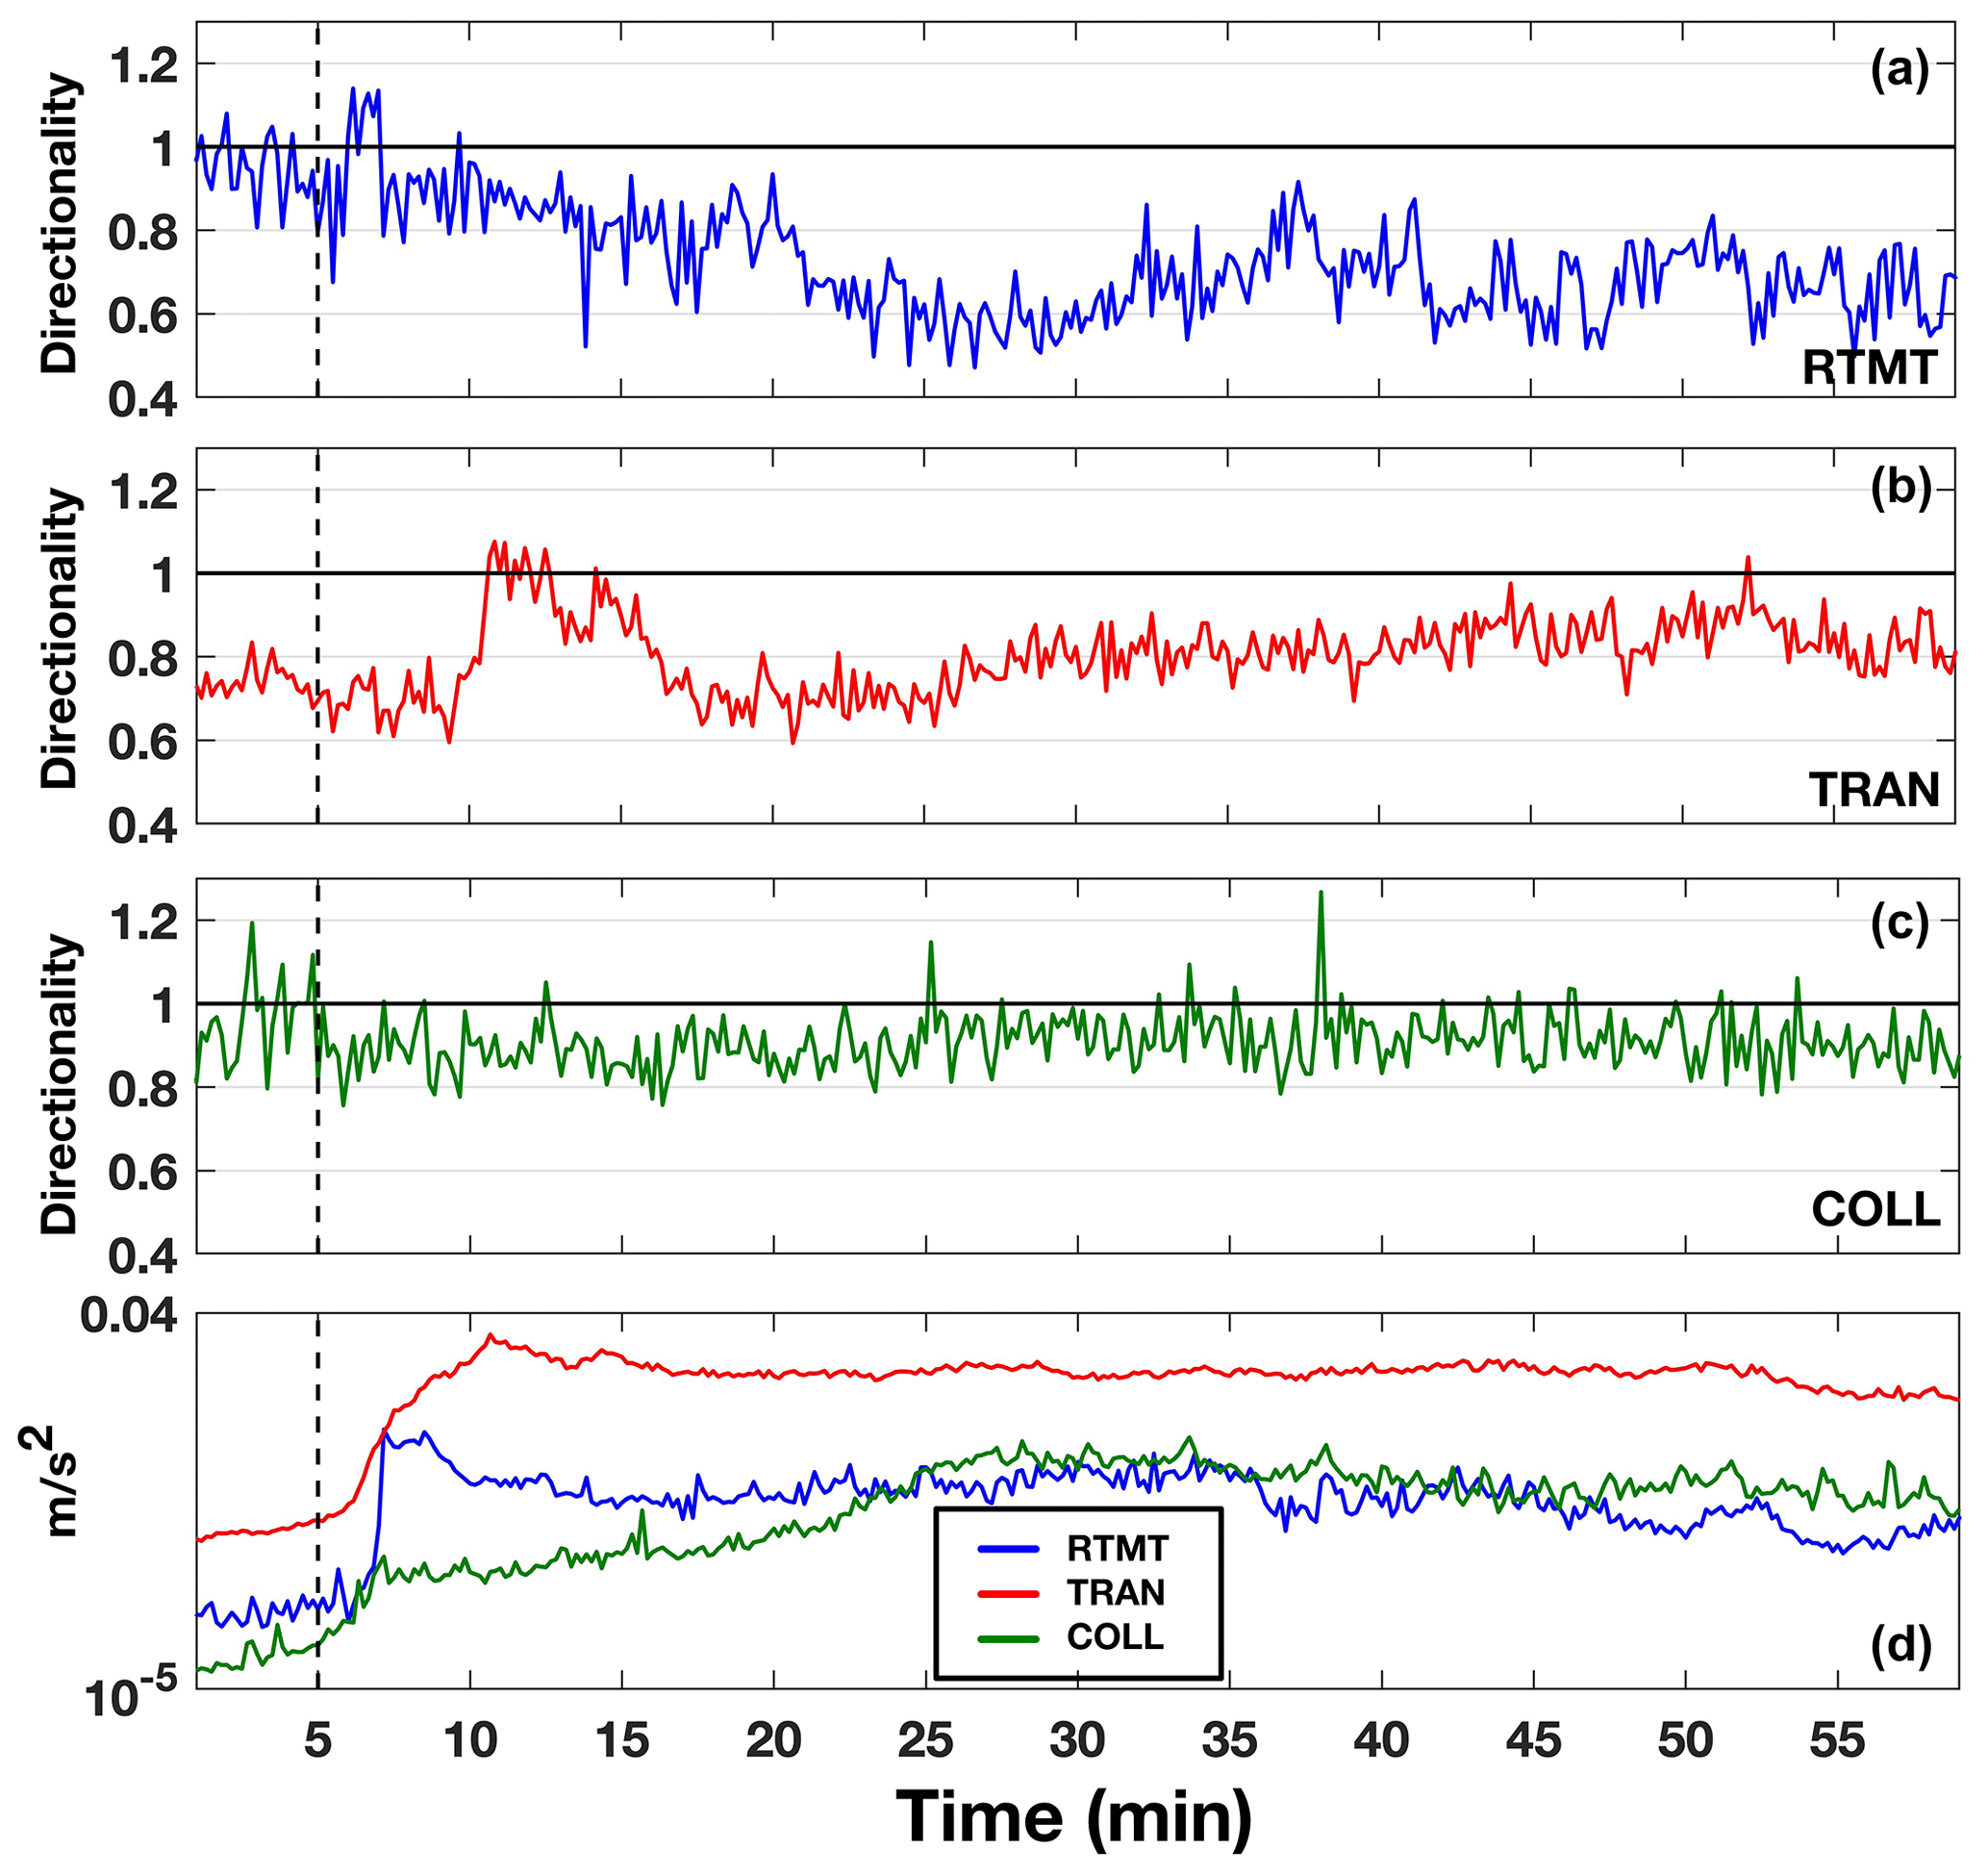
Figure 6Directionality ratio plots over time for RTMT (a), TRAN (b), and COLL (c). Vertical rms seismic signals for the three stations are plotted in panel (d), where blue is RTMT, red is TRAN, and green represents COLL. The dashed vertical lines mark the timing of the lahar front passing the monitoring station. All DRs and rms amplitudes were calculated using 10 s time windows.
4.1 Frequency constraints
In order to obtain an understanding of if PSFs are able to properly describe the lahar dynamics (i.e., the weight of the spectral amplitude at the PSF), frequency constraints must be analyzed. To complete this, normalized spectrograms along with spectral centroidal frequency (SCF) and spectral spreads are computed (e.g., Rubin et al., 2012; Saló et al., 2018). The normalized spectrograms are estimated by normalizing (using the maximum) the spectral amplitude for each 10 s time window of the lahar individually. By normalizing each time window, ranges of dominant frequencies can be visualized. SCFs are used because they represent the weighted average of the spectra and yield the location (i.e., frequency) of the center of the spectral mass. The SCF of each time window is estimated similar to that of Saló et al. (2018), in which
where f is the frequency and A(f) is the spectral amplitude associated with each frequency bin. The spectral spread measures the width of the spectral energy around the SCF (i.e., standard deviation), thus yielding information about the quality of the PSFs (e.g., Rubin et al., 2012; Giannakopoulos and Pikrakis, 2014; Saló et al., 2018). Spectral spread can be estimated by
The computed normalized spectrograms along with SCFs and spectral spreads for each of the three monitoring stations are shown in Fig. 7. For simplicity and comparison, only the flow-parallel data are shown. The normalized spectrograms for every station and component can be seen in Figs. S1–S3 in the Supplement, as well as the values in Table S1.
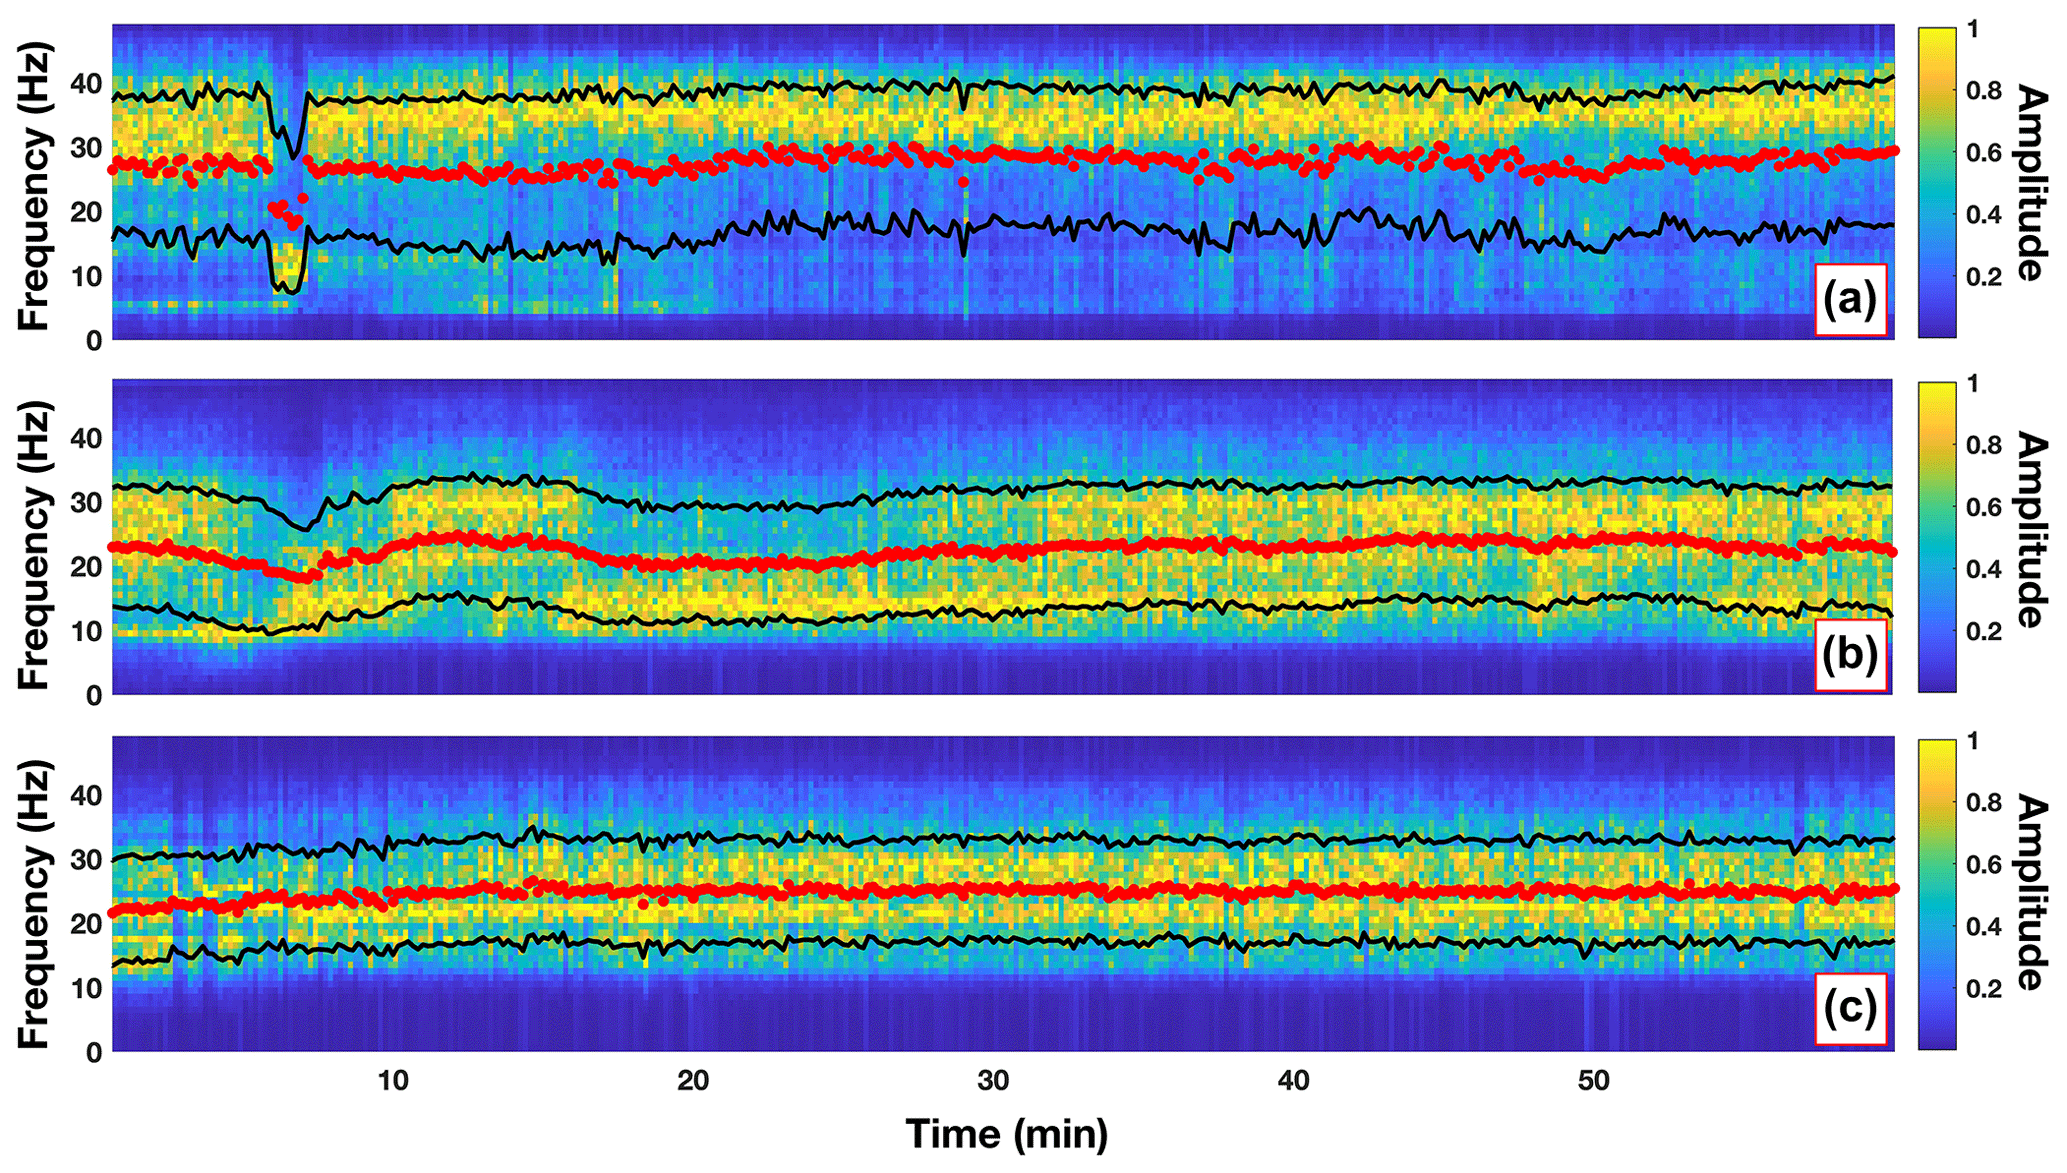
Figure 7Normalized spectrograms for the flow-parallel direction for each of the three monitoring sites along the Whangaehu channel. Red dots represent the spectral centroidal frequency, and black lines show the range of the spectral spread. Note that normalized spectrograms for the other directions can be seen in Figs. S1–S3.
The normalized spectrogram for RTMT (Fig. 7a) yields very similar results to that of the PSF (Fig. 3b), where most of the higher spectral amplitudes are at the same frequencies as those of the PSF. Notably, the low ∼10 Hz signal immediately before the arrival of the head of the lahar is not only seen in the dominant normalized spectra, but also through the decrease in SCF. Additionally, the PSFs at these time windows are contained within the spectral spread (Fig. 7a, black lines). For TRAN, the normalized spectrogram (Fig. 7b) is, again, very similar to the PSF in Fig. 4b. The SCF mirrors the pattern of the PSF with higher frequencies for the streamflow, a decrease for the front of the lahar, increase for the head of the lahar, decrease after the passing of the head, and finally a slight increase later in the lahar body. The normalized spectra yield this same pattern, with the late lahar body displaying the only time frame with increased spectral amplitude distributed throughout the spectral spread (Fig. 7b, after 30 min). This most likely explains the bimodal distribution of PSFs for TRAN in Fig. 4 after the ∼30 min mark. Continuing, the normalized spectrogram for COLL (Fig. 7c) also shows similarities to that of the PSFs in Fig. 5b. The PSFs for COLL range between ∼ 20 and 30 Hz with a slight bimodal pattern. This same pattern can be seen where the higher spectral amplitudes are located (Fig. 7c). Furthermore, the SCF for COLL splits the PSF range and stays at ∼25 Hz during the bimodal phase of the PSF. Overall, with the analysis of the normalized spectrograms, SCFs, and spectral spreads, we confirm that the use of PSFs to describe mass flow dynamics is concise for the 18 March 2007 lake-breakout lahar.
4.2 Evolution of lahar signals
4.2.1 Phase-1 evolution
A lahar propagating down channel can bulk up by collecting material from erosion or through the coalescing of multiple pulses to shorten the total length of the lahar (Procter et al., 2010b; Doyle et al., 2011). Lahars can also debulk by depositional means or by the natural elongation of the lahar as it progresses down channel (Doyle et al., 2011; Lube et al., 2012). Considering the 18 March 2007 lake-breakout lahar was a large pulse of water that only mixed with the existing streamflow and contained no juvenile material, examining the seismic signatures along the flow path can be used to characterize the evolution and transformation of a lake-breakout event from outburst flood to hyperconcentrated flow and beyond. At RTMT, the seismic signature is dominated by the flow-parallel direction (Fig. 3d) with >30 Hz PSF (Fig. 3b). The exception to this is the time frame immediately before the head of the lahar passes, when the PSF decreases to ∼10 Hz. This low-frequency signal can be seen also at TRAN (Fig. 4a–c) and in the flow-parallel direction at COLL (Fig. 5b). However, at COLL the PSF is ∼20 Hz instead of 10 Hz as recorded at RTMT and TRAN, most likely due to differing flow properties at 83 km from source. This low PSF before the head of the lahar arrives at each station probably represents the supercharged stream flow pulse (bow wave, Fig. 2c) that is pushed in front of the head of the lahar (i.e., phase 1; see Sect. 1.1) as described by Cronin et al. (1999), where they noticed these same pulses in front of lahar heads for three lahars on Mt. Ruapehu in 1995. Conversely, this frontal pulse could be from the uplift of streamflow from the faster moving underflow of the lahar (Manville et al., 2000). Furthermore, the low-frequency zone before the head of the flow lengthens as the lahar progresses downstream, suggesting that lahar elongation can also be seen in the seismic frequency domain (∼1 min at RTMT, ∼5 min at TRAN). The ∼10 Hz PSF may be explained by flow processes (e.g., frictional resistance of the flow by the channel, waves at free surface) (Schmandt et al., 2013; Barriere et al., 2015; Bartholomaus et al., 2015) and could be due to the flow at this stage being more sensitive to discharge (e.g., increase in shear velocity and/or flow depth) (Gimbert et al., 2014; Schmandt et al., 2017; Anthony et al., 2018) or, in the case of the underflow hypothesis, frictional sliding on the channel bed (Huang et al., 2004). The frontal surge or phase 1 of the lahar can be seen in the DR (Fig. 6) as well. For every station along the channel the DR has a slight drop when phase 1 passes the recording station (Fig. 6, dashed line). The elongation of phase 1 also has a correlation with distance from source, where the dip in the DR lasts for only ∼1 min at RTMT, ∼5 min at TRAN, and approximately 20 min at COLL. The reason the DR decreases during phase 1 for the 2007 lahar could be due to the parallel component being more sensitive to flow processes than bedload forces (Barriere et al., 2015; Roth et al., 2016). During phase 1, discharge increases, sediment concentration is low (Cronin et al., 1999), and streamflow dominates resulting in a low DR (e.g., Doyle et al., 2010). The low DR can also be seen before the arrival of phase 1 due to streamflow already occurring in the channel. The higher flow-parallel amplitude over cross-channel amplitude for streamflow has also been noted in the past for lahars at Volcán de Colima, Mexico (Walsh et al., 2020).
4.2.2 Phase-2 evolution
Following the low PSF phase 1 (i.e., front of the lahar), the peak seismic amplitude occurs (flow head). The peak seismic amplitude for RTMT (Fig. 3d) is accompanied by an increase to higher PSFs >30 Hz (Figs. 3a–c and 7a). PSFs >30 Hz have been shown in the past to either be dominated by turbulence or bedload transport (e.g., Gimbert et al., 2014; Roth et al., 2016). The 2007 lake-breakout lahar has been described as a hyperconcentrated streamflow (e.g., Procter et al., 2010b) with low sediment concentration, especially early on before the lake water captured enough material to bulk up and transform. At RTMT, which was only 7.4 km from source, the lahar had not fully bulked up yet and was in a net depositional regime (Procter et al., 2010a). Due to the conditions of the lahar at RTMT (e.g., Fig. 2a), we surmise the higher PSF content for the peak seismic amplitude is dominated by turbulent-flow-induced noise. Furthermore, the higher PSF content at RTMT (>30 Hz) compared to TRAN and COLL (∼30 Hz) could be due to the angle of the slope at the recording stations. Gimbert et al. (2014) noted that turbulence noise will dominate over bedload-induced noise on steeper slopes due to an increase in shear velocity. If we use the average flow velocities as a comparison, the lahar at RTMT (9.3 m s−1) flowed faster than at the other two stations (TRAN, 5.6 m s−1; COLL, 4.8 m s−1). Further down the channel at TRAN, the PSF for the peak seismic amplitude is ∼ 30 Hz for all three components (Fig. 4a–c, Table S1). Again, this high PSF may be attributed to turbulence, as seen by the images taken at TRAN (Fig. 2d). The difference at TRAN is the duration of the higher PSF, where at RTMT the high PSF stays throughout the entirety of the recording window, at TRAN the high PSF only lasts for ∼5 min (Fig. 4a–c, ∼ 11–16 min). The difference at TRAN could be from the evolution of the lahar. By the time the lahar reached the monitoring station at TRAN (28 km from source), the lahar was bulked up and had fully developed four phases as described by Scott (1988) or Cronin et al. (1999) (Fig. 2c–e; see Sect. 4.2.3). By time the lahar reached COLL 82 km from source (Fig. 5), the peak seismic amplitude was associated with PSFs between 15 and 30 Hz, with bimodal patterns in the horizontal components and a tighter spread in the vertical component (∼ 27–29 Hz). At COLL, the lahar had converted into a plug-like flow with lower turbulence, and hence the higher PSFs are most likely associated with bedload transport (Fig. 2f). Furthermore, Burtin et al. (2010) and Roth et al. (2016) noted that when the vertical component has greater seismic amplitudes than the horizontal components, bedload dominates. This same amplitude feature can be seen at COLL (Fig. 5d, past ∼25 min), where the vertical energy is greater than each of the horizontal components. The bimodal frequency pattern of the horizontal components (Fig. 5a and b) is likely from the recording of both water-flow noise (lower PSF) and bedload transport (higher PSF). This also explains why the vertical component does not show the same bimodal frequency pattern. Barriere et al. (2015) described the parallel component as being more sensitive to flow properties (e.g., discharge, depth, shear velocity), and Doyle et al. (2010) noted that the cross-channel component is likely dominated by the amount of turbulence (e.g., water and particles acting on the channel walls), thus the reasoning behind the differing PSF patterns between components. This PSF feature is similar to the lahars recorded by Walsh et al. (2020), where the cross-channel PSF is confined within a narrow band of around 15–20 Hz and the flow-parallel PSF is more bimodal (10–40 Hz). At COLL, the cross-channel PSF (Fig. 5a) is dominated by PSFs at ∼18 Hz (lower than vertical component at ∼28 Hz, Fig. 5c), with the flow parallel between 20 and 30 Hz (Fig. 5b).
The DR at the peak seismic amplitude for all three recording stations increases (Fig. 6). The DR for both RTMT and TRAN increases to DR >1. Doyle et al. (2010) noted that higher wetted perimeters will increase the DR, which can be seen at TRAN for the 18 March 2007 lake-breakout lahar (Figs. 2d and 6 peak DR and/or rms amplitude). Conversely, the DR decreases after the peak seismic amplitude, while the wetted perimeter is still high (Fig. 2d and e). While the wetted perimeter may be a factor in increasing cross-channel energy and thus the DR, the more likely explanation for the 18 March 2007 lahar might be the higher level of particle collisions and turbulence at the peak seismic amplitude. More turbulent particle collisions would increase the DR (e.g., Doyle et al., 2010) due to more lateral excitation within the flow and against the channel walls increasing the cross-channel signal. The increase in collisional energy also relates well with the PSF, as higher PSF correlates to an increase in the number of interflow collisions as shown by Huang et al. (2004), and may also explain the slight increase in DR overall when the PSF increases (Fig. 8a). The DR for COLL (Fig. 6c) during this same time frame probably is not due to the number of particle collisions due to the plug-like flow (Fig. 2f), but rather the increase in sediment concentration (Fig. 8c). As the sediment concentration increases at COLL the DR starts to increase as well (Fig. 8b). Similar to Doyle et al. (2010), COLL yields a correlation between DR and sediment concentration (R2=0.95, Fig. 8b), where higher DRs indicate higher concentrations of sediment contained in the flow. Lastly, as noted above, DRs may correlate with PSF or at least indicate differing processes taking place within the flow (Fig. 8a). Lower PSF would produce lower DRs because low PSFs are more sensitive to water-flow processes (hence higher parallel energy), whereas higher PSFs would produce higher DRs due to higher PSFs being dominated by sediment, particle collisions, and turbulence (higher cross-channel energy) (Fig. 8a).
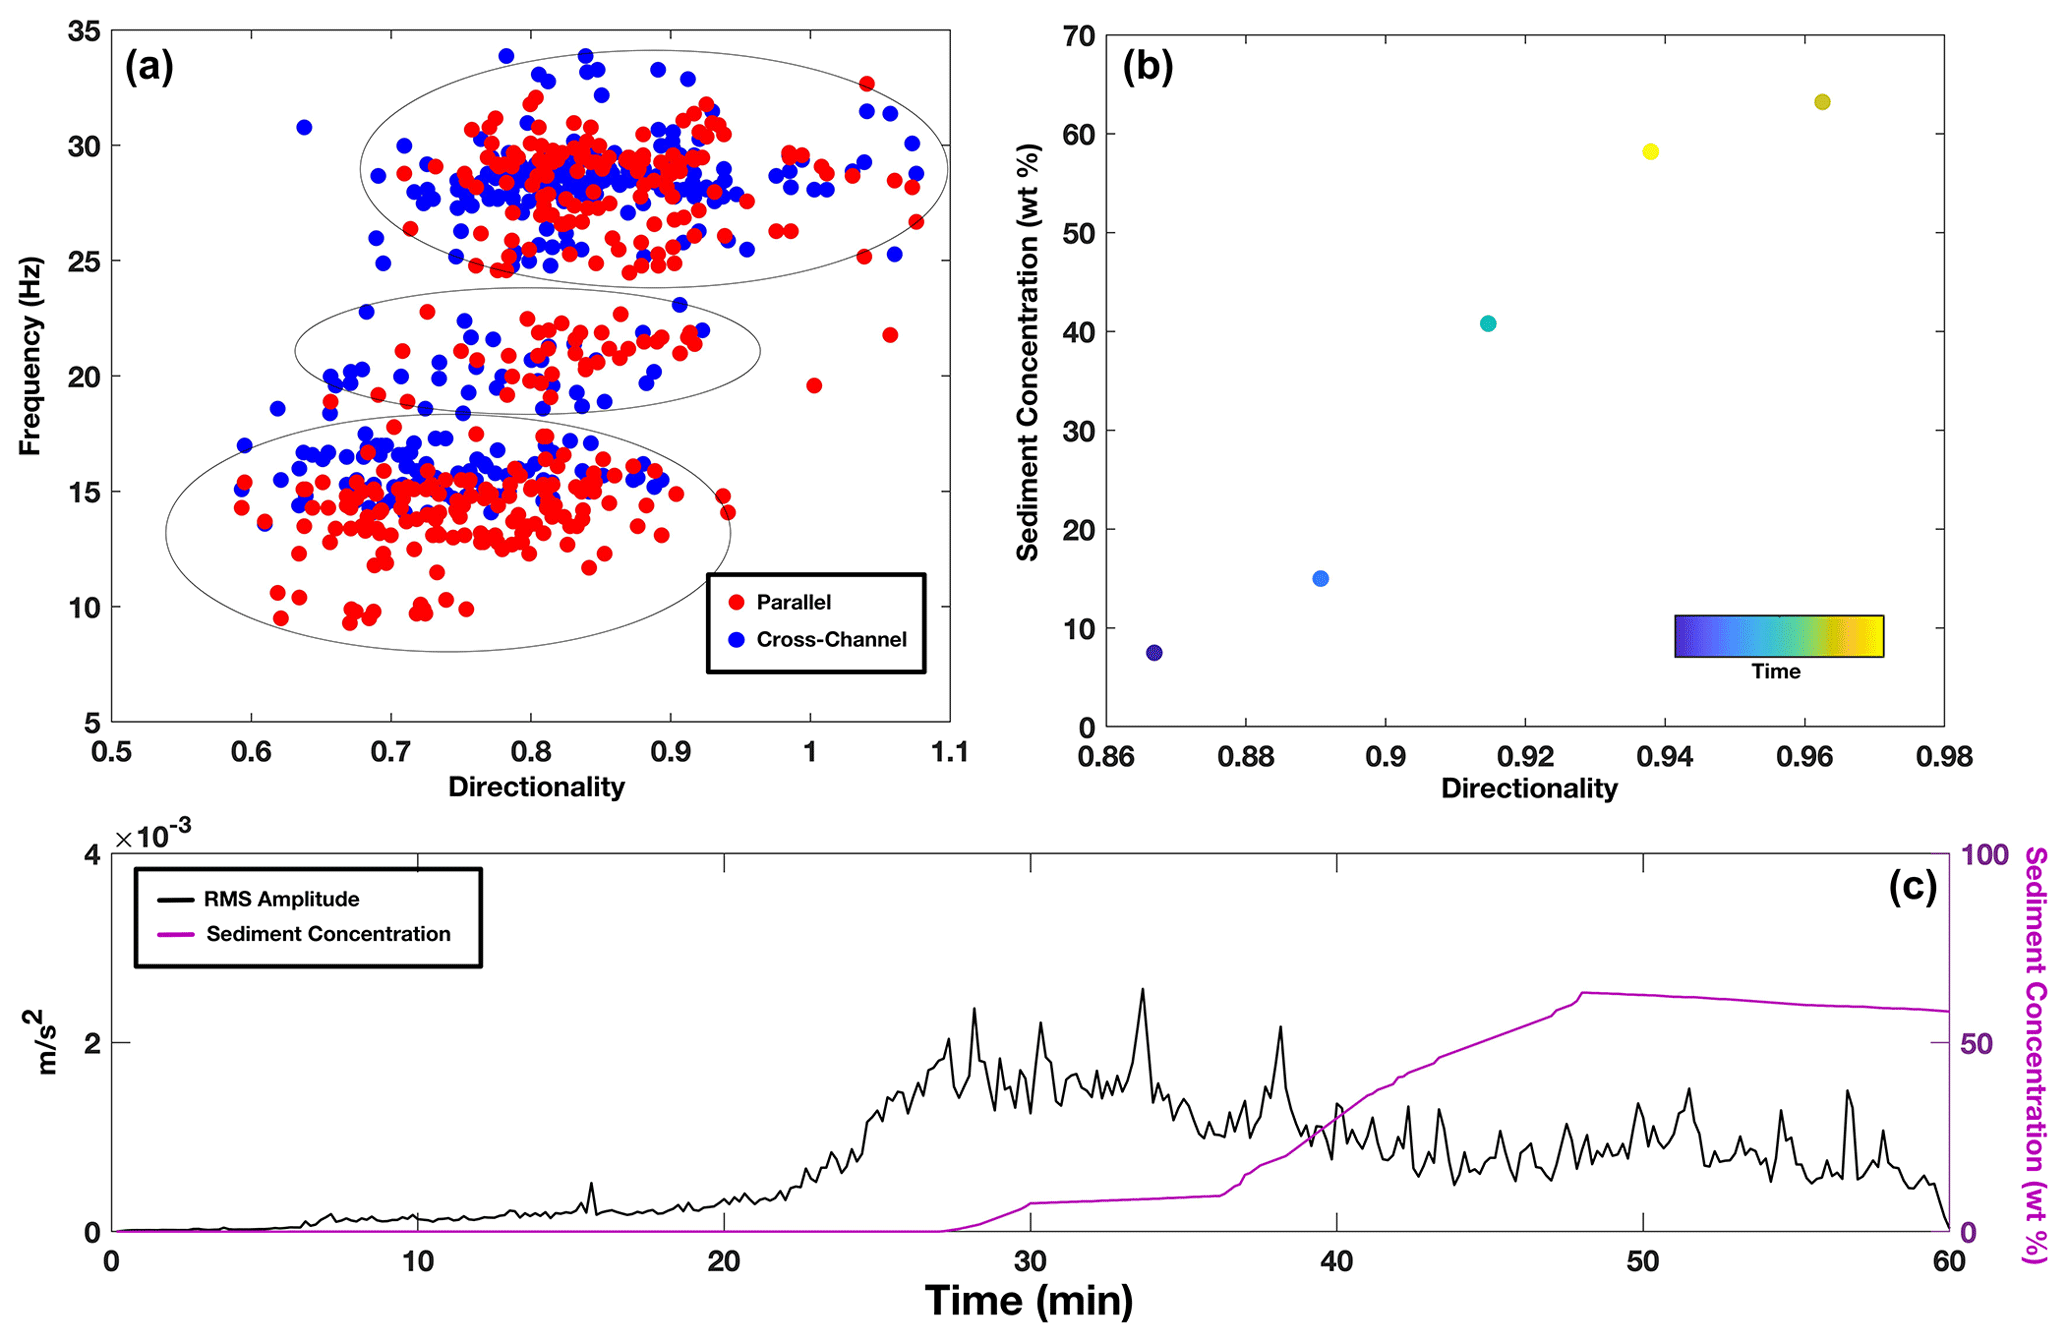
Figure 8Plots of (a) comparing PSF and DR at TRAN, (b) sediment concentration and DR at COLL (R2=0.95), and (c) seismic amplitude (black line) with sediment concentration (purple line) depicting the lag in sediment at COLL. Note on panel (a) parallel (red dots) and cross-channel (blue dots) PSFs display three different zones (black circles). Also note that at COLL the first sediment concentration measurement did not occur until the 30 min mark.
4.2.3 Development of flow phases at TRAN
While the lahar at RTMT had not fully developed yet, and at COLL lost energy, at TRAN the 18 March 2007 lahar was a dynamic bulked-up lahar (see Fig. 2b–e). The evidence for this is in the PSF content for TRAN (Fig. 4a–c) compared to the other two monitoring sites (Table S1). At TRAN the PSF has a step-up step-down pattern for the first 30 min of the lahar passing and then transitions to a bimodal or wide PSF range for the rest of the recording window. As noted above, the low PSF preceding the lahar head arrival is thought to be due to a sensitivity to water transport properties (Fig. 2c, phase 1). The increase to higher PSFs during the peak seismic amplitude may be from particle collisions and/or higher turbulence (Fig. 2d, transition from phase 1 to 2). After the maximum seismic amplitude at TRAN (Fig. 4, ∼ 10–15 min), the PSF decreases to 10–20 Hz. This drop in PSF after the highest stage and amplitude could be from a more water-flow-dominated regime (seen in the increased parallel amplitude, Fig. 4d, and decrease in DR, Fig. 6b), where turbulence decreases (Fig. 2e), discharge is still high, and the peak sediment concentration has not occurred yet (e.g., Cronin et al., 1999). Likewise, the decrease may also be from greater frictional sliding on the channel bed (Huang et al., 2004). After the decrease to 10–20 Hz PSFs, the PSF displays a bimodal or wide frequency range at ∼28 min (Figs. 4a–c and 7b). As aforementioned for COLL, this PSF pattern could be from both bedload- and water-flow-induced noise. This time frame (phase 3) is also where the peak sediment concentration would be (not recorded at TRAN), as noted by Cronin et al. (1999), and thus the PSF would show more high bedload-induced PSFs. This hypothesis also compares well with the DR (Fig. 6b), where the cross-channel energy increases starting at ∼25 min, indicating that the sediment concentration may be increasing (Doyle et al., 2010). Finally, the wide PSF range later in the recording window (Fig. 4) could also result from the lahar having two distinct layers as described by Cronin et al. (2000), where there is a wide, more dilute, finer-grain top layer and a channelized sediment-rich layer on the bottom. The two-layer model can apply to TRAN because the lahar at this monitoring station overtook the channel (Fig. 2d and e) and proceeded to flow horizontally outward forming the surface layer described by Cronin et al. (2000).
4.3 Implications for monitoring
The main goal of this research is to contribute to defining better monitoring criteria for dangerous mass flow events. The data described above are part of a larger collection of monitoring data collected over the entire length of the Whangaehu channel, consisting of 21 monitoring sites and years of preparation (e.g., Manville and Cronin, 2007; Keys and Green, 2008). Due to this, the ability to accurately estimate the properties of the lahar at various stages along its path is possible. When it comes to flow events of any size, the ability to understand how the dynamics change with distance along the channel is important for warning and future hazard mitigation. We show here that a lake-breakout event can start out as an outburst flood, bulk up into a hyperconcentrated flow, then eventually elongate and entrap enough sediment to transform into a plug-like slurry flow. Each of these flow types yields differing PSF ranges and patterns due to the relationship between the channel geometry, sediment concentration, turbulence, and bedload transport. While the lahar at different stations along the channel may have differing PSF content, we also show that the lahar elongates, and a predictable model (e.g., Cronin et al., 1999) can be used with and shown in the seismic data. Being able to apply such a model may yield some relevance of universality in terms of warning systems at different distances away from the mass flow source, whereas, shown above, the flow phases at each monitoring station can be seen, but at differing lengths and times in the seismic signal (e.g., Fig. 6). To better visualize this concept, conceptual models based off of the Cronin et al. (1999) models are created for each of the three seismic stations for the 18 March 2007 lahar (Fig. 9). In the conceptual models for the 2007 lahar, the aforementioned elongation of the frontal pulse or bow wave (phase 1) and head of the lahar (phase 2) is shown, along with the differences and similarities between the properties of the lahar at the three seismic monitoring sites.

Figure 9Conceptual models for the 18 March 2007 lahar at each of the three monitoring stations along the Whangaehu channel, depicting flow type and the estimated seismic properties at each flow phase. (a) RTMT 7.4 km from source, (b) TRAN 28 km from source, and (c) COLL 83 km from source. Flow types (FTs) are as follows: streamflow (SF), bow wave streamflow (BW), mixed flow (MF), hyperconcentrated flow (HF), transitional flow (TF), and sediment-laden streamflow (SLF). Note that decreased (D), increased (I), high (H), low (L), and mixed (M) are notations for directionality ratios and peak spectral frequency estimates. See Table S1 for value ranges for each property.
Another implication for future warning is the implementation of three-component sensors and the use of DRs for channels that have streamflow. Walsh et al. (2020) showed that for lahars flowing in La Lumbre channel at Volcán de Colima the DR for streamflow is <1 and then increases when the head of the lahar arrives. This same feature can be seen at each of the three monitoring sites for the 18 March 2007 event (Fig. 6), indicating that differing flow types will still show this DR pattern within the same flow and at other channels. To further show this, there were three natural non-lake-breakout eruption-based lahars that occurred in the Whangaehu channel in September 2007 (for more details on the lahars see Cole et al., 2009; Kilgour et al., 2010) and recorded on the seismometer at RTMT. The DR for the September events starts with streamflow with a DR <1, and when the first lahar arrives the DR increases to >1 and as the lahar fully passes, the DR decreases to < 1 again (Fig. 10a). As the second lahar arrives at RTMT (Fig. 10, second dashed line), the DR increases to >1 again. After the second lahar passes the DR deceases once again back below DR <1. Finally, as the third lahar arrives (Fig. 10, third dashed line) the DR yet again increases above 1 for the entirety of the event.
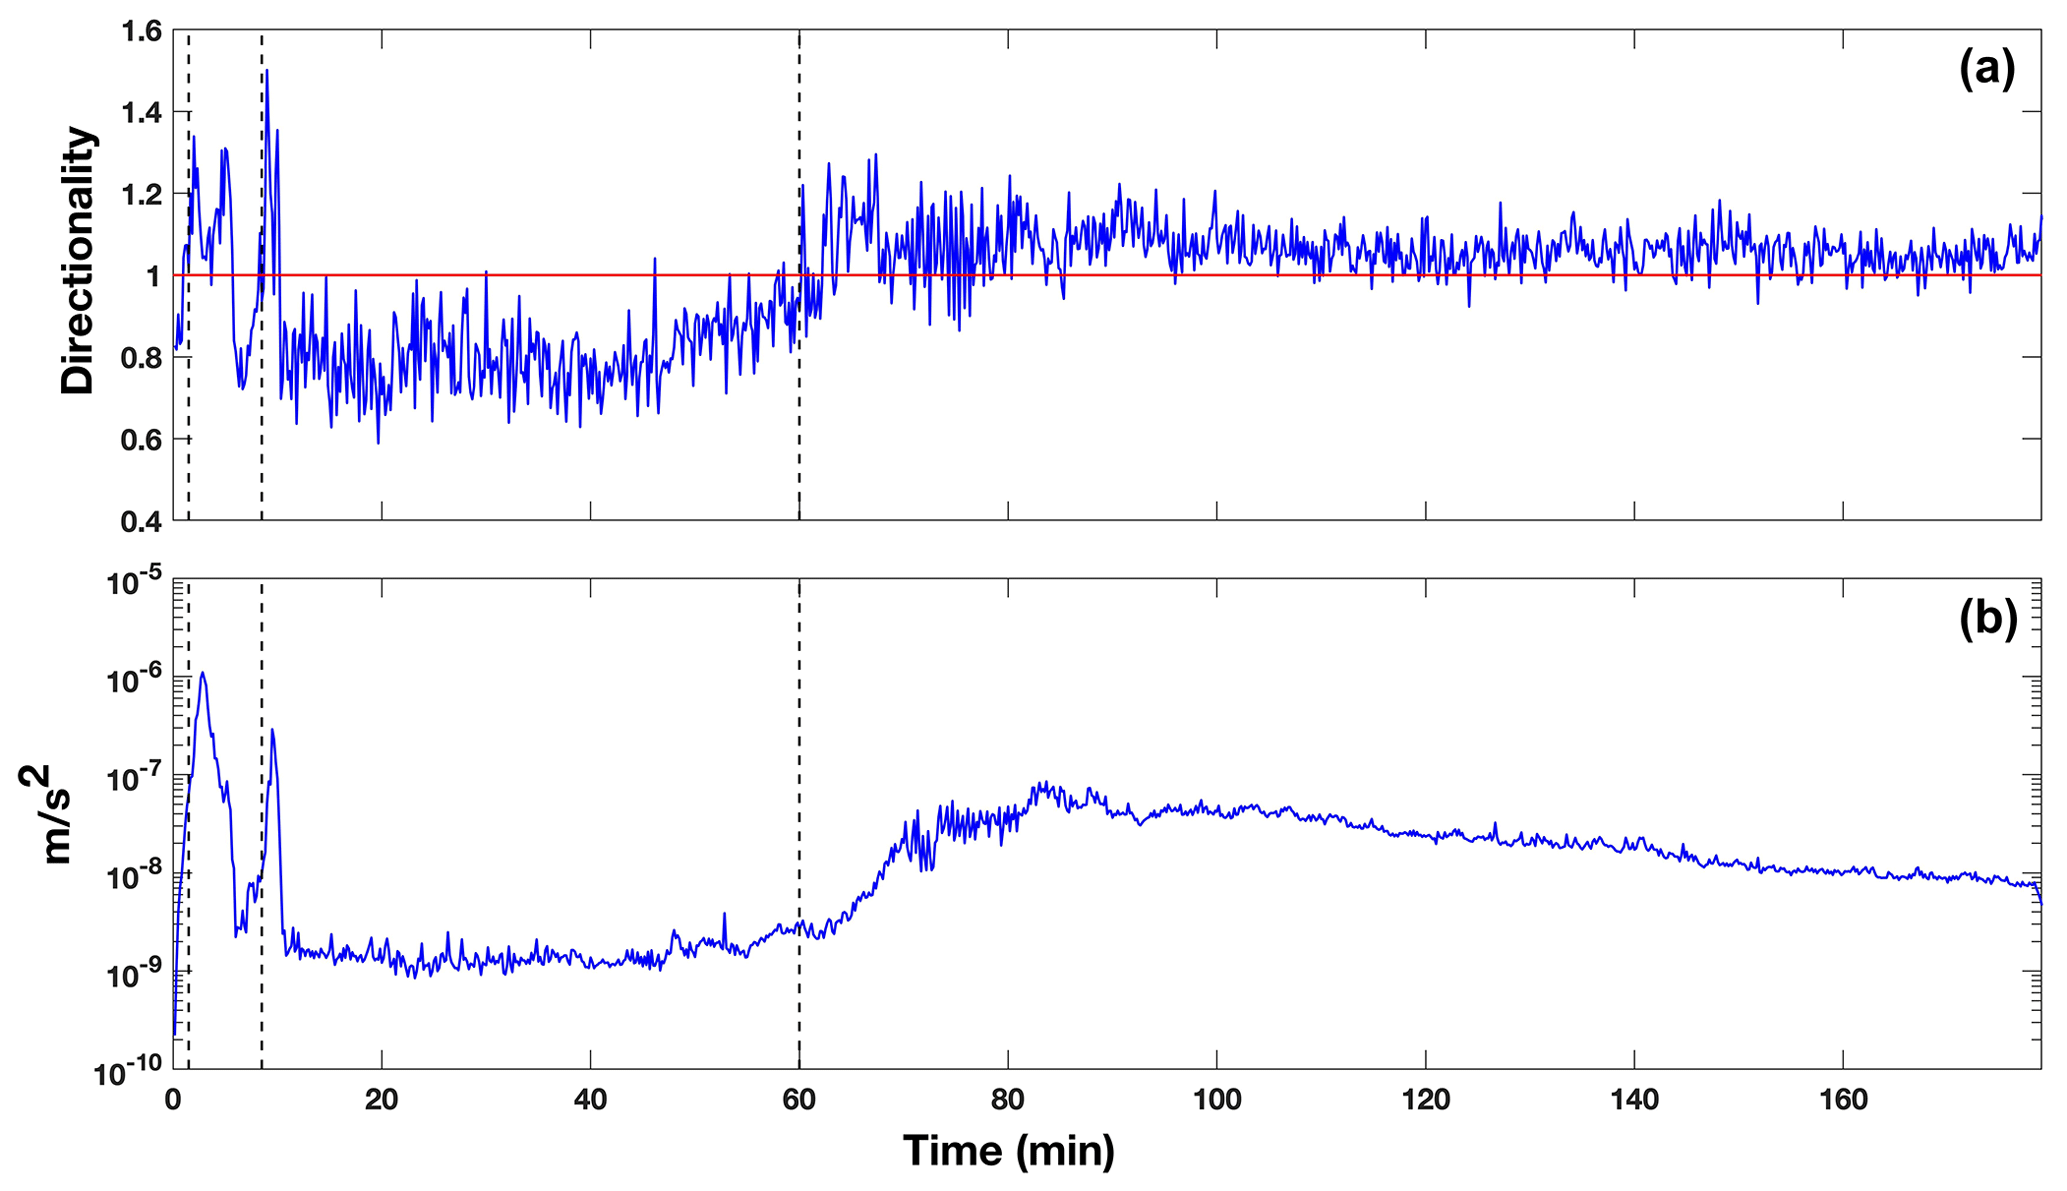
Figure 10(a) Directionality ratio for the time sequence of the three lahars that occurred on 25 September 2007. (b) Rms amplitude of the seismic record at RTMT during the timing of the three September lahars. Note that the dashed black lines represent the timing of each lahar arriving at the monitoring site.
For many mass flows and especially those that flow into channels with preexisting streamflow, the peak seismic amplitude does not always coincide with the arrival of the mass flow, and thus may not be the most reliable for event detection or warning (e.g., Arattano and Moia, 1999; Cole et al., 2009). These observations may be due to a frontal surge, the lag in sediment concentration, or differences in peak amplitude with peak discharge. Phase 1 (frontal streamflow surge) of the model proposed by Cronin et al. (1999) was based on a hyperconcentrated flow interacting with streamflow, but has also been shown for debris flows as well (e.g., Arattano and Moia, 1999). Arattano and Moia (1999) showed at Moscardo Torrent, Italy, through a hydrograph that there was a precursory surge ahead of the debris flow that was not seen in the seismic record. Similarly, at Ruapehu, for the 18 March 2007 lahar, at each of the three stations there is little evidence or rise in the seismic amplitude that would indicate that there was a precursory surge or phase 1 (Figs. 3–5, bottom panel), which could be problematic for detection methods that use amplitude thresholds or short-time-average vs. long-time-average (STA/LTA) algorithms. Conversely, the surge ahead of the lahar can be seen in both the PSF analysis (drop to low frequencies) and in the DR (decrease in DR) right before the peak seismic amplitude arrives. This shows that when monitoring for future events not only the amplitude should be used but other analysis (e.g., PSF, DR) as well, otherwise there could be a delay in the detection of an event.
Using all three components of the seismometer can be very beneficial in lahar monitoring. The above-mentioned DR analysis can only be completed with horizontal recording, and analyzing PSF in each component can yield critical information about the flow properties and dynamics. Examining the seismic amplitude differences can generate significant discoveries; for example, when the vertical component is stronger than the horizontal components, bedload may dominate over turbulence noise (Burtin et al., 2010). Greater flow-parallel signals may indicate higher water transport noises (Barriere et al., 2015), while higher cross-channel signals could be caused by increased interflow particle collisions and flow-channel wall interactions (Doyle et al., 2010). While using the differences in each component can be useful, there are also some concerns. Channel geometry and bed conditions can alter the seismic signal (e.g., Coviello et al., 2019; Marchetti et al., 2019). Additionally, the flow-parallel direction can be influenced by the lahar that has already passed, the lahar at the station, and the lahar arriving. Furthermore, the tilt of the seismometer may play a large role in determining which component is stronger (e.g., Anthony et al., 2018). In the case of the 18 March 2007 lahar, a large pulse of water passed the monitoring stations which may explain why the parallel component is stronger than the other two components at RTMT (Fig. 3d) and TRAN (Fig. 4d). At COLL, the lahar had elongated, lost energy, and thus showed more decreased flow-parallel energy compared to the previous two stations (Fig. 5d). In the cross-channel direction, if a flow overtops the channel, the amplitude would presumably be dampened. This may be the case at TRAN where both the flow-parallel and vertical directions are more energetic than the cross-channel amplitude after the passing of the head and breaking out of the channel occurred (Figs. 2d and 4d). Another concern when using the horizontal components of a seismometer is the effects shallow layers may have on the site response of the sensor. This is especially true when a sensor is installed on soft or loose sediment (e.g., soil, fluvial/alluvial deposits). To test for potential effects by shallow layer fundamental frequencies, H/V analysis of ambient noise (streamflow dominant) was conducted (see Supplement). For RTMT, the H/V results depict a broad-frequency peak between 5 and 15 Hz with a local maximum at ∼8 Hz (Fig. S4a). Comparing the H/V frequency with the PSF of RTMT (Fig. 3), the only overlap is when the front of the lahar passes the station where the PSF decreases for ∼1 min before the head of the lahar arrives. The H/V analysis for TRAN has a multi-broad-peak shape, with frequency peaks at ∼14 and ∼ 28–35 Hz (Fig. S4b). While these frequencies are similar to PSF values for TRAN (Fig. 4), the H/V analysis has no distinguishable fundamental frequency and contains large errors, and no frequency peak has a H/V amplification >2. In order for a H/V frequency peak to be considered ideal, generally the amplification must be greater than 2 and the standard deviation lower than a factor of 2 (SESAME, 2004). The H/V amplification for COLL displays a broad-frequency peak between 13 and 18 Hz, with a local maximum at ∼18 Hz (Fig. S4c). Comparing the PSFs at COLL (Fig. 5), only the cross-channel direction has significant PSF values in the same frequency range (∼18 Hz band). With all three stations not yielding distinct H/V fundamental frequencies, we surmise that the PSF content for the 18 March 2007 lake-breakout lahar is most likely dominated by the large flow passing by the seismic sensor rather than large site amplification effects from a shallow layer. While this may be the case, there is still the possibility that some of the PSF values could be due to local effects and should not be considered in the lahar analysis, e.g., the low PSFs at RTMT between 15 and 20 min (Fig. 3a and b), at TRAN contributing to some of the “jumping” in PSF content (Fig. 4a–c), or in the mostly dominant 15–20 Hz PSF in the cross-channel direction at COLL (Fig. 5a). Conversely, SCF values at each station do not reside in the broad H/V frequency range at any station (Fig. 7), which may further support the hypothesis that almost all of the recorded frequencies are indeed produced by the lahar. With the use of horizontal components becoming common in mass flow monitoring, future three-component analyses of mass flows should consider estimating H / V ratios or use other site response methods (e.g., spectral ratio analysis) in order to identify whether near-surface structures may affect the recorded flow data. Overall, all these concerns can and should be tested to estimate potential error in three-component methods. Nevertheless, using all three components of the seismometer can enhance the productivity of warning systems and, if possible, should be used instead of single-component sensors.
Finally, implementation of these new results into new or existing mass flow warning systems must be discussed. In an ideal setup, to remove any doubt about the recorded signal, machine learning techniques should be used to separate the mass flow noise from other non-flow noises (e.g., environmental, human induced, earthquakes). For instance, recently Wenner et al. (2021) used a supervised random forest algorithm to classify differing sources in a debris flow setting. Once the mass flow source has been classified, integrating automated DR and PSF analysis would be quick and straightforward. Implementation of these techniques would be similar to other seismic analysis or detection methods, such as a STA/LTA (e.g., Coviello et al., 2019) or a number of frequency detection algorithms (e.g., Rubin et al., 2012) where real-time analysis of set time windows is used to determine if there has been a change in the seismicity along the channel. The system could be programmed to identify changing features in the flow automatically by analyzing the content of each window, as well as comparing previous time windows. The analysis of continual data could then be fed into machine learning algorithms (e.g., Rubin et al., 2012; Wenner et al., 2021) to increase not only the confidence of detection, but also the characterization of flow behavior. One of the main discoveries of this research was the evolution of seismic signals produced by the lahar as the flow moved further from its source. The changes in the seismic signal along with the flow characteristics may be able to help hazard and forecast modeling through the use of numerical models (e.g., Mead et al., 2021). Modern flow hazard assessment is based on numerical models that use potential energy equations of a large non-changing mass sliding down slope with limited inputs for how the flow may evolve over time as starting inputs. This can lead to errors in risk mitigation and hazard assessments. The findings shown above on how the 18 March 2007 lahar evolved over 83 km at Mt. Ruapehu will help to improve mass flow modeling in the future by enabling modelers to add constraints or more inputs on how a mass flow might evolve, leading to improved forecasts and hazard assessment.
At 23:18 UTC on 18 March 2007, Mt. Ruapehu produced the biggest lahar in Aotearoa / New Zealand in over 100 years, causing 1.3×10⁶ m3 of water to flow out of the Crater Lake and rush down the Whangaehu channel, flowing for over 200 km to the Tasman Sea. Seismic analysis at three monitoring locations along the channel (7.4, 28, and 83 km) yielded an understanding of how flow type and processes of the lahar evolve with distance. The proximal lahar was a highly turbulent outburst flood, which generated high PSF content in all three components. Further along the channel after the lahar had bulked up, the PSF content was variable and showed changes in the flow regime. Finally, at the most distal monitoring station, the lahar had lost energy and transformed into a slurry-type flow where the PSF content became more bedload-dominant. Additionally, directionality ratios from all three sites along with data from additional lahars yielded strong evidence that DRs can be used for warning systems when there is streamflow present in the channel. Furthermore, PSFs and DRs show evidence of a pre-lahar water pulse that may be concealed in the raw seismic data but has been observed visually. Ultimately, the use of three-component broadband seismic analysis for the 18 March 2007 lahar at Mt. Ruapehu may lead to more accurate and advanced real-time warning systems for mass flows through the use of frequency and directionality around the world.
The data used in this publication can be found at: https://theghub.org/resources/4890 (last access: 10 February 2023; Walsh et al., 2022).
The supplement related to this article is available online at: https://doi.org/10.5194/nhess-23-1029-2023-supplement.
BW performed seismic analysis and drafted the paper, CL organized and prepared data, and JP created the visual location representation of the event. All participating authors contributed to the discussions and editing of the draft of the paper, as well as approving the final edition.
The contact author has declared that none of the authors has any competing interests.
Publisher's note: Copernicus Publications remains neutral with regard to jurisdictional claims in published maps and institutional affiliations.
This work was supported by the Resilience to Nature's Challenges – New Zealand National Science volcano program of research. We would also like to thank all the people from Massey University, Horizons Regional Council, NIWA, and the Department of Conservation that collected data and set up monitoring locations all along the channel in preparation for and during the lahar. A final special thanks to Kate Arentsen for editorial support.
This paper was edited by Giovanni Macedonio and reviewed by Emma Surinach and three anonymous referees.
Anthony, R., Aster, R., Ryan, S., Rathburn, S., and Baker, M.: Measuring mountain river discharge using seismographs emplaced within the hyporheic zone, J. Geophys. Res.-Earth, 123, 210–228, 2018.
Arattano, M. and Moia, F.: Monitoring the propagation of debris flow along a torrent, Hydrolog. Sci. J., 44, 811–823, 1999.
Arattano, M. and Marchi, L.: Measurements of debris flow velocity through cross-correlation of instrumentation data, Nat. Hazards Earth Syst. Sci., 5, 137–142, https://doi.org/10.5194/nhess-5-137-2005, 2005.
Arattano, M., Marchi, L., Genevios, R., Berti, M, Simoni, A., Tecca, P., and Bonte, M.: Field monitoring and real time management of debris flows, European Project “Debris Flow Risk” (N.ENV4960253), CNR-IRPI, Final Report, 30 pp., 1999.
Barriere, J., Oth, A., Hostache, R., and Krein, A.: Bed load transport monitoring using seismic observations in a low-gradient rural gravel bed stream, Geophys. Res. Lett., 42, 2294–2301, 2015.
Bartholomaus, T., Amundson, J., Walter, J., O'Neel, S., West, M., and Larsen, C.: Subglacial discharge at tidewater glaciers revealed by seismic tremor, Geophys. Res. Lett., 42, 6391–6398, 2015.
Burtin, A., Vergne, J., Rivera, L., and Dubernet, P.: Location of river-induced seismic signal from noise correlation functions, Geophys. J. Int., 182, 1161–1173, 2010.
Capra, L., Borselli, L., Barley, N., Ruiz, J., Norini, G., Sarocchi, D., Caballero, L., and Cortes, A.: Rainfall-triggered lahars at Volcan de Colima, Mexico: Surface hydro-repellency as initiation process, J. Volcanol. Geoth. Res., 198, 105–117, 2010.
Capra, L., Coviello, V., Borselli, L., Márquez-Ramírez, V.-H., and Arámbula-Mendoza, R.: Hydrological control of large hurricane-induced lahars: evidence from rainfall-runoff modeling, seismic and video monitoring, Nat. Hazards Earth Syst. Sci., 18, 781–794, https://doi.org/10.5194/nhess-18-781-2018, 2018.
Carrivick, J. and Manville, V.: A fluid dynamics approach to modelling the 18th March 2007 lahar at Mt. Ruapehu, New Zealand, B. Volcanol., 71, 153–169, 2009.
Cole, S., Cronin, S., Sherburn, S., and Manville, V.: Seismic signals of snow-slurry lahars in motion: 25 September 2007, Mt Ruapehu, New Zealand, Geophys. Res. Lett., 36, L09405, https://doi.org/10.1029/2009GL038030, 2009.
Coviello, V., Capra, L., Vazquez, R., and Marquez-Ramirez, V.: Seismic characterization of hyperconcentrated flows in a volcanic environment, Earth Surf. Proc. Land., 43, 2219–2231, 2018.
Coviello, V., Arattano, M., Comiti, F., Macconi, P., and Marchi, L.: Seismic characterization of debris flows: Insights into energy radiation and implications for warning, J. Geophys. Res.-Earth, 124, 1440–1463, https://doi.org/10.1029/2018JF004683, 2019.
Cronin, S., Neall, V., Jerome, L., and Palmer, A.: Unusual “snow slurry” lahars from Ruapehu volcano, New Zealand, September 1995, Geology, 24, 1107–1110, 1996.
Cronin, S., Neall, V., Jerome, L., and Palmer, A.: Dynamic interactions between lahars and stream flow: A case study from Ruapehu volcano, New Zealand, GSA Bulletin, 111, 28–38, 1999.
Cronin, S., Neall, V., Jerome, L., and Palmer, A.: Transformation, internal stratification, and depositional processes within a channelized, multi-peaked lahar flow, New Zeal. J. Geol. Geoph., 43, 117–128, 2000.
Doyle, E., Cronin, S., Cole, S., and Thouret, J.: The coalescence and organization of lahars at Semeru volcano, Indonesia, B. Volcanol., 72, 961–970, 2010.
Doyle, E., Cronin, S., Cole, S., and Thouret, J.: Defining conditions for bulking and debulking in lahars, GSA Bulletin, 123, 1234–1246, 2011.
Giannakopoulos, T. and Pikrakis, A.: Audio Features, Chapter 4, in: Introduction to Audio Analysis, Academic Press, 59–103, 2014, https://doi.org/10.1016/B978-0-08-099388-1.00004-2, 2014.
Gimbert, F., Tsai, V., and Lamb, M.: A physical model for seismic noise generation by turbulent flow in rivers, J. Geophys. Res.-Earth, 119, 2209–2238, 2014.
Huang, C., Shieh, C., and Yin, H.: Laboratory study of the underground sound generated by debris flows, J. Geophys. Res., 109, F01008, https://doi.org/10.1029/2003JF000048, 2004.
Iguchi, M.: Proposal of estimation method for debris flow potential considering eruptive activity, Journal of Disaster Research, 14, 126–134, 2019.
Keys, H. and Green, P.: Ruapehu lahar New Zealand 18 March 2007: Lessons for hazard assessment and risk mitigation 1995–2007, Journal of Disaster Research, 3, 284–296, 2008.
Kilgour, G., Manville, V., Della Pasqua, F., Graettinger, A., Hodgson, K., and Joly, G.: The 25 September 2007 eruption of Mount Ruapehu, New Zealand: Directed ballistics, surtseyan jets, and ice-slurry lahars, J. Volcanol. Geoth. Res., 191, 1–14, 2010.
Kogelnig, A., Suriñach, E., Vilajosana, I., Hübl, J., Sovilla, B., Hiller, M., and Dufour, F.: On the complementariness of infrasound and seismic sensors for monitoring snow avalanches, Nat. Hazards Earth Syst. Sci., 11, 2355–2370, https://doi.org/10.5194/nhess-11-2355-2011, 2011.
Kuehnert, J., Mangeney, A., Capdeville, Y., Vilotte, J., Stutzmann, E., Chaljub, E., Aissaoui, E., Boissier, P., Brunet, C., Kowalski, P., and Lauret, F.: Locating rockfalls using inter-station ratios of seismic energy at Dolomieu crater, Piton de la Fournaise volcano, J. Geophys. Res.-Earth, 126, e2020JF005715, https://doi.org/10.1029/2020JF005715, 2021.
Lube, G., Cronin, S., Manville, V., Procter, J., Cole, S., and Freundt, A.: Geology, 40, 475–478, 2012.
Manville, V. and Cronin, S.: Breakout lahar from New Zealand's crater lake, EOS T., 88, 441–456, 2007.
Manville, V., White, J., and Hodgson, K.: Dynamic interactions between lahars and stream flow: A case study from Ruapehu volcano, New Zealand: Discussion and reply discussion, GSA Bulletin, 112, 1149–1152, 2000.
Marchetti, E., Walter, F., Barfucci, G., Genco, R., Wenner, M., Ripepe, M., McArdell, B., and Price, C.: Infrasound array analysis of debris flow activity and implications for early warning, J. Geophys. Res.-Earth, 124, 567–587, 2019.
Massey., C., Manville, V., Hancox, G., Keys, H., Lawrence, C., and McSaveney, M.: Out-burst flood (lahar) triggered by retrogressive landsliding, 18 March 2007 at Mt Ruapehu, New Zealand – a successful early warning, Landslides, 7, 303–315, 2010.
Mead, S. R., Procter, J., and Kereszturi, G.: Quantifying location error to define uncertainty in volcanic mass flow hazard simulations, Nat. Hazards Earth Syst. Sci., 21, 2447–2460, https://doi.org/10.5194/nhess-21-2447-2021, 2021.
O'Connor, J., Clague, J., Walder, J., Manville, V., and Beebee, R.: 6.36 - Outburst Floods, Treatise on Geomorphology, 6.2, 765–819, https://doi.org/10.1016/B978-0-12-818234-5.00007-9, 2022.
O'Shea, B.: Ruapehu and the Tangiwai disaster, NZ J. Sci. Tech., 36B, 174–189, 1954.
Pardo, N., Cronin, S., Palmer, A., and Nemeth, K.: Reconstructing the largest explosive eruptions of Mt. Ruapehu, New Zealand: Lithostratigraphic tools to understand subplinian-plinian eruptions at andesitic volcanoes, B. Volcanol., 74, 617–640, 2012.
Pierson, T. and Scott, K.: Downstream dilution of a lahar: Transition from debris flow to hyperconcentrated streamflow, Water Resour. Res., 21, 1511–1524, 1985.
Pierson, T., Janda, R., Thouret, J., and Borrero, C.: Perturbation and melting of snow and ice by the 13 November 1985 eruption of Nevado del Ruiz, Colombia, and consequent mobilization, flow and deposition of lahars, J. Volcanol. Geoth. Res., 41, 17–66, 1990.
Procter, J., Cronin, S., Fuller, I., Lube, G., and Manville, V.: Quantifying the geomorphic impacts of a lake-breakout lahar, Mount Ruapehu, New Zealand, Geology, 38, 67–70, 2010a.
Procter, J., Cronin, S., Fuller, I., Sheridan, M., Neall, V., and Keys, H.: Lahar hazard assessment using Titan2D for an alluvial fan with rapidly changing geomorphology: Whangaehu River, Mt. Ruapehu, Geomorphology, 116, 162–174, 2010b.
Procter, J., Cronin, S., and Sheridan, M.: Evaluation of Titan2D modelling forecasts for the 2007 Crater Lake break-out lahar, Mt. Ruapehu, New Zealand, Geomorphology, 136, 95–105, 2012.
Procter, J. N., Cronin, S. J., Zernack, A. V., Lube, G., Stewart, R. B., Nemeth, K., and Keys, H.: Debris flow evolution and the activation of an explosive hydrothermal system; Te Maari, Tongariro, New Zealand, J. Volcanol. Geoth. Res., 286, 303–316, 2014.
Procter, J., Zernack, A., Mead, S., Morgan, M., and Cronin, S.: A review of lahars; past deposits, historic events and present-day simulations from Mt. Ruapehu and Mt. Taranaki, New Zealand, New Zeal. J. Geol. Geoph., 64, 479–503, 2021.
Roth, D., Brodsky, E., Finnegan, N., Rickenmann, D., Turowski, J., and Badoux, A.: Bed load sediment transport inferred from seismic signals near a river, J. Geophys. Res.-Earth, 121, 725–747, 2016.
Rubin, M., Camp, T., Van Herwijen, A., and Schweizer, J.: Automatically detecting avalanche events in passive seismic data, 11th International Conference on Machine Learning and Applications, IEEE, 1, 13–20, 2012.
Schimmel, A., Coviello, V., and Comiti, F.: Debris flow velocity and volume estimations based on seismic data, Nat. Hazards Earth Syst. Sci., 22, 1955–1968, https://doi.org/10.5194/nhess-22-1955-2022, 2022.
Schmandt, B., Aster, R., Scherler, D., Tsai, V., and Karlstrom, K.: Multiple fluvial processes detected by river side seismic and infrasound monitoring of a controlled floor in the Grand Canyon, Geophys. Res. Lett., 40, 4858–4863, 2013.
Schmandt, B., Gaeuman, D., Stewart, R., Hansen, S., Tsai, V., and Smith, J.: Seismic array constraints on reach-scale bedload transport, Geology, 45, 299–302, 2017.
Saló, L., Corminas, J., Lantada, N., Mata, G., Prades, A., and Ruiz-Carulla, R.: Seismic energy analysis as generated by impact and fragmentation of single-block experimental rockfalls, J. Geophys. Res.-Earth, 123, 1450–1478, 2018.
Scott, K.: Origins, behavior, and sedimentology of lahars and lahar runout flows in the Toutle–Cowlitz river system, USGS Professional Paper, United States Government Printing Office, Washington, 1988.
SESAME: Guidelines for the implementation of the H/V spectral ratio technique on ambient vibrations measurements, processing and interpretation, European Commission, EVG1-CT-2000-00026, 2004.
Suriñach, E., Vilajosana, I., Khazaradze, G., Biescas, B., Furdada, G., and Vilaplana, J. M.: Seismic detection and characterization of landslides and other mass movements, Nat. Hazards Earth Syst. Sci., 5, 791–798, https://doi.org/10.5194/nhess-5-791-2005, 2005.
Walsh, B., Jolly, A., and Procter, J.: Seismic analysis of the 13 October 2012 Te Maari, New Zealand, lake breakout lahar: Insights into flow dynamics and the implications on mass flow monitoring, J. Volcanol. Geoth. Res., 324, 144–155, 2016.
Walsh, B., Coviello, V., Capra, L., Procter, J., and Marquez-Ramirez, V.: Insights into the internal dynamics of natural lahars from analysis of 3-component broadband seismic signals at Volcán de Colima, Mexico, Front. Earth Sci., 8, 542116, https://doi.org/10.3389/feart.2020.542116, 2020.
Walsh, B., Lormand, C., Procter, J., and Williams-Jones, G.: 18 March 2007 Mt. Ruapehu lahar seismic data, Ghub [data set], https://theghub.org/resources/4890 (last access: 10 February 2023), 2022.
Wenner, M., Hibert, C., van Herwijnen, A., Meier, L., and Walter, F.: Near-real-time automated classification of seismic signals of slope failures with continuous random forests, Nat. Hazards Earth Syst. Sci., 21, 339–361, https://doi.org/10.5194/nhess-21-339-2021, 2021.