the Creative Commons Attribution 4.0 License.
the Creative Commons Attribution 4.0 License.
 | 17 Mar 2022
Characteristics and beach safety knowledge of beachgoers on unpatrolled surf beaches in Australia
Lea Uebelhoer
William Koon
Mitchell D. Harley
Jasmin C. Lawes
The majority of drowning deaths on Australian beaches occur significant distances away from lifeguard services. This study uses results of 459 surveys of beachgoers at five beaches unpatrolled by lifeguards in New South Wales, Australia, to improve understanding of who visits these beaches and why, and to identify risk factors associated with their beach safety knowledge and behaviour. Many unpatrolled beach users were infrequent beachgoers (64.9 %) with poor rip current hazard identification skills, who did not observe safety signage that was present, and yet intended to enter the water to swim (85.6 %) despite being aware that no lifeguards were present. The survey found that the main reasons why beachgoers visited unpatrolled beaches were because they were conveniently close to their holiday accommodation, or they represented a quieter location away from crowds. Future beach safety interventions in Australia need to extend beyond the standard “swim between the flags” message in recognition that many Australian beaches will remain unpatrolled, yet still frequented, for the foreseeable future. Future beach safety interventions for unpatrolled beaches should be tailored towards the varied demographic groups of beach users.
- Article
(8893 KB) - Full-text XML
-
Supplement
(20144 KB) - BibTeX
- EndNote


Tragically, many people drown unintentionally on beaches worldwide, with each drowning associated with significant emotional, societal, and economic costs (Sherker et al., 2008; Houser et al., 2021). Globally, the most common and effective management response to ensuring beachgoer safety is through the provision of lifeguard services, which are often denoted by, or combined with, various types of beach safety flag systems (Gilchrist and Branche, 2016). Australia has a well-established professional lifeguarding and volunteer surf lifesaving service (Jaggard, 2006), with patrolled areas denoted by the presence of a pair (or pairs) of red and yellow beach flags. The area between these flags designates a supervised, safer swimming zone for beachgoers to recreate safely in the surf. Similar systems are also employed in New Zealand, the United Kingdom, South Africa, and other countries (Brander and MacMahan, 2011). The primary beach safety message promoted to beachgoers in Australia is to “always swim between the red and yellow flags”. However, the ability to follow this message can be problematic owing to the logistical reality that lifeguard services are not present at all beaches, or at all times. Furthermore, several studies have found that although most beachgoers are aware of the meaning and importance of the red and yellow beach flags, many still choose not to swim between them when they visit patrolled beaches, or often choose to swim at unpatrolled beaches (White and Hyde, 2010; Williamson et al., 2012; Ménard et al., 2018; Pitman et al., 2021).
In Australia, less than 5 % of the approximately 11 000 beaches are patrolled by lifeguards and surf lifesavers (herein referred to as “lifeguards”) and only 20 % of the 721 beaches are patrolled in Australia's most populous state, New South Wales (NSW) (SLSA, 2021). This is problematic given that many unpatrolled beaches are easily accessible and proximal to popular tourist accommodation. McKay et al. (2014) found that for more than 90 % of coastal tourist parks in NSW, the closest beach is unpatrolled, or temporarily unpatrolled, and rated as “hazardous” (Short and Hogan, 1994). It is unrealistic to assume that visitors to these coastal accommodations will always seek out the nearest patrolled beach, which in many cases can be a significant distance away (McKay et al., 2014). It is therefore not surprising that 73 % of the 136 coastal drowning deaths in Australia between July 2020 and June 2021 occurred more than 1 km away from a lifeguard service, or outside of patrol times (SLSA, 2021).
In the absence of lifeguarding services a common beach safety intervention is the use of warning signs alerting beachgoers of various hazards, or to the fact that the beach is unpatrolled. However, several studies have shown that beach safety signs are not necessarily as effective as authorities may assume (Matthews et al., 2014; Brannstrom et al., 2015; Houser et al., 2017; Sotés et al., 2020). Ultimately, many rescues on unpatrolled beaches are conducted by surfers (Attard et al., 2015; Berg et al., 2021) and other bystanders (Brander et al., 2019; Franklin et al., 2019). Tragically however, it is not uncommon for bystander rescuers to drown while attempting to rescue others (Lawes et al., 2020).
There has been a recent increase in beach safety research (Brander, 2019) that attempts to provide a better understanding of the scope of beach-related drowning events. Existing studies typically describe the extent and characteristics of beach drowning (Silva-Cavalcanti et al., 2018; Koon et al., 2021; Segura et al., 2022), particularly in relation to strong, offshore flowing rip currents (Castelle et al., 2016), which are considered to be the main hazard for swimmers and bathers on surf beaches (Gensini and Ashley, 2010; Woodward et al., 2013; Brighton et al., 2013; Arozarena et al., 2015; Brewster et al., 2019; Cooney et al., 2020). Other studies have conducted surveys to describe the demographics, beach safety knowledge and behaviour of various types of beachgoers (Ballantyne et al., 2005; Williamson et al., 2012; Clifford et al., 2018; Sotés et al., 2018), often in relation to the presence of lifeguards, beach safety flags, and the rip current hazard (Sherker et al., 2010; Caldwell et al., 2013; Brannstrom et al., 2014; Fallon et al., 2018; Ménard et al., 2018; Locknick and Houser, 2021; Pitman et al., 2021).
Although many fatal and non-fatal drowning incidents are known to occur at unpatrolled beaches, no study has yet specifically focused on the characteristics, behaviour, and beach safety knowledge of beachgoers visiting unpatrolled beaches. The recent Australian Water Safety Strategy 2030 has an aspirational goal of reducing drowning in Australia by 50 % by 2030, and one of the key priority areas of focus are coastal environments (beaches, oceans, and rocks) where 1143 drowning deaths occurred between 2009 and 2019 (AWSC, 2021). Within this priority area, an identified key research activity is to improve understanding of the usage of unpatrolled and remote locations. To address this gap, this study was aimed at gaining a better understanding of who visits unpatrolled beaches in New South Wales, Australia, the reasons why they choose to visit these beaches, and whether these beach visitors are more at risk owing to the absence of lifeguards. A secondary aim was to identify beach user profiles and risk factors that will assist in the future development of beach safety management interventions and education approaches for high-risk demographics that frequent unpatrolled beaches, both in Australia and internationally.
The study was designed to obtain data by administering a survey questionnaire to beachgoers at five unpatrolled beaches along the New South Wales coast, Australia (Fig. 1), between January and April 2021. The beaches have a reputation of showing different patterns of beach user demographics: (i) three south coast NSW beaches (Merry Beach, Racecourse Beach, Tabourie Beach) were popular with domestic tourists during the summer months; (ii) Turimetta Beach in Sydney's northern beaches is an urban beach used primarily by local residents; and iii) Dreamtime Beach in northern NSW is a popular social media-driven tourist destination (attracting both international and domestic visitors) owing to being ranked as one of the best beaches in Australia, despite recording five drowning deaths since 2015 (McCutcheon, 2018).
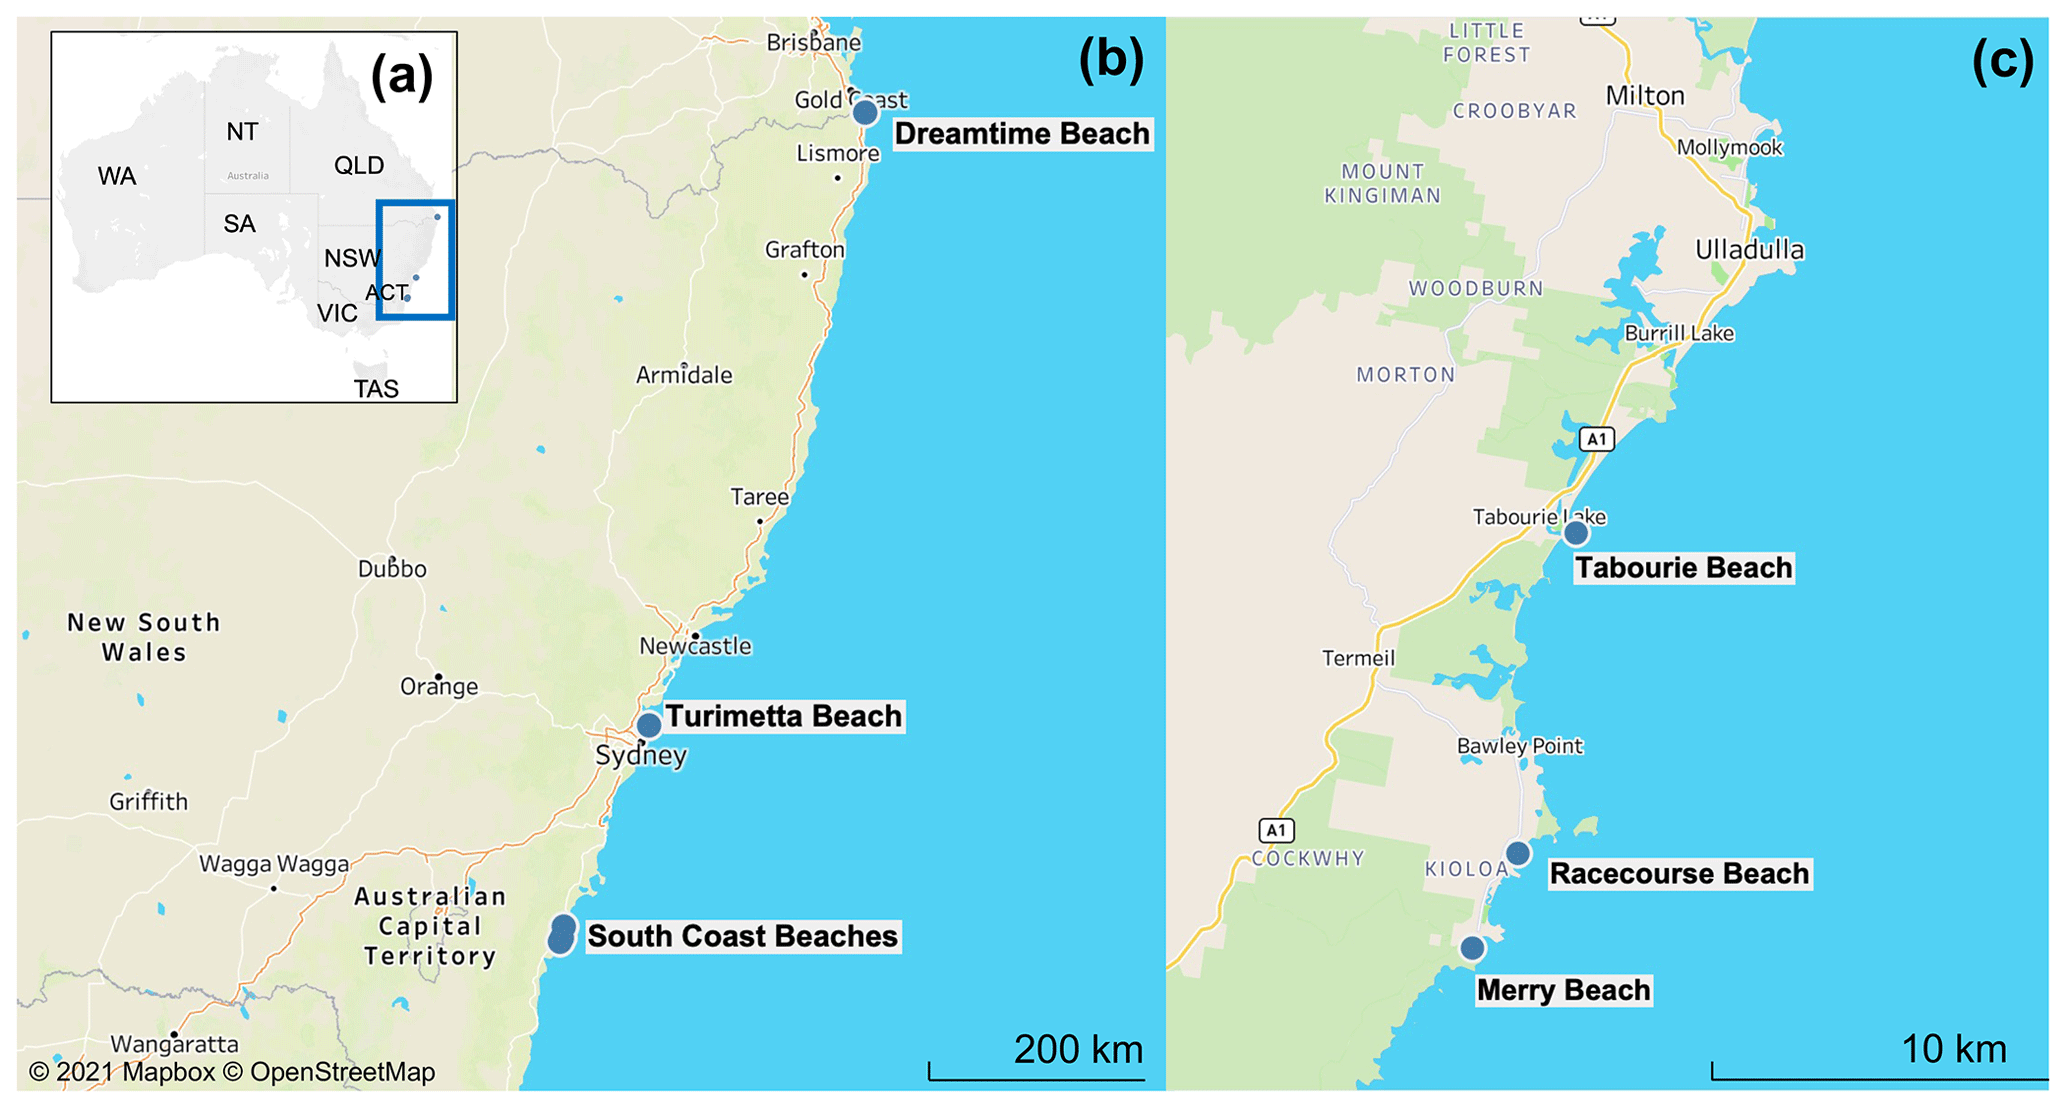
Figure 1Study sites along the New South Wales Coast, Australia (a, b). The three nearby South Coast NSW beach (Tabourie Beach, Merry Beach and Racecourse Beach) locations are indicated in (c).
2.1 Study site descriptions
The three south coast NSW beaches (Fig. 1c) are located in a region characterized by nearby holiday accommodations and tourist parks, but few patrolled beaches (McKay et al., 2014). The closest patrolled beach was at Mollymook, a 16 and 35 km drive from the closest (Tabourie) and furthest (Merry) surveyed beach respectively. The south coast beaches varied in terms of their geomorphology and hazards, but were all characterized by active surf zone conditions, particularly the presence of rip currents. Ten drowning deaths have been recorded across these locations since 2004 (SLSA, unpublished data).
Merry Beach is an embayed beach measuring 400 m long that exhibited low-tide terrace morphology (Wright and Short, 1984) with a boundary rip current against the northern headland and a weak channelized rip near the middle of the beach. The beach has a modal hazard rating of (moderately hazardous) according to Short (2007). Tabourie Beach is a beach measuring 1.7 km long connected by a sandy salient called Tabourie Point, with Wairo Beach on the northern side. Transverse bar and rip morphology (Wright and Short, 1984) was present along the middle-southern part of Tabourie and on the northern end of Wairo. The beach has a modal hazard rating of (highly hazardous; Short, 2007). Racecourse Beach is situated between Merry Beach and Tabourie Beach and is a transverse bar and rip beach measuring 1.5 km long that is considered moderately hazardous, with a hazard rating of (Short, 2007). At all south coast beaches, low to moderate wave energy conditions prevailed during the survey period, with observed breaking wave heights consistently <1.5 m (Supplement 1).
Sydney's Turimetta Beach (Fig. 1b) is in close proximity (<1 km) to patrolled beaches situated to the north and south. It is an embayed beach measuring 350 km long that is considered very hazardous, with a hazard rating of (Short, 2007), as it is typified by rock platforms, rocky outcrops, and several rip currents. Five drowning deaths have been recorded around Turimetta Beach since 2004, often associated with jumping off the adjacent headlands (SLSA, unpublished data). During the survey period the beach was characterized by a boundary rip current against the headland and moderate wave conditions with breaking wave heights ranging from 1.5 to 2 m (Supplement 1).
Dreamtime Beach is located on the far north coast of NSW close to the Queensland border and comprises the northern end of Kingscliff Beach (Fig. 1b). It is a transverse bar and rip beach rated as being moderately hazardous (; Short, 2007) and the nearest patrolled beach is <1 km away at Fingal Beach, just north of Fingal Head. Five drowning deaths have been recorded at Dreamtime Beach since 2015 (SLSA, unpublished data). Wave activity during the survey period was moderate to high with observed breaking wave heights ranging from 1.5 to 3 m; channel rips were present along the beach in addition to a boundary rip against the northern headland (Supplement 1).
2.2 Survey design
The survey questionnaire was designed using the web-based survey platform Qualtrics and was restricted to respondents aged 18 years or older. It consisted of 24 core questions and nine sub-questions across three thematic sections (Supplement 2). Section 1 explored demographic information, background information on respondents' participation in coastal activities, and questions related to their swimming ability and beach visitation frequency. Section 2 asked location-specific questions, such as previous visitation to the beach at which they were being surveyed, reasons for visiting the beach, with whom they were visiting the beach, what activity they intended to participate in while at the beach, and if they would recommend the beach to others. Section 3 was designed to obtain information related to beach safety including hazard perception, with questions relating to the red and yellow flags, lifeguards, and beach safety signage with a focus on knowledge of the rip current hazard and rip current identification, both from images and in situ. Ethics approval for the survey was granted by the UNSW Sydney Human Research Ethics Advisory Panel (project number HC190629).
2.3 Data collection
The intended survey dissemination period was significantly impacted by both extensive bushfires along the east coast of NSW in the summer of 2019/20, COVID-19-related travel restrictions through 2020 and early 2021, and weather conditions. Therefore, surveys were conducted on the south coast beaches during the summer holiday period between 9 and 17 January, primarily in the morning, as strong sea breeze activity reduced beachgoer numbers in the afternoon. Owing to COVID-19 restrictions, it was not possible to survey Turimetta Beach until the late summer/early autumn between 27 February and 13 March. Weekends were chosen during this time to maximize beachgoer numbers, but several weekends experienced poor weather and therefore low beachgoer numbers. Dreamtime Beach was surveyed during the NSW Easter School holiday period between 7 and 16 April, although the first week saw limited numbers of beachgoers because of inclement weather. On fine days, Turimetta Beach and Dreamtime Beach were surveyed throughout the day. Owing to a lack of beach users Racecourse Beach was only surveyed once.
Surveys were administered by a team of trained volunteers that ranged in number from 2 to 9 during the data collection periods. Participant beachgoers were asked to fill out the survey questionnaire on hard copies or using the Qualtrics offline app on tablet devices, which was necessary to conduct the study as several of the beaches did not have mobile phone reception. The survey took approximately 10–15 min to complete. Survey refusals were recorded. At the beginning, middle, and end of each survey day, the weather and surf conditions were noted and a photo of the beach including the water was taken from a higher vantage point, if possible, for later validation of conditions. The Merry Beach and Turimetta Beach locations also benefit from the presence of remote cameras that provided high-quality images of the beach at 15-min intervals from an elevated viewpoint. At each beach, the location of any fixed beach safety sign was recorded and a photo was taken in order to cross-check information related to signage questions in the survey.
2.4 Data analysis
All survey responses were input into Qualtrics and subsequently imported into Excel, where they were sorted by date and time and each survey was assigned a unique identifier. Analyses were conducted in Qualtrics, Tableau Desktop Version 2020.3, Microsoft Excel Version 16.52, and in R Studio Version 1.2.5033. To assess if statistical relationships existed between survey responses beyond what might be expected by random chance alone, different statistical tests were used to evaluate trends of several predetermined dependent and independent variables. The Kruskal–Wallis test was used to determine if there were statistically significant differences between two or more ordinal variables (e.g. hazard perception vs. age group); the Mann–Whitney U test for differences between ordinal and binary variables (e.g. hazard perception vs. gender) and continuous and binary variables (e.g. rip score vs. gender); Chi-squared test for differences between categorical and binary variables (e.g. intention to go in water vs. gender); linear regression for relationships between continuous and ordinal variables (rip score vs. age group); binary logistic regression for relationships between binary and ordinal variables (e.g. intention to go in the water [yes/ no] vs. age group). The effect size of the Kruskal–Wallis Test (η2 and f) and of the Mann–Whitney U test (r), were computed and interpreted after Cohen (1988). As multiple comparisons with the same dependent variables were applied, Bonferroni correction was used, deeming statistical significance to be p=0.0083 (Armstrong, 2014).
A total of 459 surveys were collected: Merry Beach (n=153), Tabourie Beach (n=125), Racecourse Beach (n=18), Turimetta Beach (n=59), and Dreamtime Beach (n=104). Based on survey refusals (n=53), the survey response rate was 89.6 %. To simplify analyses, and because of similar physical and demographic characteristics, Merry Beach, Tabourie Beach, and Racecourse Beach were grouped as “South Coast”. Where reported data are not linked to a table or figure, the full results and statistical analyses can be found in Supplement 3.
3.1 Beachgoer demographic profile
Overall, slightly more females (57.3 %) participated in the study, and this gender imbalance was consistent across beach locations (Table 1). The age distribution of respondents was evenly spread, although they tended to be older at the South Coast, with most aged 45–59 years (35.1 %) compared with Dreamtime Beach and Turimetta Beach, where respondents were mostly aged 18–24 years (34.6 % and 42.4 % respectively; Table 1).
Table 1Characteristics of surveyed beachgoers in terms of demographics, residence proximity to the beach and coast, participation in coastal activities, swimming ability, and swimming frequency. Percentages are shown in italics.
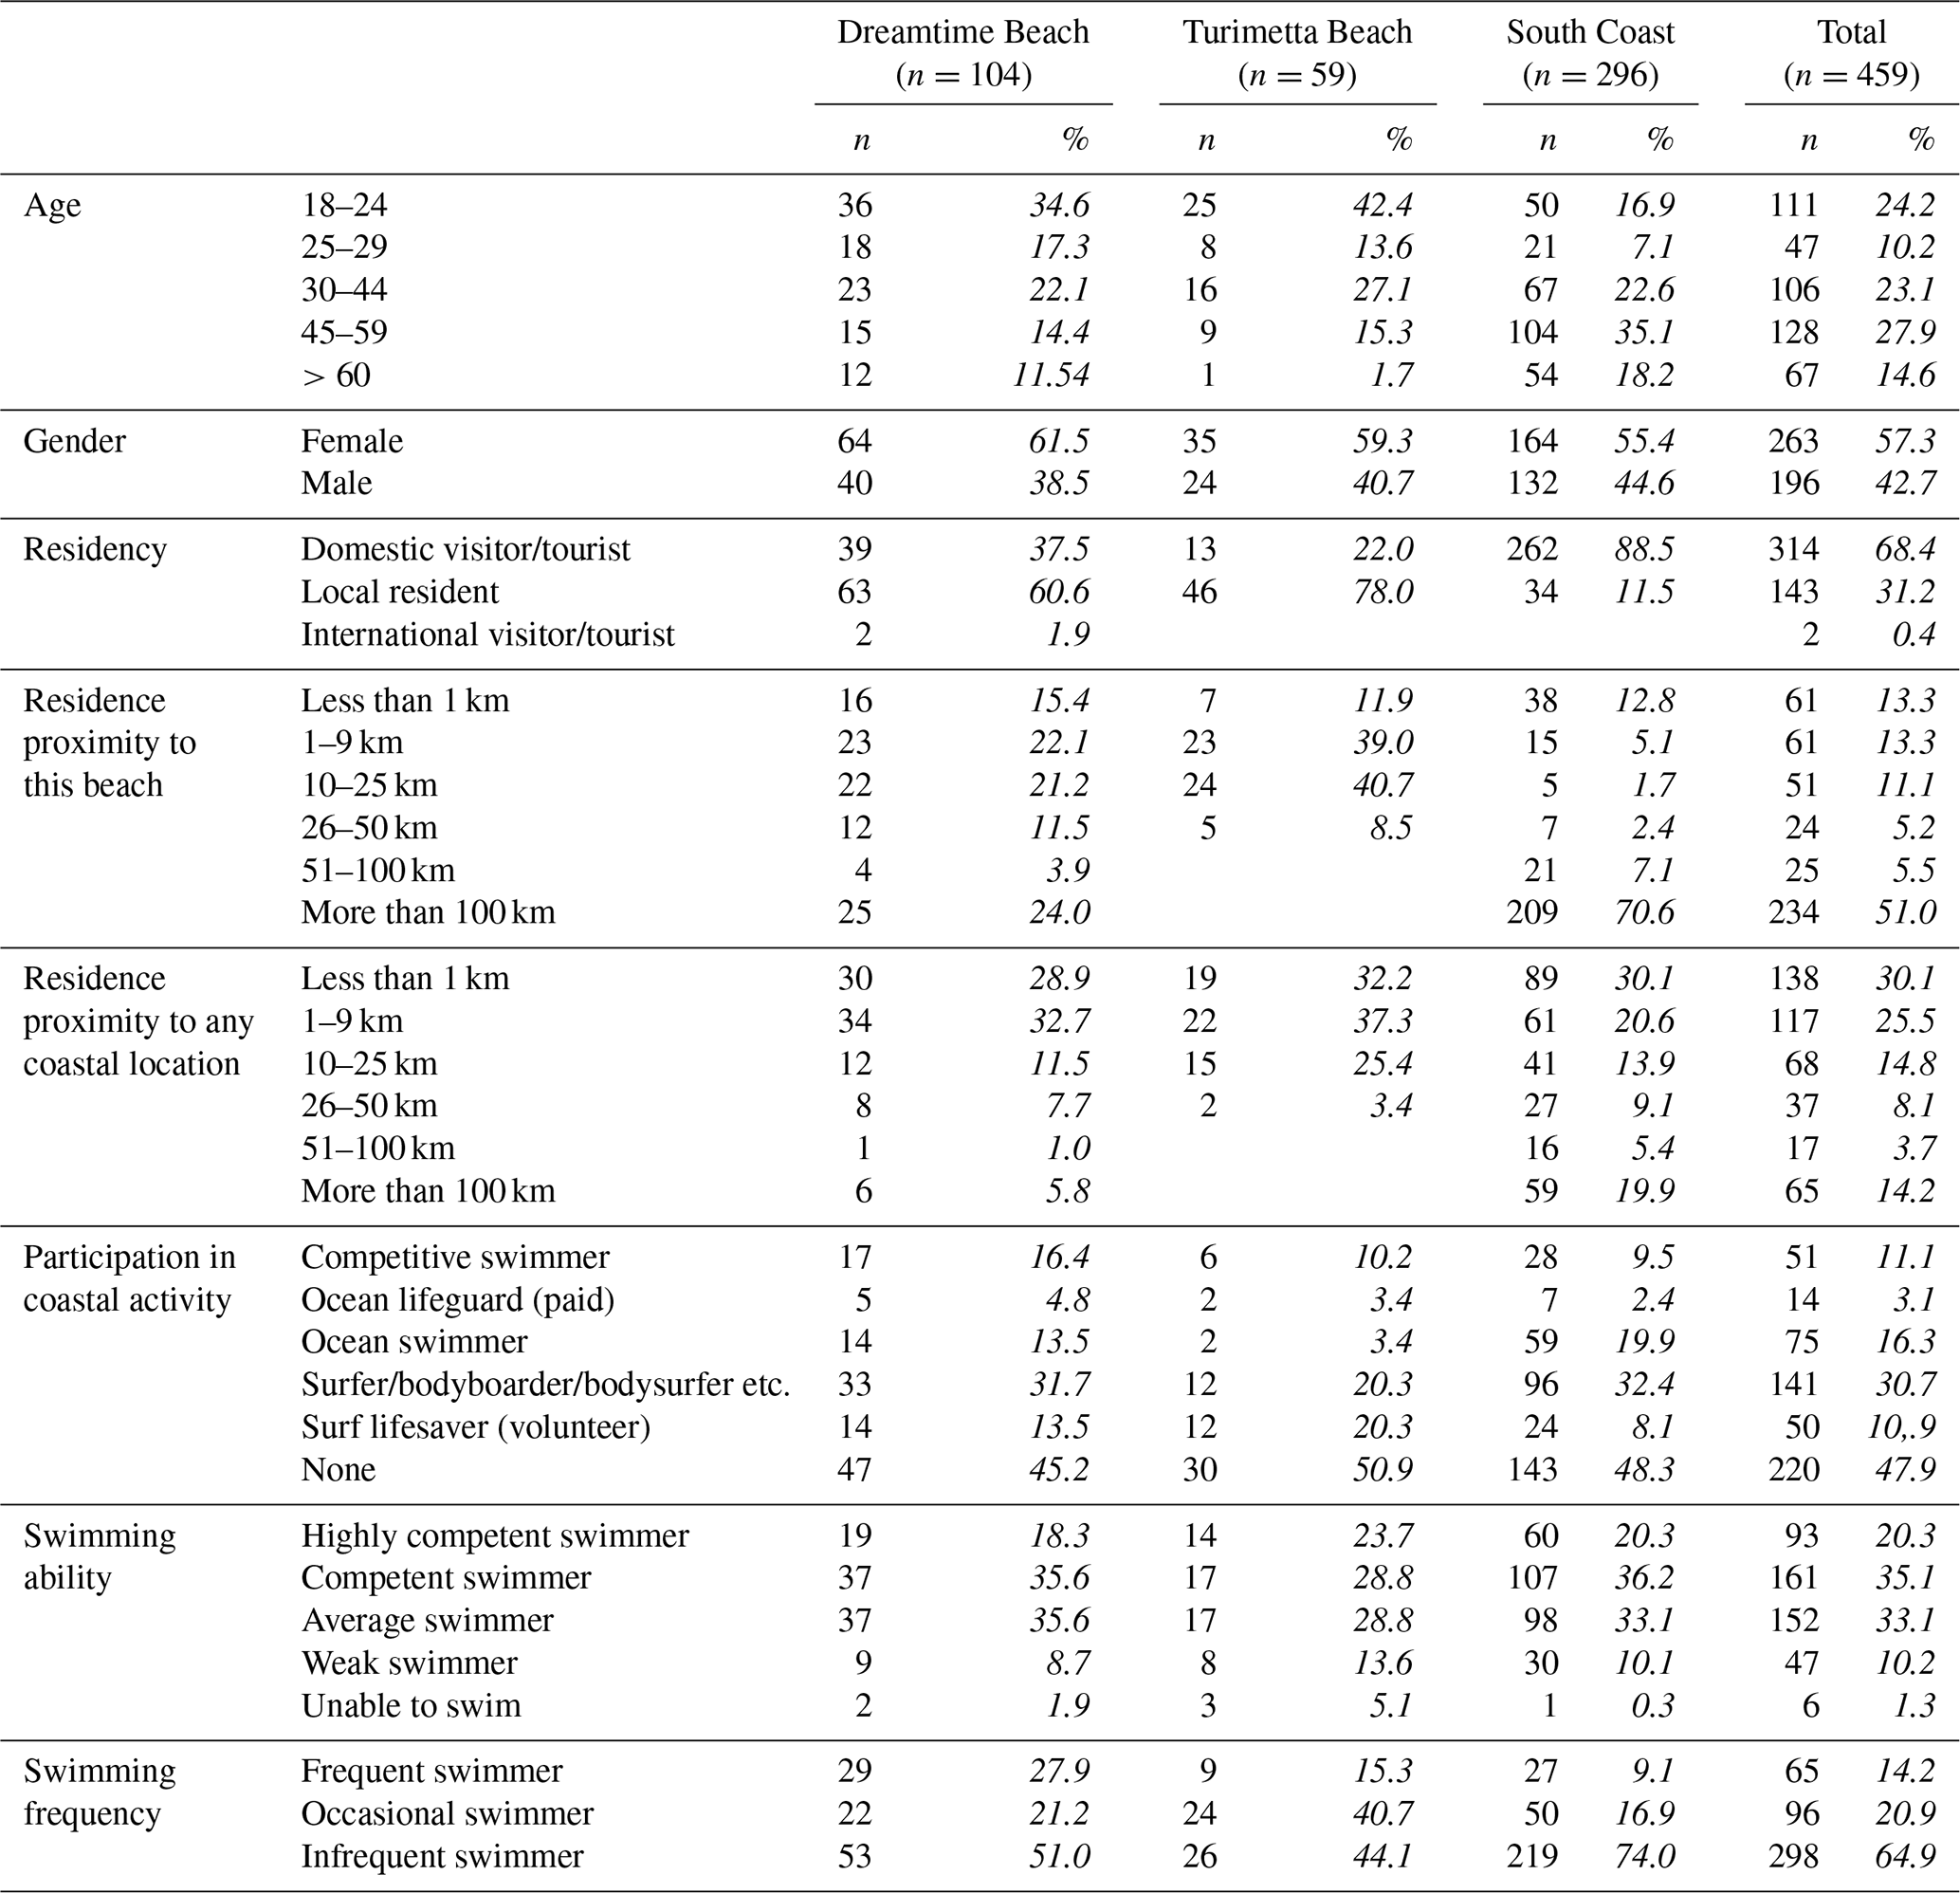
The majority of respondents at the South Coast beaches (88.5 %) were domestic visitors who lived greater than 100 km away from the surveyed beach (70.6 %; Table 1). In contrast, most respondents at Turimetta Beach (78.0 %) and Dreamtime Beach (60.6 %) were locals who lived within 10 km (50.5 %) and 25 km (58.7 %) of their beaches respectively (Table 1). Approximately 55 % of all survey respondents (55.6 %) lived within 10 km from any coastal location (Table 1) and 82.4 % had lived in Australia all their life. Owing to COVID-19 travel restrictions, only two respondents identified as international visitors and these were subsequently grouped into the domestic visitor/tourist category in later analyses.
3.2 Beachgoer experience, swimming ability, and behaviour
Almost half of the respondents (47.9 %) did not consider themselves to be surfers, bodyboarders, bodysurfers, ocean/competitive swimmers, or active or previously active surf lifesavers/lifeguards and this was consistent across all beaches (Table 1). Although 68.2 % of respondents rated their ocean swimming ability as competent (35.1 %) or average (33.1 %), 11 % self-identified as poor swimmers who can't swim 25 m without stopping or touching the bottom (10.2 %) or were unable to swim (1.3 %; Table 1). Most respondents (64.9 %) identified as being infrequent swimmers, swimming at ocean beaches 3–11 times per year or less and this was particularly the case at the South Coast (74.0 %; Table 1). Only 14.1 % of all respondents identified as being frequent ocean swimmers (Table 1).
Almost half of all respondents visited the beach they were surveyed at frequently (48.2 %), particularly at Turimetta Beach (61.0 %). Of note, one in five respondents (21.4 %) were visiting the beach they were surveyed at for the first time. Just over half (55.6 %) of all surveyed respondents visited the beach with their family, followed by a group of friends (27.2 %) or a friend (14.2 %). Results varied between beaches, with more than two-thirds (69.9 %) of South Coast respondents visiting with their family compared with 22.0 % at Turimetta Beach who visited the beach alone.
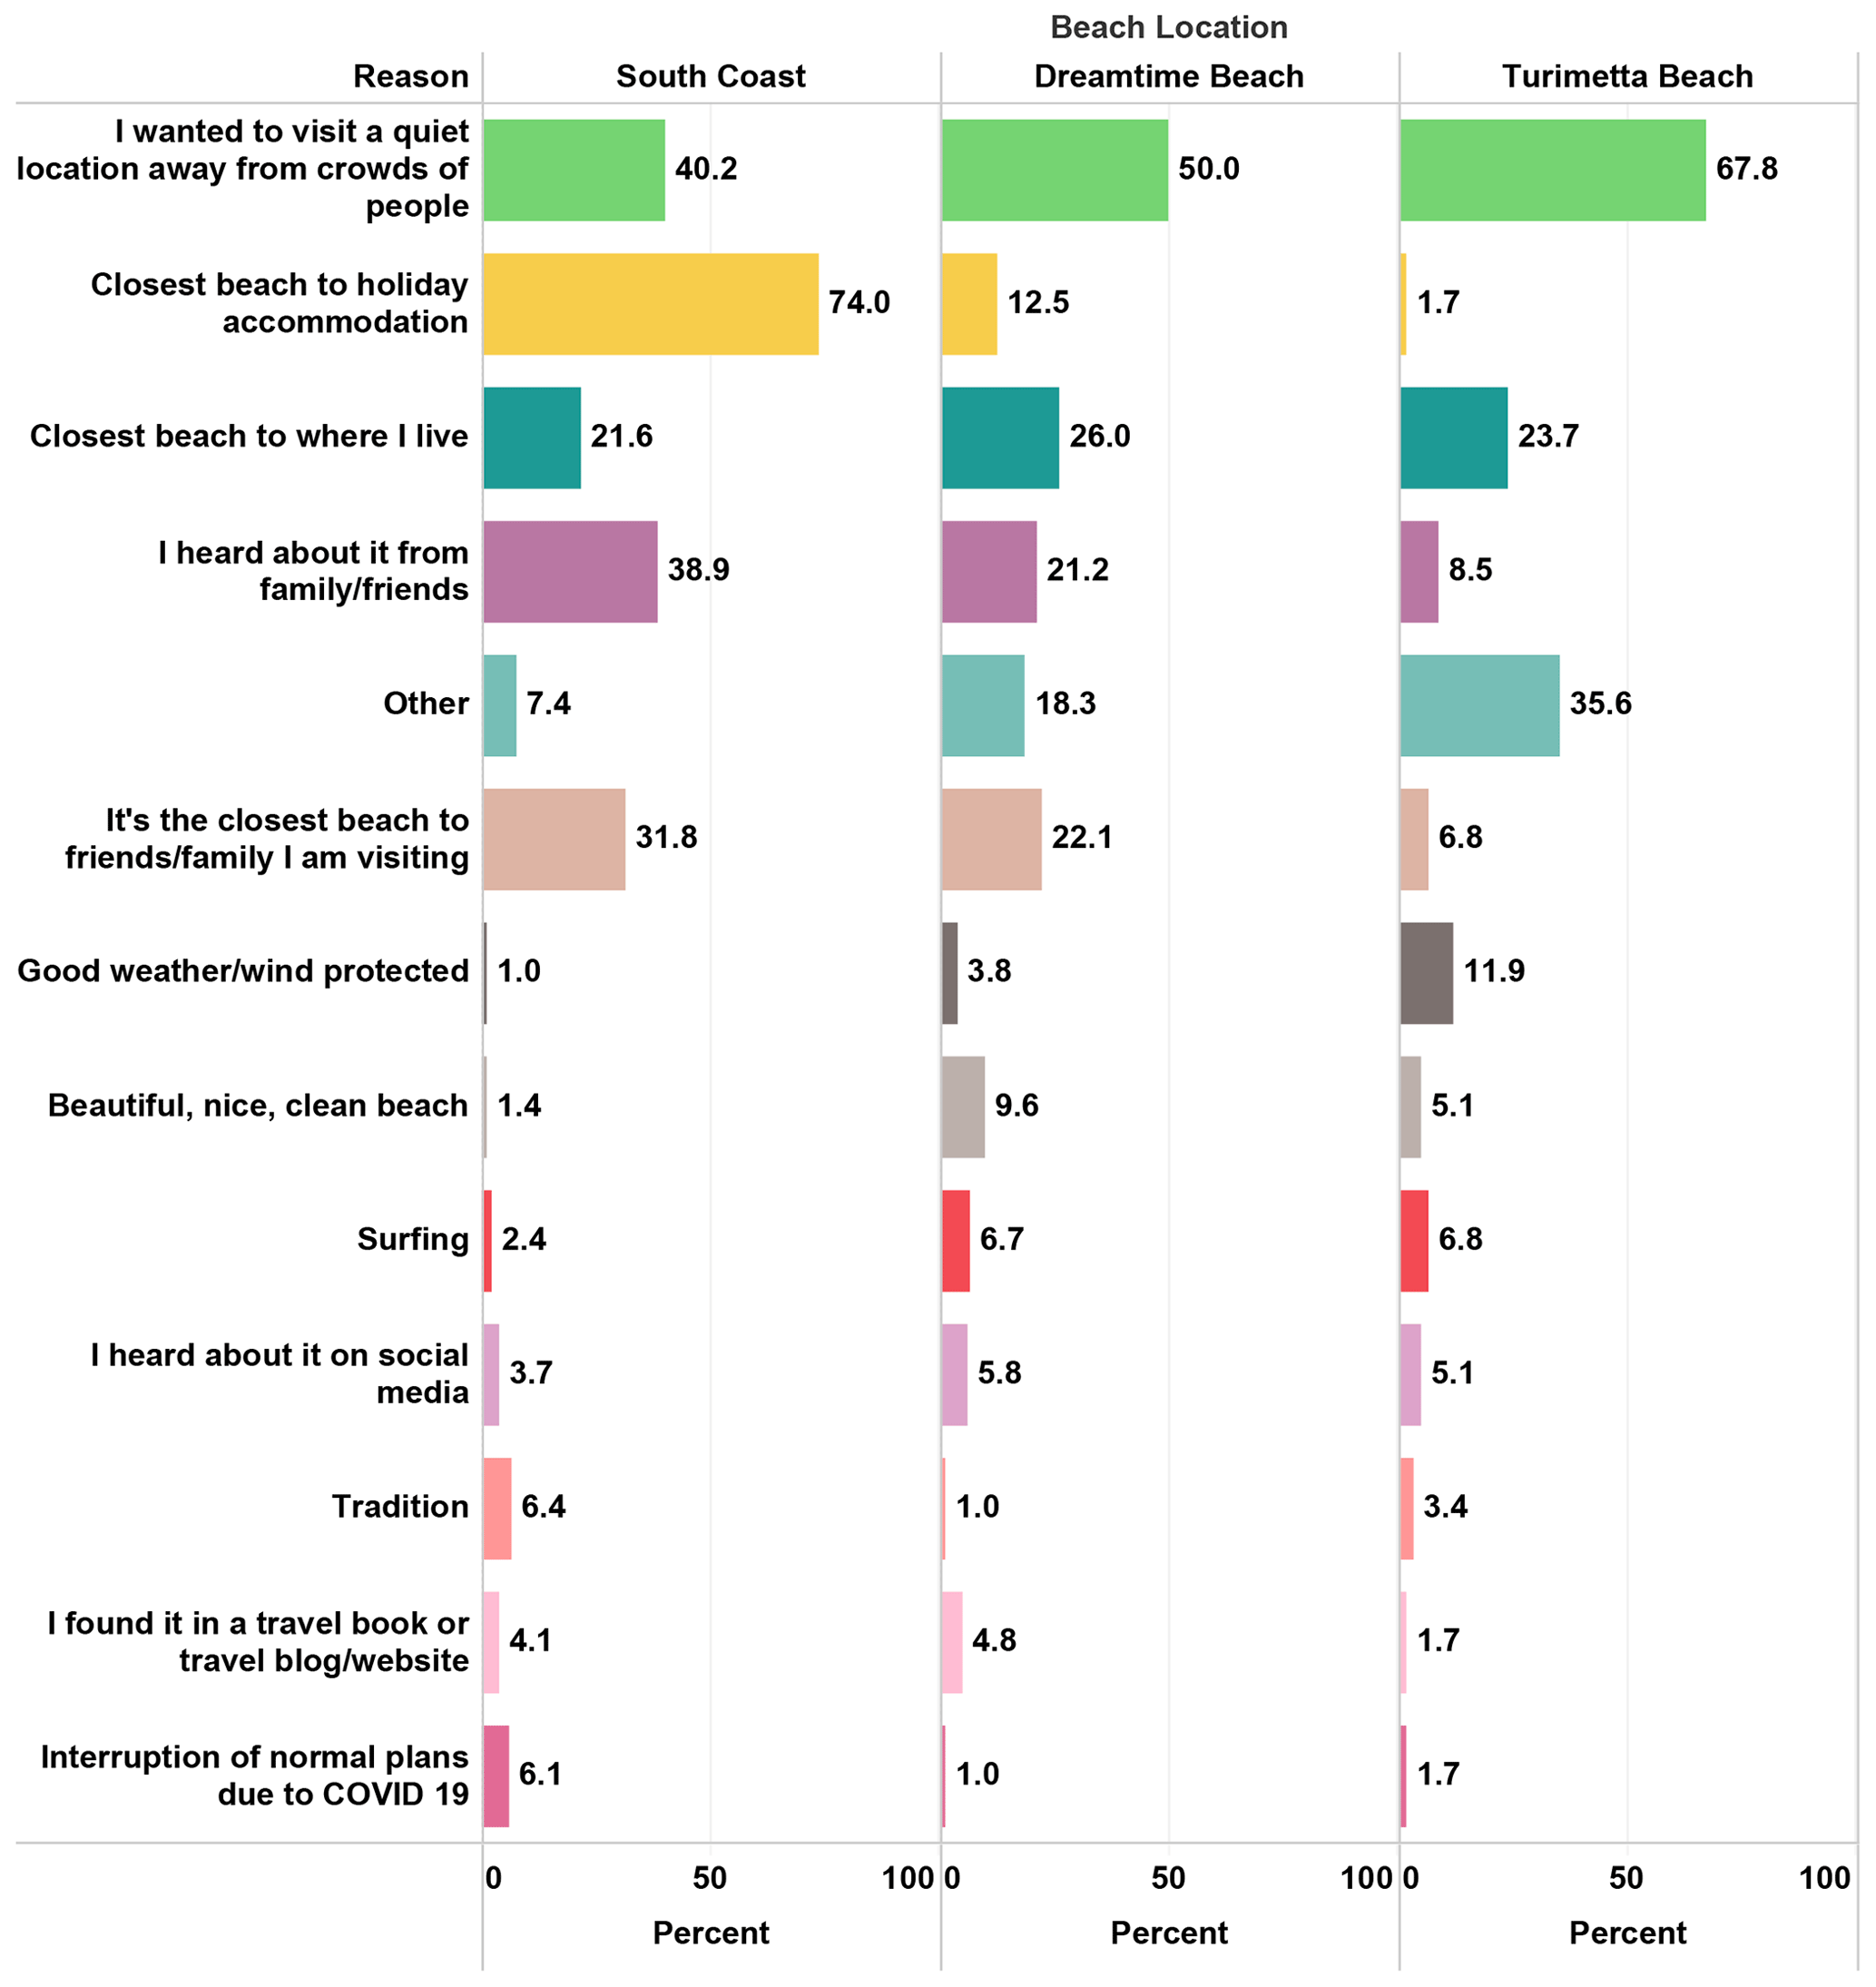
Figure 2Most cited reasons why surveyed beachgoers visited unpatrolled beaches. Values next to coloured bars are percentages (%). The total number of responses exceeds 100 % as each respondent could name up to three reasons. The number of times a reason was mentioned was divided by the number of beachgoers (South Coast: n=296, Dreamtime Beach: n=104, Turimetta Beach: n=59).
Respondents were asked to provide the main three reasons why they had chosen to visit the unpatrolled beach at which they were surveyed (Fig. 2). The main reason at the South Coast beaches (74.0 %) was that it was the closest beach to holiday accommodation. At Turimetta Beach (67.8 %) and Dreamtime Beach (50.0 %) it was because they wanted to visit a quiet location away from crowds, although this was also a common reason for South Coast beach visitation (40.2 %; Fig. 2). Respondents also visited the beach because it was the closest beach to where I live and they heard about it from family/friends (Fig. 2). Despite the absence of lifeguards, 93.3 % of all respondents would recommend visiting the beach they were surveyed at to others, primarily because of the beautiful scenery (34.2 %) and because it is quiet, secluded, and uncrowded (24.9 %).
Almost all surveyed beachgoers intended to go in the water (85.6 %, n=393) at the beach they were visiting. However, although 26.0 % of respondents at Dreamtime Beach did not intend to go in the water, this was likely related to poor weather and hazardous surf conditions experienced in the first week of surveying at Dreamtime. Of note, more than 60 % of respondents (64.9 %) who intended to go in the water identified as infrequent beach swimmers and 62.2 % of respondents who were weak swimmers or unable to swim also indicated that they intended to enter the water. Simple logistic regression indicated that swimming ability was associated with intention to enter the water (p<0.001): a competent swimmer was 4.87 times (95 % CI: 0.82–28.82) and a highly competent swimmer was 11.12 times (95 % CI: 1.55–79.84) more likely to go in the water than a non-swimmer.
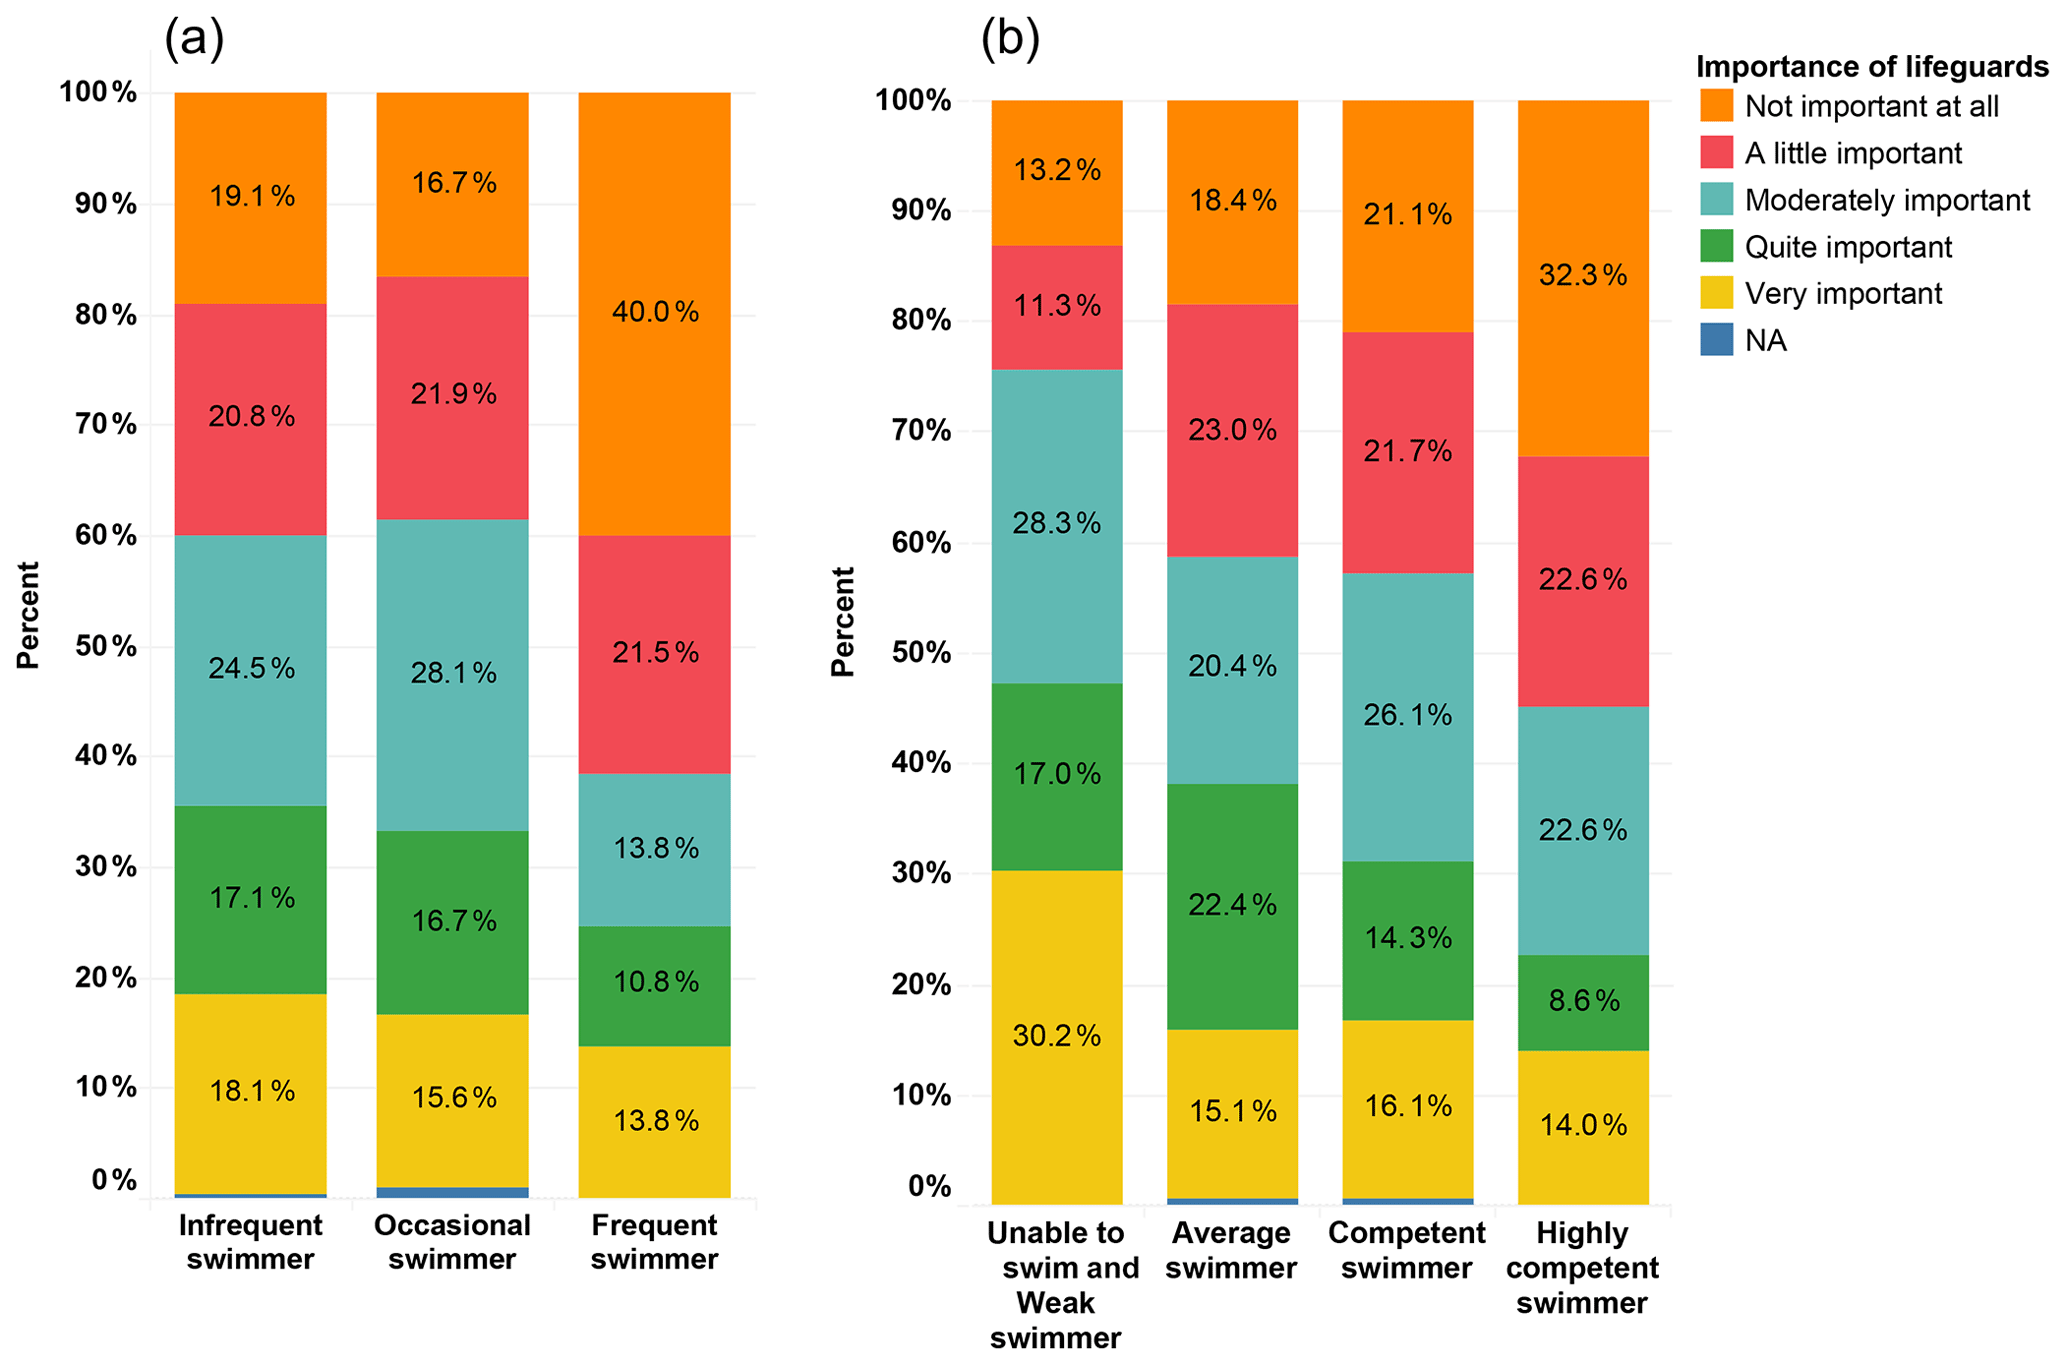
Figure 3Beachgoers' evaluation of the importance of lifeguards compared with their swimming frequency (a) and their swimming ability (b). Beachgoers who were unable to swim (n=6) and weak swimmers (n=46) were combined for ease of analysis.
3.3 Beach safety and hazards
The majority (92.6 %) of respondents knew that the beach they were visiting was unpatrolled, with no lifeguards or lifesavers present (Table 1). Almost half (42.7 %) of all respondents rated the presence of lifeguards as not important at all (21.6 %) or a little important (21.1 %); less than 20 % (17.0 %) rated the presence of lifeguards or lifesavers as very important. More respondents at Dreamtime Beach (35.6 %) and the South Coast beaches (35.1 %) considered the presence of lifeguards to be quite important/very important than at Turimetta Beach (18.6 %). On average, males valued the presence of lifeguards less than females did, with 53.6 % rating the presence of lifeguards as not important at all (29.1 %) or a little important (24.5 %) compared with 34.6 % of females (W=30 430, p<0.001, r=0.157 – weak effect). Older respondents valued the presence of lifeguards more with 41.4 % of 45- to 59-year-olds and 41.8 % of those aged >60 years rating it as quite important or very important, compared with only 24.3 % of the 18- to 24-year age group. However, despite the apparent differences, no statistically significant relationship was found between age and the importance of lifeguards (H(4)=11.244, p=0.024, f=0.128 – weak effect). Domestic visitors also had a higher perception of the importance of lifeguards than local residents (W=26 308, p=0.002, r=0.134 – weak effect).
There is evidence that swimming ability (H(4)=16.449, p=0.002, f=0.164 – weak effect) and swimming frequency (H(2)=10.257, p=0.006, f=0.136 – weak effect) have an impact on someone's perception of the importance of lifeguards. Only 30.2 % of those who identified as weak swimmers or unable to swim indicated that the presence of a lifeguard is very important, whereas almost a quarter (24.5 %) rated the presence of lifeguards as not important at all or a little important. Furthermore, 40 % of frequent swimmers rated the presence of lifeguards as not important at all in contrast to 19.1 % of the infrequent swimmers and 16.7 % of occasional swimmers (Fig. 3).
Respondents were asked how hazardous they thought it was to swim or wade at the beach they were visiting. Of note, according to Short (2007), the surveyed beaches are rated as moderately hazardous or as highly hazardous. Almost half (46.3 %) of the South Coast respondents perceived the beach as not very hazardous, whereas 42.4 % at Turimetta Beach considered it to be somewhat hazardous. 44.2 % of respondents at Dreamtime Beach believed it to be extremely hazardous or very hazardous, possibly because of the larger and rougher surf conditions present during the survey period. There was a significant difference between hazard perception and gender (W=29 431, p=0.005, r=0.121 – weak effect) and hazard perception and residency (W=14 038, p<0.001, r=0.311). Approximately 46.8 % of females and 60.2 % of males rated swimming or wading as not very hazardous or not at all hazardous. Moreover, local residents had a slightly higher hazard perception, with 40.6 % rating the beach they were visiting as somewhat hazardous compared with 42.1 % of domestic visitors rating it as not very hazardous.
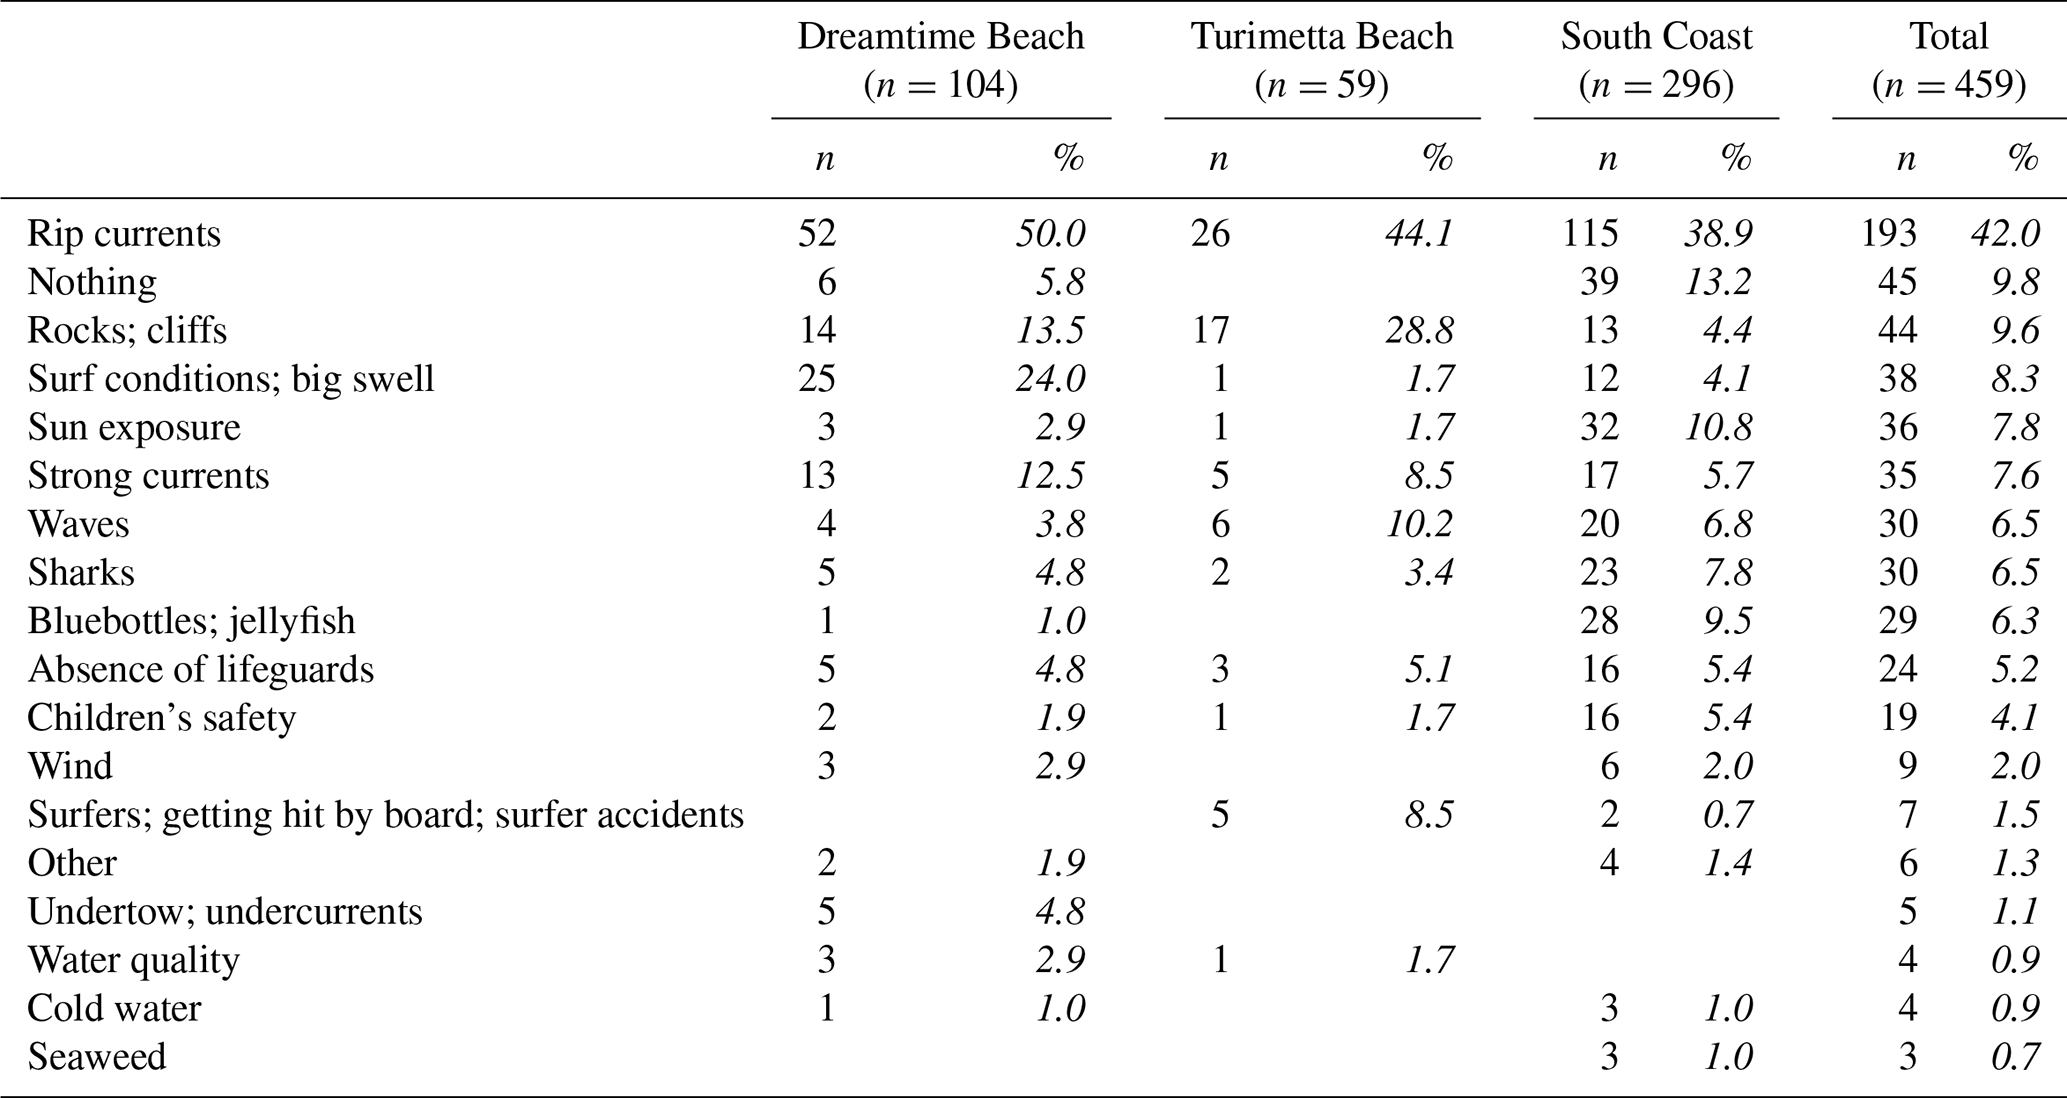
Table 2Safety and hazard concerns at Dreamtime Beach, Turimetta Beach and the South Coast (total number of responses is greater than 459, as some survey respondents provided multiple answers). Percentages shown in italics were calculated by dividing by the total number of respondents.
A significant difference was also found between home residence proximity to any coastal location and hazard perception (H(5)=19.025, p=0.002, f=0.183 – weak effect). Combining all beaches, almost one-third (29.4 %) of respondents who lived greater than 51 km from the coast rated swimming and wading as not at all hazardous compared with only 9.4 % of those who live between 1 and 9 km away from any coastal location. Although there was a statistically significant relationship between self-reported swimming ability and hazard perception, the effect size was weak and the differences in proportions small (H(4)=15.036, p=0.005, f=0.158 – weak effect). All six people who self-reported being unable to swim rated the beach they were visiting as extremely hazardous (50.0 %), very hazardous (16.7 %), or somewhat hazardous (33.3 %). In contrast, many (range: 48.7–57.0 %) respondents from all other swimming ability categories rated the beach as not very hazardous or not at all hazardous.
Respondents were asked to provide an open text answer for what they are most concerned about in terms of safety and hazards at the beach they were visiting. Responses were split into 18 separate codes, with rip currents considered to be the primary hazard on all five beaches, with 42.0 % of all coded responses (Table 2). Respondents were also concerned about rough surf conditions (24.0 %) at Dreamtime Beach, the rocks and cliffs at Turimetta Beach (28.8 %), and the sun exposure at the South Coast (10.8 %), although 13.2 % of South Coast respondents had no concerns (Table 2).
Respondents were asked if they knew the meaning of the red and yellow flags on Australian beaches, with 95.9 % answering yes. Those respondents were then asked to explain the meaning of the flags in words. A correct response included at least one of the following concepts: they designate a safe swimming area, are an area patrolled by lifeguards/lifesavers, and that people should swim between them. The majority of these respondents provided a correct definition (89.3 %). Some of the incorrect answers (n=20) indicated that the red and yellow flags are separate flags, with red indicating dangerous areas where swimming is not allowed (n=17). Other respondents believed that a yellow flag indicated surf conditions requiring caution and care for swimming (n=8). Beach safety signs were present at public access paths leading to all five beaches (Fig. 4). About half of the respondents at Dreamtime (51.9 %) and Turimetta (55.9 %) noticed safety signs, whereas only a quarter (25.7 %) noticed warning and safety signage at the South Coast beaches.
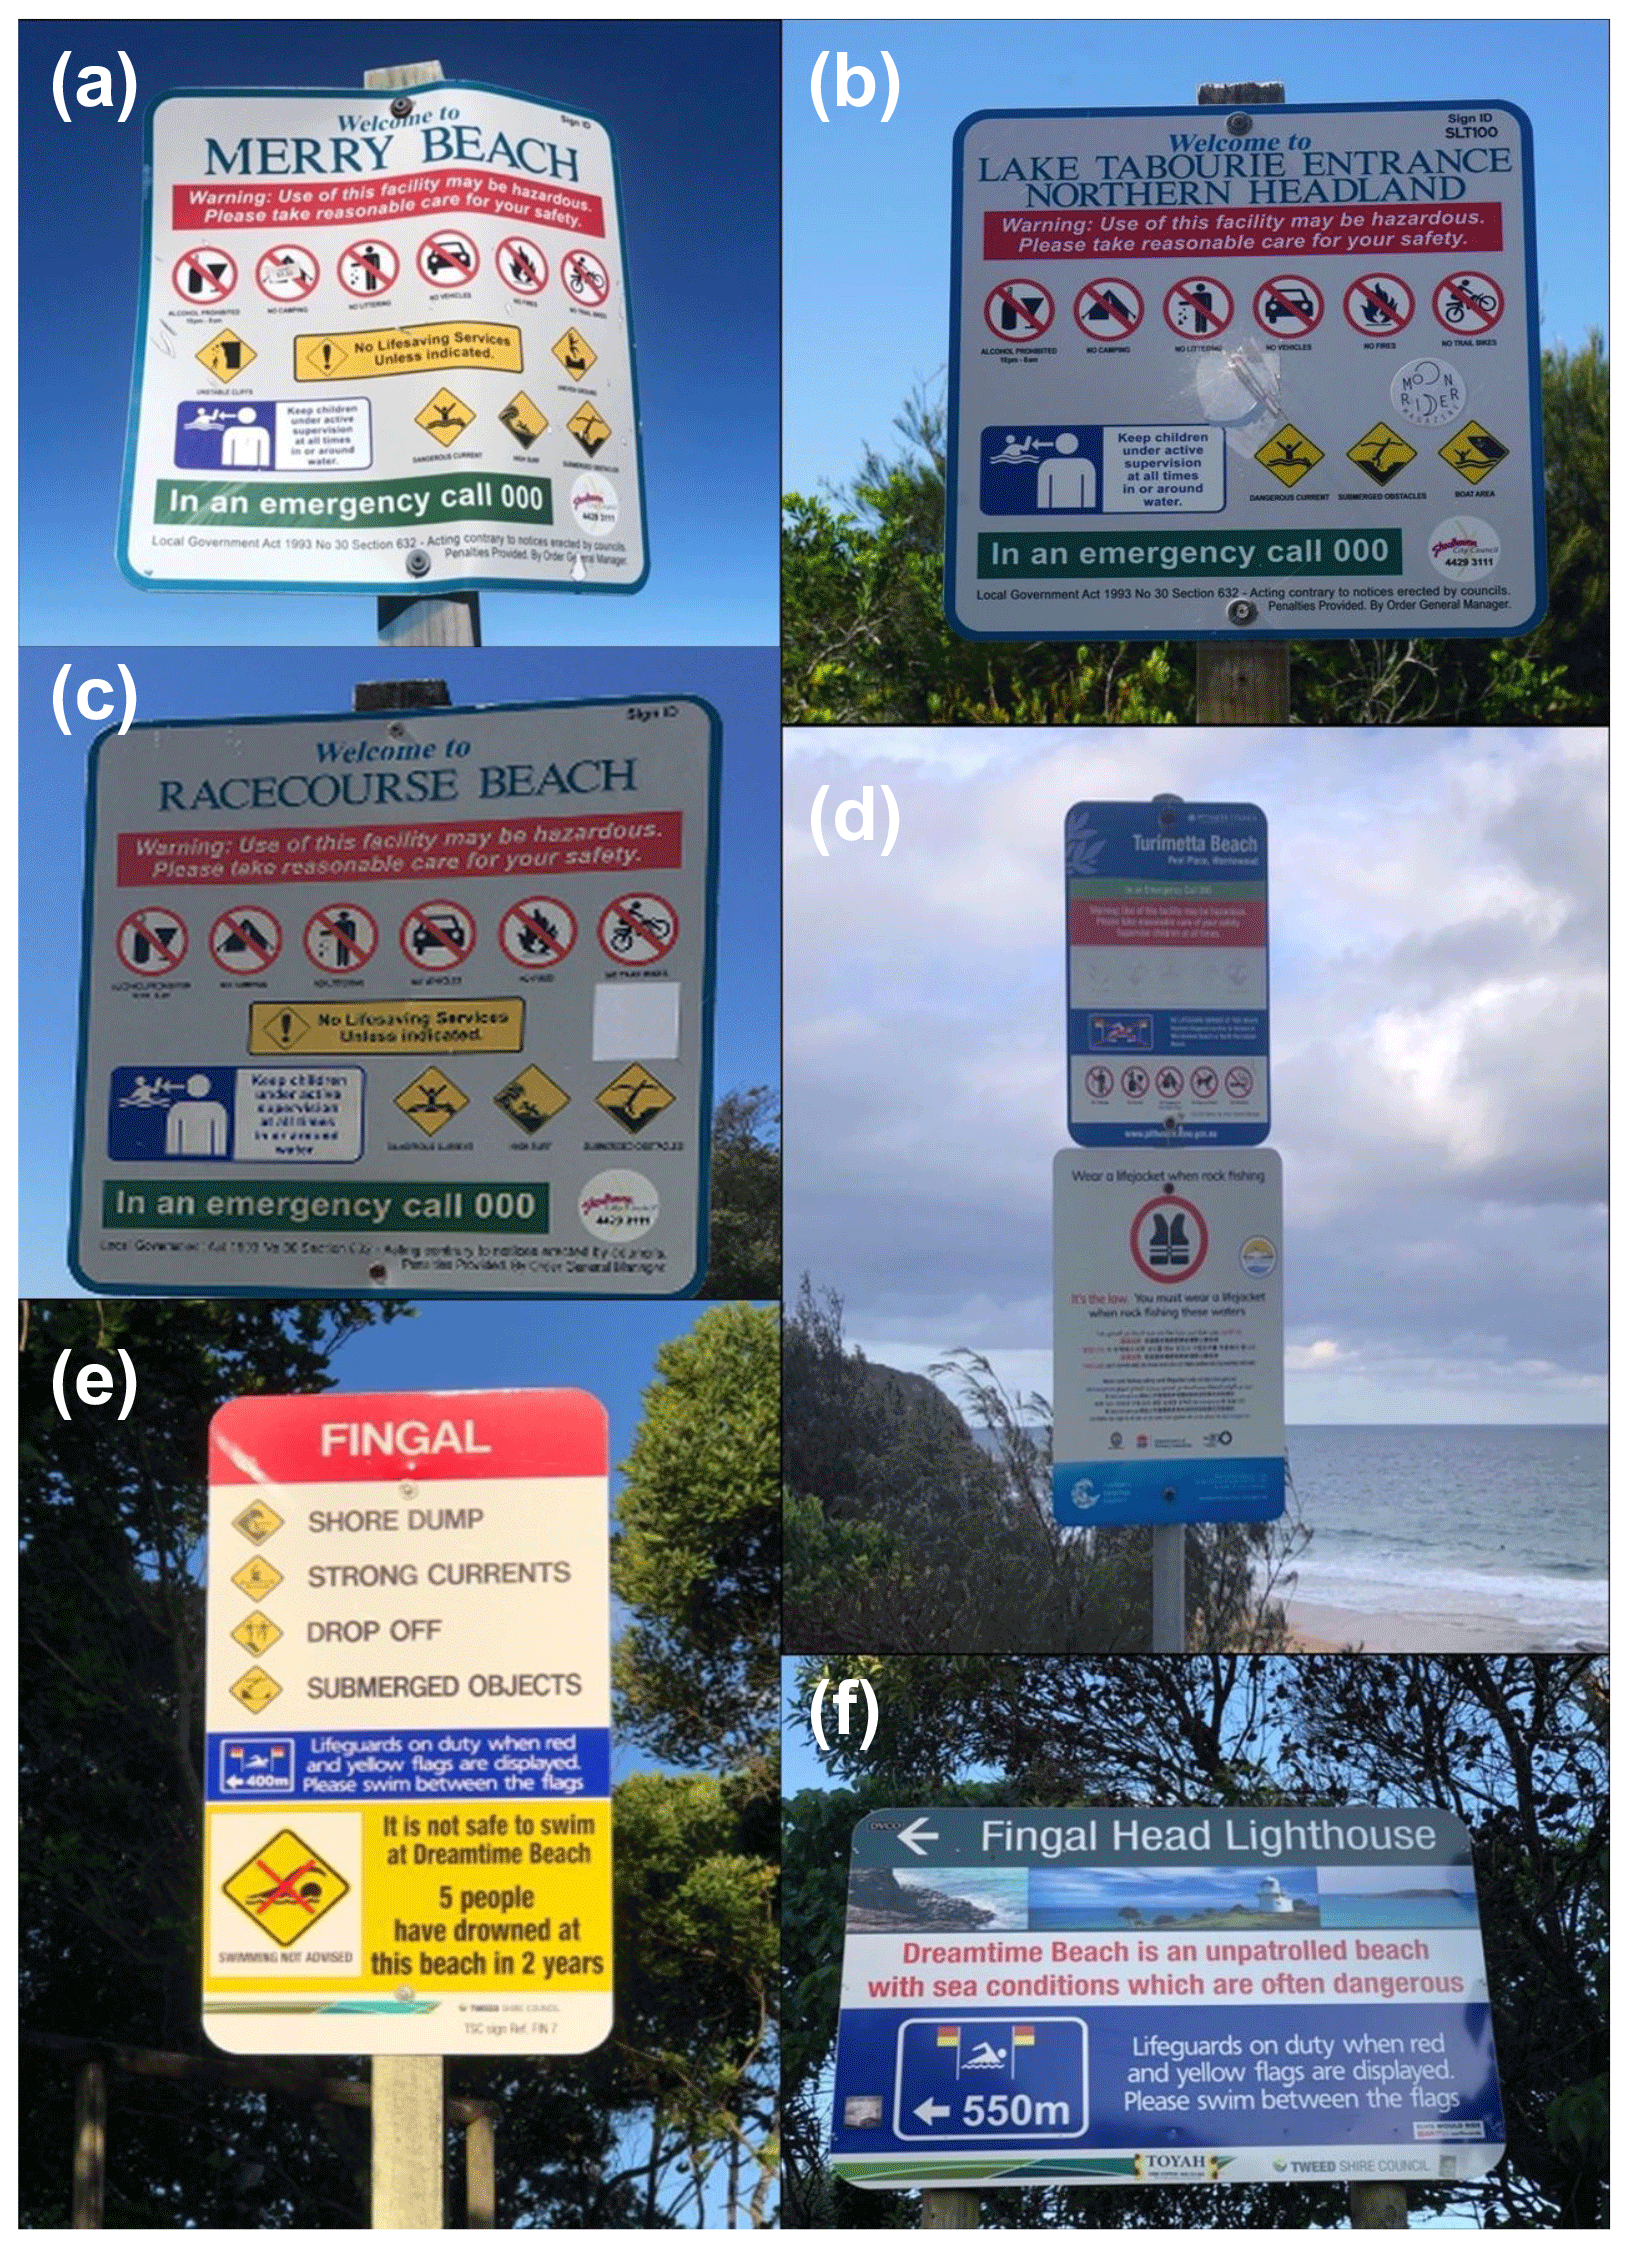
Figure 4Beach safety signs at: (a) Merry Beach; (b) Tabourie Beach; (c) Racecourse Beach; (d) Turimetta Beach; (e, f) Dreamtime Beach. (a)–(c) were the South Coast beaches. Photos courtesy of Lea Uebelhoer (a–c), William Koon (d), Robert W. Brander (e, f).
3.4 Rip current knowledge
When asked if they knew what a rip current was, 88.9 % of all respondents answered yes. Only 3.7 % of South Coast respondents answered no, compared with 10.6 % of respondents at Dreamtime Beach and 8.5 % at Turimetta Beach. Respondents who answered that they know what a rip current is, or were unsure, were then asked to describe what a rip current is in an open text answer. Responses were classified as “correct”, “incorrect”, or “partially correct”. A response was deemed “correct” if the respondent identified the concept of a strong current or a flow of water heading offshore. If only one of these concepts was included, the response was classified as “partially correct”. Two-thirds (66.9 %) of the respondents who believed that they know what a rip current is, provided a correct definition, whereas 20.8 % were partially correct and 9.6 % were incorrect. However, of all responses, 59.9 % were correct, 19.8 % partially correct, and 10.2 % incorrect. More respondents at the South Coast (66.9 %) were correct than at Dreamtime Beach (49.0 %) and Turimetta Beach (44.1 %).
Respondents were then shown a photograph of a beach with two identifiable rip currents present (Fig. 5) and were asked to indicate where they would enter the water to swim or wade. Of note, the photo was taken at Merry Beach on a date outside of the South Coast survey period. Although most respondents (72.8 %) chose a safe swimming spot away from the rip currents, almost a quarter (24.6 %) would have entered the water directly into a rip current. Fewer people marked the rip current at Turimetta Beach (16.9 %) than at Dreamtime Beach (27.9 %) and the South Coast (25.0 %).
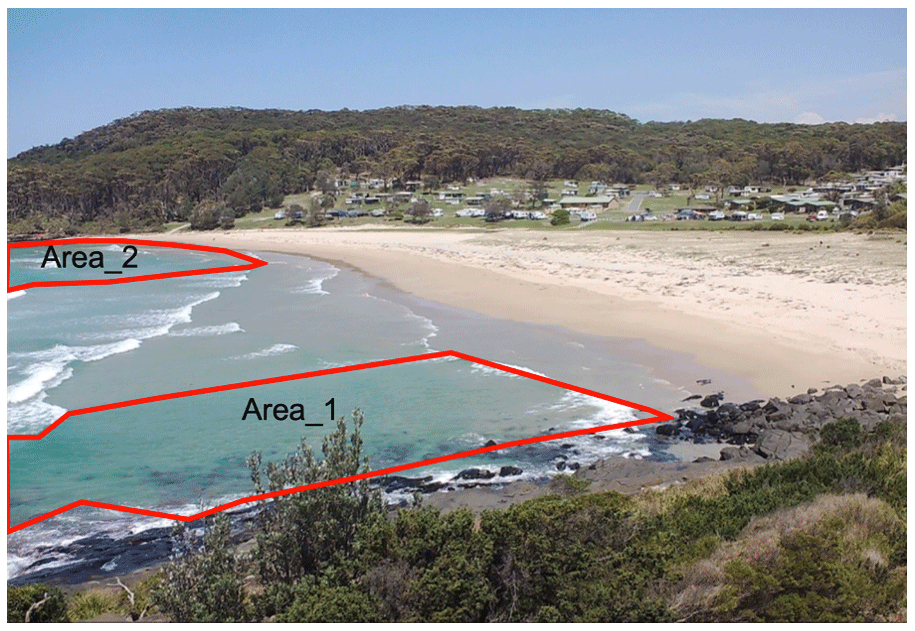
Figure 5Photo of Merry Beach (taken from the remote camera) used to test beachgoers' choice of swimming location with red polygons (Area_1; Area_2) indicating rip current locations. Respondents were shown a clean (and larger) image. Note that the image was not taken during the survey period. Image courtesy of Mitchell D. Harley.
Respondents who indicated that they know or are unsure what a rip current is were then asked to evaluate their own ability to visually spot a rip current, with 44.7 % being somewhat confident and 25.5 % being very confident in their ability to do so. In terms of location, respondents were not at all confident or not very confident in similar proportions at the different beaches (Dreamtime Beach: 31.7 %; Turimetta Beach: 25.4 %, South Coast: 23.0 %). There was a significant difference between rip identification confidence and gender, with males being more confident than females (W=15 592, p<0.001, r=0.306 – medium effect). For example, 39.8 % of all males were very confident in their ability to identify a rip current compared with 14.4 % of all females. Moreover, 82.2 % of respondents who were not at all confident were female.
A statistical association also existed between swimming ability and rip identification confidence (H(4)=64.444, p<0.001, f=0.403 – strong effect). Respondents who were better swimmers had a higher perception of their ability to visually identify a rip current. Just over half (53.8 %) of the highly competent swimmers reported to be very confident in this regard, compared with 17.1 % of average swimmers and 14.9 % of weak swimmers. Conversely, there was no difference between beach swimming frequency and identifying a rip current with confidence (H(2)=9.359, p=0.009, f=0.131 – weak effect). Almost half of the infrequent (45 %) and occasional (49 %) swimmers were somewhat confident, whereas 36.9 % of the frequent swimmers were very confident.
To specifically test rip current identification ability, a different question showed respondents six different beach photos taken from different perspectives and asked them to mark the area in the image where they thought a rip current was located (Fig. 6). With the exception of Photo 3 (Fig. 6c), which did not have a rip current, all of the images contained channel rip currents identifiable by narrow and elongated dark gaps between areas of whitewater. It should be noted that none of the images in Fig. 6 was of beaches involved in the survey. However, they represented rip currents present on NSW beaches that had similar morphological beach types and beach hazard ratings to those in the study and presented a range of surf conditions that were representative of conditions observed during the surveys (Supplement 1).
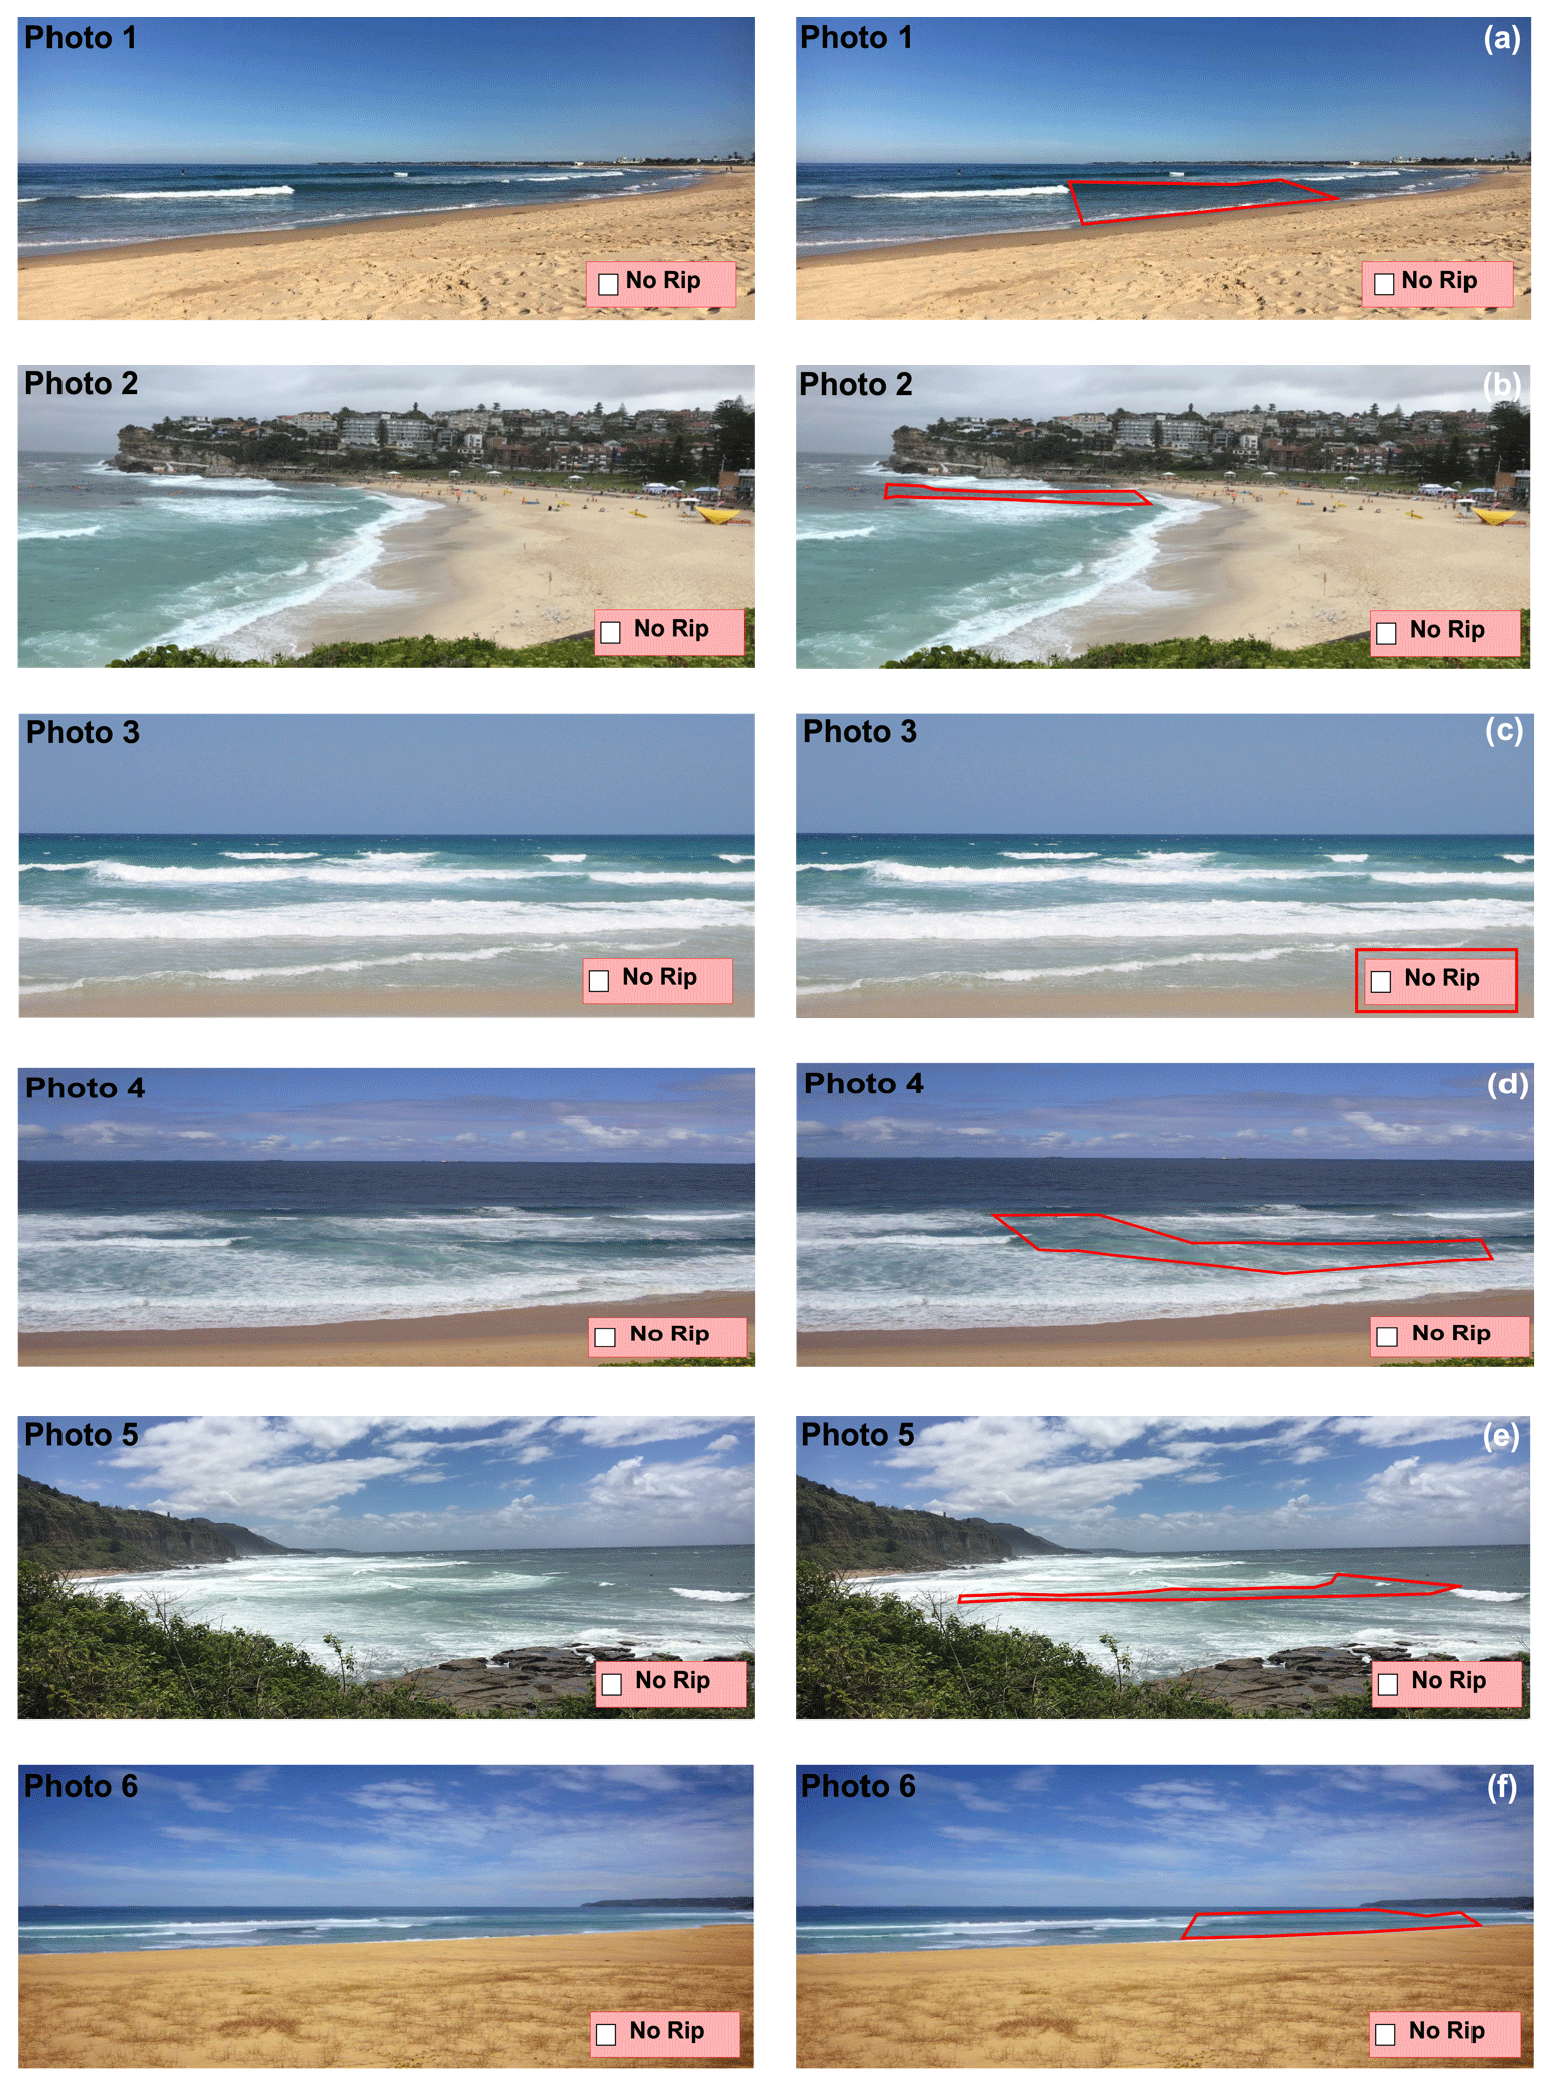
Figure 6Images that were used to assess beachgoers' ability to identify rip currents in photos. The polygons on the right side (red area) highlight the location of the rip current. If respondents placed an “x” within these areas, they were correct. Photos 1 and 2 (a, b) and 4–6 (d–f) contain a rip current while Photo 3 (c) does not. During the survey, respondents were shown the photos on the left with no polygons and the size of the rip photos was larger as they were shown on a 20×15 cm tablet screen and only one photo was presented at a time. The pre-determined polygons already include a small buffer to avoid possible unwanted incorrect responses. Photos courtesy of Robert W. Brander.
Respondents were able to mark the location of the rip current by tapping on the photo on the tablet or marking it directly on the hardcopy survey with an “x”. If respondents could not identify a rip current, or did believe that a rip current was present, they were asked to tick the no rip box. Correct answers had to be within the polygons defining the rip current area (Fig. 6). The polygons were drawn based on the collective opinions of the authors, who have considerable experience in rip current identification. However, it is acknowledged that there is some degree of error involved in this process. Responses that correctly identified the location of the rip current in the photo or correctly identified that there was no rip current (Fig. 6c) received a “1” whereas other responses were assigned a “0”. This allowed a rip score to be created ranging from 0 (no correct answers) to 6 (all answers correct).
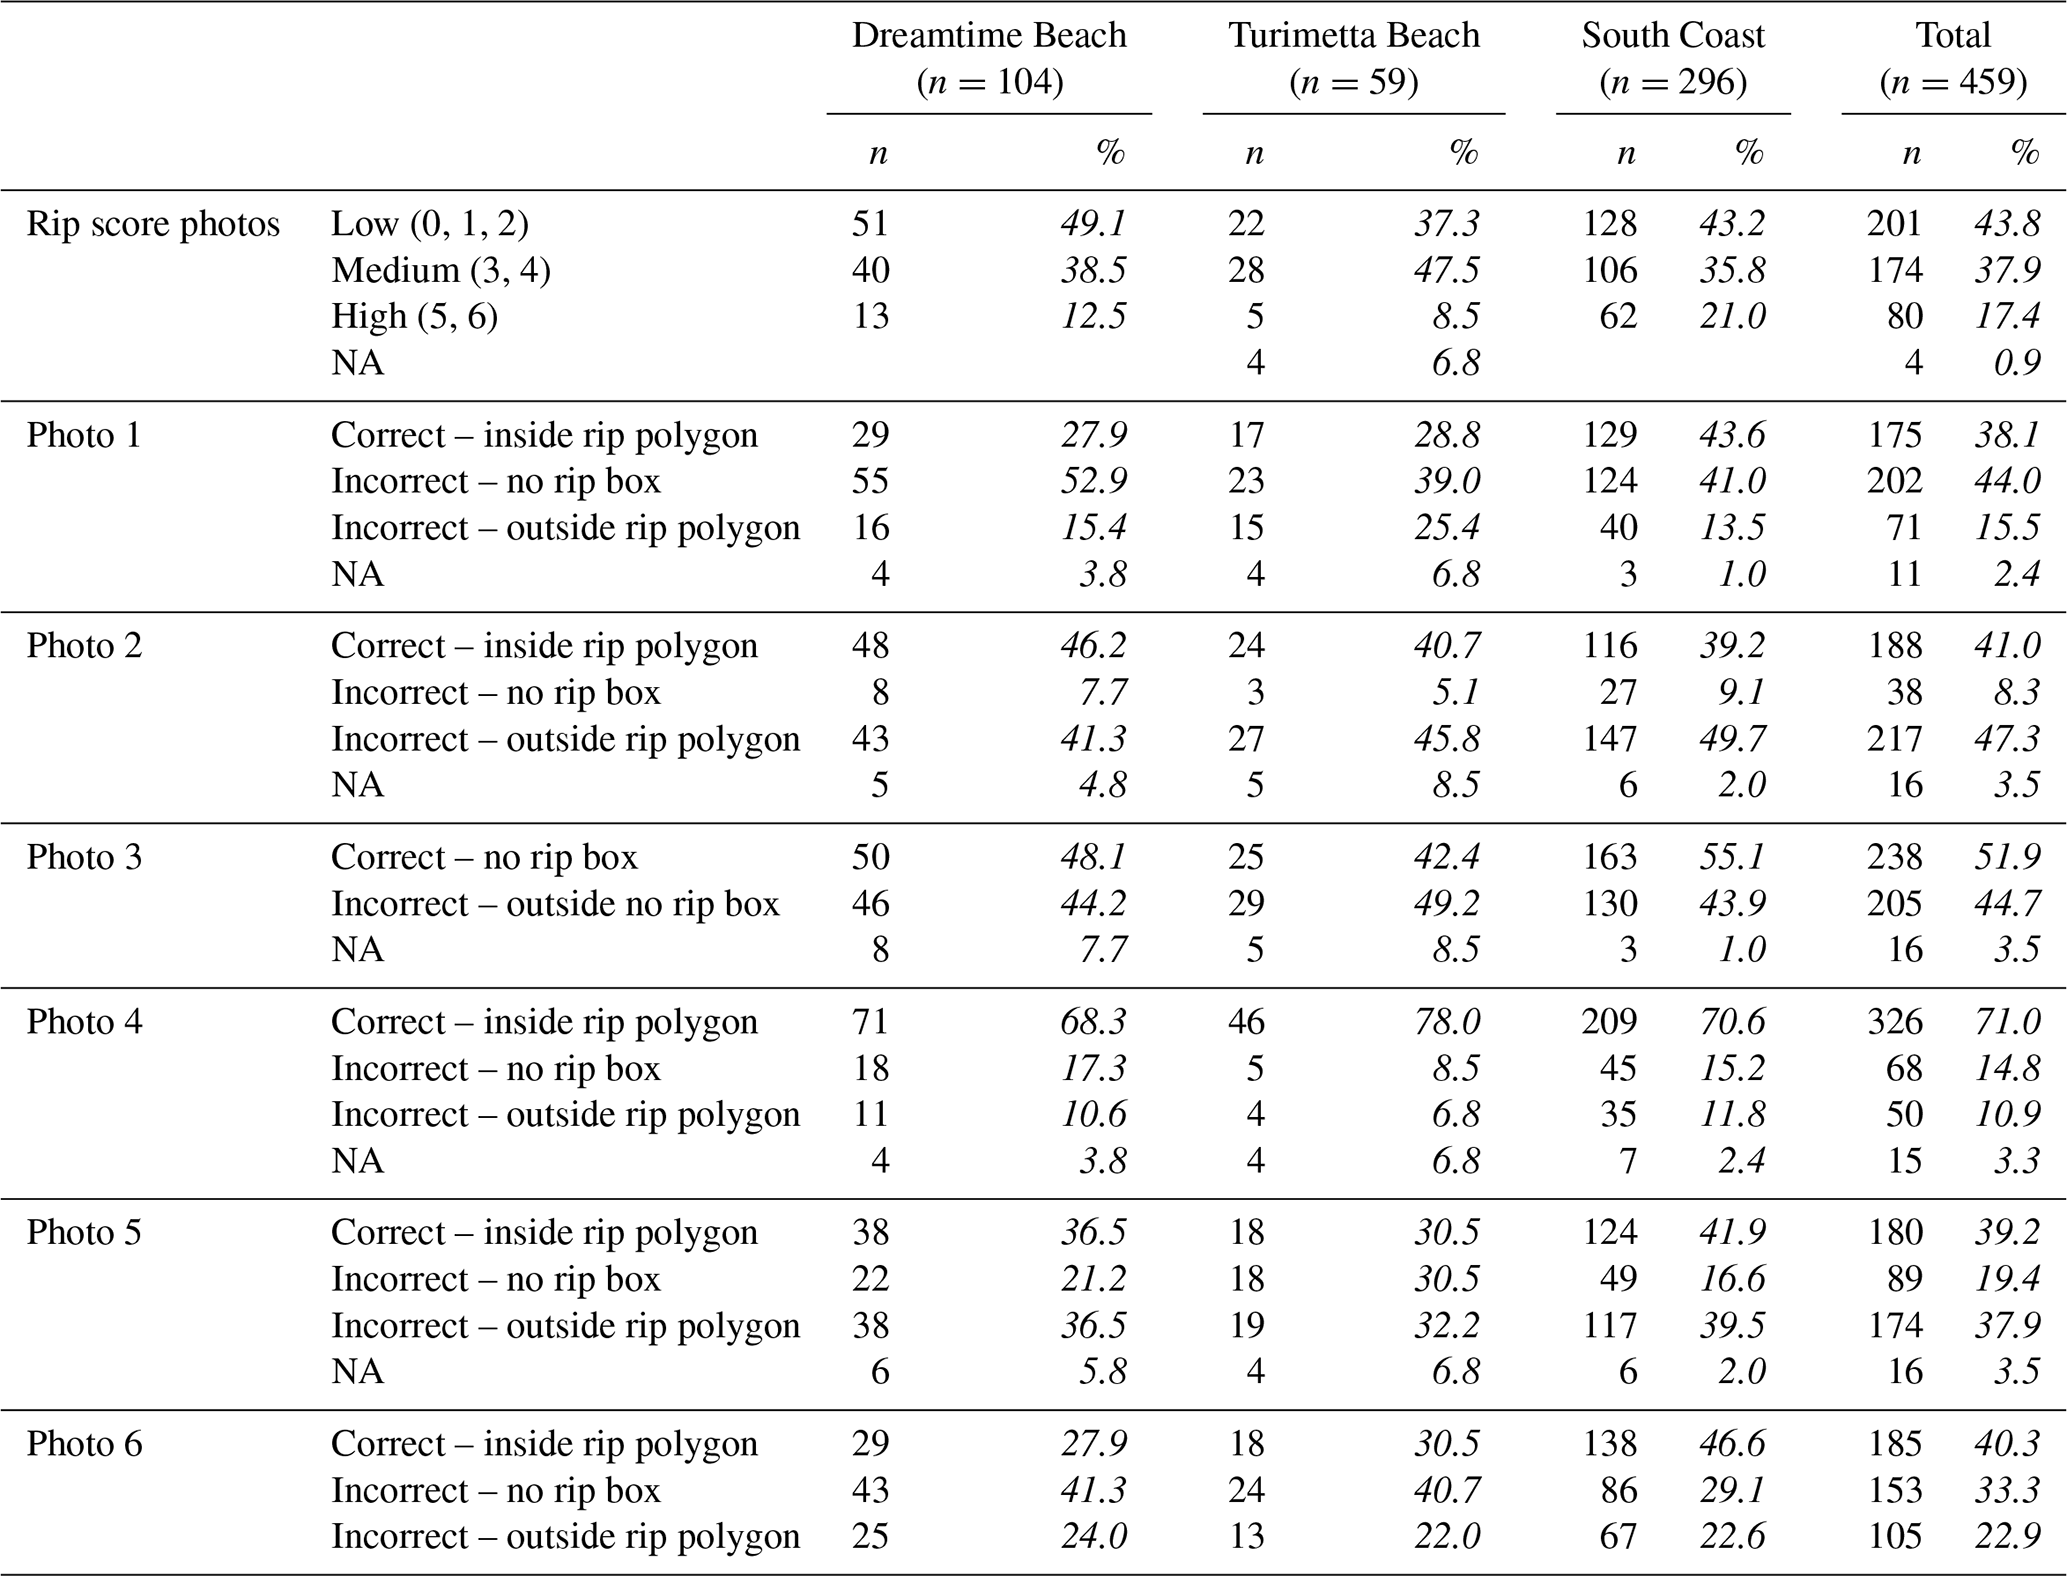
Despite the overall high level of confidence in their ability to identify rip currents, almost half (43.8 %) of all respondents had “low” rip scores (0–2 correct answers) and only 17.4 % answered correctly in five or more photos (Table 3). In terms of location, respondents at South Coast beaches were more proficient at identifying rip currents whereas those at Dreamtime Beach were least proficient (Table 3). Most respondents (71.0 %) correctly identified the rip current in Photo 4 (Fig. 6d), but only 38.1 % were able to spot the rip current in Photo 1 (Fig. 6a; Table 3). No difference existed between rip score and age (R2=0.0251, , p=0.022) or gender (W=21 784, p=0.010, r=0.108 – weak effect). Despite no statistically significant relationship between rip score and gender, males were slightly better at identifying rip currents with a mean score of 3.1 than females, with 2.7. Almost half (48.3 %) of the females were low scoring compared with 37.8 % of males. Swimming frequency (R2=0.0154, , p=0.030) and swimming ability (R2=0.0114, , p=0.271) had no impact on someone's rip score. Infrequent swimmers had a mean score of 3, compared with a score of 2.8 for frequent swimmers and 2.5 for occasional swimmers.
Table 3Survey respondent rip scores from the images shown in Fig. 6. A “low” score was defined as 0–2 correct answers, “medium” as 3–4, and “high” as 5–6. The bottom half of the table shows if respondents were able to correctly identify the rip current (marked the location inside the rip polygon) or if they believed that there was no rip current (“no rip box”). Photo 3 did not have a rip current and thus beachgoers who ticked the “no rip box” were correct. NA refers to people who did not answer the question. Percentages are shown in italics.
Overall, the unpatrolled beach users surveyed in this study exhibited several key risk factors that have important implications and create challenges for authorities responsible for beach safety and management. Similar to the general Australian population (SLSA, 2021), 96 % of respondents knew the meaning of the red and yellow flags on Australian beaches. Almost all (92.6 %) were aware that the beach they were visiting was unpatrolled by lifeguards, yet most (88.9 %) still intended to go in the water and would recommend the beach to others (93.3 %). This was particularly concerning, because almost half (44.7 %) identified as being average, weak, or non-swimmers, almost two-thirds (64.9 %) were infrequent beach swimmers, and 21.4 % were visiting the beach for the first time. Although rip currents were the primary hazard that beachgoers were concerned about, many respondents were unable to correctly explain what a rip current was (10.2 %), or identify them in photographs, despite confidence in their ability to do so (38.5 % of the somewhat confident and very confident respondents had a score of 2 or less).
It should be acknowledged that the results of this survey-based study are subject to a variety of well-known response biases that are inherent in many types of questionnaires, such as agreement bias, prestige bias, and confirmation bias (Choi and Pak, 2005; Ménard et al., 2018; Davies, 2020). These types of bias also apply to previous studies involving surveys of beachgoer safety knowledge (Sherker et al., 2010; Williamson et al., 2012; Caldwell et al., 2013; Brannstrom et al., 2014; Fallon et al., 2018; Llopis et al., 2018; Locknick and Houser, 2021; Pitman et al., 2021). These studies were all conducted on beaches with lifeguards, with the exception of Sherker et al. (2010), who did not discriminate results from respondents on patrolled and unpatrolled beaches. Although direct comparisons of results of these previous studies are complicated owing to survey bias, the different methods of lifeguarding and flag usage in other countries, varying beachgoer demographics and cultural factors, variable physical environmental conditions, as well as differences in the nature of the survey questions themselves, many similarities exist with the findings of this study. Sherker et al. (2010) found that 93 % of Australian beachgoers, particularly males, felt that they could spot a rip current, but less than two-thirds actually could when shown photographs. Williamson et al. (2012) found that less than half of surveyed Australian beachgoers made the correct decision of where to swim when shown a photograph of a rip current. Of note, in a recent survey of beach safety knowledge of an Australian multi-cultural community, Woods et al. (2022) found that 83 % of surveyed respondents had heard of the red and yellow flags, but only 29 % said that they always swim between them, compared with 56 % of the general Australian population (SLSA, 2021), and approximately half had either never heard of a rip current, or had, but did not know what they were.
In the United States, surveys of beachgoers at Pensacola Beach, Florida (Caldwell et al., 2013) found that 57 % believed that they could spot a rip current, whereas only 15 % actually could, and at Miami Beach, only 31 % felt that they could identify a rip current (Fallon et al., 2018). The images shown in Photo 2 and Photo 5 in Fig. 6 were also used by Pitman et al. (2021) in a study of New Zealand beachgoers. In their study, 31 % of beachgoers were able to identify a rip current in both photographs and 26 % could identify a rip current in only one photograph. In comparison, 41 % and 39.2 % of beachgoers in this study correctly identified the rip current in Photo 2 and Photo 5 respectively (Table 3). The images shown in Photos 4 and 6 in Fig. 6 have also been used to assess rip current identification of the Australian public in an ongoing national representative online survey by Surf Life Saving Australia (Lawes et al., 2021). According to unpublished SLSA data (Jasmin Lawes, personal communication, 27 January 2022), 56 % and 35 % of surveyed Australians between 2016 and 2020 correctly identified the rip current in Photos 4 and 6 respectively (Fig. 6). These values are lower than those reported in this study, with 71 % and 40.3 % of respondents correctly identifying the rip currents in those pictures (Table 3). However, not all of the Australians surveyed by SLSA were beachgoers.
It should also be noted that there are inherent limitations involved in assessing rip current identification skills using still images. There are issues with the angle and perspective from which the photographs were taken in relation to real-world perspectives of beachgoers on the beach as well as ambiguity of the perceived appearance of rip currents and non-rip current areas. For example, although the polygons denoting the rip current locations in Fig. 6 are correct, it is possible that the gap in breaking waves below the polygon shown in Photo 2 (Fig. 6b) could be construed as a channel rip current by a respondent, even though it is a sandbar. Similarly, the region of dark water above the polygon in Photo 6 (Fig. 6e) could be interpreted as a rip current, when in fact it was not. These limitations have previously been identified by Hatfield et al. (2013), Ménard et al. (2018), and Pitman et al. (2021), who have all suggested that future rip identification skills should be assessed with the use of video.
Overall, there is little evidence to suggest that beachgoer knowledge of safety practices and the rip current hazard varies significantly between beachgoers on patrolled and those on unpatrolled beaches. However, given that more than 95.9 % of the surveyed beach users in this study were aware of the meaning of the red and yellow flags, the obvious question is: why did they choose to ignore the core Australian beach safety message to “swim between the red and yellow flags” at a patrolled beach?
This study has provided evidence that the main reasons why beachgoers visit unpatrolled beaches are either because they are conveniently close to their holiday accommodation, or they represent a desirable quieter location away from crowds. Furthermore, almost all (93.3 %) the surveyed beach users would recommend the (unpatrolled) beach they were visiting to others owing to the beautiful scenery and the fact that it was “quiet and uncrowded”. Of particular concern, almost half (42.7 %) of the beach users surveyed, including many poor or non-swimmers, did not view lifeguard presence as being a particularly important factor for choosing a beach to visit. Caldwell et al. (2013) also found that the presence of lifeguards was not as strong a determinant of beach choice as recommendations from family and friends, ease of access, and proximity to accommodation. Williamson et al. (2012) suggested that rural beachgoers might also have been more likely to swim at remote beaches that are not patrolled. These results suggest that for many beachgoers convenience and aesthetic factors outweigh safety considerations when choosing to visit a beach. These findings go some way to explaining why 67 % of coastal drowning deaths in Australia recorded since 2004 have occurred more than 1 km away from lifesaving services, many at unpatrolled beaches (SLSA, 2021).
Implications for beach safety management
A major challenge in Australia, and internationally, has been to encourage beachgoers to always swim near lifeguards and avoid swimming, or never swim, at unpatrolled beaches. The findings of this study suggest that this aspiration is unrealistic. There are simply too many accessible unpatrolled beaches and, taken in isolation, valid reasons why people will continue to visit them and enter the water to swim, despite the risk factors described previously. The next question is: how can we keep people safe on unpatrolled beaches?
The first and most obvious answer is to expand lifeguarding services. Even incremental augmented services, for example, seasonally or on weekends, would make popular unpatrolled beaches safer. However, large-scale expansion and implementation of services to many new, currently unpatrolled, beaches comes with significant cost and logistical challenges. Regardless, expanded lifeguard and surf lifesaving services should be a top safety priority for local governments with unpatrolled beaches within their jurisdiction. Strong consideration of the impact of the tourist accommodation industry must be a core component of decision making in where, when, and how to expand services. Collaborative advocacy between water safety organizations and industry could be an effective tool in preventing coastal drowning and injury by supporting an increase in the number of patrolled beaches in the state.
The reliance on warning signage at unpatrolled beaches, and the common call for more and better signage following drowning deaths (McCutcheon, 2018), also has limitations. More than half the beachgoers surveyed in this study did not see any signs, despite some being quite large and prominent (Fig. 4). These findings are supported by Matthews et al. (2014) who reported that 45 % of respondents did not notice any beach safety sign and that the shape and how the sign is organized has no impact on people's recognition and recall ability of warning signage. Similar results were reported by Brannstrom et al. (2015), with 47.8 % of respondents not noticing any beach safety signs. Although needed, warning signs are not necessarily as effective as authorities may assume (Matthews et al., 2014; Brannstrom et al., 2015) and, as is evident in Fig. 4, considerable variability exists between the content and presentation of information on these signs.
A recent beach safety technology conference identified new technology (Beach Safety Research Group, 2021) that may increase swimmer safety at unpatrolled beaches. The establishment of emergency beacon stations, whereby beachgoers can alert emergency services about an incident immediately and, in some cases, access a flotation device to assist in a bystander rescue, may save not only the life of the individual in distress, but also the bystander rescuer. Technology may also play a future role with the potential use of drones, which have primarily been used in beach safety in relation to shark surveillance (Claesson et al., 2017; Butcher et al., 2019; Ajgaonkar et al., 2020), but also have the potential to be used to identify rip current locations. However, in the case of unpatrolled beaches, there is a logistic constraint of requiring a trained and certified operator to be present. The installation of low-cost remote video cameras has been shown to have the potential to monitor the number and location of people on beaches in real time (Guillén et al., 2008; Morgan, 2018; Provost et al., 2019) and could be used by authorities to monitor peak usage times on unpatrolled beaches, which would have implications for future lifeguard provision.
Findings of this study have also identified different risk profiles of unpatrolled beaches based on beach user characteristics that have implications for the future development and dissemination of beach safety educational and awareness interventions. For example, the South Coast NSW beaches were dominated by domestic tourists, in particular families, who lived more than 100 km away from the beach. Most were infrequent beach swimmers and approximately half did not perceive the beaches they were visiting to be hazardous, with some having no concerns at all, despite the presence of breaking waves and rip currents. In this case, educational material and messaging could be developed around these themes and disseminated directly through holiday accommodation.
Dreamtime Beach is a popular social media destination, and although it did not receive the usual large number of international or domestic tourists during the survey period (likely because of COVID-19 travel restrictions), many beach users were regional day visitors who were largely not confident or competent at both swimming and identifying rip currents. This is concerning given the large number of rip current-related drowning deaths at this beach in recent years (McCutcheon, 2018). Educating this demographic is potentially more problematic, as the desire to obtain an “Instagram” picture may also over-ride safety concerns (Flaherty and Choi, 2016; Jain and Mavani, 2017; Gioia et al., 2020); however, the findings of this study present a potential safety intervention in this regard. In general, surveyed beach users who were locals perceived the unpatrolled beaches, and swimming at them, to be more hazardous than domestic visitors and those who lived further away from the beach. This stresses the need for coastal safety managers, in partnership with the tourism sector, to explore avenues for safety messaging and education targeting visitors. Given the popularity of social media to find these locations, utilizing existing social media tools, including paid targeted messaging for high-risk beach locations and visitor demographics, should be considered. Another approach could be to encourage locals, or experienced beachgoers, to provide safety advice to beach users who appear unaware of dangers at the beach, if necessary.
There were also differences in beach safety characteristics of beach users based on gender and age. Across all the unpatrolled beaches surveyed, males valued the importance of lifeguards less, and rated swimming as less as of a hazard than females. This difference in risk perception between genders is well documented in nearly all contexts and across all ages, showing that males are more likely to undertake risky behaviour (DeJoy, 1992; Savage, 1993; Gustafson, 1998; Moran, 2011; Willcox-Pidgeon et al., 2018). Older beach users were better able to identify rip currents and placed greater value on the presence of lifeguards. There are many examples of beach safety interventions in Australia, both past and present, that have attempted to prioritize males, particularly young males, who are overrepresented in drowning statistics and are more likely to take risks than females (Willcox-Pidgeon et al., 2018; Lawes et al., 2020; SLSA, 2021), tourists, and other at-risk populations in general with regard to beach safety, identifying rip currents, and the importance of swimming between the flags. However, the findings of this study suggest that Australia must move beyond the “swim between the flags” message and also directly target the safety of beachgoers who choose to swim on unpatrolled beaches as a high-risk demographic.
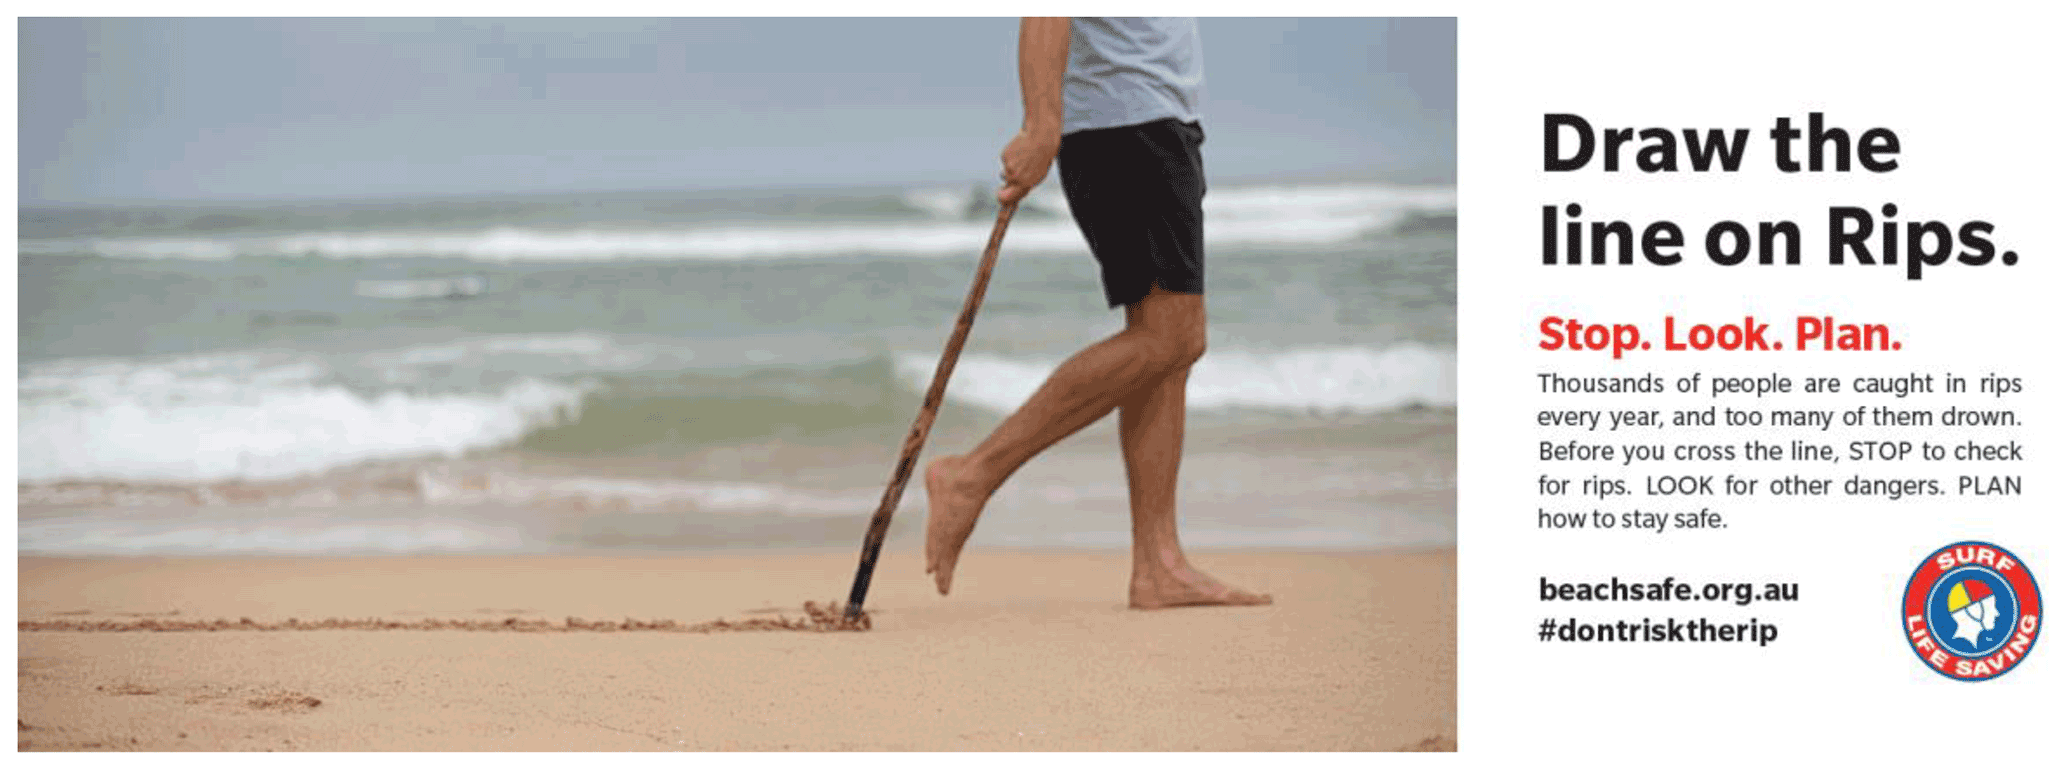
Figure 7Core graphic of the Surf Life Saving Australia “Think Line Campaign” (SLSA, 2021).
In this regard, as part of an ongoing coastal safety campaign to address rip current drowning by raising awareness and changing beachgoer behaviour, Surf Life Saving Australia developed “The Think Line Campaign” in 2018 (Fig. 7). This campaign introduced the concept of beachgoers drawing a real/imaginary line in the sand to remind them to “Stop” (to check for rips). “Look” (for other dangers). “Plan” (how to stay safe) before entering the water (SLSA, 2021). The “Think Line” messaging applies to any beach, particularly unpatrolled beaches, and although the campaign reports successful behavioural change after being exposed to the campaign (SLSA, 2021), the remaining challenge is increasing the community exposure of this message. This may be achieved through direct availability of beach safety material in coastal tourist accommodation near popular unpatrolled beaches, as well as collaborating with tourism agencies and social media platforms (e.g. Instagram) to promote beach safety information.
Finally, almost one-third of the surveyed beachgoers in this study identified as surfers, bodyboarders, or bodysurfers. During data collection, many more surfers were present in the water but not surveyed – a limitation of convenient sampling of beachgoer surveys such as in this study. Several studies have identified the valuable role that surfers perform as bystander rescuers, particularly as they have surfboards/bodyboards as flotation devices, are usually competent swimmers with the requisite ocean skills and knowledge required to navigate conditions in the surf zone, and commonly surf at unpatrolled beaches (Attard et al., 2015; Berg et al., 2021). In the absence of lifeguards and lifesavers, surfers play an important safety role. Coastal safety organizations should further promote and encourage surfers to complete basic ocean rescue and/or first aid and CPR courses, as this group could represent an essential stopgap layer of protection on all, but especially unpatrolled, beaches.
To our knowledge, this study is the first to assess the characteristics, behaviour, and beach safety knowledge of beachgoers on unpatrolled beaches in Australia and, arguably, globally. Importantly, it has provided an evidence-based understanding of who visits unpatrolled beaches, why they visit these beaches, and the reasons why many users may be at a greater risk of drowning at these beaches. It is clear that many people value convenience and the absence of crowds more than the presence of lifeguards when choosing a beach to visit and that this is unlikely to change. These findings have major implications for authorities responsible for beach safety in Australia, and overseas, and indicate the need to move beyond the standard “swim between the flags” or “swim near a lifeguard” safety messages in order to ensure swimmer safety at all beaches. In order to reduce the risk of drowning at unpatrolled beaches, the development and dissemination of future beach safety information and interventions must also take into account the diverse types of beach users that visit unpatrolled beaches.
Raw data can be provided by the corresponding authors upon request, but summary data are provided in Supplement 3.
The supplement related to this article is available online at: https://doi.org/10.5194/nhess-22-909-2022-supplement.
LU, MDH, RWB conceptualized the research and developed the survey. LU, WK, RWB conducted survey fieldwork. LU was responsible for data curation, investigation, and, together with WK, conducted formal data analysis. LU created the figures and the original draft that were reviewed and edited by WK, JCL, MDH, and RWB. RWB supervised the study.
The contact author has declared that neither they nor their co-authors has any competing interests.
Publisher's note: Copernicus Publications remains neutral with regard to jurisdictional claims in published maps and institutional affiliations.
We would like to thank the many student volunteers who assisted in conducting the beach surveys, particularly Alexander Burns, Adam Halmy, Alexander Ingall, Jake Kabbout, Alva Lane, and Edoardo Santagata.
This research has been supported by the New South Wales (NSW) Government Department of Justice, Office of Emergency Management Water Safety Fund (2018-19 WSF RM25.190)
This paper was edited by Maria Ana Baptista and reviewed by Sarah Trimble and one anonymous referee.
Ajgaonkar, K., Khanolkar, S., Rodrigues, J., Shilker, E., Borkar, P., and Braz, E.: Development of a lifeguard assist drone for coastal search and rescue, in: Global Oceans 2020 Virtual Conference, October 2020, Mississippi, US Gulf Coast, 1–10, https://doi.org/10.1109/IEEECONF38699.2020.9389382, 2020.
Armstrong, R. A.: When to use the Bonferroni correction, Ophthalm. Physiol. Opt., 34, 502–508, https://doi.org/10.1111/opo.12131, 2014.
Arozarena, R. A., Houser, C., Echeverria, A. G., and Brannstrom, C.: The rip current hazard in Costa Rica, Nat. Hazards, 77, 753–768, https://doi.org/10.1007/s11069-015-1626-9, 2015.
Attard, A., Brander, R. W., and Shaw, W. S.: Rescues conducted by surfers on Australian beaches, Accid. Anal. Prev., 82, 70–78, https://doi.org/10.1016/j.aap.2015.05.017, 2015.
AWSC – Australian Water Safety Council: Australian Water Safety Strategy 2030, Australian Water Safety Council, Sydney, 60 pp., https://www.royallifesaving.com.au/__data/assets/pdf_file/0003/43275/AWS_Strategy2030_Final-for-web.pdf, last access: 14 October 2021.
Ballantyne, R., Carr, N., and Hughes, K.: Between the flags: An assessment of domestic and international university students' knowledge of beach safety in Australia, Tour. Manage., 26, 617–622, https://doi.org/10.1016/j.tourman.2004.02.016, 2005.
Beach Safety Research Group: Beach Safety Technology Conference, virtual conference, 11 March 2021, https://www. beachsafetyresearch.com/bstc21, last access: 14 October 2021.
Berg, I., Haveman, B., Markovic, O., van de Schoot, D., Dikken, J., Goettinger, M., and Peden, A. E.: Characteristics of surfers as bystander rescuers in Europe, Am. J. Emerg. Med., 49, 209–215, https://doi.org/10.1016/j.ajem.2021.06.018, 2021.
Brander, R. and MacMahan, J.: Future Challenges for Rip Current Research and Outreach, in: Rip Currents – Beach Safety, Physical Oceanography and Wave Modelling, edited by: Leatherman, S. and Fletemeyer, J., CRC Press, Boca Raton, 1–29, https://doi.org/10.1201/b10916, 2011.
Brander, R. W.: Beach Safety Research, in: Encyclopedia of Coastal Science, edited by: Finkl, C. W. and Makowski, C., Springer, Cham, 296–300, https://doi.org/10.1007/978-3-319-93806-6_40, 2019.
Brannstrom, C., Trimble, S., Santos, A., Brown, H. L., and Houser, C.: Perception of the rip current hazard on Galveston Island and North Padre Island, Texas, USA, Nat. Hazards, 72, 1123–1138, https://doi.org/10.1007/s11069-014-1061-3, 2014.
Brannstrom, C., Brown, H., Houser, C., Trimble, S., and Lavoie, A.: “You can't see them from sitting here”: evaluating beach user understanding of a rip current warning sign, Appl. Geogr., 56, 61–70, https://doi.org/10.1016/j.apgeog.2014.10.011, 2015.
Brewster, B. C., Gould, R. E., and Brander, R. W.: Estimations of rip current rescues and drowning in the United States, Nat. Hazards Earth Syst. Sci., 19, 389–397, https://doi.org/10.5194/nhess-19-389-2019, 2019.
Brighton, B., Sherker, S., Brander, R., Thompson, M., and Bradstreet, A.: Rip current related drowning deaths and rescues in Australia 2004–2011, Nat. Hazards Earth Syst. Sci., 13, 1069–1075, https://doi.org/10.5194/nhess-13-1069-2013, 2013.
Butcher, P. A., Piddocke, T. P., Colefax, A. P., Hoade, B., Peddemors, V. M., Borg, L., and Cullis, B. R.: Beach safety: Can drones provide a platform for sighting sharks?, Wildl. Res., 46, 701–712, https://doi.org/10.1071/WR18119, 2019.
Caldwell, N., Houser, C., and Meyer-Arendt, K.: Ability of beach users to identify rip currents at Pensacola Beach, Florida, Nat. Hazards, 68, 1041–1056, https://doi.org/10.1007/s11069-013-0673-3, 2013.
Castelle, B., Scott, T., Brander, R. W., and McCarroll, R. J.: Rip current types, circulation and hazard, Eart-Sci. Rev., 163, 1–21, 2016.
Choi, B. C. K. and Pak, A. W. P.: A catalog of biases in questionnaires, Prev. Chron. Dis., 2, A13, 2005.
Claesson, A., Svensson, L., Nordberg, P. Ringh, M., Rosenqvist, M., Djarv, T., Samuelsson, J., Hernborg, O., Dahlbom, P., Jansson, A., and Hollenberg, J.: Drones may be used to save lives in out of hospital cardiac arrest due to drowning, Resuscitation, 114, 152–156, https://doi.org/10.1016/j.resuscitation.2017.01.003, 2017.
Clifford, K. M., Brander, R. W., Trimble, S., and Houser, C.: Beach safety knowledge of visiting international study abroad students to Australia, Tour. Manage., 69, 487–497, https://doi.org/10.1016/j.tourman.2018.06.032, 2018.
Cohen, J.: Statistical Power Analysis for the Behavioral Sciences, 2nd Edn., Routledge, New York, USA, https://doi.org/10.4324/9780203771587, 1988.
Cooney, N., Daw, S., Brander, R., Ellis, A., and Lawes, J.: Coastal Safety Brief: Rip currents, Surf Life Saving Australia, Sydney, 20 pp., https://issuu.com/surflifesavingaustralia/docs/csb_rip_currents_report_2020 (last access: 14 October 2021), 2020.
Davies, R. S.: Designing Surveys for Evaluations and Research, EdTech Books, https://edtechbooks.org/designing_surveys (last access: 14 October 2021), 2020.
DeJoy, D.: An examination of gender differences in traffic accident risk perception, Accid, Anal, Prev., 24, 237–246, https://doi.org/10.1016/0001-4575(92)90003-2, 1992.
Fallon, K. M., Lai, Q., and Leatherman, S. P.: Beachgoer's recognition of rip current hazard at Miami Beach, Florida, Ocean Coast. Manage., 165, 63–70, https://doi.org/10.1016/j.ocecoaman.2018.08.011, 2018.
Flaherty, G. T. and Choi, J.: The `selfie' phenomenon: reducing the risk of harm while using smartphones during international travel, J. Travel Med., 23, 1–3, https://doi.org/10.1093/jtm/tav026, 2016.
Franklin, R. C., Peden, A., Brander, R. W., and Leggat, P.: Who rescues who? Understanding aquatic rescues in Australia using coronial data and a survey, Aust. N.Z. J. Publ. Health, 43, 477–483, https://doi.org/10.1111/1753-6405.12900, 2019.
Gensini, V. A. and Ashley, W. S.: An examination of rip current fatalities in the United States, Nat. Hazards, 54, 159–175, https://doi.org/10.1007/s11069-009-9458-0, 2010.
Gilchrist, J. and Branche, C.: Lifeguard efectiveness, in: The Science of Beach Lifeguarding, edited by: Tipton, M. and Wooler, A., CRC Press, Boca Raton, 29–36, ISBN 9781482245974, 2016.
Gioia, S., Mirtella, D., Franceschetto, L., Lancia, M., Suadoni, F., and Cingolani, M.: Media-based research on selfie-related deaths in Italy, Am. J. Forens. Med. Pathol., 41, 27–31, https://doi.org/10.1097/PAF.0000000000000526, 2020.
Guillén, J., García-Olivares, A., Ojeda, E., Osorio, A., Chic, O., and Gonzáles, R.: Long-term quantification of beach users using video monitoring, J. Coast. Res., 24, 1612–1619, https://doi.org/10.2112/07-0886.1, 2008.
Gustafson, P. E.: Gender differences in risk perception: theoretical and methodological persepectives, Risk Anal., 18, 805–811, https://doi.org/10.1023/B:RIAN.0000005926.03250.c0, 1998.
Hatfield, J., Williamson, A., Sherker, S., Brander, R. W., and Hayen, A.: Development and evaluation of an intervention to reduce rip current related beach drowning, Accid. Anal. Prev., 82, 70–78, https://doi.org/10.1016/j.aap.2011.10.003, 2013.
Houser, C., Trimble, S., Brander, R., Brewster, B. C., Dusek, G., Jones, D., and Kuhn, J.: Public perceptions of a rip current hazard education program: “Break the Grip of the Rip!”, Nat. Hazards Earth Syst. Sci., 17, 1003–1024, https://doi.org/10.5194/nhess-17-1003-2017, 2017.
Houser, C., Arbex, M., and Trudeau, C.: Short communication: Economic impact of drowning in the Great Lakes Region of North America, Ocean Coast. Manage., 212, 105847, https://doi.org/10.1016/j.ocecoaman.2021.105847, 2021.
Jaggard, E.: Between the Flags: One Hundred Summers of Australian Surf Lifesaving, UNSW Press, Sydney, ISBN 0868408972, 2006.
Jain, M. and Mavani, K.: A comprehensive study of worldwide selfie-related accidental mortality: a growing problem of the modern society, Int. J. Inj. Contr. Saf. Promot., 24, 544–549, https://doi.org/10.1080/17457300.2016.1278240, 2017.
Koon, W., Peden, A., Lawes, J. C., and Brander, R. W.: Coastal drowning: A scoping review of burden, risk factors, and prevention strategies, PLoS One, 16, 1–22, https://doi.org/10.1371/journal.pone.0246034, 2021.
Lawes, J. C., Ellis, A., Daw, S., and Strasiotto, L.: Risky business: a 15-year analysis of fatal coastal drowning of young male adults in Australia, Inj. Prev., 27, 1–8, https://doi.org/10.1136/injuryprev-2020-043969, 2020.
Lawes, J. C., Uebelhoer, L., Koon, W., Strassioto, L., Anne, F., Daw, S., Brander, R. W., Mulcahy, N., and Peden, A. E.: Understanding a population: a methodology for a population-based coastal safety survey, PLoS ONE, 16, e0256202, https://doi.org/10.1371/journal.pone.0256202, 2021.
Llopis, I. A., Echeverria, A. G., Trimble, S., Brannstrom, C., and Houser, C.: Determining beach user knowledge of rip currents in Costa Rica, J. Coast. Res., 34, 1105–1115, https://doi.org/10.2112/JCOASTRES-D-17-00131.1, 2018.
Locknick, S. and Houser, C.: Correspondence of beach user perception, lifesaving strategies and rip currents: implications for beach management, Coast. Manage., 49, 598–616, https://doi.org/10.1080/08920753.2021.1967561, 2021.
Matthews, B., Andronaco, R. and Adams, A.: Warning signs at beaches: do they work?, Saf. Sci., 62, 312–318, https://doi.org/10.1016/j.ssci.2013.09.003, 2014.
McCutcheon, P.: Dangerous beach named one of Australia's best, sparking safety concerns, https://www.abc.net.au/news/2018-02-22/concerns-after-dreamtime-beach-named-one-of-australias-best/9473244 (last access: 9 September 2021), 2018.
McKay, C., Brander, R. W., and Goff, J.: Putting tourists in harms way – Coastal tourist parks and hazardous unpatrolled surf beaches in New South Wales, Australia, Tour. Manage., 45, 71–84, https://doi.org/10.1016/j.tourman.2014.03.007, 2014.
Ménard, A. D., Houser, C., Brander, R. W., Trimble, S., and Scaman, A.: The psychology of beach users: importance of confirmation bias, action, and intention to improving rip current safety, Nat. Hazards, 94, 953–973, https://doi.org/10.1007/s11069-018-3424-7, 2018.
Moran, K.: (Young) Men behaving badly: dangerous masculinities and risk of drowning in aquatic leisure activities, Ann. Leis. Res., 14, 260–272, https://doi.org/10.1080/11745398.2011.615719, 2011.
Morgan, D.: Counting beach visitors: Tools, methods, and management applications, in: Beach Management Tools – Concepts, Methodologies and Case Studies, edited by: Botero, C., Cervantes, O., and Finkl, C., Springer, Cham, 561–577, https://doi.org/10.1007/978-3-319-58304-4_27, 2018.
Pitman, S. J., Thompson, K., Hart, D. E., Moran, K., Gallop, S. L., Brander, R. W., and Wooler, A.: Beachgoers' ability to identify rip currents at a beach in situ, Nat. Hazards Earth Syst. Sci., 21, 115–128, https://doi.org/10.5194/nhess-21-115-2021, 2021.
Provost, E. J., Butcher, P. A., Colefax, A. P., Coleman, M. A., Curley, B. G., and Kelaher, B. P.: Using drones to quantify beach users across a range of environmental conditions, J. Coast. Conserv., 23, 633–642, https://doi.org/10.1007/s11852-019-00694-y, 2019.
Savage, I.: Demographic influences on risk perceptions, Risk Anal., 13, 413–420, https://doi.org/10.1111/j.1539-6924.1993.tb00741.x, 1993.
Segura, L. E., Arozarena, I., Koon, W., and Gutiérrez, A.: Coastal drowning in Costa Rica: incident analysis and comparisons between Costa Rica nationals and foreigners, Nat. Hazards, 110, 1083–1095, https://doi.org/10.1007/s11069-021-04980-7, 2022.
Sherker, S., Brander R., Finch, C., and Hatfield, J.: Why Australia needs an effective national campaign to reduce coastal drowning, J. Sci. Med. Sport, 11, 81–83, https://doi.org/10.1016/j.jsams.2006.08.007, 2008.
Sherker, S., Williamson, A., Hatfield, J., Brander, R., and Hayen, A.: Beachgoers' beliefs and behaviours in relation to beach flags and rip currents, Accid. Anal. Prev., 42, 1785–1804, https://doi.org/10.1016/j.aap.2010.04.020, 2010.
Short, A. D.: Beaches of the New South Wales Coast. A guide to their nature, characteristics, surf and safety, 2nd Edn., Sydney University Press, Sydney, ISBN 9781920898151, 2007.
Short, A. D. and Hogan, C. L. : Rip currents and beach hazards: their impact on public safety and implications for coastal management, J. Coast. Res., 12, 197–209, 1994.
Silva-Cavalcanti, J. S., Costa, M. F., and Pereira, P. S.: Rip currents signaling and users behaviour at an overcrowded urban beach, Ocean Coast. Manage., 155, 90–97, https://doi.org/10.1016/j.ocecoaman.2018.01.031, 2018.
SLSA – Surf Life Saving Australia: National Coastal Safety Report, Surf Life Saving Australia, Sydney, https://issuu.com/surflifesavingaustralia/docs/ncsr_2021, last access: 14 October 2021.
Sotés, I., Basterretxea-Iribar, I. and de Las Mercedes Maruri, M.: Are the Biscayne Universitary students ready to go to the beach safely?, Ocean Coast. Manage., 151, 134–149, https://doi.org/10.1016/j.ocecoaman.2017.10.012, 2018.
Sotés, I., Basterretxea-Iribar, I., Sanchez-Beaskoetxea, J., and de Las Mercedes Maruri, M.: Environment understanding, signage perception and safety education in Biscay beachgoers under the view of lifeguards, Ocean Coast. Manage., 189, 105149, https://doi.org/10.1016/j.ocecoaman.2020.105149, 2020.
White, K. M. and Hyde, M. K.: Swimming between the flags: A preliminary exploration of the influences on Australians' intentions to swim between the flags at patrolled beaches, Accid. Anal. Prev., 42, 1831–1838, https://doi.org/10.1016/j.aap.2010.05.004, 2010.
Willcox-Pidgeon, S., Kool, B., and Moran, K.: Perceptions of the risk of drowning at surf beaches among New Zealand youth, Int. J. Inj. Contr. Saf. Promot., 25, 365–371, https://doi.org/10.1080/17457300.2018.1431939, 2018.
Williamson, A., Hatfield, J., Sherker, S., Brander, R., and Hayen, A.: A comparison of attitudes and knowledge of beach safety in Australia for beachgoers, rural residents and international tourists, Aust. N.Z. J. Publ. Health, 36, 385–391, https://doi.org/10.1111/j.1753-6405.2012.00888.x, 2012.
Woods, M., Koon, W., and Brander, R. W.: Identifying risk factors and implications for beach drowning prevention amongst an Australian multicultural community, PLoS ONE, 17, e0262175, https://doi.org/10.1371/journal.pone.0262175, 2022.
Woodward, E., Beaumont, E., Russel, P., Wooler, A., and Macleod, R.: Analysis of rip current incidents and victim demographics in the UK, J. Coast. Res., 65, 850–855, https://doi.org/10.2112/SI65-144.1, 2013.
Wright, L. D. and Short, A. D.: Morphodynamic variability of surf zones and beaches: A synthesis, Mar. Geol., 56, 93–118, https://doi.org/10.1016/0025-3227(84)90008-2, 1984.
swim between the flagssafety message, as people will always swim at unpatrolled beaches.