the Creative Commons Attribution 4.0 License.
the Creative Commons Attribution 4.0 License.
 | 09 Dec 2022
Coupling wildfire spread simulations and connectivity analysis for hazard assessment: a case study in Serra da Cabreira, Portugal
Ana C. L. Sá
Bruno Aparicio
Akli Benali
Chiara Bruni
Michele Salis
Fábio Silva
Martinho Marta-Almeida
Susana Pereira
Alfredo Rocha
José Pereira
This study aims to assess wildfire hazard in northern Portugal by combining landscape-scale wildfire spread modeling and connectivity analysis to help fuel management planning. We used the Minimum Travel Time (MTT) algorithm to run simulations under extreme (95th percentile) fire weather conditions. We assessed wildfire hazard through burn probability, fire size, conditional flame length and fire potential index wildfire descriptors. Simulated fireline intensity (FLI) using historical fire weather conditions were used to build landscape networks and assess the impact of weather severity in landscape wildfire connectivity (Directional Index of Wildfire Connectivity, DIWC). Our results showed that 27 % of the study area is likely to experience high-intensity fires and 51 % of it is susceptible to spread fires larger than 1000 ha. Furthermore, the increase in weather severity led to the increase in the extent of high-intensity fires and highly connected fuel patches, covering about 13 % of the landscape in the most severe weather. Shrublands and pine forests are the main contributors for the spread of these fires, and highly connected patches were mapped. These are candidates for targeted fuel treatments. This study contributes to improving future fuel treatment planning by integrating wildfire connectivity in wildfire management planning of fire-prone Mediterranean landscapes.
- Article
(11343 KB) - Full-text XML
- BibTeX
- EndNote


In the last decades, wildfires have had growing economic, environmental and social impacts with human life losses as a result of changes in climate and land use in the Mediterranean basin, despite increased suppression efforts (Bowman et al., 2017; Tedim et al., 2018). Concomitantly, wildfire management policies focused on fire suppression, ignoring ongoing climate change and landscape-scale fuel buildup and resulting in very severe wildfires (Curt and Frejaville, 2018; Rodrigues et al., 2019). The large number of simultaneous fire ignitions that often burn at high-fire intensities jeopardize the suppression system, putting it beyond the limits of extinguishing capacity (Plucinski, 2019). Hence, tackling the increased frequency of intense and large wildfires requires combining fire suppression and fuel reduction strategies in landscape-level wildfire management plans. Currently, the effectiveness of such plans has been assessed via reduction in burned area extent, rather than through limitation of damages and losses (Moreira et al., 2011, 2020). The failure of that objective has raised the need for a paradigm shift in wildfire management practices towards rebalancing between suppression efforts and prevention measures (Ingalsbee, 2017; Moreira et al., 2020; Palaiologou et al., 2020; Wunder et al., 2021).
There is evidence of past profound socio-economic changes that led to the rural exodus in several countries of the Mediterranean basin. In Portugal, since the 1960s extensive land abandonment and afforestation have led to a significant decrease in agricultural and pastoral activities, which resulted in large changes in landscape configuration and composition. These circumstances have promoted the increase in the fuel load, availability and contiguity (Fernandes et al., 2019; Moreira et al., 2020), which, associated with unusually severe meteorological conditions, led to the tragic fire season of 2017. This year had a record-breaking 557 400 ha of burned area, millions of euros in economic losses and a total of 119 fatalities (Castellnou et al., 2018; Ribeiro et al., 2020). From then on, fire management has gained relevance and visibility in the public and political discussion, leading to development of a fuel management plan to be implemented from 2020 to 2030, aiming to reduce national-level exposure to wildfires (RCM, 2021).
One of the main challenges to scientists and wildfire managers is to increase landscape heterogeneity by creating interruptions in large, continuous expansions of forests and shrublands. Measures to break landscape connectivity, like interspersing different land use–land cover (LULC) classes, reducing fuel load and contiguity (fuel breaks, wide area treatments and prescribed fires, among others), may hinder the hazardousness of the landscape to large and intense wildfires, promoting the change to less fire-prone regions (Moreira et al., 2020). In wildfire research, connectivity concepts have been applied, for example to study the relationship between forest connectivity and burned areas (Martín-Martín et al., 2013), the link between climate change and fuel connectivity (Fletcher et al., 2016; Keeley et al., 2018), the impact of different weather and forest connectivity levels on fire spread (Duane et al., 2021), and the location of the best subset of fuel treatment units that minimize the impact of the worst-case wildfire (Liberatore et al., 2021). Recently, to quantify the influence of the spatial arrangement of fuels in fire spread connectivity, a new connectivity index was developed, which integrates estimated fireline intensity and the effect of wind direction on fuel connectivity (Aparício et al., 2022). Information derived from this wildfire connectivity index can be useful to prioritize fuel treatment units and to identify fire suppression opportunities and ultimately define operational tactics.
Fire spread models can estimate fire spread and behavior under different weather conditions and alternative fuel management scenarios, producing information that can be used in support of wildfire management decisions (Finney, 2006). These models have been widely used to assess wildfire hazard, exposure and risk (Alcasena et al., 2021; Palaiologou et al., 2020; Salis et al., 2013); wildfire transmission (Oliveira et al., 2016; Salis et al., 2021); and the impact of fuel treatments (Benali et al., 2021; Salis et al., 2016a, 2018). In Portugal, fire spread simulations have been used at regional and local scales to analyze the effectiveness of fuel-break treatments and fire risk transmission in the Algarve region (Oliveira et al., 2016); to propose strategic prioritization of fuel treatments over time in commercial eucalypt plantations (Martín et al., 2016); and to compare the impact of different landscape levels of fuel treatments on wildfire hazard reduction (Benali et al., 2021), the impact different intensity levels of forest management have in financial outcome from timber productions (Barreiro et al., 2021) and the fire risk assessment of human settlements affected by large wildfires (Oliveira et al., 2020), all developed in the center of Portugal. Recently, wildfire spread modeling was also used to quantify national wildfire exposure of Portuguese communities and protected areas to large fires, as a response to support national plan of future wildfire risk mitigation (Alcasena et al., 2021). Commonly, wildfire hazard assessments are based on a set of fire spread descriptors used to locate the most fire-prone areas and hence identify where fuel management actions ought to be implemented, given pre-defined objectives (e.g., lower intensities, smaller burned areas). Fuel reduction strategies decrease the intensity of fires and can also create opportunities for wildfire suppression, ultimately leading to a reduction in exposure and risk to people, infrastructures, and ecosystems and their services (Alcasena et al., 2021; Moudio et al., 2021).
Actual wildfire hazard assessments still ignore the relevance of characterizing wildfire connectivity and of identifying the main fuel patches responsible for the spread of intense fires over the landscape. We propose to address this research gap by combining fire spread simulation with landscape connectivity analysis in a study area located in northwestern Portugal. Specifically, our study aims to (1) assess the landscape wildfire hazard under extreme weather conditions, (2) characterize landscape wildfire connectivity, and (3) identify landscape fuel patches where treatments can be most effective in breaking the connectivity of intense and large fires. Results can be used to enrich the information used in wildfire hazard assessment and to help fuel management planning in other fire-prone Mediterranean landscapes.
2.1 Study area
The study area (ca. 200 000 ha) is in the northwestern Portugal and is centered at Serra da Cabreira (“goat-herder mountain”, in Portuguese). The terrain is rugged, with its highest peak at 1262 m of altitude (Fig. 1). Vegetation is adapted to heat and relative dryness, but the influence of both factors is decreased by the regular presence of moist and fresh air masses that come from the Atlantic Ocean (Costa et al., 1998). The combination of abundant winter precipitation with dry, warm summers influences the distribution and composition of the vegetation communities in the mountain. In this northwestern pyro-region there are two annual peaks of fire activity: one relatively small, centered in March, associated with pastoral burning, and the main one in August. The summer fire season typically extends from July to September (Calheiros et al., 2020).
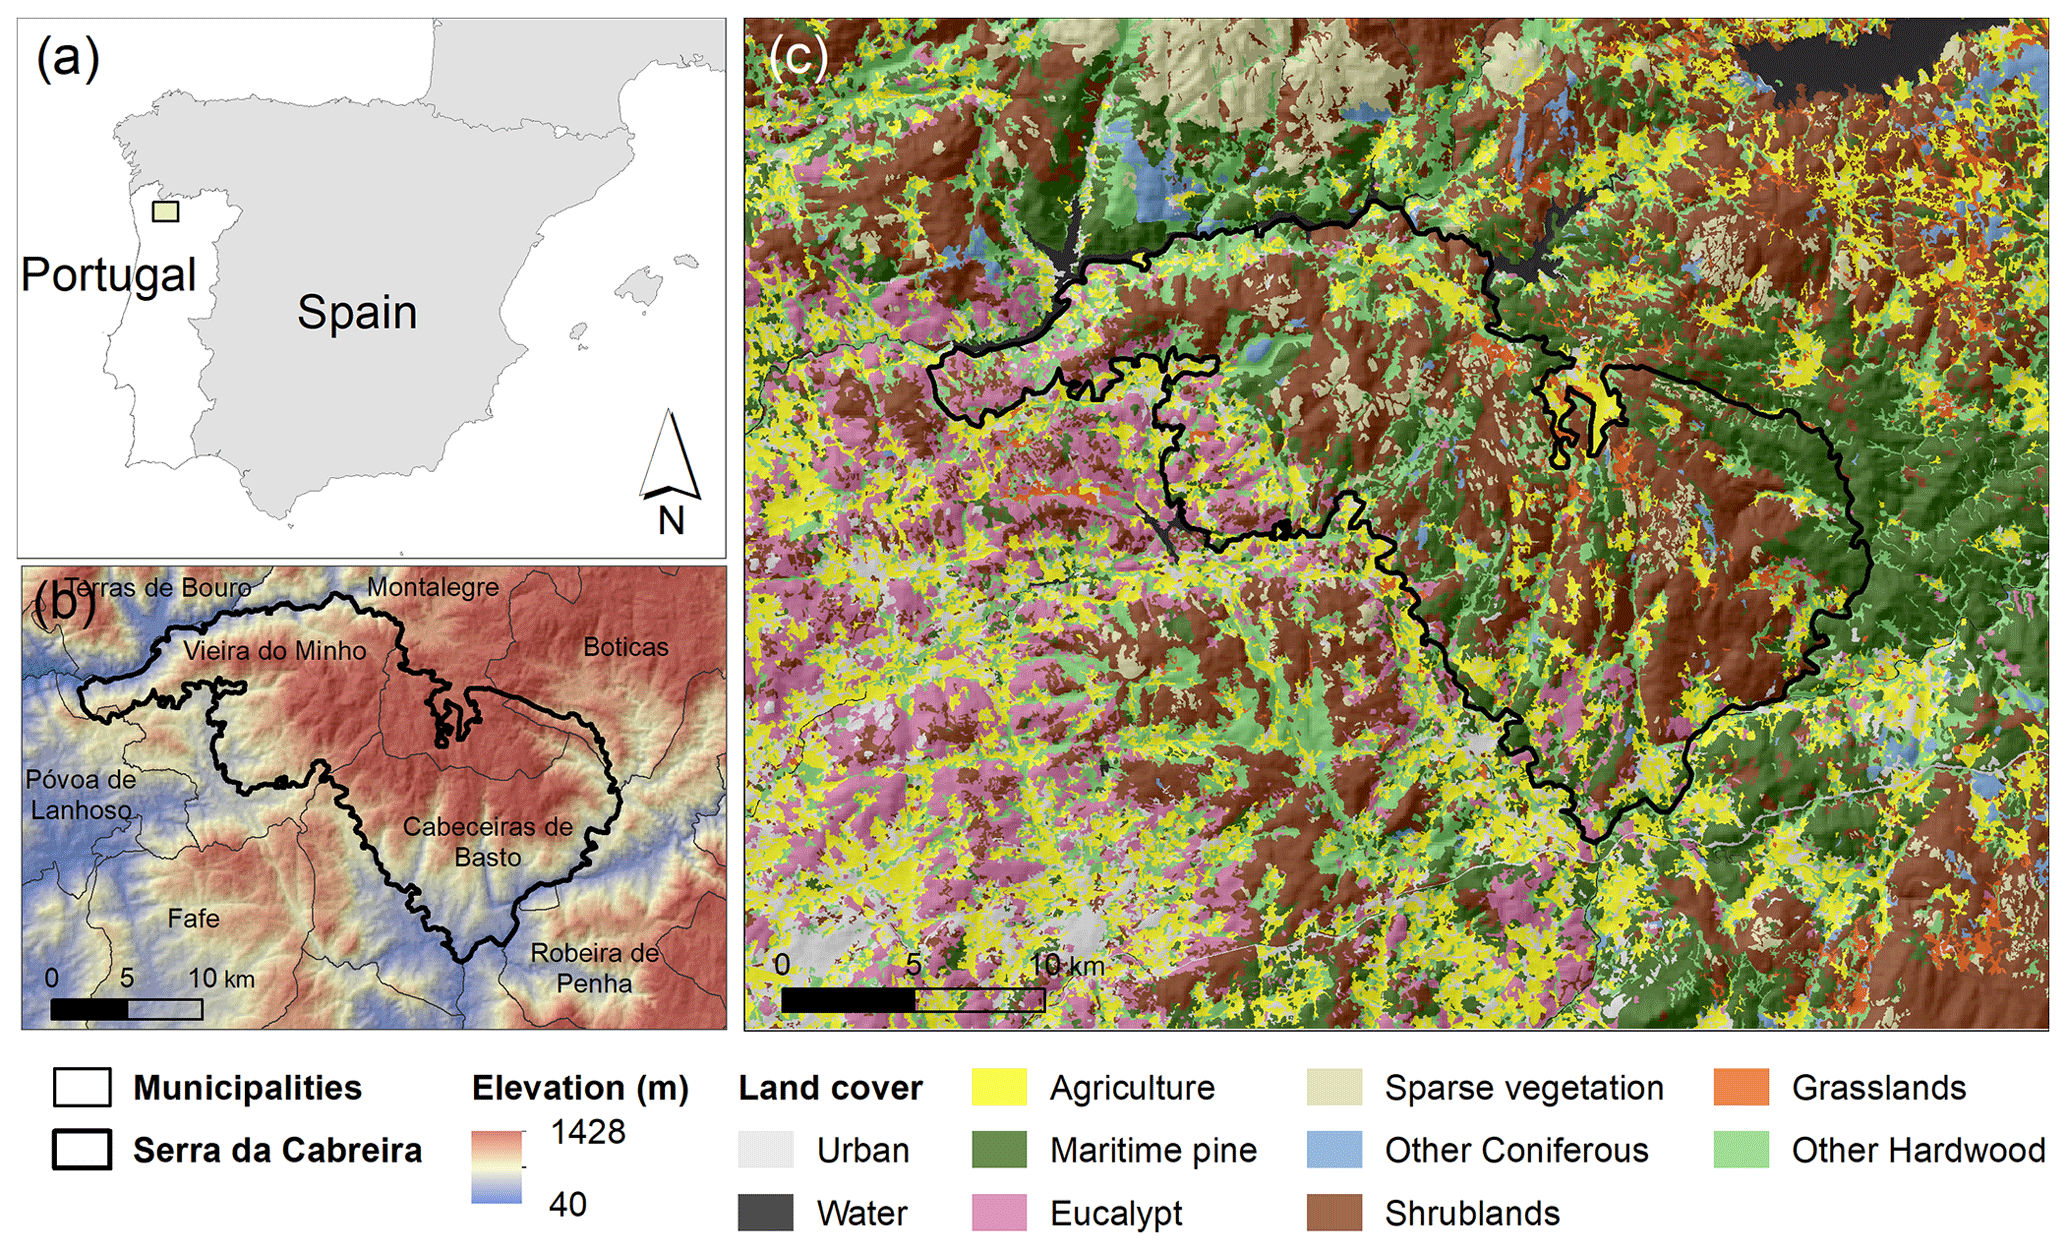
Figure 1(a) Study area centered in Serra da Cabreira and its relative position to the Iberian Peninsula, (b) elevation and Portuguese municipalities, and (c) main land use–land cover classes.
The main land cover classes are shrublands (25 %), maritime pine forests (17 %), and oaks and other hardwood forests (15 %) as extracted from the last national LULC classes of 2018 (DGT, 2021). Agriculture covers approximately 16 % of the area, mainly in the valleys (Fig. 1c). Most of the agricultural areas and eucalypt plantations (11 %) are located southwest of the study area, near the interface with an urban area. The largest continuous patch of pine forest (ca. 7600 ha) is located at the eastern limit of the mountain, and it is divided to the north by a patch that burned in 2010. In Serra da Cabreira, there are herds of wild horses, cattle and goats. Fire is traditionally used for disposing of agricultural stubble and for pasture renewal, which are important causes of ignition within its boundaries and to the southwest of the study area (ICNF, 2021b).
2.2 Fire history
Historical wildfire data for the study area were extracted from the national fire atlas with 46 years of burned area perimeters (ICNF, 2021b; Oliveira et al., 2012). We selected fires larger than 100 ha that occurred between 2001 and 2019, corresponding to a total of 200 burned area perimeters, which accounted for 64 % of the total burned area in this period. In this subset, there are nine fires (5 %) larger than 1000 ha, contributing to ca. 25 % of the area burned; ca. 85 % of the burned area perimeters have less than 500 ha (Fig. 2d). The largest burned area is 4300 ha, located at the eastern edge of the mountain (Fig. 2b).
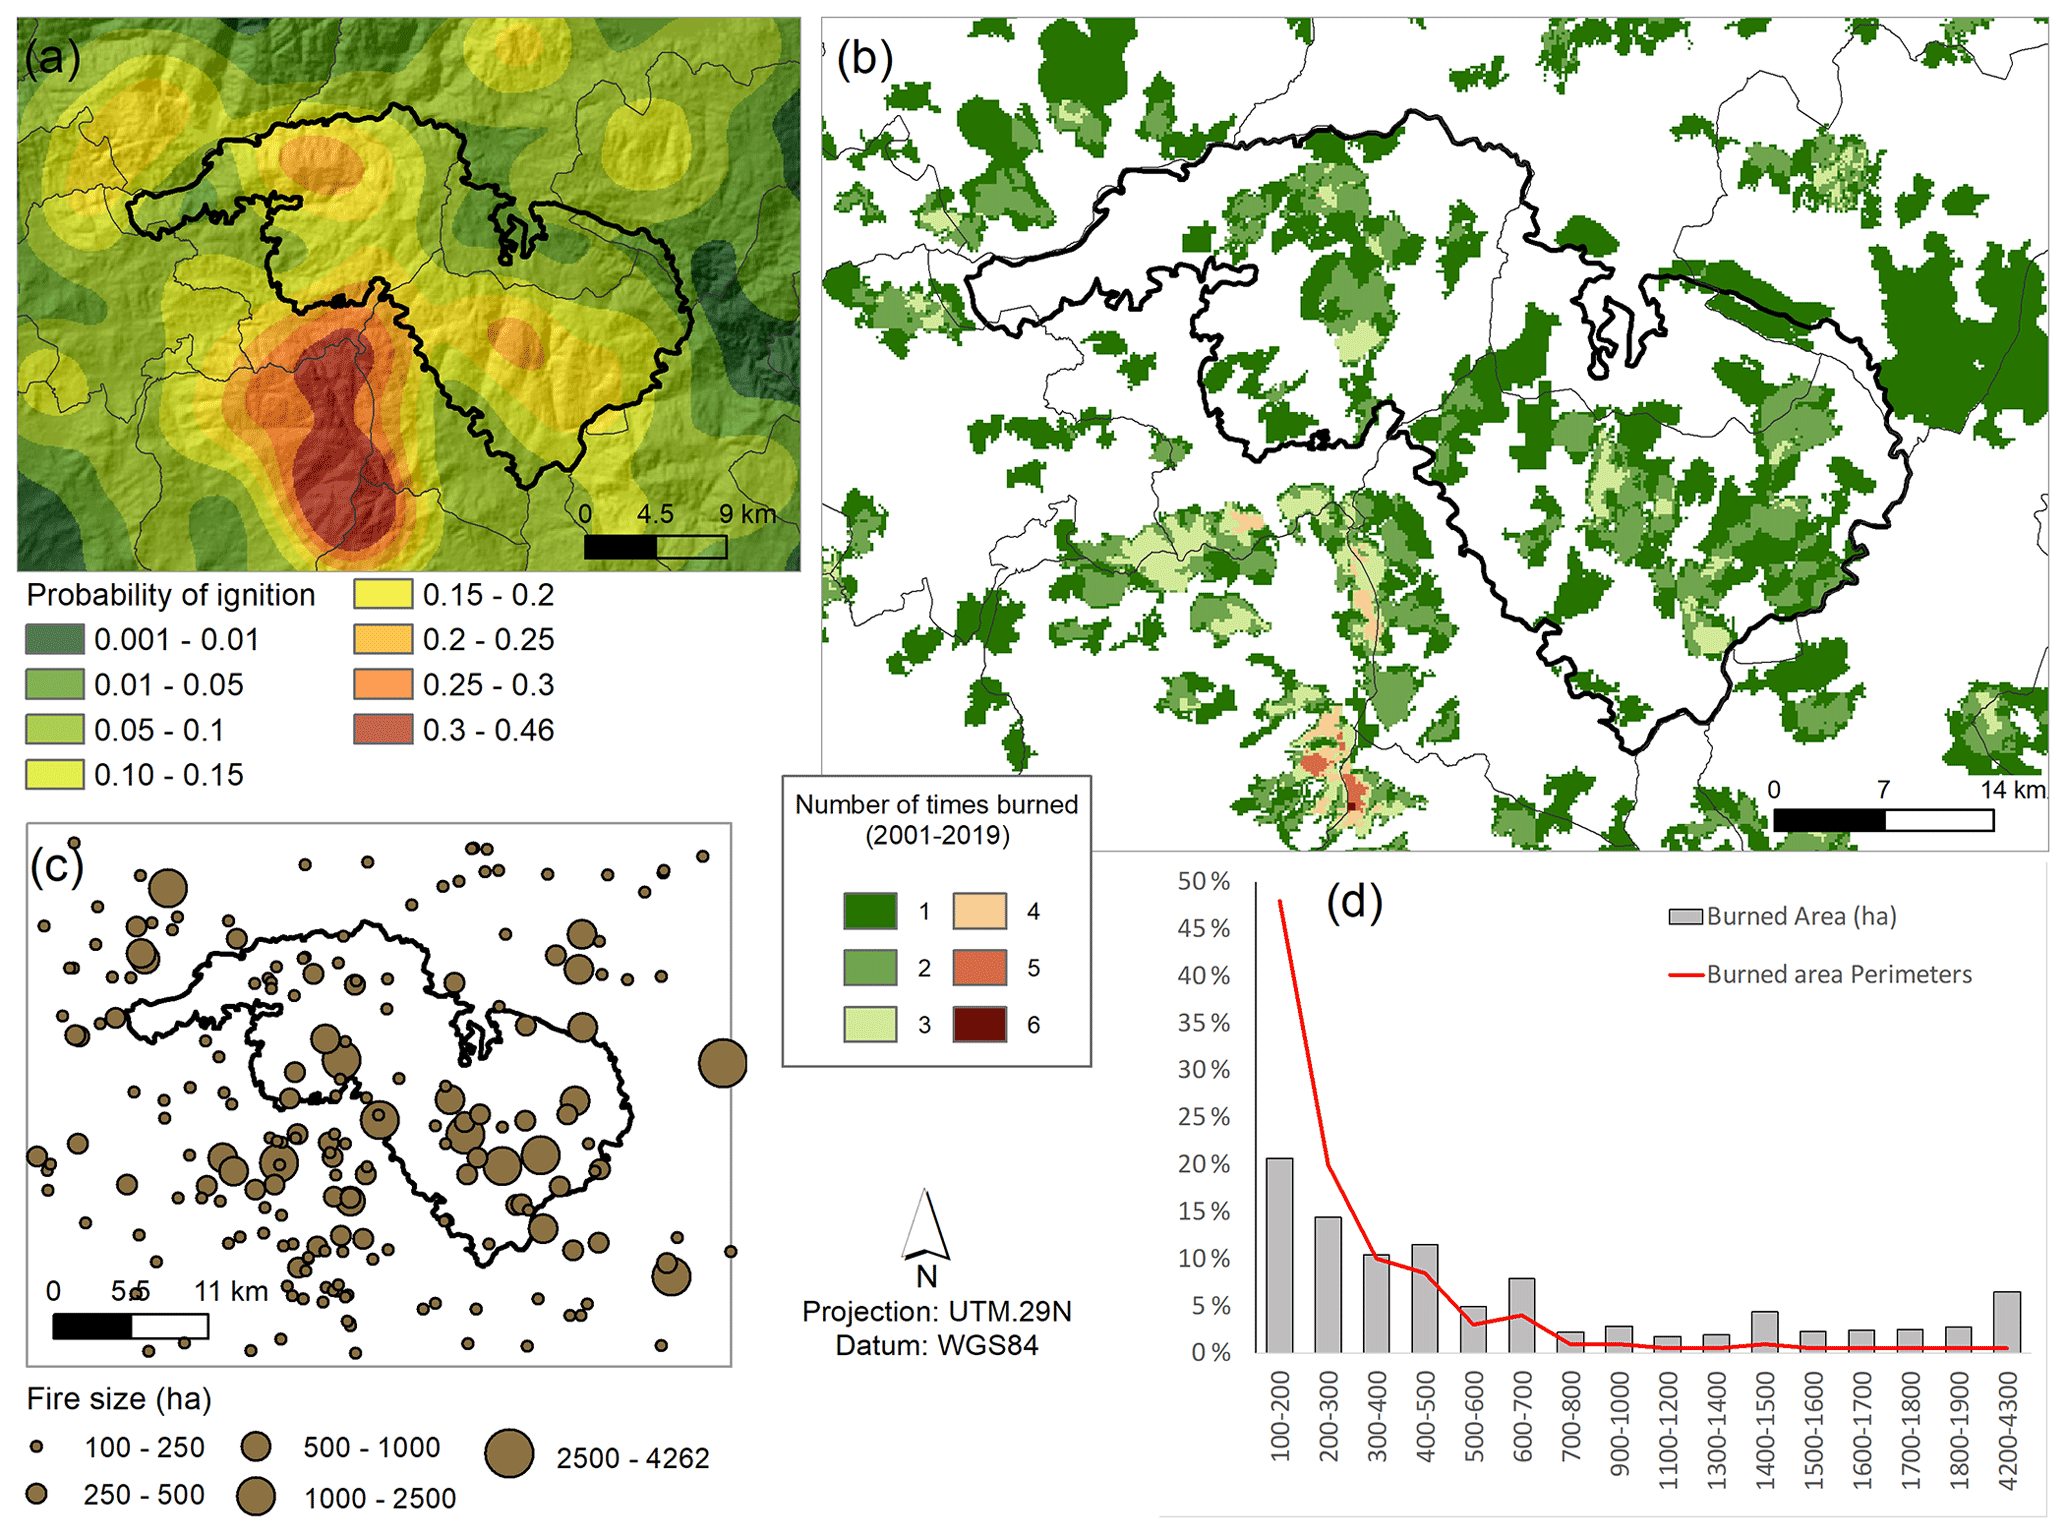
Figure 2Historical wildfire data description for burned area perimeters larger than 100 ha, from 2001 to 2019: (a) probability of ignition, (b) frequency of burning, (c) fire sizes, and (d) percentage of the number of fire perimeters and burned area perimeters by classes of area.
We extracted fire ignition locations from the Portuguese Forest Service fire database, with the start and end dates of the corresponding fires. Different sources of errors may affect the accuracy of this database, such as incorrect location or data loss or misplacement (Pereira et al., 2011). We used satellite data to complement and improve the accuracy of the location of ignitions and individual duration following previously developed research (Benali et al., 2016b). Based on this information, we calculated the frequency distribution of fire durations for the analyzed 200 fire perimeters.
An ignition probability surface was produced by interpolating the ignition points using an inverse distance weighting algorithm with a fixed radius of 6 km, corresponding to the peak distance above which spatial clustering of ignitions decreases (Fig. 2a). The highest probability of ignition is located to the south of the study area and in two distinct regions of the mountain range. Fires were historically more frequent in the southern region (Fig. 2b), but the largest fires occurred mainly in the central and eastern regions, where the probability of ignition is lower (Fig. 2c).
2.3 Fire weather
Weather variables of temperature (T), relative humidity (RH), wind speed (WS) and wind direction (WD) were compiled for the spread days of the 200 wildfires. Weather data were estimated from simulations of the Weather Research and Forecasting model (Skamarock et al., 2019). The regional model is based on the configuration described and validated by Marta-Almeida et al. (2016) and has a spatial resolution of 5 km. Temperature and RH were extracted at 2 m, and WS and WD were extracted at 10 m above the surface, both with 3 h frequency. Each weather variable results from daily average for the period 12:00–20:00 LT because it commonly represents the hotter, windier part of the day when fire spread is faster and more intense. This time window choice is because fire simulations are run for spread durations smaller than 24 h with constant weather conditions, and thus it was necessary to exclude milder weather conditions that typically occur during the evening and morning periods. The eventual averaging effects of the extreme weather conditions is compensated by tuning the duration of fire spread (Sect. 2.4.4). A summary of the distribution of average daily values of the selected fire weather variables is shown in Appendix A.
Fire weather data were classified into clusters where centroids represent daily averaged values of T, RH and WS. We used a model-based clustering classification (Stahl and Sallis, 2012) where each cluster obtained was assigned a weather type. Details of the clustering method and assumptions are shown in Appendix B.
Table 1 shows the three classified weather types: (1) “frequent/hotter (H)” – the most frequent fire weather, which has the highest mean T; (2) “drier/windier (DWi)” – the second most frequent fire weather, which has the lowest mean RH and the highest mean WS; and (3) “cooler/wetter (CWe)” – the least frequent fire weather corresponding to the lowest T and highest RH values. The latter weather type is associated with wildfires occurring outside the regular fire season or under milder weather conditions often observed during the final stages of fire spread. The most frequent wind directions are from the northeast (41 %) and west (20 %). The remaining directions have frequencies lower than 10 % and are, in descending order, from the east, south, north, northwest, southwest and southeast.
Table 1Weather types obtained from the classification of the 326 fire weather days (N_days) according to the average values of temperature (T), relative humidity (RH) and wind speed (WS). For each weather type (with frequency Fr), the percentage of each wind direction (WD) was calculated. In bold, wind direction frequencies above 10 %.
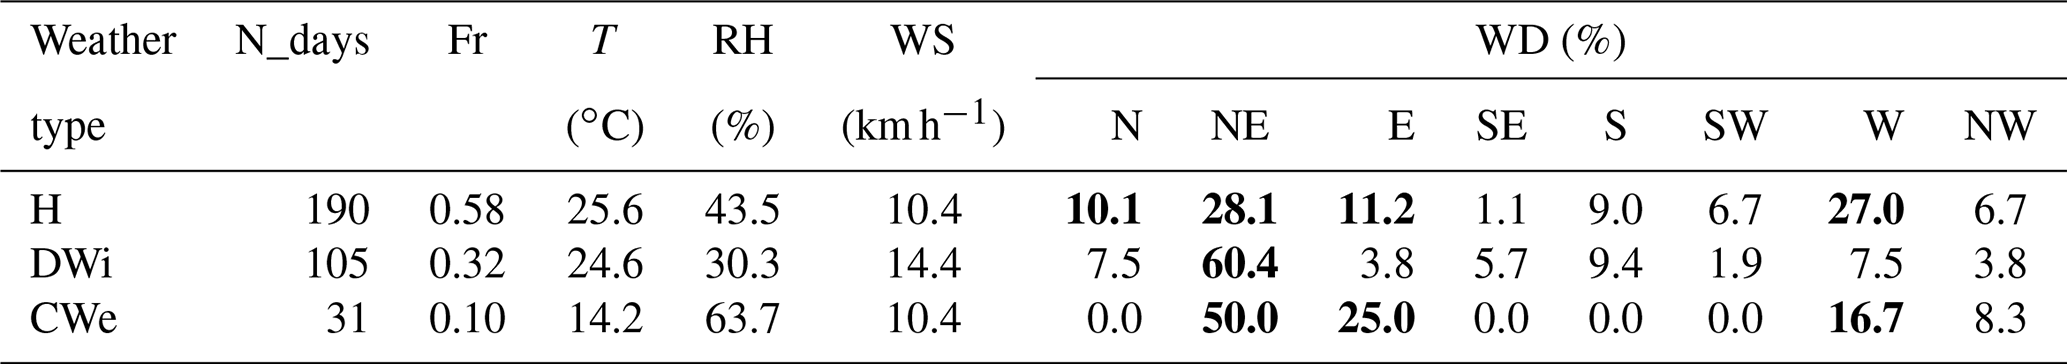
The 95th percentile of T and WS and the 5th percentile of RH were calculated to characterize an extreme weather condition. This corresponds to T of 30 ∘C, RH of 24 % and WS of 22 km h−1. The frequencies of WD in this subset of days were 36.5 % for the east, 36.5 % for the south, 18 % for the northeast and 9 % for the north.
Hence, we defined two weather conditions: (1) historical, characterized by the three weather types, and (2) extreme, corresponding to the 95th percentile of the fire weather dataset. The first was used to calibrate the fire spread simulation system and to obtain a reference fire spread simulation. The latter was used to simulate hypothetical large and intense wildfires.
2.4 Fire spread simulation system
2.4.1 FlamMap
We performed fire spread simulations using the Minimum Travel Time (MTT) fire growth algorithm as implemented in the FlamMap simulation system (Finney, 2006). The MTT algorithm calculates fire growth by searching for the set of pathways with minimum spread time among cells in the two-dimensional gridded landscape at an arbitrary user-defined spatial resolution (Finney, 2002). Wildfire spread is predicted using Rothermel's model (Rothermel, 1972), which estimates fire descriptors in the direction of the maximum rate of spread. This algorithm has been used in several fire-prone areas worldwide to address different wildfire management objectives (Alcasena et al., 2021; Palaiologou et al., 2018; Parisien et al., 2019). In Portugal, it was used to simulate extreme wildfires and evaluate the impact of fuel treatments in decreasing landscape wildfire hazard and risk (Benali et al., 2021; Oliveira et al., 2020) and exposure of communities and protected areas to large wildfires (Alcasena et al., 2021).
2.4.2 Input data
The fire spread simulation system requires a set of input data that includes spatial grid layers to describe the landscape, a list of fire ignition locations, and information about fire weather conditions and corresponding fuel moisture contents. We compiled fire weather data (T, RH, WS and WD), fire regime descriptors (burned area, ignition locations, and corresponding fire sizes and durations), vegetation (tree cover and surface fuels) and elevation data to characterize the landscape and its fire regime. Elevation was obtained from the 30 m Shuttle Radar Topography Mission (SRTM, Farr et al., 2007), and the corresponding grids of slope and aspect were derived and resampled to 100 m. Vegetation and topography data were assembled in a common geographic 100 m resolution grid.
The surface fuel model map for 2020 was derived by assigning the Portuguese (Fernandes et al., 2009) and American (Anderson, 1982) fuel model typologies to the national LULC classes of 2018 and updated in recently burned areas. Tree cover density for 2018 was downloaded from the pan-European High Resolution Layers in the Copernicus Land Monitoring Service (EEA, 2018). The historical wildfire ignition probability grid (Fig. 2a) was used to randomly sort the simulated fires.
Temperature and RH were used to calculate the initial values of fuel moisture content (1, 10 and 100 h time-lag dead fuels classes) using available equations from the literature (Anderson et al., 2015; Nelson, 2000). The herbaceous and woody live fuel moisture contents were set equal to 60 % and 90 %, respectively. The WD prevailing distribution frequencies were those from the described historical and extreme weather conditions.
2.4.3 Simulation settings
Fire modeling was conducted at 100 m resolution using the landscape input data and considering temporally constant weather and fuel moisture conditions throughout the simulation time. We estimated wildfire descriptors for the historical and extreme fire weather conditions and the fuel model grid for 2020. The landscape was saturated with 100 000 fires randomly sampled using the historical probability of ignition and an unburnable mask extracted from the fuel model grid. Simulation spread durations and corresponding frequencies were those obtained from model calibration (Sect. 2.4.4): 300 min (60 %), 540 min (25 %) and 780 min (15 %). Fire suppression efforts and crown fires were not simulated.
2.4.4 Calibration
We calibrated the fire spread simulation system using the historical wildfires (burned area, ignitions and durations) larger than 100 ha from 2001 to 2019, the fire weather conditions (weather types) and fuel model grids derived from the Portuguese LULC maps of 1995 and 2010 (DGT, 2021) representative of historical vegetation cover of the study area. The two fuel maps, three fire weather types and three fire duration classes were combined in a calibration matrix corresponding to each variable combination of frequencies. The two fuel model maps were assigned a frequency according to the total burned area before and after 2010; each weather type frequency was obtained from the model-based classification; and initial fire durations and corresponding frequencies were obtained from the wildfire database.
This calibration matrix was then used to set the number of random fire ignitions used in each simulation run (Appendix C). We sampled a total number of 100 000 random fires using the historical ignition probability and the fuel model maps (to exclude ignitions located in non-burnable areas). We calibrated the fire spread modeling system by running the MTT algorithm for each combination of variables in the calibration matrix, adjusting the duration of fire spread until obtaining a satisfactory reproduction of the historical fire frequency distribution.
The capability of the fire simulation system to reproduce historical fire pattern in the study area was assessed by comparing a set of the descriptors: (i) observed vs. estimated fire size frequency distributions; (ii) estimated burn probability vs. observed fire incidence in the historical period (2001–2019); and (iii) simulated vs. reference burned perimeters for historical wildfires larger than 1000 ha (9 fires), for which Sørensen's similarity index (Sørensen, 1948) was calculated.
2.5 Fire hazard
2.5.1 Wildfire descriptors
We analyzed simulated fireline intensity (FLI, henceforth fire intensity) and burn probability (BP) and frequency distributions of flame length (FL) and fire size (FS). Fire intensity has a relationship with flame length (FL, m) based on Byram's equation (Byram, 1959):
The MTT algorithm estimates FL distribution from multiple fires burning each pixel, from which the conditional flame length (CFL, m) can be calculated as follows:
where FLPi is the flame length probability of a fire at the ith flame length class and FLi is the midpoint of each of the 20 ith classes of 0.5 m flame length. CFL represents the probability-weighted flame length given a fire occurs and has been used as a proxy for fire hazard (Alcasena et al., 2021; Salis et al., 2013).
Burn probability represents the likelihood that a grid cell will burn considering the total number of simulated fires. It is calculated as follows:
where Fp represents the number of times a pixel p burns and Np is the number of simulated ignitions. The BP has been routinely used to assess wildfire hazard, exposure and risk, useful for supporting wildfire and forest management plans (e.g., Benali et al., 2021; Lozano et al., 2017; Salis et al., 2013).
The FS is a list of ignition points with geographical coordinates and burned area extents. These points were interpolated using an inverse distance-weighted algorithm to produce a grid of the expected FS. The combination of FS with the historical ignition surface (IP) was then used to map the fire potential index (FPI) as follows:
where high values of FPI indicate a high likelihood of fire ignitions growing into large fires. Understanding how FPI changes with distance from urban areas can be used to strategically protect villages or infrastructures from fire or implement preventive fuel reduction measures.
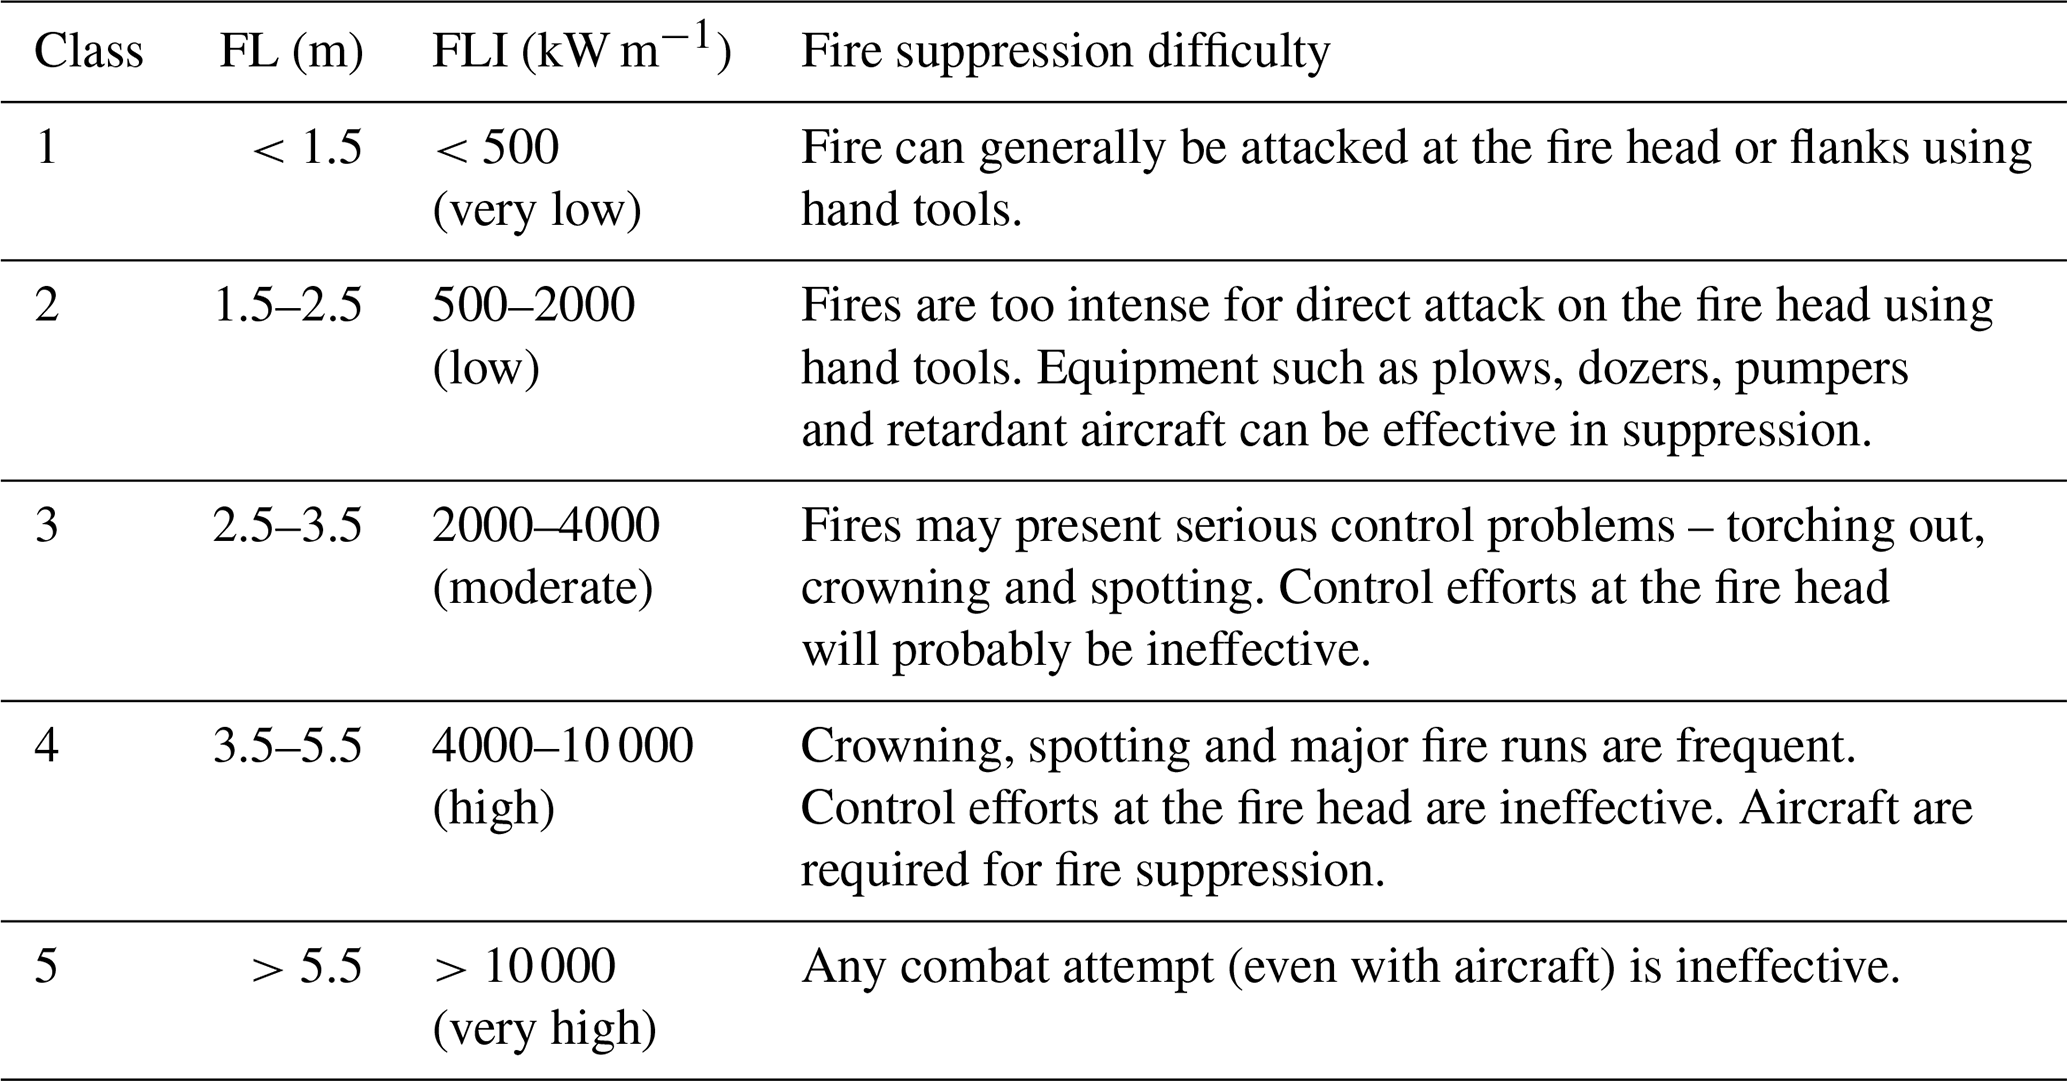
Previous wildfire descriptors were compared for the extreme and historical (reference) weather conditions to assess the increase in wildfire hazard with the increase in the weather severity. Furthermore, for the extreme weather condition, we also combined the estimated BP and FLI to identify areas most likely to be affected by high-intensity fires, which can also be used as a proxy for wildfire hazard. FLI was reclassified into four classes according to its relationship with fire suppression difficulty (Alexander and Cruz, 2019; Appendix D), and BP was divided into quartiles. For simplicity of writing, high-intensity and very high-intensity fires will henceforth be indiscriminately referred to as high-intensity or high-FLI fires. Lastly, we analyzed how the estimated fire hazard descriptors and FPI changes with distance to urban areas, relating these with the main fire-affected land cover types.
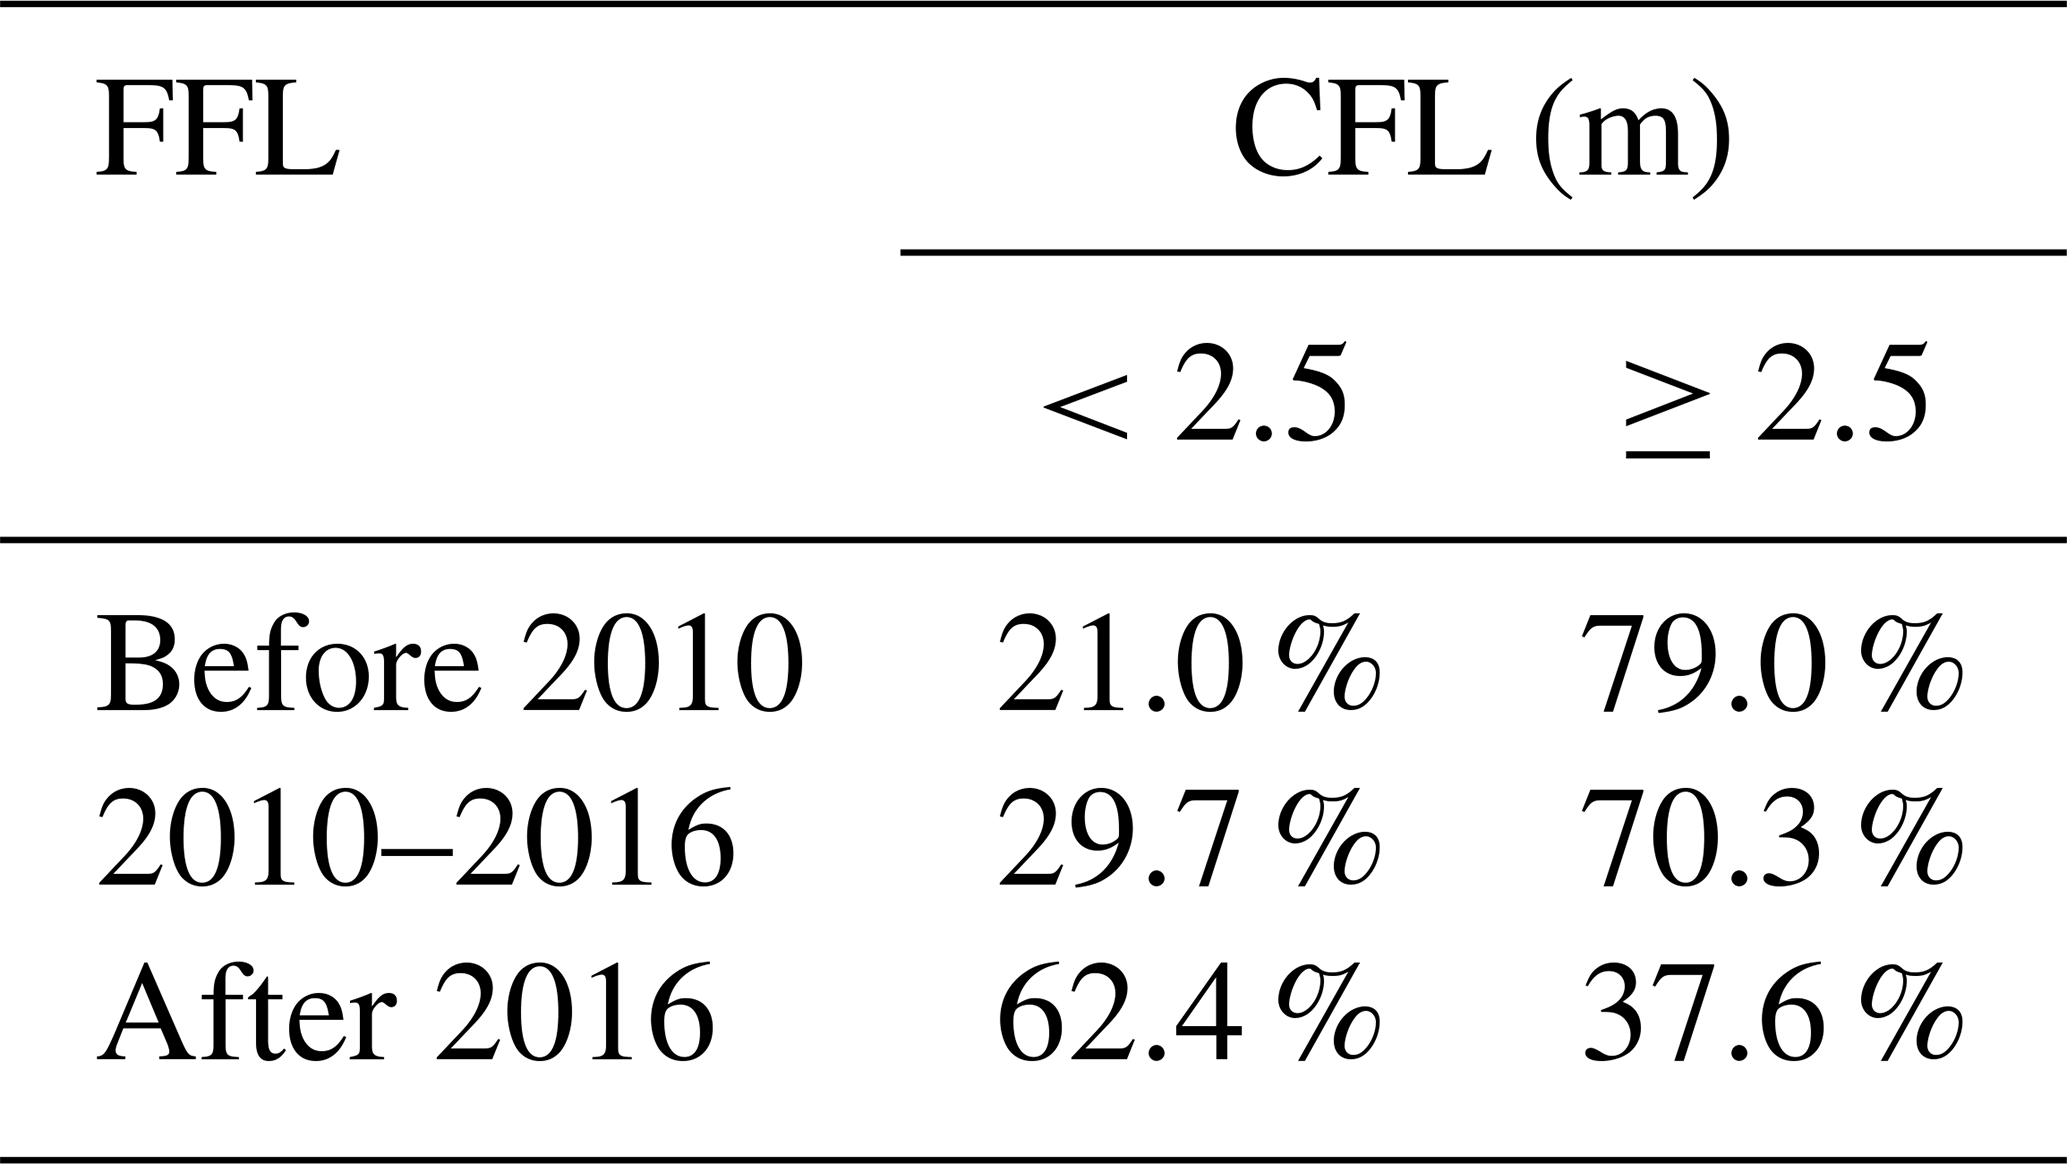
As a simple validation exercise, we evaluated if areas that were classified in the past with forest fire loss in the “Global forest loss due to fire” dataset (Tyukavina et al., 2022) are expected to have higher intensities in 2021, as estimated by the CFL. This dataset has a higher spatial resolution, and we only used pixels coded with moderate and high certainty in the analysis. Comparison with the forest fire loss (FFL) dataset was done by summing the total area of FFL divided in three periods (before 2010, between 2010 and 2016, and after 2016) and quantifying the area of the estimated CFL divided in two classes (below and above 2.5 m, based on its relationship with FLI).
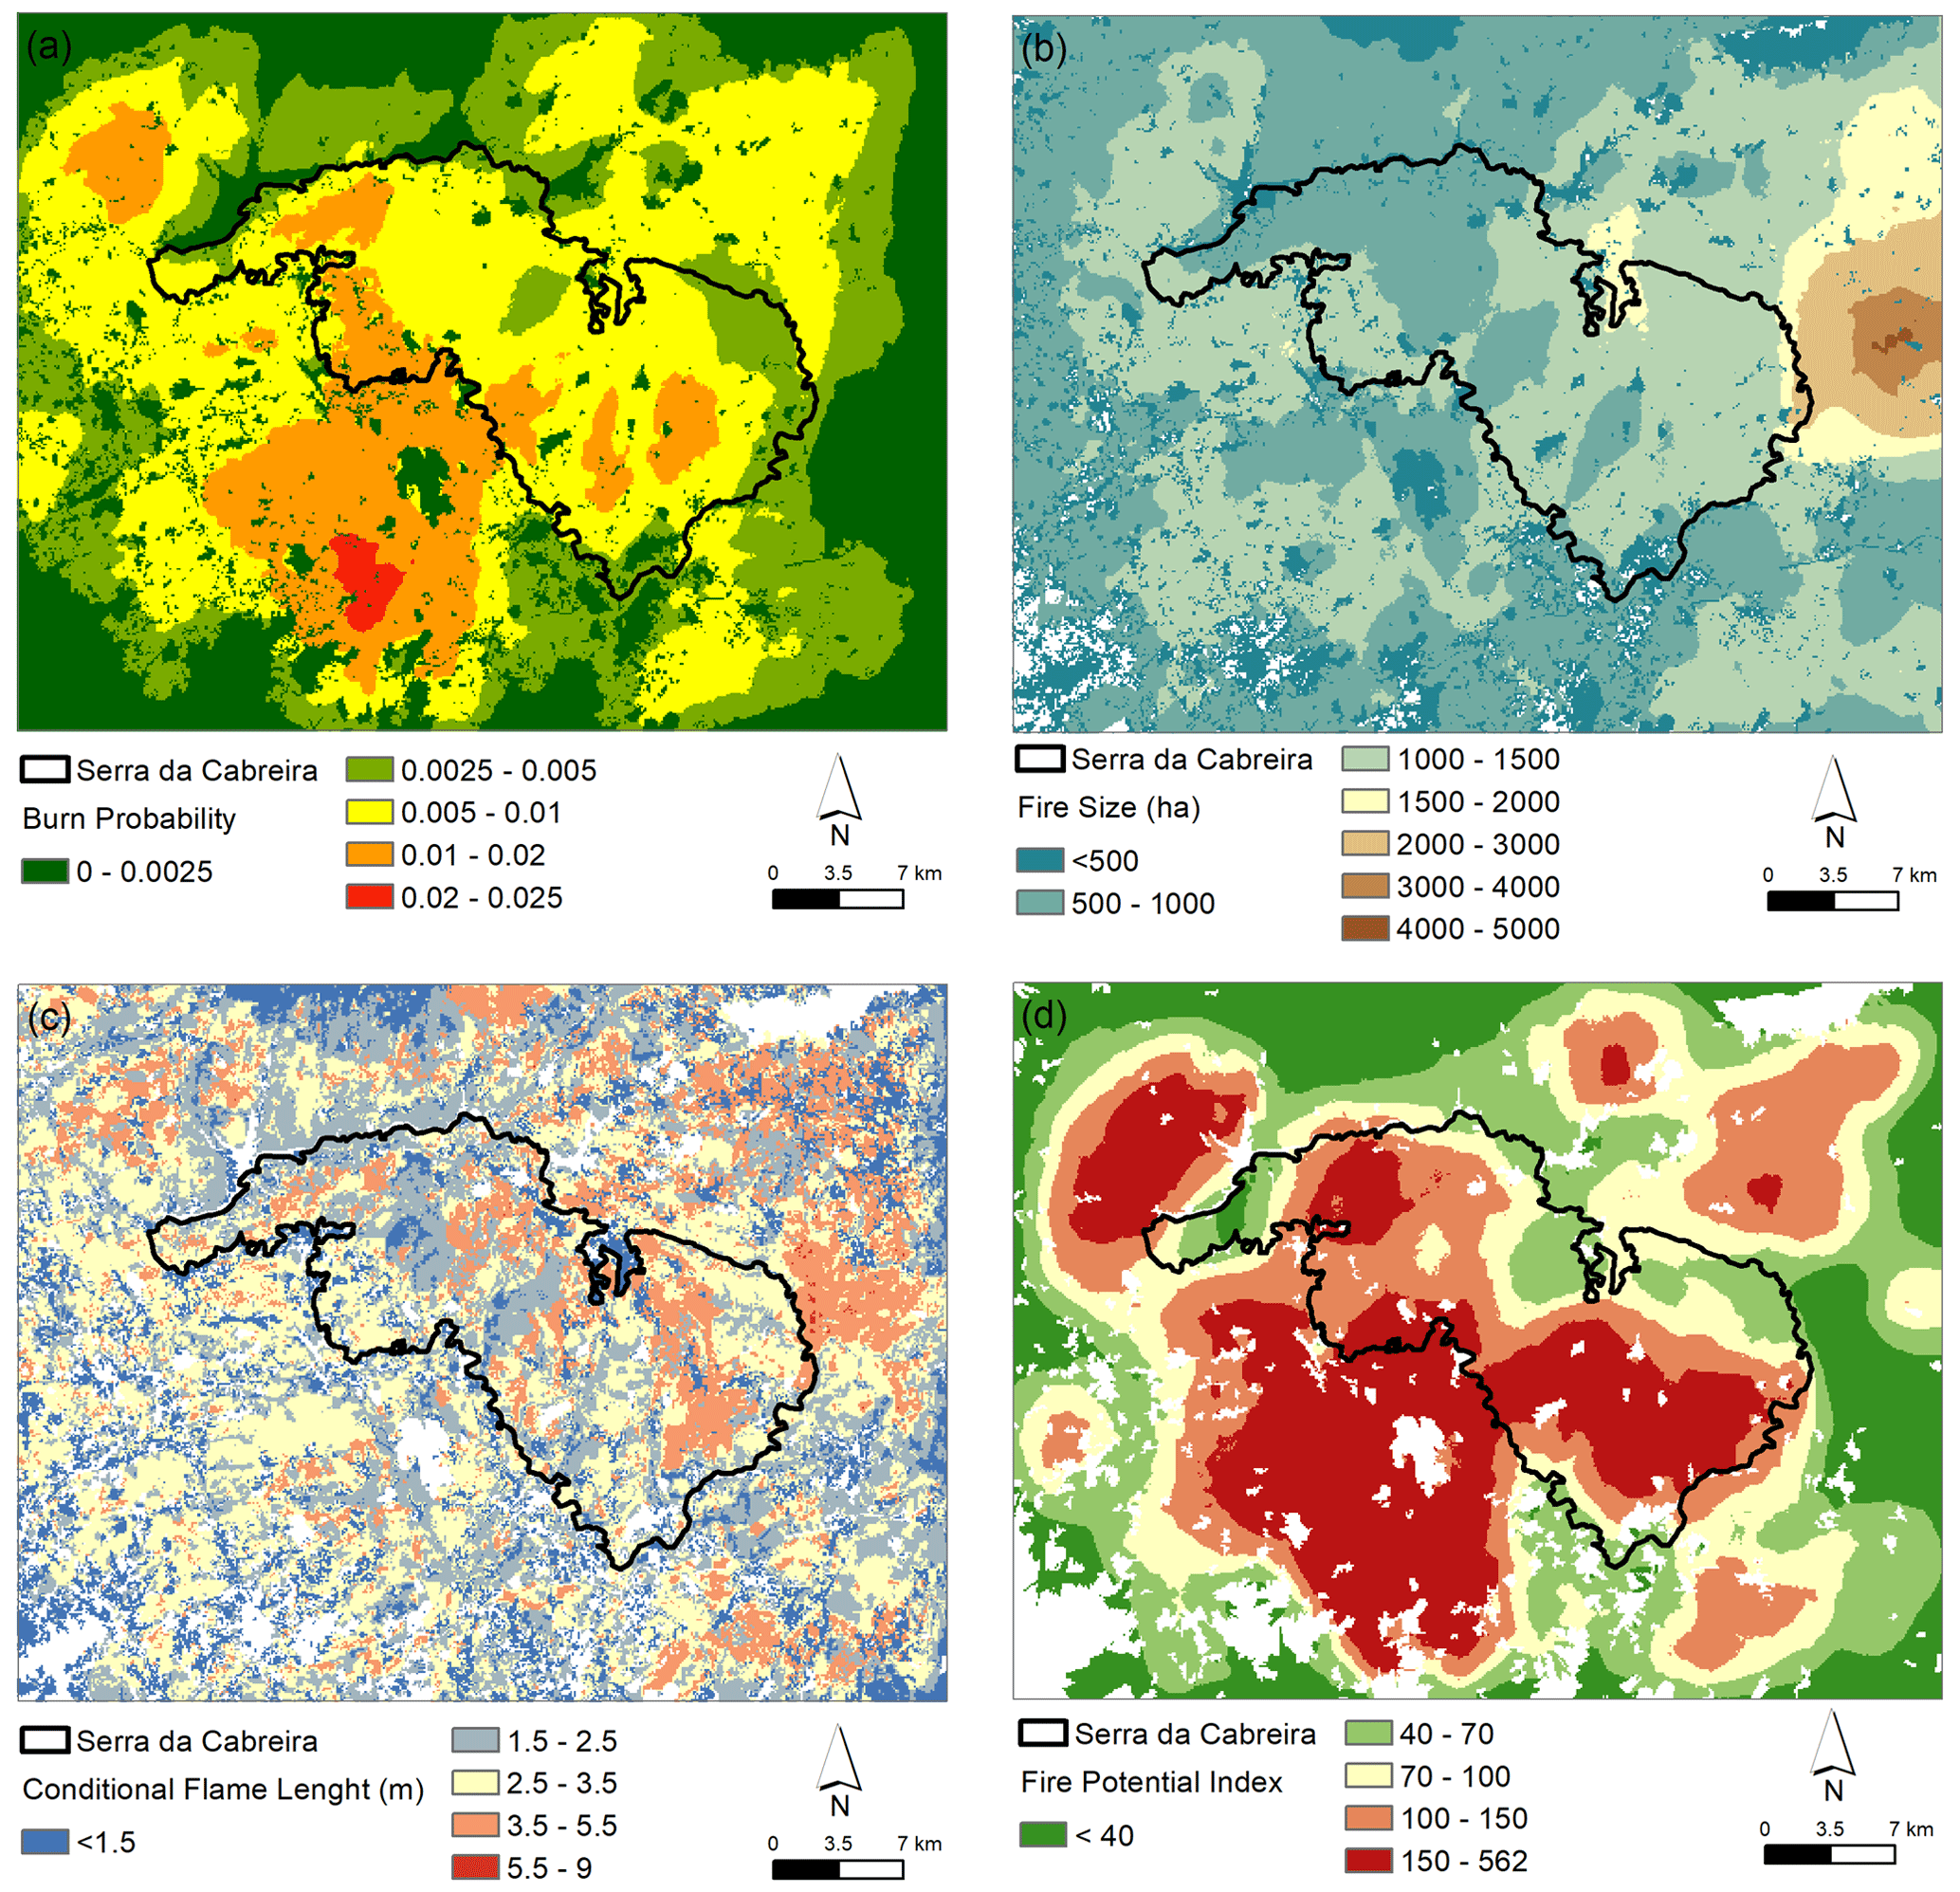
Figure 3Wildfire descriptors estimated with the extreme weather fire spread simulations: (a) burn probability (BP), (b) fire size (FS), (c) conditional flame length (CFL) and (d) fire potential index (FPI). FPI is shown in 20th percentile classes.
2.5.2 Wildfire connectivity
The spatial configuration of fuel patches needs to be considered in fuel and wildfire management planning, since fuel connectivity influences fire spread, fire size and fire intensity (Duane et al., 2021; Fernandes et al., 2014). A new metric to assess wildfire connectivity was recently proposed (Aparício et al., 2022): the Directional Index of Wildfire Connectivity (DIWC). This metric calculates the connectivity of fuel patches using simulated fire intensities and wind direction as the main driver of fire spread direction. It is calculated as follows:
where ai, aj, FLIi and FLIj are the area and fireline intensity in patches i and j, respectively. AL is the total landscape extent, and FLImax is the maximum FLI patch value in the study area. The weight matrix W is defined as or depending on wind direction quadrant. Wij is 1 when the neighboring nodes are aligned with wind direction. Distinct fuel patches were created by combining fuel model assigned to each land cover class with the main aspect directions and slope classes derived from its influence on fire spread rate (Butler et al., 2007).
We analyzed the impact of weather conditions in landscape wildfire connectivity by calculating the DIWC with FLI simulated for the historical and extreme weather conditions. Then, we used DIWC to map the contribution of each fuel patch to the landscape wildfire connectivity. The relationship between estimated FS and CFL and wildfire connectivity was also explored. Furthermore, we analyzed how the estimated fire hazard descriptors relate to the main land cover types burned. We also assessed the changes of FPI with distance to urban areas as an indicator of the exposure of population to fire hazard.
3.1 Wildfire hazard
We used the calibrated fire spread modeling system (calibration results are shown in Appendix E) to assess wildfire hazard in the study area, under extreme weather conditions. Figure 3 shows the estimated distributions of the wildfire descriptors BP, FS, CFL and FPI, the values of which are compared with those from historical simulations (Fig. 4).
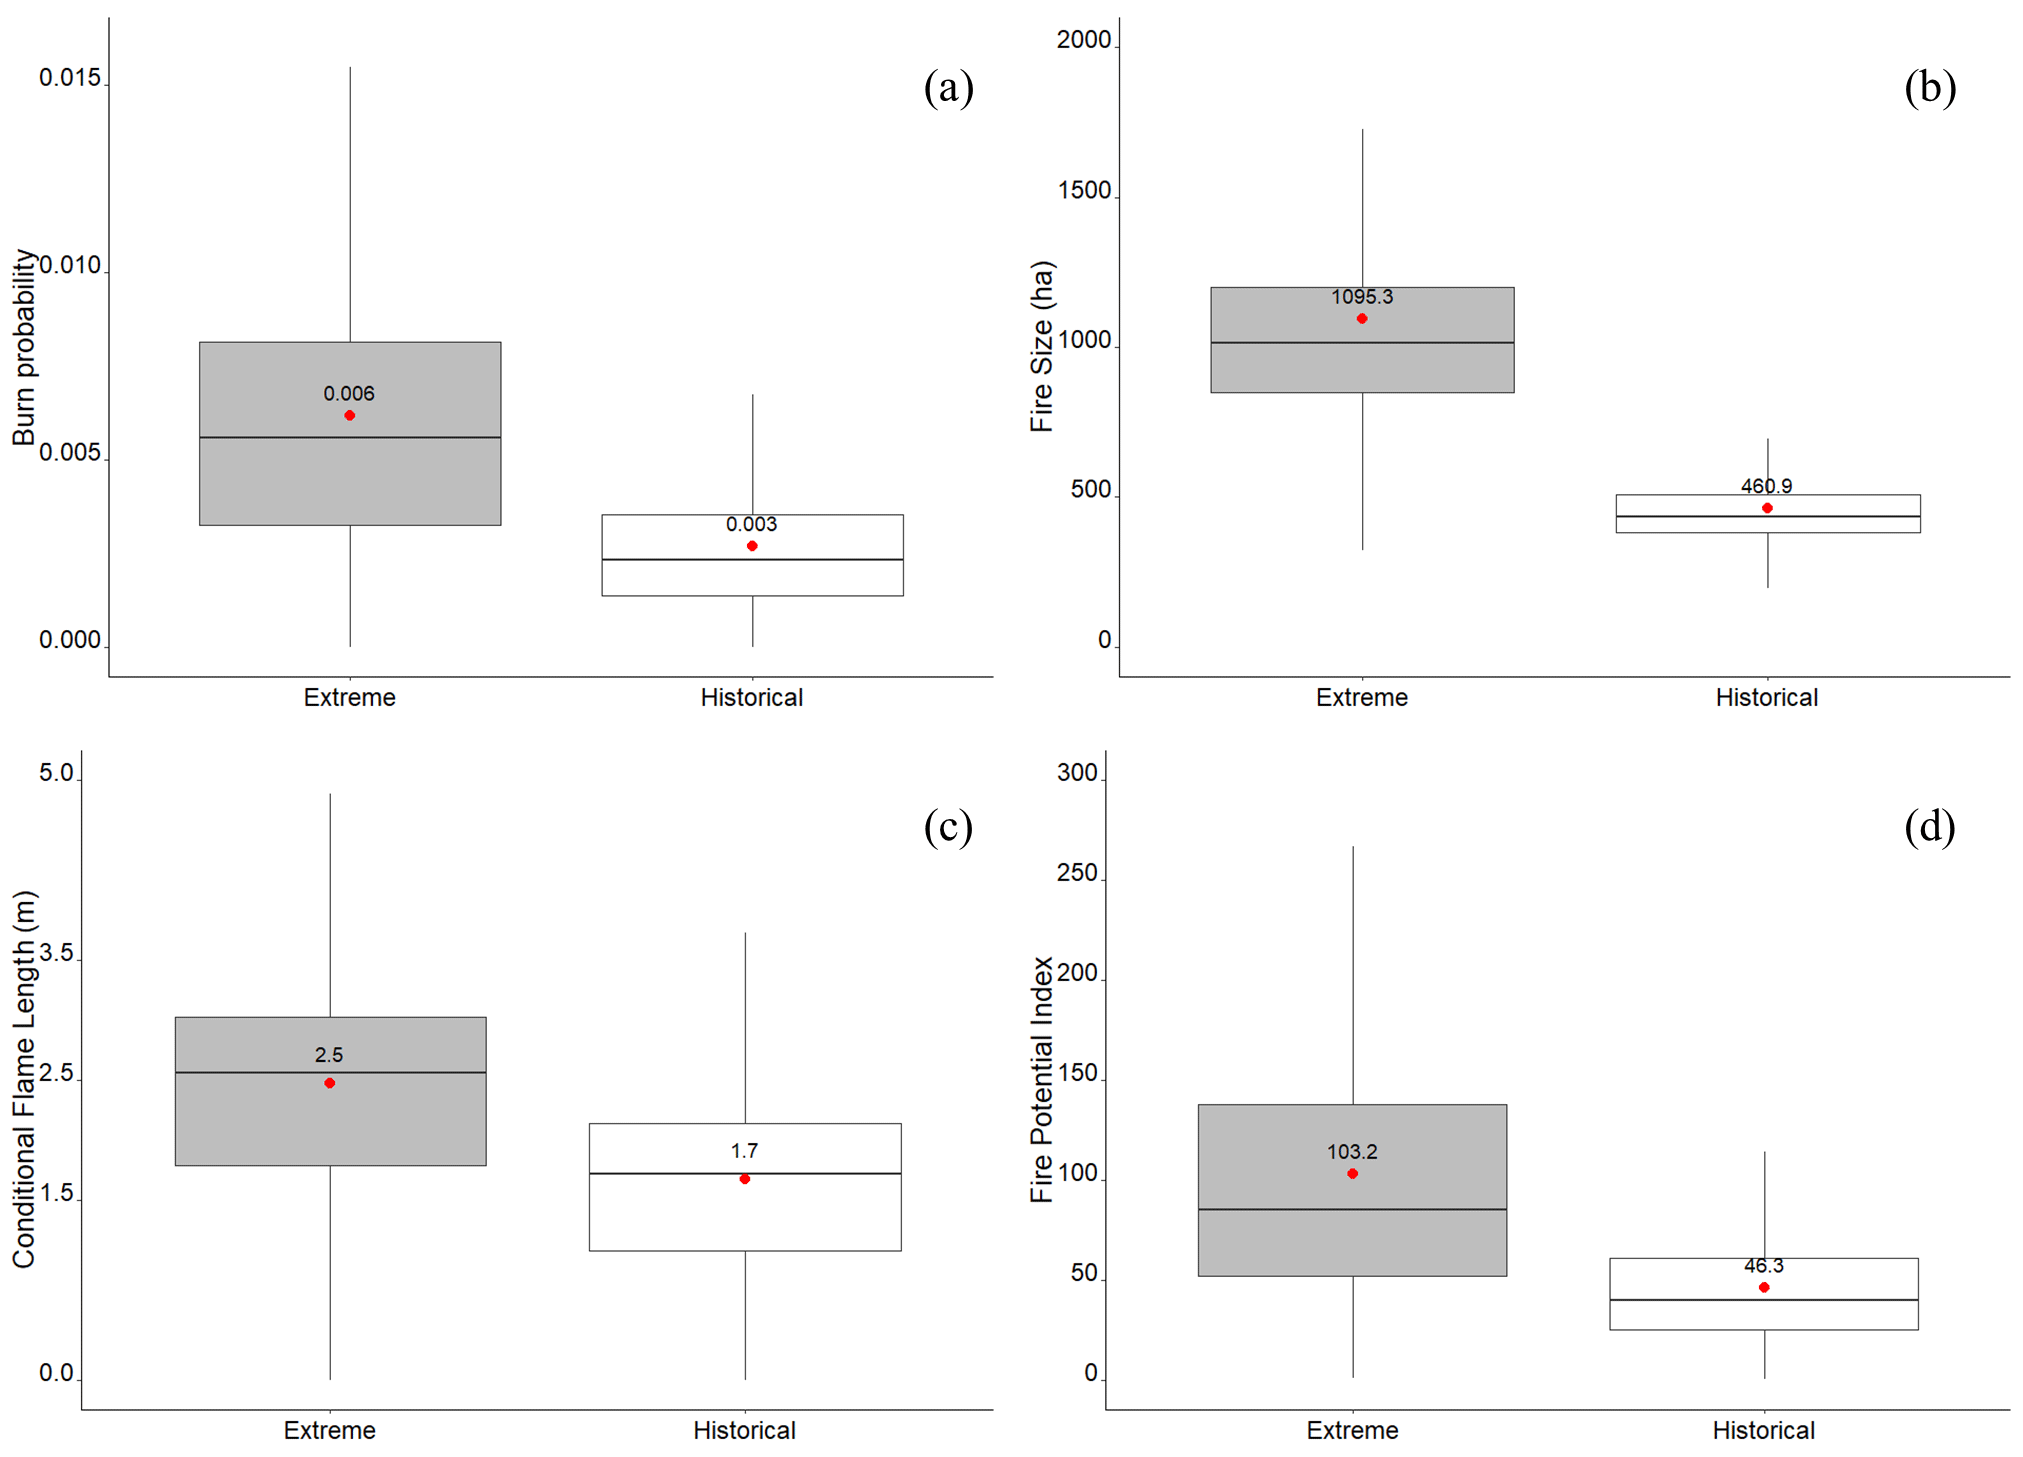
Figure 4Distribution of extreme and historical estimated wildfire descriptors: (a) burn probability (BP), (b) fire size (FS), (c) conditional flame length (CFL) and (d) fire potential index (FPI). Red points represent averaged values.
The highest burn probabilities are in the southwest and northwest of the study area, while the largest sizes are estimated in the east (Fig. 3a and b). Mean simulated BP, FS, CFL and FPI are 0.006, 1095 ha, 2.5 m and 103, respectively. Comparing the extreme and historical simulations (Fig. 4a and b), on average, BP doubled, and mean FS increased from 461 to 1095 ha (138 %), with 51 % of the study area having fires larger than 1000 ha.
Approximately 50 % of the study area has CFL values longer than 2.5 m (Fig. 3c), which represent fire intensities that do not permit suppression at the fire front. Extensive values of CFL longer than 3.5 m are estimated in ca. 15 % of the study area, mainly in the east (pine forests) and in shrubland areas located in the northwest and within the mountain limits of the study area. The spatial pattern of the FPI (Fig. 3d) extends that of the BP, especially in a large part of the southern-central section of the study area. This likelihood of large fires is higher than the historical mean in approximately 80 % of the study area (Figs. 3d and 4d).
Comparison between the estimated CFL and the FFL dataset showed that the CFL is likely providing good results in the estimated areas of high-intensity fires (CFL > 2.5 m), thus where higher fire impacts are expected (Table 2). A large percentage of the areas that had FFL before 2016 (above 70 %) are likely to have CFL values above 2.5 m, thus high-intensity wildfires in 2021. In recent burned areas (later than 2016), most of the areas that had FFL (62.4 %) are prone to lower-intensity fires.
Table 2Percentage of the area assigned with FFL per three classes of year in each class of CFL based on its relationship with fire intensity.
By combining the simulated FLI with BP (Fig. 5), the map highlights areas more likely to have intensive fires. Approximately 50 % of the study area has estimated FLI above 4000 kW m−1, which represents areas where suppression is ineffective at the head of the fire, fire spotting and crowing are frequent, and ground-based suppression must be complemented by aerial attack. The most likely locations (BP higher than the median) that spread fires with those intensities cover 27 % of the study area. Also relevant are the areas where, despite being unlikely, fires can spread with high intensity. This represents 25.1 % of the area with a BP below the median.
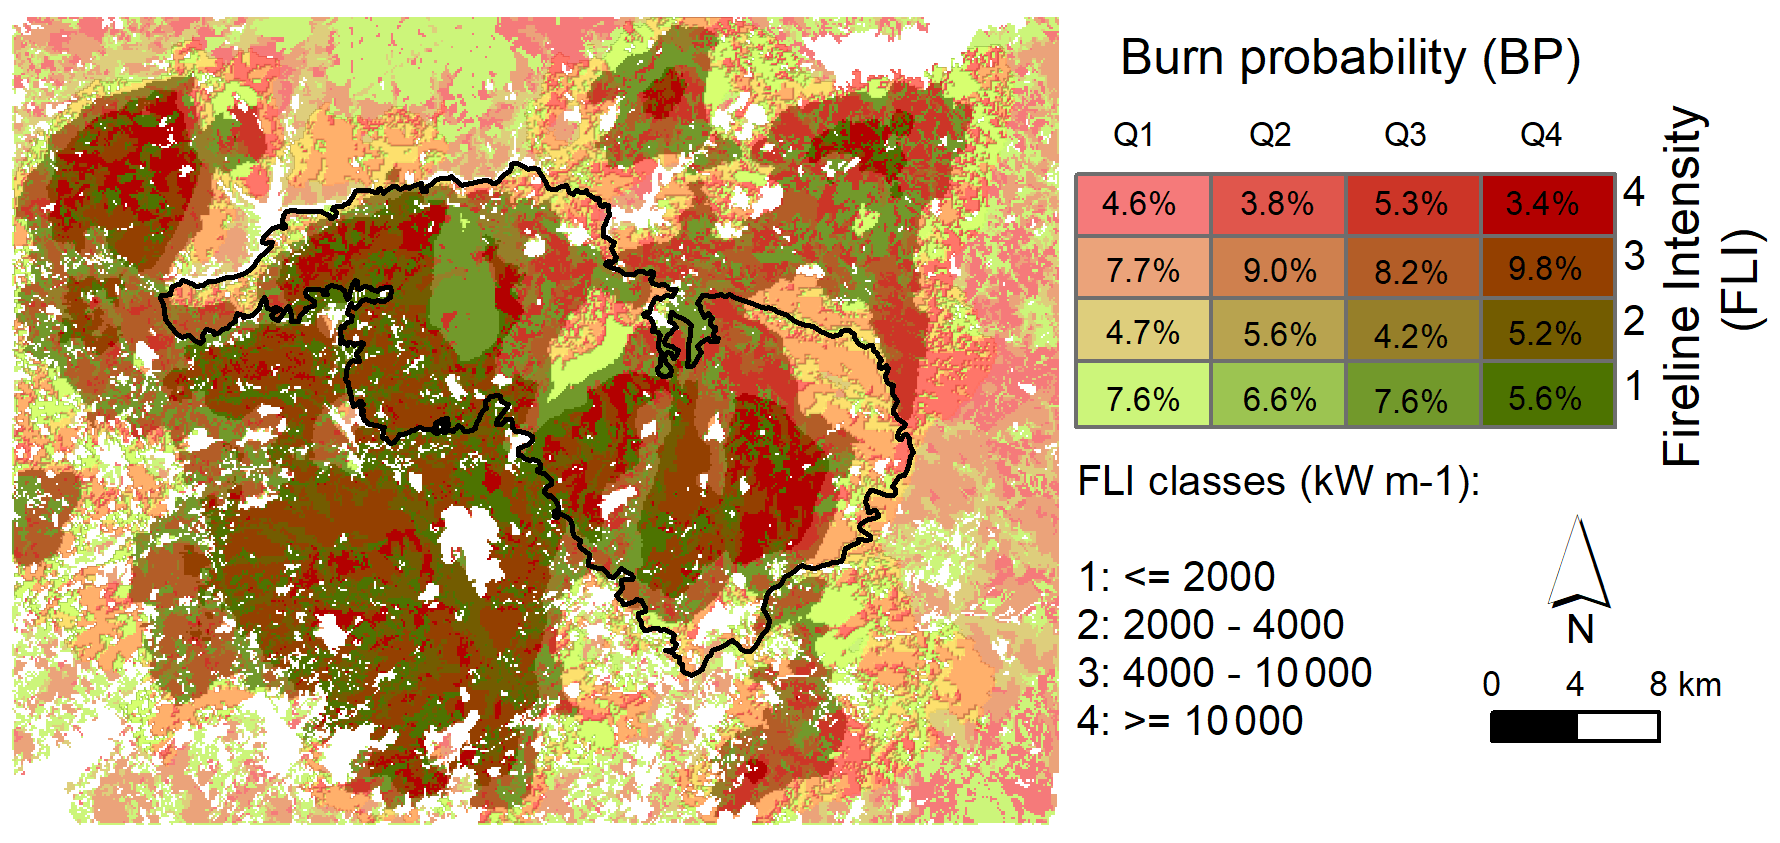
Figure 5Spatial combination of the simulated BP and FLI using burn probability quartiles and FLI classes defined according to fire suppression difficulty as a proxy for wildfire hazard. In the map lighter colors have lower BP, while reddish colors are assigned to higher estimates of FLI.
3.2 Land cover hazard
We assessed the relative contribution of different land cover types to the spread of wildfires under extreme weather conditions by calculating their averaged values in the space defined by the BP, CFL, FS and FPI fire spread descriptors (Fig. 6). The main land cover types burned are, in descending order, shrublands, sparse vegetation, other hardwood forests, agriculture, pine forest, grasslands, other coniferous and eucalypt plantations.
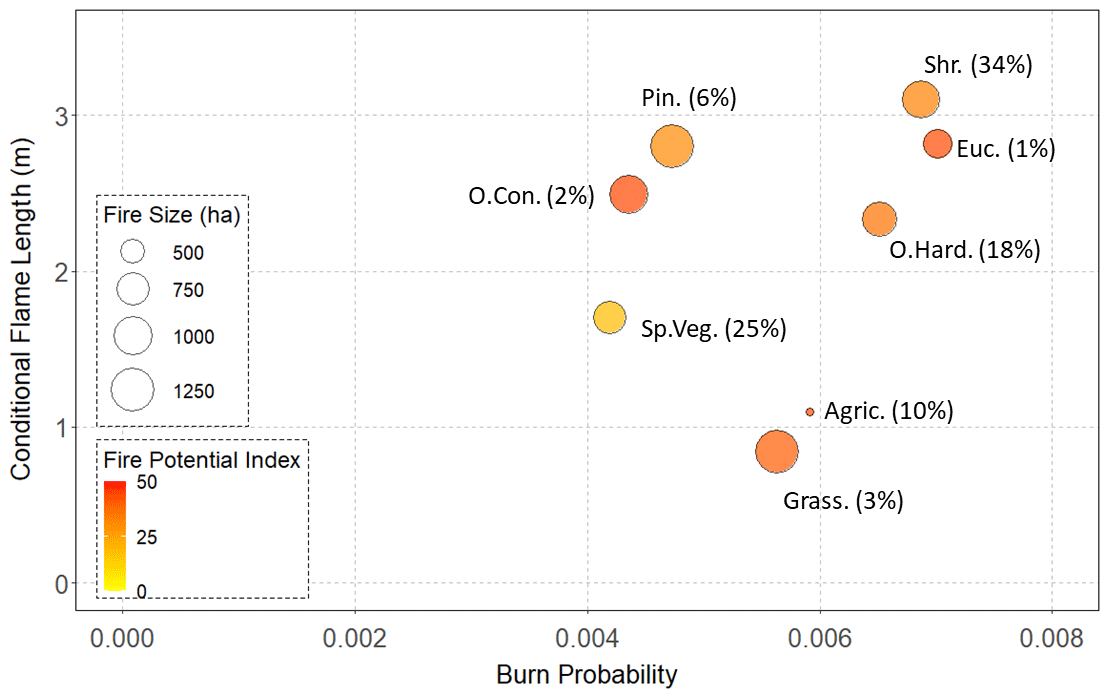
Figure 6Averaged values of simulated burn probability (BP), conditional flame length (CFL), fire size (FS) and fire potential index (FPI) for the eight main land cover classes in the study area. The percentage of each class burned is shown in parenthesis. Bubble size is proportional to FS, and the color represents the FPI values. Agric.: agriculture; Pin.: maritime pine; Euc.: eucalypt; Sp. Veg.: sparse vegetation; O. Con.: other coniferous; Shr.: shrublands; Grass.: grasslands; O. Hard.: other hardwood.
Shrublands, eucalypt and other hardwood forests show the largest average BP, representing approximately 50 % of the simulated burned area. However, eucalypts cover a very small fraction (1 %) of the burned area, despite their large FPI values. Fires in shrublands and pine forests are expected to be the most intense (CFL of 3.1 and 2.8 m, respectively) and large (958 and 1229 ha, respectively). Fires in grasslands have the largest FS (1260 ha), moderate BP (0.006) and relatively high FPI (41.4). However, only 3 % of the simulated burned area was in grasslands. Other hardwoods represent 18 % of the area burned, with relatively high average BP (0.006), moderate CFL (2.3 m), relatively large FS (826 ha) and intermediate values of FPI (36.5).
We analyzed how FPI changes with distance to urban areas and assessed where the most hazardous land cover classes are located (Fig. 7). Comparing with the FPI 75th percentile (Fig. 7a), there is a clear increase in the probability of an ignition becoming a large fire for distances up to 1 km from urban areas. Up to 250 m from urban areas, agricultural areas and eucalypt plantations are the most represented classes. Shrublands (38 %), pine (20 %) and other hardwood forest (18 %) contribute to the large values of FPI, mainly between 500 m and 1 km from urban areas (Fig. 7b). For distances between 1 and 4 km, the FPI decreases with the increase in sparse vegetation, while pine forests and shrublands decrease. The lowest FPI values were estimated for distances larger than 4 km from urban areas, where ca. 75 % of the burned area is in sparsely vegetated locations.
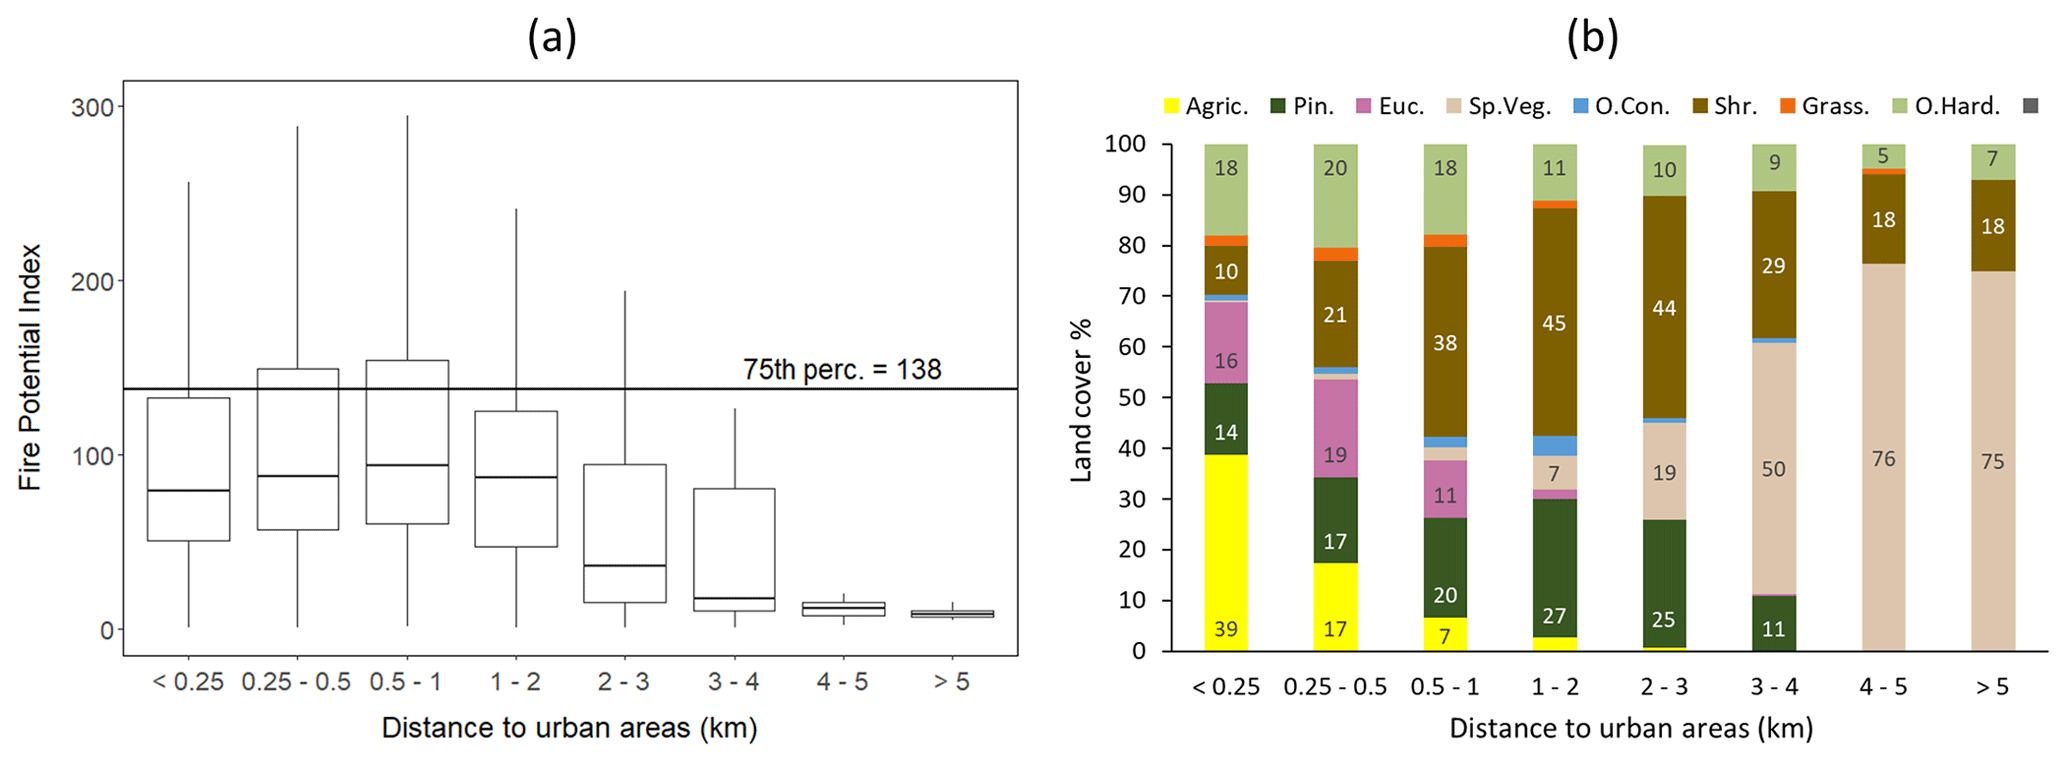
Figure 7(a) Fire potential index (FPI) as a function of distance from urban areas and (b) main land cover percentages by distance from urban areas class. Only land cover classes that burned more than 5 % are shown.
3.3 Wildfire connectivity
We analyzed variations in landscape connectivity for the spread of fires as a function of the fire weather conditions (Fig. 8). With increasing weather severity, the area of the landscape that spread high-intensity fires increases. This is clearly shown in the DWi weather type where the DIWC approximately doubles (ca. 0.3) the connectivity of the other weather types and in the extreme weather where different WDs result in different landscape DIWC values. The highest value of wildfire connectivity was estimated for the north–south wind directions.
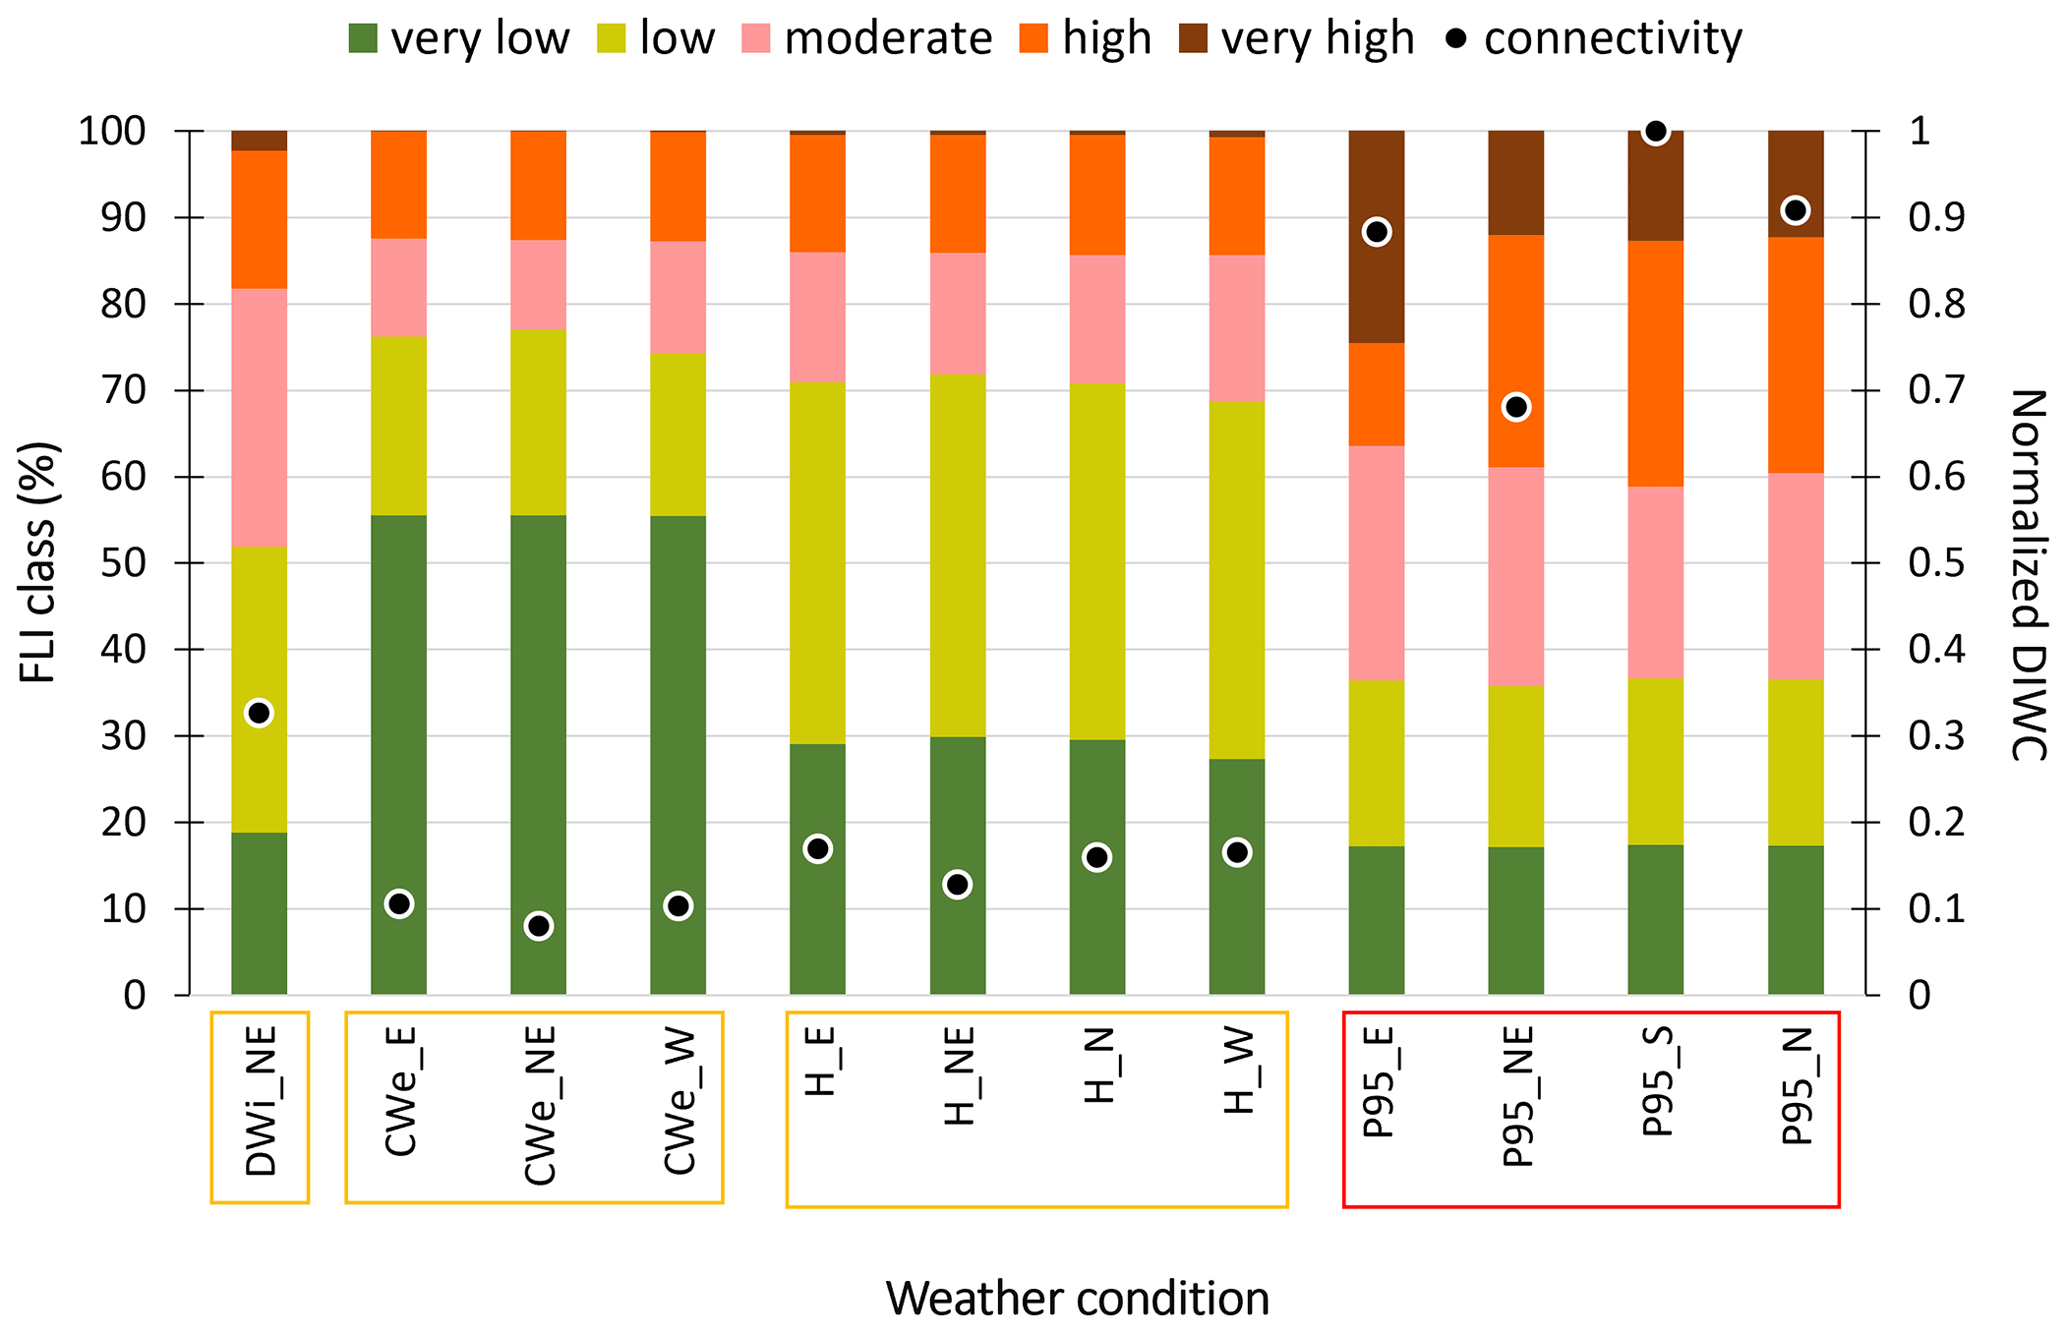
Figure 8Percentage of fire intensity (FLI) classes and normalized wildfire connectivity index (DIWC) for each weather condition. Simulated FLI was classified in five classes (Appendix D). Yellow boxes represent the weather types from the historical weather condition, while the red box represents the extreme weather condition. Acronyms refer to the weather types and the corresponding wind directions with a frequency higher than 10 %.
Figure 9 shows the expansion of high-FLI classes (from 9 % under CWe to 50 % under P95) with the increase in fire weather severity. This leads to the coalescence of fuel patches, which the DIWC quantifies as an increase in wildfire connectivity, as shown by the expansion of mainly two hotspots in the eastern and central regions of the study area. Highly connected patches (with DIWC > 0.10, here selected as having values larger than the 95th percentile) represent 13.3 % (13 125 ha) of the area under the extreme weather, 12 % and 8 % under the DWi and H weather types, respectively. For the extreme weather, these patches are shrublands (57 %), pine forests (22 %) and eucalypt plantations (12 %), where pine forests (followed by the shrublands) have the largest DIWC values of all the weather conditions (Appendix F).
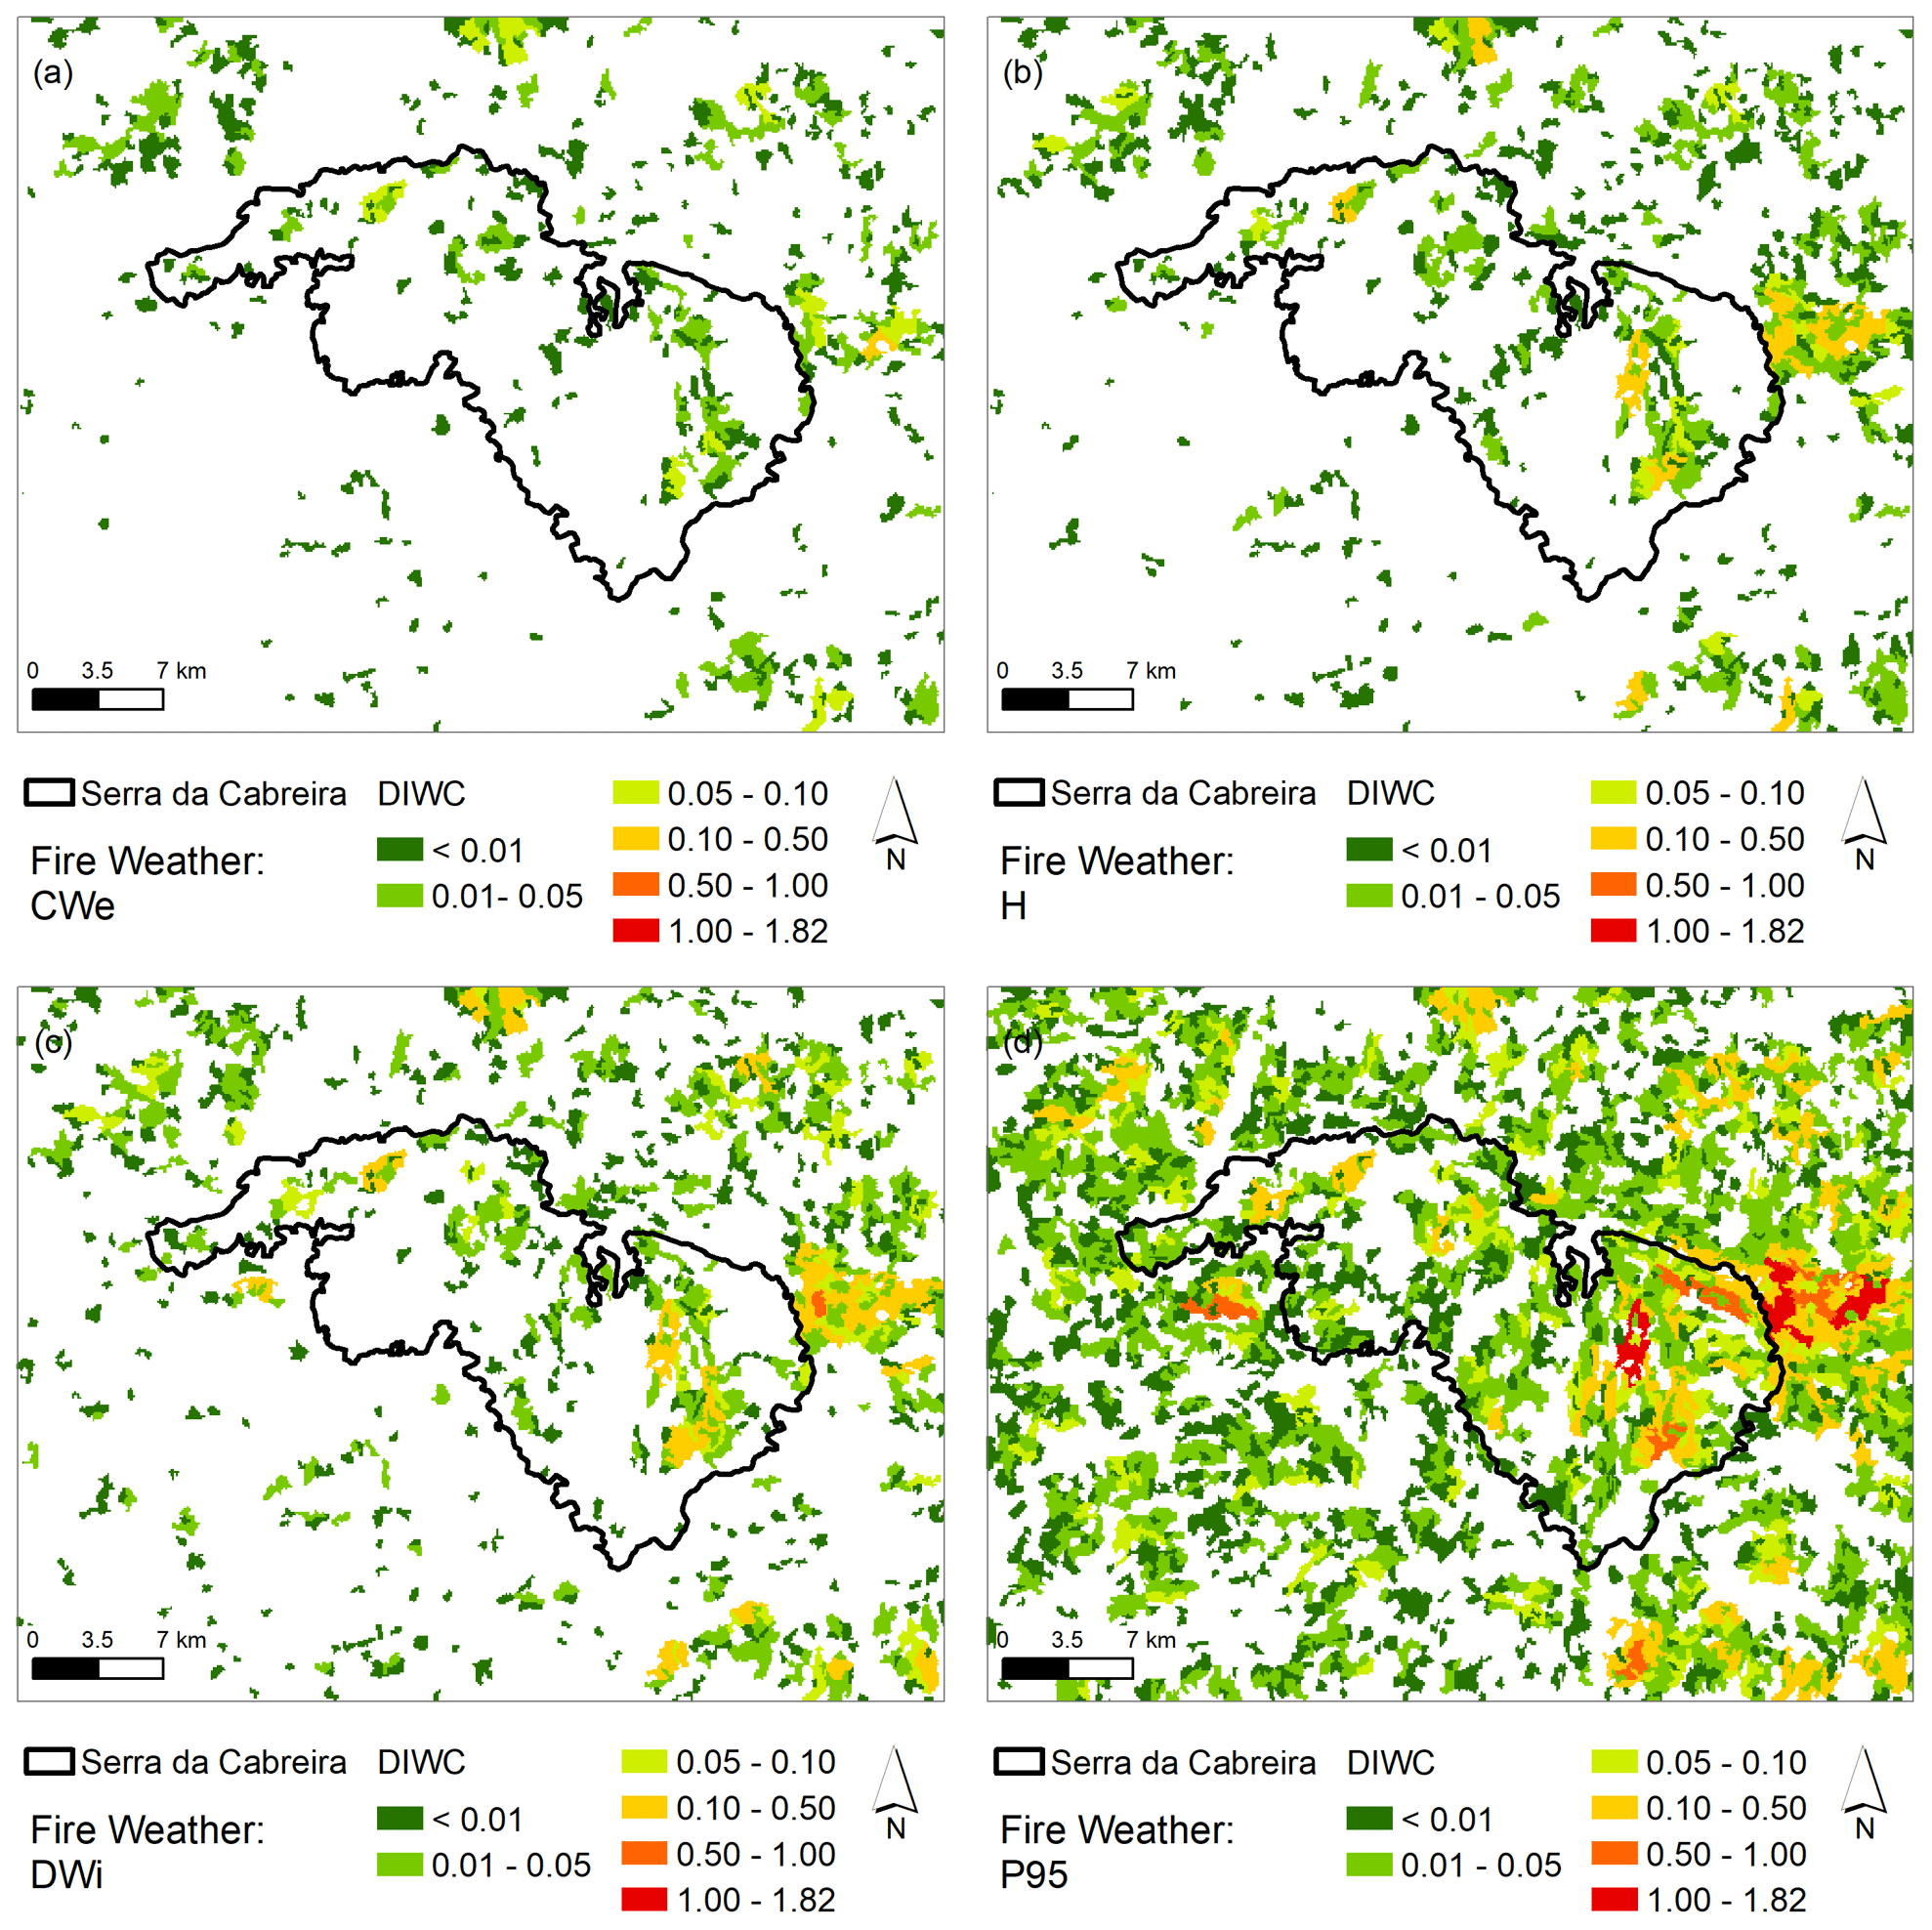
Figure 9Normalized wildfire connectivity (DIWC) calculated for the historical – (a) CWe, (b) H and (c) DWi – and (d) extreme fire weather conditions. Only fuel patches with estimated FLI > 4000 kW m−1 (high-FLI classes).
Furthermore, Fig. 10 shows for the extreme weather condition and high-FLI patches (Fig. 9d) the relationship between wildfire descriptors and wildfire connectivity values. The fuel patches with the highest values of DIWC also have higher values of FS and CFL (Fig. 10a and b). Thus, the location of fuel patches with extreme values of DIWC in the landscape highlights areas likely to spread very intense and large wildfires (median values of 3.7 m and 1010 ha, respectively). Nonetheless, there is not a relationship between DIWC and BP (Fig. 10c), and patches with higher DIWC have lower FPI (Fig. 10d) because they are in areas of low probability of fire ignition.
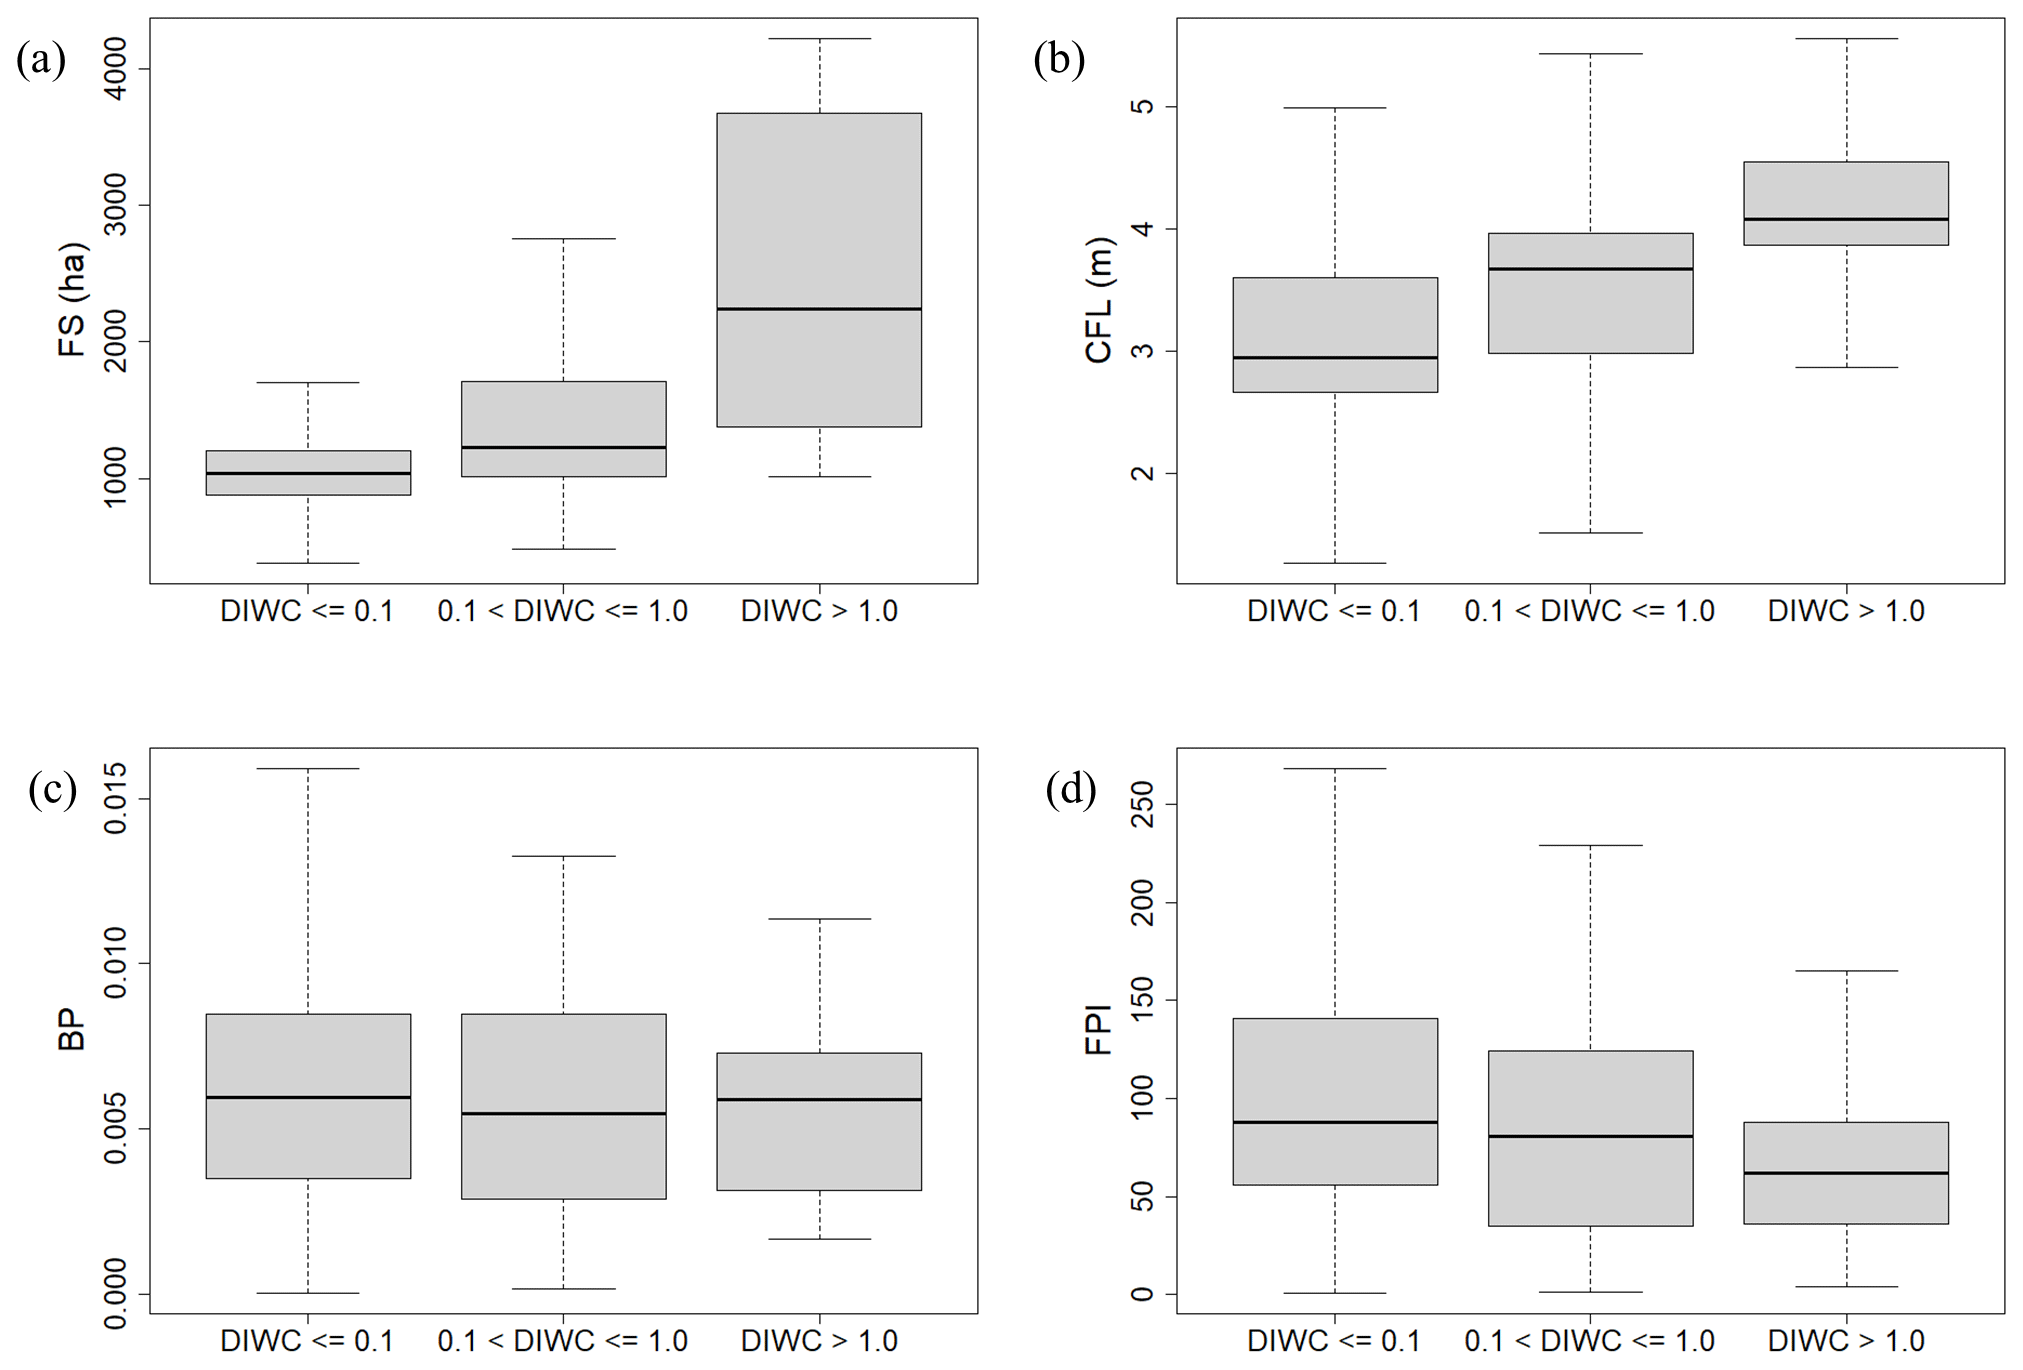
Figure 10Relationship between simulated fire size (FS), conditional flame length (CFL), burn probability (BP) and fire potential index (FPI) with the normalized wildfire connectivity index (DIWC), under the extreme weather condition. The 95th percentile of the DIWC is 0.10.
In Mediterranean countries there is an urgent need to adapt fire preventive measures and bring together researchers, politicians and managers to tackle the prospective increase of wildfire impacts in a changing climate (European Commission, 2021). This requires a paradigm shift that assumes coexisting with fire by creating fire-resilient landscapes. Hence, wildfire management needs to evolve towards identifying the best treatment opportunities that reduce fire intensity and burned extent while simultaneously creating opportunities for more effective suppression efforts (Curt and Frejaville, 2018; Wunder et al., 2021).
Consistent with previous findings, our study showed that by combining wildfire hazard and wildfire connectivity assessments supported by fire spread simulations, it is possible to enrich information used in landscape fuel management planning. We located the most likely areas to burn and those that spread large (above 1000 ha) and intense wildfires (above 4000 kW m−1). We also showed how landscape wildfire connectivity increases with weather severity and identified fuel patches that mostly contribute to the spread of high-intensity fires.
Wildfire hazard assessment under extreme weather conditions showed that Serra da Cabreira is exposed to large and intense fires that mostly spread with eastern and southern winds. Historical fire regime indicates that east of the mountain, the probability of ignition is low. However, simulations showed that the potential largest fires are located here, in extensive patches of pine forest with high fuel loads. This area has several highly connected fuel patches that support the spread of intense fires into the mountain, likely to burn extensive shrubland areas.
Another important hazardous area extends from the south to the center of the study area, where intensive and large fires are also expected to spread over shrublands. Southernly, the landscape is more anthropic, where urban areas are interspersed with agricultural lands, eucalypt plantations and other hardwoods in the valleys. However, at high altitudes this heterogeneous vegetation pattern is replaced by continuous areas of shrublands where fire frequency is high and fire return intervals can be lower than 5 years, which are both related to the frequent use of fire as a tool for pasture renewal (Catry et al., 2009; Moreira et al., 2011). This cultural use of fire is an important source of fire ignitions in the region, which in hot and windy days may lead to fire hazard increase in the mountain. Another relevant hotspot that has a high probability of spreading intensive and large fires is located northwest in another high-altitude shrubland area. Although western winds are not coincident with extreme fire weather conditions, they should not be ignored, given their moderate frequency in climate type H and the possibility that they lead to the spread of forest fires from this area to the mountain.
The maximum potential of likely ignitions spreading to large fires lies between 500 and 1000 m from urban areas, where shrublands prevail. Here, fuel-load reductions should be planned to decrease wildfire hazard, increase landscape fire resilience and improve wildfire response system. With other objectives in mind, such as for example to decrease the impact of fires in the wildland–urban interface, the FPI hazard descriptor should be replaced by other variables (e.g., fireline intensity), and smaller buffer distances from urban areas have to be considered (Calkin et al., 2014).
Extensive areas of fuels are one of the major determinants of fire size in Portugal (Duguy et al., 2007; Fernandes et al., 2016); the measures which promote the disruption of fuel contiguity will inevitably create opportunities for fire suppression and decrease burned areas and consequently hazardous landscapes. To implement those measures, landscape connectivity assessment is crucial not only to fuel treatment planning but also in the perspective of fuel structural connectivity (Liberatore et al., 2021; Rachmawati et al., 2016). Ignoring the complex dynamic fuel–weather interactions, which result in different landscape fire spread patterns, can lead to underestimation of connectivity and even different solutions of where to prioritize fuel treatments (Duane et al., 2021; Zeller et al., 2020).
To address the previous research gap, we applied a recently developed connectivity metric (Aparício et al., 2022) to calculate and map landscape wildfire connectivity response to the increase in fire weather severity. With increasing fire weather severity, the landscape extent that potentially spreads high-intensity fires increases, and with the coalescence of fuel patches, the landscape is more connected to the spread of large and intense fires. In the extreme weather condition, 50 % of the landscape can support the spread of high-intensity fires. In these areas, high wildfire impacts and suppression difficulties are expected, which can be exacerbated by the highly connected landscape fuel patches. These are candidate locations for fuel management treatment aiming to disrupt fire spread connectivity. Nonetheless, the effectiveness of breaking fuel connectivity to mitigate fire impacts and the spread of large fires in the landscape may be significantly reduced by the occurrence of severe weather conditions (Duane et al., 2021). However, there is evidence that there is a fuel effect on fire behavior under less severe weather conditions (e.g., Anderson et al., 2015). Besides this, as fuel treatments significantly reduce fuel load, it is expected that they significantly decrease fire intensity and the impacts in the landscape while simultaneously improving effectiveness of fire suppression operations. Furthermore, those extreme weather conditions typically occur in a few days of the fire season, so fuel treatments still have an important role in reducing fire spread and intensity in more frequent less severe weather conditions. We believe that wildfire managers can still use our study results and framework to target fuel patches for treatments aiming at decreasing landscape wildfire impacts.
Although the calibration of the fire spread modeling system reproduced the historical fire size distribution and burned area pattern in the study area reasonably well, there are some limitations to the current study. Uncertainty in fuel model assignment to existent land cover maps has important impacts on simulation results (Benali et al., 2016a); thus local information should be used to refine the fuel model input map. Furthermore, crown fires were not simulated because of the absence of data describing canopy fuels, which may be overcome in the future by using estimates from lidar data (ICNF, 2021a). Regarding the surface fuel models, the recently available national land cover map (DGT, 2021) with its increased spatial resolution potentially provides more accurate land cover mapping, which may improve the quality of fuel model assignment.
This study provides research-based information to enrich landscape wildfire management decisions by integrating wildfire connectivity analysis and simulated wildfire hazard descriptors. For the extreme weather conditions, we located the most hazardous areas of large and intense fires, and we showed that shrublands and pine forests are the land cover types that mostly burned in those damaging fires. We also showed that landscape wildfire connectivity increases with fire weather severity because of the coalescence of severe fires that extended for ca. 50 % of the study area. Landscape wildfire connectivity was mapped for each fire weather condition, highlighting fuel patches where the potential to spread large and severe wildfires is high.
We believe that these results can help fire managers to identify hotspot areas where site-specific fuel treatment operations should be planned. Ultimately, they contribute to mitigating future wildfire impacts and increasing landscape fire resilience of Mediterranean fire-prone regions. Future work should include the wildfire connectivity metric in the design of alternative fuel treatment scenarios to inform more sustainable and effective wildfire management in fire-prone Mediterranean landscapes.
There are 4 d of fire spread with T<10 ∘C, corresponding to fires that occurred outside the main fire season (Fig. A1a). Most of the wildfires spread with T between 30 and 35 ∘C. Most of the days have RH of 40 %, and a quarter had below 30 %. In general, lower T values are related to higher RH, which often corresponds to the last hours of fire spread, sometimes coincident with a decrease in severity of the fire weather conditions (Fig. A1b). The most frequent WS values lie between 10 and 15 km h−1, while the maximum value is 25 km h−1. The most frequent WDs are from the east (41 %) and west (19 %), while each of the remaining directions has a frequency below 10 % (Fig. A1c and d).
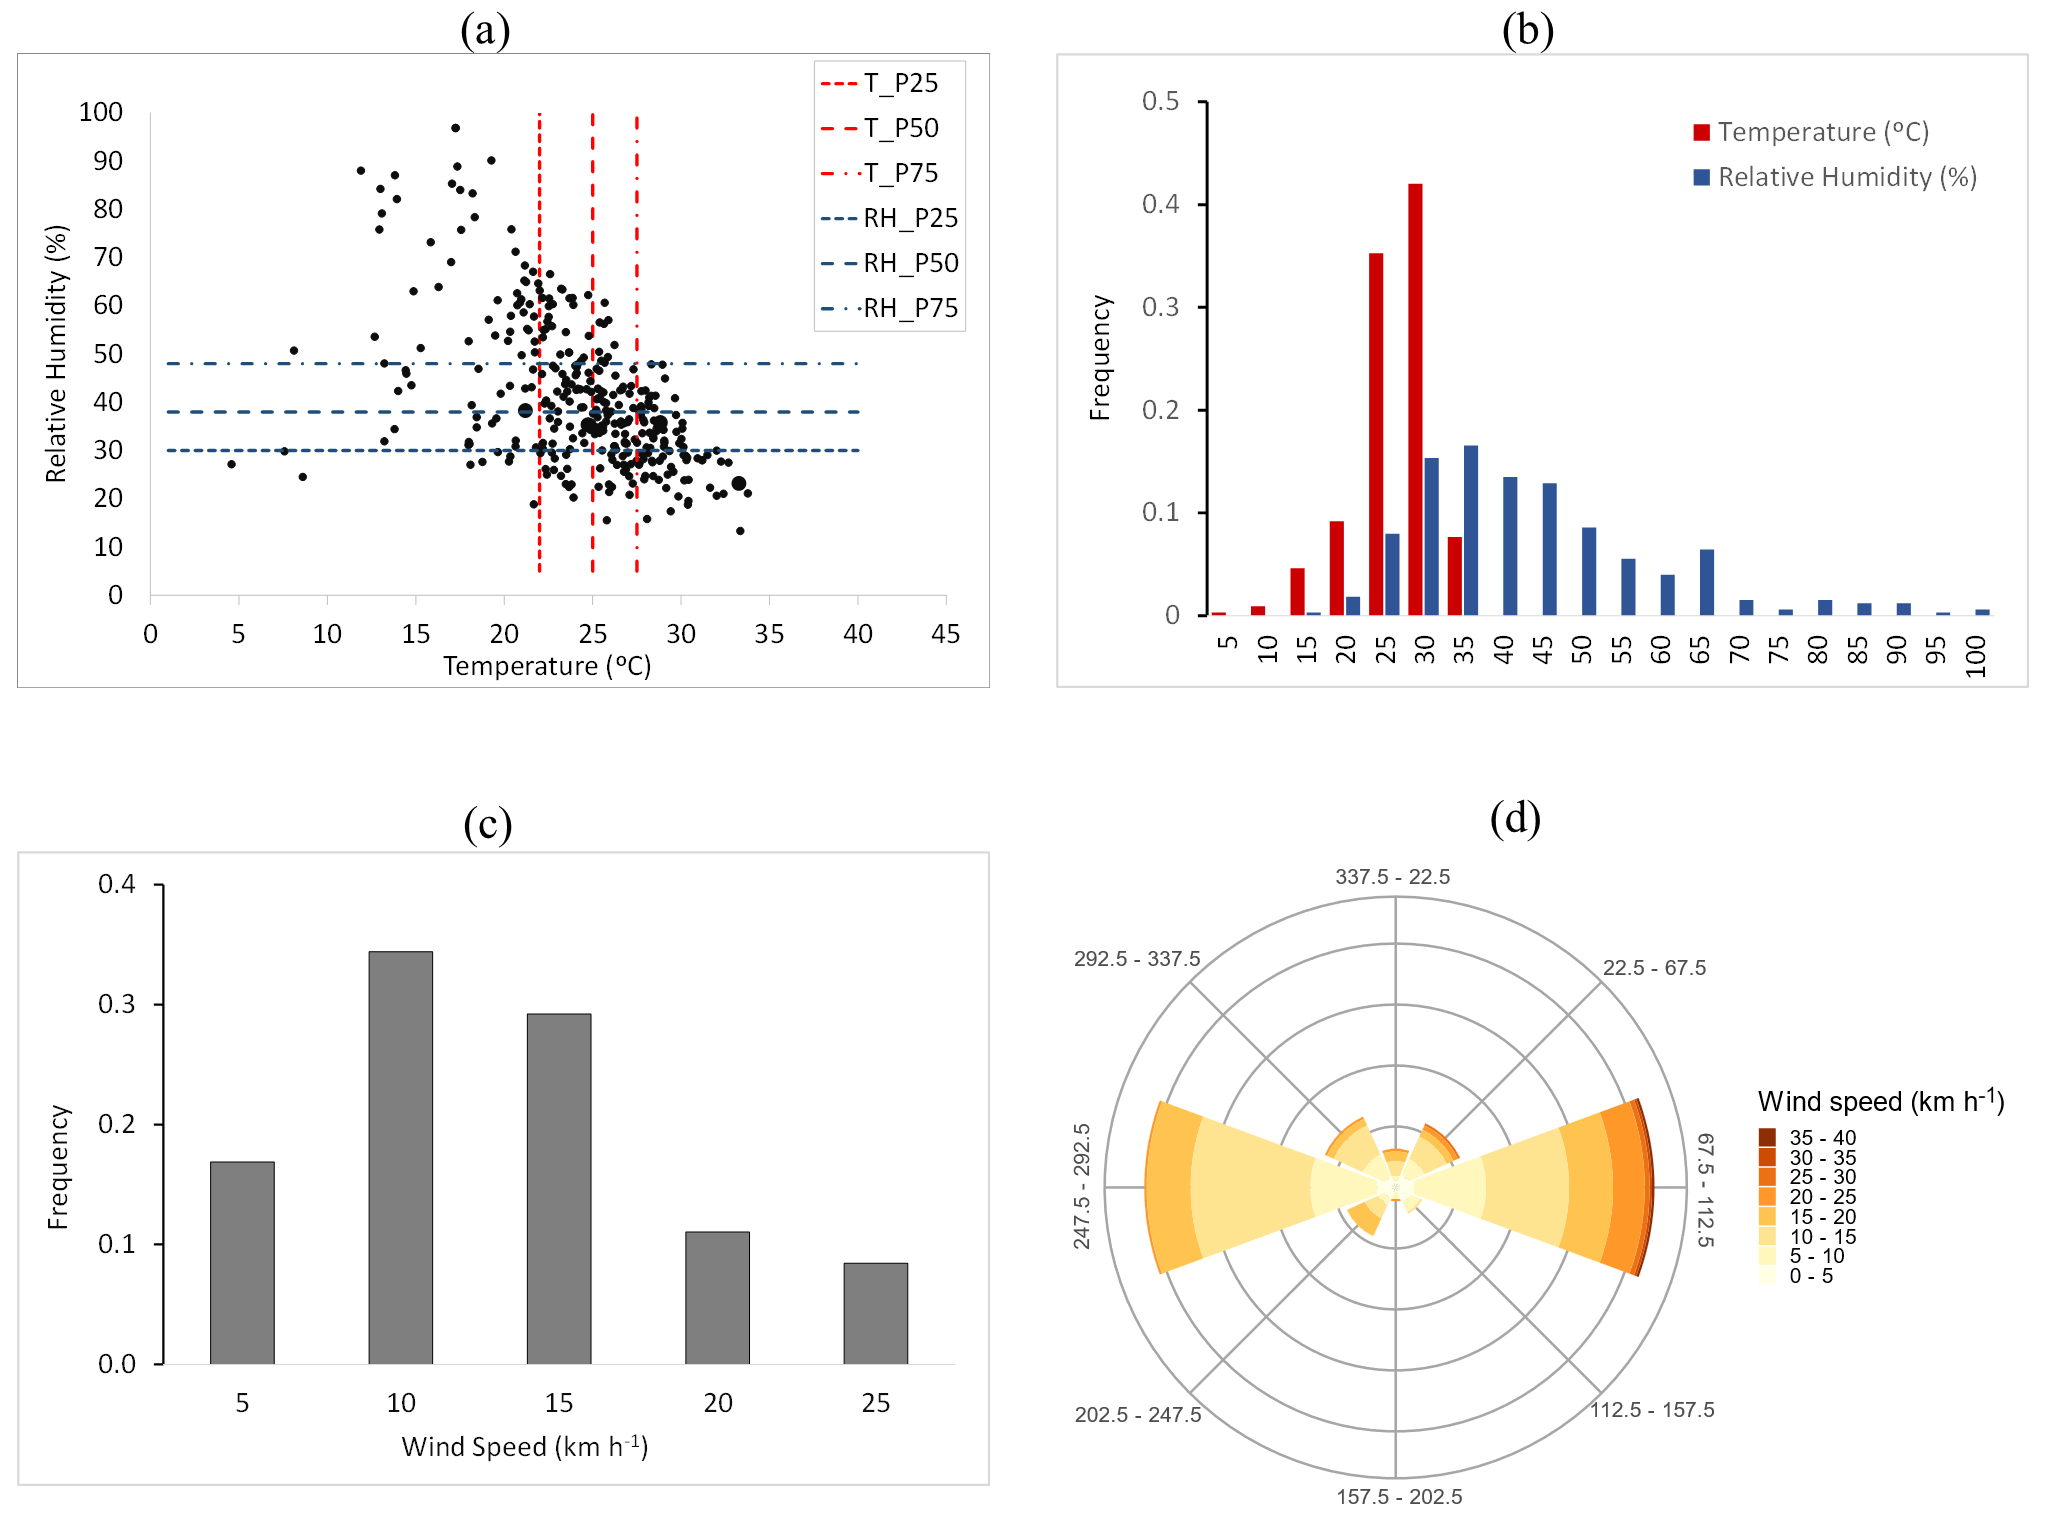
Figure A1Fire weather variables compiled for the days of fire spread of the 200 wildfires from the fire database. (a) Average daily values of the variables were calculated for temperature and relative humidity, with quartile lines shown; (b) frequency distribution of T and RH; (c) frequency distribution of WS; and (d) wind rose. A total number of 326 d was compiled.
A finite mixture model was fitted to the wildfire weather database using the Bayesian information criterion model selection to derive the optimal number of clusters. This model considers the data as coming from a distribution that is mixture of two or more clusters. In the classification, the optimal number of clusters is calculated automatically; it integrates uncertainty in class assignment and produces the probability of each daily observation belonging to each cluster. It also produces the geometric features (orientation, size and shape) of the clusters (Banfield and Raftery, 1993).
Results showed that the optimal solution is a three-cluster model (Fig. B1a), which has ellipsoidal shapes with varying volume, shape and orientation (VVV). Uncertainty of cluster allocation is shown in Fig. B1b, where larger symbols indicate more uncertainty. Observations in the left cluster (cluster 2) are more certain of being in the correct cluster, while observations classified in the right clusters are more uncertain as they are more similar.
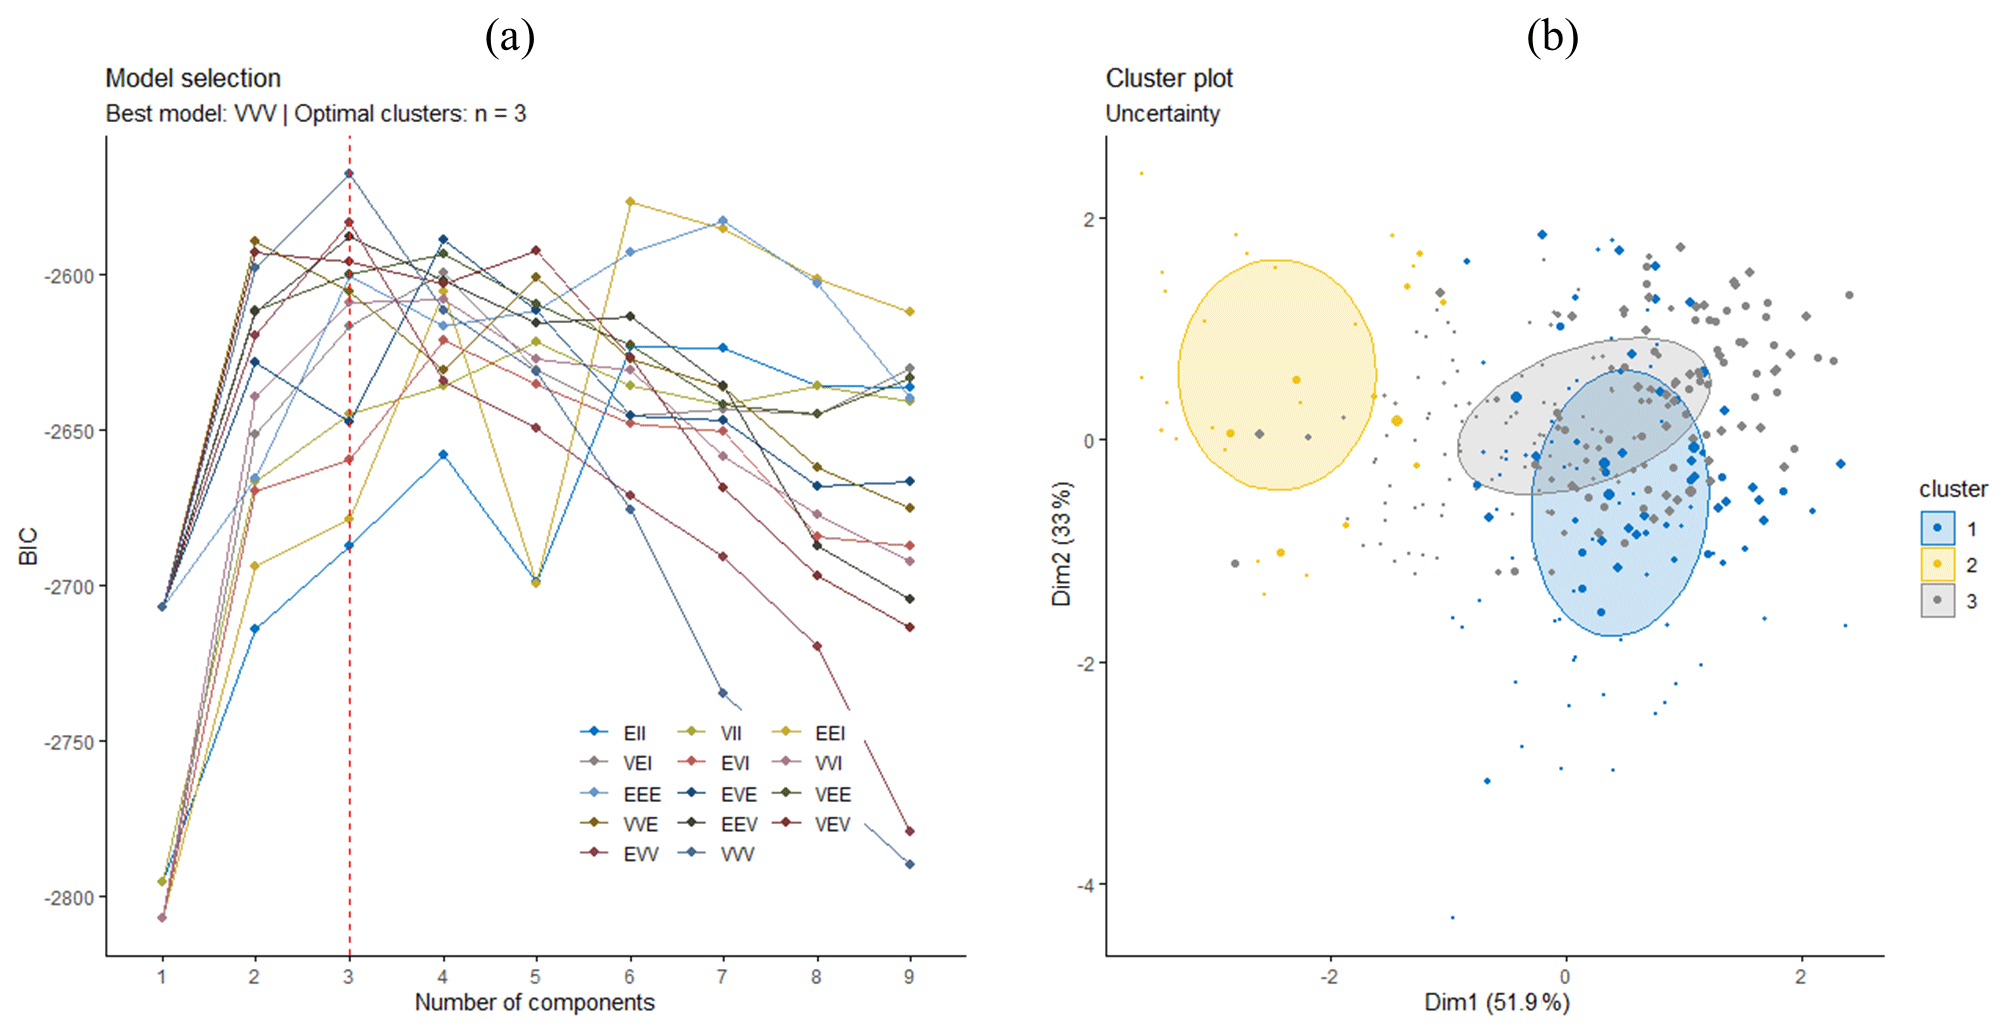
Figure B1(a) Optimal solution (three clusters) according to the ellipsoidal volume, shape and orientation properties and (b) uncertainty cluster assignment of each weather day. There are 14 available models for more than 2 groups represented by triplets EII, VII, EEI, VEI, EVI, VVI, EEE, EVE, VEE, EEV, VEV, EVV and VVV. The first letter in a triplet refers to the cluster size (volume), the second to the shape and the third to the orientation of the multivariate distribution, with E standing for “equal”, V for “variable” and I for “coordinate axes”. DIM1 and DIM2 are the first two principal components used to reduce data dimensionality. For details, please see Scrucca et al. (2016).
Calibration was carried out by combining historical fire and weather data regimes in different simulation scenarios with probabilities corresponding to selected variable frequencies. The resultant calibration matrix (Table C1) was then used to obtain the number of fire ignitions in each simulation scenario. We ran 120 fire spread simulations and a total of 100 000 fire ignitions. Variables used in the calibration were (1) two fuel model maps (1995 and 2010), (2) three weather types, (3) wind direction frequencies in each weather type and (4) three classes of fire spread duration (table shows final durations used in the calibrated model).
Table C1Calibration matrix defining the fire spread simulation runs and corresponding probabilities.
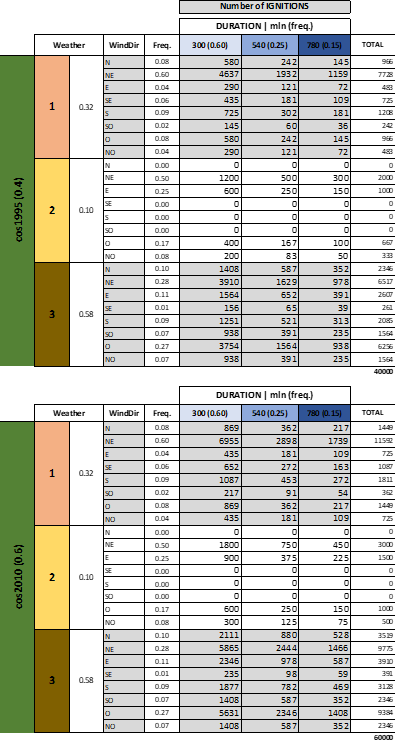
Table D1Classes of fireline intensity (FLI) and flame length (FL) translated to fire suppression difficulty. Adapted from Alexander and Cruz (2019).
The uncertainty in fuel data and meteorology (Benali et al., 2017), duration of fire spread, and the lack of knowledge of the conditions that drove the spread of each individual fire led to the development of a calibration framework based in an array of weights, used to generate fire ignitions and to weight the output simulated wildfire descriptors (Table C1). We covered the historical period of analysis as the combination of frequencies covering two vegetation fuel maps, three fire weather types, wind distribution frequency in each of these weather types and three fire spread durations. The calibrated model was obtained by tuning fire durations until the distribution of the simulated fires described the historical fire patterns reasonably well. We ended the calibrated model with the next fire durations and corresponding frequencies: 300 min (60 %), 540 min (25 %) and 720 min (15 %).
Figure E1a shows that using this combination of durations, we reproduced the historical fire size distribution pattern reasonably well. The simulated and reference burned area perimeters peak at ca. 200 ha but with a clear underestimation of the number of simulated fires in this class. The opposite occurs for burned areas between 500 and 1500 ha, where there is an overestimation of the frequency of simulated fires. One of the reasons for this might be that fire suppression is not considered in the simulations. The estimated BP map (Fig. E2) reproduces the spatial pattern of the frequency of burn in the study area between 2001 and 2019 (Fig. E1b) very well. Additionally, the regions with the highest burn probability are coincident with those that historically had higher ignition probability (Fig. 2a) and that burned more frequently (Fig. 2b).
Moreover, with the calibrated fire modeling system we simulated the spread of the nine largest wildfires (>1000 ha, responsible for approximately 25 % of the total burned area between 2001 and 2019 in the study area) using the corresponding fire weather data and the duration of 13 h. Sørensen's similarity index was 0.60, in the interval limit between moderate and substantial agreement classes (Filippi et al., 2013). This value is in agreement with values obtained in other fire spread simulations (Alcasena et al., 2016; Salis et al., 2016b). Overall, these results show that the calibrated wildfire modeling system accurately reproduces the historical size and spatial distribution of fires in the period of analysis.
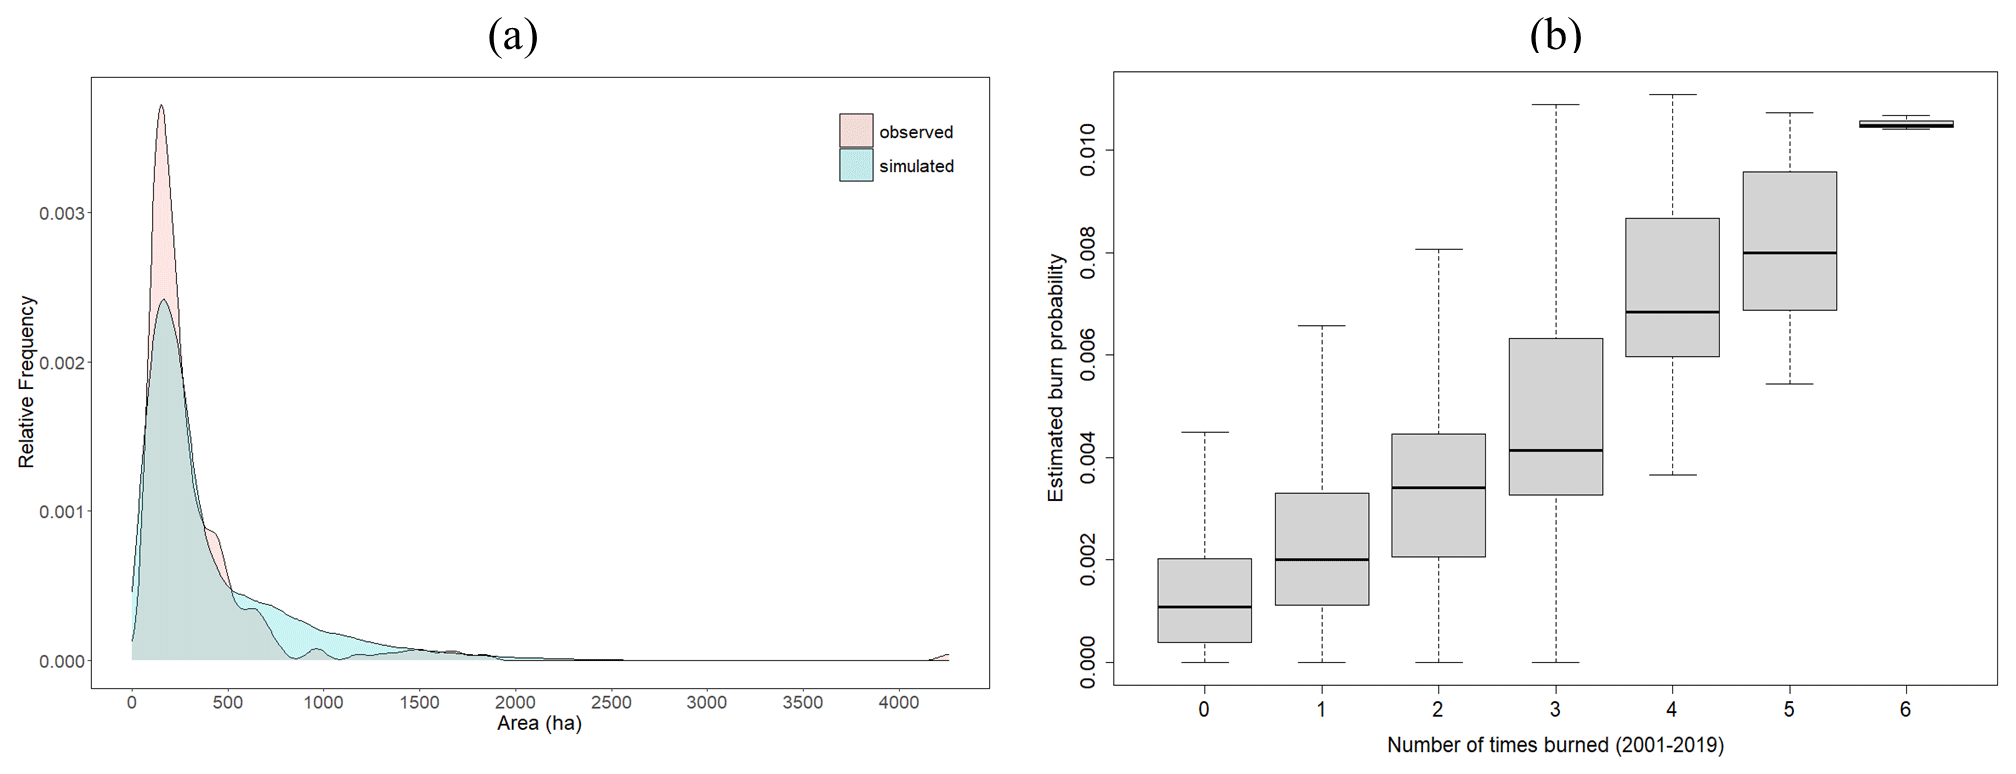
Figure E1Comparison (a) between the simulated and observed burned area and (b) between the estimated burn probability and the historical frequency of burning.
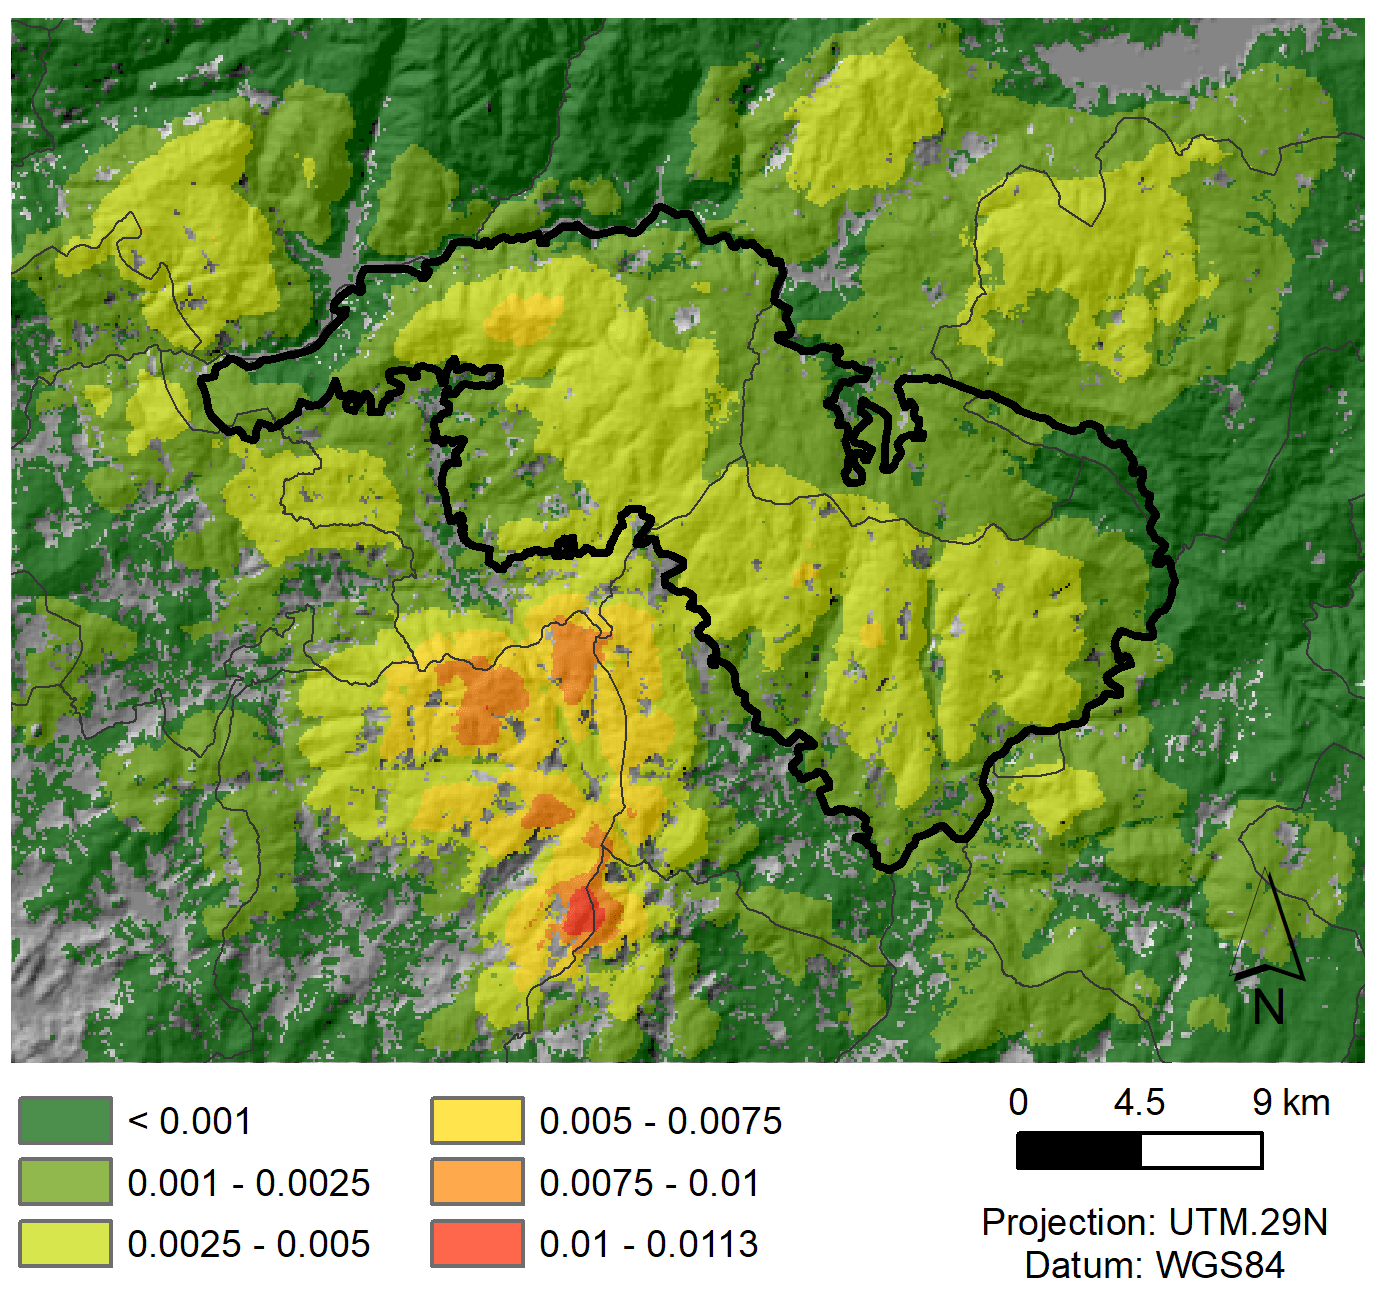
Figure E2Simulated burn probability (BP) derived from running fire spread simulations using 100 000 random ignitions with fire spread durations of 5 h (60 %), 9 h (25 %) and 13 h (15 %). Relative frequencies are shown in parentheses.
The land cover classes that have FLI estimates larger than 4000 kW m−1 are shrubs (57 %), pine forests (22 %) and eucalypt plantations (12 %). The remaining classes cover less than 10 % with those FLI values. Wildfire connectivity for each simulated fire weather condition is shown in Fig. F1. Pine forests have the largest wildfire connectivity from all the weather conditions, showing similar values for P95 and DWi. Eucalypt plantations have the lowest values of DIWC in all weather conditions.
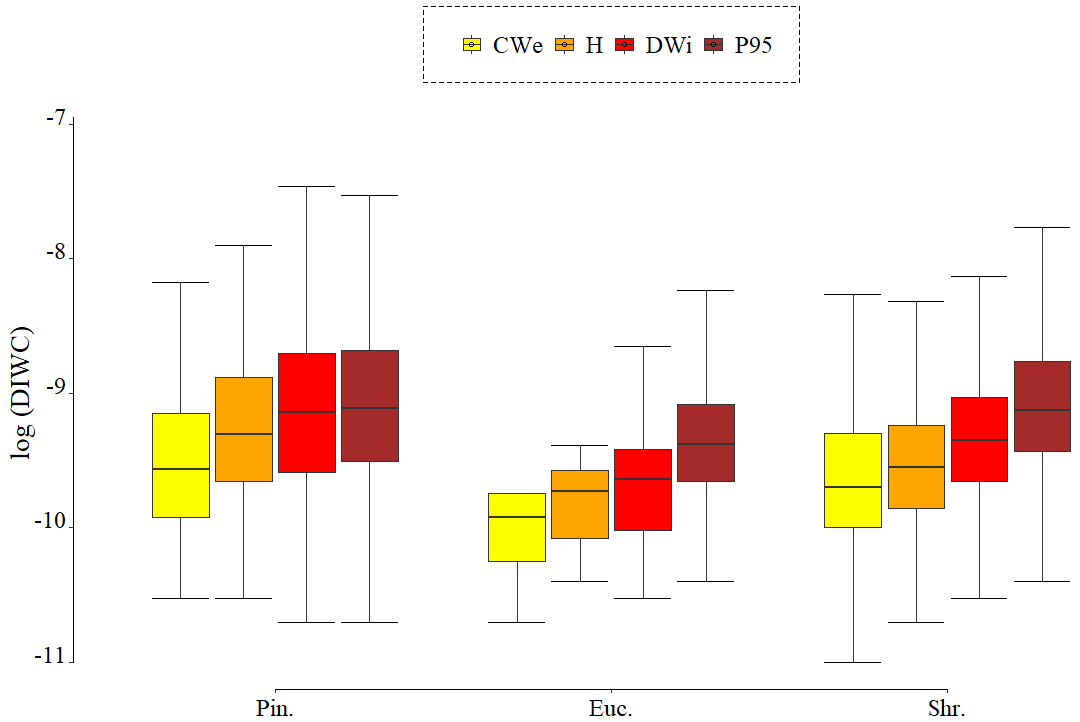
Figure F1Natural logarithm of the normalized wildfire connectivity (DIWC) of patches with FLI above 4000 kW m−1, estimated from fire spread simulations with historical (CWe, H, DWi) and extreme (P95) weather conditions. Pin.: pine forest; Euc.: eucalypt plantations; Shr.: shrublands.
All raw data can be provided by the corresponding author upon request.
ACLS, JP, BA, AB, MS and FS were involved in the conceptualization. AS, MS and JP developed the methodology. AR supervised SP and MMA in the weather data processing. CB explored the fire spread modeling system and prepared input weather data. BA performed the connectivity analysis. ACLS and BA analyzed the data. BA and ACLS developed R code for data analysis and visualization. ACLS developed the calibration framework. ACLS wrote the manuscript draft and edited the co-authors' revisions. All co-authors were involved in the review of the manuscript.
The contact author has declared that none of the authors has any competing interests.
Publisher's note: Copernicus Publications remains neutral with regard to jurisdictional claims in published maps and institutional affiliations.
The authors would like to thank the Portuguese forest pulp companies The Navigator Company and Altri Florestal for the shared information of the land cover in the industrial properties, used to derive the national fuel model map of 2020, under the framework of the FIRE-MODSAT II project. We also thank Fabio Silva and his colleagues Pedro Machado and Carlos Branco from the Portuguese Civil Protection Special Force for their fully availability and interest in collaborating with fieldwork related to fuel model assignment in the Serra da Cabreira.
This research was funded by the Forest Research Centre research unit, funded by Fundação para a Ciência e a Tecnologia I. P. (FCT), Portugal (grant no. UIDB/00239/2020). Bruno Aparício was supported by a PhD fellowship funded by FCT (grant no. UI/BD/150755/2020). Ana C. L. Sá was supported under the framework of contract program no. 1382 (grant no. DL 57/2016/CP1382/CT0003) funded by FCT. Akli Benali was supported by a research contract (no. CEECIND/03799/2018/CP1563/CT0003) funded by FCT. Chiara Bruni was supported by the project foRESTER (no. PCIF/SSI/0102/2017), funded by FCT. José Pereira was supported by the project FireCast – Forecasting fire probability and characteristics for a habitable pyroenvironment (no. PCIF/GRF/0204/2017), funded by FCT. The participation of Susana Pereira and Alfredo Rocha was supported by the project FIRE-MODSAT II (no. PTDC/ASP-SIL/28771/2017), also funded by FCT.
This paper was edited by Vassiliki Kotroni and reviewed by two anonymous referees.
Alcasena, F. J., Salis, M., and Vega-García, C.: A fire modeling approach to assess wildfire exposure of valued resources in central Navarra, Spain, Eur. J. Forest. Res., 135, 87–107, https://doi.org/10.1007/S10342-015-0919-6, 2016.
Alcasena, F., Ager, A., Le Page, Y., Bessa, P., Loureiro, C., and Oliveira, T.: Assessing Wildfire Exposure to Communities and Protected Areas in Portugal, Fire, 4, 82, https://doi.org/10.3390/FIRE4040082, 2021.
Alexander, M. E. and Cruz, M. G.: Fireline Intensity, in: Encycl. Wildfires Wildland-Urban Interface Fires, Springer, 1–8, https://doi.org/10.1007/978-3-319-51727-8_52-1, 2019.
Anderson, H. E.: Aids to determining fuel models for estimating fire behavior, General Technical Report INT-122, USDA Forest Service, Intermountain Forest and Range Experiment Station, 28 pp., https://books.google.pt/books?hl=pt-PT&lr=&id=IeAhH-ovVKcC&oi=fnd&pg=PA1&ots=1h2dntjZ6q&sig=7jRzP15v_VqnVcyVFdGjf6Km44I&redir_esc=y#v=onepage&q&f=false (last access: 7 December 2022), 1982.
Anderson, W. R., Cruz, M. G., Fernandes, P. M., McCaw, L., Vega, J. A., Bradstock, R. A., Fogarty, L., Gould, J., McCarthy, G., and Marsden-Smedley, J. B.: A generic, empirical-based model for predicting rate of fire spread in shrublands, Int. J. Wildl. Fire, 24, 443–460, 2015.
Aparício, B. A., Pereira, J. M. C., Santos, F. C., Bruni, C., and Sá, A. C. L.: Combining wildfire behaviour simulations and network analysis to support wildfire management: A Mediterranean landscape case study, Ecol. Indic., 137, 108726, https://doi.org/10.1016/J.ECOLIND.2022.108726, 2022.
Banfield, J. D. and Raftery, A. E.: Model-Based Gaussian and Non-Gaussian Clustering, Biometrics, 49, 803, https://doi.org/10.2307/2532201, 1993.
Barreiro, S., Benali, A., Rua, J. C. P., Tomé, M., Santos, J. L., and Pereira, J. M. C.: Combining Landscape Fire Simulations with Stand-Level Growth Simulations to Assist Landowners in Building Wildfire-Resilient Landscapes, Forests, 12, 1498, https://doi.org/10.3390/F12111498, 2021.
Benali, A., Ervilha, A. R., Sá, A. C. L., Fernandes, P. M., Pinto, R. M. S., Trigo, R. M., and Pereira, J. M. C.: Deciphering the impact of uncertainty on the accuracy of large wildfire spread simulations, Sci. Total Environ., 569, 73–85, https://doi.org/10.1016/j.scitotenv.2016.06.112, 2016a.
Benali, A., Russo, A., Sá, A. C. L., Pinto, R. M. S., Price, O., Koutsias, N., and Pereira, J. M. C.: Determining Fire Dates and Locating Ignition Points With Satellite Data, Remote Sens., 8, 1–20, https://doi.org/10.3390/rs8040326, 2016b.
Benali, A., Sá, A. C. L., Ervilha, A. R., Trigo, R. M., Fernandes, P. M., and Pereira, J. M. C.: Fire spread predictions: Sweeping uncertainty under the rug, Sci. Total Environ., 592, 187–196, https://doi.org/10.1016/J.SCITOTENV.2017.03.106, 2017.
Benali, A., Sá, A. C. L., Pinho, J., Fernandes, P. M., and Pereira, J. M. C.: Understanding the Impact of Different Landscape-Level Fuel Management Strategies on Wildfire Hazard in Central Portugal, Forests, 12, 522, https://doi.org/10.3390/F12050522, 2021.
Bowman, D., Williamson, G., Abatzoglou, J., Kolden, C., Cochrane, M., and Smith, A.: Human exposure and sensitivity to globally extreme wildfire events, Nat. Ecol. Evol., 1, 1–6, https://doi.org/10.1038/s41559-016-0058, 2017.
Butler, B. W., Anderson, W. R., and Catchpole, E. A.: Influence of slope on fire spread rate, USDA For. Serv. Proc., 75–82, 2007.
Byram, G.: Combustion of forest fuels, For. fire Control use, 61–89 http://ci.nii.ac.jp/naid/10029316165/en/ (last access: 5 January 2022), 1959.
Calheiros, T., Nunes, J. P., and Pereira, M. G.: Recent evolution of spatial and temporal patterns of burnt areas and fire weather risk in the Iberian Peninsula, Agr. Forest Meteorol., 287, 107923, https://doi.org/10.1016/J.AGRFORMET.2020.107923, 2020.
Calkin, D. E., Cohen, J. D., Finney, M. A., and Thompson, M. P.: How risk management can prevent future wildfire disasters in the wildland-urban interface, P. Natl. Acad. Sci. USA, 111, 746–751, https://doi.org/10.1073/pnas.1315088111, 2014.
Castellnou, M., Guiomar, N., Rego, F., and Fernandes, P.: Fire growth patterns in the 2017 mega fire episode of October 15, central Portugal, Adv. Forest. Fire Res., 2018, 447–453, https://doi.org/10.14195/978-989-26-16-506_48, 2018.
Catry, F. X., Rego, F. C., Bação, F. L., and Moreira, F.: Modeling and mapping wildfire ignition risk in Portugal, Int. J. Wildl. Fire, 18, 921–931, https://doi.org/10.1071/WF07123, 2009.
Costa, J., Aguiar, C., Capelo, J., Lousã, M., and Neto, C.: Biogeografia de Portugal continental, https://bibliotecadigital.ipb.pt/handle/10198/714 (last access: 12 August 2021), 1998.
Curt, T. and Frejaville, T.: Wildfire Policy in Mediterranean France: How Far is it Efficient and Sustainable?, Risk Anal., 38, 472–488, https://doi.org/10.1111/RISA.12855, 2018.
DGT – Direção-Geral do Território Dados abertos | DGT, Port. L. Use L. Cover 2018, https://www.dgterritorio.gov.pt/dados-abertos, last access: 23 August 2021.
Duane, A., Miranda, M. D., and Brotons, L.: Forest connectivity percolation thresholds for fire spread under different weather conditions, Forest Ecol. Manage., 498, 119558, https://doi.org/10.1016/J.FORECO.2021.119558, 2021.
Duguy, B., Alloza, J. A., Röder, A., Vallejo, R., and Pastor, F.: Modelling the effects of landscape fuel treatments on fire growth and behaviour in a Mediterranean landscape (eastern Spain), Int. J. Wildl. Fire, 16, 619–632, https://doi.org/10.1071/WF06101, 2007.
European Commission: Land-based wildfire prevention: principles and experiences on managing landscapes, forests and woodlands for safety and resilience in Europe, edited by: Nuijten, D., Onida, M., and Lelouvier, R., Publications Office, https://op.europa.eu/en/publication-detail/-/publication/4e6cc1f1-8b8a-11eb-b85c-01aa75ed71a1 (last access: 7 December 2022), 2021.
EEA – European Environment Agency: Copernicus Land Monitoring Service User Manual Consortium Partners, https://land.copernicus.eu/pan-european/high-resolution-layers/forests (last access: 26 February 2022), 2018.
Farr, T. G., Rosen, P. A., Caro, E., Crippen, R., Duren, R., Hensley, S., Kobrick, M., Paller, M., Rodriguez, E., Roth, L., Seal, D., Shaffer, S., Shimada, J., Umland, J., Werner, M., Oskin, M., Burbank, D., and Alsdorf, D. E.: The Shuttle Radar Topography Mission, Rev. Geophys., 45, RG2004, https://doi.org/10.1029/2005RG000183, 2007.
Fernandes, P., Gonçalves, H., Loureiro, C., Fernandes, M., Costa, T., Cruz, M., and Botelho, H.: Modelos de combustível florestal para Portugal, in: Actas Do 6o Congresso Florestal Nacional, SPCF – Sociedade Portuguesa de Ciências Florestais, Lisboa, Portugal, https://www.researchgate.net/publication/261708410_Modelos_de_Combustivel_Florestal_para_Portugal (last access: 7 December 2022), 2009.
Fernandes, P. M., Loureiro, C., Guiomar, N., Pezzatti, G. B., Manso, F. T., and Lopes, L.: The dynamics and drivers of fuel and fire in the Portuguese public forest, J. Environ. Manage., 146, 373–382, 2014.
Fernandes, P. M., Monteiro-Henriques, T., Guiomar, N., Loureiro, C., and Barros, A. M. G.: Bottom-Up Variables Govern Large-Fire Size in Portugal, Ecosystems, 19, 1362–1375, https://doi.org/10.1007/S10021-016-0010-2/TABLES/3, 2016.
Fernandes, P. M., Guiomar, N., and Rossa, C. G.: Analysing eucalypt expansion in Portugal as a fire-regime modifier, Sci. Total Environ., 666, 79–88, https://doi.org/10.1016/J.SCITOTENV.2019.02.237, 2019.
Filippi, J.-B., Mallet, V., Nader, B., Filippi, J.-B., Mallet, V., and Nader, B.: Representation and evaluation of wildfire propagation simulations, Int. J. Wildl. Fire, 23, 46–57, https://doi.org/10.1071/WF12202, 2013.
Finney, M. A.: Fire growth using minimum travel time methods, Can. J. Forest Res., 32, 1420–1424, https://doi.org/10.1139/x02-068, 2002.
Finney, M. A.: An overview of FlamMap fire modeling capabilities, in Fuels management – how to measure success: conference proceedings, March 28–30, in: Proceedings RMRS-P-41, Department of Agriculture, Forest Service, Fort Collins, CO, US, Rocky Mountain Research Station, Portland, Oregon, p. 13, https://www.fs.usda.gov/treesearch/pubs/25948 (last access: 23 August 2021), 2006.
Fletcher, R. J., Burrell, N. S., Reichert, B. E., Vasudev, D., and Austin, J. D.: Divergent Perspectives on Landscape Connectivity Reveal Consistent Effects from Genes to Communities, Curr. Landsc. Ecol. Rep., 1, 67–79, https://doi.org/10.1007/S40823-016-0009-6, 2016.
ICNF: Instituto da Conservação da Natureza e das Florestas; Projeto áGIL – Dados LiDAR, https://geocatalogo.icnf.pt/geovisualizador/agil.html (last access: 25 March 2022), 2021a.
ICNF: Instituto da Conservação da Natureza e das Florestas, http://www.icnf.pt/portal/florestas/dfci/inc/estat-sgif (last access: 20 December 2021), 2021b.
Ingalsbee, T.: Whither the paradigm shift? Large wildland fires and the wildfire paradox offer opportunities for a new paradigm of ecological fire management, Int. J. Wildl. Fire, 26, 557–561, https://doi.org/10.1071/WF17062, 2017.
Keeley, A. T. H., Ackerly, D. D., Cameron, D. R., Heller, N. E., Huber, P. R., Schloss, C. A., Thorne, J. H., and Merenlender, A. M.: New concepts, models, and assessments of climate-wise connectivity, Environ. Res. Lett., 13, 073002, https://doi.org/10.1088/1748-9326/AACB85, 2018.
Liberatore, F., León, J., Hearne, J., and Vitoriano, B.: Fuel management operations planning in fire management: A bilevel optimisation approach, Safe. Sci., 137, 105181, https://doi.org/10.1016/J.SSCI.2021.105181, 2021.
Lozano, O. M., Salis, M., Ager, A. A., Arca, B., Alcasena, F. J., Monteiro, A. T., Finney, M. A., Del Giudice, L., Scoccimarro, E., and Spano, D.: Assessing Climate Change Impacts on Wildfire Exposure in Mediterranean Areas, Risk Anal., 37, 1898–1916, https://doi.org/10.1111/RISA.12739, 2017.
Marta-Almeida, M., Teixeira, J. C., Carvalho, M. J., Melo-Gonçalves, P., and Rocha, A. M.: High resolution WRF climatic simulations for the Iberian Peninsula: Model validation, Phys. Chem. Earth Pt. A/B/C, 94, 94–105, https://doi.org/10.1016/J.PCE.2016.03.010, 2016.
Martín, A., Botequim, B., Oliveira, T. M., Ager, A., and Pirotti, F.: Resource Communication. Temporal optimization of fuel treatment design in blue gum (Eucalyptus globulus) plantations, Forest Syst., 25, eRC09–eRC09, https://doi.org/10.5424/FS/2016252-09293, 2016.
Martín-Martín, C., Bunce, R. G. H., Saura, S., and Elena-Rosselló, R.: Changes and interactions between forest landscape connectivity and burnt area in Spain, Ecol. Indic., 33, 129–138, https://doi.org/10.1016/J.ECOLIND.2013.01.018, 2013.
Moreira, F., Viedma, O., Arianoutsou, M., Curt, T., Koutsias, N., Rigolot, E., Barbati, A., Corona, P., Vaz, P., and Xanthopoulos, G.: Landscape–wildfire interactions in southern Europe: implications for landscape management, J. Environ. Manage., 92, 2389–2402, 2011.
Moreira, F., Ascoli, D., Safford, H., Adams, M. A., Moreno, J. M., Pereira, J. M. C., Catry, F. X., Armesto, J., Bond, W., González, M. E., Curt, T., Koutsias, N., McCaw, L., Price, O., Pausas, J. G., Rigolot, E., Stephens, S., Tavsanoglu, C., Vallejo, V. R., Van Wilgen, B. W., Xanthopoulos, G., and Fernandes, P. M.: Wildfire management in Mediterranean-type regions: Paradigm change needed, Environ. Res. Lett., 15, 011001, https://doi.org/10.1088/1748-9326/AB541E, 2020.
Moudio, P. E., Pais, C., and Shen, Z.-J. M.: Quantifying the impact of ecosystem services for landscape management under wildfire hazard, Nat. Hazards, 106, 531–560, https://doi.org/10.1007/s11069-020-04474-y, 2021.
Nelson Jr., R. M.: Prediction of diurnal change in 10-h fuel stick moisture content, Can. J. Forest. Res., 30, 1071–1087, 2000.
Oliveira, S., Gonçalves, A., Benali, A., Sá, A., Zêzere, J. L., and Pereira, J. M.: Assessing Risk and Prioritizing Safety Interventions in Human Settlements Affected by Large Wildfires, Forests, 11, 859, https://doi.org/10.3390/F11080859, 2020.
Oliveira, S. L. J., Pereira, J. M. C., and Carreiras, J. M. B.: Fire frequency analysis in Portugal (1975–2005), using Landsat-based burnt area maps, Int. J. Wildl. Fire, 21, 48–60, https://doi.org/10.1071/WF10131, 2012.
Oliveira, T. M., Barros, A. M. G., Ager, A. A., and Fernandes, P. M.: Assessing the effect of a fuel break network to reduce burnt area and wildfire risk transmission, Int. J. Wildl. Fire, 25, 619–632, https://doi.org/10.1071/WF15146, 2016.
Palaiologou, P., Ager, A. A., Nielsen-Pincus, M., Evers, C. R., and Kalabokidis, K.: Using transboundary wildfire exposure assessments to improve fire management programs: A case study in Greece, Int. J. Wildl. Fire, 27, 501–513, https://doi.org/10.1071/WF17119, 2018.
Palaiologou, P., Kalabokidis, K., Ager, A. A., and Day, M. A.: Development of Comprehensive Fuel Management Strategies for Reducing Wildfire Risk in Greece, Forests, 11, 789, https://doi.org/10.3390/F11080789, 2020.
Parisien, M.-A., Dawe, D. A., Miller, C., Stockdale, C. A., and Armitage, O. B.: Applications of simulation-based burn probability modelling: a review, Int. J. Wildl. Fire, 28, 913–926, https://doi.org/10.1071/WF19069, 2019.
Pereira, M. G., Malamud, B. D., Trigo, R. M., and Alves, P. I.: The history and characteristics of the 1980–2005 Portuguese rural fire database, Nat. Hazards Earth Syst. Sci., 11, 3343–3358, https://doi.org/10.5194/nhess-11-3343-2011, 2011.
Plucinski, M. P.: Fighting Flames and Forging Firelines: Wildfire Suppression Effectiveness at the Fire Edge, Curr. Forest. Rep., 5, 1–19, https://doi.org/10.1007/s40725-019-00084-5, 2019.
Rachmawati, R., Ozlen, M., Reinke, K. J., and Hearne, J. W.: An optimisation approach for fuel treatment planning to break the connectivity of high-risk regions, Forest Ecol. Manage., 368, 94–104, https://doi.org/10.1016/J.FORECO.2016.03.014, 2016.
RCM: Resolução do Conselho de Ministros 71-A/2021, 2021-06-08 – DRE, Aprova o Programa Nacional de Ação do Plano Nacional de Gestão Integrada de Fogos Rurais, https://dre.pt/home/-/dre/164798802/details/maximized, last access: 30 September 2021.
Ribeiro, L. M., Rodrigues, A., Lucas, D., and Viegas, D. X.: The Impact on Structures of the Pedrógão Grande Fire Complex in June 2017 (Portugal), Fire, 3, 57, https://doi.org/10.3390/FIRE3040057, 2020.
Rodrigues, M., Alcasena, F., and Vega-García, C.: Modeling initial attack success of wildfire suppression in Catalonia, Spain, Sci. Total Environ., 666, 915–927, https://doi.org/10.1016/J.SCITOTENV.2019.02.323, 2019.
Rothermel, R. C.: A mathematical model for predicting fire spread in wildland fuels, Res. Pap. INT-115, US Department of Agriculture, Forest Service, Intermountain Forest and Range Experiment Station, Ogden, UT, p. 40, https://books.google.pt/books?hl=pt-PT&lr=&id=27n_RugVVK0C&oi=fnd&pg=PA1&ots=9V3MCEpv34&sig=0pz2rz81krPm3gPxhvKPCFa_GaY&redir_esc=y#v=onepage&q&f=false (last access: 6 December 2022), 1972.
Salis, M., Ager, A. A., Arca, B., Finney, M. A., Bacciu, V., Duce, P., and Spano, D.: Assessing exposure of human and ecological values to wildfire in Sardinia, Italy, Int. J. Wildl. Fire, 22, 549–565, https://doi.org/10.1071/WF11060, 2013.
Salis, M., Laconi, M., Ager, A. A., Alcasena, F. J., Arca, B., Lozano, O., Fernandes de Oliveira, A., and Spano, D.: Evaluating alternative fuel treatment strategies to reduce wildfire losses in a Mediterranean area, Forest Ecol. Manage., 368, 207–221, https://doi.org/10.1016/j.foreco.2016.03.009, 2016a.
Salis, M., Arca, B., Alcasena, F., Arianoutsou, M., Bacciu, V., Duce, P., Duguy, B., Koutsias, N., Mallinis, G., Mitsopoulos, I., Moreno, J. M., Pérez, J. R., Urbieta, I. R., Xystrakis, F., Zavala, G., and Spano, D.: Predicting wildfire spread and behaviour in Mediterranean landscapes, Int. J. Wildl. Fire, 25, 1015–1032, https://doi.org/10.1071/WF15081, 2016b.
Salis, M., Del Giudice, L., Arca, B., Ager, A. A., Alcasena-Urdiroz, F., Lozano, O., Bacciu, V., Spano, D., and Duce, P.: Modeling the effects of different fuel treatment mosaics on wildfire spread and behavior in a Mediterranean agro-pastoral area, J. Environ. Manage., 212, 490–505, https://doi.org/10.1016/j.jenvman.2018.02.020, 2018.
Salis, M., Arca, B., Del Giudice, L., Palaiologou, P., Alcasena-Urdiroz, F., Ager, A., Fiori, M., Pellizzaro, G., Scarpa, C., Schirru, M., Ventura, A., Casula, M., and Duce, P.: Application of simulation modeling for wildfire exposure and transmission assessment in Sardinia, Italy, Int. J. Disast. Risk Reduct., 58, 102189, https://doi.org/10.1016/J.IJDRR.2021.102189, 2021.
Scrucca, L., Fop, M., Murphy, T. B., and Raftery, A. E.: mclust 5: Clustering, Classification and Density Estimation Using Gaussian Finite Mixture Models, R J., 8, 289–317, https://doi.org/10.32614/RJ-2016-02, 2016.
Skamarock, W. C., Klemp, J. B., Dudhia, J., Gill, D. O., Liu, Z., Berner, J., Wang, W., Powers, J. G., Duda, M. G., and Barker, D. M. A.: Description of the Advanced Research WRF Model Version 4, National Center for Atmospheric Research, Boulder, CO, USA, p. 145, https://doi.org/10.5065/D68S4MVH, 2019.
Sørensen, T.: A method of establishing groups of equal amplitude in plant sociology based on similarity of species and its application to analyses of the vegetation on Danish commons, Biol. Skr., 5, 1–34, 1948.
Stahl, D. and Sallis, H.: Model-based cluster analysis, Wiley Interdisciplin. Rev. Comput. Stat., 4, 341–358, https://doi.org/10.1002/WICS.1204, 2012.
Tedim, F., Leone, V., Amraoui, M., Bouillon, C., Coughlan, M. R., Delogu, G. M., Fernandes, P. M., Ferreira, C., McCaffrey, S., McGee, T. K., Parente, J., Paton, D., Pereira, M. G., Ribeiro, L. M., Viegas, D. X., and Xanthopoulos, G.: Defining Extreme Wildfire Events: Difficulties, Challenges, and Impacts, Fire, 1, 9, https://doi.org/10.3390/FIRE1010009, 2018.
Tyukavina, A., Potapov, P., Hansen, M. C., Pickens, A. H., Stehman, S. V., Turubanova, S., Parker, D., Zalles, V., Lima, A., Kommareddy, I., Song, X.-P., Wang, L., and Harris, N.: Global Trends of Forest Loss Due to Fire From 2001 to 2019, Front. Remote Sens., 3, 9, https://doi.org/10.3389/FRSEN.2022.825190, 2022.
Wunder, S., Calkin, D. E., Charlton, V., Feder, S., Martínez de Arano, I., Moore, P., Rodríguez y Silva, F., Tacconi, L., and Vega-García, C.: Resilient landscapes to prevent catastrophic forest fires: Socioeconomic insights towards a new paradigm, Forest Policy Econ., 128, 102458, https://doi.org/10.1016/J.FORPOL.2021.102458, 2021.
Zeller, K. A., Lewison, R., Fletcher, R. J., Tulbure, M. G., and Jennings, M. K.: Understanding the Importance of Dynamic Landscape Connectivity, Land, 9, 303, https://doi.org/10.3390/LAND9090303, 2020.
- Abstract
- Introduction
- Data and methods
- Results
- Discussion
- Conclusions
- Appendix A: Summary of fire weather data
- Appendix B: Model-based cluster analysis
- Appendix C: Calibration of the fire spread modeling system
- Appendix D: Correspondence between fire intensity and fire suppression difficulty
- Appendix E: Calibration of the fire spread modeling system
- Appendix F: Influence of weather conditions on wildfire connectivity by major land cover types
- Data availability
- Author contributions
- Competing interests
- Disclaimer
- Acknowledgements
- Financial support
- Review statement
- References