the Creative Commons Attribution 4.0 License.
the Creative Commons Attribution 4.0 License.
 | 21 Nov 2022
Multi-hazard analysis of flood and tsunamis on the western Mediterranean coast of Turkey
Kutay Yilmaz
Gorkem Onder
Flooding has always been a devastating hazard for social and economic assets and activities. Especially, lowland areas such as coastal regions can be more vulnerable to inundations. The combination of different natural hazards observed at the same time is definitely worsening the situation in the affected regions. The goal of this study is to conduct a distinctive multi-hazard analysis considering flood hazards with the contribution of potential earthquake-triggered tsunamis that might be observed throughout the Fethiye coastline and city center. For this purpose, tsunami hazard curves are generated based on Monte Carlo simulations. Comprehensive stochastic hazard analyses are performed considering the aleatory variability of earthquake-triggered tsunamis and epistemic uncertainty of floods having 10-, 50-, and 100-year return periods. Numerical simulations are conducted to combine the potential tsunamis and flood events that are able to adversely affect the selected region. The results of this study show that the blockage of stream outlets due to tsunami waves drastically increases the inundated areas and worsens the condition for the selected region.
- Article
(16049 KB) - Full-text XML
- BibTeX
- EndNote


Flood hazards have been one of the most destructive and frequent global-wide natural hazards resulting in loss of lives, livestock, and economic assets (Slater and Villarini, 2016; Alfieri et al., 2017; Kreibich et al., 2017; Qiang, 2019; Zhai et al., 2020). Even though lowland and plain areas where 80 % of the world population live can create an easy way for urbanization, they also vulnerable to flood risk, and the hazardous effects of floods will increase in the future due to the changing hydrological cycle in recent years (Lamond et al., 2011). As the number of flood hazards increases, the amount of flood losses are going to follow a parallel trend, accordingly. Hemmati et al. (2020) stated that both the number of floods and destructive economic results have been drastically increased since the 1990s. Munich RE (2020) has compiled a natural catastrophe loss database on natural disasters since 1980s for analyzing and assessing losses resulting from natural disasters. The database reveals that number of floods and their destructive economic results have an upward trend at a global scale.
Independently of flood hazard, the tsunami, which can be a long- or short-term event, is rare but can cause catastrophic damage to economic and social assets and activities (Wolfgang, 2005; Kundzewicz et al., 2017; Subyani et al., 2017; Fukao, 1979). Devastating economic losses and loss of lives have been recorded for the countries that experienced tsunami events, especially for the last 2 decades (Nadim and Glade, 2006; Carreño et al., 2007; Cardona et al., 2010; Sørensen et al., 2012; Lane et al., 2013; Horspool et al., 2014; Goda and Abilova, 2016). Scientists have revealed significant and reliable hazard evaluation methods for tsunami hazard assessment according to adverse consequences of the experienced tsunamis (Jelínek et al., 2012).
Multi-hazard assessment of floods with different natural hazards can be found in the literature. For instance, climate-change-related flood hazard assessment has been widely investigated (Blöschl et al., 2017; Skougaard Kaspersen et al., 2017; Szewrański et al., 2018; Carter et al., 2018; Barkey et al., 2019; Yavuz et. al., 2020b). However, the investigations covering simultaneous assessment of flood and tsunami events have been limited. Even if the coincidence of flood and tsunami hazards may be experienced once in a blue moon, it should also be investigated due to the uncertainty in the time of occurrence of these natural hazards. The objective of this study is to reveal a statistical methodology to evaluate the aggregate potential hazard levels due to flood hazards with the presence of earthquake-triggered tsunamis.
As commonly used issues in stochastic hazard analysis of any kind of hazard in the literature (Bommer, 2003; Helton et al., 2010), aleatory and epistemic uncertainties are considered to generate multi-hazard analysis in this study. The exceedance of flood hazard is strongly likely depending on geological and meteorological circumstances; the hazard is included in the stochastic analyses conducted in this study as epistemic uncertainty. Since the occurrence of the tsunami is generally rare compared with flood hazards, tsunami events are inspected by considering aleatory variability in this study. Additionally, hypothetical earthquake magnitudes Mw are generated using Monte Carlo simulations to obtain a required number of random earthquake sources in the bathymetry.
The proposed methodology is applied to Fethiye city center, which is one of the most popular touristic destinations on the Western Mediterranean coast of Turkey. The selection of this site is based on the documented seven tsunami events throughout history and evidence of tsunami deposits found by researchers (Cita and Rimoldi, 1997; Papadopoulos, 2009; Altinok et al., 2011) around Fethiye Bay. The Fethiye coastline was hit several times with destructive tsunami waves reaching up to 1.8 m, and significant inundation distances were recorded (Papadopoulos, 2009). The location of the study area for the case study is shown in Fig. 1.
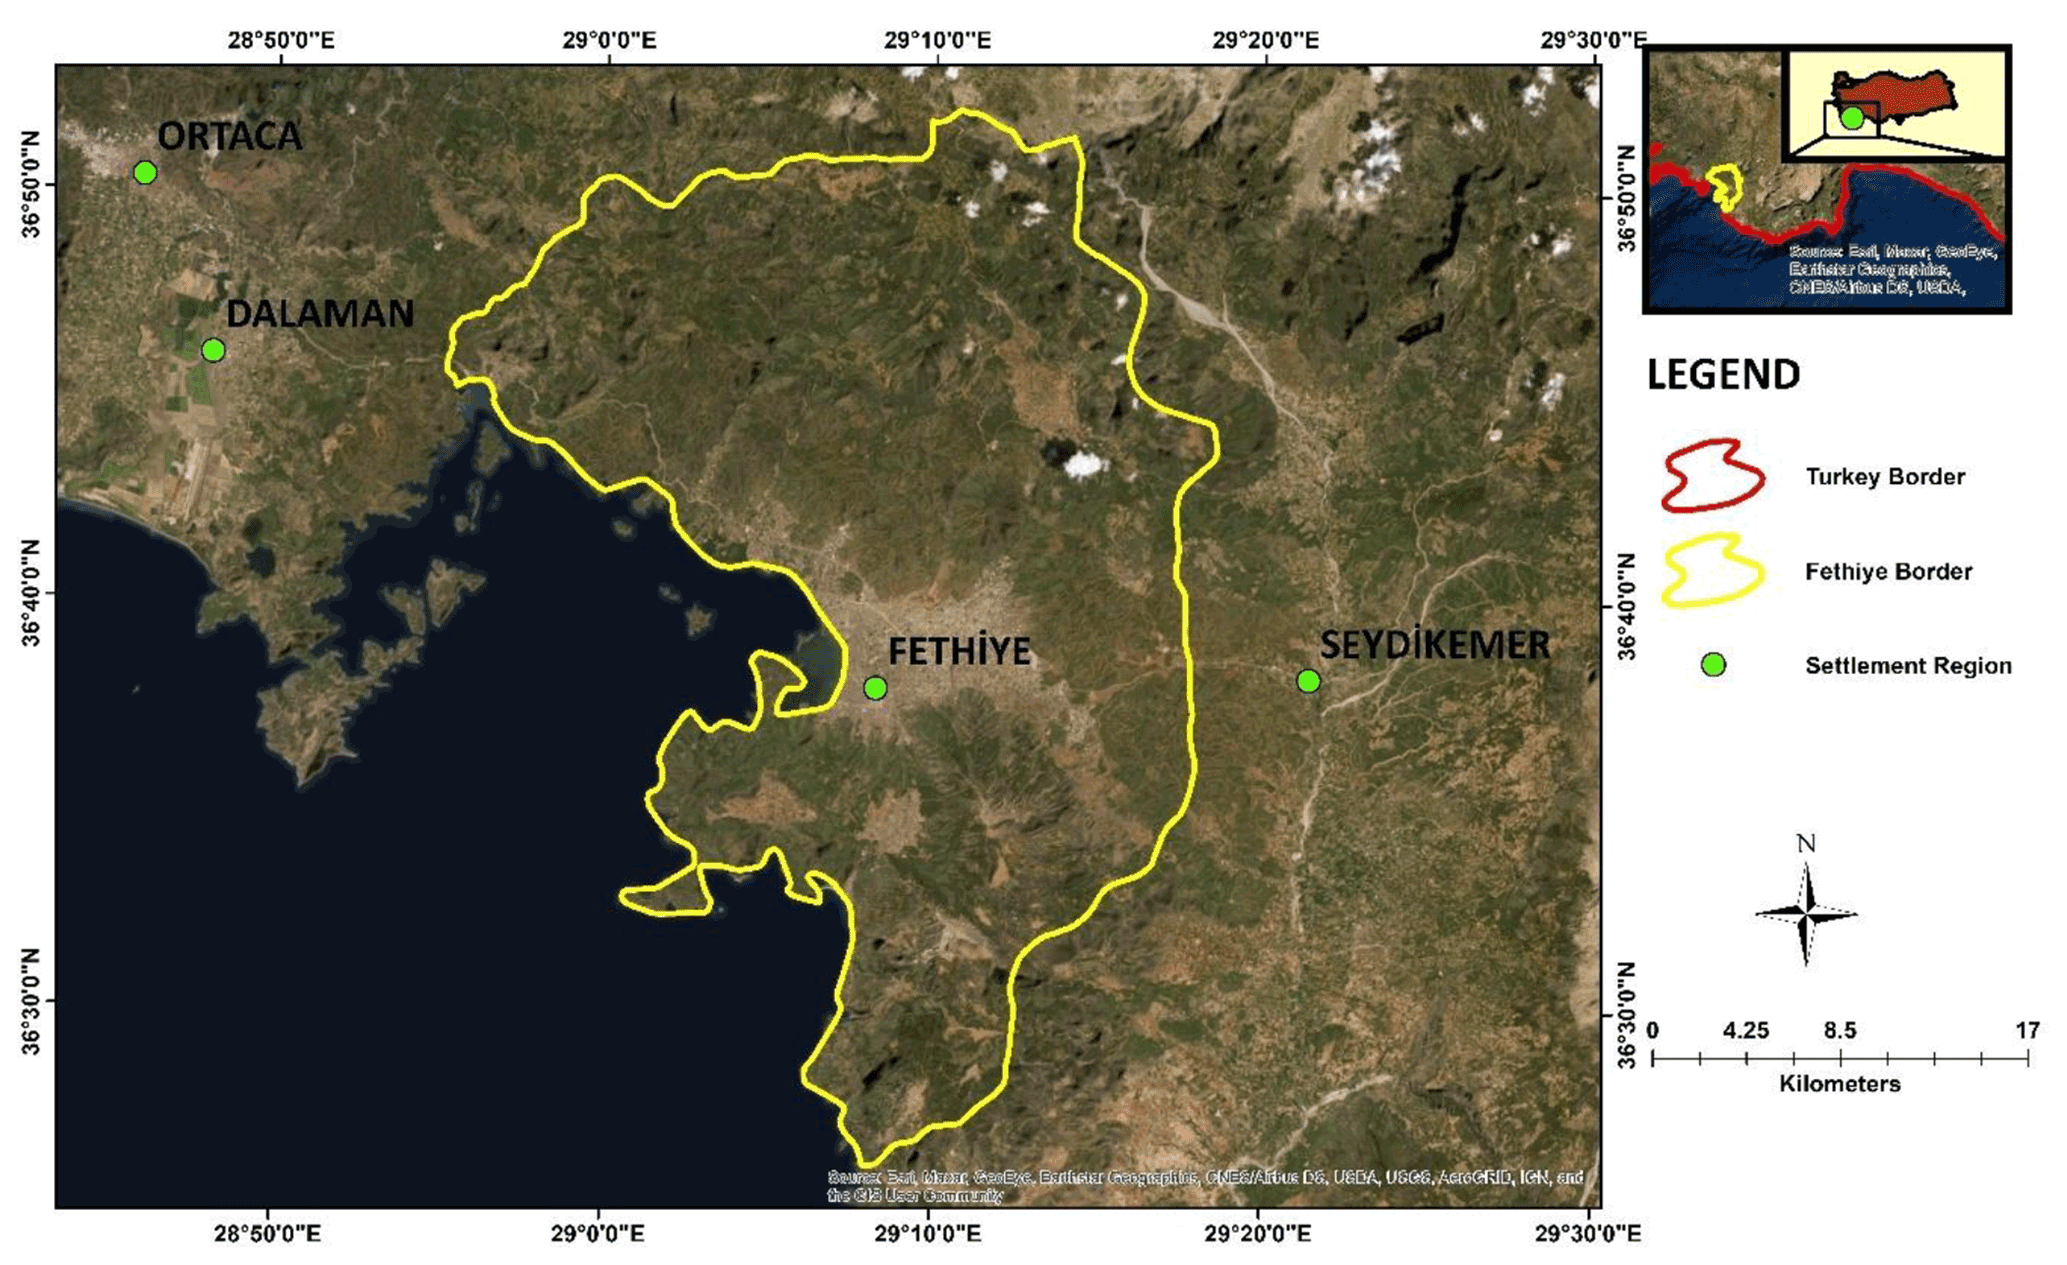
Figure 1Study area and its location on satellite image (sources: Esri, Maxar, GeoEye, Earthstar Geographics, CNES/Airbus DS, USDA, USGS, AeroGRID, IGN, and the GIS User Community).
The probabilistic multi-hazard assessment approach is applied in this study. In doing so, the aim is to evaluate the two dynamic natural hazards one by one and simultaneously. In total, 523 historical earthquakes recorded between 1900–2013 are retrieved from the European Union-funded “Tsunami risk and strategies for the European region” (TRANSFER Project, 2022) project catalogue. The Gutenberg–Richter relationship is used to determine the best-fitted distribution for the historical earthquake magnitudes. The Gutenberg–Richter relationship is a mathematical expression of the relationship between a number of earthquakes and the Richter magnitudes (Mw) of these earthquakes that occurred in a specific region (Gutenberg and Richter, 1954). They proposed a widely accepted and commonly used empirical equation that explains the relationship between the occurrence probability of an earthquake depending on two seismic constants (i.e., a and b values) which define the frequency-magnitude distribution and the Richter magnitudes experienced in a particular region. The equation is defined as follows:
where N is the number of earthquakes experienced in the selected region, and a and b are the constants that are defined specifically for the selected region.
Tsunami hazard curves are generated based on the hypothetical earthquake magnitudes (Mw) produced from 100 000 Monte Carlo simulations. The NAMI DANCE software is used to simulate hypothetical earthquakes having Mw≥6.5 (USGS, 2022) and the resulting tsunami wave heights are computed at the coast of Fethiye city center.
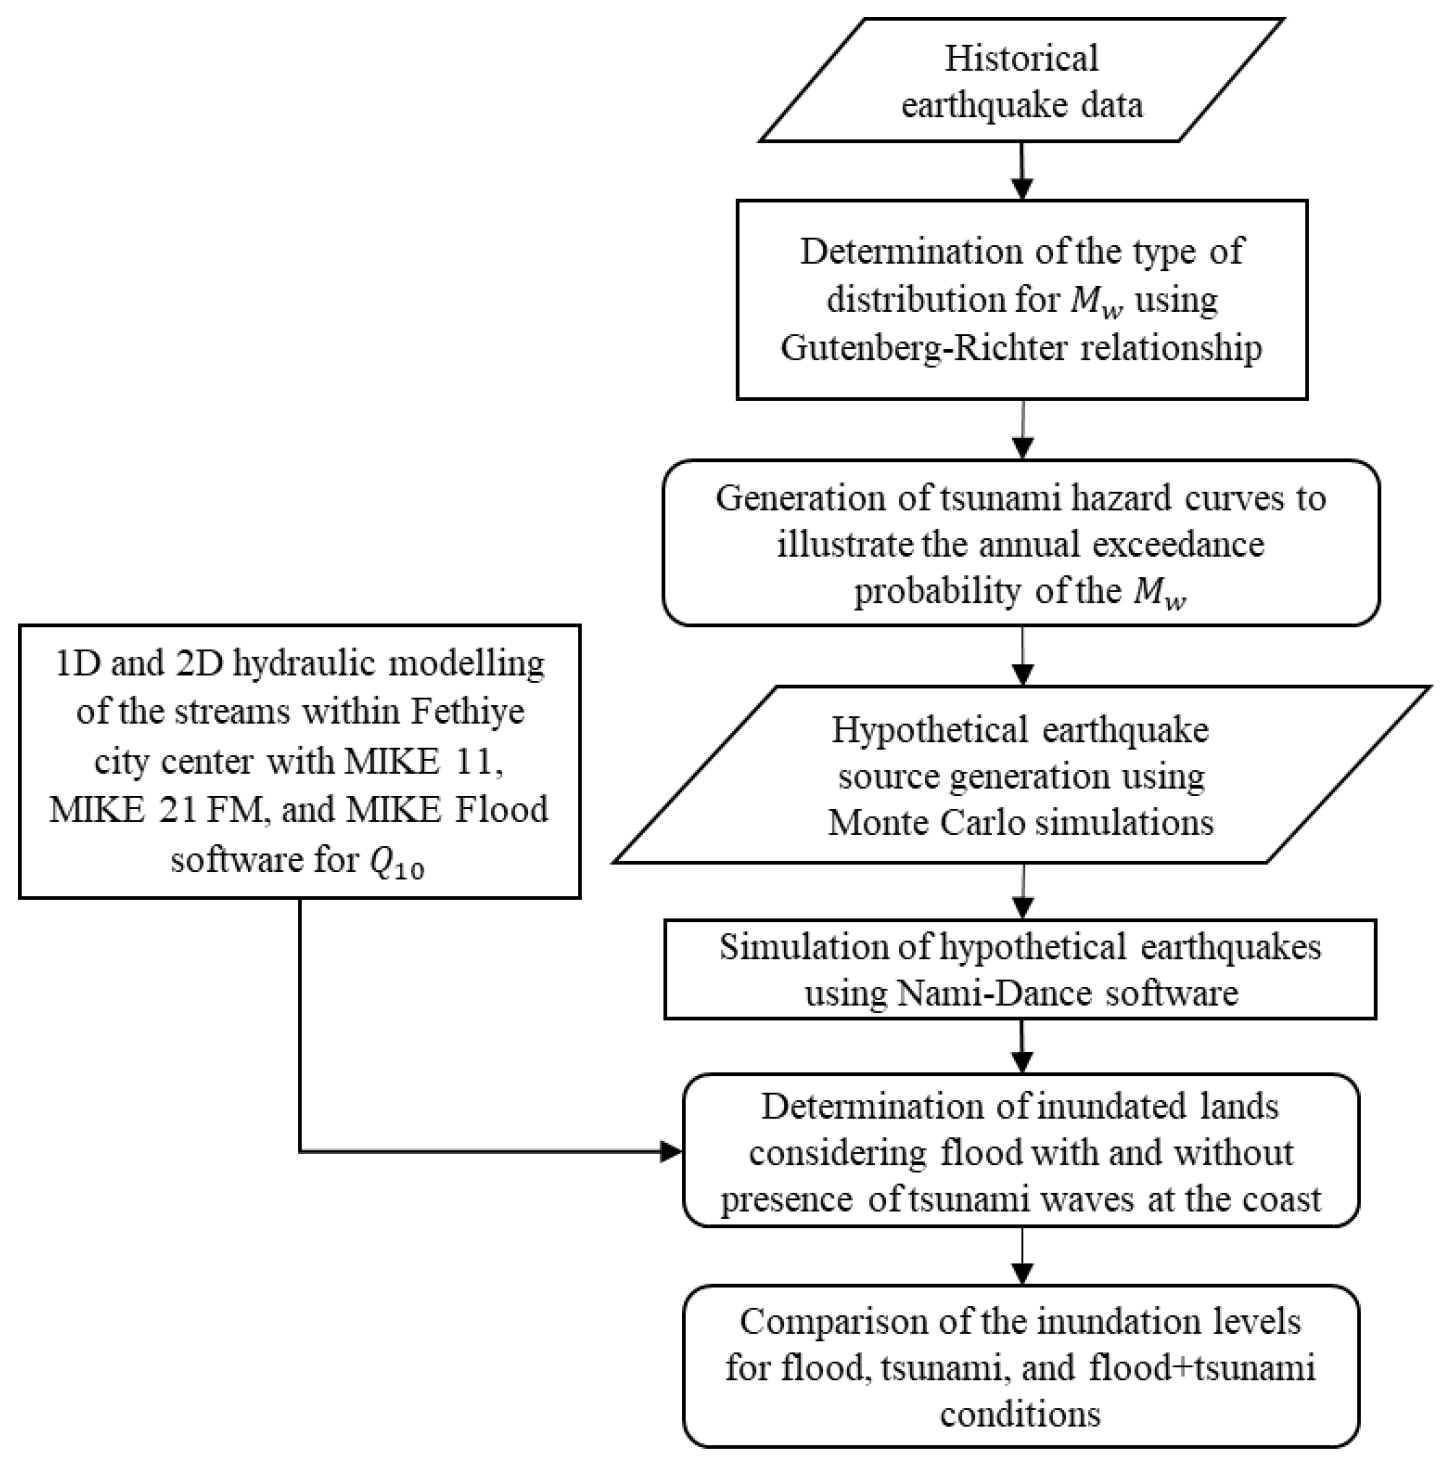
Flood hazards having recurrence periods of 10, 50, and 100 years (Q10, Q50, and Q100) on the other hand is modeled by MIKE 11, MIKE 21 FM, and MIKE Flood considered with and without tsunami wave existence at the coasts (DHI, 2016a, b). As a more frequent flood period, Q10 is evaluated in detail and hazard maps are generated for the flood events having return periods of 50 years (Q50) and 100 years (Q100). Additionally, tsunami-drifted flood hazard levels are also provided for all three flood events to satisfy the multi-hazard assessment procedure presented in this study. Thus, hazard levels considering both flood, earthquake-triggered tsunami, and tsunami-drifted flood hazards can be compared for the selected region. The inundation levels presented in this study have resulted from the numerical analysis of both hazards. Potential hazard that can result from seismicity are not within the scope of this study. The flowchart of the methodology used in this study is illustrated in Fig. 2.
2.1 Generation of hypothetical earthquakes
Random Mw values are generated using Monte Carlo simulation; also known as stochastic modeling, it is accepted as one of the most flexible and easiest methods to implement probabilistic hazard analysis (Ferson, 1996). Probability density function is defined for Mw, which is defined as the independent parameter of the earthquake. Normal distribution is assigned to Mw depending on the probability density function. A Kolmogorov–Smirnov test is applied to the assigned distribution to test the goodness of fit via p value. The feasibility of Mw data production is satisfied by conducting 100 000 Monte Carlo simulations. Sufficiency of the generated data and the consistency of normal distribution are inspected using a Gutenberg–Richter relationship. For Fethiye Bay, the a and b values used in the Gutenberg–Richter relationship are obtained from Pamukçu et al. (2021) as 4.6624 and 0.8644, respectively. The Q−Q plot obtained from the Gutenberg–Richter relationship for the study area is illustrated in Fig. 3. For the moment magnitudes greater than 6.0 illustrated in Fig. 3, the normal distribution has a good coincidence with the Gutenberg–Richter relation.

Three different tsunami hazards curve samples that are derived from 100 000 Monte Carlo simulations are used to determine the reliability of Monte Carlo simulations by considering the aleatory variability of each hypothetical earthquake magnitude by checking the consistency of the curves. The curve samples are shown as Sample_1, Sample_2, and Sample_3 in Fig. 4.
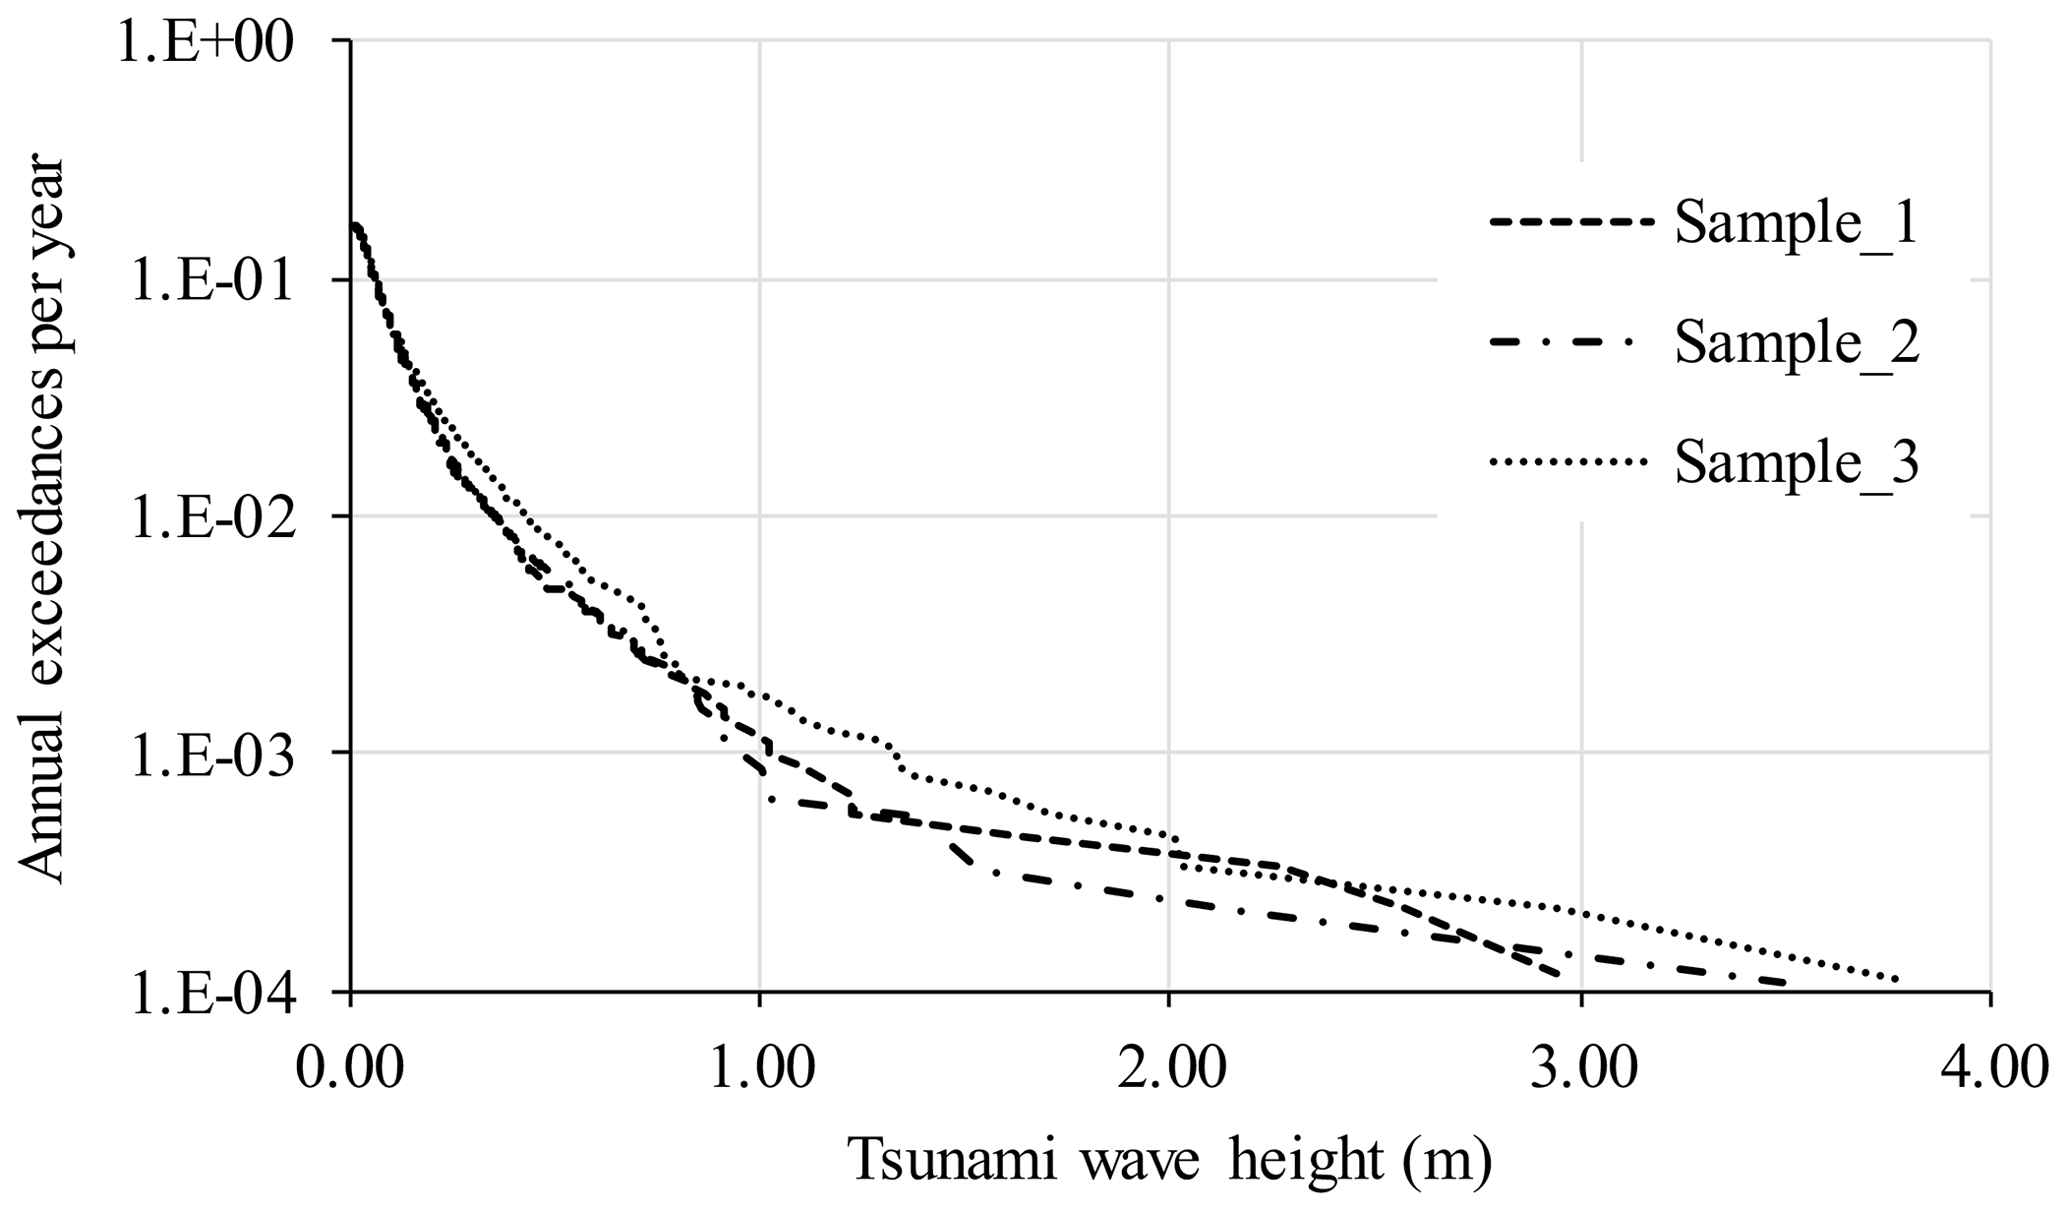
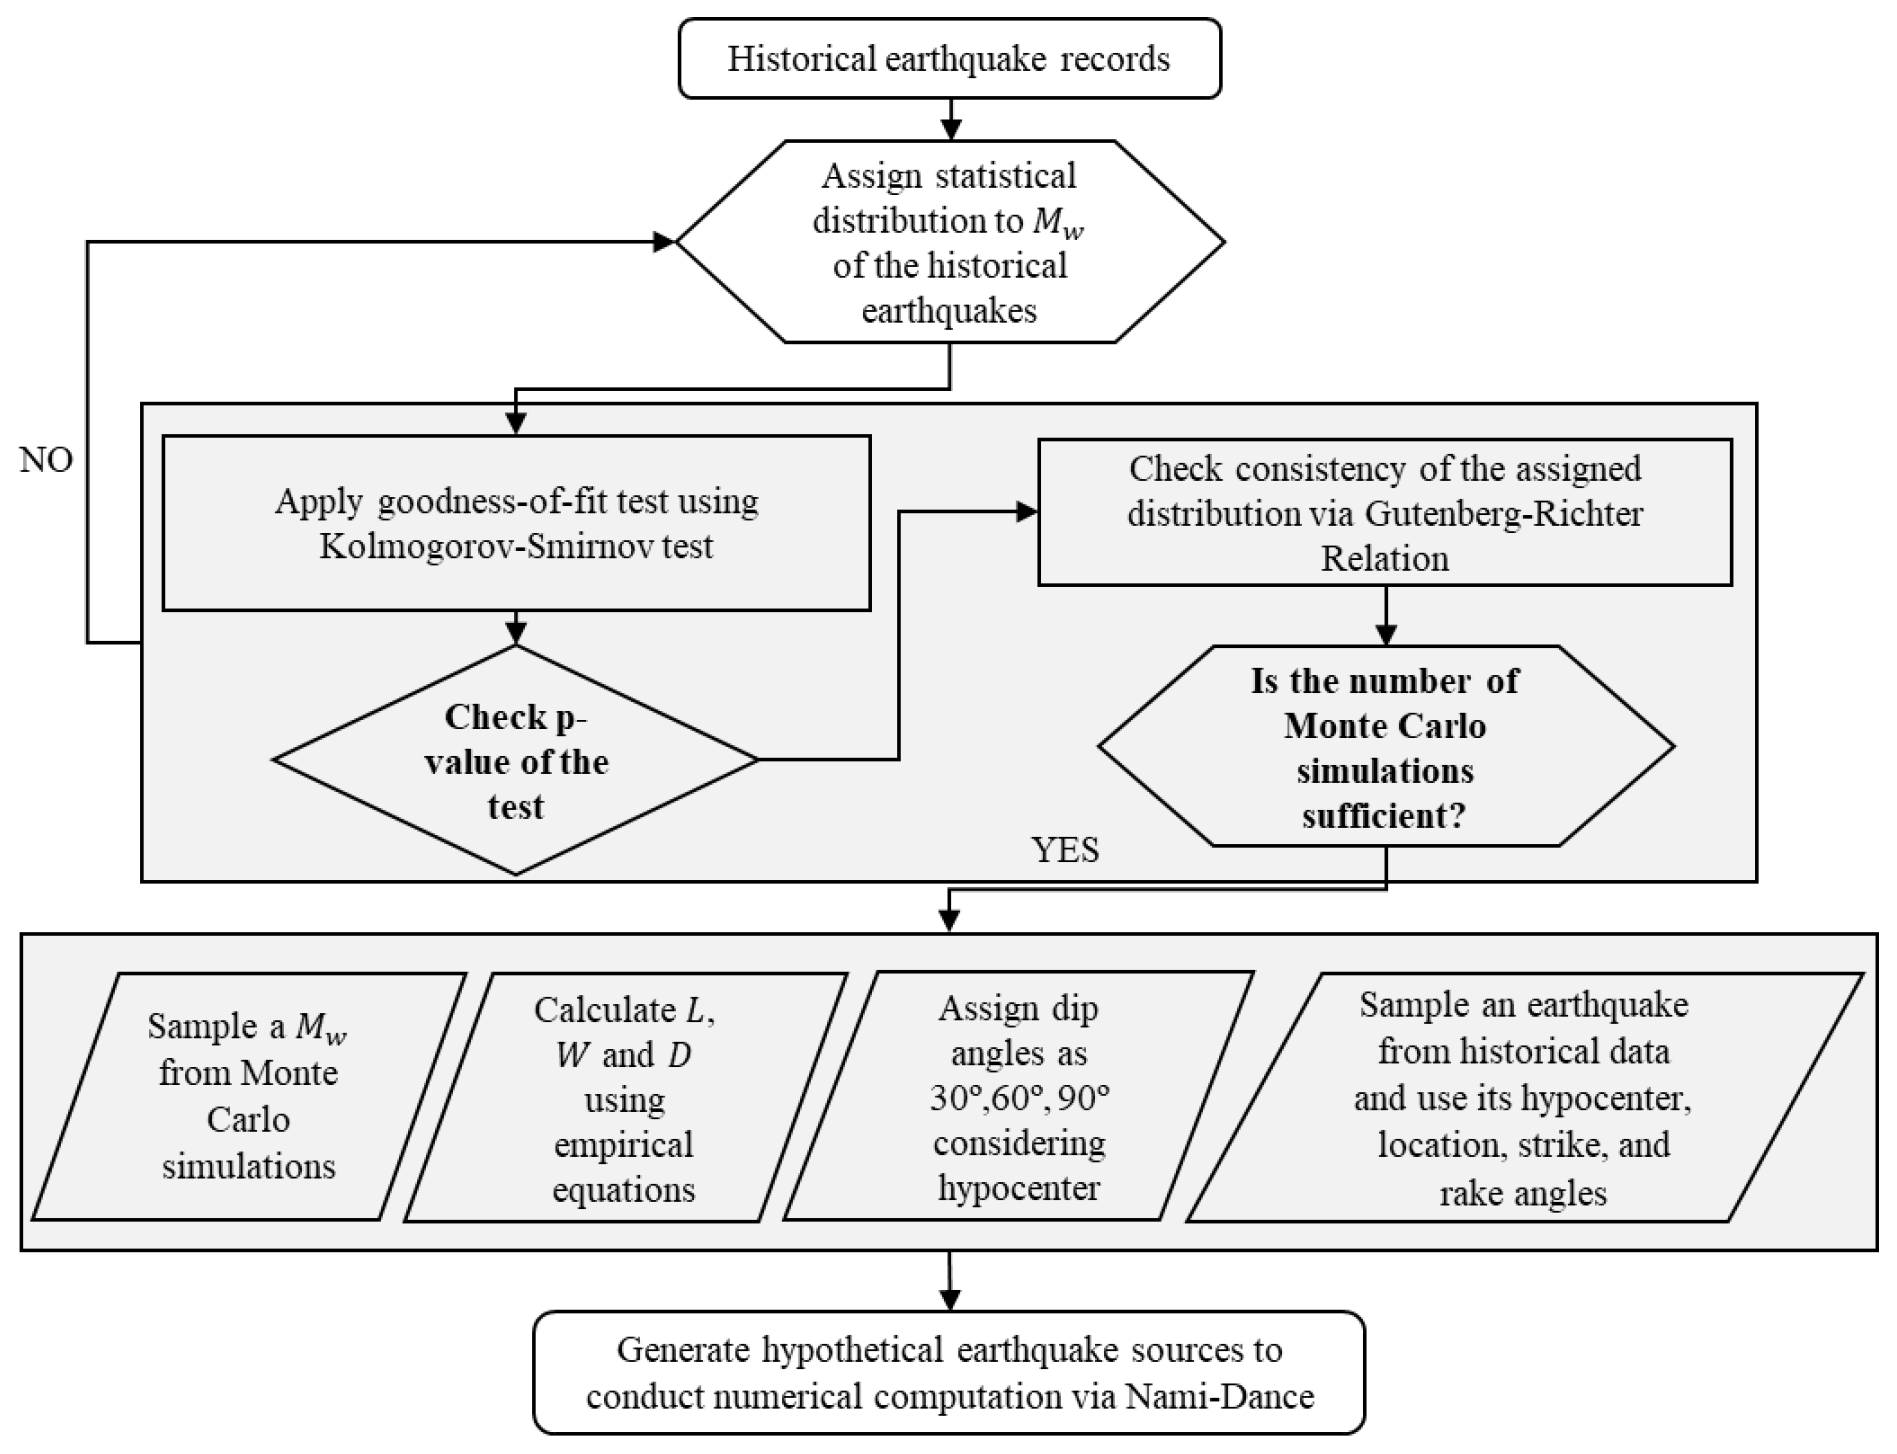
The coincidence between the randomly generated Mw shows that 100 000 Monte Carlo simulations are sufficient up to 10−4 per year annual exceedance of the tsunamigenic earthquake. As clearly stated in the literature, earthquakes having Mw≥6.5 can be considered tsunamigenic earthquakes (USGS, 2022). Depending on this statement, 1561 out of 100 000 randomly generated Mw values have a magnitude greater than 6.5 and are regarded as a tsunamigenic earthquake in this study. The generation steps of the hypothetical earthquake sources are given in Fig. 5.
The calculation procedure of the parameters of the hypothetical earthquake is explained. The fault length (L) of the hypothetical earthquake is calculated using the following equation (Takemura, 1998):
The fault width (W) can then be calculated using the simple equation given for the rupture area (S) as . Displacement (D) is also calculated using the empirical equation provided by Hanks and Kanamori (1979):
where μ is the shear modulus of crust (3.43×10¹⁰ N m−2).
In this study, the asperity position of the hypocenter is assumed to be at the center of the fault, and hypocenter distances are directly obtained from the historical earthquake dataset. In some circumstances, hypocenter distances are smaller than the calculated W values. This phenomenon causes some problematic solutions. To prevent this kind of miscalculations, dip angles are randomly assigned as 30, 60, and 90∘ to the grouped hypocenter distances considering the W values as well. The rest of the parameters are obtained directly from a sampled historical earthquake from the catalogue. The locations of the historical earthquakes are randomly assigned as the epicenters of the hypothetical earthquakes and are illustrated in Fig. 6. Then, these earthquake sources are simulated and tsunami wave heights along the coast of Fethiye, Turkey, are computed by the NAMI DANCE software (Zaytsev et al., 2019).
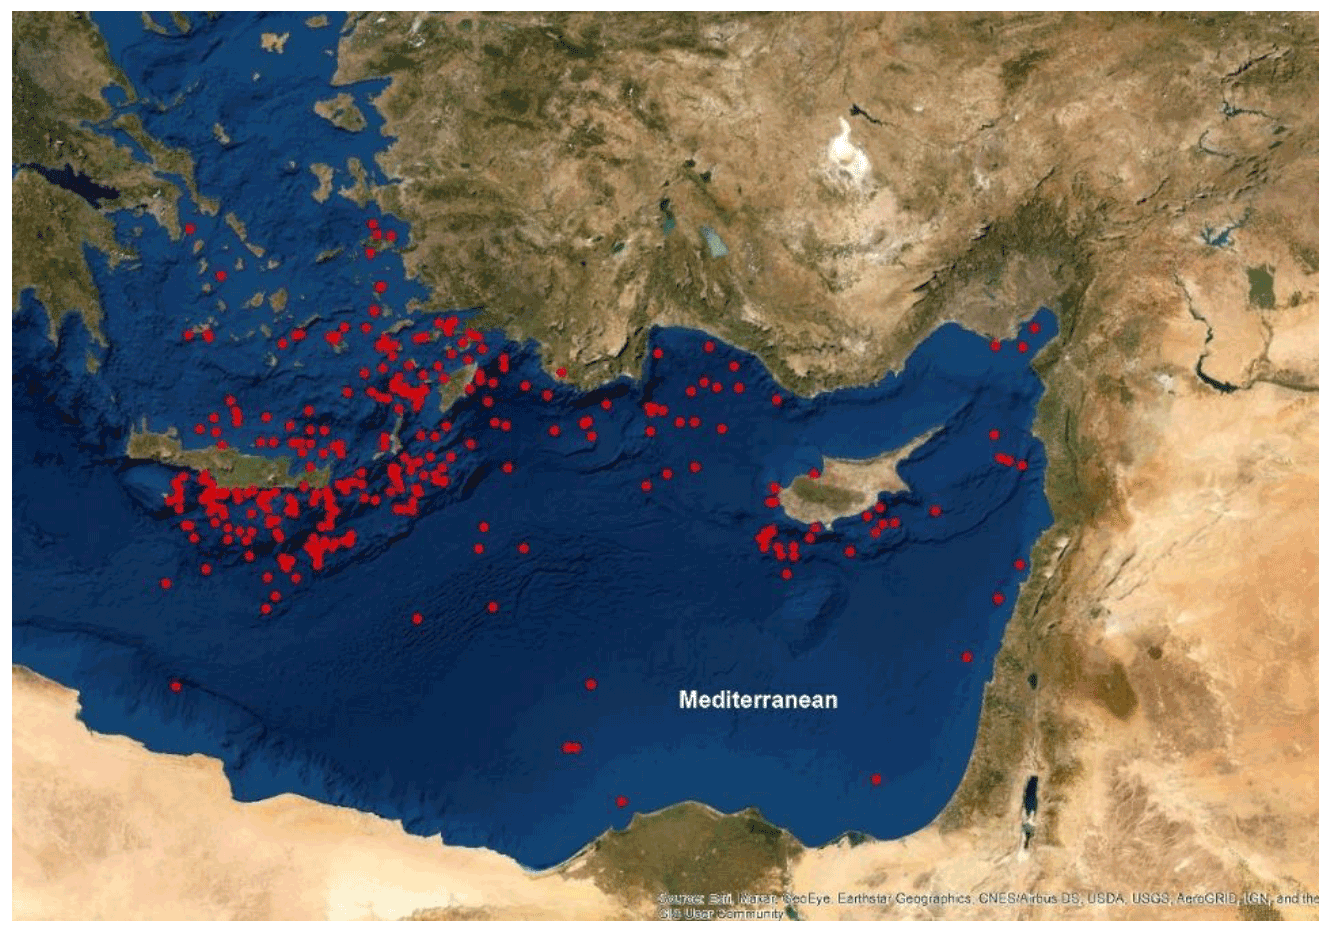
Figure 6Historical earthquake locations that are used as the epicenters of the hypothetical earthquakes (sources: Esri, Maxar, GeoEye, Earthstar Geographics, CNES/Airbus DS, USDA, USGS, AeroGRID, IGN, and the GIS User Community).
2.2 Tsunami simulations
Overall, 100 000 earthquake magnitudes are generated via Monte Carlo simulations and 1561 hypothetical earthquake sources having Mw≥6.5 are compiled to evaluate the flood and tsunami hazards simultaneously for the selected region based on the suggested framework by Yavuz et al. (2020a). The bathymetry of the study area has a 407 m grid size, and is retrieved from the General bathymetric chart of the oceans (GEBCO, 2022). The NAMI DANCE software that runs the continuity and momentum equations as shallow-water equations is used to perform tsunami simulations to compute the tsunami wave height (dt) at the coast of Fethiye, Turkey. The shallow-water equations are expressed as follows (Velioglu et al., 2016):
where η is the disturbance at the sea surface due to fault displacement, t is time, x and y are the horizontal axes on the sea surface, n is Manning's roughness coefficient, M and N are the discharge fluxes, D is the total sea depth, g is the gravitational acceleration, u and v are the water particle velocities, and h is the undisturbed sea depth. The NAMI DANCE software has the capability to compute generation, propagation, and amplification of tsunami waves using the shallow-water equations given above (Velioglu et al., 2016).
In this study, tsunami wave amplification cannot be calculated due to the coarse grid size of the bathymetry. Therefore, a commonly used empirical equation proposed by Green (Synolakis, 1991; Løvholt et al., 2012, 2014; Yavuz et al., 2020a) is used to calculate dt at 1 m water depth at the coast. To apply the equation, a gauge is digitized at 50 m water depth and Green's law (Synolakis, 1991) is used to calculate dt at 1 m depth at the coast of the selected region.
where h50 and h1 are the undisturbed water depths at 50 and 1 m, respectively. d50 is the tsunami wave height recorded at the digitized gauge point in the simulation. dt is used to determine the additional flooded lands resulting from the simultaneous occurrence of the flood and tsunami hazards in the selected regions. The hypothetical earthquakes having annual exceedance probabilities of 10−4 to 10−1 per year are regarded as the earthquakes that can generate a tsunami at the Fethiye coastline. It is known that a tsunami has a wave period of a couple of minutes, while the river flood could be much longer. However, it should be noted here that tsunami hazard is assumed to occur at the time of fully developed flood hazard condition in this study. By doing so, dt is considered only as a water level at the downstream boundary condition; it neither changes with time nor with the water levels at the river mouths. Flood hazard analyses are conducted for the discharge having a recurrence period of 10 years (Q10). Q10 flood discharge is selected due to its higher chance of coincidence with a probable tsunami event than other commonly used flood periods in the literature. Thus, there is a coincidence of the combination of these two hazards changes from 10−5 to 10−2 per year.
2.3 Hydrodynamic modeling and quantification of flood hazard
Fluvial hazards resulting from water level rise in the river and overflow onto the neighboring lands are also evaluated considering three different return periods with and without the presence of earthquake-triggered tsunamis. We conducted 1D and 2D hydraulic modeling of the streams within the Fethiye city center by implementing MIKE 11, MIKE 21 FM, and MIKE Flood, widely accepted and used software for simulating hydraulic engineering problems (DHI, 2016a, b).
Firstly, 1D numerical modeling is conducted by MIKE 11, which solves Saint Venant's equations (DHI, 2016b). For this purpose, the physical conditions of each stream are determined by field trips. By using the Nivelman GPS device, the layout of cross-sections is determined at every 100 m for each stream. Moreover, the dimensions and locations of culverts or inline structures are determined in the field. Therefore, obtained data from the field are entered into MIKE 11 to represent the real physical conditions of the study area. Finally, a 1D numerical model via MIKE 11 is conducted and areas prone to flooding are determined by considering the bank elevations and water levels within each cross-section.
After having implemented the 1D numerical model, it is able to conclude that there is a possibility of flooding within Fethiye city center. Therefore, the MIKE 21 FM model is implemented for the area of the city center. MIKE 21 is widely used software for modeling free-surface flows (DHI, 2016b). The software solves shallow-water equations which are incompressible Reynolds-averaged Navier–Stokes equations (DHI, 2016b). Excess discharge within the streambed (1D model) is released from the river banks and released to the surface; thus a numerical solution of surface water flows is implemented by MIKE 21. For this purpose, a digital elevation model (DEM) of the area with a resolution of 1 m is obtained from Fethiye Municipality. The DEM of the project area is illustrated in Fig. 7.
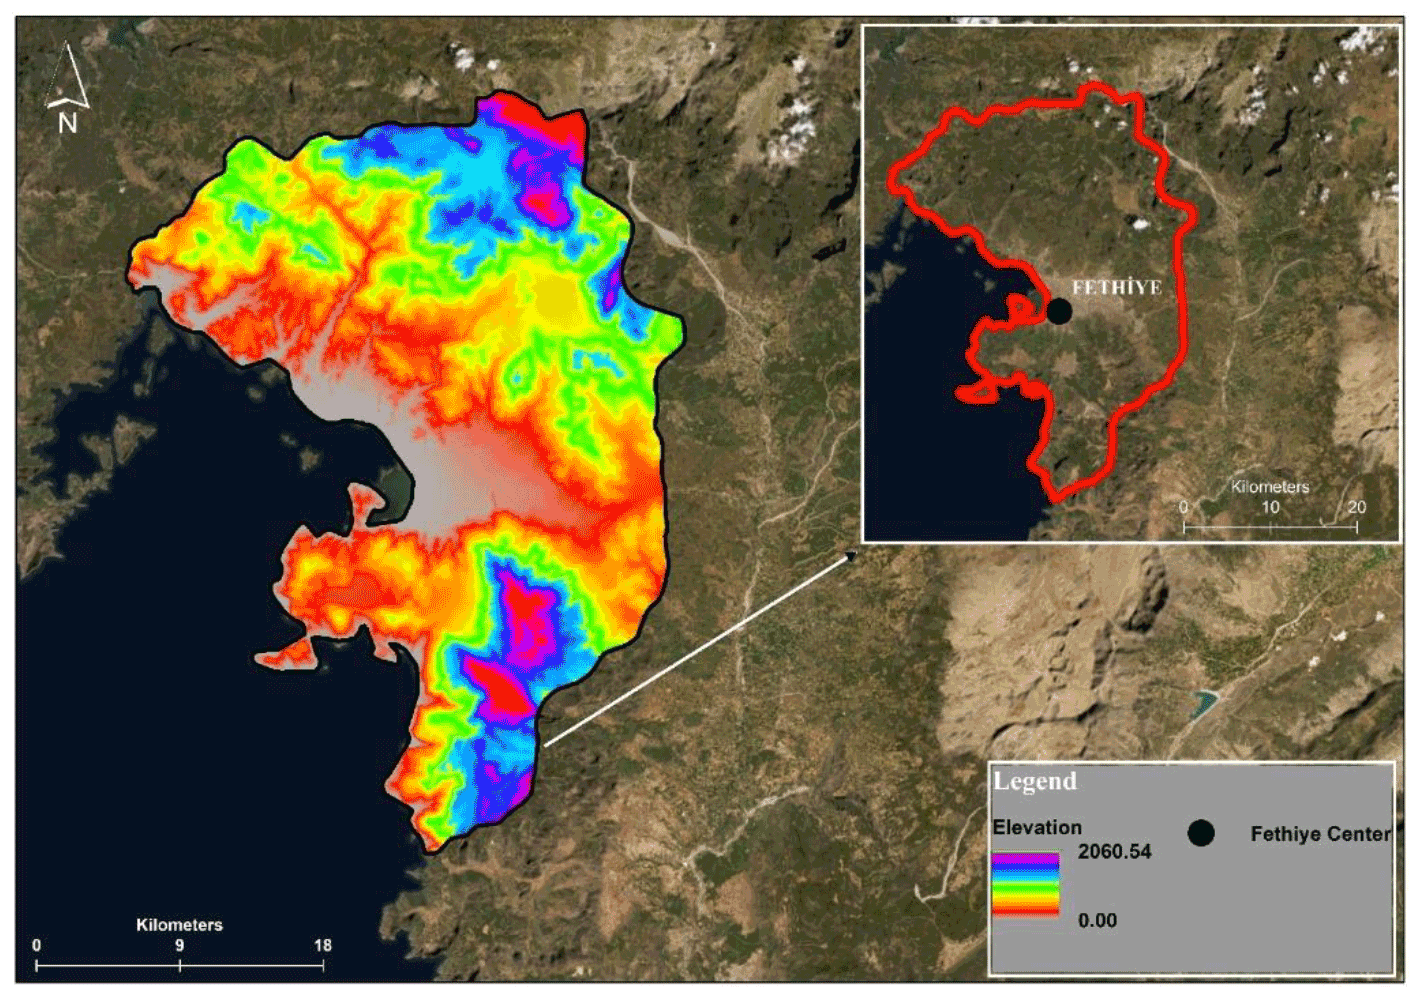
Figure 7Demonstration of the DEM of study area (sources: Esri, Maxar, GeoEye, Earthstar Geographics, CNES/Airbus DS, USDA, USGS, AeroGRID, IGN, and the GIS User Community).
Both the 1D model and 2D model are coupled via the MIKE Flood software; thus, excess discharge within the streambed is released from the banks of the stream and the computational area is inundated. In order to solve the surface flow, the computational domain is meshed with non-uniform unstructured meshes. Moreover, the buildings and/or structures within the computational area are digitized and implemented into the MIKE 21 model to determine the area with fine meshes. The buildings within the computational area are excluded from the meshing procedure by considering the building elevations and possible inundation water levels. The result is provided by solving 1D and 2D numerical models simultaneously. The stream network of the selected region including Fethiye city center is presented in Fig. 8.
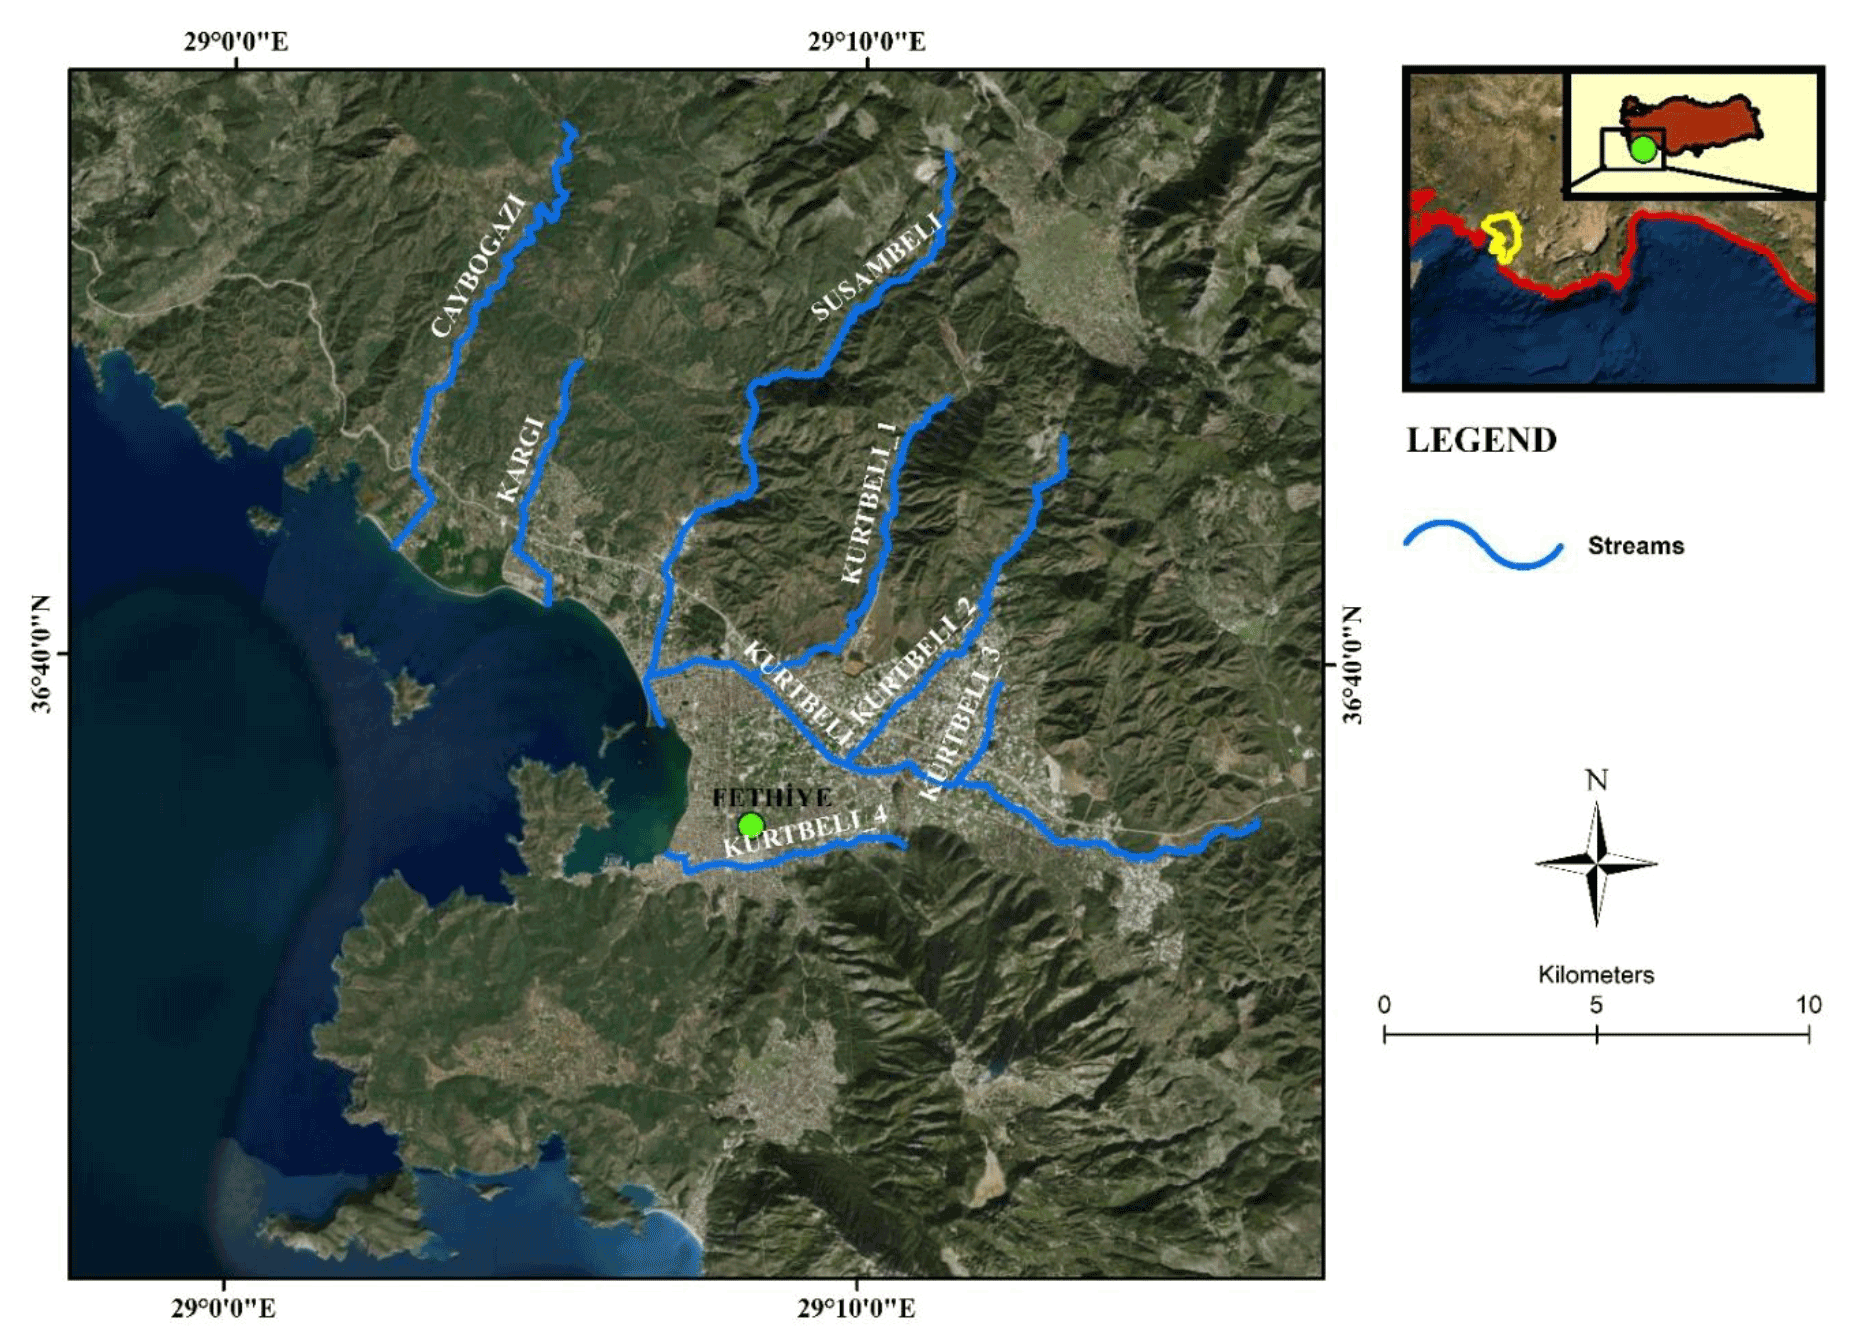
Figure 8Stream network of the selected region (sources: Esri, Maxar, GeoEye, Earthstar Geographics, CNES/Airbus DS, USDA, USGS, AeroGRID, IGN, and the GIS User Community).
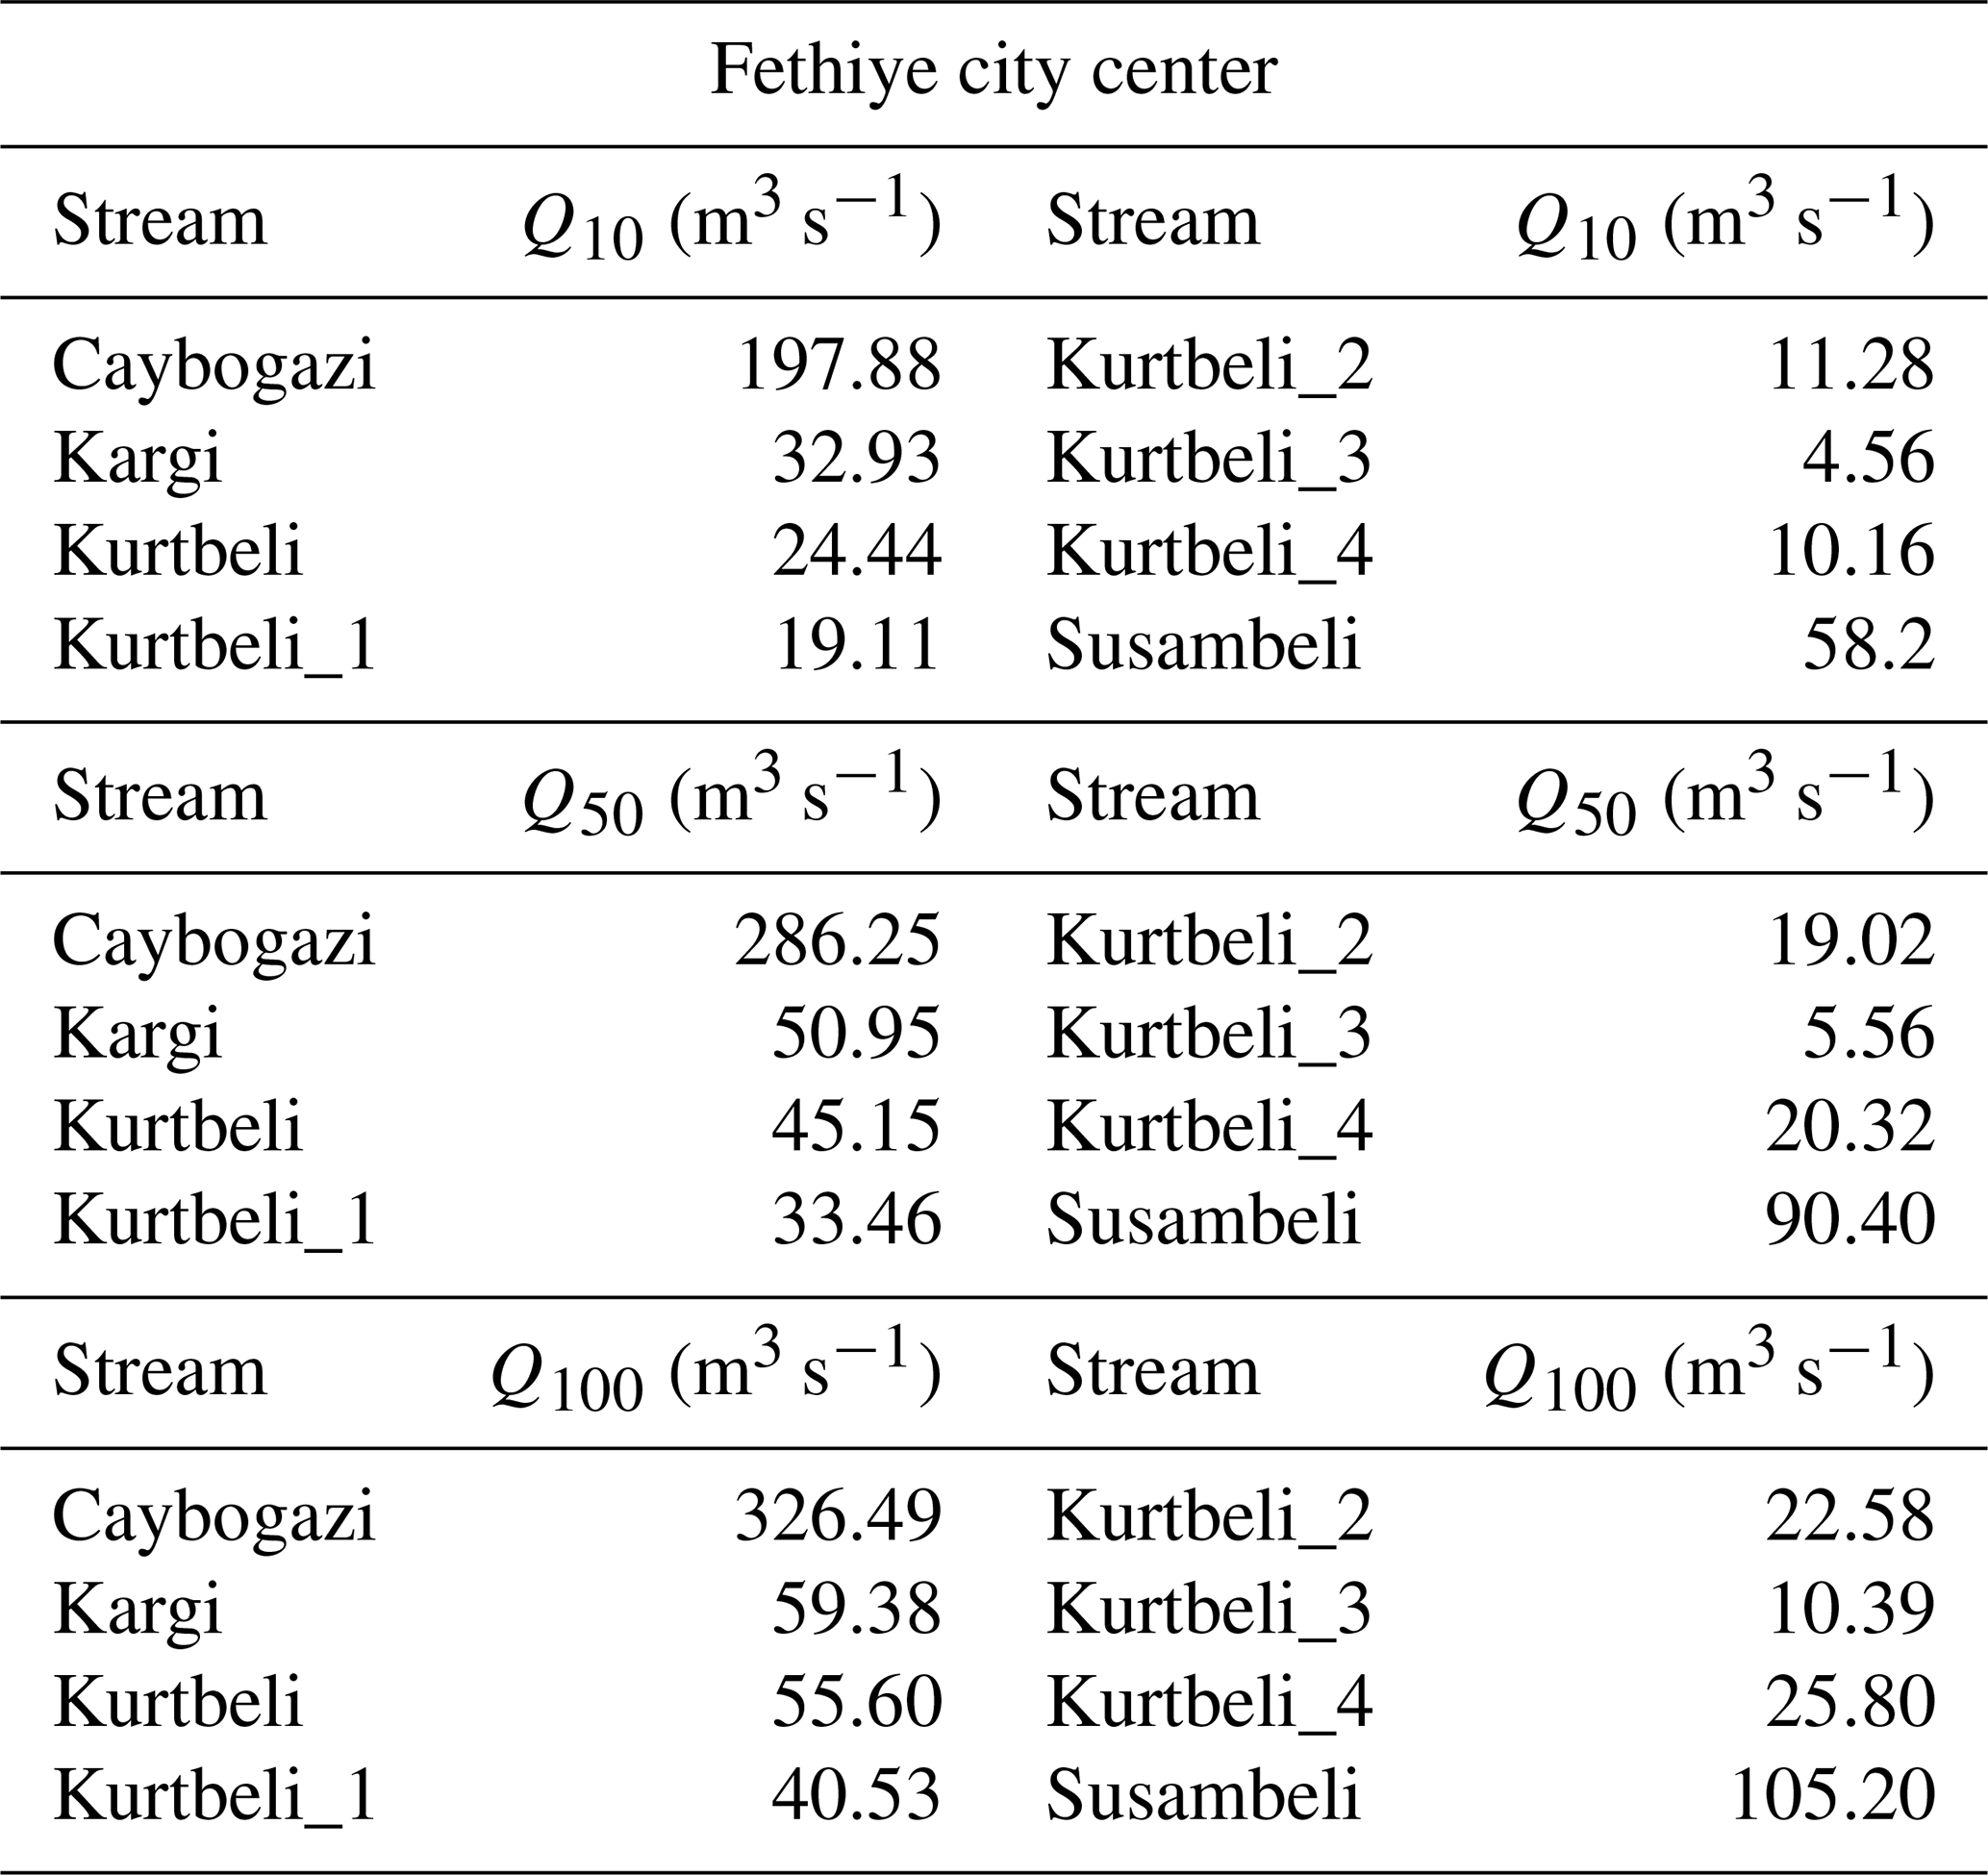
Throughout the simulations processes, input boundary conditions of each stream are determined as the discharge of the 10-year recurrence interval (Q10). The calculated Q10 discharges for each stream are tabulated in Table 1 and are provided from the “Hydrology report” of the “Flood management plan of Western Mediterranean Basin” which was prepared by the General Directorate of Water Management of Turkey under the guidance of the “EU flood directive 2007/60” and the “Water framework directive” (SYGM, 2022).
Table 1Peak discharges of the streams for discharge of 10-year recurrence interval in the study area (SYGM, 2022).
The downstream boundary condition for a discharge having 10-, 50-, and 100- year return periods of each stream is determined as mean sea level. Moreover, calibration of the hydraulic model cannot be accomplished due to the lack of data. However, the most important parameter for calibrating the hydraulic model is Manning's roughness coefficient. The surface roughness coefficients are determined by considering CORINE 2018 Land Cover data (Papaioannou et al., 2018). The computational area was classified according to the land use classification of CORINE 2018 data as shown in Fig. 9. Spatially varied roughness coefficients of the specific land cover were implemented according to the study conducted by Papaioannou et al. (2018).
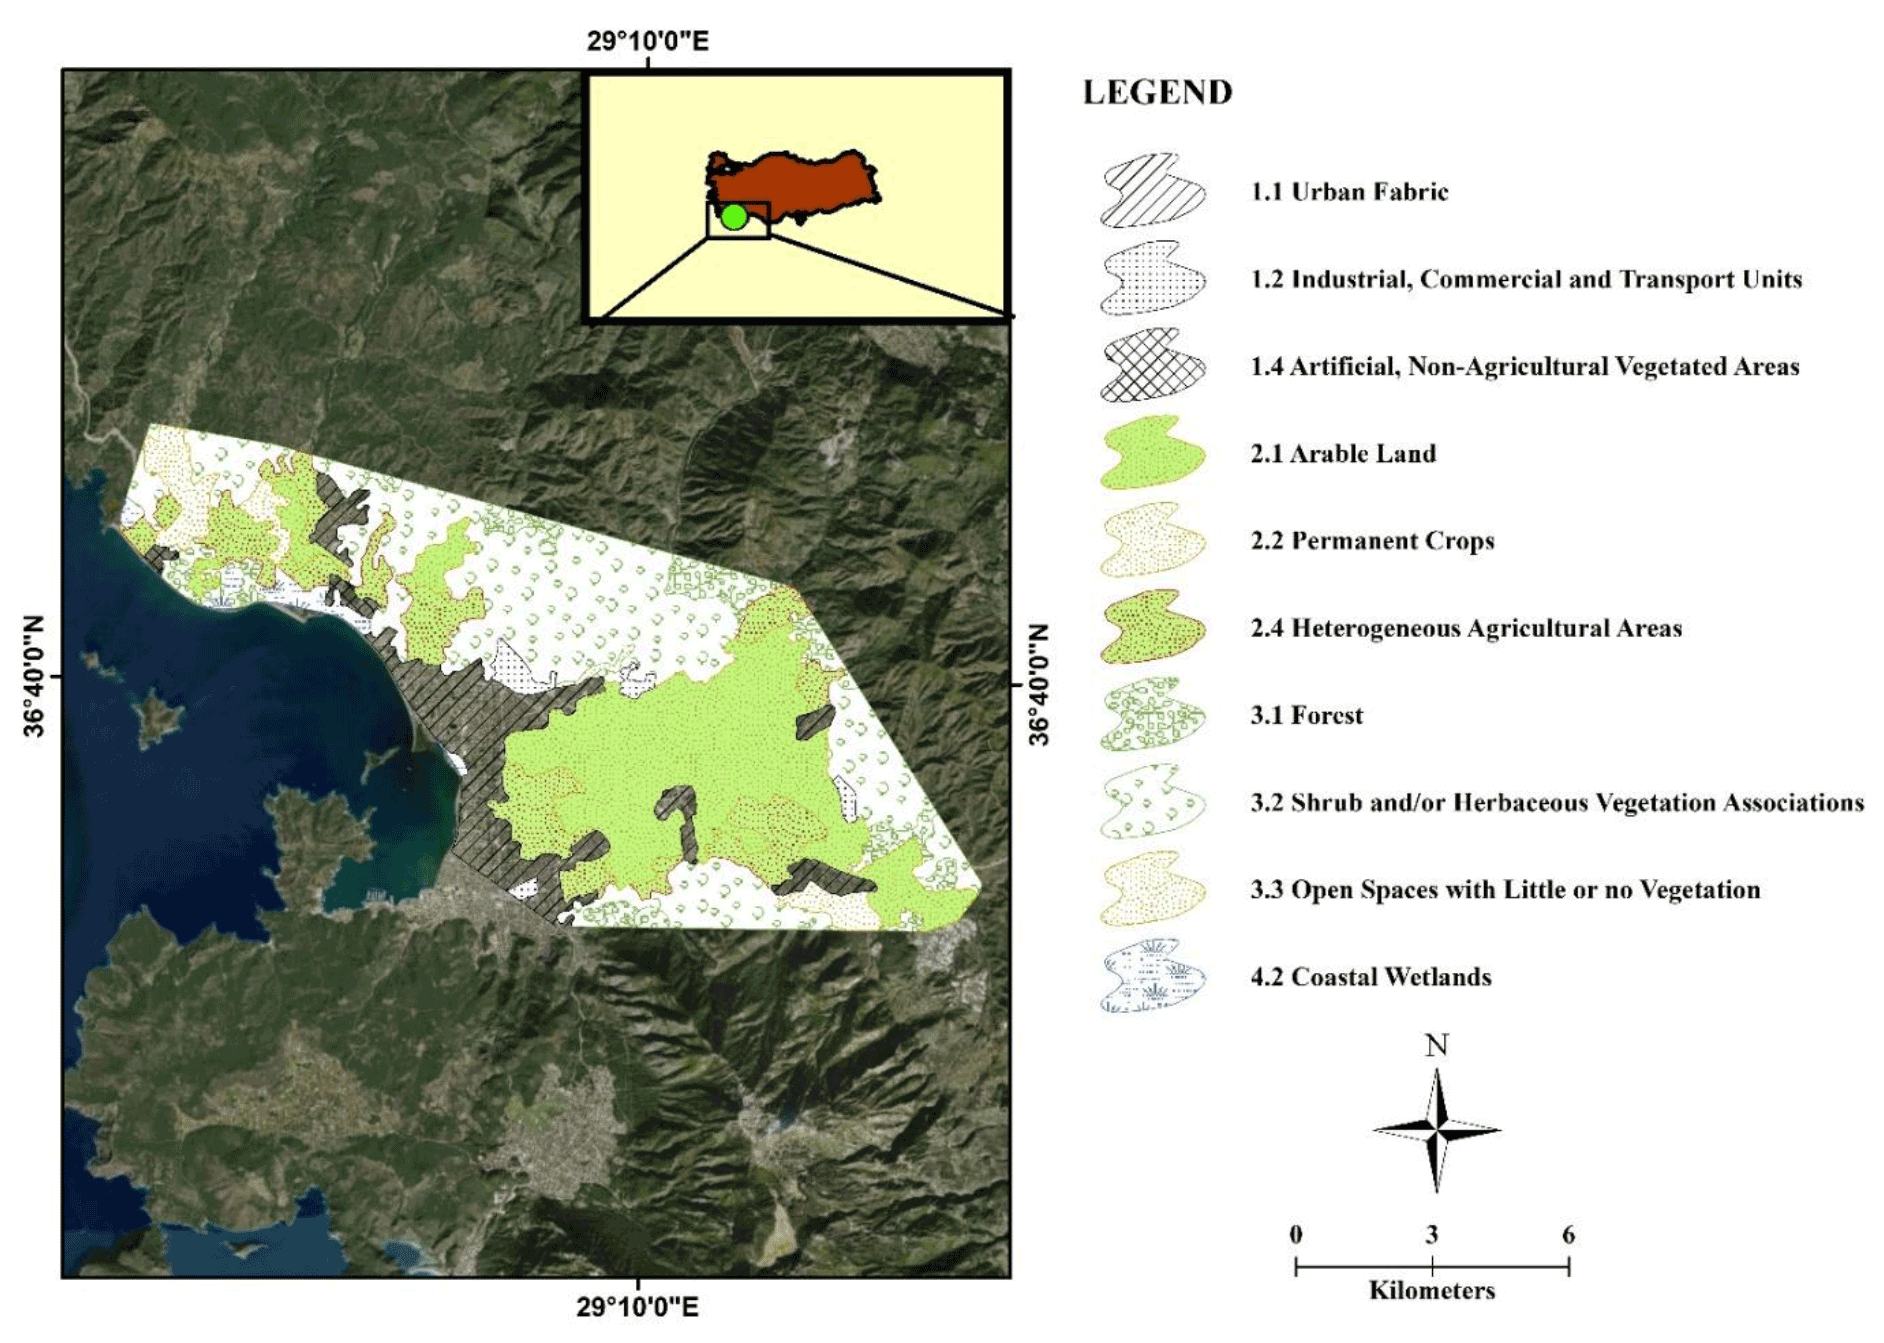
Figure 9Land cover classification of computational domain according to CORINE 2018 Data (sources: Esri, Maxar, GeoEye, Earthstar Geographics, CNES/Airbus DS, USDA, USGS, AeroGRID, IGN, and the GIS User Community).
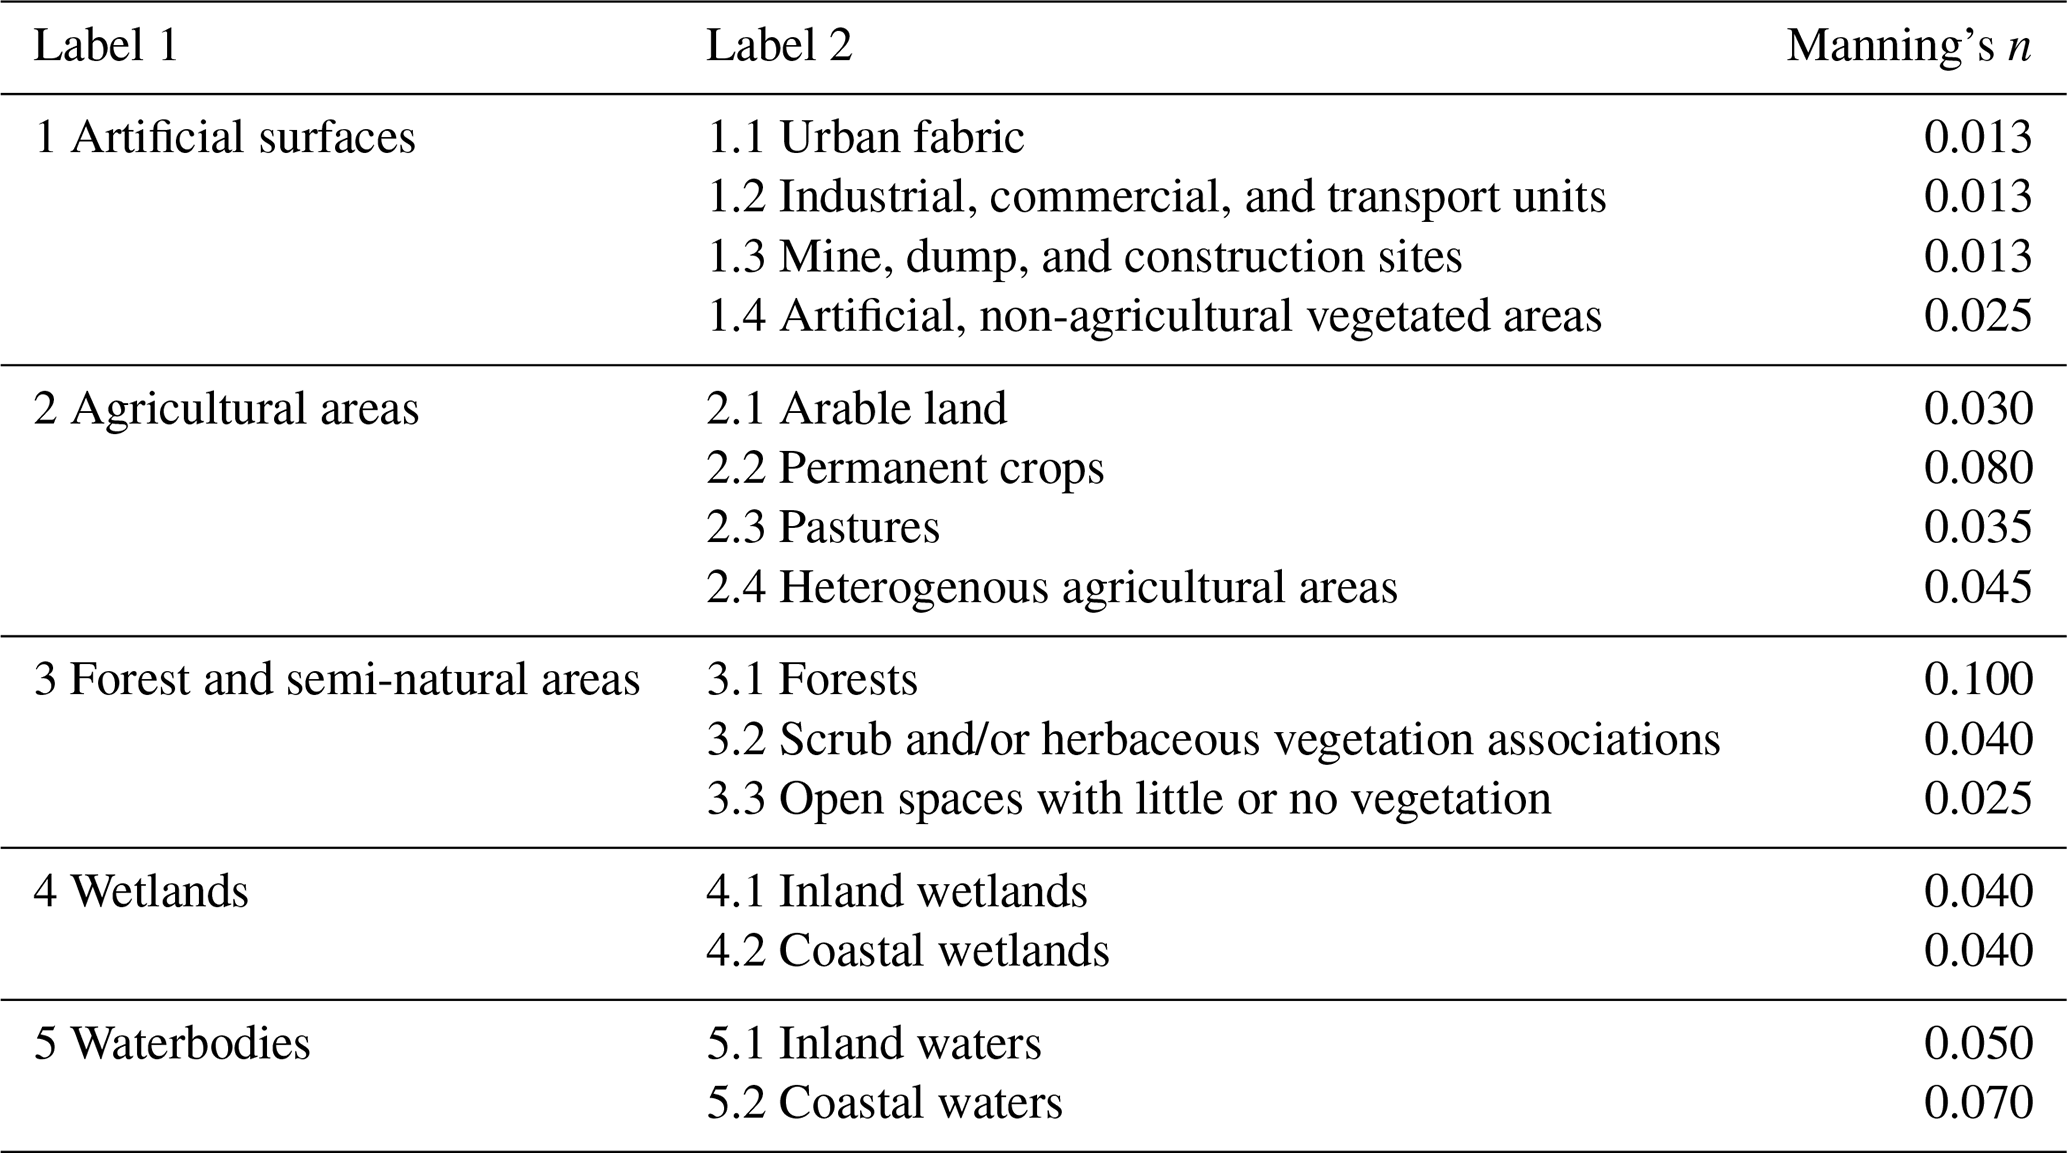
Average Manning's surface roughness coefficients of each land cover of CORINE 2018 data were presented by Papaioannou et al. (2018). The land cover of the computational domain is constructed by examining the CORINE data, and the roughness coefficients of each land cover are tabulated in Table 2.
Table 2Peak discharges of the streams for discharge of 10-year recurrence interval in the study area (Papaioannou et al., 2018).
After having carried out the hydraulic analysis, the result of the model is also used for flood hazard quantification. Flood hazard quantification is often conducted by considering water depth and velocity. Although there are various methods for quantifying flood hazards, direct multiplication of depth and velocity is suggested by Smith et al. (2014). The threshold values for each hazard class and vulnerability classification are tabulated in Table 3 below (Smith et al., 2014).
Table 3Hazard classes and vulnerability thresholds (Smith et al., 2014).

Water depth within the inundated area and flood propagation velocity are both considered with and without the presence of an earthquake-triggered tsunami. Therefore, spatially varied hazard maps are constructed accordingly.
In this study, potential multi-hazard assessment because of the fluvial flood hazard (Q10, Q50, and Q100), with and without the presence of earthquake-triggered tsunamis, is analyzed for Fethiye city center. Inundated areas due to flood only, earthquake-triggered tsunami only, and multi-hazard conditions (i.e., flood + earthquake-triggered tsunami) are determined by numerical computations, and corresponding inundation levels are revealed for each hazard circumstance.
For all flood hazard events considered in this study, maximum water levels are observed within the riverbed. The inundated area due to flood is limited along the streamlines for inland sections. There are also small inundated sections that can be observed due to flood in some parts of the coast of the study area. A large portion of the coastal region is not affected by the flood waves and the inundated area is limited in the coastal parts. A sample inundation map of the study area is given in Fig. 10 for the flood of Q10, Q50, and Q100 obtained from the numerical computations.
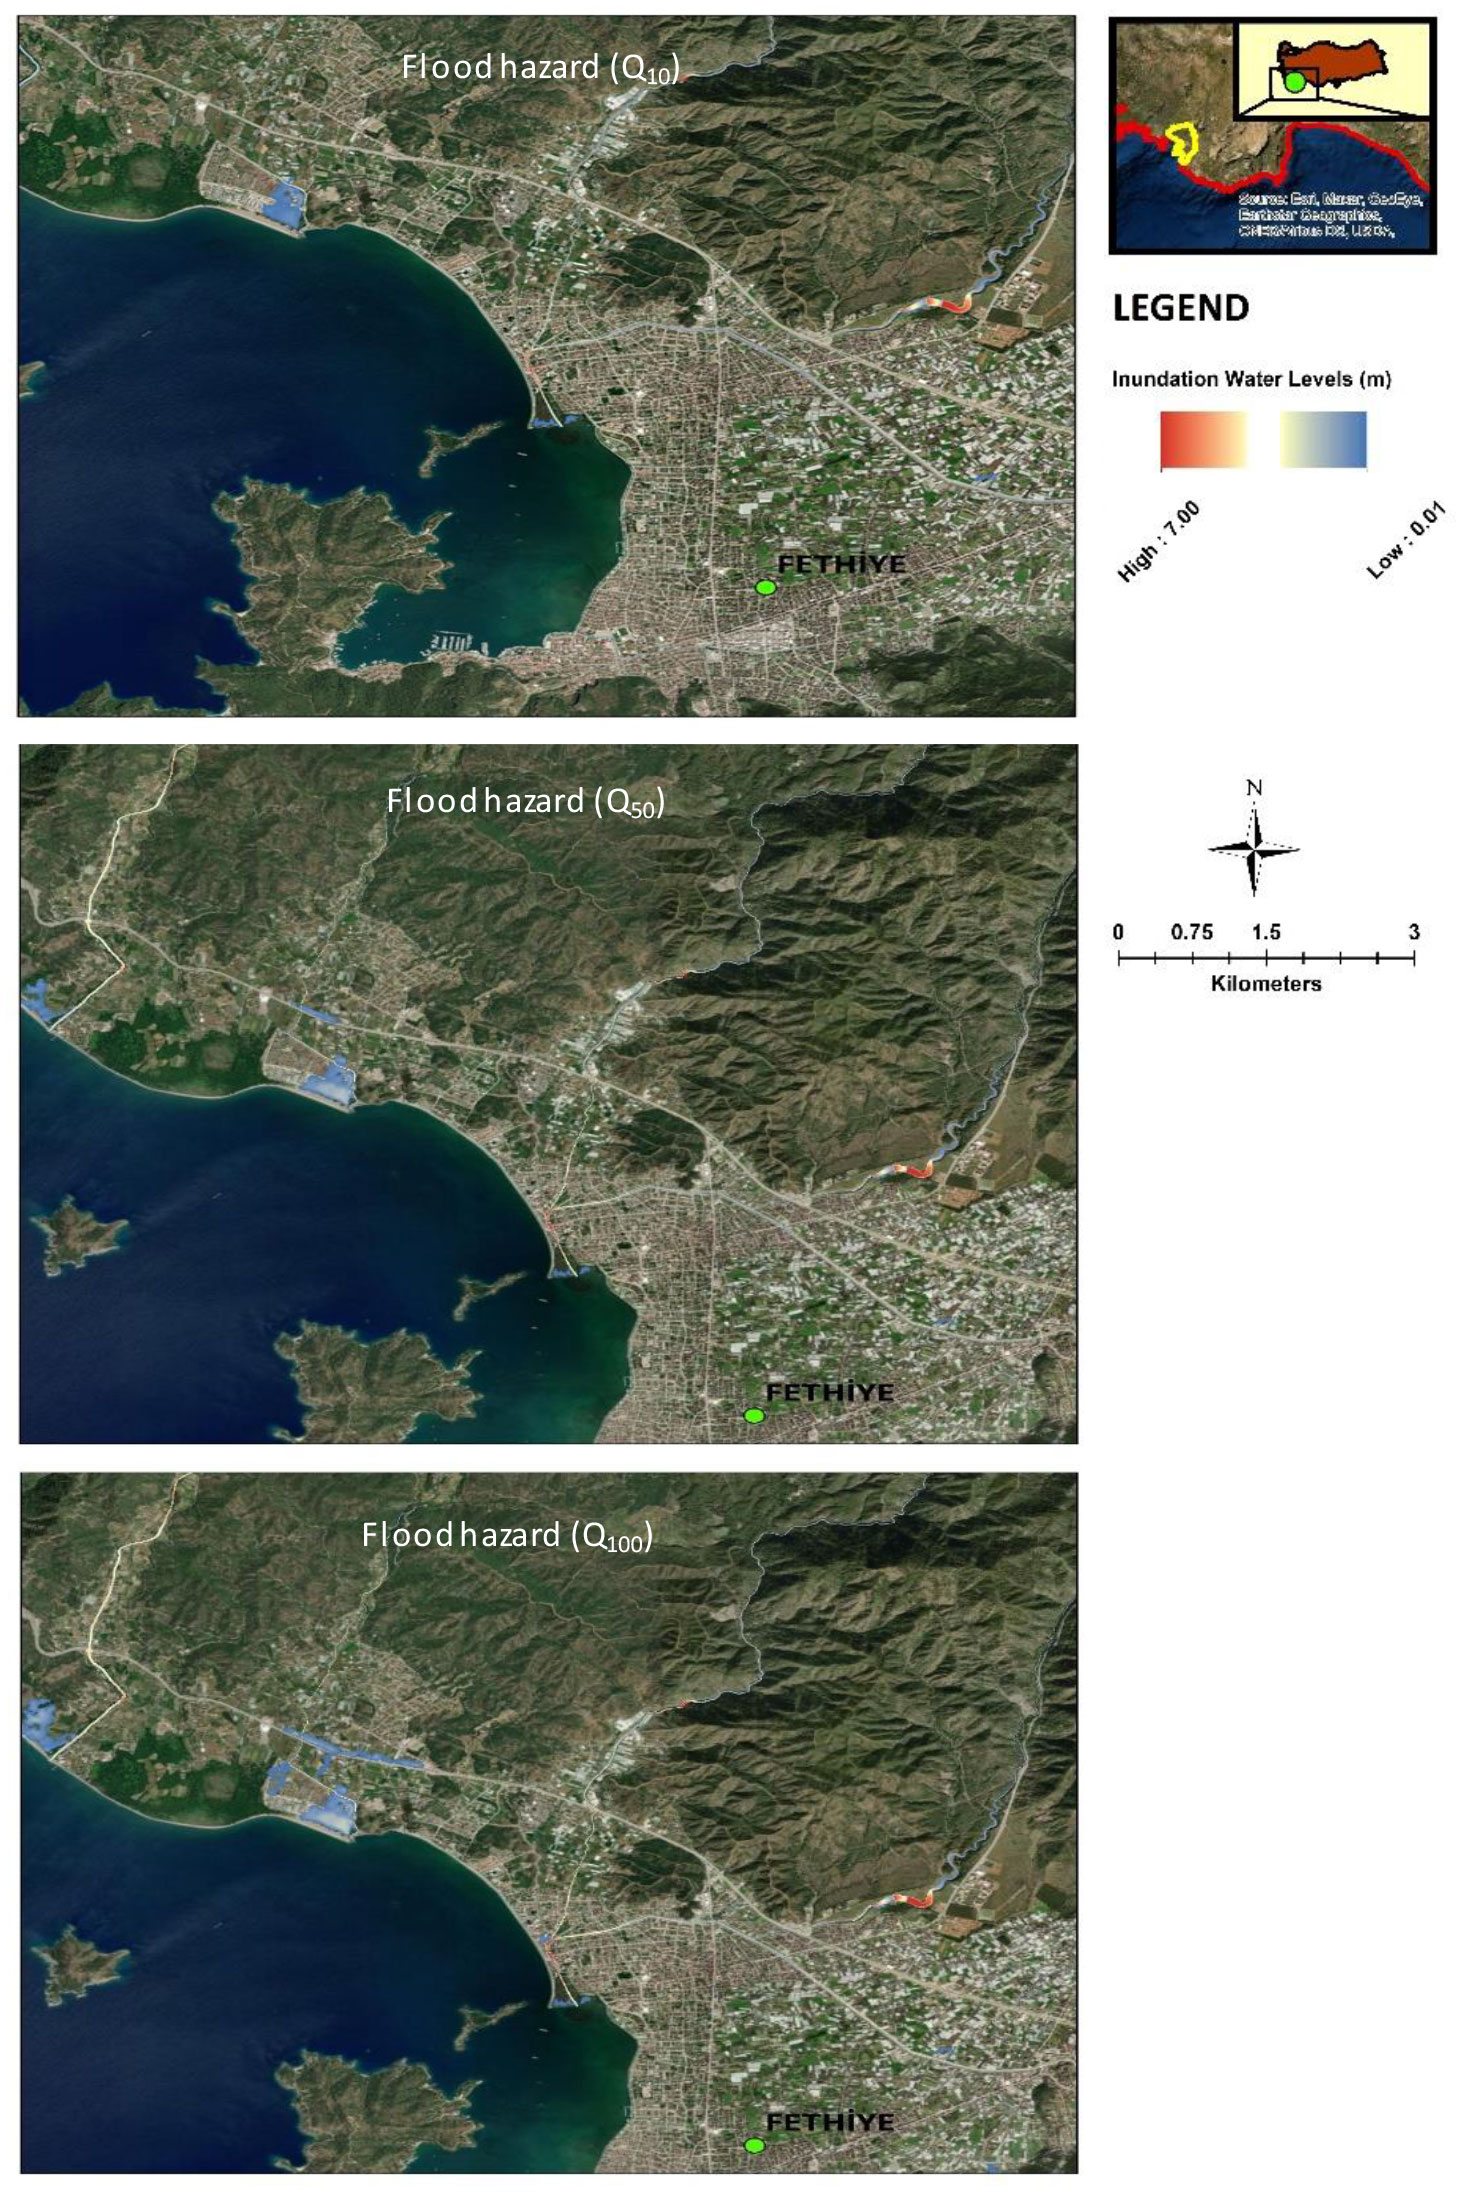
Figure 10Inundation due to flood hazards considered in the study (sources: Esri, Maxar, GeoEye, Earthstar Geographics, CNES/Airbus DS, USDA, USGS, AeroGRID, IGN, and the GIS User Community).
Although a water inundation level exceeding 6 m is observed on some parts of the Kurtbeli_1 stream, the effect of the Q10 flood is limited at the coastline. Depending on the computation results, the other streams also have small inundations around the riverbeds.
For the flood hazard having a 50-year return period, maximum water levels are observed only within the riverbed again, but the inundated area is slightly extended compared with the flood event having a return period of 10 years as expected. A large portion of the coastal region is not affected by the flood waves, and the inundated area is limited in the coastal parts.
Depending on the simulation results, a flood hazard having a 100-year return period generates maximum water levels within the riverbeds in the study area. The inundated area due to flood is limited along the streamlines for inland sections. There are also small inundated sections that can be observed due to flood in some parts of the coast of the study area. A large portion of the coastal region is not affected by the flood waves, and the inundated area is limited in the coastal parts.
For the earthquake-triggered tsunami hazard conditions on the other hand, a significant portion of the coastline is estimated to be inundated with 3.5 m tsunami wave heights (see Fig. 11). Compared to the flood hazard level, earthquake-triggered tsunamis might have considerable inundation levels at the coastline. Up to 1 km of land inwards from the coastline is estimated to be inundated due to tsunami waves depending on the hypothetical earthquake-triggered tsunami analysis.
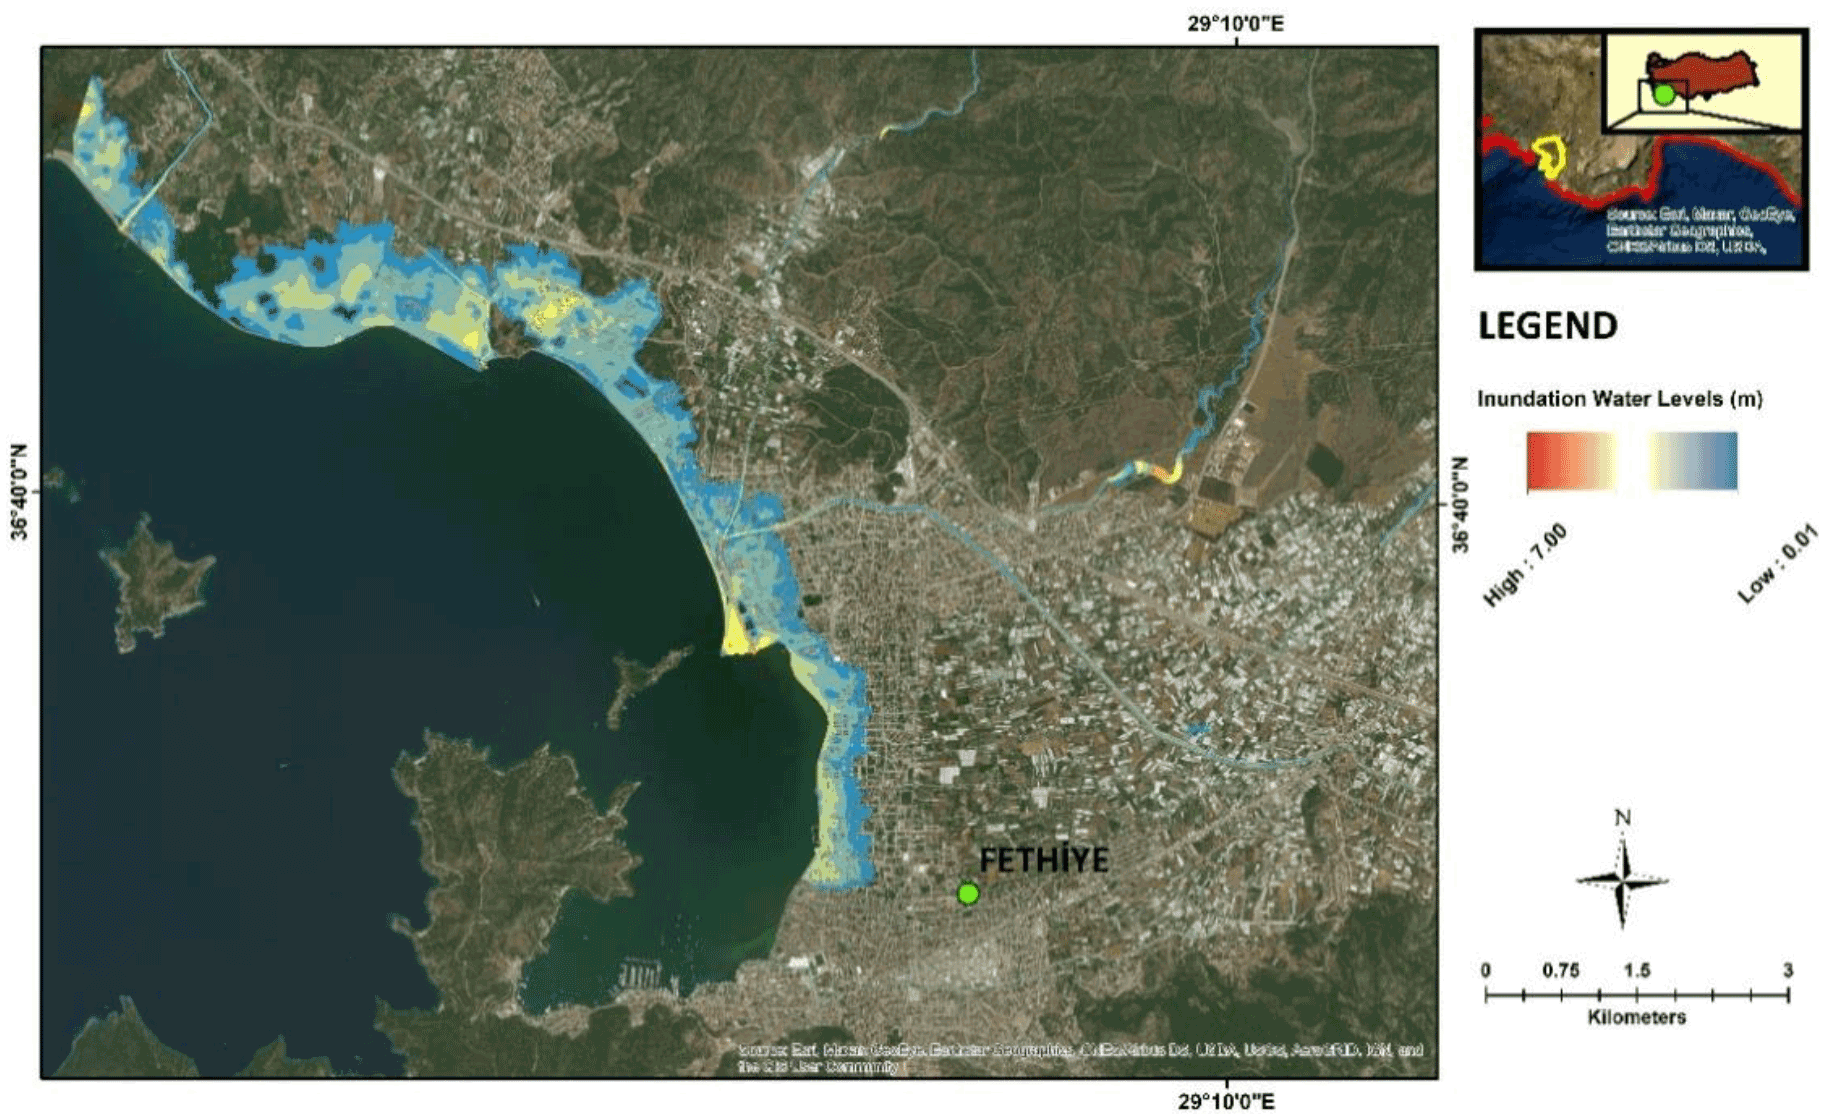
Figure 11Inundation levels resulting from an earthquake-triggered tsunami hazard (sources: Esri, Maxar, GeoEye, Earthstar Geographics, CNES/Airbus DS, USDA, USGS, AeroGRID, IGN, and the GIS User Community).
On the other hand, the coastline of the study area is severely inundated due to flood (Q10) which takes place slightly before tsunami peak waves hit the coastal parts of the city. Although the maximum tsunami wave height obtained from the simulations is around 3.50 m, the inundation level for the multi-hazard conditions reaches up to 7.00 m for some parts of the low-lying sections of the study area (see Fig. 12).

Figure 12Inundation levels obtained from the simultaneous occurrence of fully developed flood Q10 and earthquake-triggered tsunami hazards (sources: Esri, Maxar, GeoEye, Earthstar Geographics, CNES/Airbus DS, USDA, USGS, AeroGRID, IGN, and the GIS User Community).
Even for the contribution of flood hazard having the shortest return period (i.e., Q10) in the study, the multi-hazard inundation level reaches up to 7.00 m. It will not be surprising that higher inundation levels are definitely observed for multi-hazard assessment with Q50 and Q100 flood hazards.
Quantification of the flood hazard is also carried out for all three case studies by considering the threshold values and classes given in Table 3 (Smith et al., 2014). The results of hazard quantification are presented for all return periods in Fig. 13.
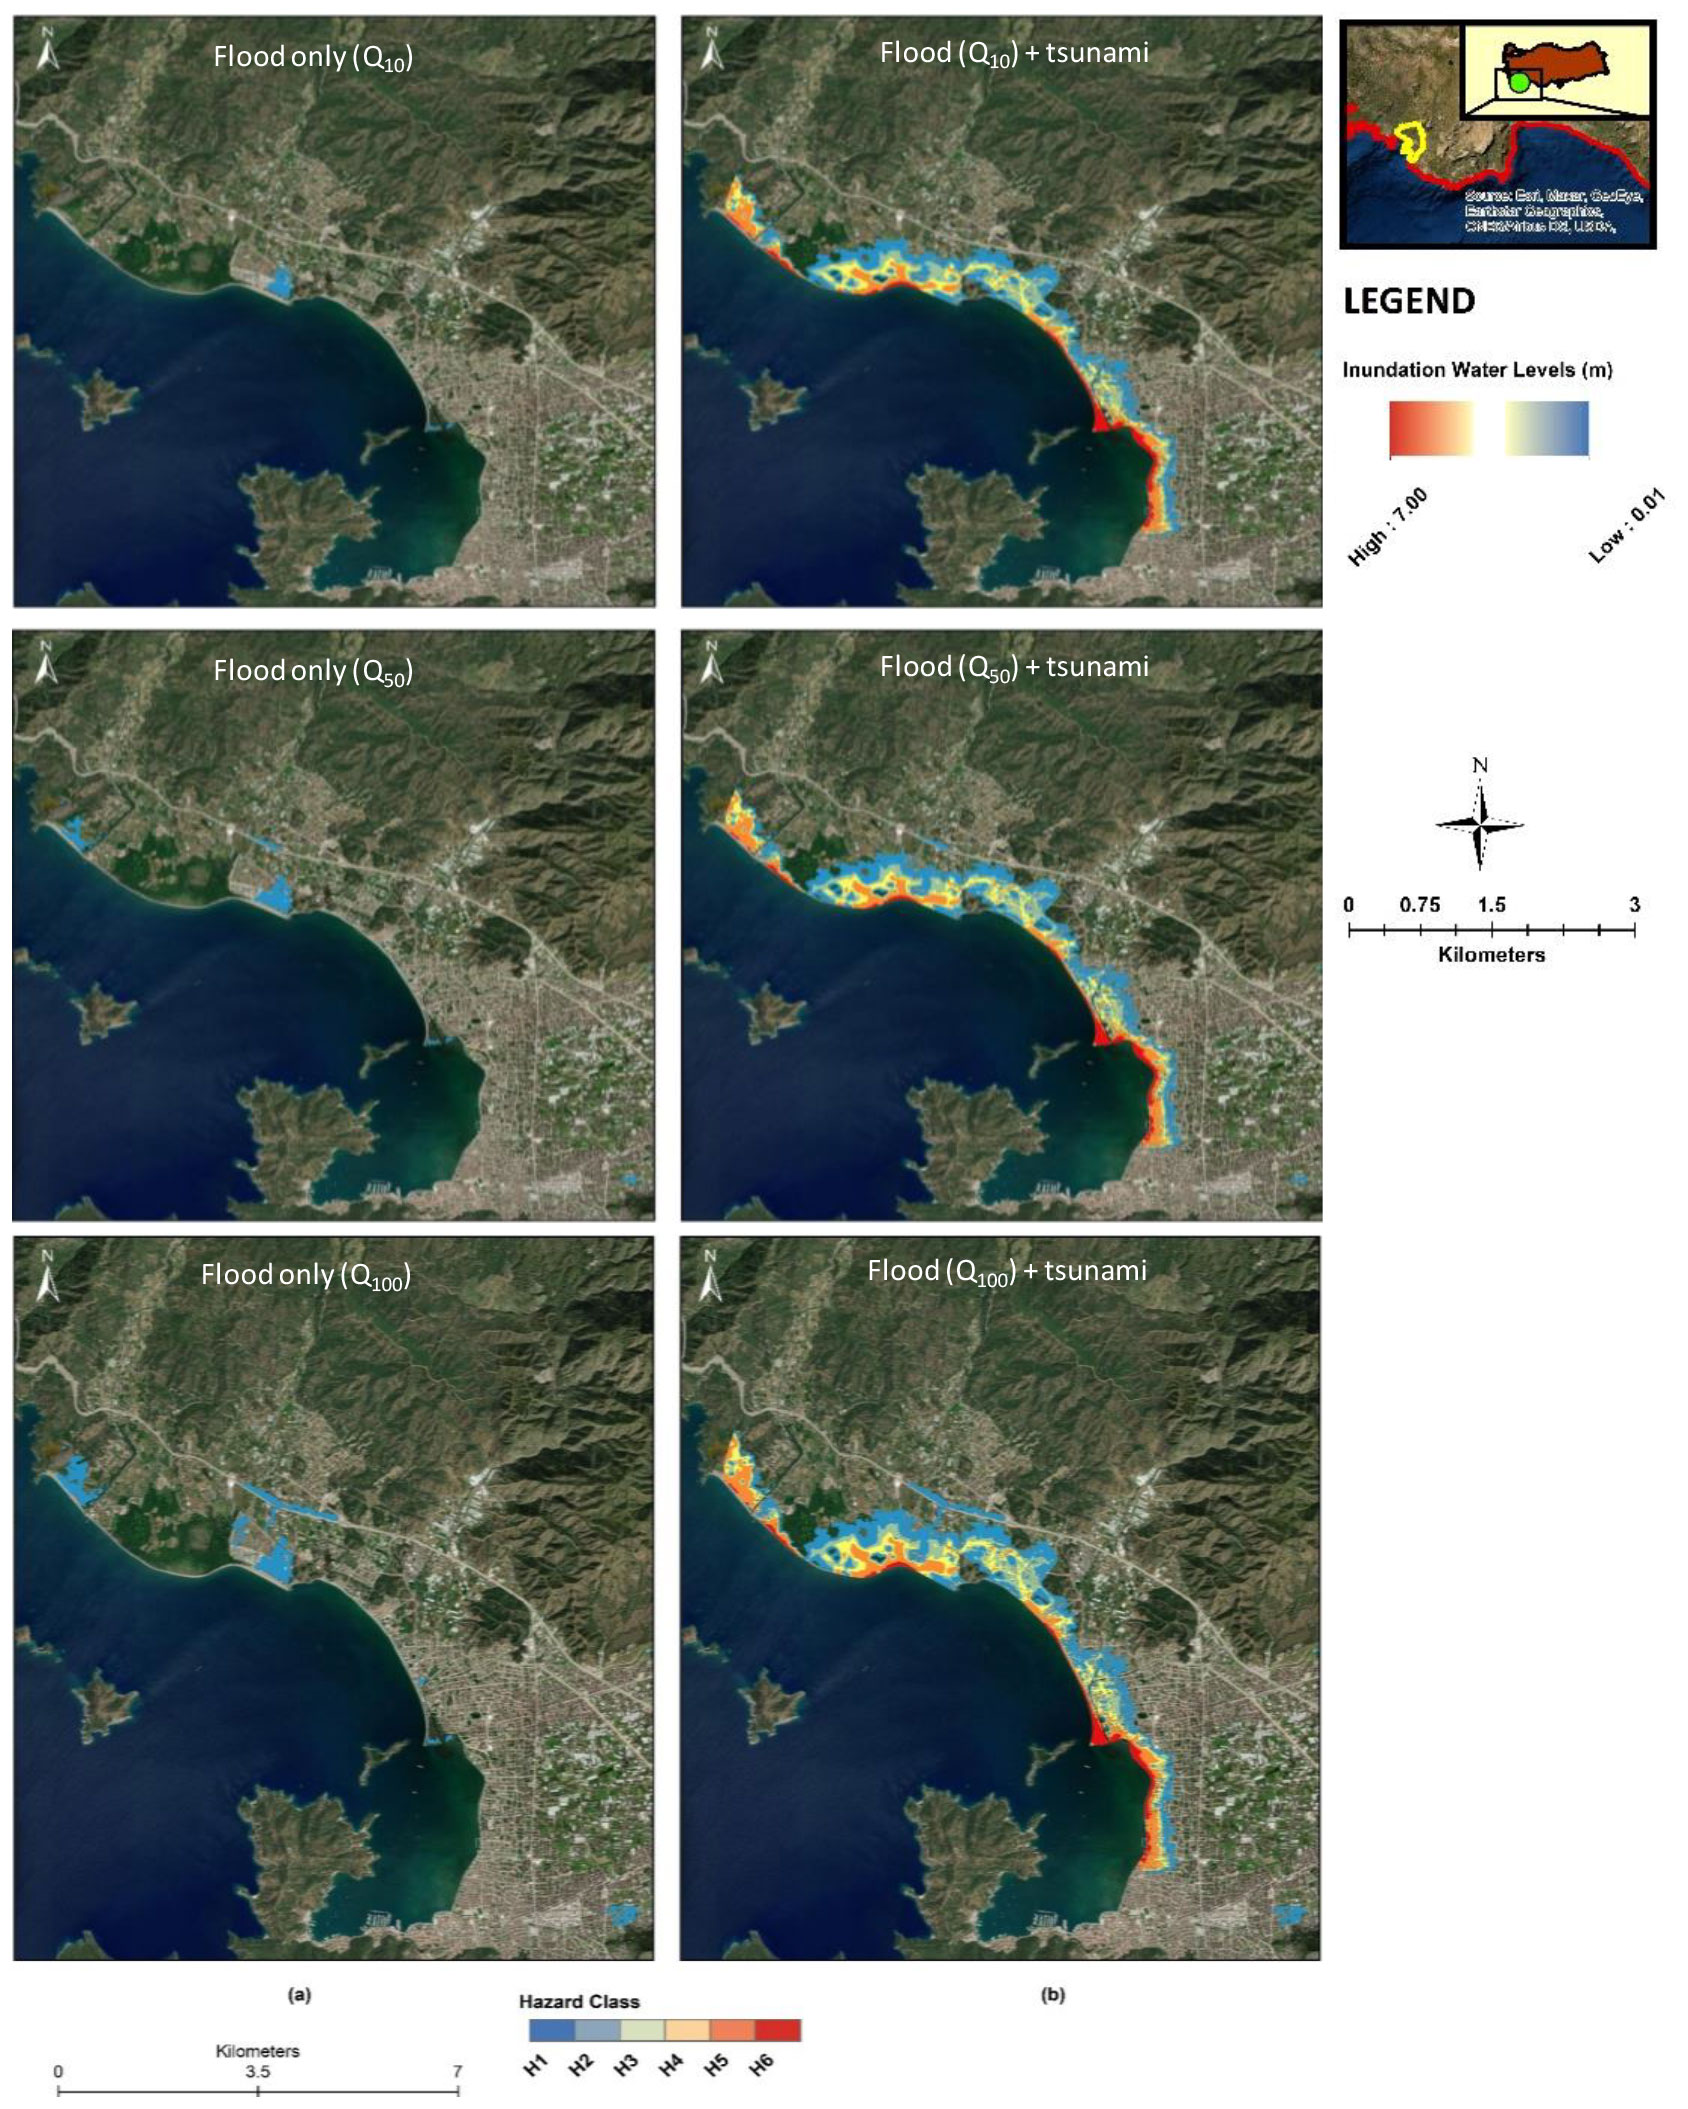
Figure 13Spatially varied hazard mapping for (a) flood only for Q10, Q50, and Q100 and (b) multi-hazard condition (i.e., flood+earthquake-triggered tsunami) (sources: Esri, Maxar, GeoEye, Earthstar Geographics, CNES/Airbus DS, USDA, USGS, AeroGRID, IGN, and the GIS User Community).
According to the hazard vulnerability classification proposed by Smith et al. (2014), all three flood events having different recurrence intervals (i.e., 10, 50, and 100 years) fall into the H1 hazard class, which can generate negligible adverse effects in some coastal parts of the city center. On the other hand, the fully developed flood events for all three recurrence intervals just after peak tsunami waves reach the coast resulted in varying hazard classes of H1 to H6. It should be noted that the major portion of the hazard is caused by the tsunami.
It can be seen from Fig. 13 that the inundated area is slightly enhanced due to the rate of change in flood discharges coming from the rivers. However, a huge portion of the hazard resulted from the effect of earthquake-triggered tsunamis. It can also be estimated that the rate of change in discharges coming from the rivers may also have some positive effect on the reduction in the additional adverse effect of multi-hazard conditions, due to encountered flows at the coastline.
Fluvial flood hazards having different recurrence intervals and potential earthquake-triggered tsunami hazards are simultaneously analyzed to evaluate the height of inundation levels at the coastline of Fethiye Bay and Fethiye city center. Results demonstrate that the majority of the increase in inundation levels is due to tsunami hazard. However, it should be emphasized that inundation levels are almost doubled in the presence of all flood hazard events at the same time. In the analyses, it is assumed that a fully developed fluvial flood takes place just after the peak tsunami waves hit the coastal region. Therefore, sea levels are determined accordingly for the hydraulic models.
Floods with 10-, 50-, and 100-year recurrence periods were taken into consideration in the study and potential hazards are calculated. Although it is more sophisticated to reduce the effects of tsunamis, the prevention of floods as well as their consequences are a more common procedure. Thus, combined risk analyses of multiple hazards should be taken into consideration in order to reduce risks due to natural disasters.
In conclusion, the coincidence of flood and tsunami events might be very unlikely. But the combination of these two hazards definitely increases the inundation levels and corresponding disaster levels in the selected region. Some other factors, such as seasonal changes in economic and social aspects, the expansion of residential sites, proximity to the fault zones, and climate change effects, should be taken into consideration in combined risk analysis for future years.
All raw data can be provided by the corresponding authors upon request.
CY and KY planned the scope of the study. The methodology was prepared by CY. Numerical simulations were conducted by CY, KY, and GO. The paper draft was written by CY and KY. CY reviewed and edited the paper based on the reviewers' comments.
The contact author has declared that none of the authors has any competing interests.
Publisher's note: Copernicus Publications remains neutral with regard to jurisdictional claims in published maps and institutional affiliations.
This article is part of the special issue “Coastal hazards and hydro-meteorological extremes”. It is not associated with a conference.
The authors express their appreciation to Ahmet Cevdet Yalciner and his colleagues for providing the NAMI DANCE software ver. 9.0 BETA for conducting tsunami simulations.
This paper was edited by Francisco Campuzano and reviewed by Lucy Bricheno and two anonymous referees.
Alfieri, L., Bisselink, B., Dottori, F., Naumann, G., de Roo, A., and Salamon, P.: Global projections of river flood risk in a warmer world, Earth's Future, 5, 171–182, https://doi.org/10.1002/2016EF000485, 2017.
Altinok, Y., Alpar, B., Özer, N., and Aykurt, H.: Revision of the tsunami catalogue affecting Turkish coasts and surrounding regions, Nat. Hazards Earth Syst. Sci., 11, 273–291, https://doi.org/10.5194/nhess-11-273-2011, 2011.
Barkey, R., Nursaputra, M., Mappiase, M. F., Achmad, M., Solle, M., and Dassir, M.: Climate change impacts related flood hazard to communities around Bantimurung Bulusaraung National Park, Indonesia IOP Conf. Ser., Earth Environ. Sci., 235, 1–12, 2019.
Blöschl, G., Hall, J., Parajka, J., Perdigão, R. A., Merz, B., Arheimer, B., Aronica, G. T., Bilibashi, A., Bonacci, O., Borga, M., Čanjevac, I., Castellarin, A., Chirico, G. B., Claps, P., Fiala, K., Frolova, N., Gorbachova, L., Gül, A., Hannaford, J., Harrigan, S., Kireeva, M., Kiss, A., Kjeldsen, T. R., Kohnová, S., Koskela, J. J., Ledvinka, O., Macdonald, N., Mavrova-Guirguinova, M., Mediero, L., Merz, R., Molnar, P., Montanari, A., Murphy, C., Osuch, M., Ovcharuk, V., Radevski, I., Rogger, M., Salinas, J. L., Sauquet, E., Šraj, M., Szolgay, J., Viglione, A., Volpi, E., Wilson, D., Zaimi, K., and Živković, N.: Changing climate shifts 305 timing of European floods, Science, 357, 588–590, 2017.
Bommer, J. J.: Uncertainty about the uncertainty in seismic hazard analysis, Eng. Geol., 70, 165–168, 2003.
Cardona, O. D., Ordaz, M. G., Marulanda, M. C., Carreño, M. L., and Barbat, A. H.: Disaster risk from a macroeconomic perspective: a metric for fiscal vulnerability evaluation, Disasters, 34, 1064–1083, https://doi.org/10.1111/j.1467-7717.2010.01183.x, 2010.
Carreño, M. L., Cardona, O. D., and Barbat, A. H.:Urban seismic risk evaluation: a holistic approach, Nat. Hazards, 40, 137–172, 2007.
Carter, J. G., Handley, J., Butlin, T., and Gill, S.: Adapting cities to climate change–exploring the flood risk management role of green infrastructure landscapes, J. Environ. Plann. Man., 61, 1535–1552, 2018.
Cita, M. B. and Rimoldi, B.: Geological and geophysical evidence for a holocene tsunami deposit in the eastern 315 Mediterranean deep-sea record, J. Geodynam., 24, 293–304, 1997.
Danish Hydraulic Institute (DHI): A modelling system for Rivers and Channels, MIKE 11 user guide, https://manuals.mikepoweredbydhi.help/2021/Water_Resources/Mike_11_ref.pdf (last access: 17 November 2022), 2016a.
Danish Hydraulic Institute (DHI): MIKE 21 flow model FM Hydrodynamic Module user guide, https://manuals.mikepoweredbydhi.help/2019/Coast_and_Sea/MIKE_FM_HD_2D.pdf (last access: 17 November 2022), 2016b.
Ferson, S.: What Monte Carlo methods cannot do? Human and Ecological Risk Assessment, Int. J., 2, 990–1007, 1996.
Fukao, Y.: Tsunami earthquakes and subduction processes near deep-sea trenches, J. Geophys. Res., 84, 2303–2314, https://doi.org/10.1029/JB084iB05p02303, 1979.
General Bathymetric Chart of the Oceans (GEBCO): Gridded bathymetry data, GEBCO [data set], https://www.gebco.net/data_and_products/gridded_bathymetry_data/, last access: 17 November 2022.
Goda, K. and Abilova, K.: Tsunami hazard warning and risk prediction based on inaccurate earthquake source parameters, Nat. Hazards Earth Syst. Sci., 16, 577–593, https://doi.org/10.5194/nhess-16-577-2016, 2016.
Hanks, T. C. and Kanamori H.: A moment-magnitude scale, J. Geophys. Res., 84, 2348–2350, 1979.
Helton, J. C., Johnson, J. D., Oberkampf, W. L., and Sallaberry, C. J.: Representation of analysis results involving aleatory and epistemic uncertainty, Int. J. Gen. Syst., 39, 605–646, 2010.
Gutenberg, B. and Richter, C. F. (Eds.): Seismicity of the Earth, Princeton University Press, Princeton, New Jersey, ISBN 9780598977205, 1954.
Hemmati, M., Ellingwood, B. R., and Mahmoud, H. N.: The role of urban growth in resilience of communities under flood risk, Earth's Future, 8, e2019EF001382, https://doi.org/10.1029/2019EF001382, 2020.
Horspool, N., Pranantyo, I., Griffin, J., Latief, H., Natawidjaja, D. H., Kongko, W., Cipta, A., Bustaman, B., Anugrah, S. D., and Thio, H. K.: A probabilistic tsunami hazard assessment for Indonesia, Nat. Hazards Earth Syst. Sci., 14, 3105–3122, https://doi.org/10.5194/nhess-14-3105-2014, 2014.
Jelínek, R., Krausmann, E., González, M., Álvarez-Gómez, J.A., Birkmann, J., and Welle, T.: Approaches for tsunami risk 335 assessment and application to the city of Cádiz, Spain, Nat. Hazards, 60, 273–293, 2012.
Kreibich, H., di Baldassarre, G., Vorogushyn, S., Aerts, J. C., Apel, H., and Aronica, G. T.: Adaptation to flood risk: Results of international paired flood event studies, Earth's Future, 5, 953–965, https://doi.org/10.1002/2017EF000606, 2017.
Kundzewicz, Z. W., Krysanova, V., Dankers, R., Hirabayashi, Y., Kanae, S., Hattermann, F. F., Huang, S., Milly, P. C. D., Stoffel, M., Driessen, P. P. J., Matczak, P., Quevauviller, P., and Schellnhuber, H. J.: Differences in flood hazard projections in Europe–their causes and consequences for decision making, Hydrolog. Sci. J., 62, 1–14, https://doi.org/10.1080/02626667.2016.1241398, 2017.
Lamond, J. E. Booth, C. A. Hammond, F. N. and Proverbs, D. G. (Eds.): Flood Hazards: Impacts and Responses for the Built Environment, CRC Press – Taylor and Francis Group, London, ISBN 9781439826256, 2011.
Lane, E. M., Gillibrand, P. A., Wang, X., and Power, W.: A probabilistic tsunami hazard study of the Auckland Region, Part II: inundation modelling and hazard assessment, Pure Appl. Geophys., 170, 1635–1646, 2013.
Løvholt, F., Glimsdal, S., Harbitz, C. B., Zamora, N., Nadim, F., Peduzzi, P., and Smebye, H.: Tsunami hazard and exposure on the global scale, Earth-Sci. Rev., 110, 58–73, 2012.
Løvholt, F., Glimsdal, S., Harbitz, C. B., Horspool, N., Smebye, H., De Bono, A., and Nadim, F.: Global tsunami hazard and exposure due to large co-seismic slip, Int. J. Disast. Risk Re., 10, 406–418, 2014.
Munich RE: Data on natural disasters since 1980, https://www.munichre.com/en/solutions/for-industry-clients/natcatservice.html, last access: 17 November 2022.
Nadim, F. and Glade, T.: On tsunami risk assessment for the west coast of Thailand, ECI conference on geohazards, Lillehammer, Norway, 18–21 June, https://dc.engconfintl.org/geohazards/28/ (last access: 17 November 2022), 2006.
Pamukçu, O., Doğru, F., Cirmik, A., and Göneş, D.: Seismic a and b-values and crustal parameters of Samos Island-Aegean Sea, Lesvos Island-Karaburun, Kos Island-Gökova Bay earthquakes, Turk. J. Earth Sci., 30, 833–850, 2021.
Papadopoulos, G. A.: Tsunamis in The Physical Geography of Mediterranean, edited by: Woodward, J. C., Oxford Univ. Press, Oxford, 493–512, ISBN 9780199268030, 2009.
Papaioannou, G., Efstratiadis, A., Vasiliades, L., Loukas, A., Papalexiou, S.M., Koukouvinos, A., Tsoukalas, I., and Kossieris, P.: An Operational Method for Flood Directive Implementation in Ungauged Urban Areas, Hydrology, 5, 24, https://doi.org/10.3390/hydrology5020024, 2018.
Qiang, Y.: Disparities of population exposed to flood hazards in the United States, J. Environ. Manage., 232, 295–304, 2019.
Skougaard Kaspersen, P., Høegh Ravn, N., Arnbjerg-Nielsen, K., Madsen, H., and Drews, M.: Comparison of the impacts of urban development and climate change on exposing European cities to pluvial flooding, Hydrol. Earth Syst. Sci., 21, 4131–4147, https://doi.org/10.5194/hess-21-4131-2017, 2017.
Slater L. J. and Villarini, G.: Recent trends in US flood risk, Geophys. Res. Lett., 43, 12428–12436, https://doi.org/10.1002/2016GL071199, 2016.
Smith, G. P., Davey, E. K., and Cox, R.: Water Research Laboratory Technical Report 07: Flood Hazard, University of South Wales, https://knowledge.aidr.org.au/media/2334/wrl-flood-hazard-techinical-report-september-2014.pdf (last access: 11 April 2022), 2014.
Sørensen, M. B., Spada, M., Babeyko, A., Wiemer, S., and Grünthal, G.: Probabilistic tsunami hazard in the Mediterranean Sea, J. Geophys. Res.-Sol. Ea., 117, B01305, https://doi.org/10.1029/2010JB008169, 2012.
Subyani, D., Daniels, Murray, A., and Kirsch, T. D.: The human impact of floods: a historical review of events 1980–2009 and systematic literature review, PLoS Curr., 5, 1–19, 2017.
SYGM: Taskin Yönetim Planları, https://www.tarimorman.gov.tr, last access: 4 April 2022.
Synolakis, C. E.: Green's law and the evolution of solitary waves, Phys. Fluids A, 3, 490–491, https://doi.org/10.1063/1.858107, 1991.
Szewrański, S., Chruściński, J., Kazak, J., Świąder, M., Tokarczyk-Dorociak, K., and Żmuda, R.: Pluvial Flood Risk Assessment Tool (PFRA) for rainwater management and adaptation to climate change in newly urbanised areas, Water, 10, 386, https://doi.org/10.3390/w10040386, 2018.
Takemura, M.: Scaling law for Japanese intraplate earthquakes in special relations to the surface faults and the damages, J-STAGE Earthquake Series 2, 51, 211–228, https://doi.org/10.4294/zisin1948.51.2_211, 1998 (in Japanese with English abstract).
TRANSFER Project: Tsunami risk and strategies for the European region, https://cordis.europa.eu/project/rcn/81399_en.html, last access: 17 November 2022.
USGS: What is it about an earthquake that causes a tsunami?, https://www.usgs.gov/faqs/what-it-about-earthquake-causes-tsunami#:~:text=Magnitudes between 7.6 and 7.8,tsunamis, especially near the epicenter, last access: 17 November 2022.
Velioglu, D., Kian, R., Yalciner, A. C., and Zaytsev, A.: Performance assessment of NAMI DANCE in tsunami evolution and currents using a benchmark problem, Journal of Marine Science and Engineering, 4, 49, https://doi.org/10.3390/jmse4030049, 2016.
Wolfgang, K.: Flood Risk = Hazard ⋅ Values ⋅ Vulnerability, Water Int., 30, 58–68, DOI:1080/02508060508691837, 2005.
Yavuz, C., Kentel, E., and Aral, M. M.: Tsunami risk assessment: economic, environmental and social dimensions, Nat. Hazards, 104, 1413–1442, https://doi.org/10.1007/s11069-020-04226-y, 2020a.
Yavuz, C., Kentel, E., and Aral, M. M.: Climate Change Risk Evaluation of Tsunami Hazards in the Eastern Mediterranean Sea, Water, 12, 2881, https://doi.org/10.3390/w12102881, 2020b.
Zaytsev, A., Kurkin, A., Pelinovsky, E., and Yalciner, A. C.: Numerical tsunami model NAMI DANCE, Science of Tsunami Hazards, 38, 151-168, ISSN:87556839, 2019.
Zhai, R., Tao, F., Lall, U., Fu, B. Elliott, J., and Jägermeyr, J.: Larger drought and flood hazards and adverse impacts on population and economic productivity under 2.0 than 1.5 ∘C warming, Earth's Future, 8, e2019EF001398, https://doi.org/10.1029/2019EF001398, 2020.