the Creative Commons Attribution 4.0 License.
the Creative Commons Attribution 4.0 License.
 | 17 Oct 2022
Real-time urban rainstorm and waterlogging disaster detection by Weibo users
Haoran Zhu
Priscilla Obeng Oforiwaa
Guofeng Su
With the process of urbanization in China, the urban waterlogging caused by rainstorms occurs frequently and often leads to serious damage to the natural environment, human life, and the city economy. Rapid detection of rainstorm and urban waterlogging disasters is an essential step to minimize these losses. Weibo, a popular microblog service in China, can provide many real-time Weibo posts for rapid detection. In this paper, we propose a method to identify microblogs with rainstorm and waterlogging information and apply them to waterlogging risk assessment. After pre-processing the microblog texts, we evaluate the performance of clustering (k-means) and classification (support vector machine, SVM) algorithms in the classification task. Apart from word vector features, we also introduce sentiment and publisher features for more real-time and accurate results. Furthermore, we build a waterlogging intensity dictionary to assess the waterlogging risk from the Weibo texts and produce a risk map with ArcGIS. To examine the efficacy of this approach, we collect Weibo data from two rainstorms and waterlogging disasters in Beijing city as examples. The results indicate that the SVM algorithm can be applied for a real-time rainstorm and waterlogging information detection. Compared to official-authentication and personal-certification users, the microblogs posted by general users can better indicate the intensity and timing of rainstorms. The location of waterlogging points is consistent with the risk assessment results, which proves our proposed risk assessment method can be used as a reference for timely emergency response.
- Article
(1112 KB) - Full-text XML
- BibTeX
- EndNote


Urban rainstorm waterlogging is a frequent occurrence all over China, resulting in serious damage to city safety and residents' daily lives (Yin et al., 2015). On 21 July 2012, a 100-year rainstorm swept Beijing. The rainstorm and waterlogging destroyed 10 660 houses, caused economic losses of up to CNY 11.64 billion, and caused the deaths of up to 79 people (The People's Government of Beijing Municipality, 2012). Such serious waterlogging disasters also occurred in Shanghai on 13 September 2013, in Guangzhou on 7 May 2017, and in Zhengzhou on 20 July 2021. To help government make timely responses and minimize loss of life and property caused by rainstorms, we should focus on urban rainstorms and waterlogging risk assessment, prevention, forecasting, and early warning.
Many factors work together in the formation of waterlogging, including rainstorms, terrain, drainage systems, the vegetation coverage rate, and so on (Zhang et al., 2020). Considering these features, many different models were constructed to simulate the submerged area and depth of different rainstorm return periods. A classic type is a hydrologic model, represented by the Storm Water Management Model (SWMM) (Bisht et al., 2016; Jiang et al., 2015; Rossman, 2010). The hydrologic model depends on the pipeline data and needs huge modelling and calculating resources, which limits its application. To make up for this setback, many simplified models have been developed (Quan, 2014; Lin et al., 2018; Tang et al., 2018). These models study the macroscopic relationship between factors and the waterlogging disasters instead of the detailed dynamic calculation and perform as well as the hydrologic models. In the early warning step, researchers focus more on the improvement of the government's management system and the building of physical sensor networks (Perera et al., 2020; Liu et al., 2014). However, these early warning systems require significant time and material costs. We need a faster and more convenient early warning method.
Compared to the physical sensors, Sakaki et al. (2010) promoted the concept of social sensors for earthquake detection in 2010. Social networks such as Twitter and Weibo are popular all over the world. As of March 2021, Weibo's monthly active users totalled 530 million, of which 94 % were mobile users. They are all real-time social sensors by sharing their experience on the Weibo site. Many disaster early warning studies were carried out on the analysis of Weibo's content (Choi and Bae, 2015; Avvenuti et al., 2015; Cao et al., 2017). By screening the keywords with supervised or unsupervised algorithms, we can quickly select and analyse the relevant microblog texts related to specific events. Most researchers have focused on earthquake disasters. The detection of urban rainstorm and waterlogging disasters is more complex. Nair et al. (2017) used naïve Bayes (NB) and random forest (RF) to detect the 2015 Chennai flood's effect on Twitter users and found that random forest was the best algorithm. Xiao et al. (2018) promoted an identification method of urban rainstorm waterlogging microblogs based on three supervised algorithms in 2018, for which the classification accuracy rate came up to 84 %. Unsupervised algorithms are also widely used in Weibo content processing (Gao et al., 2014; Wang et al., 2013), but there are few types of research discussing their applications in urban waterlogging disasters. The analysis of Weibo data also limits the word vector in most cases, without taking the features of emotion and publisher into account. Most of the previous studies separated the storm-related microblogs from general microblogs, while the emergency response needs to further separate the microblogs containing timely rainstorm information from the storm-related microblogs.
Rainstorms are predictable, but there are still uncertainties in time, space, and intensity. What is more, the secondary disaster following rainstorms, urban waterlogging, is hardly predictable. Based on the discussion above, the huge number of Weibo users can be regarded as social sensors, and there are time, location, and intensity information on ongoing disasters in their microblogs (Sakaki et al., 2010). By extracting appropriate features, we can select these disaster-related microblogs with classification algorithms such as support vector machine (SVM; Nair et al., 2017). These microblogs tell us the intensity of precipitation and the depth of waterlogging in different places at different times, which can help us identify spots of potential waterlogging.
This study takes two urban rainstorms and waterlogging disasters in Beijing as examples, promoting an integrated data-mining method for Weibo users. The primary objectives of our study are as follows: (1) to evaluate the role of publisher and sentiment features in a real-time rainstorm and waterlogging microblog information extraction, (2) to select the microblogs with real-time information, and (3) to produce a waterlogging risk assessment map of the microblogs with location information.
2.1 Study area
Beijing is located in the monsoon climate zone, and the sudden rainstorms often result in serious waterlogging disasters. The study area covers 16 410 km2 with 16 districts and is surrounded by mountains in the west, north, and northeast. Precipitation centres are distributed along the windward slopes of these mountains. The foothills of northern Beijing, the eastern slope and piedmont area of the Taihang Mountains, and the land–sea interface of Bohai Bay contribute to the formation of short-duration heavy rainfall (SDHR), which, along with other climate factors (Cheng et al., 2021), makes urban rainstorm and waterlogging early warning more difficult. The monsoon season in Beijing spans from June through September. After the serious rainstorm and waterlogging disaster on 21 July 2012, the government identified 64 waterlogging vulnerable points. However, with the development of urbanization, every time there is a rainstorm, there are new spots of waterlogging. Compared to relying on experience, rapid detection of waterlogging points in a rainstorm is a better solution.
2.2 Data collection
We chose two heavy rainstorms, for which the Beijing Emergency Management Bureau issued an orange alert, in Beijing on 12 August 2020 (case A) and 18 July 2021 (case B) as case studies. We extracted Weibo texts about disaster situations based on the keywords “Beijing” and “rainstorm” as a preliminary selection. In case A, meteorological information showed it was going to be the heaviest precipitation in Beijing since 2012, so the warning was issued 24 h before the precipitation. We extracted 19 791 Weibo data points in 48 h from 00:00 (all times are given in local time) on 12 August 2020 to 23:59 on 13 August 2020. In the case B, we extracted 2840 Weibo data points in 36 h from noon on 17 July 2021 to 23:59 on 18 July 2021. The data included text, user information, release time, and release type (post or repost).
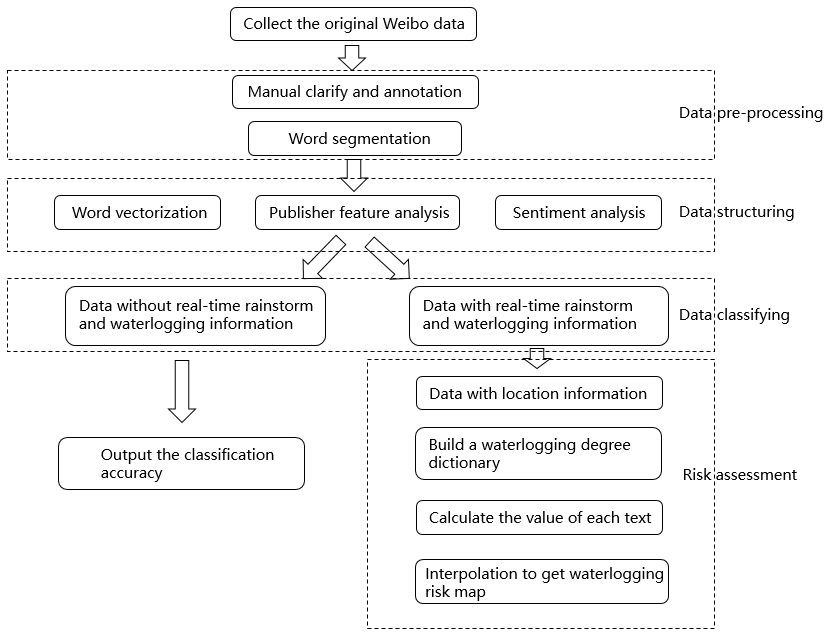
Text is typical unstructured data with complex features. After pre-processing, we can obtain the basic unit of text, the words. Compared with other features, words are more ambiguous and changeable with the context. What is more, the microblogs always have a character limitation of 140 characters. To better understand the information in microblogs to classify them, we introduced more features apart from the words, e.g. the publisher and sentiment features. Some microblogs contain location information by mentioning area names in the text or choosing to show their current location when posting. These microblogs are more accurate sensors, which aid in the accurate estimation of the spatial distribution of precipitation and waterlogging instead of only time distribution. The overall processing framework is shown in Fig. 1.
3.1 Data pre-processing and structuring
3.1.1 Manual clarity and annotation
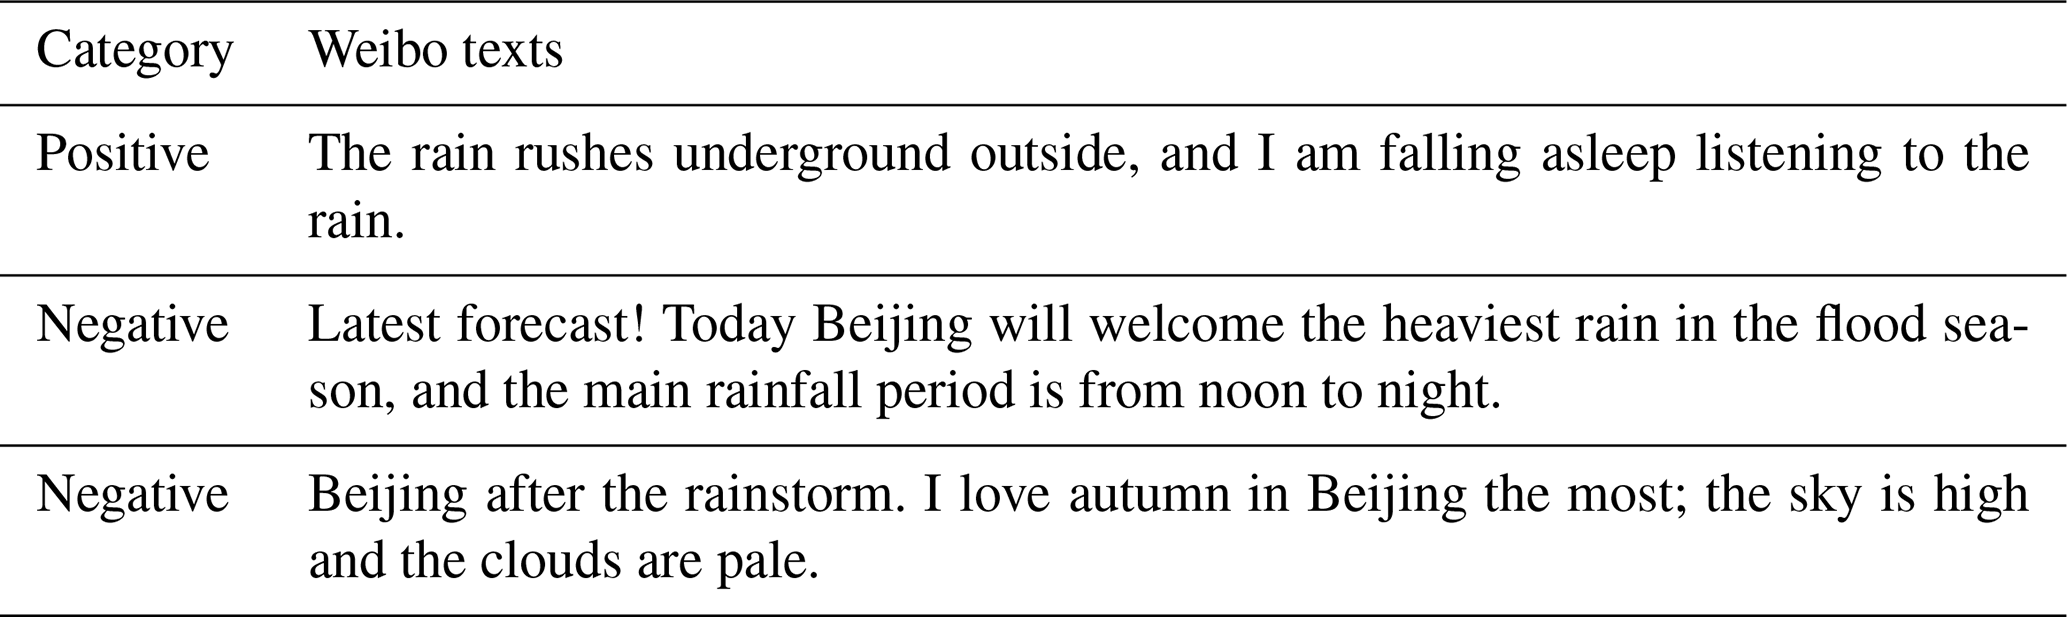
Uncertainties and errors are inherent in data derived from social sensors such as Weibo users. There is an assumption that if a microblog is reposted, it is more likely to carry outdated information. There is typically a time lag between the release time of the microblog and the disaster situation described. For the original microblogs, we can infer the time lag from the words such as now, just, and so on. However, in the case of reposted microblogs, there is an extra time lag for the second user to notice the microblog, so we eliminate all the reposted microblogs. In supervised algorithms, the label of each text must be given for model training. A text carrying information related to a rainstorm is a broad concept, including for example forecasting and warning messages from the meteorological department before the rainstorm and the sharing of a particular view from general users after the rainstorm. Microblogs with such information tend to be classified into a positive category in many studies. However, these microblogs contain advanced or lagging information, which contributes little to current risk assessment and early warning. In our experiments, timeliness is as important as disaster description. The microblogs with a description of a real-time urban rainstorm and waterlogging disaster are marked as positive categories with the label 1. Others are negative with the label 0. Now we transform the text classification problem into a binary classification one. Table 1 shows an example of annotation.
Table 1Examples of positive (with timely disaster situation) and negative (without timely disaster situation) Weibo texts.
3.1.2 Word segmentation
Compared to English, word segmentation is more complex in Chinese as there is no separation between characters. The segmentation steps are as follows.
Filtering the Chinese characters. Most of the segmentation modules support only one language, while there are many English or special symbols in the text. In this paper, we used a regular expression to filter the text first.
Removing the Weibo topic tags. To make it more convenient for the public to participate in the discussion, Weibo gives every topic a tag with the format of “##”, for example “#Beijing rainstorm#”. Many microblogs have three or four tags, and we should remove them for less distortion. Stop words are functional words that have no concrete meaning, e.g. conjunctions, prepositions, and interjections. In many studies, stop vocabularies were created to remove these words. However, we did not eliminate the stop words in this paper as many stop words could help us understand the time information in Weibo texts.
Word segmentation. In this paper, we introduced the Jieba segmentation module for word segmentation, which is based on word frequency statistics to segment Chinese words.
Weight calculation. We obtained the word vector representation of every text after word segmentation, but each word had a different weight. Term frequency–inverse document frequency (TF-IDF) is a popular method for determining weights. The basic idea is the fewer the words appear, the more important it is in this document. The calculation formula is
in which the ni,j represents the number of occurrences of the word i in document j, ∑knkj represents the total number of words in document j, D represents the total number of documents, and represents the number of documents with the word i.
Sentiment analysis. Traditional sentiment analysis only focuses on sentimental words, degree adverbs, and negative words, while another method states that every word contributes to the sentiment value. We prefer the second method. In this paper, we use the Boson dictionary for sentiment analysis by BosonNLP Company, which gives the sentiment value of each word.
3.2 Data classifying and effect evaluation
On the selection of the word vector weight, the term frequency (TF) performed better than the TF-IDF. There were many kinds of expressions when talking about rainstorm information, and TF-IDF might exaggerate the weight of specific expressions and make it difficult for the algorithm to learn. On the selection of the classification model, there are two commonly used classification models: clustering methods and supervised methods. We introduce the k-means algorithm representing the clustering method and the SVM algorithm representing supervised methods and then apply them to the classification task and evaluate the accuracy. A brief introduction of the two methods is given below.
3.2.1 The k-means clustering algorithm
The k-means clustering analysis is a simple and commonly used clustering algorithm based on the squared-error criterion which is over 50 years old (MacQueen, 1967). The k-means algorithm can process the original data with weak regularity and form the initial classification with certain regularity. This algorithm divides n samples into k categories as the squares within the group are fewer than the squares between groups. In the k-means method, the position of clustering centres and the number of categories determine the clustering accuracy. For the first problem, we randomly initialize the initial clustering centres multiple times and take the mean to avoid the results falling into local extrema. For the latter problem, the method of a sum of the squared errors (SSE) and silhouette coefficient are popular for this task. In the SSE method, the point with the highest decreasing rate corresponds to the optimal number of categories, so the SSE method is also called the elbow law. In the silhouette coefficient method, the point with the highest value corresponds to the optimal number of categories.
3.2.2 The SVM clustering algorithm
SVM is a linear classifier defined in feature space with the largest interval, which distinguishes it from a perceptron. With the help of different kernel functions, it can also handle the nonlinear problem. In the case of low dimensional or sparse features, SVM performs as well as a deep learning network and has a faster processing speed. As a supervised method, the model studied from the training set is verified with the test set to illustrate the overfitting and underfitting problems in the process. We then choose a better combination of the penalty (trial) parameter C and the type of kernel for better results. There are two most common classification kernels in SVM. The linear kernel achieved a higher score in precision and selected more correct microblogs, while the Gaussian kernel performed better in the recall rate index and made fewer mistakes. In our experiments, we chose the linear kernel for better performance in precision for the larger number of correct microblogs.
3.2.3 Effect evaluation index
There are four possible classification situations: predict a positive sample as positive (TP), predict a positive sample as negative (FN), predict a negative sample as positive (FP), and predict a negative sample as negative (TN). Based on these four indicators, we further give three global indicators.
Precision represents the proportion of original positive samples in the samples judged positive by the classifier, which can be calculated by
The recall ratio represents the proportion of the positive samples judged correctly by the classifier in the positive samples, which can be calculated by
The F score balances the precision and recall ratio by parameter β, which can be calculated by
The value of β represents the relative importance of precision and the recall ratio. If β>1, the recall ratio is more important; if β<1, the users focus more on the precision. In this paper, we chose β's value as 1.
3.3 Risk assessment
Some microblogs contain location information by mentioning place names in the text or choosing to show their current location when posting, which makes it possible to assess the spatial distribution of waterlogging risk. The risk assessment steps are as follows.
Extracting location information. As mentioned above, there are two types of location information. If the users choose to show their current location when posting microblogs, the location information can be extracted while extracting the microblog texts. In a situation where the location has mentioned in the text, we build a dictionary of location names in Beijing to obtain the location information. However, the dictionary can only be accurate up to the street name rather than the buildings. Therefore, we mainly depend on the current location shown by the users.
Assessing the waterlogging risk in a single microblog. In this paper, we proposed that the waterlogging risk consists of three types of information: the quantity of rain, the duration, and the description of the current accumulation of water. If the rain is heavier and the duration is longer, then the current accumulation of water is more serious. We consider the waterlogging risk in this region to be higher.
In this study, we built an intensity dictionary for extracting the three types of information out of the text and the risk assessment. The dictionary contained three types of words shown in Table 2.
Table 2The intensity dictionary for assessing waterlogging risk.

We divided the texts with precipitation and time information into three categories. From values 0 to 2, the risk of waterlogging was low, medium, and high. When it came to the waterlogging information, the precipitation had exceeded the drainage capacity, so the degree started from value 1. Adding the three degrees together, we gave the waterlogging risk value in different blocks. As there were three indexes and a value of 1 represents a moderate risk in each index, we assumed that areas with a value greater than 3 had a high risk of waterlogging.
Assessing the spatial distribution of waterlogging risk. Combining the risk value and location information, we obtained the isolated risk point on the map. With the use of interpolation, we obtained the spatial distribution of waterlogging risk on the map. In this paper, we applied the inverse distance weighted (IDW) method and the local polynomial method (Caruso and Quarta, 1998) for comparison. IDW interpolation implements a basic law of geography; i.e. things that are close to one another are more alike than things that are far apart. All the distances have the same power, which is 2 in this paper. The polynomial interpolation assumes that every point on the surface conforms to some polynomial formula. Global methods use all the known values to estimate an unknown one, while in local methods only a specified number of nearest neighbours are used. We chose the local method as the area in our research contains six districts and the terrain might be different. To avoid the violent fluctuation of value caused by overfitting, we chose a power of 1 in this method.
The experiment used the Windows 10 operating system and ran programs in the Python 3.9 environment. We mainly applied the Jieba and scikit-learn packages in the data processing. The spatial distribution of waterlogging risk was calculated and drawn by ArcGIS.
In the pre-processing step, we first iterated over all the microblog text and built a bag of words with 22 692 words. Then we performed word segmentation on each microblog and recorded the number of occurrences of each word and the location of the word. We introduced the sparse matrix into this process for rapid calculation, which enabled the conversion of the microblog into a vector with 22 692 dimensions. Then we calculated the sentiment value of each microblog by the Boson dictionary. If the value was greater than zero, it was recorded as a positive sample with label 1. Others were recorded as negative samples with label 0. We combined them to obtain a vector with 22 693 dimensions for further classification.
4.1 k-means clustering results
In the case of A, we extracted 19 791 Weibo data points in the 48 h from 00:00 on 12 August to 23:59 on 13 August. After filtering out the repost and repeat microblogs, 9951 Weibo data points remained. We considered the category of Weibo data with timely rainstorm information to be positive and the others to be negative. By manual annotation, there were 7410 negative and 2541 positive categories in the case of A. Firstly, we applied the word segmentation process in Weibo data and converted the text into word vector representation. Then we introduced the SSE and the silhouette coefficient method for determining the optimal number of categories. To avoid falling into local extremes, we randomized the initial centre points 20 times and took the mean value in both methods.
As shown in Fig. 2, there were some puzzles across the two methods. For the silhouette coefficient, seven seemed to be the most appropriate number of categories. However, the elbow law illustrated that two was the best, followed by three. This situation illustrated the uncertainty of k-means clustering. Bo (2018) once applied the k-means method to the classification of earthquake microblogs and found that the subjects of social media information were always mixed. Considering both methods, we chose the number of categories to be two.
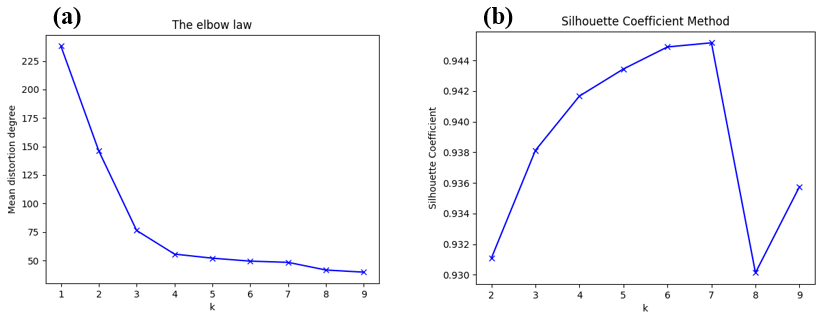
Figure 2Evaluation for different number of categories using k-means analysis by the elbow law and silhouette coefficient method.
A comparison of the positive proportion between the three groups is shown in Table 3.
Table 3Comparison of positive and negative proportions between three groups (unit %).
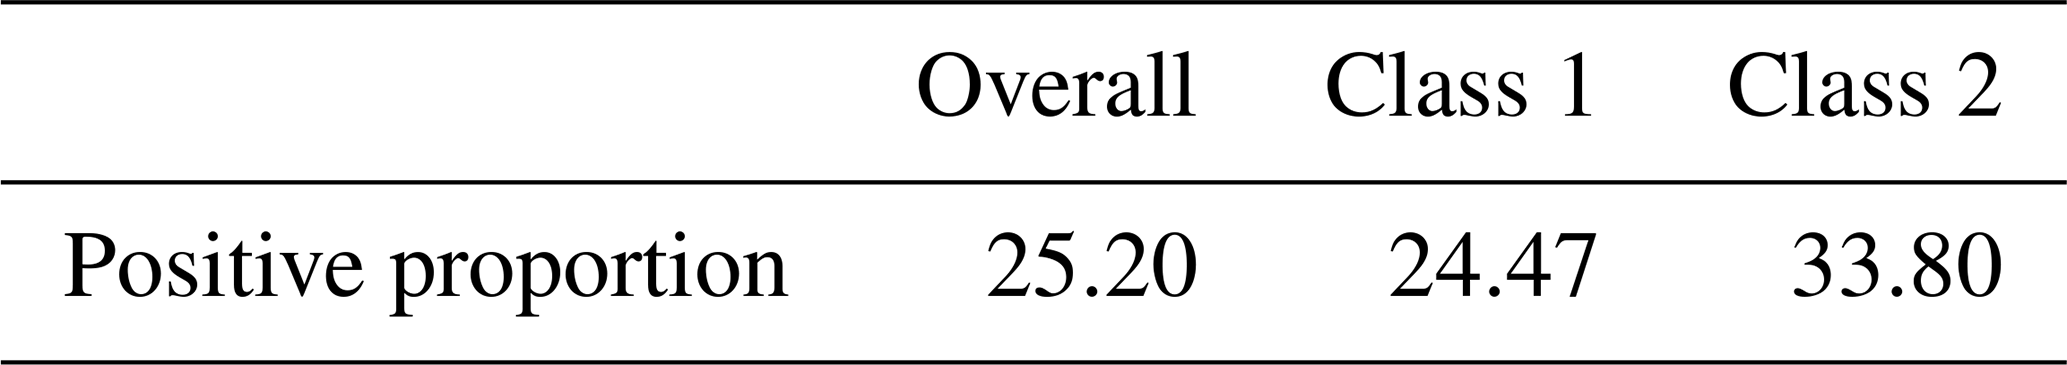
It can be seen from the comparison that the k-means method did not distinguish the text with or without the disaster information. Actually, in the classification task with multidimensional features, the k-means method usually returned a poor performance. It was more suitable for fixed and fewer features, for example, the clustering of geographical locations of disaster information (Lu and Zhou, 2016).
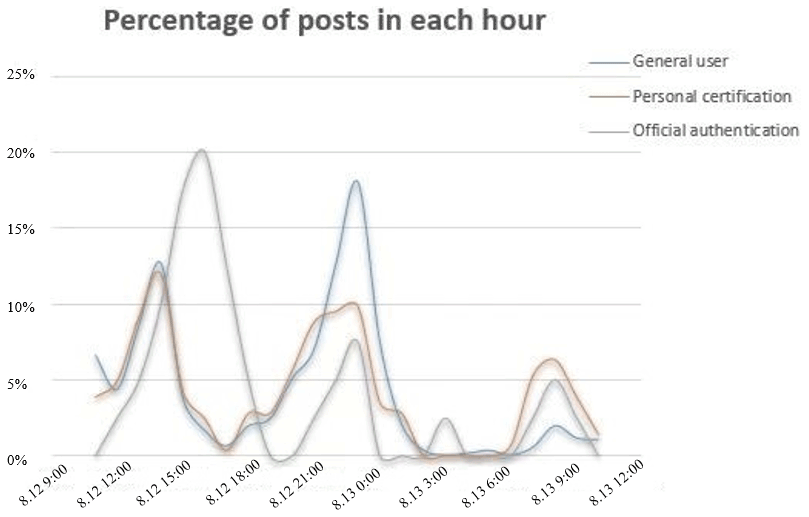
Figure 3Ratio of hourly microblog posts to the total for three types of publisher. Time is given in the format month.day hour:minute (local time).
4.2 Sentiment features, publisher features, and the SVM classification results
Unlike earthquakes, whilst spatially and temporally uncertain, a rainstorm is predictable. Thus, there are many types of information about the rainstorm disaster, for example, warning news before the storm, doubts about the forecast, and rescue reports after the storm. Such information should be separated from real-time rainstorm information as it contributes little to real-time disaster assessment and early warning. In this paper, we improved the extraction results of a rainstorm and waterlogging information in two aspects.
-
More real-time information. Real time had two concepts: extraction of the information more quickly and the information description of the situation shortly before its occurrence
-
Migratory validation. The training set and test set did not come from the same disaster as the high-frequency words vary from case to case.
We introduced sentiment analysis into the classification process. By manual annotation, we first divided the data into two categories according to whether they carried real-time rainstorm information or not. In the category with useful information, the proportion of negative microblogs was 55.42 %, while in the other category, the number was 44.85 %. We further separated the waterlogging microblogs from the rainstorm ones. In the waterlogging category, the proportion of negative microblogs was 70.12 %. This difference in sentiment values could help us better classify rainstorm and waterlogging information. In sentiment analysis, if the sentiment value was greater than 0, the text was marked as 1. The others were marked as 0.
We imported data from case A as a training set and data from case B as a test set. In comparison, we also set an experiment with 80 % of the samples in case A as a training set and 20 % of the samples in case A as a test set. By manual annotation, there were 2541 positive and 7410 negative categories in case A and 710 positive and 971 negative categories in case B. The experimental results are shown in Table 4.
Table 4Comparison of the macro-average indicators in two situations (unit %).
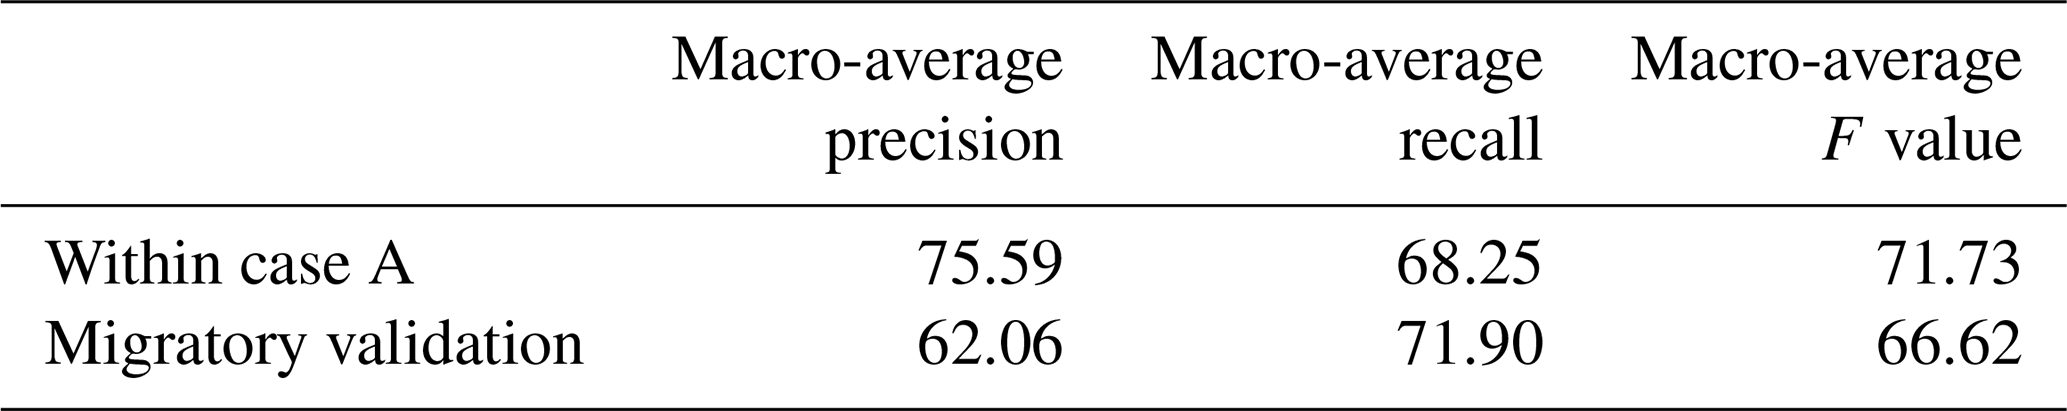
From the table above, we can obtain a higher accuracy within one disaster data group. In migratory validation, the accuracy would be slightly worse, but it could be further improved with a larger training set. In the experiments, it was especially difficult to classify short texts with fewer than 10 words. People usually used some objects to represent rainstorms and waterlogging, such as shoes or windows, which rarely appeared in our training set. This situation reduced the accuracy of the classification. Overall, it showed the feasibility of being applied in practice that we can further separate the real-time disaster information from all the disaster-related texts in such predictable disasters.
There were three types of publisher on the Weibo platform: official authentication, personal certification, and the general user. Previous studies have considered that information from three types of publisher is equally valuable (Xiao et al., 2018), while we discuss their difference in timeliness in this part. We counted the number of microblogs on rainstorms and waterlogging posted by three types of user in each hour from 11:00 on 12 August to 11:00 on 13 August. As the numbers of each publisher type were different, we calculated the percentage of posts in each hour for different types. The results are shown in Fig. 3.

Figure 4Annotation of the waterlogging microblogs with location information and risk value on the original map.
There were two large-scale precipitation events in this period. The one with less rainfall lasted from 11:00 to 14:00. The other heavy precipitation lasted from 21:00 to early morning the next day. For the peak position, there was a lag of about 1 h for official-authentication users, which means that their microblogs might have contained outdated information. For the peak height, the number of microblogs posted by the general users was positively correlated with precipitation. Therefore, when we used social network data to evaluate the degree of urban rainstorms and waterlogging disasters, much attention might be paid to the microblogs of general users.
4.3 Waterlogging risk assessment and map labelling
We were concerned about the location of waterlogging points in an urban rainstorm and waterlogging disaster, which was hard to obtain. We often used precipitation to estimate the depth of water in different blocks. By analysing the word frequency of the microblogs with a description of a rainstorm and waterlogging disasters, we built a dictionary for waterlogging point detection. In the case of A, we selected 269 microblogs with location information. Through the open platform of Baidu Maps, we obtained the latitude and longitude of each point. We mark them on the map by ArcGIS in Fig. 4.
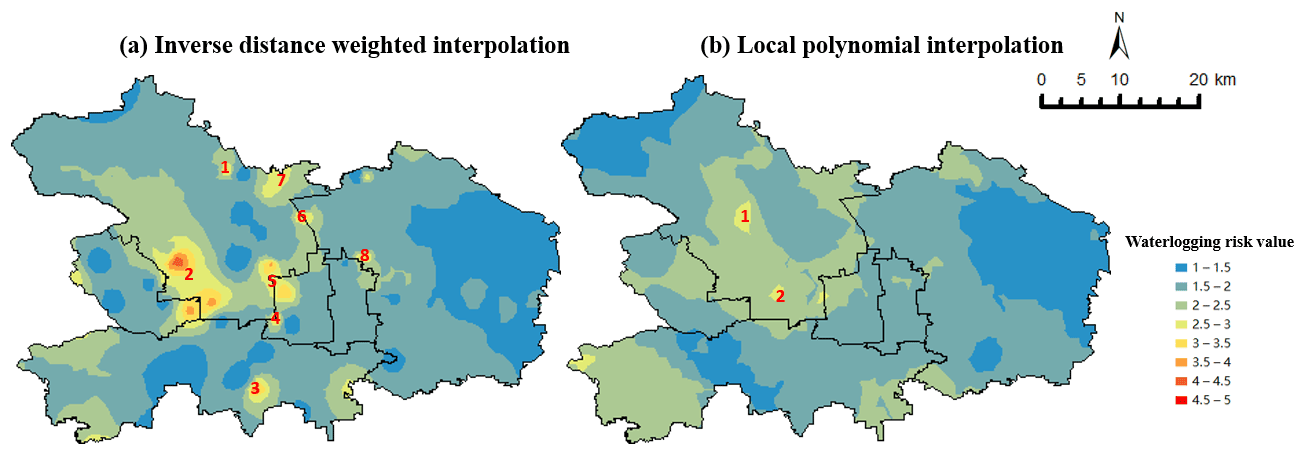
Figure 5Waterlogging risk assessment map by inverse distance weighted method and local polynomial method.
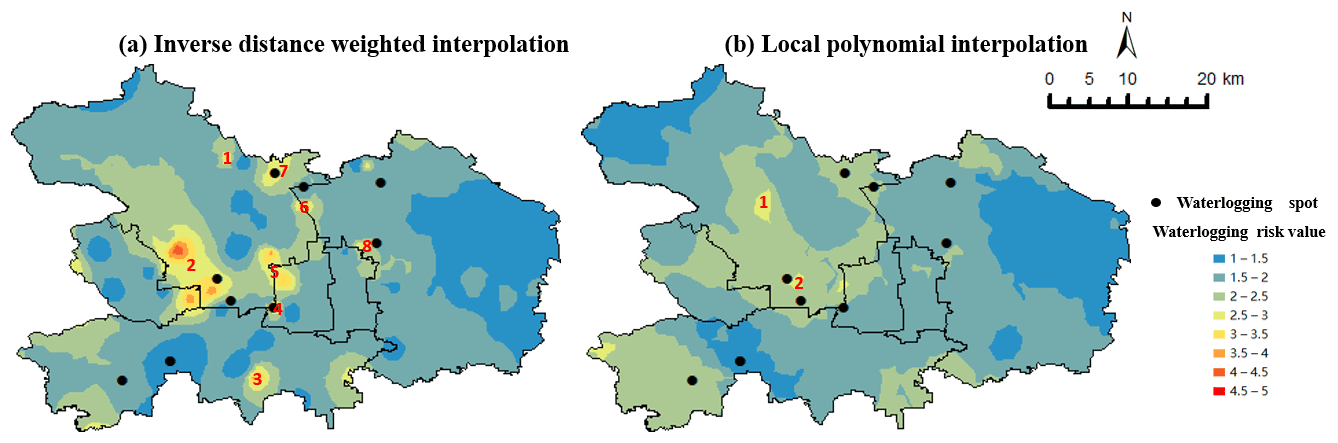
Figure 6Annotation of the waterlogging points on the risk assessment map.
It can be seen from Fig. 4 that most microblog locations were concentrated in the core urban area of Beijing. We chose Haidian District, Chaoyang District, Dongcheng District, Xicheng District, Shijingshan District, and Fengtai District as examples where the microblogs with location information were concentrated. And we showed the interpolation results in the form of a map, the risk assessment map.
Figure 5 shows that the inverse distance weighted method could achieve more discriminative results than the local polynomial method, which made it easier to identify the key areas for emergency response. In the map of the inverse distance weighted method, there were mainly eight areas with a risk value higher than 3, and we marked them on the map from numbers one to eight. Compared with the local polynomial method, the high-risk areas from the inverse distance weighted method were larger and more dispersed. To compare the accuracy of the two methods, we found the waterlogging point information in the six districts in reports (Beijing Daily, 2020). The annotation results are shown in Fig. 6.
We can conclude from Fig. 6 that the inverse-distance function was better. Of the total nine waterlogging points, four were in the area with a value over 3, located in Zone 2, Zone 4, Zone 6, and Zone 7. Three points were in the local extreme area, located in Zone 4, Zone 7, and Zone 8. What is more, in eight areas with a greater risk of waterlogging, four had waterlogging points, including Zone 2, Zone 4, Zone 6, and Zone 7. This shows that the high-risk areas of waterlogging obtained from Weibo texts with location information were certainly accurate. We can also notice that some waterlogging points were located in the low-risk area. The first reason for this is that the conditions for the formation of waterlogging were complex, including, in addition to precipitation, topography, drainage systems, and other factors. Another reason is the limit on the number of microblogs, which led to inaccurate assessments in marginal areas. Compared to deep learning, the calculation process of SVM and inverse distance weighted interpolation is not complicated, which ensures the timeliness of the model's results. The results show that social media users, as social sensors, do not just transmit yes or no information. Instead, we can dig out more detailed information such as intensity by quantifying keywords related to emergency management.
This paper proposed a social network data analysing model for an urban rainstorm and waterlogging disaster risk assessment and real-time detection. The novelties of this study lay in three main aspects. First, we screened microblogs with timely disaster situations from all disaster-related microblogs. Unlike earthquakes, rainstorms were predictable. Therefore, many users might express their concerns or expectations about the rainstorm through microblogs which carry little useful timely disaster information. Based on the word and sentiment vector, we could further separate the microblogs with timely disaster information. The classification accuracy in the same case reached 71.73 % and 66.62 % in different cases. Second, from the perspective of publisher features, general users published the timeliest disaster information, while there was usually a delay for personal-certification and official-authentication users' microblogs. This result showed that researchers should pay more attention to microblogs by general users when it comes to determining the starting time. Third, in the selected microblogs, we built an urban rainstorm and waterlogging disaster intensity dictionary for waterlogging risk assessment. By analysing the disaster levels of different microblogs, we obtained a real-time risk assessment map by ArcGIS and inverse distance weighted interpolation for emergency management and early warning. The waterlogging spots summarized in the report verified the model's accuracy. Social media users, as social sensors, did not just transmit yes or no information. Instead, we could dig out more information such as heightened stress on emergency management during flooding.
In future work, we will attempt to build a larger urban rainstorm and waterlogging text database for higher accuracy in classification results. In word segmentation, we focus on reducing the dimensionality of word vectors by more accurate part-of-speech tagging for rapid classification.
The data and code used in the study are available at https://github.com/zhr-thu/Real-time-urban-rainstorm-and-waterlogging-disasters-detection-by-Weibo-users (last access: 29 August 2022; https://doi.org/10.5281/zenodo.7097379, zhr-thu, 2022).
HZ and GS conceived the research framework and developed the methodology. HZ was responsible for the code compilation and data analysis. HZ and POO did the first-draft writing. GS managed the implementation of research activities. HZ and POO revised the manuscript. All authors discussed the results and contributed to the final version of the paper.
The contact author has declared that none of the authors has any competing interests.
Publisher's note: Copernicus Publications remains neutral with regard to jurisdictional claims in published maps and institutional affiliations.
This article is part of the special issue “Advances in flood forecasting and early warning”. It is not associated with a conference.
This research has been supported by the National Key Research and Development Program of China (grant no. 2018YFC0807000).
This paper was edited by Dapeng Yu and reviewed by two anonymous referees.
Avvenuti, M., Del Vigna, F., Cresci, S., Marchetti, A., and Tesconi, M.: Pulling information from social media in the aftermath of unpredictable disasters, in: 2015 2nd International Conference on Information and Communication Technologies for Disaster Management (ICT-DM), 258–264, Rennes, France, 30 November–2 December 2015, IEEE, https://doi.org/10.1109/ict-dm.2015.7402058, 2015.
Beijing Daily: Beijing lifts rainstorm warning, https://weibo.com/6215401356/JfG8swIOQ (last access: 29 August 2022), 2022.
Bisht, D., Chatterjee, C., Kalakoti, S., Upadhyay, P., Sahoo, M., and Panda, A.: Modeling urban floods and drainage using SWMM and MIKE URBAN: a case study, Nat. Hazards, 84, 749–776, https://doi.org/10.1007/s11069-016-2455-1, 2016.
Bo, T.: Application of earthquake disaster data mining and intensity rapid assessment based on social media, Institute of Engineering Mechanics, China Earthquake Administration, https://kns.cnki.net/KCMS/detail/detail.aspx?dbname=CDFDLAST2022andfilename=1019239057.nh (last access: 29 August 2022), 2018.
Cao, Y. B., Wu, Y. M., and Xu, R. J.: Research about the Perceptible Area Extracted after the Earthquake Based on the Microblog Public Opinion, J. Seismol. Res., 40, 303–310, 2017.
Caruso, C. and Quarta, F.: Interpolation methods comparison, Comput. Math. Appl., 35, 109–126, https://doi.org/10.1016/S0898-1221(98)00101-1, 1998.
Cheng, C., Li, Q., Dou, Y., and Wang, Y.: Diurnal Variation and Distribution of Short-Duration Heavy Rainfall in Beijing–Tianjin–Hebei Region in Summer Based on High-Density Automatic Weather Station Data, Atmosphere, 12, 1263, https://doi.org/10.3390/atmos12101263, 2021.
Choi, S. and Bae, B.: The real-time monitoring system of social big data for disaster management, in: Computer science and its applications, edited by: James, J., Ivan, S., Hwa, Y., and Gangman, Y., Springer, Berlin, Heidelberg, https://doi.org/10.1007/978-3-662-45402-2_115, 809–815, 2015.
Gao, Y., Guo, W., Zhou, H., and Nie, Z.: Improvements of personal weibo clustering algorithm based on K-means, Microcomput. Appl., 33, 78–81, 2014.
Jiang, L., Chen, Y., and Wang, H.: Urban flood simulation based on the SWMM model, Proc. IAHS, 368, 186–191, https://doi.org/10.5194/piahs-368-186-2015, 2015.
Lin, T., Liu, X., Song, J., Zhang, G., Jia, Y., Tu, Z., Zheng, Z., and Liu, C.: Urban waterlogging risk assessment based on internet open data: A case study in China, Habitat Int., 71, 88–96, https://doi.org/10.1016/j.habitatint.2017.11.013, 2018.
Liu, Y., Du, M., Jing, C., and Cai, G.: Design and implementation of monitoring and early warning system for urban roads waterlogging. In International Conference on Computer and Computing Technologies in Agriculture, Beijing China, September 16–19, 2014. Springer, Cham, 610–615, https://doi.org/10.1007/978-3-319-19620-6_68, 2014.
Lu, X. S. and Zhou, M.: Analyzing the evolution of rare events via social media data and k-means clustering algorithm, in: 2016 IEEE 13th International Conference on Networking, Sensing, and Control (ICNSC), Mexico City, Mexico, 28–30 April 2016, IEEE, 1–6, https://doi.org/10.1109/icnsc.2016.7479041, 2016.
MacQueen, J.: Some methods for classification and analysis of multivariate observations. In Proceedings of the fifth Berkeley symposium on mathematical statistics and probability, Vol. 1, No. 14, 281–297, Berkeley,United States, 21 June–18 July 1965 and 27 December 1965–7 January 1966, 1967.
Nair, M., Ramya, G. R., and Sivakumar, P. B.: Usage and analysis of Twitter during 2015 Chennai flood towards disaster management, Procedia Comput. Sci., 115, 350–358, https://doi.org/10.1016/j.procs.2017.09.089, 2017.
Perera, D., Agnihotri, J., Seidou, O., and Djalante, R.: Identifying societal challenges in flood early warning systems, Int. J. Disast. Risk Re., 51, 101794, https://doi.org/10.1016/j.ijdrr.2020.101794, 2020.
Quan, R.: Rainstorm waterlogging risk assessment in central urban area of Shanghai based on multiple scenario simulation, Nat. Hazards, 73, 1569–1585, https://doi.org/10.1007/s11069-014-1156-x, 2014.
Rossman, L. A.: Storm water management model user's manual, version 5.0, National Risk Management Research Laboratory, Cincinnati, Office of Research and Development, US Environmental Protection Agency, https://data.aquacloud.net/public/2018/hla-hydrolatinamerica/olivgon5/public/Data/epaswmm5_user_manual.pdf (last access: 29 August 2022), 2010.
Sakaki, T., Okazaki, M., and Matsuo, Y.: Earthquake shakes twitter users. In Proceedings of the 19th international conference on World wide web, Raleigh North Carolina, USA, 26–30 April, 851–860, https://doi.org/10.1145/1772690.1772777, 2010.
Tang, X., Shu, Y., Lian, Y., Zhao, Y., and Fu, Y.: A spatial assessment of urban waterlogging risk based on a Weighted Naïve Bayes classifier, Sci. Total Environ., 630, 264–274, https://doi.org/10.1016/j.scitotenv.2018.02.172, 2018.
The People's Government of Beijing Municipality: “7.21” Beijing Torrential rain press conference, http://www.qgshzh.com/show/db15c68a-2f3c-429d-afcd-27e279f95e40 (last access: 29 August 2022), 2022.
Wang, Y., Xiao, S., Guo, Y., and Lv, X.: Research on Chinese micro-blog bursty topics detection, Data Analysis and Knowledge Discovery, 29, 57–62, https://doi.org/10.11925/infotech.1003-3513.2013.02.09, 2013.
Xiao, Y., Li, B., and Gong, Z.: Real-time identification of urban rainstorm waterlogging disasters based on Weibo big data, Nat. Hazards, 94, 833–842, https://doi.org/10.1007/s11069-018-3427-4, 2018.
Yin, J., Ye, M., Yin, Z., and Xu, S.: A review of advances in urban flood risk analysis over China, Stoch. Env. Res. Risk A., 29, 1063–1070, https://doi.org/10.1007/s00477-014-0939-7, 2015.
Zhang, Q., Wu, Z., Zhang, H., Giancarlo, F., and Paolo T.: Identifying dominant factors of waterlogging events in metropolitan coastal cities: The case study of Guangzhou, China, J. Environ. Manage., 271, 110951, https://doi.org/10.1016/j.jenvman.2020.110951, 2020.
zhr-thu: zhr-thu/Real-time-urban-rainstorm-and-waterlogging-disasters-detection-by-Weibo-users: Real time urban rainstorm and waterlogging disasters detection by Weibo users (v1.0), Zenodo [code] and [data set], https://doi.org/10.5281/zenodo.7097379, 2022.