the Creative Commons Attribution 4.0 License.
the Creative Commons Attribution 4.0 License.
 | 21 Sep 2022
Identification and ranking of subaerial volcanic tsunami hazard sources in Southeast Asia
Aiym Orynbaikyzy
Simon Plank
Andrey Babeyko
Herlan Darmawan
Ismail Fata Robbany
Thomas R. Walter
Tsunamis caused by large volcanic eruptions and flanks collapsing into the sea are major hazards for nearby coastal regions. They often occur with little precursory activity and are thus challenging to detect in a timely manner. This makes the pre-emptive identification of volcanoes prone to causing tsunamis particularly important, as it allows for better hazard assessment and denser monitoring in these areas. Here, we present a catalogue of potentially tsunamigenic volcanoes in Southeast Asia and rank these volcanoes by their tsunami hazard. The ranking is based on a multicriteria decision analysis (MCDA) composed of five individually weighted factors impacting flank stability and tsunami hazard. The data are sourced from geological databases, remote sensing data, historical volcano-induced tsunami records, and our topographic analyses, mainly considering the eruptive and tsunami history, elevation relative to the distance from the sea, flank steepness, hydrothermal alteration, and vegetation coverage. Out of 131 analysed volcanoes, we found 19 with particularly high tsunamigenic hazard potential in Indonesia (Anak Krakatau, Batu Tara, Iliwerung, Gamalama, Sangeang Api, Karangetang, Sirung, Wetar, Nila, Ruang, Serua) and Papua New Guinea (Kadovar, Ritter Island, Rabaul, Manam, Langila, Ulawun, Bam) but also in the Philippines (Didicas). While some of these volcanoes, such as Anak Krakatau, are well known for their deadly tsunamis, many others on this list are lesser known and monitored. We further performed tsunami travel time modelling on these high-hazard volcanoes, which indicates that future events could affect large coastal areas in a short time. This highlights the importance of individual tsunami hazard assessment for these volcanoes, the importance of dedicated volcanological monitoring, and the need for increased preparedness on the potentially affected coasts.
- Article
(8455 KB) - Full-text XML
-
Supplement
(1820 KB) - BibTeX
- EndNote


Tsunamis are among the deadliest hazards affecting coastal regions around the world. While most tsunamis are caused by tectonic earthquakes, tsunamis induced by volcanic sources account for ∼ 6 % of global tsunamis (NGDC, 2021). As a result, volcanic tsunamis are far less researched but have resulted in many deadly events that were often unexpected and hit shores without warning. This is because volcanic tsunamis are low-probability, high-impact, and hardly predictable black swan events, and 26 % of all fatalities recorded at volcanoes since 1800 have been due to such tsunamis (Brown et al., 2017). Due to the very high density of active volcanoes near coastlines, Southeast (SE) Asia is one of the most prominent regions in the world for volcano-induced tsunami events. The most well-known example is Krakatau volcano, Indonesia, where a tsunami caused by a major eruption in 1883 had an estimated death toll of ∼ 36 000 people (Brown et al., 2017; Hamzah et al., 2000). In 2018, another tsunami by the same volcano killed 437 people due to the instability of its regrown volcano flank, which caused a sector collapse into the sea (Darmawan et al., 2020; Omira and Ramalho, 2020; Walter et al., 2019). In 1888, Ritter Island in Papua New Guinea experienced a similar catastrophic collapse, resulting in a tsunami with a death toll exceeding several hundred people (Ward and Day, 2003). Even without flank or edifice instability, volcanic eruptions can still cause deadly tsunamis by the expulsion of pyroclastic density currents (PDCs) into the sea. Such events repeatedly occurred at Awu volcano, Indonesia, in 1856, 1892, and 1913 with a cumulative ∼ 4500 fatalities (Hidayat et al., 2020). The recent explosive eruption of the Hunga Tonga–Hunga Ha'apai volcano near Tonga caused a tsunami affecting the entire Pacific Ocean, which travelled faster towards the coasts than was expected. While the mechanisms of this tsunami are not fully understood yet, reports suggest the interaction of acoustic and water gravity waves as a possible explanation (Somerville et al., 2022). This may be similar to airwaves attributed to tsunamis produced by Taal volcano, Philippines, in 1911 and 1965 (Paris et al., 2014, and references therein). These and many further examples emphasise that such potentially catastrophic tsunamis occur frequently and may pose a severe threat for coastal regions even hundreds of kilometres away from the source.
As historical databases reveal, the details of the tsunami-triggering source are often a subject of debate. Even for the largest and deadliest volcanogenic tsunami, at Krakatau in 1883, discussed processes include caldera collapse, pyroclastic flows into the sea, sector collapse, explosion, or combinations thereof (e.g. Francis, 1985; Maeno et al., 2006; Nomanbhoy and Satake, 1995; Yokoyama, 1981). This highlights that there are multiple ways in which a volcano can cause a tsunami, which are considered a secondary volcanic hazard and result from eruptions or sector collapses of volcanic edifices (McGuire, 2006; Paris, 2015). Specifically, eruptions are known to generate tsunamis through large PDCs resulting from column or lava dome collapses entering the sea (Carey et al., 2000; Watts and Waythomas, 2003), through phreatic explosions when lava interacts with seawater (Belousov et al., 2000; Smith and Shepherd, 1993), and through the collapse of a lava delta when large amounts of lava construct unstable new land in the sea (Di Traglia et al., 2018; Poland and Orr, 2014). The formation of a caldera during particularly large eruptions is also known to generate tsunamis as large parts of the volcanic edifice are moving or collapsing (Maeno et al., 2006). On the other hand, a landslide or sector collapse (or lateral collapse) and resulting debris avalanche from a volcanic edifice may also occur in association with volcanic activity, i.e. flank instability triggered through the intrusion of cryptodomes or dykes, earthquakes, explosions, or loading of the flank with eruptive products (Lipman and Mullineaux, 1981; McGuire, 2006; Murray and Voight, 1996; Romero et al., 2021; Siebert, 1984). Flank instability can also be gravitationally driven without current volcanic unrest or eruptive activity through a deep-seated and slow-moving décollement (Van Wyk De Vries and Borgia, 1996) and may be seen as a precursory stage of a catastrophic flank collapse. Hydrothermal alteration may further facilitate gravitational instability by altering the chemical and structural composition of the volcanic flanks or basement (Heap et al., 2021, 2013; Van Wyk De Vries and Borgia, 1996). However, the interrelation between gravitational and magmatic flank instability is still poorly understood and may strongly depend on the local geologic setting and structural architecture of the volcano (Poland et al., 2017).
The inherent problem of volcanogenic tsunamis is the lack of warning time and quick response options because these tsunamis are not recognised by the early warning systems designed to detect tectonic earthquake events via seismic monitoring (Hanka et al., 2010; Lauterjung et al., 2010) and scenario-based modelling (Harig et al., 2020). This shortcoming also affected the 2018 tsunami originating from Anak Krakatau, where a warning system was in operation but not designed to correctly interpret the moderate-sized seismic energy as a tsunamigenic event (Annunziato et al., 2019). This may then allow for a targeted implementation of disaster mitigation strategies and warning systems at critical sites, e.g. by placing additional tide gauges as proposed for Krakatau (Annunziato et al., 2019) or improved volcano monitoring. Here, we present an in-depth analysis of the tsunami hazards by volcanoes in the Southeast Asian seas, including Indonesia, Papua New Guinea, the Philippines, and India. While we incorporate some elements of review studies, which have been done extensively for the volcanic tsunamis in Southeast Asia (see e.g. Mutaqin et al., 2019; Paris et al., 2014), we expand on this by attempting to place the potential source volcanoes in a hierarchical order and identify the volcanoes most likely to cause tsunamis in the future. For this purpose, we create a comprehensive catalogue of potentially tsunamigenic volcanoes and further use these data to create a point-based hierarchical ranking and identify the most likely candidates for sourcing potentially catastrophic tsunamis in the future.
2.1 Morphological evaluation and catalogue
For creating the catalogue we considered all active volcanoes in the SE Asian region (Fig. 1), here including India, Indonesia, Papua New Guinea, and the Philippines, that were listed in the Global Volcanism Program (GVP) database (Global Volcanism Program, 2013) with a maximum distance of 20 km to the sea (with one exception: Peuet Sague, which has an uncertain historical tsunami associated with it). Volcanoes further inland were not considered as mass movements from eruptions or flank/sector collapses are unlikely to exceed such a distance, although in some circumstances this may still be possible. Deposits of debris avalanches from sector failures of stratovolcanoes, e.g. the Gotemba deposit from Fuji volcano, Japan, were found as far as 24 km from the summit (Yoshida et al., 2012) or 35 km at Shiveluch, Kamchatka (Belousov et al., 1999). Pyroclastic flows at Mount St. Helens, USA, also reached more than 25 km from the vent (Kieffer, 1981). However, these distances are exceptional and likely limited to very large volume collapses or highly energetic lateral eruptions.
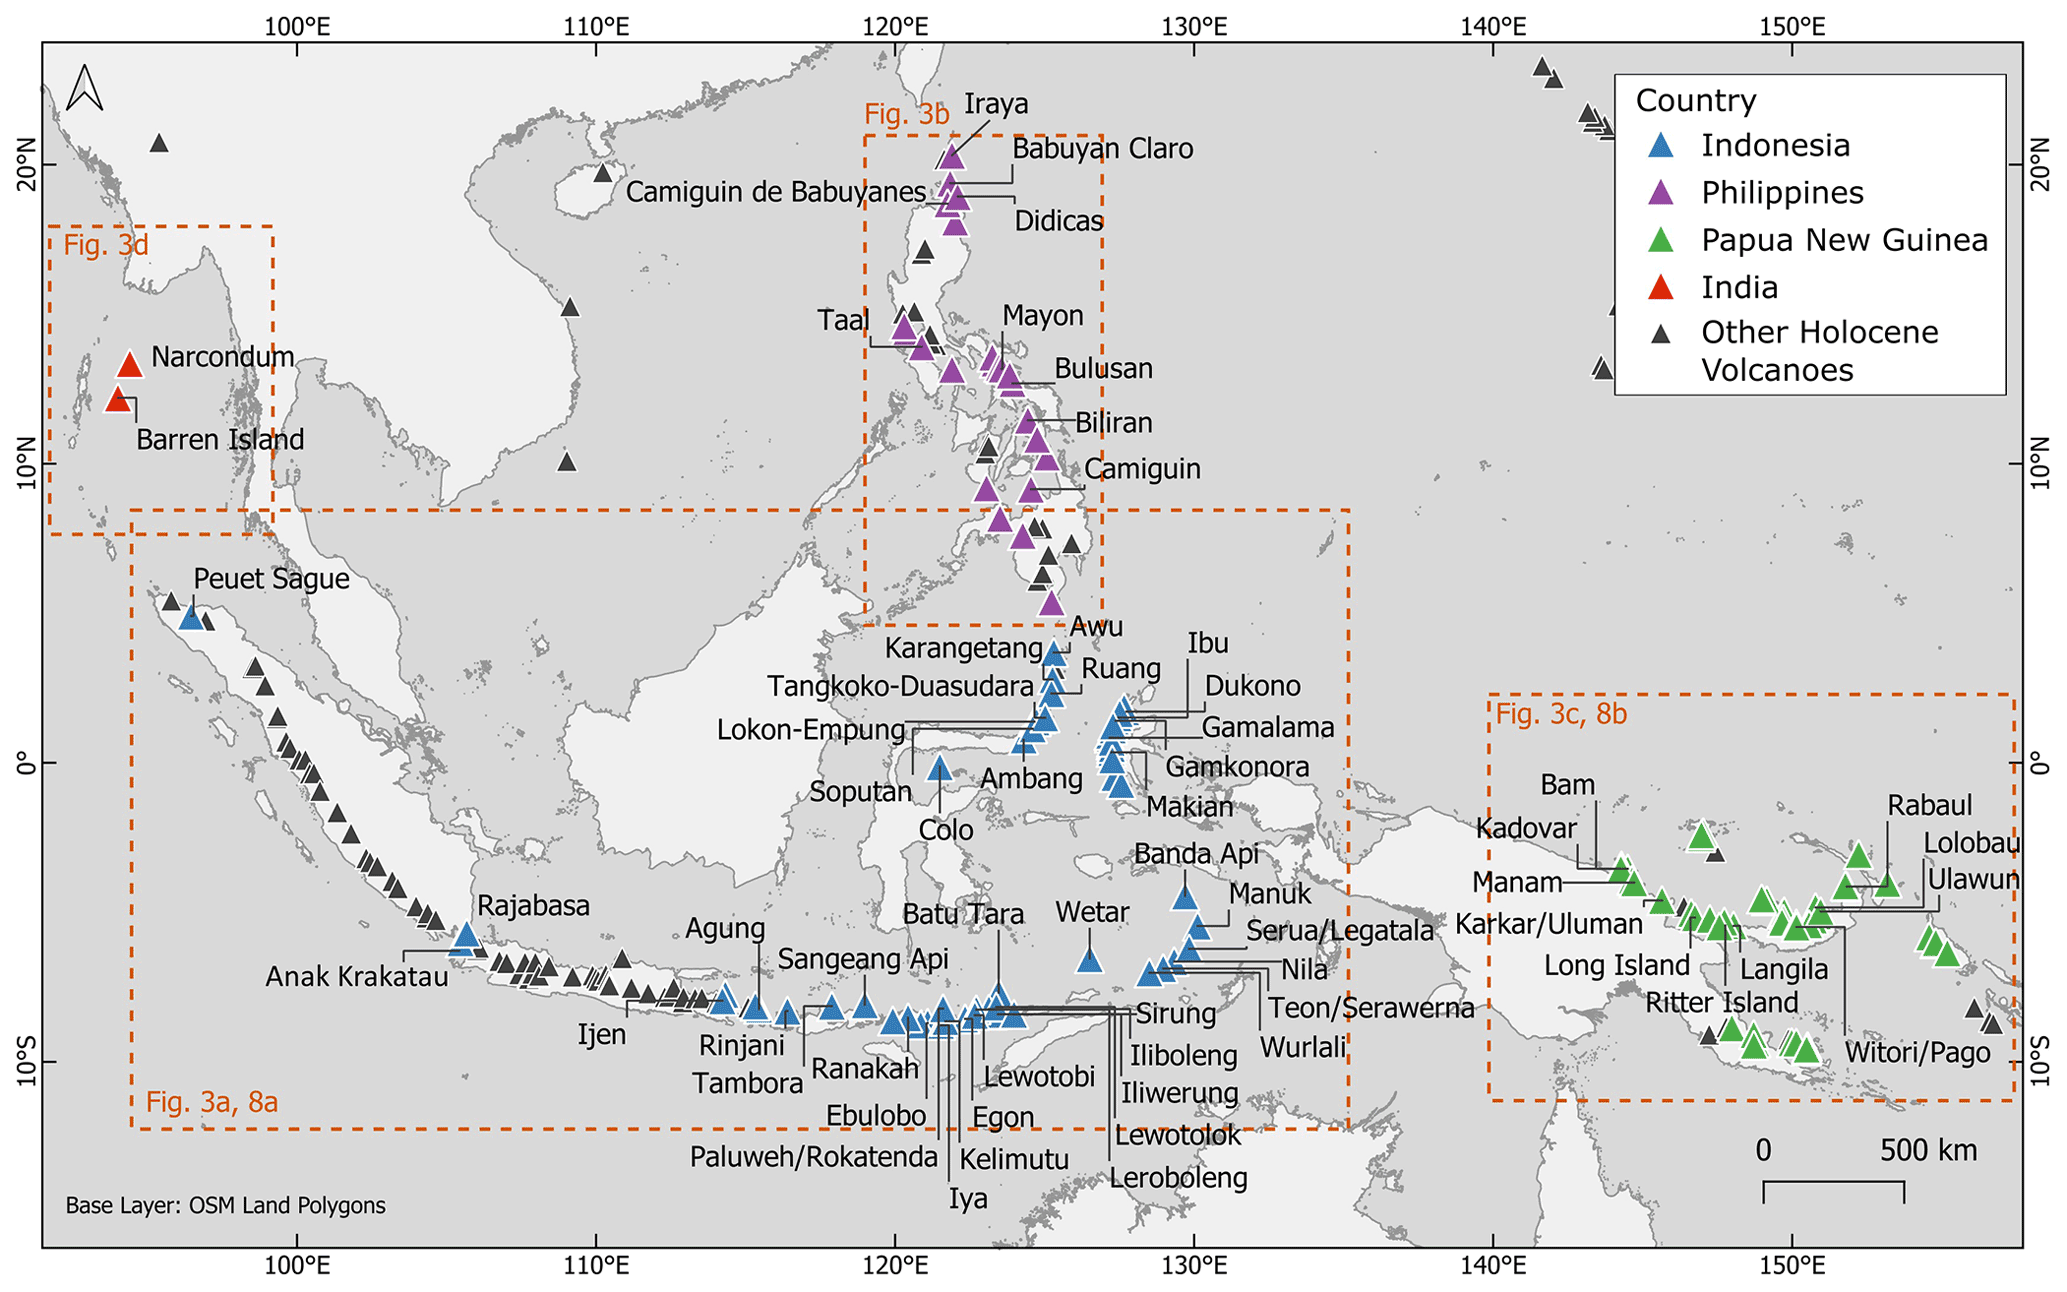
Figure 1The overview map of all active volcanoes located in the SE Asian region. Considered for our catalogue (in colour) are all subaerial volcanoes in Indonesia, India, Papua New Guinea, and the Philippines less than 20 km away from the nearest coastline. The colour corresponds to the country where a volcano is located. In total, there are 214 active volcanoes between the four countries, and 131 of them are considered in our catalogue. The rectangles indicate the extent of the scoring maps in Fig. 3. Base map data source: © OpenStreetMap contributors 2022. Distributed under the Open Data Commons Open Database Licence (ODbL) v1.0.
The catalogue contains a total of 131 volcanoes, colour-coded according to the country in Fig. 1. The information on the individual volcanoes was collected from databases, including the GVP (Global Volcanism Program, 2013) and the Global Historical Tsunami Database (NGDC, 2021), scientific literature, optical remote sensing data from Sentinel-2 satellites accessed via Sentinel Playground (ESA, 2022), and our own measurements using the Copernicus digital elevation model (DEM) (Airbus, 2020). The Copernicus DEM is based on the previously available DEMs such as ASTER, SRTM90, SRTM30, SRTM30plus, GMTED2010, TerraSAR-X Radargrammetric DEM, and ALOS World 3D-30m.
We started by extracting morphometric data from the Copernicus DEMs using the NETVOLC (Euillades et al., 2013) and MORVOLC (Grosse et al., 2012, 2009) codes and automatically delineated the edifice boundary of the volcanoes. NETVOLC initiates with a starting location (usually the volcano summit) and a pixel range to draw the edifice boundary by iteratively looking for the minimum profile convexity. This is based on the assumption that volcanic edifices are bound by concave breaks in their slopes. Then, MORVOLC allowed us to use that boundary (and an optional crater outline, manually added) to collect data such as maximum elevation, slope steepness, or edifice volume for further evaluation. A full example for the NETVOLC and MORVOLC output and an illustration of the edifice boundary definition is provided in Supplement S1. For most volcanoes in our catalogue this approach worked very well. For some volcanoes (28/131 cases or ∼ 21 %), however, we had to delineate the edifice boundary manually as the automatic NETVOLC approach would produce no or visibly wrong boundaries. This is due to the more complex morphology of some volcanoes, which does not allow for a clear delineation of concave slope breaks.
The final catalogue (see Supplement S2) includes (1) the coordinates of the volcano, (2) the volcano type, (3) its activity status as the last eruption year, (4) how many tsunamis it has historically induced, (5) its height and distance from the sea (as a ratio) as well as (6) the maximum average slope angle, (7) the possible collapse azimuth range (flanks facing the sea) and (8) the most likely azimuth for tsunamis (manually selected base on slope steepness or location relative to the sea), (9) the edifice volume, and (10) a summary of other hazardous features (see below).
2.2 The volcanic tsunami hazard ranking
One key challenge in creating a meaningful ranking of the tsunami hazard posed by many individual volcanoes is the application of consistent criteria to allow for strong comparability. Since volcanoes have a large variety of shapes, morphologies and styles of activity, this is not a trivial task. We therefore only considered the data representing all volcanoes under the same conditions, and we used as many objectively measurable criteria as possible to minimise human subjectivity and inconsistency. Here, we decided on a multicriteria decision analysis (MCDA), which is a method frequently used to aid in prioritising and decision-making for complex and multifaceted problems across many scientific disciplines – for example, in medical sciences evaluating the impact of drugs (Nutt et al., 2010), in Earth sciences assisting in the management of nuclear waste disposal sites (Morton et al., 2009), or in hazard evaluations of flood-prone sites (Fernández and Lutz, 2010; Rahmati et al., 2016; Toosi et al., 2019). Our MCDA system uses weighted point scores based on five major factors to influence our final ranking. These factors were assigned (i) factor points based on their likelihood to contribute to the volcano's tsunami hazard and (ii) factor weights based on how much the factor contributes to the volcano's tsunami hazard. By adding these weighed factor points to a final score, we could rank the tsunami hazard from the individual volcanoes:
where F represents the individual factor points from 0–100 (100 representing the highest tsunami hazard) and W represents the factor weight as a percentage (the total of all factor weights adding up to 100 %). Due to the specific nature of some factors, the full 100 points could not always be reached, but the point systems were designed to scale well between 0 and 100. This results in a final score that also has points between 0–100 and makes our ranking easier to comprehend and visualise. While there are numerous factors that can be considered to reflect the tsunami hazard from a volcano, most of them do not have a known empirical relation to the hazard. For example, it is reasonable that a steep volcano close to the sea is more likely to produce a tsunami than a gently sloped one far inland, but exactly how much more likely this makes a tsunami is not known. With our ranking, we can therefore only aim to compare these factors by assuming that certain higher values equal a higher hazard.
We consider the following five factors and point systems for the ranking. Each represents a set of data that can be recorded or quantified objectively, which is then assigned a subjective but consistent point scale in order to create a comparable hierarchy:
- i.
ratio. This is the height H of the volcanic edifice (i.e. the maximum elevation of the peak) as a fraction of the distance from that point to the sea D. To measure the height of volcano edifice, we used the 30 m Copernicus DEM GLO-30 (Airbus, 2020), which is considered the most reliable choice among the freely available and global DEMs (Guth and Geoffroy, 2021). Only for Anak Krakatau no post-collapse DEM was available, so we used a downsampled photogrammetric DEM previously published by Darmawan et al. (2020). We selected the maximum elevation of the edifice (extracted using the MORVOLC code) and from that location measured the minimum distance to the shoreline using OpenStreetMap land polygons (OpenStreetMap, 2022). This parameter is highly relevant to the tsunami hazard of a volcano. Firstly, this is because a volcano with higher elevation can produce larger collapses and allow for more potential energy in mass movements, both from flank/sector/dome collapses and PDCs directed towards the sea. Secondly, if the mass movement source is closer to the sea, it is more likely to actually reach it and produce a tsunami. The resulting values ranged from 0.02 to 0.89, so in order to convert the factor to the 0–100 point scale, the values were multiplied by 100. The only exception is Ritter Island, Papua New Guinea, which achieved a ratio of 1.77 due to the remnant collapse scar, which drops steeply towards the sea. We simplified this by assigning a maximum of 100 points.
- ii.
Volcanic activity. Frequent eruptive activity can exert strain on the flanks of a volcano as the volcano deforms, inflates, and deflates as a result of pressurisation or the movement of intrusions. Additionally, erupted lava or tephra can quickly pile up and oversteepen flanks, while constant high seismic activity can act as a trigger to mass movements. This means a volcano with a high activity level is far more likely to experience a sector/flank/dome collapse or produce pyroclastic flows compared to a quiescent one. While the exact mechanisms and timescales are generally not well understood, it is known that many volcanic systems have extended periods or cycles of quiescence or low eruptive frequency, followed by more frequent eruptions (e.g. Crisci et al., 1991; Gertisser and Keller, 2003; Turner, 2008). This suggests that a volcano that recently erupted is more likely to become more active or erupt again in the near future compared to ones that have been quiet for a long time. Considering all the above, we based our factor points on the time since the last known eruption of the volcano, with the data sourced from the GVP (Global Volcanism Program, 2013). However, due to the different timescales of eruptive cycles and the decreasing certainty of historic records, we decided to apply a non-linear point scale. Any volcano that erupted since the beginning of 2020 received a full 100 points. Every year before 2020 resulted in one point deduction, and from the year 2000 only, every decade is worth one point less but to a minimum of 20 points as long as the volcano erupted within the Holocene. Similarly, if these volcanoes experienced historical unrest episodes but no eruption, they were assigned 20 points. For volcanoes where Holocene eruptions are presumed or considered likely, we assigned 10 points, and 0 points were assigned for volcanoes that are presumed to be extinct.
- iii.
Tsunamigenic history. Some volcanoes have an increased tendency to produce tsunamis, either through frequent large eruptions or inherently unstable flanks. Here, we counted the number of tsunamis known from historic records sourced from the Global Historical Tsunami Database (NGDC, 2021) and relevant review papers (Hamzah et al., 2000; Hidayat et al., 2020; Mutaqin et al., 2019; Paris et al., 2014). Our compilation is shown in Table 1. We further considered signs of previous edifice instability that include collapse scars (amphitheatres) and known submarine debris avalanche deposits. We assigned 10 points for every known historical tsunami, 10 for a collapse scar or submarine deposit and 20 if the volcano has multiple scars or submarine deposits.
- iv.
Slope angle. The steeper an edifice is the less stable it becomes. For volcanoes, steeper slope angles are correlated with higher frequencies of edifice failures (Siebert, 1984). Typically, the angle of repose for natural volcanic rocks lies between 30–40∘, and edifices exceeding this angle may experience gravitational instability. Here, we measured the maximum average slope angle that is part of the MORVOLC output, meaning the steepest part of the edifice calculated as the average slope value of the 50 m elevation interval of the edifice with the highest mean average slope; see Grosse et al. (2009). However, we limited the output to only those flanks facing towards the sea and excluded slopes facing inland. For the factor points, we doubled the steepness value in degrees, so a 50∘ slope would equal the maximum of 100 points. We also note that this factor is a major distinction from the ratio since it considers real measured local steepness. This may differ strongly from the ratio, e.g. if the volcano is very steep but the summit is located far from the sea.
- v.
Hazardous features. This factor is deliberately designed to encompass a broad collection of features impacting the likelihood of a tsunami-generating event at the volcanoes. These features do not really fit a typical quantitative scheme and have to be arbitrarily evaluated by a human and are easily missed or misinterpreted. Thus, in order to minimise user bias and avoid unrealistic points, all listed features below were combined into one factor. The data were collected by visually examining the Copernicus DEM GLO-30 (Airbus, 2020) as well as optical satellite imagery from Sentinel-2 satellites accessed via Sentinel Playground (ESA, 2022). The considered features include the following.
-
Underwater extent. Whether a volcano and its flanks are submerged in the sea plays a very important role when assessing tsunami hazards as an edifice failure or an erupting vent may be located partially or fully underwater. We assigned 10 points if the edifice is partially submerged (so at least part of the edifice outline used in the NETVOLC and MORVOLC codes reaches into the sea) and 20 points if the edifice is fully in the water and all flanks reach into the sea.
-
Morphological features. Breached craters highlight a volcano's tendency to experience partial instability and provide an easy path for eruption products to reach the sea. We assigned 15 points to volcanoes with breached craters. Similarly, calderas signal that one or many large eruptions have occurred at this volcano and were also given 15 points. Finally, a larger volcanic edifice may have multiple secondary edifices and vents, adding further potential source locations to volcanogenic tsunamis. We thus added 15 points if one or more secondary peaks/vents were found.
-
Vegetation. Dense vegetation and plant roots can significantly enhance a flank's stability and make a flank/sector collapse less likely (Gonzalez-Ollauri and Mickovski, 2017). In contrast, a flank's stability may significantly decrease due to the vegetation loss after major eruptions (Korup et al., 2019). Here, we visually inspected the volcano flanks using Sentinel-2 data (10 m spatial resolution). We gave no points if the volcano flanks were densely vegetated, 5 points if the volcano had vegetation free portions (most commonly, this is near the crater as a result of recent eruptions), and 15 points if at least one flank between summit and sea was free of vegetation.
-
Hydrothermal alteration. Fumarole systems and weathering may significantly alter the rocks of a volcano flank, changing their appearance, composition, and strength. Most commonly, hydrothermal alteration can weaken the rocks and promote failure or close permeable fluid paths and induce phreatic explosions (Heap and Violay, 2021). Alteration through geothermal systems is sometimes listed as the main reason for flank destabilisation, as with the 1979 landslide causing a tsunami at Iliwerung volcano, Indonesia (Yudhicara et al., 2015). Thus, we attempted to identify areas of localised alteration by visually inspecting the volcano flanks using Sentinel-2 data. We specifically looked for characteristic bright spots indicative of alteration minerals and localised vegetation loss (outside the main crater). If these were identified, we added 10 points.
-
Topography between an edifice and the sea. Within 20 km of the shore, the volcano's flank may not directly face the sea. While past events at Mount St. Helens, USA, in 1980 (Fisher, 1990) and Merapi, Indonesia, in 2010 (Cronin et al., 2013) have shown that sector collapses or PDCs can overcome significant topography, they are less likely to reach the sea in such circumstances. To account for that, we added 30 points if we found no major topographic obstacle between the summit of the edifice towards the sea, thus adding more points to volcanoes close to the coast.
-
For the factor weights, we have to choose values based on the importance of the factor data. A higher weight of a factor will result in a larger impact of this factor on the final score and thus make it more important. Here too, these choices are largely subjective but allow reducing the impact or importance of, for example, less reliable factor data and in turn raise the impact of more reliable factors. We decided to favour morphometry and eruptive activity over the other factors. Morphometry, here meaning ratio and slope angle, measures the feasibility of gravitational mass movements (flank collapses or PDCs) reaching the sea and quantifies oversteepening of individual flanks. These data also represent the most reliable quantitative data in our ranking as the morphometric factors can be precisely measured. Eruptive activity is also favoured as tsunamis do not only occur by flank collapse but also through PDCs or explosions. Additionally, unrest or eruptions may also act as a trigger for gravitational failures. In turn, we decided to weigh the hazardous features less since these are not quantitatively determined and more prone to human subjectivity and misjudgement. Thus, they are less reliable. Consequently, the final factor weights used were the ratio (20 %) and the slope angle (20 %) as morphometry factors and then volcanic activity (30 %), tsunamigenic history (20 %), and hazardous features (10 %). An example of how the score was calculated is provided in Fig. 2.
Table 1Compiled list of historic tsunami events in the Southeast Asia region. References are (1) Hamzah et al. (2000), (2) Paris et al. (2014), (3) Mutaqin et al. (2019), (4) Hidayat et al. (2020), and (5) NGDC (2021). A cause with question mark indicates that the actual cause is unclear and/or debated.
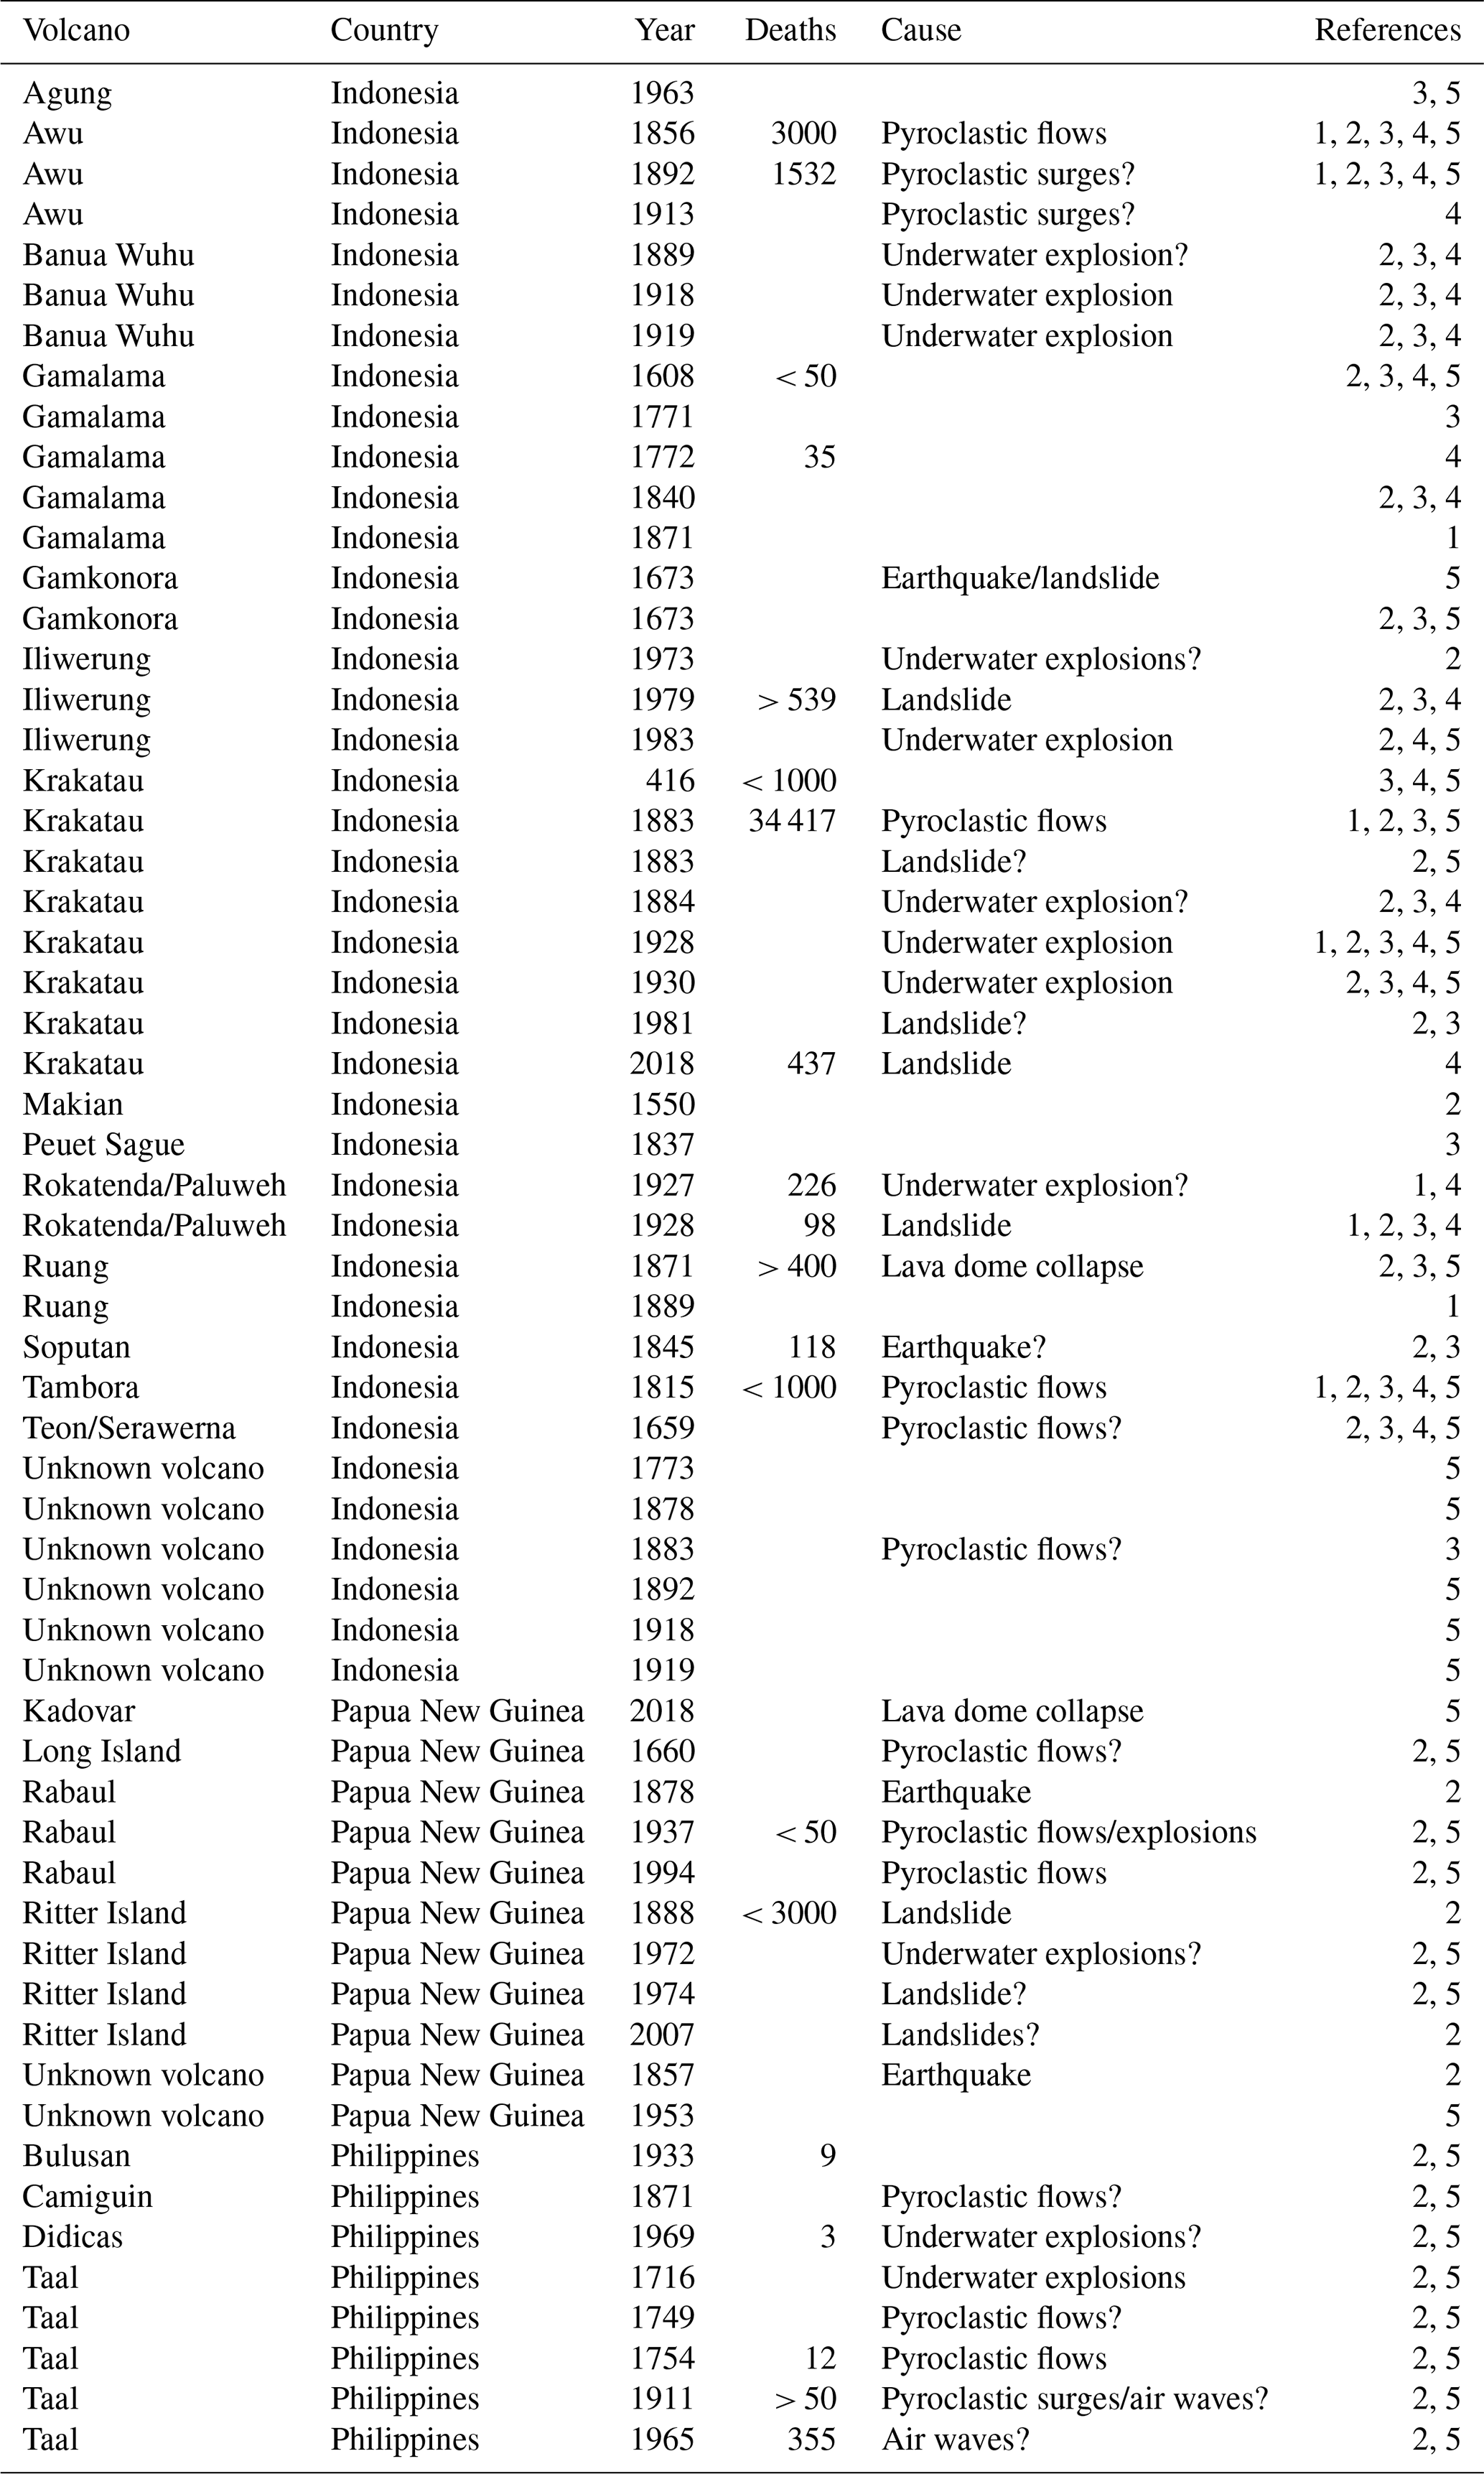

Figure 2Example calculation of the ranking score using Nila volcano, Indonesia. Panel (a) is a false colour image from Sentinel-2 from bands 8 (NIR), 4 (red), and 3 (green). This highlights vegetated areas as red but leaves barren areas grey. Here, Nila Island is densely vegetated, except for the southeast slope, which appears to be unvegetated due to ongoing hydrothermal alteration. Panel (b) is a hillshade DEM from Copernicus GLO30, and panel (c) is a summary of our MCDA score calculation using data marked in panels (a) and (b) as well as the GVP database and Global Historical Tsunami Database.
We further tested how robust our ranking is with respect to used factor weights. This is done to confirm that the highest-scoring volcanoes still retain their high score even when the weighing is significantly different, which can confirm that these volcanoes really pose the highest tsunami hazard despite possible human error or misjudgement. The test was carried out by changing the five factor weights, increasing one factor to 60 % and setting all others to 10 %. The procedure was repeated for all five factor weights, so that every single factor was once set as the strongest influence. We also added one instance of all weights being considered equal (i.e. all five factors being weighed at 20 %). This then enabled us to calculate both an average score and standard deviations within this variability of weights. The results could then be used to judge whether our ranking can generally identify the highest-scoring and most-hazardous volcanoes well, despite the subjective weight choices. We could further determine which volcanoes were more sensitive to the influence of single factors, as this would result in higher deviations.
2.3 Ranking assumptions and limitations
There are many factors influencing the tsunami hazard posed by volcanoes, and not all of them can be quantitatively evaluated. Furthermore, even for the ones which can be evaluated, certain assumptions have to be made in order to create a comparable baseline to judge all volcanoes on an equal basis. Here we address some of the issues with the data used in our ranking approach.
It is important to emphasise that the point system used in our MCDA is based on arbitrary and thus subjective point scales, assigned to best cover the range of values used to build the ranking score. Any evaluation of this type will inherently involve arbitrarily chosen scores that have to consider and weigh the many multifaceted factors that contribute to volcano flank instability and the hazards of generating a tsunami. In studies previously ranking volcanic hazards and risks, this could be done by a simple count of “yes” or “no” features adding 1 or 0 points, respectively (Yokoyama et al., 1984), or similar variations (Ewert, 2007; Ewert et al., 2018), or via the creation of index values and adding them up to create a score (Scandone et al., 2015). Then categories (e.g. high, medium, and low hazard) are defined to best cover the range of scores (e.g. Ewert et al., 2018), which is also what we do in our ranking. MCDAs in other fields often have more quantitative scales such as 0–9 points (Fernández and Lutz, 2010; Rahmati et al., 2016) or 0–100 (Nutt et al., 2010), but the score systems are still assigned arbitrarily. Thus, all these approaches and our ranking presented here use some degree of subjective judgement, as not all factors directly translate into an empirical hazard or risk value. Without this, no meaningful comparison between volcanoes could be made. However, as the rules with which points are given are kept strictly the same for all volcanoes, the comparability of scores is retained, allowing for a meaningful hierarchical order or scores. For our ranking, this means that the hazard score by itself should be seen as a rough hierarchy estimation rather than a strict empirical value as it has little meaning in terms of hard data, such as expected tsunami event frequency, possible wave heights, or impacts on shorelines and population. Similarly, we can thus not adequately assess the risk to shores and population in the traditional sense. Instead, we identify which volcanoes are the most likely to cause a tsunami in the future as these are expected to produce the highest hazard score.
Another important consideration is that we cannot consider all factors that are known or suspected to impact the tsunamigenic potential of a volcano. The most noteworthy ones are (1) ongoing flank deformations (e.g. through dyke intrusions or slow décollement movement), which can destabilise parts of the edifice, and (2) absence of bathymetric data covering the underwater geometry of the volcanoes. Because the lack of high-quality and accessible data for all volcanoes makes meaningful comparison of the impact of these factors on the tsunami hazard impossible, we could only consider these factors by proxy. For instance, eruptive activity of a volcano increases the likelihood of ongoing deformation, and thus it is indirectly tied to the activity factor points. However, not all erupting volcanoes are likely to experience significant deformation, and, on the other hand, there may be significant deformation without an eruption (e.g. due to the intrusion of magma underground). For the underwater geometry, our analysis is simplified to whether the volcano is partially or fully in the water, thus counting towards the hazardous features factor points. But it neglects steep underwater flanks, which also means that some potentially hazardous submarine volcanoes had to be excluded from our catalogue as they had no subaerial edifice to examine. Here, these are Banua Wuhu, Indonesia, and Hankow Reef, Papua New Guinea, as well as two unnamed seamounts. Future studies could take these missing factors into account properly and warrant their own point scores, provided that data quality, regularity, and availability of surveys improve.
Conducting a comparative ranking can be more challenging if there are major dependencies between the used factors. As an example for our case, it would be reasonable to assume that recent eruptive activity would more likely cause hydrothermal alteration, thus making the eruptive history and hazardous features factors interdependent. However, in our catalogue, only few volcanoes are recorded to have extensive hydrothermal alteration on their flanks, and for many of these, no eruption occurred for decades to centuries (e.g. Manuk, Teon, Serua). Hence, we think that these issues are unlikely to significantly affect our results. The only exception is a direct dependence between the ratio and the slope angle as it is essentially the same value if the volcano is close to the coast; however, the separation does allow for a more distinct look at volcanoes that may be far from the coast but still have steep slopes on a local level.
Data based on historic observations are often flawed as they were not always systematically recorded. This includes historical tsunamis, flank collapses, and eruptions. The problem is facilitated the further the events lie back in time, and many events may be missed or wrongly interpreted because they were either not understood properly or simply not noticed or remembered. For instance, some volcanoes have unknown eruption dates and thus received a relatively low rating, even when it is quite likely that their last eruption happened only decades ago. One example is Balbi volcano, Papua New Guinea, which likely erupted around the early 1800s, but this is unconfirmed (Global Volcanism Program, 2013). This creates a slight bias towards volcanoes that are well known and researched, whereas volcanoes with less scientific attention may receive lower ratings. Thus, our analyses may be prone to missing or incorrectly recorded events. This is also the reason we prefer to use just the last eruption year known from a volcano rather than creating a score based on eruption frequency as these frequencies can simply not be reliably established for many volcanoes in our catalogue. For tsunamis, we tried to minimise this bias by incorporating data from multiple databases and studies (Hamzah et al., 2000; Hidayat et al., 2020; Mutaqin et al., 2019; NGDC, 2021; Paris et al., 2014). Surprisingly, no study had the exact same tsunami events listed, and some were only found in certain reviews. Our compilation thus likely marks the most comprehensive list of historic tsunamis in SE Asia to date; however, there are likely some further events that were missed or not recorded.
For evidence of edifice instability the problem is similar. Many collapse scars related to such instability or lateral blasts can be obscured by the regrowth of the volcano and are thus easy to miss. On the other hand, gradual erosion and destabilisation due to hydrothermally weakened rocks (Darmawan et al., 2022) may produce scars that are very similar to collapse scars and consequently very challenging to distinguish using satellite data. Finally, submarine debris avalanche deposits which are evidence for past edifice failures that reached the sea are poorly studied since the required bathymetry data are rarely acquired. Here, Silver et al. (2009) specifically investigated volcanic debris avalanches for most volcanoes in Papua New Guinea, so this region can be considered reasonably well covered. However, no similar studies exist for Indonesia or the Philippines, making some oversights likely.
When analysing the vegetation cover of the volcanoes using the Sentinel-2 satellite images, we found that the vegetation is subject to seasonal changes. Mainly this encompasses vegetation colour changes due to dry or rainy periods. Since our analysis is kept rather simple and qualitative rather than quantitative, this effect is unlikely to impact our results.
While we consider gravitational instability of volcanic edifices by measuring the slope steepness, additional factors can play an important role that could not be considered here as they are unknown for most volcanoes. These are mainly the lithological properties of the flank and the rock mass strength (Watters et al., 2000). Furthermore, the nature of the volcanic flanks deposits and their state of consolidation is likely to play a role on how resistant they are to oversteepening and destabilisation. For instance, one factor that is speculated to have contributed to the 2018 Anak Krakatau flank collapse is that it consisted of loose unconsolidated pyroclastics covered with lavas (Grilli et al., 2019), which likely contributed to the instability.
3.1 Volcano catalogue and ranking
Using the factor points and weights described in Sect. 2.2, we ranked the volcanoes in our catalogue by their tsunami hazard. An overview is presented in Fig. 3, and a list of the 40 highest-scoring volcanoes is shown in Table 2. A complete, more detailed, and interactive version of this list with individual entries relating to how the points were counted can be found in Supplement S2. The points range from 76 (Batu Tara, Indonesia), representing the highest tsunami hazard, to 13 (Baluan, Papua New Guinea), representing the lowest tsunami hazard. Using these results, we grouped the volcanoes into high-, medium-, and low-tsunami-hazard categories based on their relative score. The high-hazard category is assigned for volcanoes having more than 55 points (∼ 14 % of the volcanoes in the catalogue), the medium-hazard category is assigned to volcanoes with scores between 40 and 55 points (∼ 36 % of the volcanoes in the catalogue), and the low-hazard category is assigned to volcanoes with less than 40 points (∼ 49 % of volcanoes in the catalogue). Volcanoes like Anak Krakatau, Indonesia, and Ritter Island, Papua New Guinea, are among the highest-tsunami-hazard volcanoes in our ranking, which is unsurprising considering their history of powerful eruptions and catastrophic tsunamis (Paris et al., 2014). However, we also identify high-hazard volcanoes that are not as well known for their tsunamigenic potential but received similarly high scores. In Indonesia these include Batu Tara, Gamalama, Iliwerung, Karangetang, Nila, Sangeang Api, Wetar, Sirung, Serua, and Ruang. For Papua New Guinea we identify Kadovar, Rabaul, Ritter Island, Manam, Bam, Langila, and Ulawun as volcanoes with high tsunami hazard. For the Philippines, only Didicas is classified as a high-tsunami-hazard volcano.
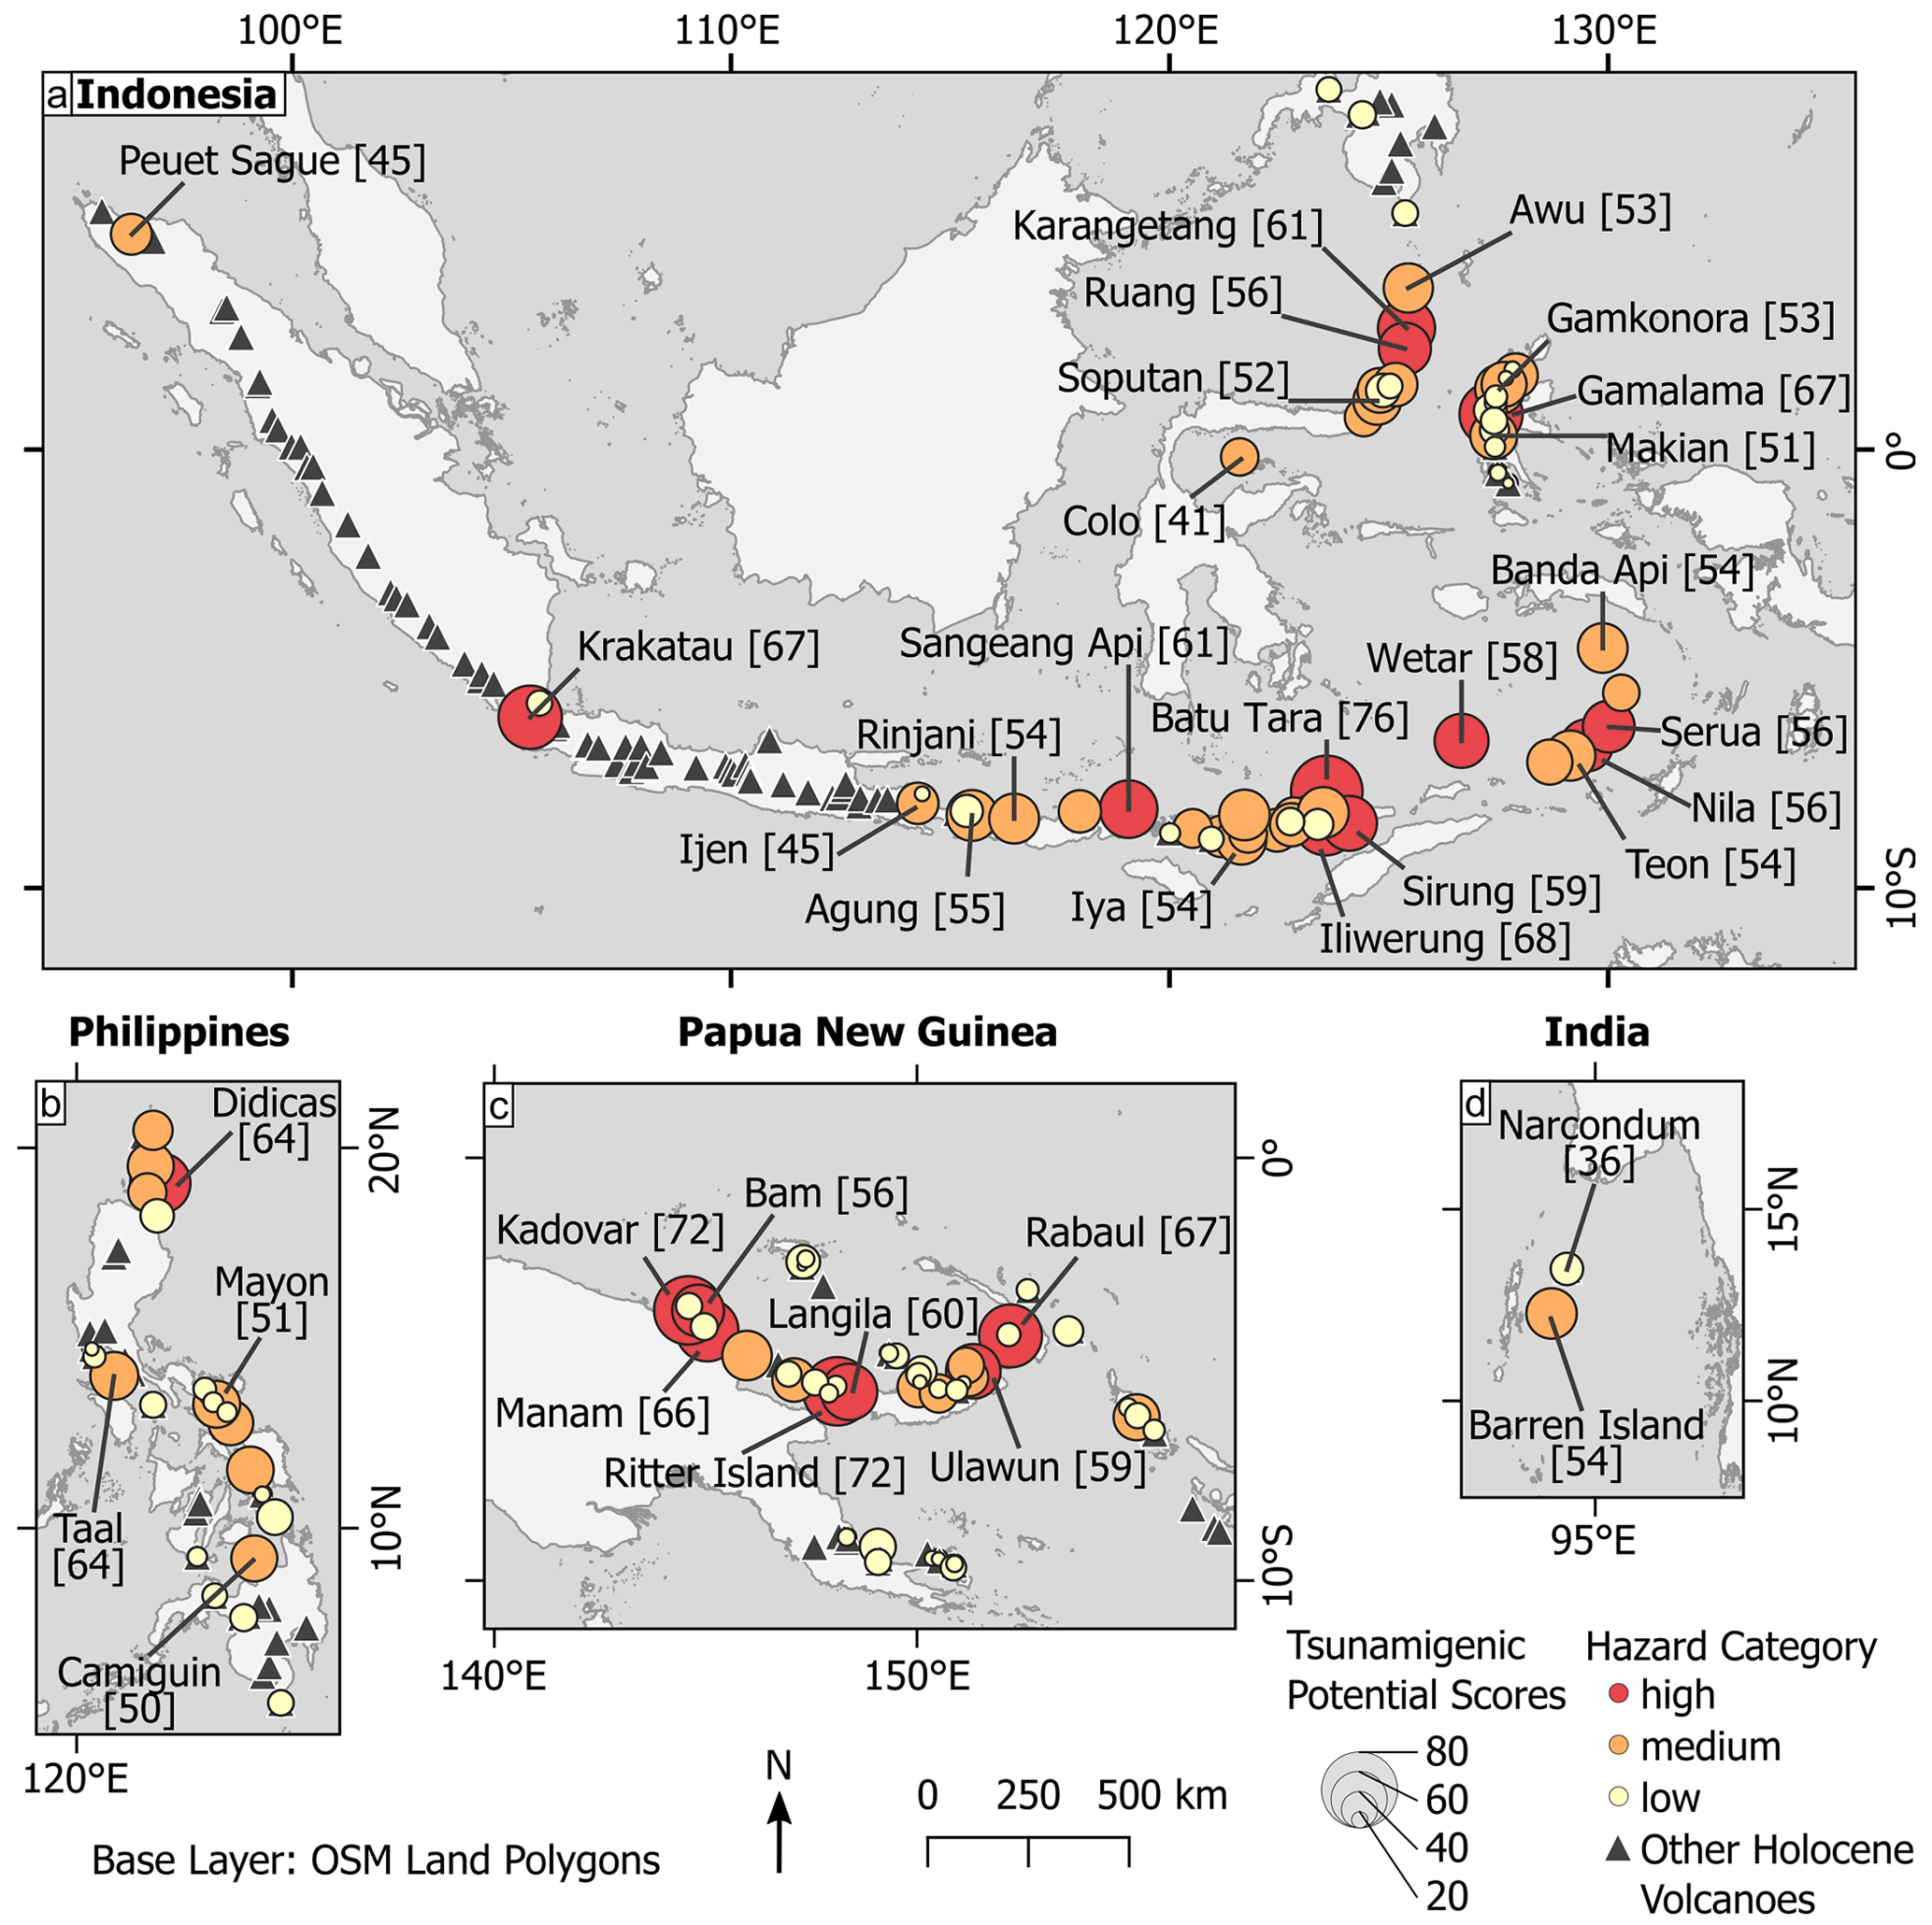
Figure 3Maps of the volcanoes in the catalogue with their corresponding ranking score and the resulting hazard category in (a) Indonesia, (b) the Philippines, (c) Papua New Guinea, and (d) India. For a detailed overview of tsunami hazard scores for all volcanoes in the catalogue, see Table 2. Base map data source: © OpenStreetMap contributors 2022. Distributed under the Open Data Commons Open Database Licence (ODbL) v1.0.
Table 2List of the 40 highest-scoring volcanoes in our catalogue and their respective MCDA ranking of the relative tsunami hazard, showing individual factor points and the final score. The factor weights for the total score are ratio (20 %), volcanic activity (30 %), tsunamigenic history (20 %), slope angle (20 %), and hazardous features (10 %). For the full catalogue and ranking table see Supplement S2.
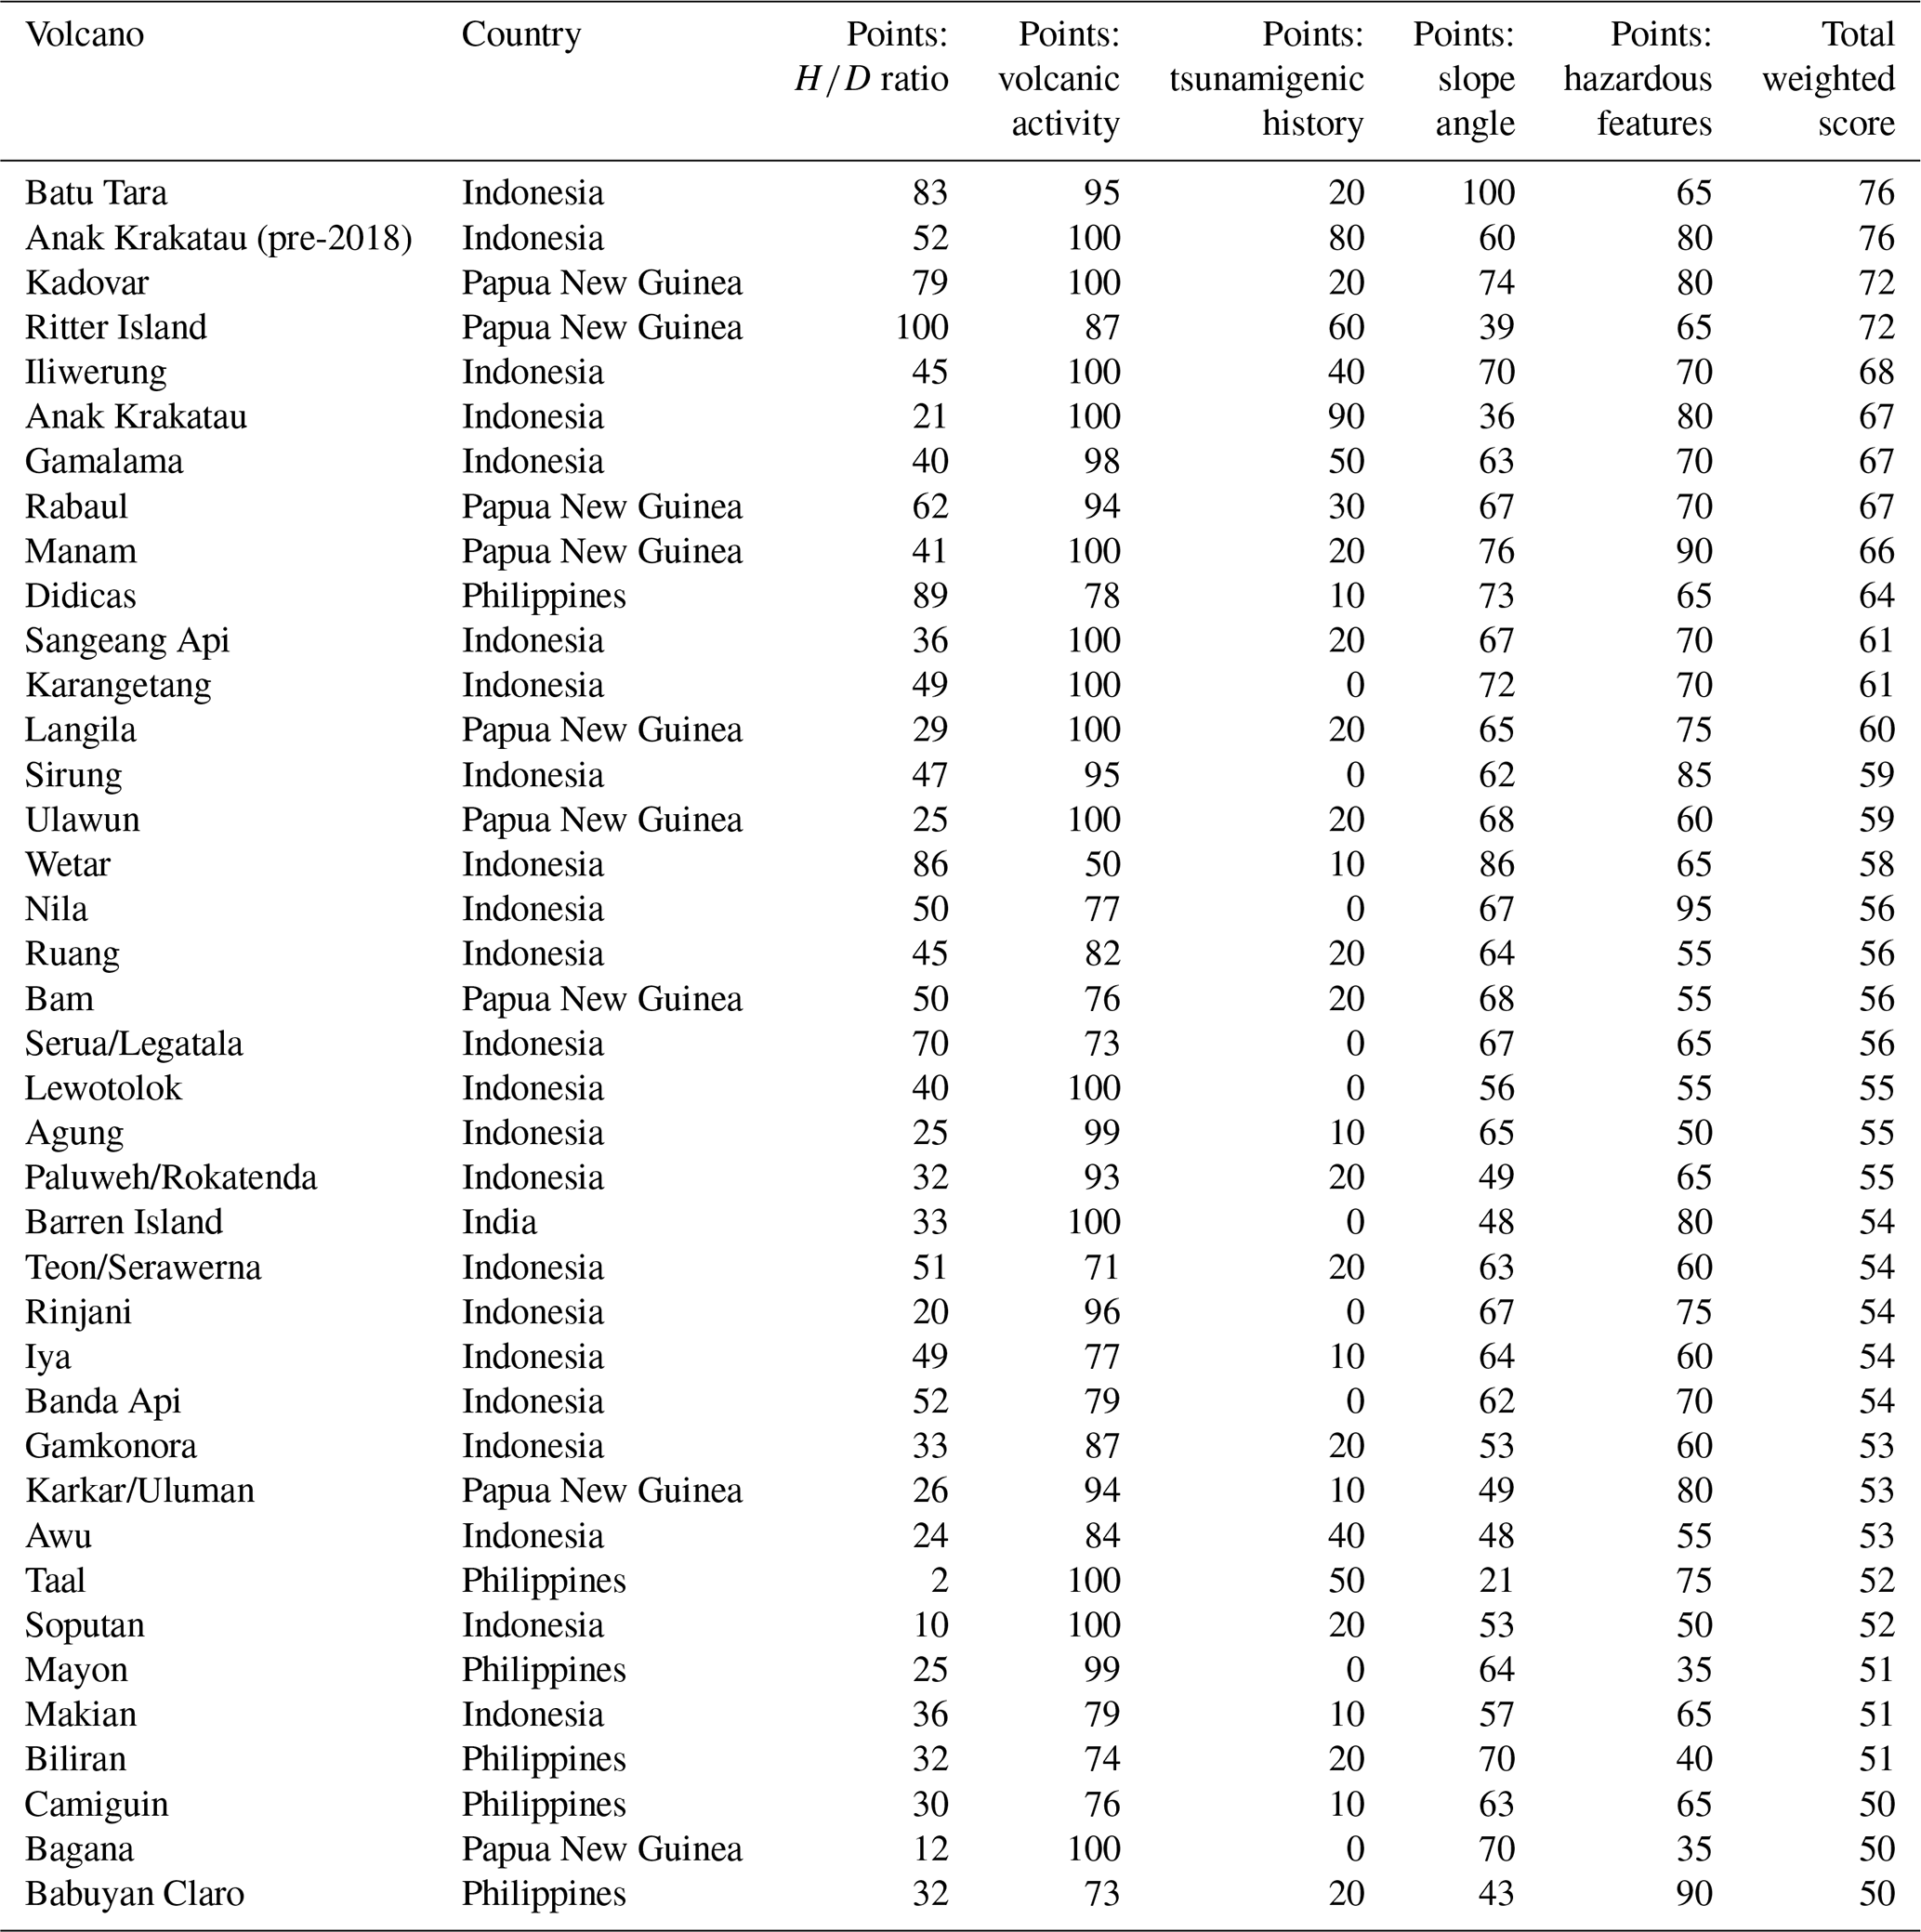
The results of the ranking robustness testing are summarised in Fig. 4, showing that the higher-scoring volcanoes in our ranking with our chosen weights generally also score the highest average points independent of the factor weight. This adds confidence to our results and confirms that we are generally able to identify the higher-hazard volcanoes well, even if their individual rank may vary slightly (Fig. 4a). The lower the volcanoes are ranked, the less robust the ranking order becomes, which is likely due to a higher number of volcanoes with similar scores (Fig. 4b, c). Here, this means that our ranking is most meaningful for the higher-scoring volcanoes and puts them in a more reliable order. Standard deviations vary between 7 and 15 points for each individual volcano, being higher when the scoring strongly depends on single factors. For instance, the pre-2018 tsunami Anak Krakatau achieved high points in all factors and is thus not very variably in its total score, while Batu Tara has low points in tsunamigenic history and may thus have a greater variance in its total score for different weights (Fig. 4a).
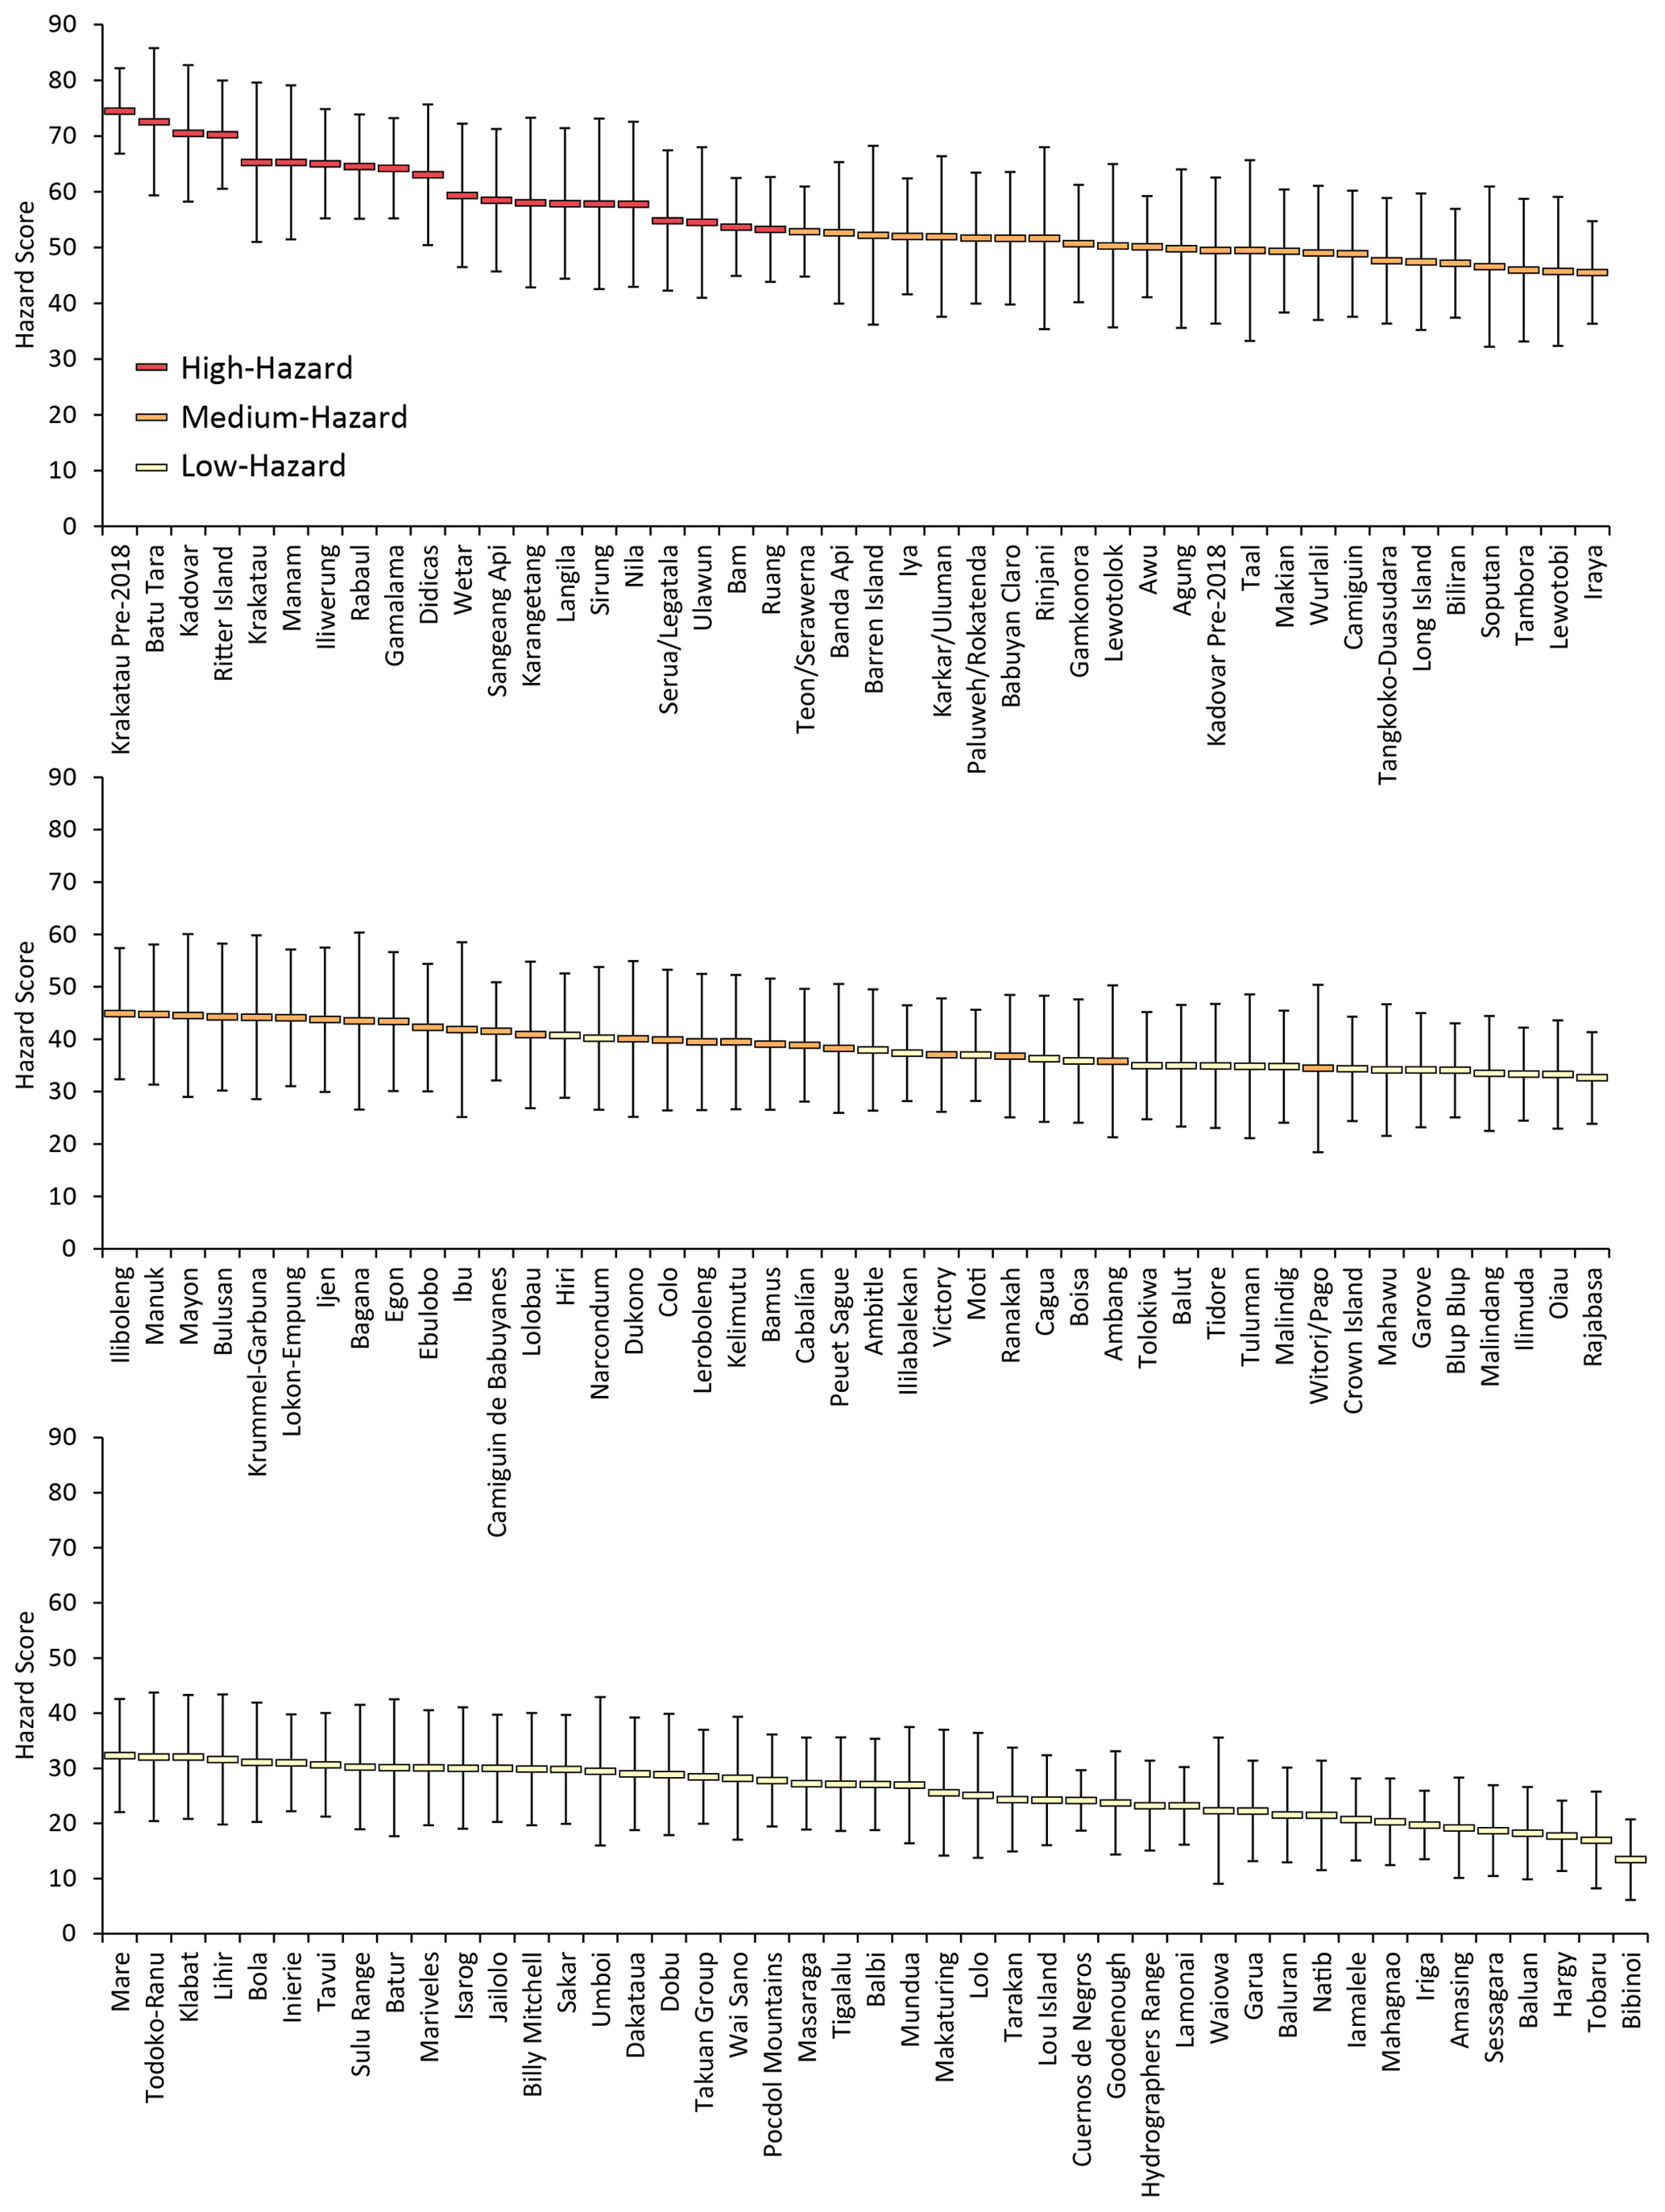
Figure 4Robustness test of the factor weights used in the ranking. This was done by calculating an average score and standard deviations from repeat scoring while systematically changing the factor weights. It shows that the volcanoes we classed as high-hazard volcanoes are generally well distinguished, with the highest values being independent of factor weights. This demonstrates that changing the factor weights may slightly change the order in which the volcanoes are ranked, but our analysis is generally classifying higher-hazard volcanoes correctly, confirming the robustness of our ranking. However, for the medium- and low-hazard volcanoes (here classified by colour using our final weights and rank; see Table 2) the ranking is less robust, due to a high number of volcanoes with similar scores, which can significantly change the hierarchical order depending on the chosen factor weights.
3.2 Volcano distribution and tsunami causes
Most of the high- and medium-tsunami-hazard volcanoes are located in Indonesia, which by itself is not surprising since Indonesia also has the most volcanoes in our catalogue (∼ 46 %, Fig. 5a). However, the relative amount of these volcanoes in those categories is significantly higher (Fig. 5), suggesting that Indonesia has an over-proportionally high number of hazardous volcanoes. This is further evident in the low-tsunami-hazard category, which includes volcanoes that are dominantly from Papua New Guinea (Fig. 5c, d). Volcanoes of the Philippines are only underrepresented in the high-tsunami-hazard category, but this may be due to the lower number of overall volcanoes.
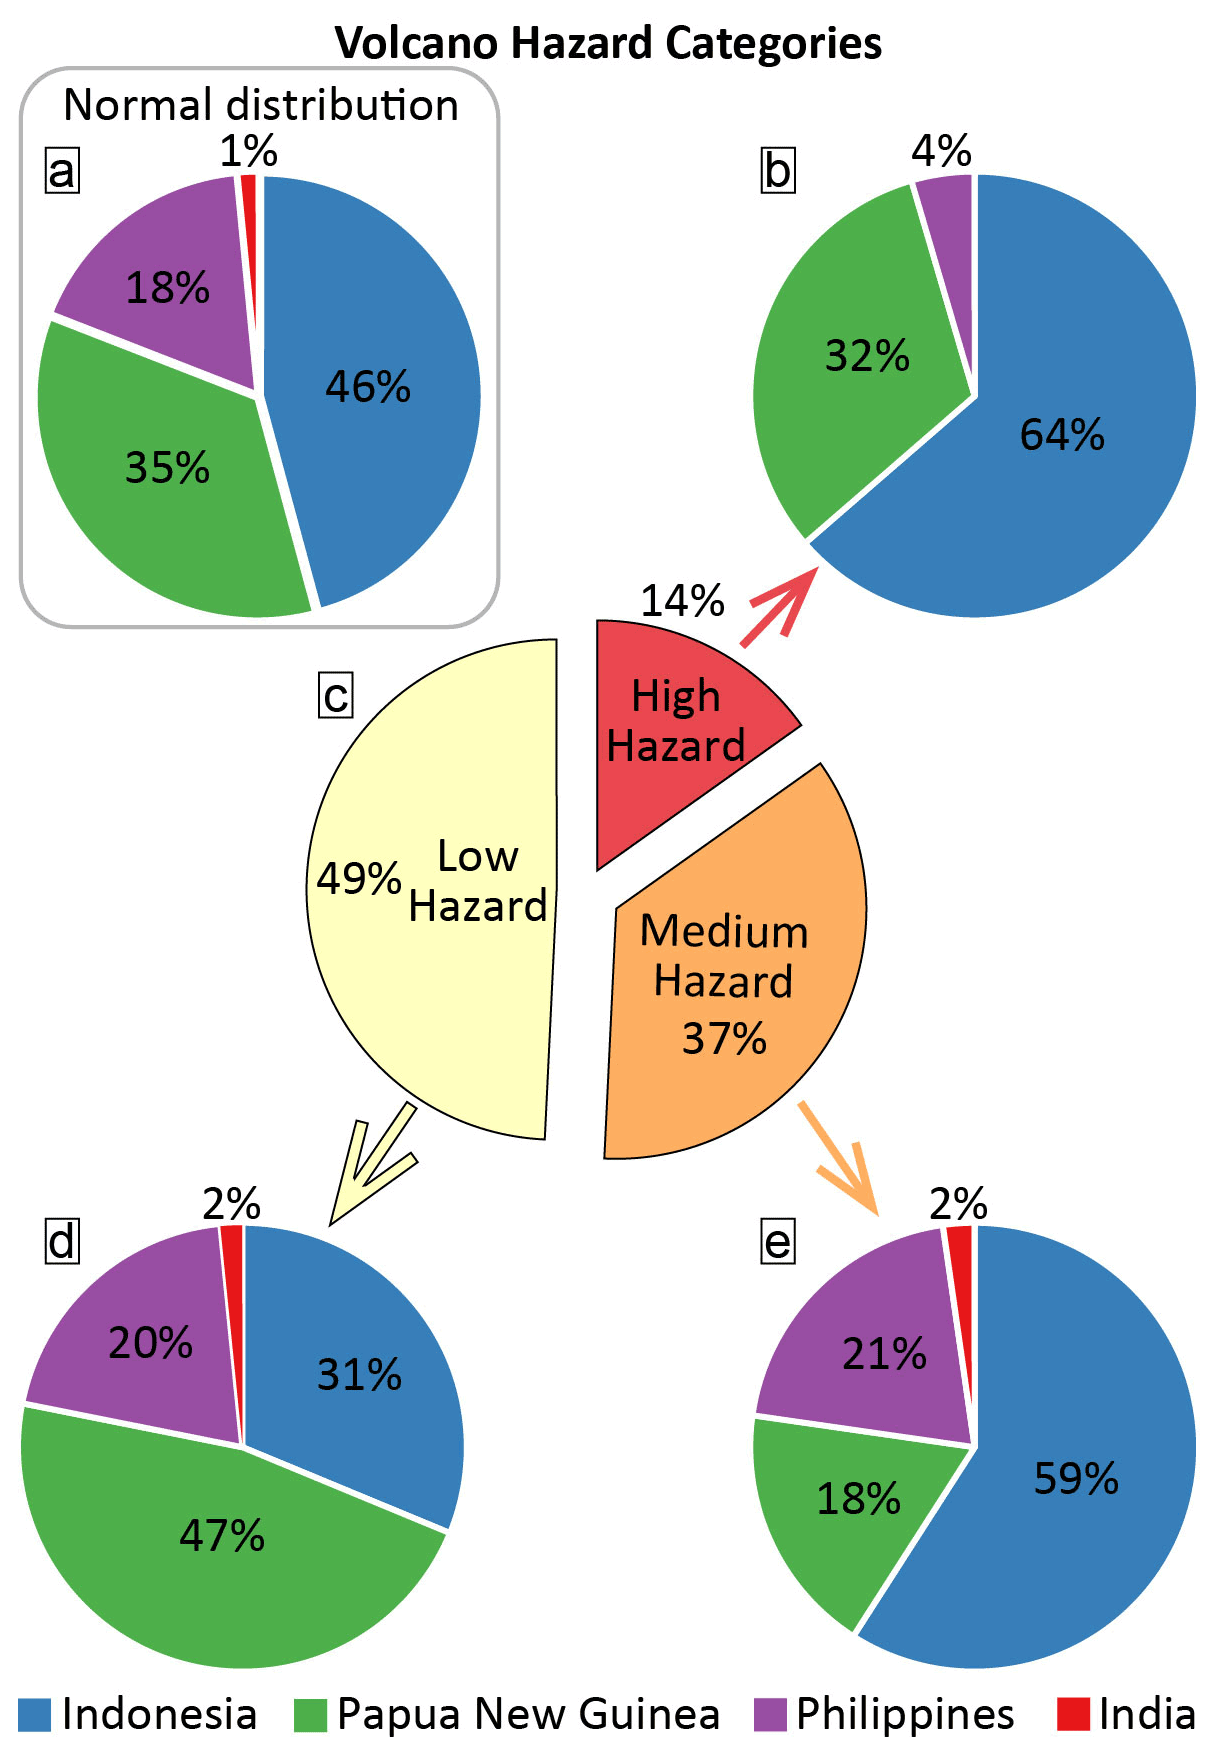
Figure 5Tsunamigenic hazard from individual volcanoes by country. Shown are (a) all considered volcanoes by country and (c) their hazard categories according to our ranking. These are then split in their respective distribution between the countries for (b) high-hazard, (d) medium-hazard, and (e) low-hazard volcanoes. We find a disproportionately large number of high- and medium-hazard category volcanoes located in Indonesia (∼ 64 % and ∼ 59 %, respectively), which is much larger than expected since Indonesian volcanoes make up only ∼ 46 % of all volcanoes in our catalogue. In contrast, the Philippines has a lower share of high-hazard volcanoes (∼ 4 %, only one volcano) but makes up 18 0% of all volcanoes in our catalogues. Papua New Guinean volcanoes make up ∼ 35 % of the catalogue, so they can be considered underrepresented in the medium-hazard category and overrepresented in the low-hazard category.
Our review of historical tsunamis in Southeast Asia contains 61 distinct events (Table 1) and shows that the majority of the historical volcanogenic tsunamis still have an unknown or uncertain cause (Fig. 6). However, we can still extract that the most known or suspected causes were explosions (21 %), followed by mass movements like pyroclastic flows (19 %) and landslides (14 %). Volcanic earthquakes rarely cause tsunamis by themselves since volcanic quakes are usually much weaker compared to tectonic events, and lava dome growth is a rather specific eruption style and thus less frequent in producing tsunamis (here only 2 cases). Some cascading events also occurred, involving multiple causes (here 3 cases), which were once an earthquake and a landslide and twice an explosion and pyroclastic flow. It is noteworthy that most known cases of volcanogenic tsunamis are produced by pyroclastic flows and explosions, both of which are commonly associated with strong eruptive activity. Gravitational failures such as landslides or lava dome collapses occur less frequently but do not necessarily require ongoing eruptions.
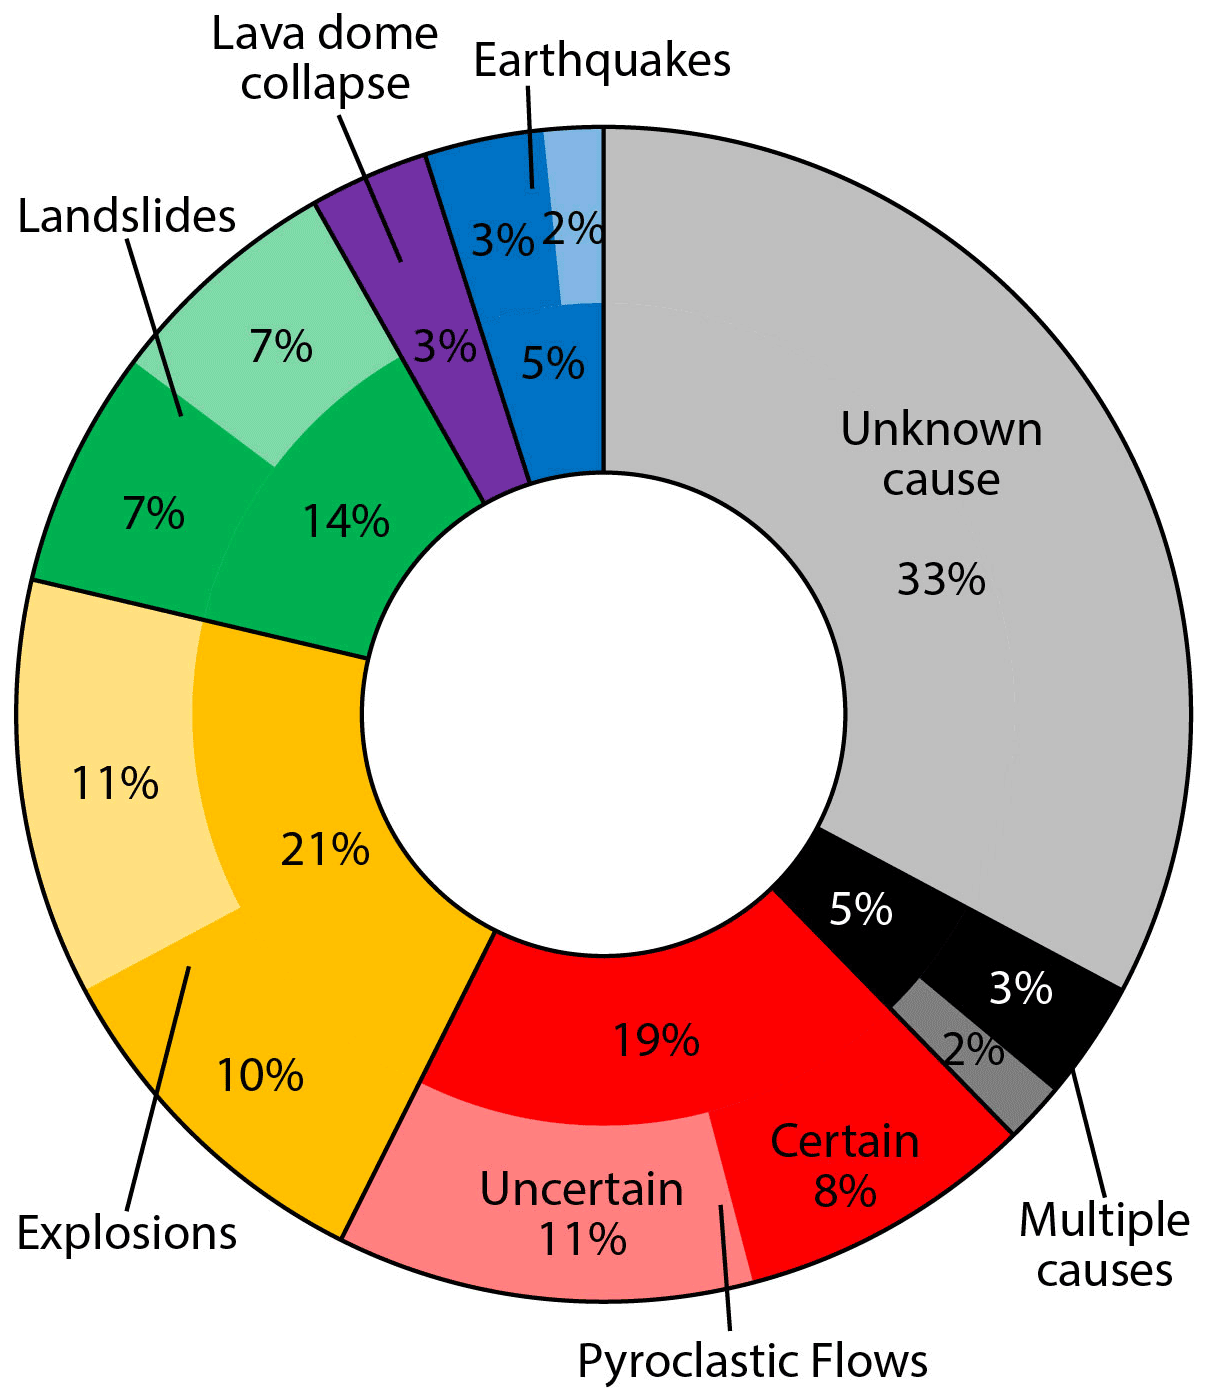
Figure 6The historical causes of volcanogenic tsunamis in SE Asia sourced from Table 1; uncertain causes are shown in a lighter shade. While there are still many unknown tsunami sources, about 66 % including both unknown and uncertain events, most known cases are caused by mass movements (pyroclastic flows and landslides), and about a fifth is attributed to explosions, whereas earthquakes and lava domes rarely produce tsunamis. For the purpose of this figure, air waves were grouped with explosions as they also require a strong explosion.
4.1 Evaluating scores and ranking through recent tsunami events
In 2018, both Anak Krakatau, Indonesia, and Kadovar, Papua New Guinea, produced tsunamis, with good-quality topographic data available and their circumstances being well known (Plank et al., 2019; Walter et al., 2019). The changes resulting from the events are displayed in Fig. 7. One important aspect when judging the usefulness of our ranking is its ability to correctly identify volcanoes that are most likely to produce tsunamis in the future. We tested this by comparing the scores of both volcanoes as they are now compared to how they were before the tsunami events. The morphology of Anak Krakatau has changed quite significantly following the 2018 flank collapse (Darmawan et al., 2020). The island is reduced in size and became lower in elevation, which consequently reduced the ratio factor points (Fig. 7a–d). However, it now has a crater that is open to the sea, and it still has a history of many tsunamis and regular recent eruptions, thus only changing the score slightly from 76 points before the collapse to 67 points after (Table 2). Consequently, Anak Krakatau was the highest-hazard volcano before its collapse and tsunami occurred, confirming that our approach would have correctly identified the volcano as a threat. Now, after the collapse, it is still among the highest-scoring volcanoes, meaning the recent 2018 tsunami and the event changed little in its overall status. However, the 2018 flank collapse indeed lowered the score, which is reasonable since the main volcanic edifice has yet to rebuild after the collapse. Further tsunamis through further collapses, explosions, or pyroclastic flows are still potential tsunami causes that may occur at Anak Krakatau in the near future.
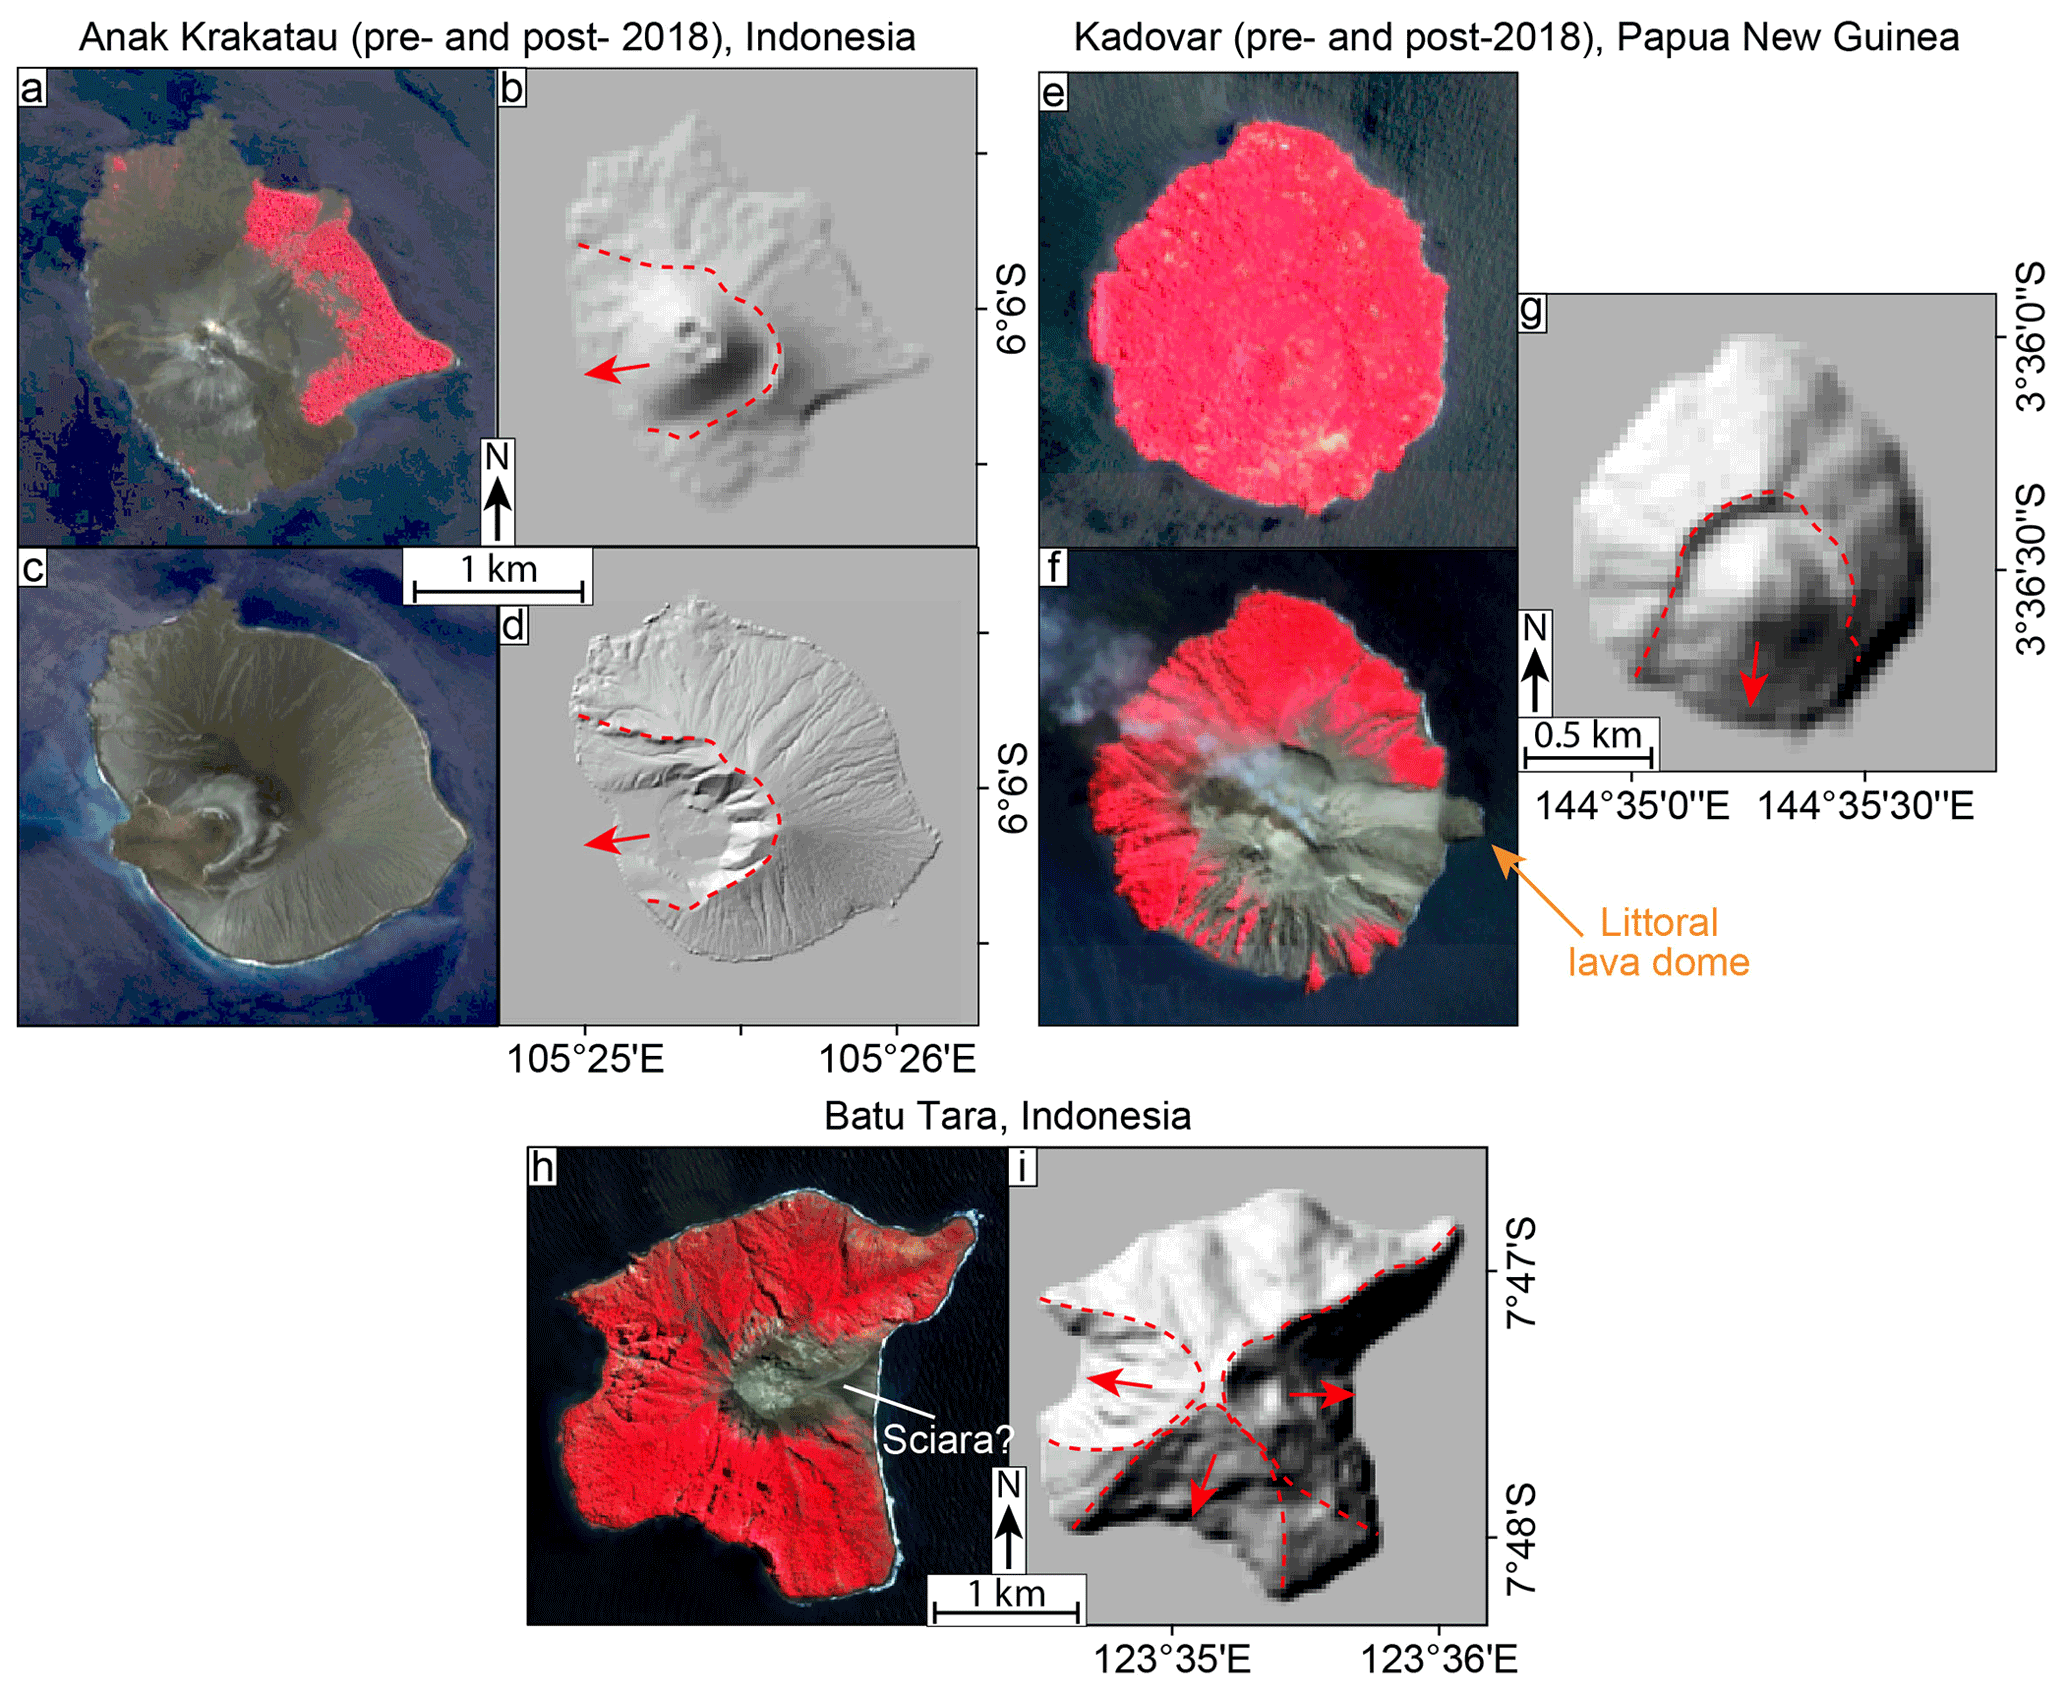
Figure 7Remote sensing data for Anak Krakatau (a–d) and Kadovar (e–g) and Batu Tara (h, i) volcanoes. Anak Krakatau and Kadovar are shown before and after their 2018 tsunamis. Sentinel-2 images in false colour bands 8 (NIR), 4 (red), and 3 (green) show a drastic reduction of vegetation (seen as red) after both events due to the volcanic activity. For the scoring, this mainly affects Kadovar, which appeared fully vegetated before the event (e). The DEMs also illustrate the massive morphological changes on Anak Krakatau due to the flank collapse (b, d), which strongly affected the ratio and the slope angle in our scoring. Both islands also show amphitheatre collapse scars (dashed lines) visible on the DEMs. Notably, the new failure scar from Anak Krakatau after the collapse (d) is nearly identical to the scar at this volcano before the collapse (b). On the other hand, the old scar at Kadovar (g) did not produce another failure, but the tsunami was triggered by a partial collapse at the newly grown littoral lava dome. For Batu Tara we highlight the development of a steep slope reminiscent of the Sciara del Fuoco at Stromboli volcano, Italy, where scoria, lava flows, and PDCs are directed towards the sea. The island also features multiple collapse scars, suggesting past flank failures.
For Kadovar, the changes were different. While the 2018 eruption produced a new vent and formed a littoral lava dome (Plank et al., 2019), the overall topography of the island did not change significantly (Fig. 7e–g). Here, the tsunami was not generated as a result of a major flank collapse but rather due to a collapse of the littoral dome and smaller parts of the eastern flank south of the dome (Plank et al., 2019). However, before the eruption, Kadovar had no known historic eruptions, although it is possible that one occurred in 1700, but this is unconfirmed (Global Volcanism Program, 2013; Llanes et al., 2009). In 1976 the island residents were briefly evacuated due to strong fumarolic activity and fears of an eruption, which ultimately did not occur (Llanes et al., 2009). Thus, before its 2018 eruption, the island could only be considered to have historic unrest, which lowered the score significantly. The score was 45 points before the 2018 tsunami, meaning Kadovar would still have been identified as a volcano with an elevated hazard (medium category) before the eruption. However, given its high eruptive activity now, the score has increased strongly. If the unconfirmed eruption in 1700 is included, the hazard score would be significantly higher at 54 points, just outside the high-hazard category. This highlights that a better-constrained volcanic history on some volcanoes can significantly improve the meaningfulness of this ranking. Now, after the 2018 tsunami, Kadovar scores 72 points, making it the third-highest tsunami hazard in SE Asia based on our ranking. Both the steep south-facing flank and the littoral lava dome are still in place and may pose a large tsunami hazard in the future, especially if the eruptive activity continues.
From both of these cases we can conclude that our ranking system is able to identify hazardous volcanoes reasonably well before a tsunami occurs. While individual volcano scores may change significantly over time due to eruptions or morphological changes, the applied multi-categorised approach has worked well for both Anak Krakatau and Kadovar. However, these cases also emphasise that particular attention should be devoted to coastal volcanoes with unclear eruptive histories, especially when they become active after decades or centuries of no activity.
We further investigate the score of the currently highest ranking volcano with our method, Batu Tara, Indonesia, with 76 points. This lone and small volcanic island is located north of the Lesser Sunda Islands and positioned centrally between the Flores Sea and Banda Sea. The island's high eruptive activity is well documented and appears to be mostly strombolian to vulcanian (Spina et al., 2021), but also pyroclastic flows and rockfalls were reported to reach the sea (Global Volcanism Program, 2013). The volcano is also exceptionally steep, with the eastern flank measuring an incline of about 50∘. Despite its relatively small size, the island has an elevation of 753 m, making it 2.5 times higher than Anak Krakatau before its collapse. Despite its activity and morphology, no recorded instances of historical tsunamis are known from this volcano, although smaller past events could easily have been missed as the island is uninhabited. However, there are multiple scars on different sides of the island, indicating major past collapse events (Fig. 7h, i). All this results in very high scores in all factors except its tsunamigenic history.
Batu Tara is often compared to Stromboli volcano, Italy, which has a similar style of eruptive activity and morphological features, including multiple sector collapse scars (Laiolo et al., 2018; Spina et al., 2021). The morphology of Batu Tara's eastern flank is strikingly reminiscent of the Sciara del Fuoco, both of which channel recent eruptive material towards the sea, which is clearly distinguishable in the loss of vegetation on these flanks (Fig. 7h). Contrary to Batu Tara, Stromboli is inhabited and is a well-known tsunami hazard evident both through its sector collapses in its geological history (Tibaldi, 2001; Tinti et al., 2003) and more recent tsunamis such as in 2002 caused by partial flank failure and landslide (Bonaccorso et al., 2003; Fornaciai et al., 2019). For this reason, the high score of Batu Tara is very likely justified, and its consideration as a high-hazard tsunamigenic volcano is reasonable. Since this volcano is less well known compared to islands like Anak Krakatau, future monitoring efforts and tsunami risk modelling should make Batu Tara a high-priority target.
4.2 Future tsunami hazards in SE Asia
To allow for a more detailed look at future tsunami hazards in SE Asia, we summarised in which locations a high concentration of hazardous volcanoes is located. This was done by performing a weighted point density calculation, highlighting areas where many tsunamigenic volcanoes are located closely together (Fig. 8). For this, we used the kernel density function of Esri® ArcMap™ (version 10.5.0.6492), which calculates the point density using the interpolated number of points (the volcano locations) within a specified search radius, here ∼ 280 km. The point number is multiplied by our hazard score value for the respective point volcano, which additionally increases the density value in the area around volcanoes with high scores. The result shows that the areas with the highest volcanogenic tsunami hazard are located around the Indonesian Lesser Sunda Islands, particularly between East Nusa Tenggara and the Alor Archipelago, at the Molucca Sea coast between northern Sulawesi and Halmahera, and at the southern Bismarck Sea in Papua New Guinea. Further elevated hazard areas can be found within the Indonesian Banda Sea, the Philippine Luzon Strait, the central Philippine islands, and along the southern Solomon Sea coast of Papua New Guinea. These areas can thus be considered to be the most likely areas to source volcanic tsunamis and are therefore important to prioritise for tsunami monitoring, modelling, and forecasting. A brief feature of individual high-hazard volcanoes can be found in Supplement S3.
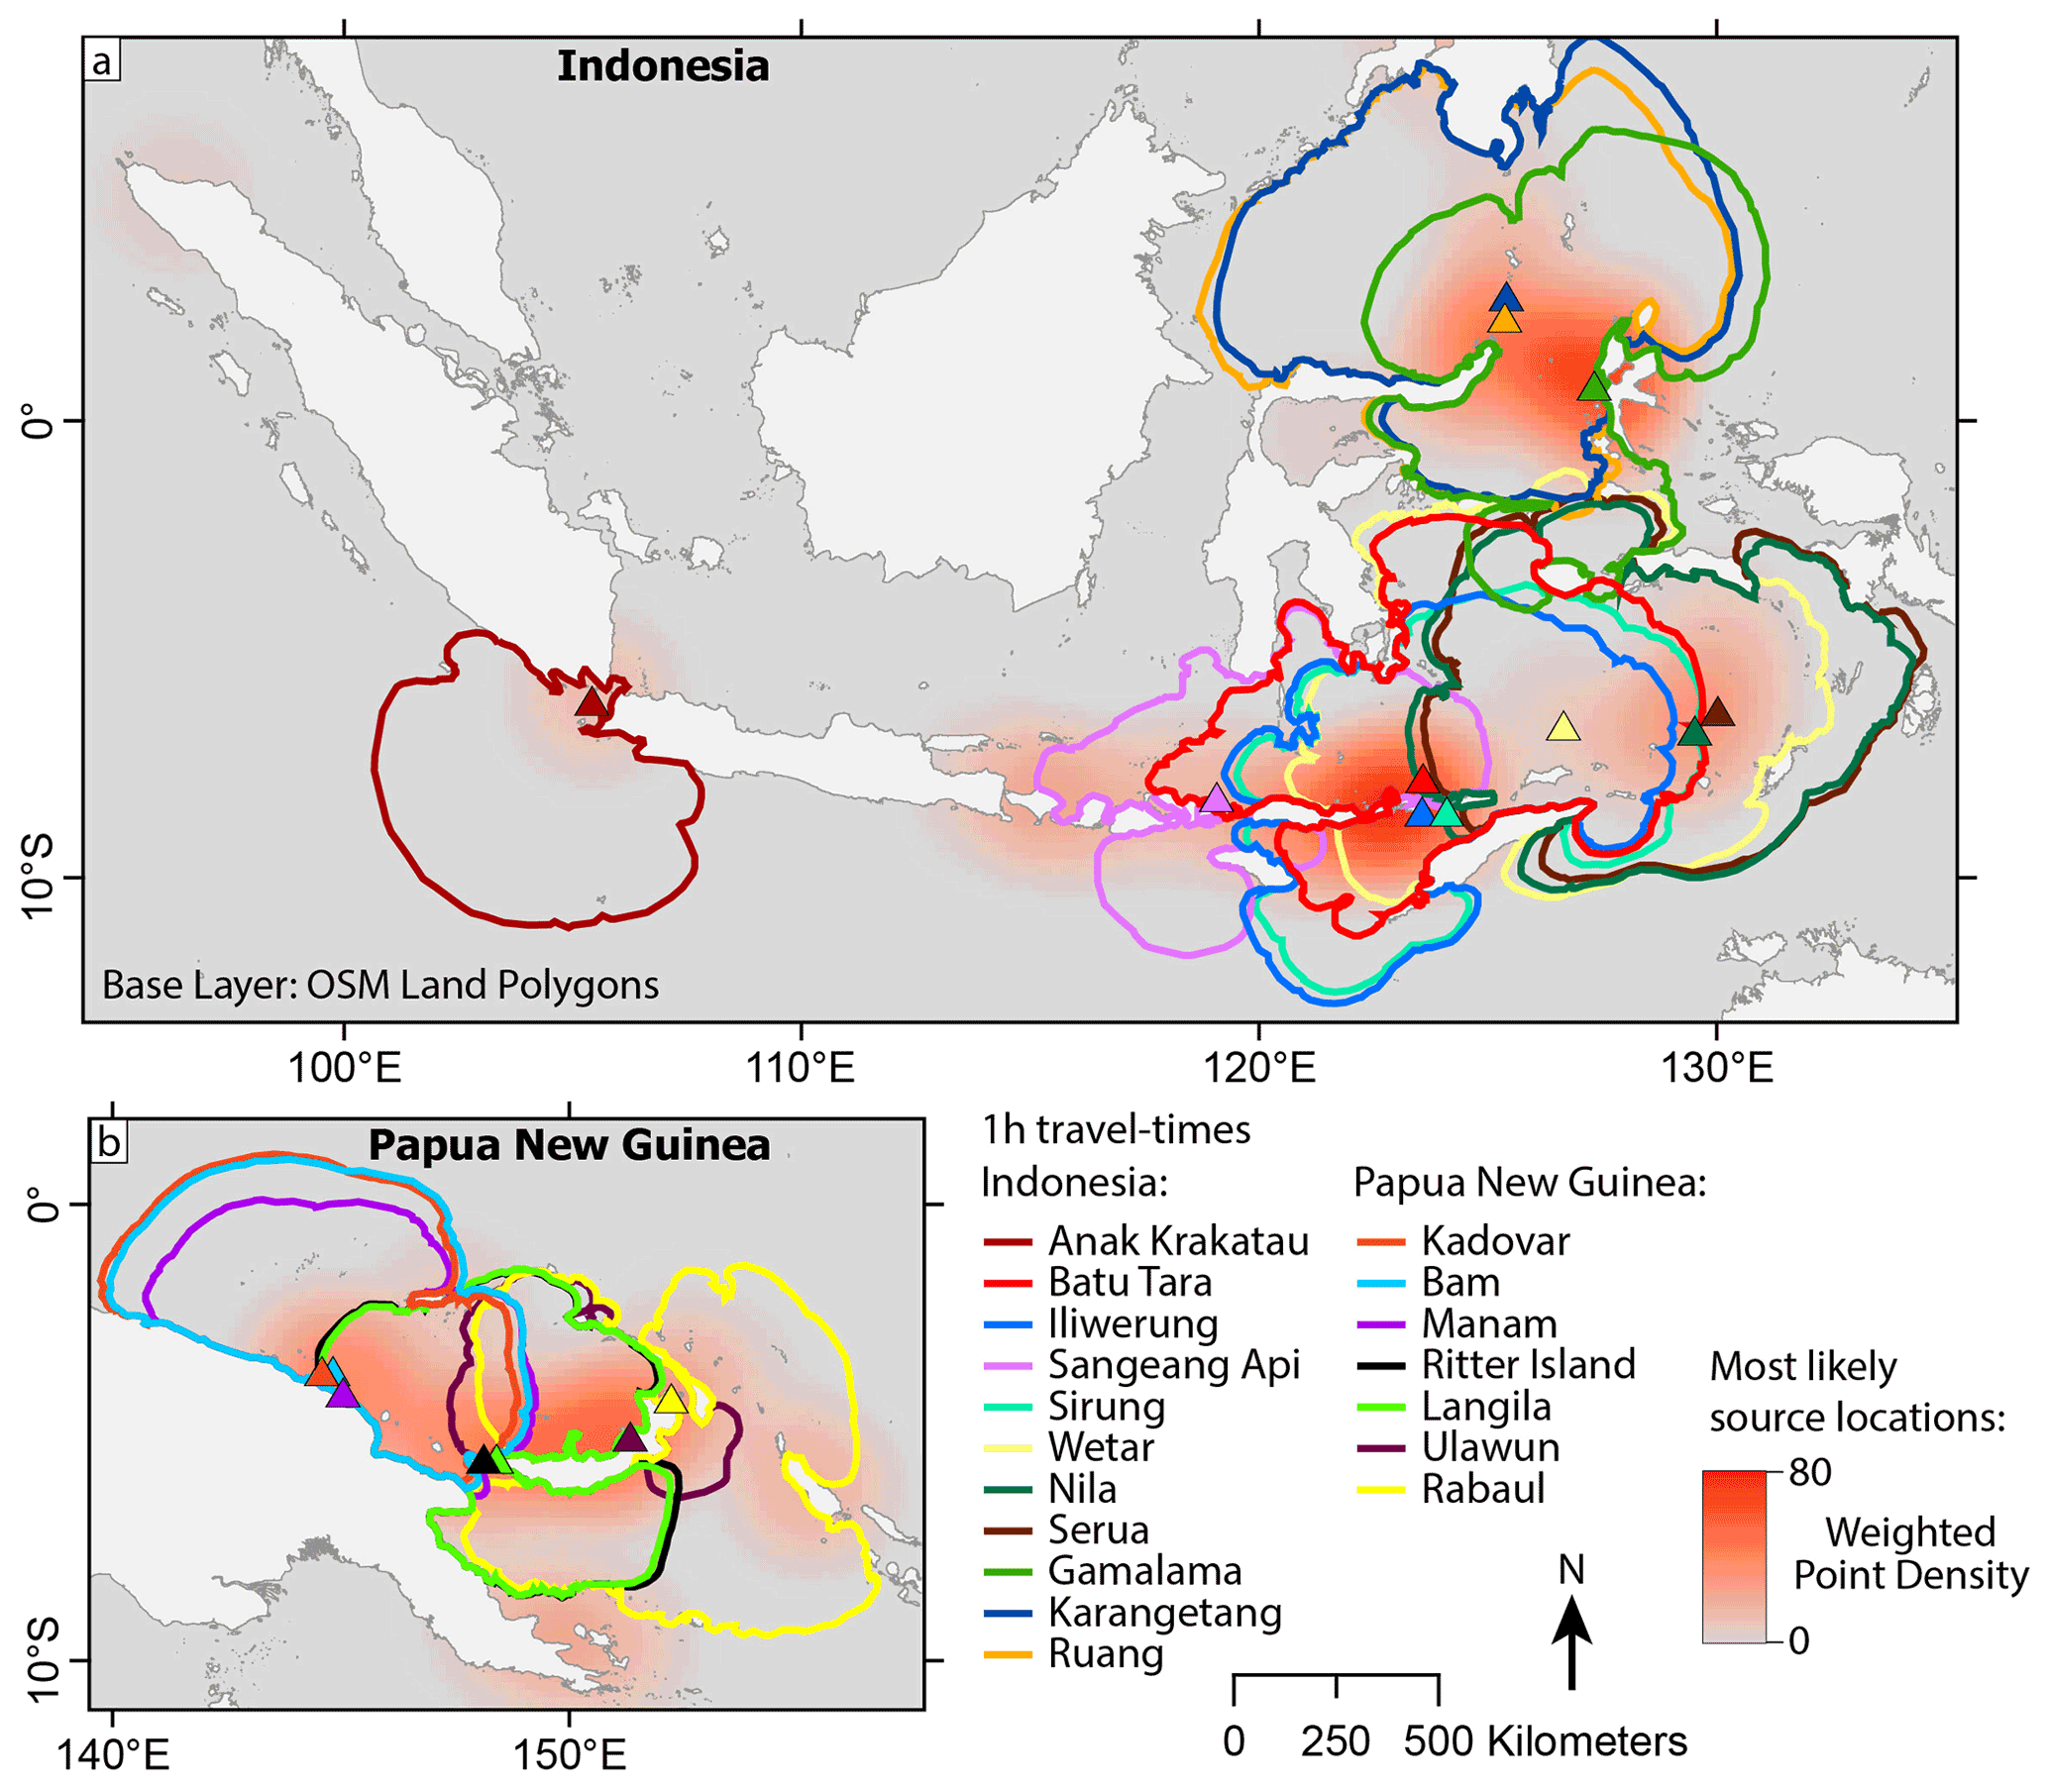
Figure 8Travel-distance plots of tsunamis originating at a high-hazard volcano after 60 min in (a) Indonesia and (b) Papua New Guinea. How much coastline is affected by each volcano is summarised in Table 3. The additional heat map shows the most likely source locations based on a weighted point density calculation using our hazard score. A higher density means the area is closer to many tsunamigenic volcanoes. This highlights that particularly the Lesser Sunda Islands and the northern Molucca Sea in Indonesia as well as the southern Bismarck Arc in Papua New Guinea are likely hot spots for future volcanogenic tsunamis, and events from high-hazard volcanoes identified by our ranking may affect large amounts of coastline in a short time. Base map data source: © OpenStreetMap contributors 2022. Distributed under the Open Data Commons Open Database Licence (ODbL) v1.0.
In order to assess the risks and impacts of volcanogenic tsunamis, numerical simulations are commonly used, both for distinct future scenarios and in retrospect for past events. For Southeast Asia, a large number of such studies had been conducted. Most models were done for Anak Krakatau, looking specifically at the 2018 flank collapse with some using the known event to calibrate and confirm the quality of current simulation methods (Borrero et al., 2020; Grilli et al., 2019; Mulia et al., 2020; Omira and Ramalho, 2020; Paris et al., 2020; Zengaffinen et al., 2020), some using the known tsunami data (e.g. from tide gauges) to identify source parameters (Grilli et al., 2021; Heidarzadeh et al., 2020; Ren et al., 2020), and some testing variations in the source parameters to characterise potential future events (Dogan et al., 2021). In general, the consensus is that a landslide between 0.1 and 0.3 km3 volume that occurred both with a subaerial and a submarine component is mostly consistent with the observed and modelled run-up heights at the adjacent shores. Similar models also exist for the 1883 tsunami at Krakatau, with the main purpose being the identification of its generation mechanism (Maeno and Imamura, 2011) and how such a tsunami propagates in the far field (Choi et al., 2003). Predictive studies only considering possible future events are not as abundant but have been done for Anak Krakatau before the 2018 tsunami (Badriana et al., 2017; Giachetti et al., 2012), with Giachetti et al. (2012) making a remarkably close prediction to the later event. Other volcanoes in Southeast Asia are not as commonly considered. Pranantyo et al. (2021) test the tsunami propagation from Ruang volcano, Indonesia, using and comparing both historical observations and data from the 2018 Anak Krakatau event and reproducing a 25 m run-up in the near field. In Papua New Guinea numerical tsunami models have almost exclusively been considered for the Ritter Island tsunami in 1888 and the reconstruction of its generation (Karstens et al., 2020; Ward and Day, 2003). Similarly, numerical tsunami models in the Philippines are mostly limited to Taal volcano, where models are based both on a past tsunami in 1716 (Pakoksung et al., 2021) and a predictive study considering scenarios with different explosion sites and energies (Paris and Ulvrova, 2019). Considering these works, it is clear that tsunamis induced by volcanoes can be well explained with numerical models, but the considered volcanoes remain limited to a few select sites and scenarios. These models are also typically restricted to one particular volcano and one specific mechanism of tsunami generation as a retrospectively investigation.
Consequently, predictive studies remain rare (Giachetti et al., 2012; Paris and Ulvrova, 2019) and are only possible because the specific local circumstances leading to the tsunami are very well understood, which is knowledge that is lacking for most coastal volcanoes. Here, we provide multiple predictive models for the volcanoes we classified as posing a high tsunamigenic hazard. As volcanogenic tsunamis are caused by a large variety of mechanisms (Fig. 6), we contribute to this aspect by providing a simplified and broader view of the travel times of potential future tsunamis that are unspecific to the mechanism of tsunami generation and their magnitude (with the possible exception of meteotsunamis as seen at Hunga Tonga–Hunga Ha'apai in 2022, which appear to have different wave propagation properties). We mainly account for the potential spatial impact of volcanogenic tsunamis and extend our tsunami hazard evaluation by assessing the total length of a coastline affected within 1 and 2 h of tsunami propagation for the volcanoes categorised as high hazard in our ranking (except Didicas). For that, we compute tsunami travel times (TTT) from point sources centred at each volcano position using the SRM30+ bathymetry (Becker et al., 2009) resampled to 1 arcmin resolution and the numerical algorithm as proposed by Marchuk (2008). This means that we can simulate the travel and arrival times of specific volcanoes independent of how the tsunami was generated (as long as it is a point source), but we also cannot consider specific wave heights or run-up as these depend strongly on the specific source mechanism and magnitude of the event and require additional and much more specific modelling data for individual sites. Figure 8 shows our calculated tsunami propagation fronts after 1 h of wave propagation. Table 3, in turn, lists the total lengths of the coastlines affected after 1 and 2 h of propagation, respectively. Detailed tsunami travel time plots for the individual volcanoes can be found in Supplement S4.
Table 3The affected coastline of a tsunami originating from high-hazard volcanoes extracted using the tsunami travel time modelling. We note that Anak Krakatau, where the most prominent event in recent years occurred in 2018, affects the lowest length of coastline. This highlights that similar events at other locations can have much more widespread impacts.
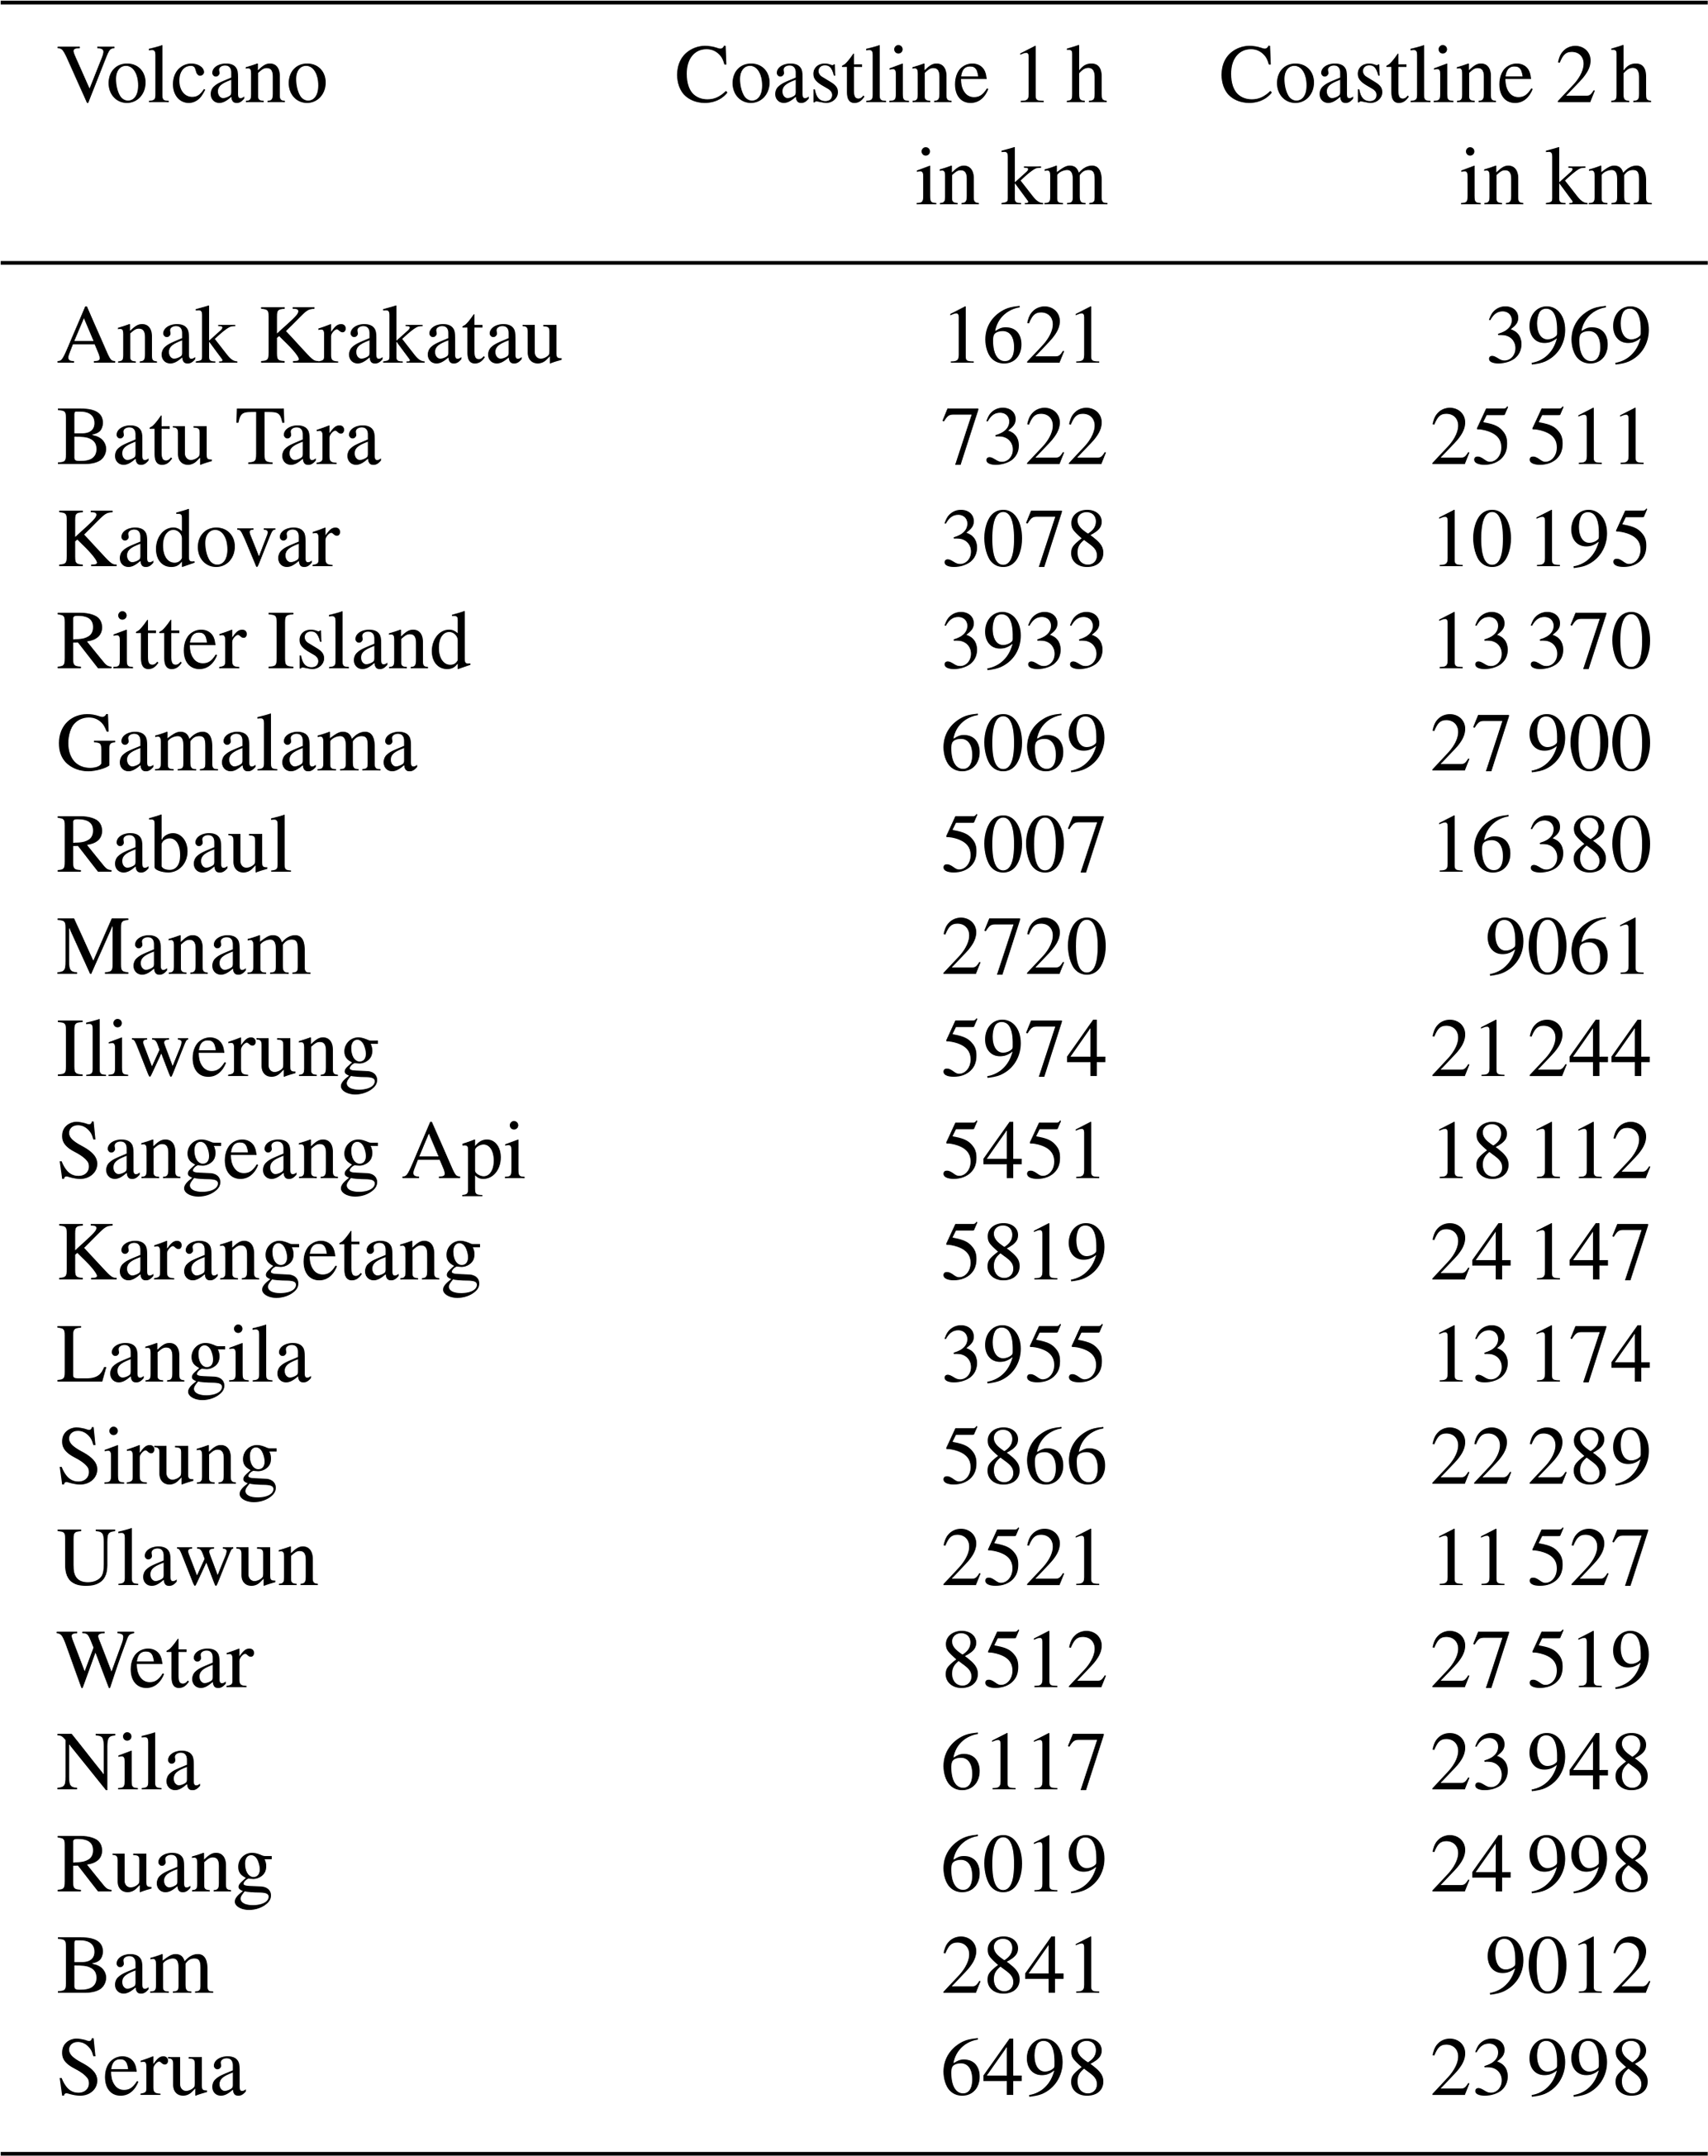
The results show the potentially wide reach of volcanogenic tsunamis in both Indonesia and Papua New Guinea (Fig. 8), but it also reveals surprising differences. Anak Krakatau is only projected to affect ∼ 1600 km of coastline within 1 h (Table 1), and the area is restricted mostly within the Sunda Strait coast and parts of southern Java and Sumatra. This is nearly consistent with the 2018 tsunami, where the impacts were only within the Sunda Strait (e.g. Paris et al., 2020). All other volcanoes may produce tsunamis affecting a lot more coasts (Table 3). Batu Tara, which is now the highest-scoring volcano in our catalogue, is projected to affect a coastline of ∼ 7300 km, almost 5 times as much as Anak Krakatau within the same time. The longest total affected coastline of ∼ 8500 km (after 1 h of propagation) is calculated for Wetar, covering almost the entire Banda Sea. Tsunamis from the northern volcanoes in Indonesia are shown to potentially reach up to the Philippines as well as cover large parts of northern Sulawesi and Halmahera, and almost all volcanoes in Papua New Guinea (with the exception of Rabaul) reach through most of the Bismarck Sea.
While our models are limited to the travel time, they can be used to estimate the warning time for shores in case a tsunami occurs at one of the considered volcanoes. Despite demonstrating the potential to affect large coastal areas, our TTT modelling does not inform how severe a tsunami from a volcanic source could actually turn out. In fact, tsunami travel time modelling accounts for neither source magnitude nor energy transfer. Full source process simulation coupled to modelling of the full wave propagation is needed to assess the magnitude of the coastal impact. In particular, the models are expected to strongly depend on the mechanism triggering the tsunami, i.e. a landslide, PDC, or explosion, as well as the magnitude of the event. For example, in landslide or sector collapse events, the largest run-ups and the most severe impacts are expected to be largest in the near field of the volcano but may still be significant in the far field (Grilli et al., 2021; Harris et al., 2012). Furthermore, the recent Hunga Tonga–Hunga Ha'apai eruption has shown that large eruptions are capable of generating meteotsunamis travelling long distances without significant loss of amplitude. This particular tsunami also travelled faster than initially expected (Somerville et al., 2022). Similarly, it is important to emphasise that the probability of the modelled tsunamis is not equal between the volcanoes, and we cannot present a full risk assessment (including, for example, the tsunami probability within a given time period), since the required data are still too sparse. However, our ranking can prioritise which volcanoes are most likely to produce such an event as demonstrated here, but this type of analyses would greatly benefit from quantitative data on future tsunami probability. An additional issue may be the point-based approach of our models, which can cause erroneous arrival times, particularly in the near field of the tsunami source, if the source is spatially more complex. For volcanic tsunamis with yet unknown properties, point sources are likely appropriate for most cases as the most common sources – explosions, PDCs, landslides, and lava dome collapses (Fig. 5) – are typically not larger than a few hundred metres. However, large-scale sector failures of volcanoes or certain types of earthquakes can likely displace water over larger areas simultaneously and may require more complex source models to accurately capture the tsunami wave near field.
To compensate for these knowledge gaps, full physics-based source and propagation modelling, especially if they are coupled to the population density information along the coasts, may become the most useful tool to improve our understanding of the risk posed by volcanogenic tsunamis. So far, published models almost exclusively consider Anak Krakatau (e.g. Grilli et al., 2019; Heidarzadeh et al., 2020; Mulia et al., 2020; Omira and Ramalho, 2020; Paris et al., 2020), whereas the risk posed by the other high-hazard volcanoes in our catalogue is largely unknown, emphasising the need for future investigations and modelling efforts. For future hazard and risk assessments, we thus recommend supplementing the knowledge from our TTT models with specific detailed scenario calculations using established numerical modelling approaches, particularly for those high-hazard volcanoes where no such models exist (e.g. Batu Tara, Iliwerung, Nila). This, coupled with the prioritisation of specific volcanoes provided by our ranking, can provide a well-founded basis for future disaster mitigation strategies. While the detection of volcanic processes triggering a tsunami will remain challenging to detect due to the multiple possible generation mechanisms, other steps can be done to improve warning times. These include the addition of strategically placed tide gauges as suggested by Annunziato et al. (2019) or improved real-time volcano monitoring through seismometers, radar, cameras, or infrasound sensors. Regular use of satellite data (e.g. InSAR) can also help to pre-emptively identify volcanic unrest or destabilising flanks.
Based on our MCDA analysis considering 131 volcanoes in SE Asia, we identify 19 that pose a high tsunami hazard and another 48 with moderate tsunami hazard. We find our ranking system to be robust for the higher-scoring volcanoes, meaning that we can reliably identify the most likely volcanoes to produce a tsunami in the future. For volcanoes with moderate to low scores, the ranking is less robust and more susceptible to subjective judgement. The main limitations remaining are (1) a lack of knowledge of how much individual factors contribute to the tsunami hazard of a volcano, instead requiring subjective assumptions; (2) erroneous, incomplete, or insufficient data availability for many volcanoes (e.g. bathymetry or historical data); and (3) the multitude of different mechanisms which may cause a volcanic tsunami (i.e. PDCs, landslides, explosions), making a clear scenario assessment challenging.
Our results show that the Indonesian Lesser Sunda Islands and northern Molucca Sea as well as the southern Bismarck Sea in Papua New Guinea are areas with a high number of hazardous volcanoes and may thus be particularly prone to tsunamis induced by volcanoes. Many of these volcanoes such as Batu Tara, Indonesia, are not commonly considered for this type of hazard. We therefore emphasise the need to reconsider the current state of monitoring and risk assessment in these areas. Since tsunami warning systems are mostly not designed to detect volcanogenic tsunamis, our results highlight the importance of a reassessment of the current network and additional suitable equipment on the ground and through Earth observation satellites. Due to the inherently short warning times of these events, we also recommended increased pre-emptive measures on a local level, such as increased public education programmes for coastal communities and the marking of evacuation routes along populated coasts.
The data used to create the MCDA ranking and more detailed TTT model plots can be freely accessed in the Supplement. NETVOLC and MORVOLC data for individual volcanoes are available from the corresponding author upon reasonable request.
The supplement related to this article is available online at: https://doi.org/10.5194/nhess-22-3083-2022-supplement.
EUZ conceptualised and wrote the manuscript. Figures were prepared by EUZ and AO. EUZ also performed the analyses and evaluations of the individual volcanoes. EUZ, AO, SP, TRW, and IFR jointly developed the point score system. Tsunami travel time modelling was performed by AB, and photogrammetric data for Anak Krakatau were provided by HD. All authors contributed to the writing and editing of the manuscript.
The contact author has declared that none of the authors has any competing interests.
Publisher’s note: Copernicus Publications remains neutral with regard to jurisdictional claims in published maps and institutional affiliations.
This article is part of the special issue “Tsunamis: from source processes to coastal hazard and warning”. It is not associated with a conference.
We thank the two anonymous reviewers as their comments greatly improved the quality of the manuscript. We also thank Raphaël Paris for friendly and helpful feedback on the manuscript.
This research has been supported by the Federal Ministry of Education and Research of Germany in the framework of the TSUNAMI_RISK project (grant nos. 03G0906A and 03G0906B), which is a part of the funding initiative CLIENT-II.
The article processing charges for this open-access publication were covered by the Helmholtz Centre Potsdam – GFZ German Research Centre for Geosciences.
This paper was edited by Mohammad Heidarzadeh and reviewed by two anonymous referees.
Airbus: Copernicus DEM Validation Report (v2.1), https://spacedata.copernicus.eu/documents/20126/0/GEO1988-CopernicusDEM-SPE-002_ProductHandbook_I1.00.pdf (last access: 19 September 2022), 2020.
Annunziato, A., Prasetya, G., and Husrin, S.: Anak Krakatau volcano emergency tsunami early warning system, Science of Tsunami Hazards, 38, 68–95, ISSN 8755-6839, 2019.
Badriana, M. R., Bachtiar, H., Adytia, D., Sembiring, L., Andonowati, and Groesen, E. v.: Wave run-up of a possible Anak-Krakatau tsunami on planned and optimized Jakarta Sea Dike, AIP Conf. Proc., 1857, 090004, https://doi.org/10.1063/1.4987103, 2017.
Becker, J. J., Sandwell, D. T., Smith, W. H. F., Braud, J., Binder, B., Depner, J., Fabre, D., Factor, J., Ingalls, S., Kim, S. H., Ladner, R., Marks, K., Nelson, S., Pharaoh, A., Trimmer, R., Von Rosenberg, J., Wallace, G., and Weatherall, P.: Global Bathymetry and Elevation Data at 30 Arc Seconds Resolution: SRTM30_PLUS, Mar. Geod., 32, 355–371, https://doi.org/10.1080/01490410903297766, 2009.
Belousov, A., Belousova, M., and Voight, B.: Multiple edifice failures, debris avalanches and associated eruptions in the Holocene history of Shiveluch volcano, Kamchatka, Russia, B. Volcanol., 61, 324–342, https://doi.org/10.1007/s004450050300, 1999.
Belousov, A., Voight, B., Belousova, M., and Muravyev, Y.: Tsunamis Generated by Subaquatic Volcanic Explosions: Unique Data from 1996 Eruption in Karymskoye Lake, Kamchatka, Russia, Pure Appl. Geophys., 157, 1135–1143, https://doi.org/10.1007/s000240050021, 2000.
Bonaccorso, A., Calvari, S., Garfì, G., Lodato, L., and Patanè, D.: Dynamics of the December 2002 flank failure and tsunami at Stromboli volcano inferred by volcanological and geophysical observations, Geophys. Res. Lett. 30, 1941, https://doi.org/10.1029/2003GL017702, 2003.
Borrero, J. C., Solihuddin, T., Fritz, H. M., Lynett, P. J., Prasetya, G. S., Skanavis, V., Husrin, S., Kushendratno, Kongko, W., Istiyanto, D. C., Daulat, A., Purbani, D., Salim, H. L., Hidayat, R., Asvaliantina, V., Usman, M., Kodijat, A., Son, S., and Synolakis, C. E.: Field Survey and Numerical Modelling of the December 22, 2018 Anak Krakatau Tsunami, Pure Appl. Geophys., 177, 2457–2475, https://doi.org/10.1007/s00024-020-02515-y, 2020.
Brown, S. K., Jenkins, S. F., Sparks, R. S. J., Odbert, H., and Auker, M. R.: Volcanic fatalities database: analysis of volcanic threat with distance and victim classification, Journal of Applied Volcanology, 6, 15, https://doi.org/10.1186/s13617-017-0067-4, 2017.
Carey, S., Sigurdsson, H., Mandeville, C., and Bronto, S.: Volcanic hazards from pyroclastic flow discharge into the sea: Examples from the 1883 eruption of Krakatau, Indonesia, in: Volcanic Hazards and Disasters in Human Antiquity, edited by: McCoy, F. W. and Heiken, G., Geological Society of America, https://doi.org/10.1130/0-8137-2345-0.1, 2000.
Choi, B. H., Pelinovsky, E., Kim, K. O., and Lee, J. S.: Simulation of the trans-oceanic tsunami propagation due to the 1883 Krakatau volcanic eruption, Nat. Hazards Earth Syst. Sci., 3, 321–332, https://doi.org/10.5194/nhess-3-321-2003, 2003.
Crisci, G. M., De Rosa, R., Esperança, S., Mazzuoli, R., and Sonnino, M.: Temporal evolution of a three component system: the island of Lipari (Aeolian Arc, southern Italy), B. Volcanol., 53, 207–221, https://doi.org/10.1007/BF00301231, 1991.
Cronin, S. J., Lube, G., Dayudi, D. S., Sumarti, S., Subrandiyo, S., and Surono: Insights into the October–November 2010 Gunung Merapi eruption (Central Java, Indonesia) from the stratigraphy, volume and characteristics of its pyroclastic deposits, J. Volcanol. Geoth. Res., 261, 244–259, https://doi.org/10.1016/j.jvolgeores.2013.01.005, 2013.
Darmawan, H., Mutaqin, B. W., Harijoko, A., Wibowo, H. E., Haerani, N., Surmayadi, M., Jati, R., and Asriningrum, W.: Topography and structural changes of Anak Krakatau due to the December 2018 catastrophic events, Indonesian Journal of Geography, 52, 402–410, https://doi.org/10.22146/ijg.53740, 2020.
Darmawan, H., Troll, V. R., Walter, T. R., Deegan, F. M., Geiger, H., Heap, M. J., Seraphine, N., Harris, C., Humaida, H., and Müller, D.: Hidden mechanical weaknesses within lava domes provided by buried high-porosity hydrothermal alteration zones, Sci. Rep., 12, 3202, https://doi.org/10.1038/s41598-022-06765-9, 2022.
Di Traglia, F., Nolesini, T., Solari, L., Ciampalini, A., Frodella, W., Steri, D., Allotta, B., Rindi, A., Marini, L., Monni, N., Galardi, E., and Casagli, N.: Lava delta deformation as a proxy for submarine slope instability, Earth Planet. Sc. Lett., 488, 46–58, https://doi.org/10.1016/j.epsl.2018.01.038, 2018.
Dogan, G. G., Annunziato, A., Hidayat, R., Husrin, S., Prasetya, G., Kongko, W., Zaytsev, A., Pelinovsky, E., Imamura, F., and Yalciner, A. C.: Numerical Simulations of December 22, 2018 Anak Krakatau Tsunami and Examination of Possible Submarine Landslide Scenarios, Pure Appl. Geophys., 178, 1–20, https://doi.org/10.1007/s00024-020-02641-7, 2021.
ESA: Copernicus Sentinel-2 data, https://apps.sentinel-hub.com/sentinel-playground, last access: 19 September 2022.
Euillades, L. D., Grosse, P., and Euillades, P. A.: NETVOLC: An algorithm for automatic delimitation of volcano edifice boundaries using DEMs, Comput. Geosci., 56, 151–160, https://doi.org/10.1016/j.cageo.2013.03.011, 2013.
Ewert, J. W.: System for Ranking Relative Threats of U.S. Volcanoes, Nat. Hazards Rev., 8, 112–124, https://doi.org/10.1061/(ASCE)1527-6988(2007)8:4(112), 2007.
Ewert, J. W., Diefenbach, A. K., and Ramsey, D. W.: 2018 update to the U.S. Geological Survey national volcanic threat assessment, Reston, VA, Report 2018-5140, U.S. Geological Survey Scientific Investigations, 50, https://doi.org/10.3133/sir20185140, 2018.
Fernández, D. S. and Lutz, M. A.: Urban flood hazard zoning in Tucumán Province, Argentina, using GIS and multicriteria decision analysis, Eng. Geol., 111, 90–98, https://doi.org/10.1016/j.enggeo.2009.12.006, 2010.
Fisher, R. V.: Transport and deposition of a pyroclastic surge across an area of high relief: The 18 May 1980 eruption of Mount St. Helens, Washington, GSA Bulletin, 102, 1038–1054, https://doi.org/10.1130/0016-7606(1990)102<1038:TADOAP>2.3.CO;2, 1990.
Fornaciai, A., Favalli, M., and Nannipieri, L.: Numerical simulation of the tsunamis generated by the Sciara del Fuoco landslides (Stromboli Island, Italy), Sci. Rep., 9, 18542, https://doi.org/10.1038/s41598-019-54949-7, 2019.
Francis, P. W.: The origin of the 1883 Krakatau tsunamis, J. Volcanol. Geoth. Res., 25, 349–363, https://doi.org/10.1016/0377-0273(85)90021-6, 1985.
Gertisser, R. and Keller, J.: Temporal variations in magma composition at Merapi Volcano (Central Java, Indonesia): magmatic cycles during the past 2000 years of explosive activity, J. Volcanol. Geoth. Res., 123, 1–23, https://doi.org/10.1016/S0377-0273(03)00025-8, 2003.
Giachetti, T., Paris, R., Kelfoun, K., and Ontowirjo, B.: Tsunami hazard related to a flank collapse of Anak Krakatau Volcano, Sunda Strait, Indonesia, Geological Society, London, Special Publications, 361, 79, https://doi.org/10.1144/SP361.7, 2012.
Global Volcanism Program: Volcanoes of the World, v. 4.10.6 (24 March 2020), edited by: Venzke, E., Smithsonian Institution, https://doi.org/10.5479/si.GVP.VOTW4-2013, 2013.
Gonzalez-Ollauri, A. and Mickovski, S. B.: Hydrological effect of vegetation against rainfall-induced landslides, J. Hydrol., 549, 374–387, https://doi.org/10.1016/j.jhydrol.2017.04.014, 2017.
Grilli, S. T., Tappin, D. R., Carey, S., Watt, S. F. L., Ward, S. N., Grilli, A. R., Engwell, S. L., Zhang, C., Kirby, J. T., Schambach, L., and Muin, M.: Modelling of the tsunami from the December 22, 2018 lateral collapse of Anak Krakatau volcano in the Sunda Straits, Indonesia, Sci. Rep., 9, 11946, https://doi.org/10.1038/s41598-019-48327-6, 2019.
Grilli, S. T., Zhang, C., Kirby, J. T., Grilli, A. R., Tappin, D. R., Watt, S. F. L., Hunt, J. E., Novellino, A., Engwell, S., Nurshal, M. E. M., Abdurrachman, M., Cassidy, M., Madden-Nadeau, A. L., and Day, S.: Modeling of the Dec. 22nd 2018 Anak Krakatau volcano lateral collapse and tsunami based on recent field surveys: Comparison with observed tsunami impact, Mar. Geol., 440, 106566, https://doi.org/10.1016/j.margeo.2021.106566, 2021.
Grosse, P., van Wyk de Vries, B., Petrinovic, I. A., Euillades, P. A., and Alvarado, G. E.: Morphometry and evolution of arc volcanoes, Geology, 37, 651–654, https://doi.org/10.1130/G25734A.1, 2009.
Grosse, P., van Wyk de Vries, B., Euillades, P. A., Kervyn, M., and Petrinovic, I. A.: Systematic morphometric characterization of volcanic edifices using digital elevation models, Geomorphology, 136, 114–131, https://doi.org/10.1016/j.geomorph.2011.06.001, 2012.
Guth, P. L. and Geoffroy, T. M.: LiDAR point cloud and ICESat-2 evaluation of 1 second global digital elevation models: Copernicus wins, T. GIS, 25, 2245–2261, https://doi.org/10.1111/tgis.12825, 2021.
Hamzah, L., Puspito, N. T., and Imamura, F.: Tsunami Catalog and Zones in Indonesia, Journal of Natural Disaster Science, 22, 25–43, https://doi.org/10.2328/jnds.22.25, 2000.
Hanka, W., Saul, J., Weber, B., Becker, J., Harjadi, P., Fauzi, and GITEWS Seismology Group: Real-time earthquake monitoring for tsunami warning in the Indian Ocean and beyond, Nat. Hazards Earth Syst. Sci., 10, 2611–2622, https://doi.org/10.5194/nhess-10-2611-2010, 2010.
Harig, S., Immerz, A., Weniza, Griffin, J., Weber, B., Babeyko, A., Rakowsky, N., Hartanto, D., Nurokhim, A., Handayani, T., and Weber, R.: The Tsunami Scenario Database of the Indonesia Tsunami Early Warning System (InaTEWS): Evolution of the Coverage and the Involved Modeling Approaches, Pure Appl. Geophys., 177, 1379–1401, https://doi.org/10.1007/s00024-019-02305-1, 2020.
Harris, J. C., Grilli, S. T., Abadie, S., and Bakhsh, T. T.: Near- And Far-field Tsunami Hazard From the Potential Flank Collapse of the Cumbre Vieja Volcano, The Twenty-second International Offshore and Polar Engineering Conference, 17–22 June 2012, Rhodes, Greece, ISBN 978-1-880653-94-4, 2012.
Heap, M. J. and Violay, M. E. S.: The mechanical behaviour and failure modes of volcanic rocks: a review, B. Volcanol., 83, 33, https://doi.org/10.1007/s00445-021-01447-2, 2021.
Heap, M. J., Mollo, S., Vinciguerra, S., Lavallée, Y., Hess, K. U., Dingwell, D. B., Baud, P., and Iezzi, G.: Thermal weakening of the carbonate basement under Mt. Etna volcano (Italy): Implications for volcano instability, J. Volcanol. Geoth. Res., 250, 42–60, https://doi.org/10.1016/j.jvolgeores.2012.10.004, 2013.
Heap, M. J., Baumann, T. S., Rosas-Carbajal, M., Komorowski, J. C., Gilg, H. A., Villeneuve, M., Moretti, R., Baud, P., Carbillet, L., Harnett, C., and Reuschlé, T.: Alteration-Induced Volcano Instability at La Soufrière de Guadeloupe (Eastern Caribbean), J. Geophys. Res.-Sol. Ea., 126, e2021JB022514, https://doi.org/10.1029/2021JB022514, 2021.
Heidarzadeh, M., Ishibe, T., Sandanbata, O., Muhari, A., and Wijanarto, A. B.: Numerical modeling of the subaerial landslide source of the 22 December 2018 Anak Krakatoa volcanic tsunami, Indonesia, Ocean Eng., 195, 106733, https://doi.org/10.1016/j.oceaneng.2019.106733, 2020.
Hidayat, A., Marfai, M. A., and Hadmoko, D. S.: Eruption on Indonesia's volcanic islands: a review of potential hazards, fatalities, and management, IOP C. Ser. Earth Env., 485, 012061, https://doi.org/10.1088/1755-1315/485/1/012061, 2020.
Karstens, J., Kelfoun, K., Watt, S. F. L., and Berndt, C.: Combining 3D seismics, eyewitness accounts and numerical simulations to reconstruct the 1888 Ritter Island sector collapse and tsunami, Int. J. Earth Sci., 109, 2659–2677, https://doi.org/10.1007/s00531-020-01854-4, 2020.
Kieffer, S. W.: Blast dynamics at Mount St Helens on 18 May 1980, Nature, 291, 568–570, https://doi.org/10.1038/291568a0, 1981.
Korup, O., Seidemann, J., and Mohr, C. H.: Increased landslide activity on forested hillslopes following two recent volcanic eruptions in Chile, Nat. Geosci., 12, 284–289, https://doi.org/10.1038/s41561-019-0315-9, 2019.
Laiolo, M., Massimetti, F., Cigolini, C., Ripepe, M., and Coppola, D.: Long-term eruptive trends from space-based thermal and SO2 emissions: a comparative analysis of Stromboli, Batu Tara and Tinakula volcanoes, B. Volcanol., 80, 68, https://doi.org/10.1007/s00445-018-1242-0, 2018.
Lauterjung, J., Münch, U., and Rudloff, A.: The challenge of installing a tsunami early warning system in the vicinity of the Sunda Arc, Indonesia, Nat. Hazards Earth Syst. Sci., 10, 641–646, https://doi.org/10.5194/nhess-10-641-2010, 2010.
Lipman, P. W. and Mullineaux, D. R.: The 1980 eruptions of Mount St. Helens, Washington, Report 1250, United States Department of the Interior, https://doi.org/10.3133/pp1250, 1981.
Llanes, P., Silver, E., Day, S., and Hoffman, G.: Interactions between a transform fault and arc volcanism in the Bismarck Sea, Papua New Guinea, Geochem. Geophy. Geosy., 10, Q06013, https://doi.org/10.1029/2009GC002430, 2009.
Maeno, F. and Imamura, F.: Tsunami generation by a rapid entrance of pyroclastic flow into the sea during the 1883 Krakatau eruption, Indonesia, J. Geophys. Res.-Sol. Ea., 116, B09205, https://doi.org/10.1029/2011JB008253, 2011.
Maeno, F., Imamura, F., and Taniguchi, H.: Numerical simulation of tsunamis generated by caldera collapse during the 7.3 ka Kikai eruption, Kyushu, Japan, Earth Planets Space, 58, 1013–1024, https://doi.org/10.1186/BF03352606, 2006.
Marchuk, A. G.: Minimizing computational errors of tsunami wave-ray and travel time, Science of Tsunami Hazards, 27, 12–24, 2008.
McGuire, W. J.: Lateral collapse and tsunamigenic potential of marine volcanoes, Geological Society, London, Special Publications, 269, 121, https://doi.org/10.1144/GSL.SP.2006.269.01.08, 2006.
Morton, A., Airoldi, M., and Phillips, L. D.: Nuclear Risk Management on Stage: A Decision Analysis Perspective on the UK's Committee on Radioactive Waste Management, Risk Anal., 29, 764–779, https://doi.org/10.1111/j.1539-6924.2008.01192.x, 2009.
Mulia, I. E., Watada, S., Ho, T. C., Satake, K., Wang, Y., and Aditiya, A.: Simulation of the 2018 Tsunami Due to the Flank Failure of Anak Krakatau Volcano and Implication for Future Observing Systems, Geophys. Res. Lett., 47, e2020GL087334, https://doi.org/10.1029/2020GL087334, 2020.
Murray, J. B. and Voight, B.: Slope stability and eruption prediction on the eastern flank of Mount Etna, Geological Society, London, Special Publications, 110, 111, https://doi.org/10.1144/GSL.SP.1996.110.01.08, 1996.
Mutaqin, B. W., Lavigne, F., Hadmoko, D. S., and Ngalawani, M. N.: Volcanic Eruption-Induced Tsunami in Indonesia: A Review, IOP C. Ser. Earth Env., 256, 012023, https://doi.org/10.1088/1755-1315/256/1/012023, 2019.
NGDC: NCEI/WDS Global Historical Tsunami Database, National Geophysical Data Center/World Data Service, https://doi.org/10.7289/V5PN93H7, 2021.
Nomanbhoy, N. and Satake, K.: Generation mechanism of tsunamis from the 1883 Krakatau Eruption, Geophys. Res. Lett., 22, 509–512, https://doi.org/10.1029/94GL03219, 1995.
Nutt, D. J., King, L. A., and Phillips, L. D.: Drug harms in the UK: a multicriteria decision analysis, Lancet, 376, 1558–1565, https://doi.org/10.1016/S0140-6736(10)61462-6, 2010.
Omira, R. and Ramalho, I.: Evidence-Calibrated Numerical Model of December 22, 2018, Anak Krakatau Flank Collapse and Tsunami, Pure Appl. Geophys., 177, 3059–3071, https://doi.org/10.1007/s00024-020-02532-x, 2020.
OpenStreetMap: OSM Land polygons, https://www.openstreetmap.org, last access: 19 September 2022.
Pakoksung, K., Suppasri, A., and Imamura, F.: Probabilistic Tsunami Hazard Analysis of Inundated Buildings Following a Subaqueous Volcanic Explosion Based on the 1716 Tsunami Scenario in Taal Lake, Philippines, Geosciences, 11, 92, https://doi.org/10.3390/geosciences11020092, 2021.
Paris, A., Heinrich, P., Paris, R., and Abadie, S.: The December 22, 2018 Anak Krakatau, Indonesia, Landslide and Tsunami: Preliminary Modeling Results, Pure Appl. Geophys., 177, 571–590, https://doi.org/10.1007/s00024-019-02394-y, 2020.
Paris, R.: Source mechanisms of volcanic tsunamis, Philos. T. Roy. Soc. A, 373, 20140380, https://doi.org/10.1098/rsta.2014.0380, 2015.
Paris, R. and Ulvrova, M.: Tsunamis generated by subaqueous volcanic explosions in Taal Caldera Lake, Philippines, B. Volcanol., 81, 14, https://doi.org/10.1007/s00445-019-1272-2, 2019.
Paris, R., Switzer, A. D., Belousova, M., Belousov, A., Ontowirjo, B., Whelley, P. L., and Ulvrova, M.: Volcanic tsunami: a review of source mechanisms, past events and hazards in Southeast Asia (Indonesia, Philippines, Papua New Guinea), Nat. Hazards, 70, 447–470, https://doi.org/10.1007/s11069-013-0822-8, 2014.
Plank, S., Walter, T. R., Martinis, S., and Cesca, S.: Growth and collapse of a littoral lava dome during the 2018/19 eruption of Kadovar Volcano, Papua New Guinea, analyzed by multi-sensor satellite imagery, J. Volcanol. Geoth. Res., 388, 106704, https://doi.org/10.1016/j.jvolgeores.2019.106704, 2019.
Poland, M. P. and Orr, T. R.: Identifying hazards associated with lava deltas, B. Volcanol., 76, 880, https://doi.org/10.1007/s00445-014-0880-0, 2014.
Poland, M. P., Peltier, A., Bonforte, A., and Puglisi, G.: The spectrum of persistent volcanic flank instability: A review and proposed framework based on Kīlauea, Piton de la Fournaise, and Etna, J. Volcanol. Geoth. Res., 339, 63–80, https://doi.org/10.1016/j.jvolgeores.2017.05.004, 2017.
Pranantyo, I. R., Heidarzadeh, M., and Cummins, P. R.: Complex tsunami hazards in eastern Indonesia from seismic and non-seismic sources: Deterministic modelling based on historical and modern data, Geoscience Letters, 8, 20, https://doi.org/10.1186/s40562-021-00190-y, 2021.
Rahmati, O., Zeinivand, H., and Besharat, M.: Flood hazard zoning in Yasooj region, Iran, using GIS and multi-criteria decision analysis, Geomatics, Natural Hazards and Risk, 7, 1000–1017, https://doi.org/10.1080/19475705.2015.1045043, 2016.
Ren, Z., Wang, Y., Wang, P., Hou, J., Gao, Y., and Zhao, L.: Numerical study of the triggering mechanism of the 2018 Anak Krakatau tsunami: eruption or collapsed landslide?, Nat. Hazards, 102, 1–13, https://doi.org/10.1007/s11069-020-03907-y, 2020.
Romero, J. E., Polacci, M., Watt, S., Kitamura, S., Tormey, D., Sielfeld, G., Arzilli, F., La Spina, G., Franco, L., Burton, M., and Polanco, E.: Volcanic Lateral Collapse Processes in Mafic Arc Edifices: A Review of Their Driving Processes, Types and Consequences, Front. Earth Sci., 9, 639825, https://doi.org/10.3389/feart.2021.639825, 2021.
Scandone, R., Bartolini, S., and Martí, J.: A scale for ranking volcanoes by risk, B. Volcanol., 78, 2, https://doi.org/10.1007/s00445-015-0995-y, 2015.
Siebert, L.: Large volcanic debris avalanches: Characteristics of source areas, deposits, and associated eruptions, J. Volcanol. Geoth. Res., 22, 163–197, https://doi.org/10.1016/0377-0273(84)90002-7, 1984.
Silver, E., Day, S., Ward, S., Hoffmann, G., Llanes, P., Driscoll, N., Appelgate, B., and Saunders, S.: Volcano collapse and tsunami generation in the Bismarck Volcanic Arc, Papua New Guinea, J. Volcanol. Geoth. Res., 186, 210–222, https://doi.org/10.1016/j.jvolgeores.2009.06.013, 2009.
Smith, M. S. and Shepherd, J. B.: Preliminary investigations of the tsunami hazard of Kick'em Jenny submarine volcano, Nat. Hazards, 7, 257–277, https://doi.org/10.1007/BF00662650, 1993.
Somerville, P., Blong, R., and Gissing, A.: Why the Tonga tsunami arrived much earlier and much larger than expected, Risk Frontiers Briefing Note 460, Risk Frontiers, https://riskfrontiers.com/insights/ why-the-tonga-tsunami-arrived-much-earlier-and-much-larger-than-expected/, last access: 19 September 2022.
Spina, L., Del Bello, E., Ricci, T., Taddeucci, J., and Scarlato, P.: Multi-parametric characterization of explosive activity at Batu Tara Volcano (Flores Sea, Indonesia), J. Volcanol. Geoth. Res., 413, 107199, https://doi.org/10.1016/j.jvolgeores.2021.107199, 2021.
Tibaldi, A.: Multiple sector collapses at stromboli volcano, Italy: how they work, B. Volcanol., 63, 112–125, https://doi.org/10.1007/s004450100129, 2001.
Tinti, S., Pagnoni, G., Zaniboni, F., and Bortolucci, E.: Tsunami generation in Stromboli island and impact on the south-east Tyrrhenian coasts, Nat. Hazards Earth Syst. Sci., 3, 299–309, https://doi.org/10.5194/nhess-3-299-2003, 2003.
Toosi, A. S., Calbimonte, G. H., Nouri, H., and Alaghmand, S.: River basin-scale flood hazard assessment using a modified multi-criteria decision analysis approach: A case study, J. Hydrol., 574, 660–671, https://doi.org/10.1016/j.jhydrol.2019.04.072, 2019.
Turner, M. B.: Eruption cycles and magmatic processes at a reawakening volcano, Mt. Taranaki, New Zealand: a thesis presented in partial fulfilment of the requirements for the degree of Doctor of Philosophy in Earth Science at Massey University, Palmerston North, New Zealand, Doctoral, Massey University, 2008.
van Wyk De Vries, B. and Borgia, A.: The role of basement in volcano deformation, Geological Society, London, Special Publications, 110, 95, https://doi.org/10.1144/GSL.SP.1996.110.01.07, 1996.
Walter, T. R., Haghshenas Haghighi, M., Schneider, F. M., Coppola, D., Motagh, M., Saul, J., Babeyko, A., Dahm, T., Troll, V. R., Tilmann, F., Heimann, S., Valade, S., Triyono, R., Khomarudin, R., Kartadinata, N., Laiolo, M., Massimetti, F., and Gaebler, P.: Complex hazard cascade culminating in the Anak Krakatau sector collapse, Nat. Commun., 10, 4339, https://doi.org/10.1038/s41467-019-12284-5, 2019.
Ward, S. N. and Day, S.: Ritter Island Volcano – lateral collapse and the tsunami of 1888, Geophys. J. Int., 154, 891–902, https://doi.org/10.1046/j.1365-246X.2003.02016.x, 2003.
Watters, R. J., Zimbelman, D. R., Bowman, S. D., and Crowley, J. K.: Rock Mass Strength Assessment and Significance to Edifice Stability, Mount Rainier and Mount Hood, Cascade Range Volcanoes, Pure Appl. Geophys., 157, 957–976, https://doi.org/10.1007/s000240050012, 2000.
Watts, P. and Waythomas, C. F.: Theoretical analysis of tsunami generation by pyroclastic flows, J. Geophys. Res.-Sol. Ea., 108, 2563, https://doi.org/10.1029/2002JB002265, 2003.
Yokoyama, I.: A geophysical interpretation of the 1883 Krakatau eruption, J. Volcanol. Geoth. Res., 9, 359–378, https://doi.org/10.1016/0377-0273(81)90044-5, 1981.
Yokoyama, I., Tilling, R. I., and Scarpa, R.: International Mobile Early-Warning System (s) for Volcanic Eruptions and Related Seismic Activities: Report of an Unesco/UNEP Sponsored Preparatory Study in 1982–84, Unesco, OCLC Number 38664828, 1984.
Yoshida, H., Sugai, T., and Ohmori, H.: Size–distance relationships for hummocks on volcanic rockslide-debris avalanche deposits in Japan, Geomorphology, 136, 76–87, https://doi.org/10.1016/j.geomorph.2011.04.044, 2012.
Yudhicara, Y., Bani, P., and Darmawan, A.: Geothermal System as the Cause of the 1979 Landslide Tsunami in Lembata Island, Indonesia, Indonesian Journal on Geoscience, 2, 91–99, https://doi.org/10.17014/ijog.2.2.91-99, 2015.
Zengaffinen, T., Løvholt, F., Pedersen, G. K., and Muhari, A.: Modelling 2018 Anak Krakatoa Flank Collapse and Tsunami: Effect of Landslide Failure Mechanism and Dynamics on Tsunami Generation, Pure Appl. Geophys., 177, 2493–2516, https://doi.org/10.1007/s00024-020-02489-x, 2020.