the Creative Commons Attribution 4.0 License.
the Creative Commons Attribution 4.0 License.
 | 31 Aug 2022
Modelling geographical and built-environment attributes as predictors of human vulnerability during tsunami evacuations: a multi-case-study and paths to improvement
Jorge León
Alejandra Gubler
Alonso Ogueda
Evacuation is the most important and effective method to save human lives during a tsunami. In this respect, challenges exist in developing quantitative analyses of the relationships between the evacuation potential and the built-environment and geographical attributes of coastal locations. This paper proposes a computer-based modelling approach (including inundation, evacuation, and built-environment metrics), followed by multivariate regressive analysis, to estimate how those attributes might influence the expected tsunami death ratios of seven Chilean coastal cities. We obtained, for the examined variables, their average values to different thresholds of the death ratio. Also, our statistical analysis allowed us to compare the relative importance of each metric, showing that the maximum flood, the straightness of the street network, the total route length, and the travel time can have a significant impact on the expected death ratios. Moreover, we suggest that these results could lead to spatial planning guidelines for developing new urban areas into exposed territories (if this expansion cannot be restricted or discouraged) or retrofitting existing ones, with the final aim of enhancing evacuation and therefore increasing resilience.
- Article
(3854 KB) - Full-text XML
- BibTeX
- EndNote


Tsunamis are relatively rare phenomena but capable of triggering widespread destruction and causing significant human casualties in exposed coastal areas. In the last 2 decades, devastating events, including those in Indonesia (2004, 2006, 2010, 2018), Samoa (2009), Chile (2010, 2014, 2015), and Japan (2011), provoked more than 250 000 deaths globally (WHO, 2021). Authorities and scholars have suggested and developed a range of integrated countermeasures to reduce tsunami risk: “hard” strategies, like structural defences (e.g. sea walls, breakwaters, flood gates, and control forests) and the construction of elevated ground, and “soft” approaches focused on education and policy, like land-use and built-environment planning, plus early warning and emergency management systems (Koshimura and Shuto, 2015; Suppasri et al., 2012b, 2013; Ting et al., 2015; Tsimopoulou et al., 2012). While hard countermeasures are uncommon out of Japan, soft-planning-focused strategies require extended periods and high political and community support to be implemented. Typically, this support (plus its necessary technical and monetary resources) is hard to achieve in developing countries like Indonesia and Chile (with other urgent everyday needs), where hence community-focused emergency management, emphasising evacuation, is the most feasible strategy to reduce the vulnerability of populations to tsunamis. Moreover, there is a growing consensus on evacuation as the most important and effective method for saving human lives during a tsunami (Shuto, 2005; Suppasri et al., 2012b), which is particularly true in areas exposed to near-field events, with peak arrival times as short as 15 min, as was shown for the 2014 and 2015 Chilean events by Catalán et al. (2015) and Aránguiz et al. (2016), respectively.
In the context of disaster risk reduction policies and studies, we can define “risk” as the potential for adverse consequences for human or ecological systems, which results from dynamic interactions between natural or man-made hazards with the exposure and vulnerability of the affected human or ecological systems (IPCC, 2020). According to the UNDRR terminology (United Nations Office for Disaster Risk Reduction; UNDRR, 2022), a hazard is “a process, phenomenon or human activity that may cause loss of life, injury or other health impacts, property damage, social and economic disruption or environmental degradation”, while vulnerability can be defined as “the conditions determined by physical, social, economic and environmental factors or processes which increase the susceptibility of an individual, a community, assets or systems to the impacts of hazards”, and exposure identifies “the situation of people, infrastructure, housing, production capacities and other tangible human assets located in hazard-prone areas”. Authors like Birkmann (2006) and Frazier et al. (2014) stress the need for strengthening and focus risk mitigation and adaptation plans through the spatial assessment of hazard, vulnerability, and exposure factors. In line with this, based on thorough analyses of previous tsunami disaster outcomes (including the 2011 Great East Japan Earthquake and Tsunami, the 2010 Chilean tsunami, the 2009 Samoan tsunami, and the 2004 Indian Ocean tsunami) or pre-disaster modelling, scholars like Anwar et al. (2011), Birkmann et al. (2010), Eckert et al. (2012), González-Riancho et al. (2015), Suppasri et al. (2016), and Zamora et al. (2021) have underlined a range of characteristics leading to tsunami risk (with a focus on either the population or the built environment). These aspects comprise determinants of hazard (e.g. tsunami height, flow depth, and arrival time), exposure (e.g. geomorphological characteristics of the inhabited areas and man-made features, including elevation, shoreline distance, number of people exposed, population density, housing density, locations of infrastructures, and types of land use), and vulnerability (e.g. warning systems; governance and institutional arrangements; evacuation potential; economic resources; education; and personal awareness, knowledge, and decision-making capacity).
Several studies aim at quantitatively examining tsunami vulnerability and its correlation with geographical, built-environment, and socio-psychological features, within a spatially specific area or domain of study, from neighbourhoods to whole regions, including blocks, districts, cities, and metropolitan areas. For instance, as shown by Tarbotton et al. (2015), most researchers use post-tsunami destruction data to focus on built structures and develop statistically based empirical vulnerability functions that model the damage response to tsunamis. A common type of function is the fragility function, which combines the probability of damage (y axis) with hydrodynamic characteristics such as flood depth, flow velocity, and force (x axis). Typically, researchers develop these curves by integrating satellite remote sensing, numerical modelling of tsunami inundation, and post-tsunami survey data (examined in GIS – geographic information system – systems) (Koshimura et al., 2009). A large group of these studies focus on the losses in the built environment. For instance, Suppasri et al. (2012a) (using data from the 2011 Great East Japan Earthquake and Tsunami) applied least-square regression to demonstrate how building characteristics like the structural material, number of stories, and coastal topography can influence their damage levels. Other tsunami disasters examined through this approach include the 2010 Chilean tsunami in Dichato (Mas et al., 2012b) and the 2018 Sulawesi tsunami at Palu Bay in Indonesia (Mas et al., 2020). In the former, the researchers estimated the affected houses' structural fragility through a post-tsunami survey. They combined this with an interpolated inundation depth (developed in geographic information systems from measures taken in the field) to deliver a tsunami fragility curve. In the case of the Sulawesi tsunami, the authors created the fragility functions by integrating field survey data, visual interpretation of satellite images, and machine learning for multi-sensor and multitemporal satellite images.
Other studies focus on quantitatively assessing human vulnerability to tsunamis and its possible explanatory factors. For instance, working with the case of the 2004 tsunami disaster in Banda Aceh, Indonesia, Koshimura et al. (2009) used regressive analysis to develop a fragility function for the human death ratio through the combination of tsunami modelling and post-tsunami data. This function used the number of dead, missing, and saved residents in 88 examined villages, plus the modelled inundation depth. Yun and Hamada (2015) interviewed 1153 witnesses (and also used data for behaviour of the dead and missing) of the 2011 Great East Japan Earthquake and Tsunami to develop a conditional logistic regression model and identify the factors that influenced life safety during that catastrophe. They found out that the fatality rate is significantly influenced by the tsunami height, aged population, speed, and region of analysis. Suppasri et al. (2016) used spatially accurate data from areas less than 3 km2 wide (with an inundation ratio greater than 70 %) and statistical analysis to examine the fatality ratios and the factors that affected human fatalities during that same event. Their findings show that (in different manners depending on the region of analysis) fatality ratios are affected by the tsunami characteristics (inundation depth, wave force, arrival time), topographical characteristics (slope, elevation, type of coast), regional characteristics (existence or absence of defence structures, warning systems, and evacuation facilities), and human characteristics (existence or absence of knowledge, awareness, and decision-making capacity). Nateghi et al. (2016) analysed municipality-level and sub-municipality-level data from the 1896, 1933, 1960, and 2011 tsunamis that affected the Tohoku area in Japan. With this information, they worked out a model based on statistical learning methods that allowed them to appraise the effectiveness of seawalls and coastal forests in mitigating destruction and death rates provoked by tsunamis. Goto and Nakasu (2018) used data from the 2011 Great East Japan Earthquake and Tsunami to propose a human vulnerability index (HVI) that combines each location's fatality rate and the rate of incidence of washed-out buildings. Moreover, they applied multivariate regressive analysis to identify four explanatory variables for this index: (1) allowance period (the tsunami arrival time divided by the distance to a safe place), (2) preparedness (the rate of affected evacuees for analysis who had prepared emergency carry-out bags beforehand), (3) road serviceability (the rate of car-using evacuees multiplied by car speed), and (4) warning effect (multiplication of announced tsunami height and cognition rate of warning). Also working in the context of the 2011 disaster, Latcharote et al. (2018) integrated surveyed fatality ratios with tsunami arrival times (obtained from flood modelling) into linear and nonlinear regression analyses to find out the relationships between them. Moreover, they examined the different findings for two topographically different coastal areas (the Sanriku Coast and the Sendai Plain). Their findings show that the fatality ratios decrease as the tsunami arrival times increase (for all the examined cases) and that (in the case of the Sendai Plain) the fatality rates of females and those above 65 were higher than those of males and those of all ages, respectively. Lastly, Yavuz et al. (2020) used probabilistic tsunami modelling (developed from earthquake databases from 1900–2013) to evaluate social, economic, and environmental risks on the eastern Mediterranean coast. Specifically, they defined social risk as to the number of people in areas where inundation depth reaches 0.5 m or higher.
In cases where tsunamis have not occurred recently or their data are not available, researchers typically use computer-based models to estimate human vulnerability according to simulated scenarios. For instance, Sugimoto et al. (2003) developed a tsunami human damage prediction method for the town of Usa, city of Tosa, Shikoku Island, Japan, in the context of a possible Nankai earthquake to occur during the first half of the 21st century. Their method comprised a GIS-based spatial model integrating tsunami numerical modelling, exposed populations, and expected evacuation behaviours (e.g. departure times) obtained from questionnaire surveys. This model delivered the predicted loss of human lives in three different scenarios, depending on the tsunami hazard factors (over 0.5 m inundation depth or more than 2.0 m s−1 flow velocity) and evacuation behaviour (with or without evacuation activities). In line with this, evacuation modelling has been extensively used in recent years to estimate human casualties during tsunami scenarios, using both “dynamic” and “static” approaches (Imamura et al., 2012). Models couple expected evacuation performances with discrete or probabilistic tsunami floods to estimate mortality rates across evacuees. Examples of dynamic evacuation models comprise, for instance, agent-based (Aguilar and Wijerathne, 2016; León et al., 2019; Makinoshima et al., 2016, 2018; Mas et al., 2015; Mostafizi et al., 2017; Taubenböck et al., 2009; Wang et al., 2016; Wang and Jia, 2020), cellular automata (e.g. Kitamura et al., 2020), and the “evacuee generation model” of Dohi et al. (2016) (which includes the effect of external information on the evacuation behaviour). In turn, GIS-based, least-cost distance (e.g. Fraser et al., 2014; Priest et al., 2016; Wood et al., 2018, 2020), and network approaches (Dewi, 2012; González-Riancho Calzada et al., 2013) are examples of static evacuation models (whilst sometimes including variability in wave arrival times, population exposure scenarios, evacuation departure times, and travel speeds), which allow the identification of “evacuation landscapes” (Wood et al., 2014).
As Goto and Nakasu (2018) point out, a quantitative analysis of the relationships between fatality rates and geographical, built-environment, and socio-psychological features can support the development of effective measures to reduce the loss of human lives. Moreover, if place-based models' findings can be generalised, this “will produce a tool for measuring areal vulnerability to future tsunamis and enable municipalities to prioritise the order of their countermeasures” (Goto and Nakasu, 2018, p. 2). In the case of evacuation as a method for reducing disaster vulnerability, authors like Perry et al. (1981), Mohareb (2011), and Murray-Tuite and Wolshon (2013) provide analyses of geomorphological and socio-psychological aspects that determine the evacuees' behaviour during an emergency (e.g. selection of the escape routes, the required times for evacuation, human response, travel and waiting, and the role of the crowd influence). In this respect, for the case of tsunamis Makinoshima et al. (2020) deliver a comprehensive review of evacuation behaviours during 22 events since the Chilean tsunami of 1960, built around a framework with three stages of notifications: early, mid, and late. They found out a range of possible evacuation notifications across these stages, including ground shaking, official warnings, informal communications, and natural signs (e.g. unusual sea level changes, sighting the landing tsunami, hearing unusual sounds). In turn, these notifications can motivate a range of risk cognition and response activities, with sharp variations among different individuals and groups (determined by factors like previous knowledge or experience, culture, mental biases, and geographical location). These response activities include, for instance, collecting information, confirming the safety and gathering of family members, and preparatory actions (e.g. packing emergency kits, collecting important goods). Following these activities, the actual evacuation begins, determined by a destination, a route of travel, and a means of evacuation (e.g. pedestrian or vehicular). Lastly, post-evacuation activities might include gathering additional information, contacting family or friends, or returning home (e.g. to pick up valuables or get the car).
While socio-psychological aspects can be critical determinants of evacuation, we will focus our research on some of the most relevant geographical and built-environment attributes (capable of being quantitatively assessed through computer-based modelling) that could contribute to the success (or failure) of evacuation in the case of a tsunami. These characteristics include those related to the tsunami (maximum flood depth and the estimated time of arrival of this maximum depth), context (elevation, distance to the shoreline), the evacuation process (travel time, distance to the shelter, route length, pedestrian directness ratio), and the street network configuration (betweenness, closeness, straightness). In this respect, authors like Allan et al. (2013), Kubisch et al. (2020), Tumini et al. (2017), Villagra et al. (2014), and Villagra and Quintana (2017) underline the links between urban morphology/geospatial characteristics and evacuation. They point out how the former physically affects the latter and examine how behavioural aspects (e.g. the decision of evacuation, route selection, or evacuation mode) relate to the environmental factors. In line with this, following Goto and Nakasu (2018), we aim at quantitatively assessing the relationship between the geographical and built-environment attributes and tsunami vulnerability (represented by the expected death ratio) as a first step towards the proposal of evidence-based countermeasures for risk reduction. For instance, as most evacuations take place in cities, planners and decision-makers could apply our recommendations for built-environment changes and standards (aimed at increasing the number of evacuees that can reach safe areas) to guide the physical development retrofitting of tsunami-prone coastal communities around the world, thus, with the final aim of enhancing pedestrian evacuation, saving lives, and therefore increasing resilience.
León et al. (2021b) deliver a modelling framework (including flood and agent-based evacuation) to examine the relationship between the evacuation potential and urban-form characteristics of 67 urban samples from 12 case studies in Chile. In turn, they use the model's outcomes to develop a multivariate regressive analysis, which allows them to “weight” the relative importance of each of the independent variables (i.e. the urban-form characteristics) on the evacuation times. In this paper, we propose to enhance their approach with a greater emphasis on the description of real-world geographical and built-environment conditions that might influence tsunami evacuation. Therefore, while León et al. (2021b) set up a generic tsunami scenario where they test selected urban samples for flood and evacuation, we aim at developing a multi-case-study approach that encompasses real-world-based large flood and evacuation models for seven coastal cities in Chile: Arica, Iquique, Coquimbo, La Serena, Viña del Mar, Valparaíso, and Talcahuano. Moreover, we focus our descriptive and multivariate regressive analyses on the expected death ratios of these cities' exposed areas (as an indicator of human vulnerability to tsunamis) and how they can be affected by the geographical and built-environment characteristics.
The rest of this paper is as follows. Section 2 describes the methodology, which comprises the selection of the seven examined Chilean cities and a description of two scaffolding cross-case research phases: a descriptive statistical analysis and a multivariate regressive analysis. Section 3 presents the results of our research, which we discuss in Sect. 4. Lastly, Sect. 5 delivers the study's main findings and proposes paths for future investigation.
2.1 Case studies
Chile is one of the most tsunami-prone countries globally, with more than 100 tsunamis recorded since the 16th century, including 35 destructive events up to 2005 (Lagos and Gutiérrez, 2005) and recent disasters in 2010, 2014, and 2015. Moreover, researchers including Drápela et al. (2021), Klein et al. (2017), and Medina et al. (2021) have underlined the existence of extensive submarine areas in seismic locking along the central and northern coasts of Chile, capable of triggering large destructive tsunamis if major rupture earthquakes occur. Among the Chilean coastal cities, we selected seven case studies, distributed from north to south: Arica, Iquique, Coquimbo, La Serena, Viña del Mar, Valparaíso, and Talcahuano (see Fig. 1).
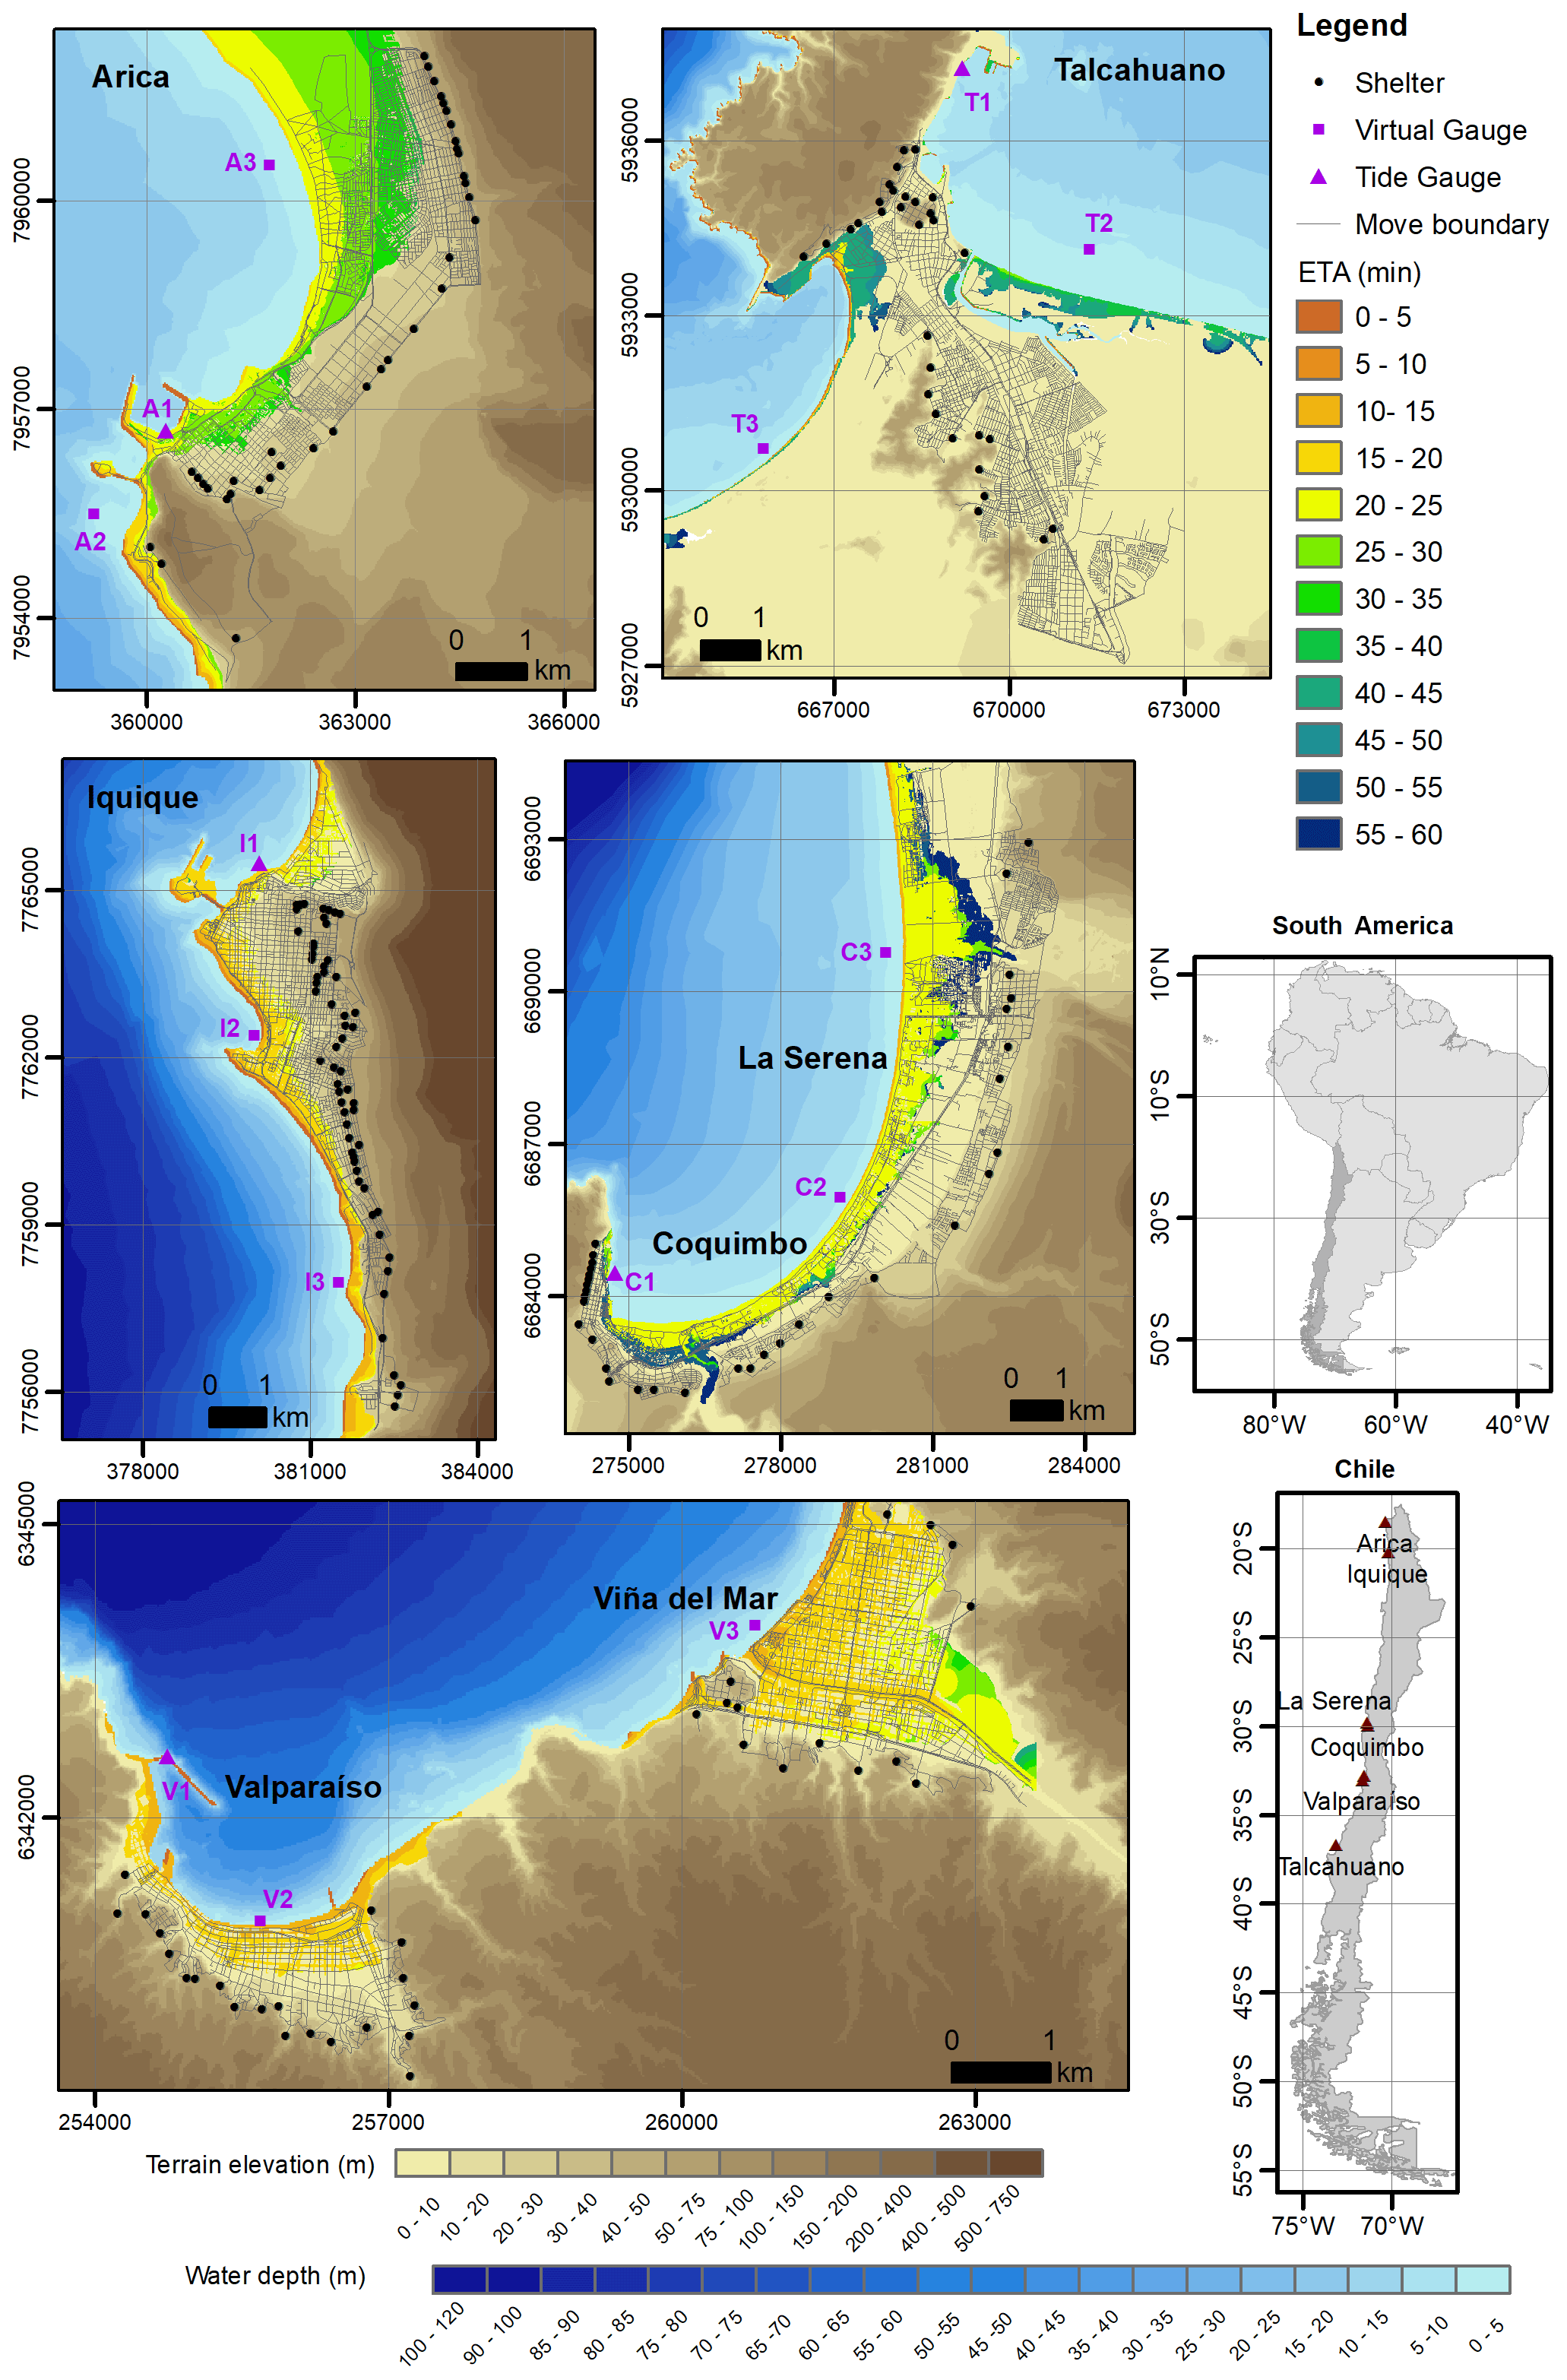
Figure 1Location, topo-bathymetry, and tsunami-related features of the examined case studies in Chile.
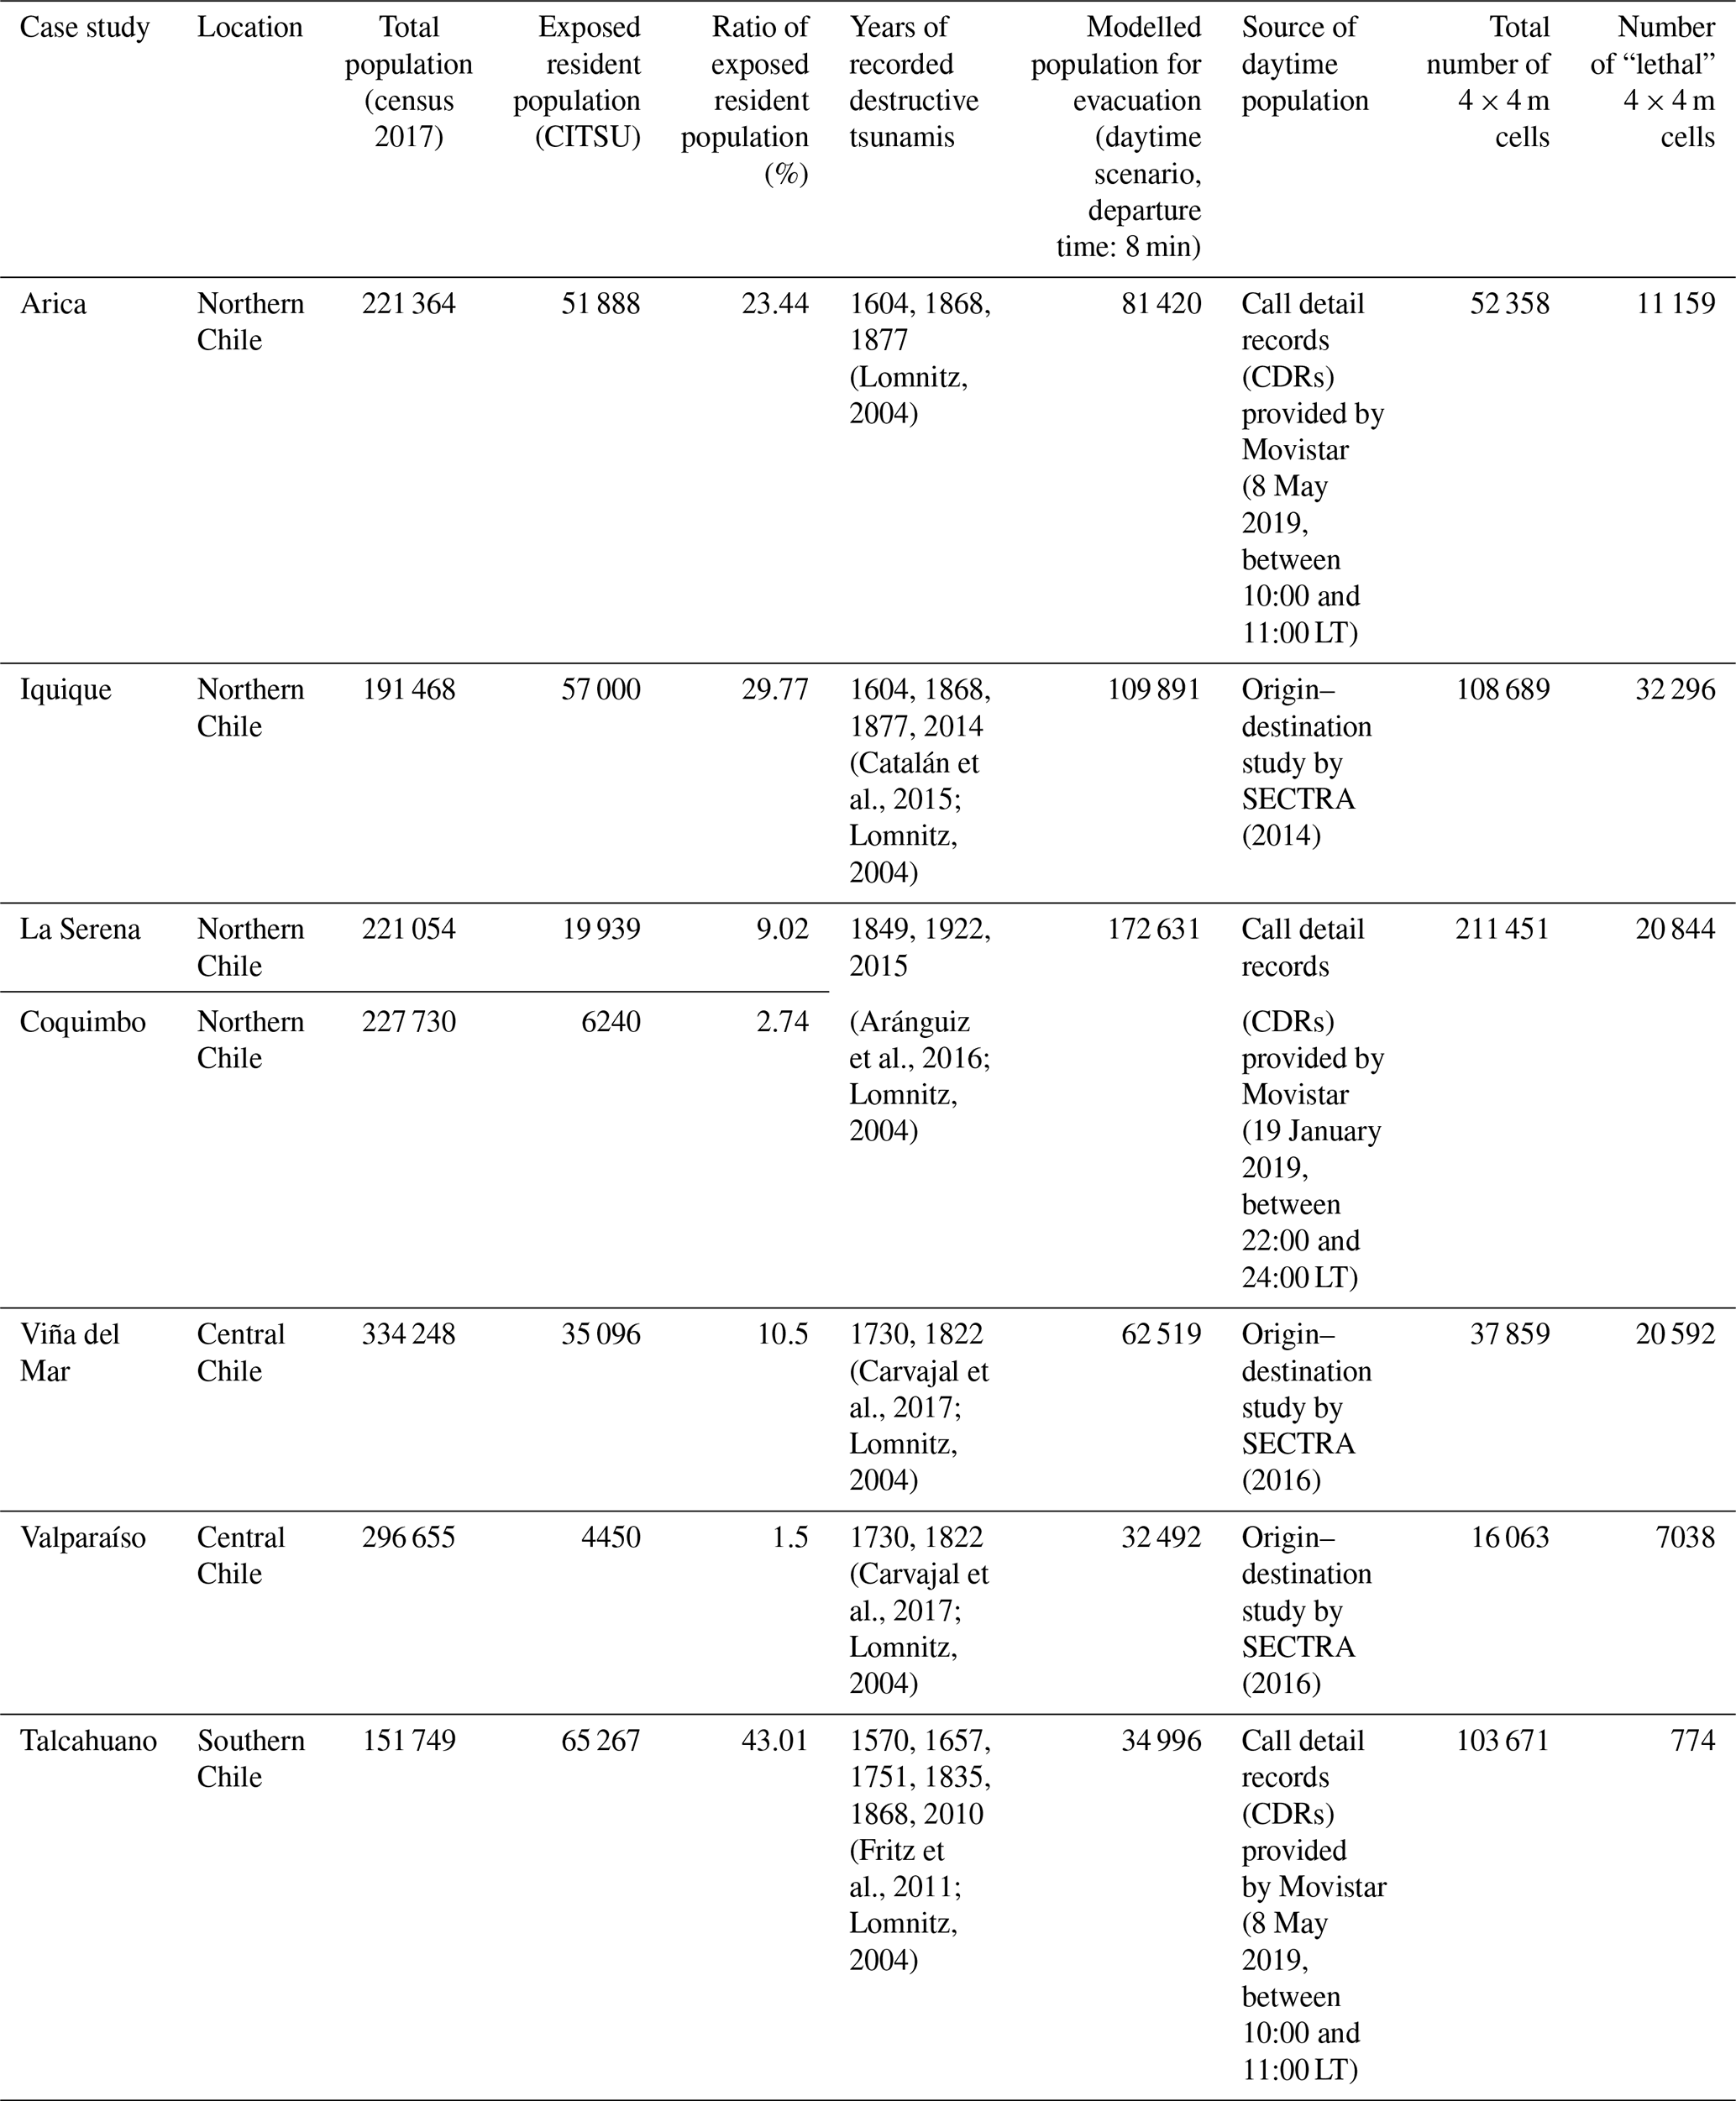
According to the National Statistics Institute of Chile (INE), these cities are among the top 20 in Chile for the most significant ratios of exposed populations to tsunamis (INE, 2021). This information is based on census data and the official tsunami flood charts by SHOA (Hydrographic and Oceanographic Service of the Chilean Navy, the Chilean Navy's agency aimed at providing technical elements, information, and technical assistance to offer navigational safety in Chilean waters) (SHOA, 2012). Talcahuano, Iquique, and Arica occupy the first three places in the list, with 43.01 %, 29.77 %, and 23.44 % of their populations living in floodable areas, respectively. In each of these cities we focused our analysis only on inhabited areas. Overall, the seven case studies gather roughly 240 000 exposed residents. As seen in Table 1, historical records (since the 16th century) show that destructive tsunamis have repeatedly affected these cities.
Table 1Attributes of the examined case studies in Chile. CITSU: Carta de Inundación por Tsunami. SECTRA: Programa de Vialidad y Transporte Urbano.
2.2 Descriptive analysis
This phase aimed to develop a thorough description of the current geographical and built-environment conditions that might influence the outcome of tsunami evacuations in each of the case studies and, second, to integrate those results through GIS spatial post-processing based on 4×4 m cells as the basic units of study.
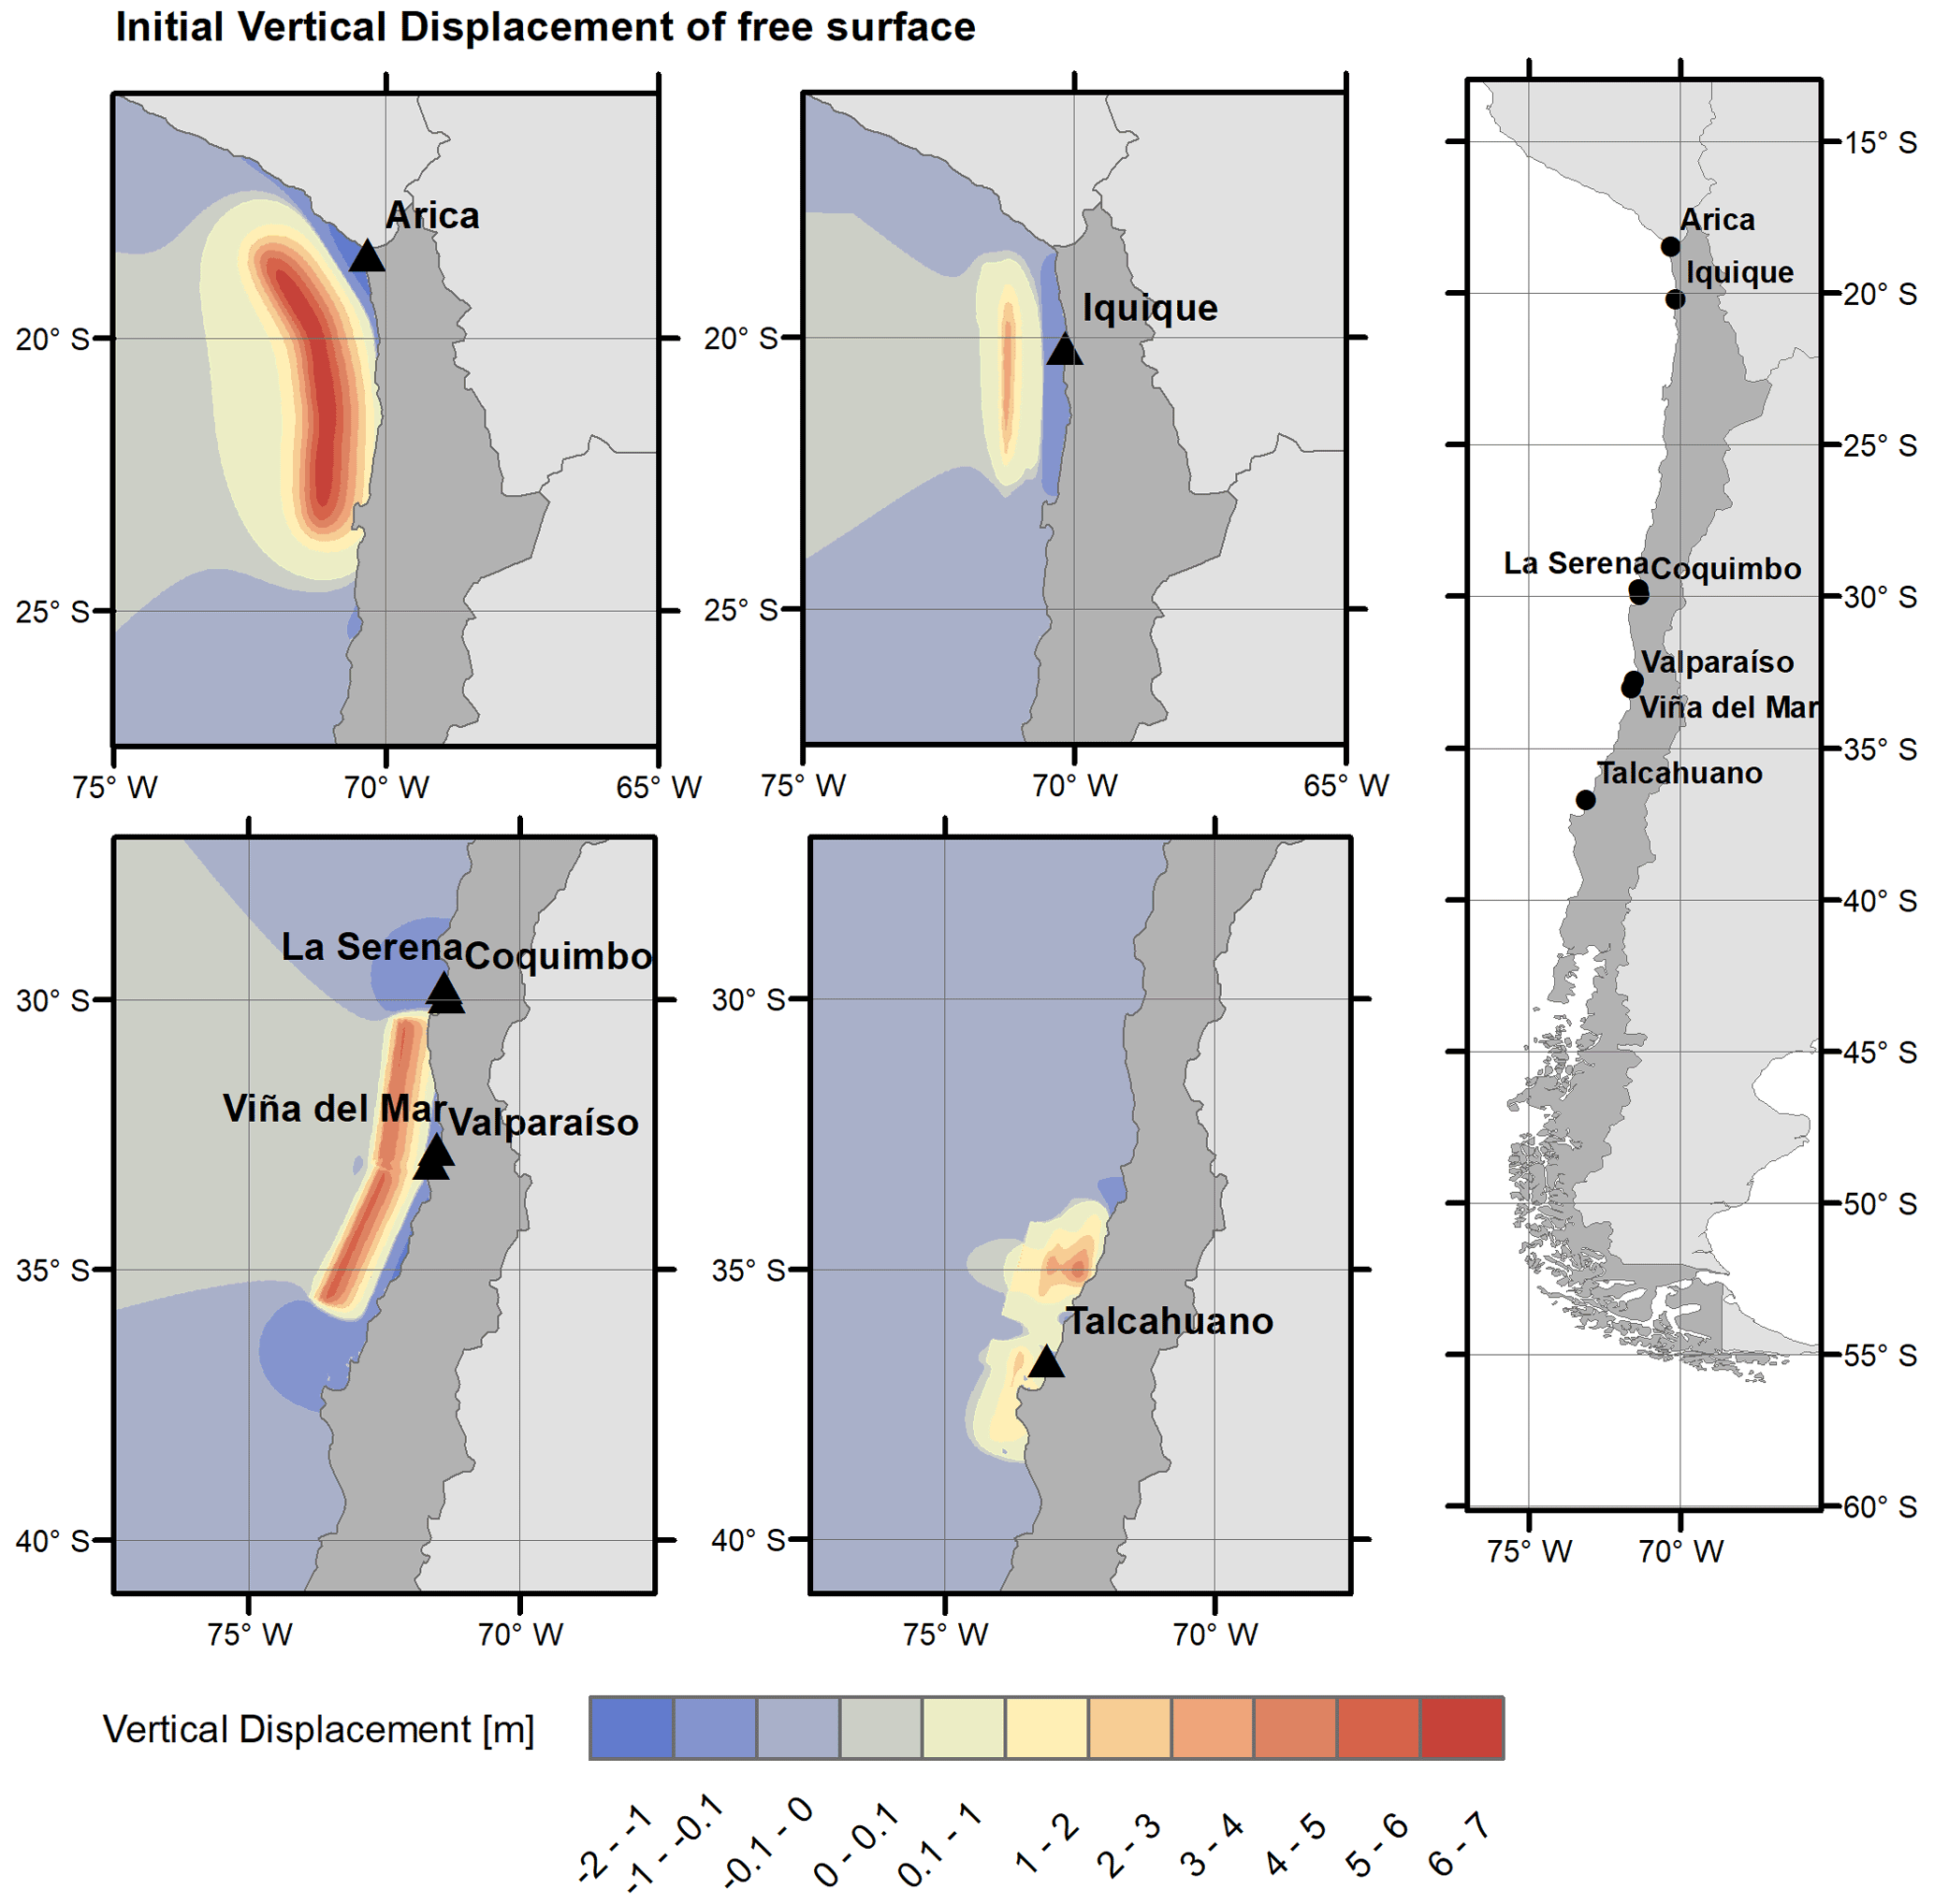
Figure 2Seismic scenarios used for the examined case studies.
2.2.1 Tsunami inundation and evacuation models
We developed coupled tsunami inundation and evacuation models for each case study, using the methodologies extensively described in León et al. (2019, 2020). First, we worked out flood simulations according to the worst-case feasible seismic scenario (i.e. a high-consequence event of a relatively small likelihood; Løvholt et al., 2014) for each city. To do this, we used the Storm Surge and Tsunami Simulator in Oceans and Coastal Areas (STOC), specifically the Multi-layered Static Dynamics Model (STOC-ML) (Tomita et al., 2006). We used seismic models by Carvajal et al. (2017) and Fujii and Satake (2012), and for the Iquique scenario we calculated the seismic parameters, including length, width, and slip, according to the scaling law by Papazachos et al. (2004) (see Table 2 and Fig. 2). The input data for the simulations included bathymetry, coastline, topography, and elevation data, compiled from various sources including SHOA, local governments, and GEBCO (General Bathymetric Chart of the Oceans; https://www.gebco.net/, 8 January 2021). Each case study's simulation used five nested grids for numerical analysis, with spatial resolutions of 1536, 256, 32, 8 and 4 m, respectively. Tsunamis were simulated for 60 min (capable of comprising their development from the occurrence of the earthquake to the maximum inland penetration, i.e. the inundation line or run-up). The model used a time step of 0.1 s, also recording time series, the inundation depth (every 10 min), the maximum inundation depth, and the estimated time of arrival (ETA) of this maximum depth (see Fig. 3).
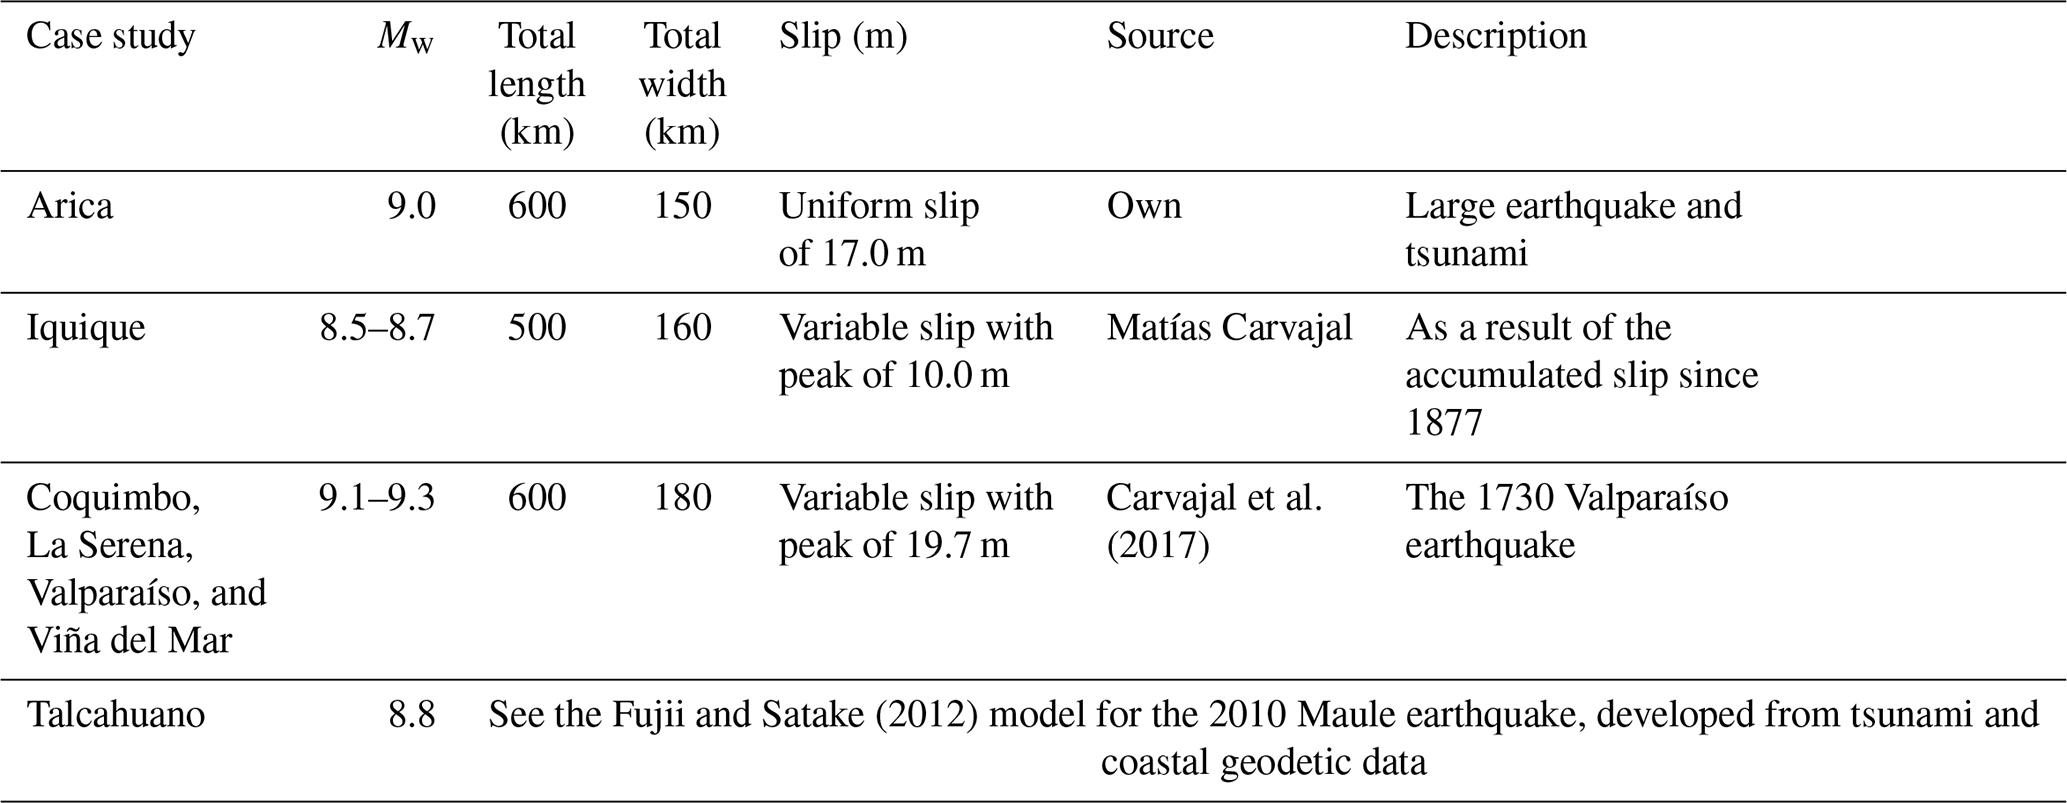
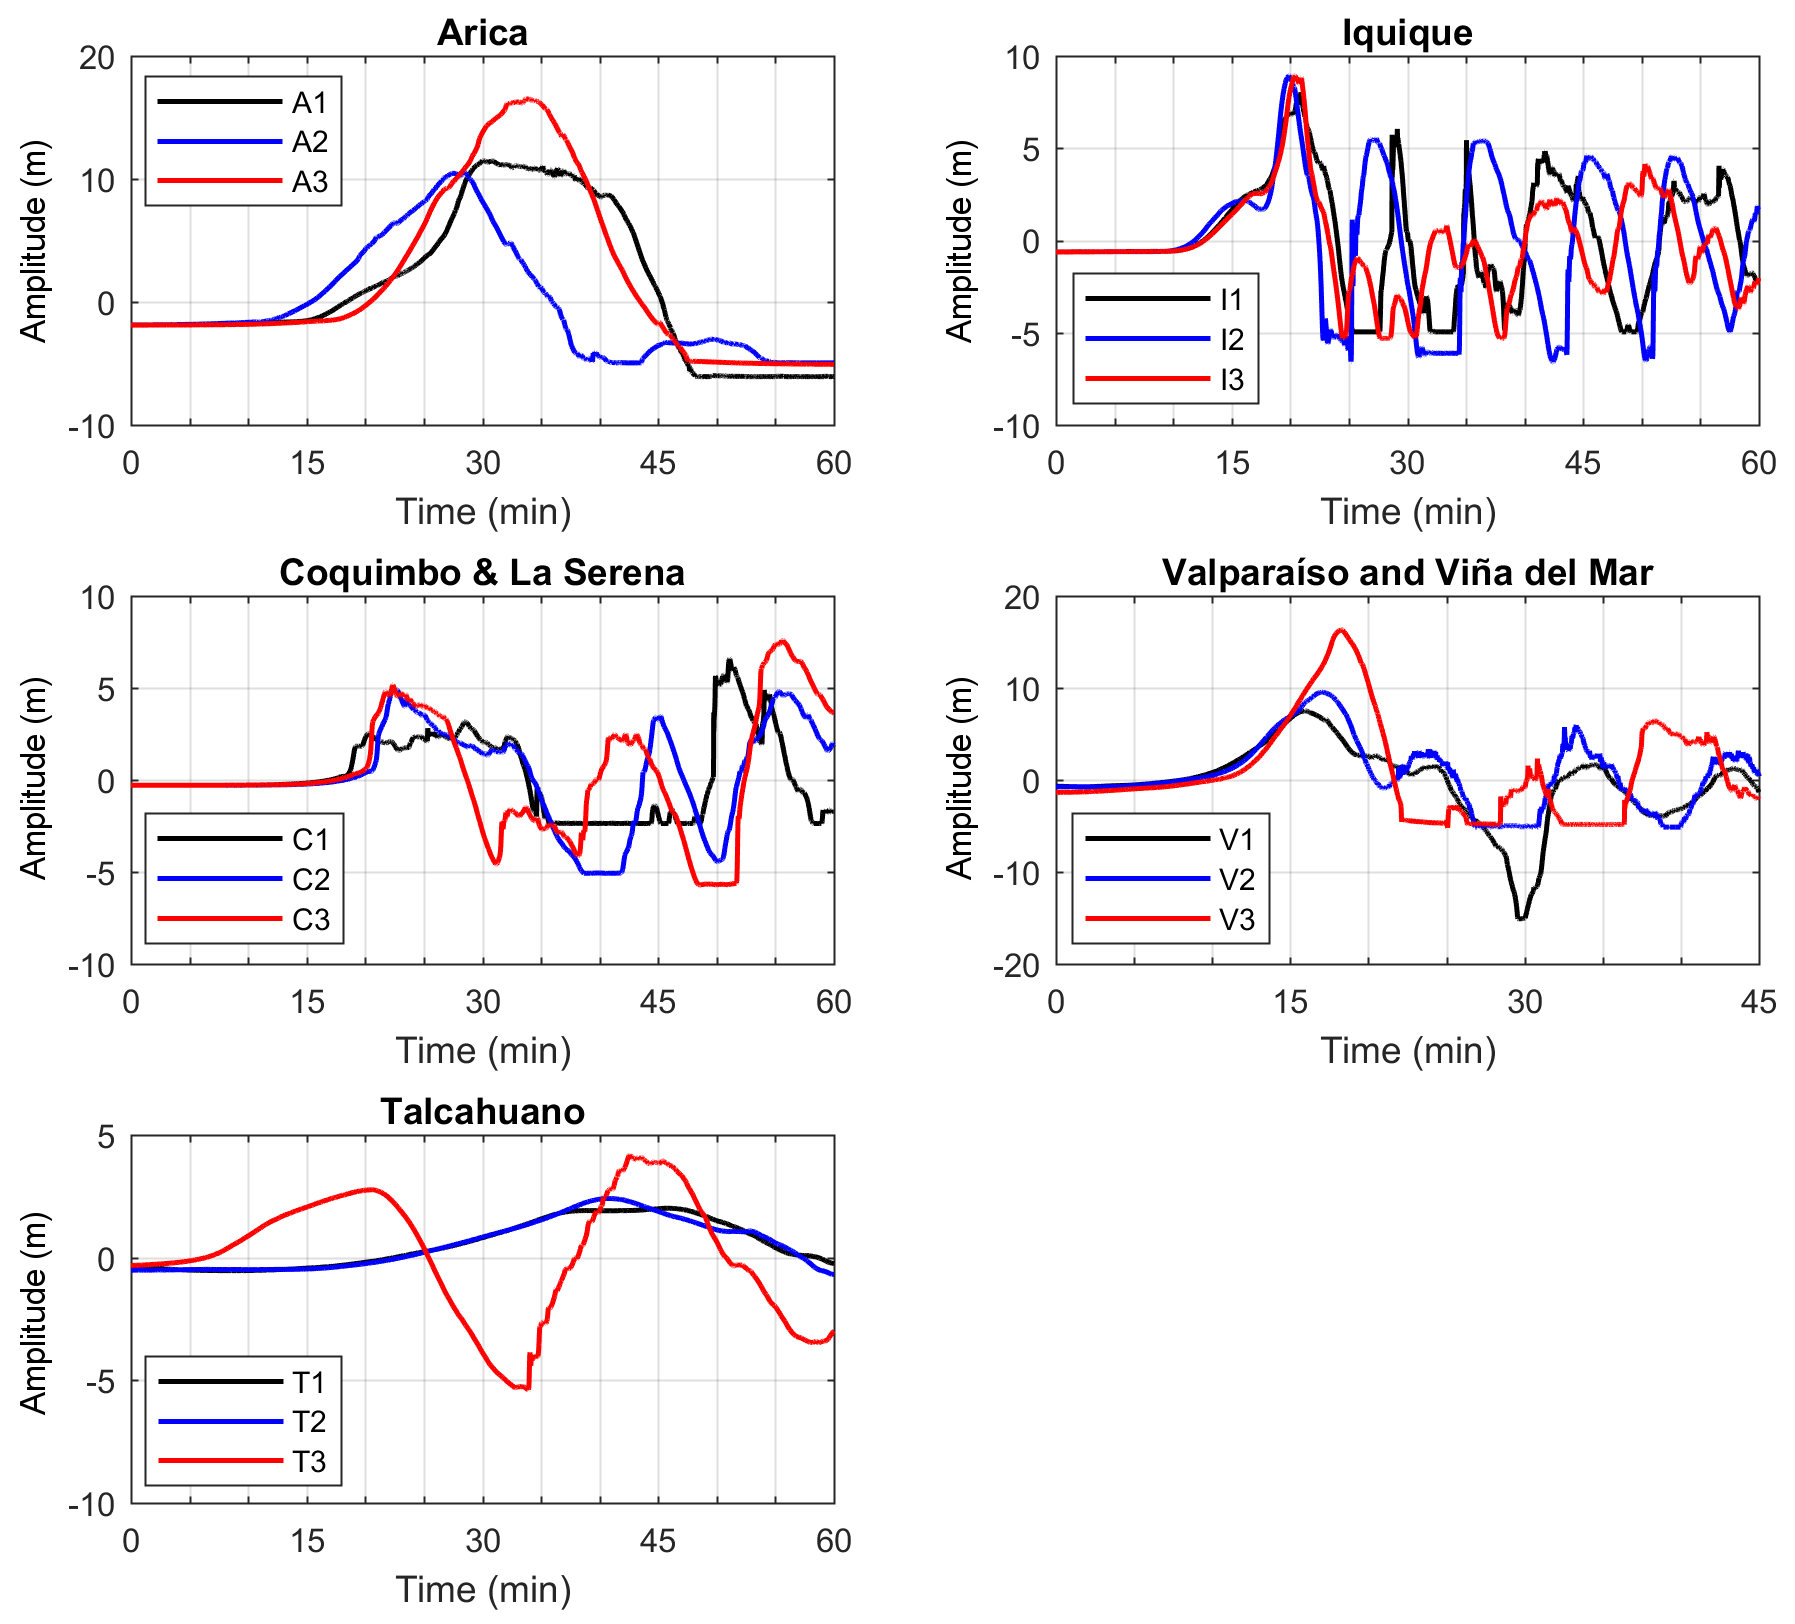
Figure 3Tsunami time series for the examined case studies, as measured by virtual gauges (see their locations in Fig. 1).
We also developed agent-based evacuation simulations (see Sect. 1) for each case study, using an evacuation threshold of 45 min. While we had the 60 min long tsunami simulations from the STOC-ML model (and the sea level anomalies may last for several hours after the earthquake), preliminary tests showed that a 45 min threshold was sufficient to encompass the total evacuation time of every examined city, therefore allowing us to reduce computing time. To carry out the evacuation analyses we used an enhanced version of the PARI-AGENT model (Arikawa, 2015). We modified this source code to assess the impact of the slope on the evacuees' speed, to include a Rayleigh probabilistic distribution of departure times for evacuees, and to assign a range of age-based evacuation speeds across the agents (see León et al., 2020). Recently, this model was validated using real-world data of 1966 pupils from four K–12 schools (primary and secondary education from kindergarten to 12th grade) in Valparaíso and Viña del Mar, Chile, collected during an evacuation drill held in September 2019 (León et al., 2021a).
Agent-based models are bottom-up computer simulations where individual disaggregated elements (the agents, which in our model correspond to evacuees) are modelled as autonomous decision-making entities that follow simple rules, which are iteratively performed within a set time threshold, usually including stochastic features. The agents' interactions (also with their environment) lead to emergent phenomena, which is helpful for the examination of complex, real-life events like mass evacuation. As we adopted a cross-case study perspective to examine extensive urban areas (534 881 agents overall), with a focus on the geomorphological conditions affecting the evacuation, we formulated our agent-based model under a macroscopic perspective, disregarding microscopic interactions among agents (Makinoshima et al., 2018). Rather, we examined the overall outcomes of the evacuation processes (i.e. number of saved, moving, and dead evacuees, for each time step), determined by the environmental conditions and the moving crowd (see below). To develop the agent-based models for each case study, we had to follow these steps. First, we included the inundation parameters obtained from the STOC-ML analyses. Second, we determined the evacuation territories of each case study (henceforth denominated “move boundary”; see Fig. 1), comprising the streets and open spaces connecting the coastline with the safe assembly areas (shelters) as defined by the evacuation plans from ONEMI (National Office of Emergency of the Interior Ministry), the Chilean emergency management agency (available at https://geoportalonemi.maps.arcgis.com/apps/webappviewer/index.html?id=5062b40cc3e347c8b11fd8b20a639a88, last access: 30 July 2021). For their spatial definition, these move boundaries used the smallest nested grid from the inundation model (with 4×4 m cells). We obtained their specific configuration through its intersection with the street network obtained from OpenStreetMap (https://www.openstreetmap.org/, last access: 10 September 2021) and post-processed in ArcMap 10.4.1 (see Fig. 1). Third, we had to establish worst-case daytime population distributions (different from census data), reflecting that most of the examined zones comprise downtown, CBD (central business district), or touristic areas that significantly increase their populations during daytime due to commuting and visiting (see Table 1). In the case of Iquique, Viña del Mar, and Valparaíso, we obtained daytime populations from previous origin–destination studies conducted by the Chilean Ministry of Transportation (SECTRA, 2014, 2016). For Arica, Coquimbo, La Serena, and Talcahuano, in turn, we used extrapolations of mobile CDR (call detail record) databases provided by one of the largest telecom companies in Chile (with a market share of roughly 28 %). In the case of Arica and Talcahuano, we used the morning peak time (10:00 to 11:00 LT) of a random weekday (8 May 2019) as the worst-case daytime scenario. For Coquimbo and La Serena, popular summer touristic destinations with a vibrant nightlife along their coastlines, we used Saturday, 19 January 2019, between 22:00 and 24:00 LT. The PARI-AGENT code randomly distributed these populations across the move boundaries within each case study (locating one or more agents on each 4×4 m cell). Fourth, we established the agents' performance parameters, including (1) the impact of the slope on the evacuees' speed, according to Tobler's exponential hiking function (Tobler, 1993); (2) a Rayleigh probabilistic distribution of departure times for evacuees (see Mas et al., 2012a), with a mean of the distribution (the μ factor) equal to 8 min, which corresponds to the average time that ONEMI takes to release an evacuation warning; (3) an evacuation speed for each agent, according to its age (Buchmueller and Weidmann, 2006), probabilistically defined based on the case studies' population pyramids from the 2017 census (INE, 2018); (4) a random-walk parameter that introduces an aleatory fluctuation up to 10∘ on the evacuation direction; and (5) a crowd potential parameter that makes the agent tend to follow the direction in which other evacuees are moving, stochastically assigned (with a probability of 0.5). Fifth, we executed the simulation, in which the code initially computes the optimal route for each agent, according to its initial position and closest shelter, using the A* algorithm, frequently applied in evacuation studies (e.g. Mas et al., 2012a; Takabatake et al., 2020; Wang and Jia, 2021). Then, it calculates every agent's position at each time step (1 s), based on its departure time and velocity (which could be modified by the slope, random-walk, and crowd parameters). The code compares this new position with the water height at that moment (obtained from the inundation file) and updates the agent's status: (1) moving (i.e. alive), (2) dead (i.e. reached by the water), or (3) escaped (i.e. alive in the shelter). This process continues for 45 min, and then the computation stops.
As the model included stochastic parameters (the initial positions of the agents, their walking speeds and departure times, and the random-walk factor), we carried out 10 simulation rounds for each case study, intending to achieve a 95 % confidence interval with a margin of error < 1 % in the average values of the number of escaped, moving, and dead evacuees after 45 min. The model also recorded each agent's travel time and evacuation route (for every iteration).
2.2.2 Street network configuration model
According to Fakhrurrazi and Van Nes (2012), an appropriate street network configuration can increase the evacuees' chances of successfully evacuating in the case of a tsunami. The suitability of a street network for evacuation depends on factors like its accessibility; variety of route options; and the possibility of short, direct trips (Dill, 2004; Handy et al., 2003). While a range of metrics has been proposed to examine these characteristics (Sharifi, 2019), we will focus our analysis on centrality indicators, which can be used “to measure the degree of importance of specific nodes/links in a street network” (Sharifi, 2019, p. 174), based on how central the locations are compared to the rest of the urban layout (Porta et al., 2006). Moreover, centrality is a good predictor of everyday human movement (Sasabe et al., 2020; Turner, 2007), and authors like Mohareb (2011) and Marín Maureira and Karimi (2017) point out that evacuees tend to choose well-known paths instead of the designated ones.
We examined the move boundaries (described in Sect. 2.2.1 above) from each case study with the Urban Network Analysis Toolkit for ArcGIS (UNA) (Sevtsuk et al., 2013). For each street segment belonging to the input network, we analysed three centrality metrics: (1) betweenness, (2) straightness, and (3) closeness. These can be defined, respectively, as follows (Sevtsuk et al., 2013; Sharifi, 2019): (1) the fraction of shortest paths between all pairs of destinations in the street network that pass through an examined street segment, (2) the extent to which the shortest paths from a segment of interest to all the other segments in the street network resemble straight Euclidean paths, and (3) an indication of how close a street segment is to all other street segments in the network. To compare the street network's components, the toolkit normalises the outcomes according to the total number of segments in the network. The Urban Network Analysis Toolkit for ArcGIS delivers its outputs as a new GIS vector shapefile, with the input street network including these metrics.
2.2.3 Context-determined evacuation metrics
Each discrete location belonging to the examined areas of each case study (represented in our model by a 4×4 m cell) has a set of evacuation metrics determined by its existing spatial relationships to the geographical and built contexts. We examined these metrics using ArcMap 10.4.1 and the same data sources mentioned in Sect. 2.2.3 and 2.2.4 above. These indicators include (1) elevation; (2) sea distance, i.e. the straight-line distance between the cell's centre and its closest shoreline point; (3) distance to shelter, i.e. the straight-line distance between the cell's centre and the closest safe assembly area; and (4) pedestrian directness ratio (PDR) (also termed “Pedestrian Route Directness (PRD)” by Dill, 2004), which is the ratio of the “real-world” route distance (as determined by the street network) and the straight-line distance connecting the cell's centre and its closest safe assembly area. In this respect, Hillier and Iida (2005) and Hillier (2009) underline that the strongest movement predictor is the least angle change along the routes. Therefore, networks including fewer direction changes (i.e. lower PDR values) might improve the evacuees' wayfinding performance. Wayfinding is “the process of determining and following a path or route between an origin and a destination” (Allen, 1999, p. 6).
2.2.4 Spatial post-processing
In this research phase, we aimed to integrate the previous sections' outcomes into a descriptive spatial analysis that could also serve as the basis for the subsequent multivariate regressive study. We carried out this integration with the aid of the ArcMap 10.4.1 software. Our canvas included the move boundaries described in Sect. 2.2.1 above for each case study, which comprised a network of streets and open spaces represented by raster files with 4×4 m cells. Each of these cells corresponded to a specific location in the evacuation landscape, for which all the calculated metrics had to be spatialised. First, as the inundation and agent-based models used the same base raster, the former's results did not need to be post-processed. Second, the data from each case study's evacuation model included a range of at least 10 different groups of agents' initial locations (each with an associated final status: moving, dead, or escaped). Due to our purpose of examining vulnerability, we aimed at quantifying, for each cell, its death ratio (i.e. the percentage of dead agents that began their journey from it, comprising all the model's iterations). To do this, we used ArcMap's Spatial Join tool, which joined the attributes from the source feature (i.e. the initial locations of agents, all merged in a single shapefile) to the target feature (i.e. the raster-based street network). Third, for the case of the street configuration model, we applied the same Spatial Join tool to cast the properties from the outcoming street network into the base raster. Lastly, as we also calculated the context-determined evacuation metrics on the base raster, their results did not need to be post-processed either.
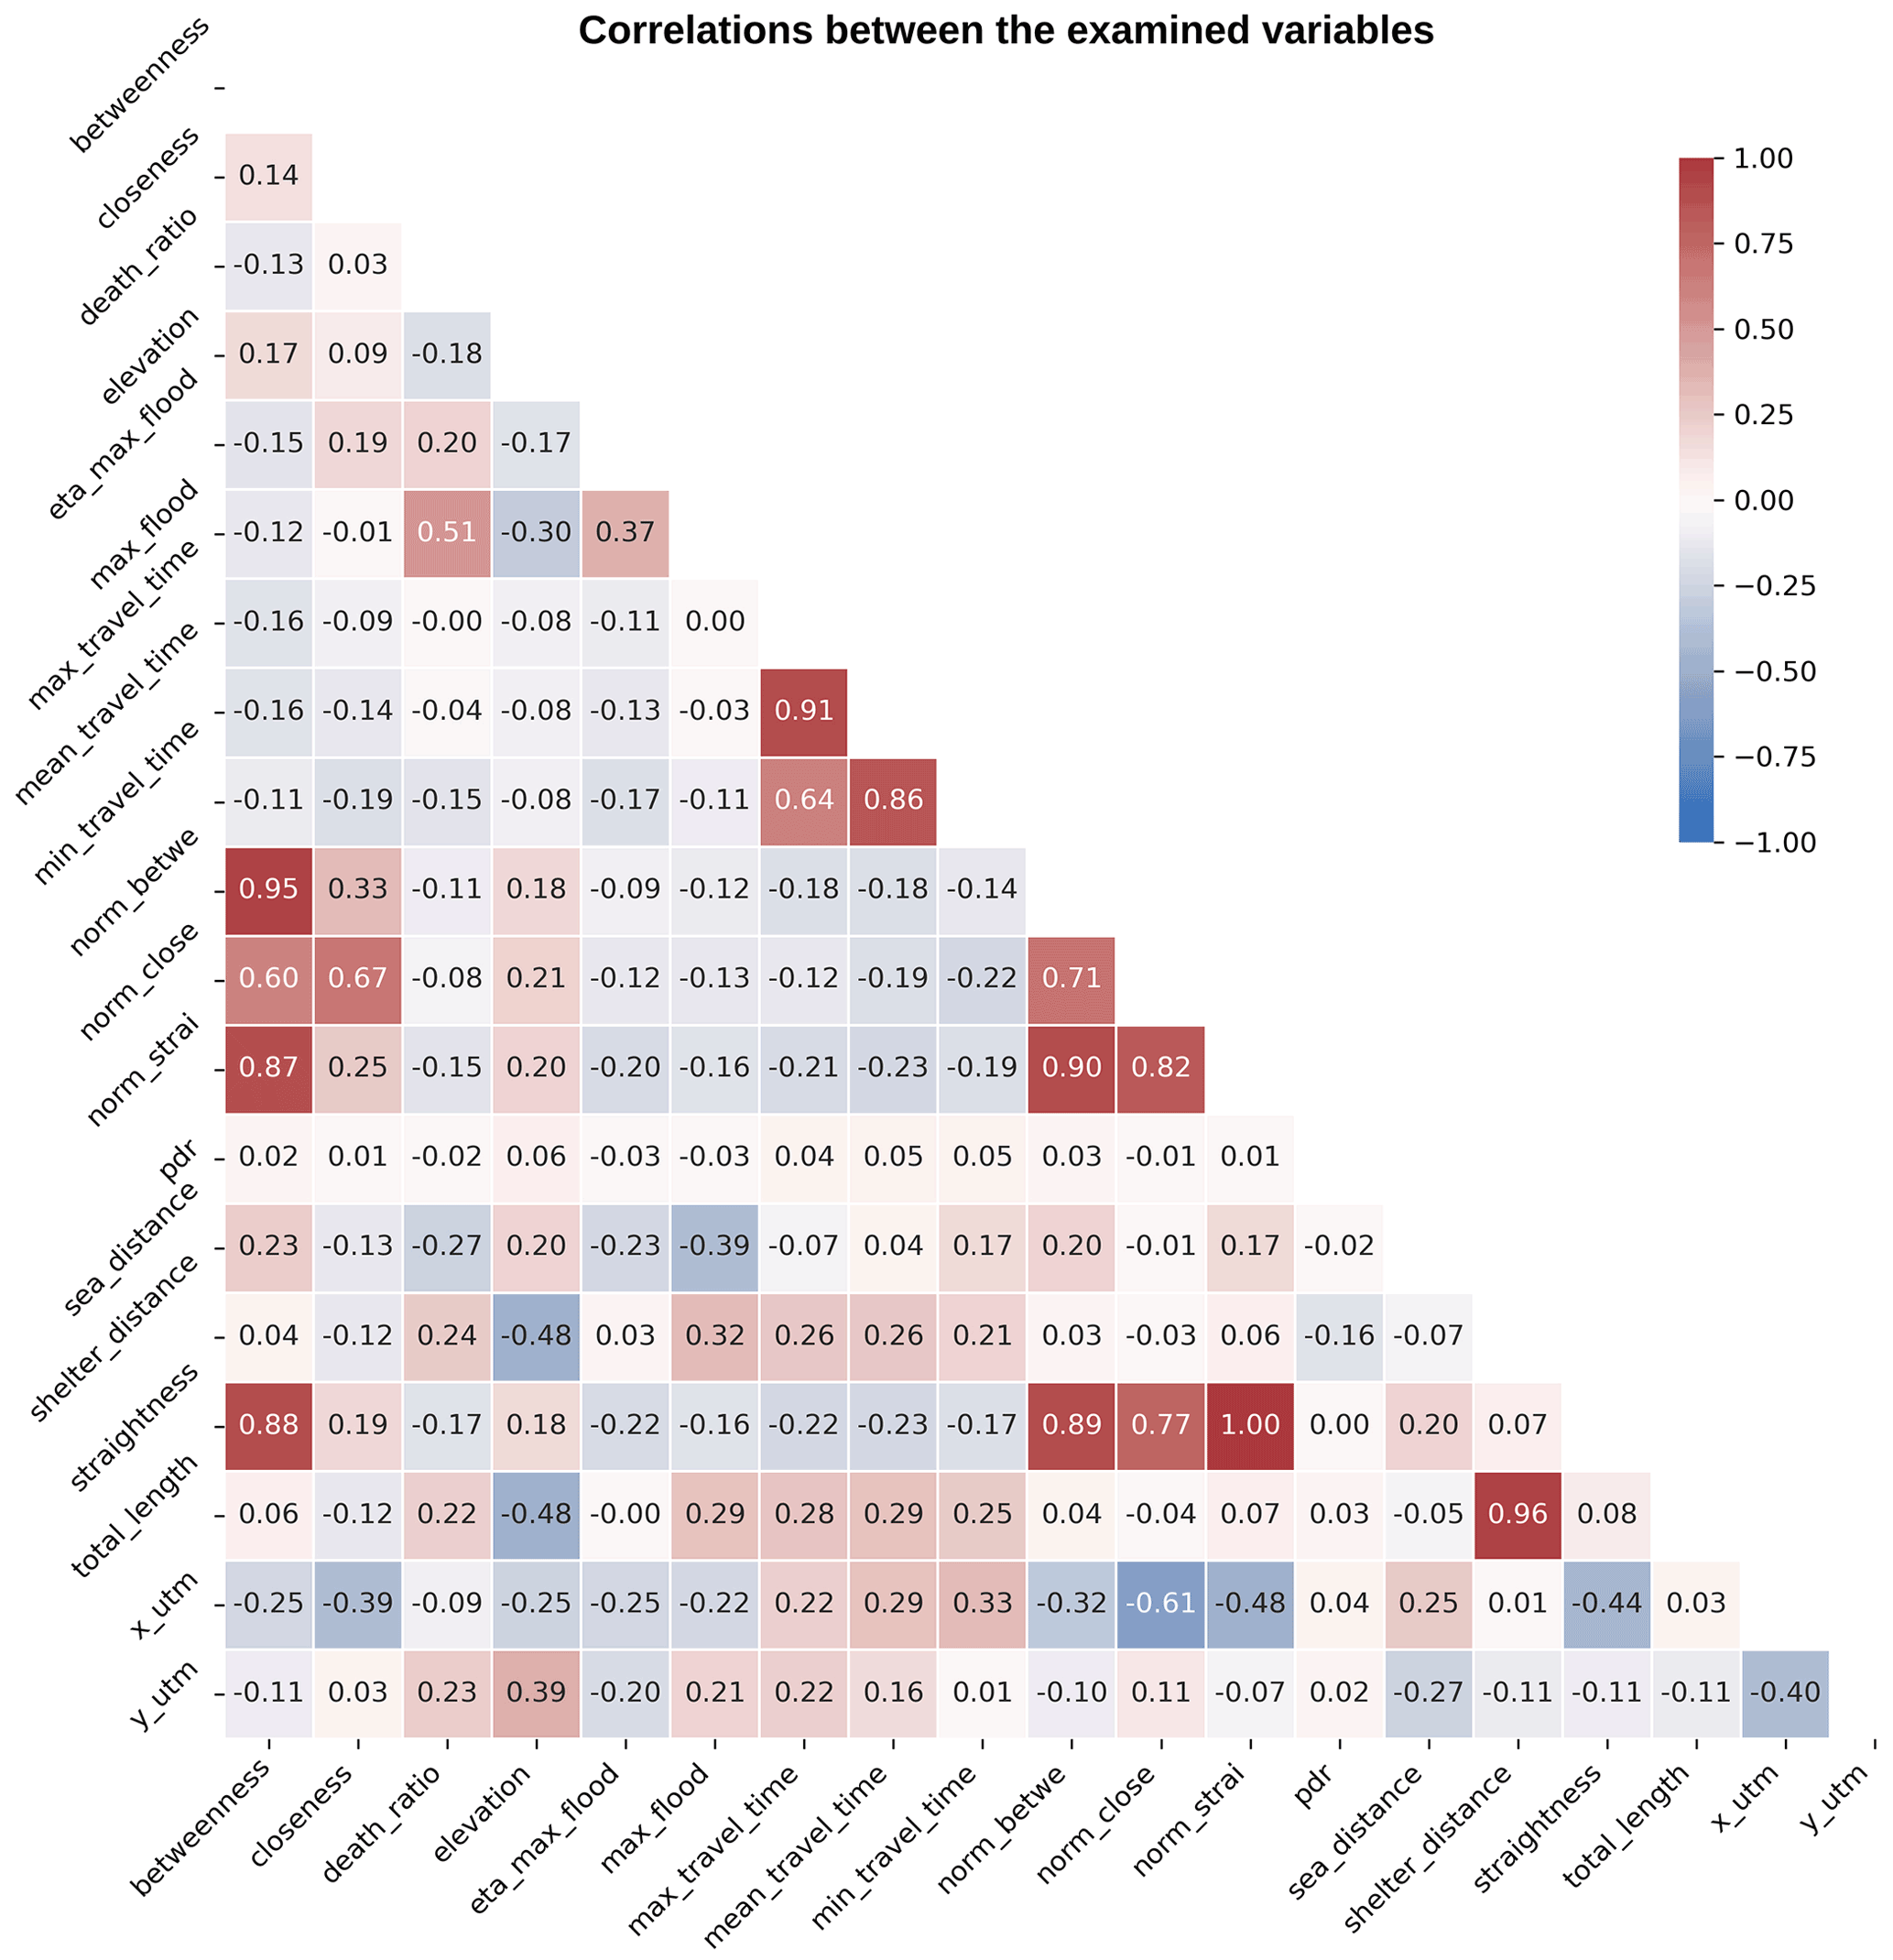
Our analysis, comprising all the case studies, included 530 091 cells, each of them containing the following data fields: (1) death ratio; (2) maximum, (3) minimum, and (4) mean travel time; (5) sea distance; (6) elevation; (7) total route length; (8) shelter distance; (9) estimated time of arrival (ETA) of the maximum flood; (10) maximum flood; (11) closeness, (12) betweenness, and (13) straightness (and their three normalised values); (17) pedestrian directness ratio (PDR); and the UTM (Universal Transverse Mercator) latitude and longitude coordinates (18 and 19). Assuming that the death ratio was our dependent variable, we ran a correlation test to prevent the correlation between the other predictor (independent) variables and therefore avoid collinearity problems in the regressive model (see Fig. 4). This test demonstrated that seven of these variables (numbers 2, 3, 8, 12, 14, 15, and 16 above) should not be included in the analysis, as they were correlated at (Dormann et al., 2013). We did not include the UTM coordinates, as they are defined according to global reference systems and not to local conditions.
Table 1 shows the number of examined cells for each case study.
2.3 Multivariate regressive analysis
For each case study, the result from the spatial post-processing was a raster shapefile representing the evacuation territory, where each cell included the 19 data fields mentioned in Sect. 2.2.4. The objective of our regressive analysis was to test, for each of the 530 091 cells, the death ratio (the dependent variable) against the other nine selected independent variables, which represent characteristics of the geography and built environment. In this way, we could examine how much each of these characteristics contributes to the expected death ratios. To do this, we developed a multivariate regressive analysis using a random forest methodology, which combines a multitude of simple decision trees (Breiman, 2001). Tree-based methods for regression and classification stratify or segment the predictor space into several simple regions. To predict a given observation, we typically use the mean or the mode response value for the training observations in the region it belongs. Since the splitting rules used to segment the predictor space can be summarised in a tree, these approaches are known as decision tree methods (James et al., 2013). Random forest is an ensemble method that combines many simple decision trees models to obtain a single and potentially powerful model. Each tree takes random samples of the observations and performs split steps using a subset of features, thereby decorrelating the trees and leading to a more thorough exploration of model space.
We applied a k-fold cross-validation method to assess this model's outcomes (Mosteller and Tukey, 1968). Following this method, we randomly split all the input data (comprising the nine independent variables and one dependent variable) into five equal-size packages (folds). In four of them (the training packages), we applied our regressive random forest model to internally predict the values of the death ratio, according to the independent variables; this was the “training” test. We repeat this process for the “external” fifth package (the testing one) on the “testing” test. Then, we calculated the coefficient of determination (R2) to assess the strength of the relationship between the predicted and actual dependent variable in the training and testing packages. After that, we tried the other four combinations of training and testing packages to obtain further R2 scores. Then, we executed five other random splits of the input data, leading to 30 overall repetitions of the procedure. Overall, our mean R2 scores were 0.9101 (SD = 0.0021) and 0.8607 (SD = 0.0022) for the training and testing analyses, respectively, which underline our model's goodness of fit.
To enhance the interpretation of the model's results, we used SHAP (SHapley Additive exPlanations) values (Lundberg and Lee, 2017). SHAP values are a unified framework for explaining model predictions, motivated by the idea that model interpretability is as important as model accuracy, since some modern models act as black boxes due to their complexity. It has three significant advantages over other explanatory approaches: (1) it considers that interpreting a prediction model is a model itself, commonly named as an explanation model; (2) game theory results guarantee a unique solution; and (3) the method is better aligned with human intuition. SHAP values are a unique unified measure of feature importance, since it meets three desired properties: (i) local accuracy (approximating the original model), (ii) missingness (a missing feature in the original input has no impact), and (iii) consistency (if a model changes, then the attributes of the inputs should be updated as well). Classic Shapley regression values examine feature importance for linear models in the presence of multicollinearity. To do this, SHAP retrains the model on all feature subsets, assigning an importance value to each feature that represents the effect of including that feature on the model prediction: a model is trained with a particular feature present, and another model is trained with the feature withheld, and then predictions from the two models are compared (Lundberg and Lee, 2017). SHAP values are the Shapley values of a conditional expectation function of the original model. The exact computation of SHAP values is challenging. However, combining insights from current additive feature attribution methods makes it possible to approximate them, leading to good computational efficiency. Since this method is, essentially, a sum of the contributions of each feature, which is consistent with human intuition.
To develop our statistical analysis, we used an ad hoc Python model, comprising the data analysis libraries NumPy (Berg et al., 2020) (https://numpy.org/, last access: 10 September 2021), pandas (McKinney et al., 2020) (https://pandas.pydata.org/, last access: 10 September 2021), and SHAP (Lundberg, 2020) (https://github.com/slundberg/shap, last access: 10 September 2021).
Lastly, to ensure the validity of our results and to assess the potential effect of the resolution of the data generated by our flood and evacuation model, we carried out an integrated SHAP value analysis including the same source information but combined in different resolutions, according to a geometric sequence with a factor of 2 between the size of each examined unit. To do this, we developed an algorithm that, starting from the 4×4 m cell (resolution × 1) with the largest southern latitude and western longitude in each case study (i.e. located at the bottom left corner of the study area), grouped these basic units into five successive spatial partitions, each of them covering the complete evacuation move boundary. These partitions comprised cells 8×8 (resolution × 2), 16×16 (resolution × 4), 32×32 (resolution × 8), 64×64 (resolution × 16), and 128×128 m (resolution × 32) wide, respectively. For each of these larger cells, the algorithm calculated the value of every independent variable as the average of the combined 4×4 m units. Then, we ran the SHAP value analysis at these coarser resolutions again.
3.1 Death ratios and the natural- and built-environment characteristics
Table 3 summarises our descriptive analysis comprising 530 091 cells belonging to the case studies' move boundaries. This table arranges the data in 11 intervals according to growing (in 10 % steps) death ratio thresholds. For each of these intervals, we include the mean and standard deviation values of nine independent variables (mean travel time, sea distance, elevation, total route length, estimated time of arrival – ETA – of the maximum flood depth, maximum flood depth, closeness, straightness, and pedestrian directness ratio – PDR). Figure 5, in turn, shows scatterplots (summarising all the examined cells with positive death ratios) of the death ratio compared with each of the nine independent variables, plus one extra chart that shows the death ratio distribution across the case studies. To enhance readability, we post-processed the 530 091 scattered records into a 10×10 grid, where each square's colour depth represents the percentage of all the data comprised by it.
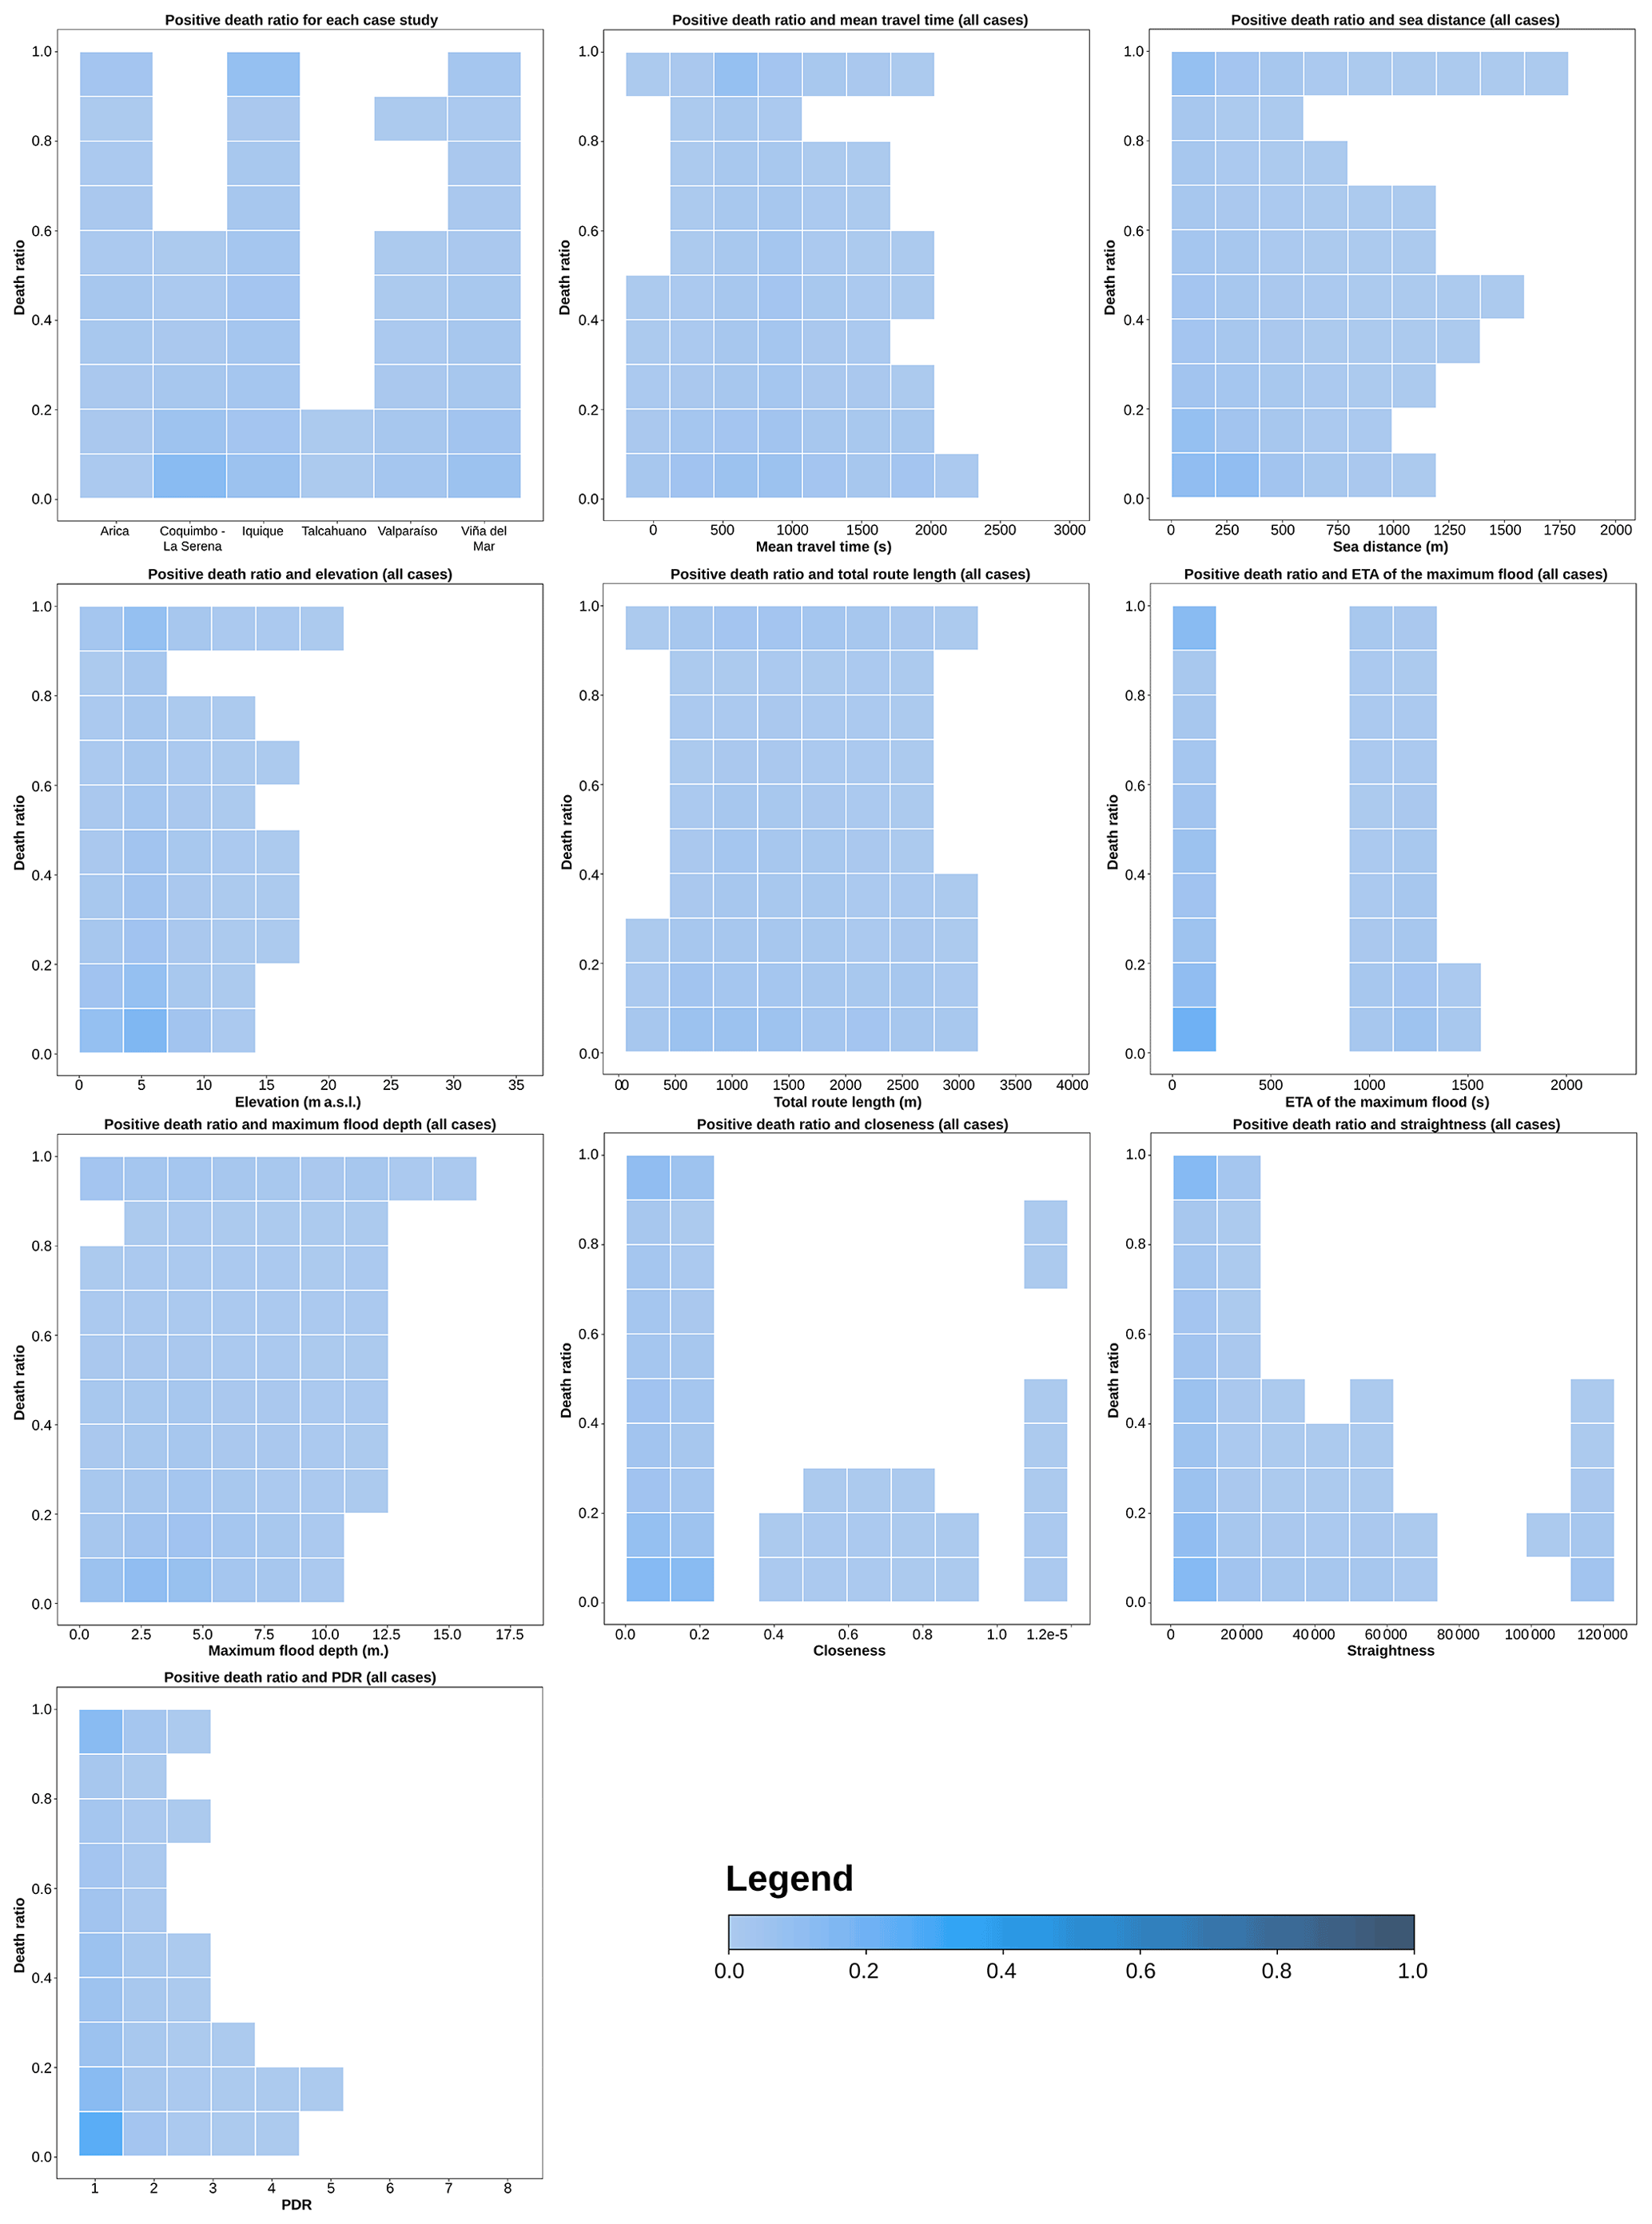
Figure 5Data scatterplots showing the distribution of the death ratios, in comparison to the nine examined independent variables. The prevalence of different death ratios across the case studies is also included (top left image).
Table 3Death ratio thresholds and mean and standard deviation of the independent variables.
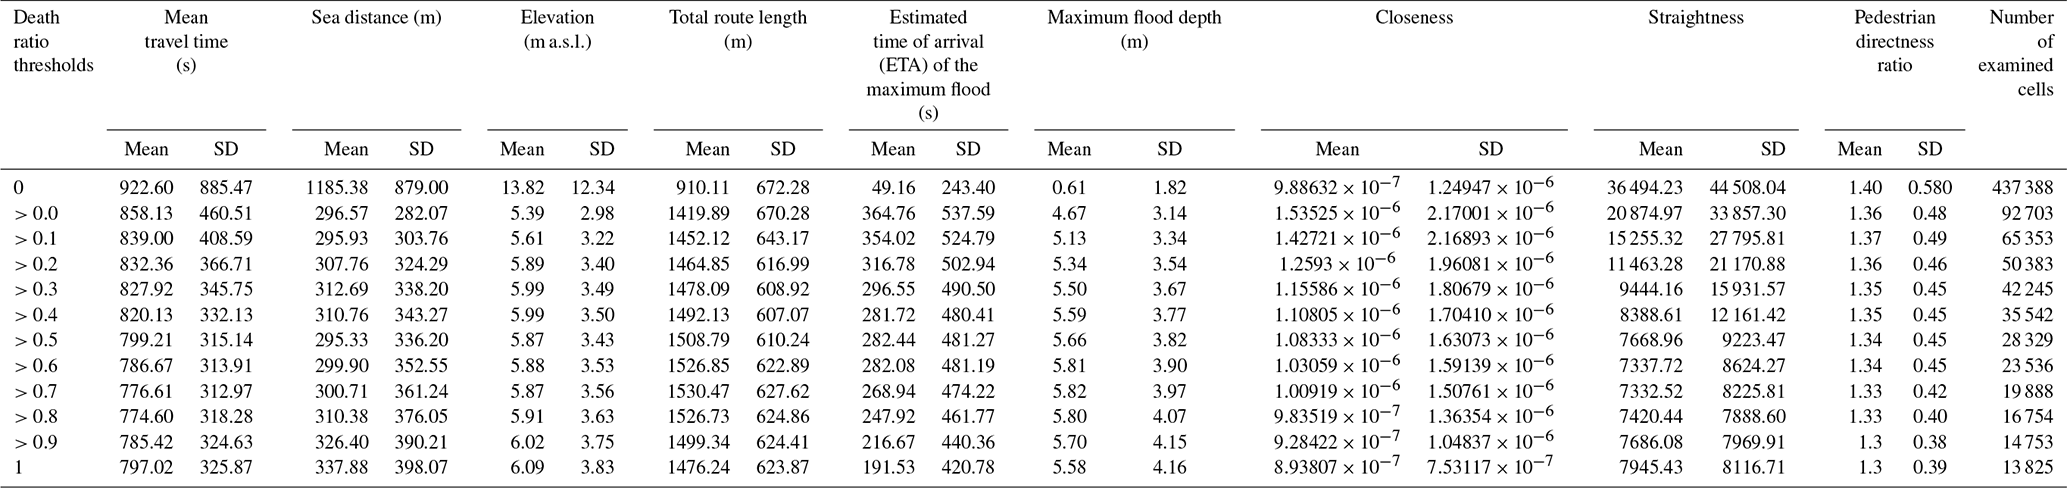
Our analysis shows that 92 703 of 530 091 cells (17.49 %) have at least one “dead” agent (evacuee) across the simulations. Moreover, Fig. 5 shows that Arica, Iquique, Valparaíso, and Viña del Mar have cells where the death ratio reaches up to 1; i.e. every agent departing from them is caught by the modelled tsunamis. The analysis also shows that some of the geographical and built-environment attributes have clear spatial relationships with death ratios. In this respect, it is useful to compare their average values for two different death ratio thresholds, 0 and >0.0 (i.e. without and with dead agents in the cells), to highlight their differences. For instance, cells with positive death ratios have an average elevation of 5.39 m a.s.l., i.e. 39.03 % of the average value of the “safe” cells (13.82 m a.s.l.). In line with this, Fig. 5 shows that the maximum values of elevation for “deadly” cells stay below 20 m a.s.l. In the case of the distance to the sea, the ratio between the average values of deadly and safe cells is 0.25 (296.57 and 1185.38 m, respectively), with maximum levels smaller than 1750 m (according to Fig. 5). For the maximum flood depth attribute, the ratio is 0.13 (average values of 0.611 and 4.67 m for the safe and deadly cells, respectively), with no cells above 15 m. A similarly steep difference occurs in the case of the ETA of the maximum flood, with a ratio of 0.13 due to an average value of 49.16 s for those cells with a death ratio = 0 and of 364.76 s for cells with a death ratio > 0.0. In the case of the variables related to evacuation and urban-form parameters (mean travel time, total route length, closeness, straightness, and pedestrian directness ratio – PDR), the differences between the average values of safe and deadly cells are also pronounced in some cases (0.57 for straightness and 0.64 for both total route length and closeness), while they are mild in others (0.97 and 0.93 for PDR and mean travel time, respectively).
To assess the dispersion of results shown by Fig. 5, it is useful to compare the coefficients of variation in each data field, in the case of the average values of two different death ratio thresholds (0 and >0.0). According to Abdi (2010), the coefficient of variation allows for the comparison of data distributions with different units. It is defined as the standard deviation of a series of numbers, divided by the mean of this series of numbers. Along these lines, in the case of the safe cells (death ratio = 0), the examined data fields (mean travel time, sea distance, elevation, total route length, estimated time of arrival – ETA – of the maximum flood, maximum flood depth, closeness, straightness, and pedestrian directness ratio – PDR) show coefficients of variation of 0.96, 0.74, 0.89, 0.74, 4.95, 2.98, 1.26, 1.22, and 0.41, respectively. On the other hand, for the deadly cells (death ratio > 0.0) and the same variables, the coefficients of variation are 0.54, 0.95, 0.55, 0.47, 1.47, 0.67, 1.41, 1.62, and 0.35, respectively. These values show that, in the case of cells with a death ratio = 0, the dispersion of results is in a similar range, except for two variables: ETA of the maximum flood and maximum flood depth. In the case of death ratio > 0.0, variation among results is more limited, with three highlighted variables: estimated time of arrival (ETA), closeness, and straightness.
3.2 Multivariate regressive analysis
Figures 6 and 7 show the results of the SHAP value analysis for the random forest model's outcomes. Figure 6 shows, for every independent variable and all the examined cells, the amount of the former's contribution (either positive or negative) to the predicted death ratio (compared to the average prediction across all the cells). Red dots mean higher values of the independent variable, while blue ones imply the opposite. Figure 7 processes this data to display, for each independent variable, the average absolute contribution to the predicted death ratio. These results show that the most important feature in predicting death ratios is the maximum flood depth, followed by the straightness, the total route length, and the mean travel time. On average, the maximum flood depth can vary the death ratio up to 0.08 points, more than twice the impact of the straightness (0.037). In turn, this value is higher than those of the total route length (0.032) and the mean travel time (0.024).

Figure 8, in turn, summarises the results of the SHAP value analysis including different resolutions (×1, ×2, ×4, ×8, ×16, and ×32) developed from the basic 4×4 m unit (i.e. with cells 8×8, 16×16, 32×32, 64×64 and 128×128 m, respectively). According to these results, the overall importance hierarchy of the independent variables remains unchanged through the different resolutions of analysis. Complementarily, noticeable and disparate changes can be seen in the amount of their impacts on the predicted death ratio if we compare the more and less accurate resolutions. For instance, while the maximum flood depth increases its impact value by 35.44 % between the ×1 and ×32 resolutions, the straightness and the total length of the street network reduce their impacts by 2.78 % and 12.5 %, respectively. Moreover, reduction reaches 45.83 % in the case of the mean travel time. In turn, the ETA of the maximum flood exhibits shifting results: its impact on the death ratio grows by 33.33 % until the ×16 resolution and then decreases to 0.015 points at the ×32 resolution, i.e. 16.66 % less than in its original value at ×1.
Our descriptive analysis included 530 091 cells. Of these, 92 703 (17.49 %) have a death ratio > 0.0 (i.e. at least one agent from any of the model's run, who started its evacuation from one of them, was caught by the tsunami). In turn, 13 825 cells (2.61 %) have a death ratio = 1, which means that the waters reach every agent departing from them before they arrive at a safe assembly area. As shown by Table 1 and Fig. 5, the rate of cells with elevated death ratios is unevenly distributed across the case studies. Cities like Viña del Mar, Valparaíso, and Iquique show large percentages of cells susceptible to having dead evacuees (54.78 %, 43.81 %, and 29.71 %, respectively). On the contrary, Talcahuano has only 0.74 % of its cells on this condition. As we can see in the maps included in Fig. 1, while the first three cities gather considerable urban development and residential populations on exposed locations right next to the coastline, most of the last one's territory is roughly 1.0 to 1.5 km from the coast, from whom large, marshy areas separate it.
The death ratio thresholds included in Table 3 and the results in Figs. 6 and 7 allow for appraising, for the examined case studies, how each independent variable relates to the possibility of death in the case of a tsunami and how these variables change between deadly and safe locations. First, the data show that three of the four of most important predictor variables (the maximum flood depth, straightness, and total route length, whose impacts are on average 5.1 times larger than the other eight examined variables) have significant differences between their average values for the deadly and safe cells (ratios of 0.13, 0.57, and 0.64, respectively). Second, some of the variables exhibit what we might call an expected behaviour: the probability (for an agent) of “dying” because of a tsunami increases if the departing cell has comparatively lower elevation or shorter distance to the sea. In a similar manner, a higher maximum flood depth also increases the cells' death ratios. Third, three variables show somewhat counter-intuitive results: the death ratio increases when the mean travel time reduces and when the estimated time of arrival (ETA) of the maximum flood, as well as the closeness, grow. In the case of the first of these independent variables, the results are likely influenced by the fact that the evacuees that departed from lethal cells have comparatively shorter (actual) evacuation times, as the tsunami soon reaches them and cannot complete their evacuation paths. In the case of the street network's closeness (which is a measure of how close a cell is to all other cells within the “evacuation territory”), one may expect that more compact street networks should lead to shorter evacuation routes (and times) and, therefore, fewer dead evacuees. Nevertheless, according to our results, it would be possible that these smaller networks are faster to flood by the incoming tsunami. Lastly, in the case of the ETA, it is essential to underline that the estimated time of arrival of the maximum flood is not necessarily the same as the onset time of the first tsunami front. In our model, the latter can have much more impact on the evacuees' survival rates.
While tsunamis and their related evacuation potentials are highly context-dependent, our cross-case results could serve to identify and appraise other tsunami-vulnerable areas in Chile. Moreover, they highlight possible spatial planning guidelines that could be applied to develop new urban regions in exposed territories (if this expansion cannot be restricted or discouraged). For instance, our results show that the average number of tsunami-caused deaths would occur across those evacuees initially located within an approximately 300 m wide buffer zone from the coastline. In line with this, Løvholt et al. (2014, p. 133) point out that studies of the impact of the 2004 Indian Ocean tsunami show that “in Sri Lanka, people within the 100-m zone from the shoreline were more likely to die and to be seriously injured than people living outside this zone”. In turn, González-Riancho et al. (2015) underline that 72 % of the housing units within the 200 m line from the shoreline in Sri Lanka were completely or partially damaged, leading to a higher number of victims. Eckert et al. (2012) also point out that buildings within that area are highly vulnerable. In the case of the tsunami flood, while inundation depths can be above 10 m at several of our case studies' coastlines, our model shows that the average flood depth at the lethal departure cells is roughly 4.67 m. In turn, safe cells have a comparatively low mean value of 0.61 m, implying that some evacuees can avoid being caught by the advancing tsunami front if they rapidly leave the low floodable areas. These results are in line with the literature on human casualties during past tsunamis. For instance, Suppasri et al. (2016) point out that the inundation depths that increased fatality ratios during the 2011 Great East Japan Earthquake and Tsunami are primarily around 10 or 5 m, depending on the specific geographical characteristics of different examined areas. In line with this, Murakami et al. (2012) examined the human loss distribution during the 2011 disaster in the district of Yuriage, city of Natori, showing that inundation depths between 1.87 and 8.50 m triggered death ratios up to 22.3 %. In turn, in the case of the ground elevation, the average value of the safe cells is 13.82 m. When we include lethal cells in the analysis, we can see that fatalities concentrate around elevations of 6 m and below. In this respect, Eckert et al. (2012) argue that buildings located at a height of 5–10 m can be considered of medium vulnerability to tsunamis, while those with an elevation above 10 m have low vulnerability. For the previously mentioned case of the district of Yuriage, Murakami et al. (2012) report elevations less than 5 m in the deadly areas. It is also noticeable that cells belonging to street networks with good integration levels that also allow for short walks to the safe assembly areas and have few direction changes (i.e. with high betweenness, straightness, and PDR values, respectively) have lower death ratios. In this respect, as Sharifi (2019) underlines, locations with high betweenness centrality values can easily lead to many other sites within the network. Therefore, it is critical to maintain their functionality during disasters.
To focus on possible paths to improvement for these case studies, it is helpful to examine the outcomes from our multivariate regressive analysis. In this respect, as we pointed out above, some independent variables have comparatively higher impacts on the death ratios as predicted by our regressive model. The most significant one is the maximum flood depth, followed by the straightness, the total route length, and the travel time. The maximum floods on lethal cells are difficult to mitigate unless hardware-type defences are built (which, as mentioned above, is unlikely in developing countries like Chile). Moreover, we already pointed out that the tsunami flood also affects the travel time in our regressive analysis. Nevertheless, the straightness and total route length depend on real-world urban configurations, resulting from the case studies' historical development process. They hence can be subject to strategic interventions to modify their values to reduce the cells' death ratios. In this respect, more direct routes are not only faster to walk (thus reducing escape distances and evacuation times) but also help to improve wayfinding, as they reduce the changes in direction that evacuees must undertake between their origins and destinations (Fakhrurrazi and Van Nes, 2012; Mohareb, 2011). The importance of wayfinding cannot be underestimated, especially in the case of tourists and non-locals, who may constitute a large percentage of casualties during a tsunami (as shown by the Chilean disaster of 2010) (Kubisch et al., 2020). Also, the total route length (and the shelter distance) could also be reduced by incorporating vertical evacuation across the urban fabric, which has been proven to reduce the evacuation times significantly (León et al., 2019; Mostafizi et al., 2019). Currently, vertical evacuation in Chile is recommended as only a second choice of escape if horizontal evacuation is not feasible (ONEMI, 2014).
Thorough evacuation analyses are context-dependent and must take care of geographical and socio-psychological aspects that affect the populations' behaviour (Makinoshima et al., 2021; Mohareb, 2011; Murray-Tuite and Wolshon, 2013; Perry et al., 1981). In this respect, one limitation of our study is that socio-psychological factors are not analysed. However, future research on this type of determinants of tsunami evacuation could help to critically review some of our model's central assumptions (e.g. a “full compliance” evacuation, the probabilistically distributed departure times, or the routing process) and strengthen future outputs. Furthermore, as Suppasri et al. (2016, p. 11) point out, “analyses involving statistically significant correlations between characteristics and fatality rate must be performed with caution and based on various data sources”. We are aware that the reliability of our findings depends on the quality of the model's assumptions, functions, and source data. In this respect, we included a secondary SHAP value analysis to assess the validity of our results at coarser resolutions of the input data generated by our flood and evacuation model. This analysis showed that the overall importance hierarchy of the examined independent variables (as predictors of the death ratio) remains unchanged throughout the different resolutions of the study. Moreover, halving the resolution of our input data could lead to absolute changes not greater than 18 % on the impact of the most significant independent variables on the expected death ratio. Our results also show that increasingly less accurate resolutions might lead to noticeable variations in these impacts (for instance, up to roughly 35 % when the maximum flood depth is compared between the ×1 and ×32 resolutions). Along these lines, future research could deepen into the possible sources of these variations (including, but not limited to, the scale of the input data), for instance, the appropriate resolution, type, functioning and parameters of the evacuation models; the characteristics of the examined independent variables; and the chosen regressive analysis method, among others. We also point out that reality-based validation procedures (as the one mentioned in León et al., 2021a) will always be necessary and that the related spatial planning guidelines for evacuation improvement should be delivered cautiously. Nevertheless, as tsunamis are relative rare phenomena (where populations' actual behaviours are still hard to capture), our simulation-based analysis provides a significant step into identifying and examining geographical and built-environment attributes that might influence the evacuation potential of coastal communities, as a spatial framework for the subsequent analysis of their specific socio-psychological characteristics.
-
We proposed a modelling-based approach (including inundation, evacuation, and urban-form metrics) to quantitatively appraise, through statistical regressive analysis, some of the most relevant geographical and built-environment aspects that could contribute to the success (or failure) of evacuation in the case of a tsunami, using a cross-case study of seven Chilean coastal cities.
-
According to our results, some of these cities can have up to roughly 55 % of their move boundaries (i.e. the evacuation area between the coastline and the safe inland assembly areas) susceptible to having dead evacuees.
-
We also demonstrated that geographical, urban-form, and evacuation variables, including the maximum flood depth (within the examined evacuation threshold), straightness, total route length, and mean travel time, could significantly impact the expected death ratios in each case study. Moreover, we describe the average values of these metrics related to different thresholds of death ratio.
-
We argued that, while engineered countermeasures to control flood levels are unlikely in developing countries like Chile, urban-form metrics like the street network's straightness could be the subject of improvements through planning processes. Moreover, this would allow for other enhancements in other evacuation dimensions like the travel time and evacuees' wayfinding.
-
Future research could enhance our approach with the incorporation of socio-psychological aspects and probabilistic tsunami flood modelling. Also, more case studies (at both the national and global levels) and validation procedures (also considering different resolutions of the input data) could help test our findings' robustness and generalisability.
Tsunami-flood- and agent-based modelling codes cannot be openly accessed, as the sources that we modified belong to the Port and Airport Research Institute (PARI) of Japan. They were transferred to the Research Center for Integrated Disaster Risk Management (CIGIDEN) within the framework of a SATREPS (Science and Technology Research Partnership for Sustainable Development) project (2011–2015) (from the Japanese government), “Collaboration with Chile to Prevent Future Tsunami Tragedies”. Codes for statistical analysis can be downloaded from the sources mentioned above.
DBF files compressing the post-processed spatial data can be downloaded from https://usmcl-my.sharepoint.com/:f:/g/personal/jorge_leon_usm_cl/Emfj8ZYFmb1EhZmQ49dbLJ4Bi5z1HOvc-TKHsg0Wg5GZBw?e=KAL2Z5 (Léon, 2022).
JL conceptualised the project and methodology and wrote the original draft of the paper. AG performed tsunami and evacuation modelling and reviewed and edited the paper. AO performed statistical modelling.
The contact author has declared that none of the authors has any competing interests.
Publisher's note: Copernicus Publications remains neutral with regard to jurisdictional claims in published maps and institutional affiliations.
We thank Taro Arikawa from PARI and Chuo University, Japan. We thank Telefónica Movistar Chile for providing anonymised CDR databases. Powered@NLHPC: this research was partially supported by the supercomputing infrastructure of the NLHPC (National Laboratory for High Performance Computing Chile; no. ECM-02). We also thank Matías Carvajal for providing the fault model of the Iquique earthquake.
This research was funded by the Agencia Nacional de Investigación y Desarrollo (ANID) and Fondo Nacional de Desarrollo Científico y Tecnológico (FONDECYT; grant nos. 11170024 and 1210184) and by the Research Center for Integrated Disaster Risk Management (CIGIDEN; grant no. ANID/FONDAP/15110017; Fondo de Financiamiento de Centros de Investigación en Áreas Prioritarias).
This paper was edited by Mauricio Gonzalez and reviewed by two anonymous referees.
Abdi, H.: Coefficient of Variation, in Encyclopedia of Research Design, edited by N. Salkind, SAGE, Thousand Oaks, http://www.utd.edu/~herve (last access: 3 March 2022), 2010.
Aguilar, L. and Wijerathne, M. L. L.: On a Mass Evacuation Simulator with Complex Autonomous Agents and Applications, in: Journal of Earthquake and Tsunami, World Scientific Publishing Company, 10, 1640021, https://doi.org/10.1142/S1793431116400212, 2016.
Allan, P., Bryant, M., Wirsching, C., Garcia, D., and Rodriguez, M. T.: The Influence of Urban Morphology on the Resilience of Cities Following an Earthquake, J. Urban Des., 18, 242–262, 2013.
Allen, G. L.: Spatial Abilities, Cognitive Maps, and Wayfinding. Bases for individual differences in spatial cognition and behavior, in: Wayfinding Behavior. Cognitive mapping and other spatial processes, edited by: Golledge, R., The John Hopkins University Press, Baltimore, 46–80, ISBN 9780801859939, 1999.
Anwar, H., Gebert, N., Mueck, M., Muhari, A., Post, J., Stein, E., Wegscheider, S., Birkmann, J., Riedlinger, T., and Strunz, G.: Guideline For Tsunami Risk Assessment In Indonesia. Scientific Proposal For Practitioner And End Users, https://www.gitews.org/tsunami-kit/en/E1/further_resources/GITEWS Guideline for Tsunami Risk Assessment in Indonesia.pdf (last access: 10 July 2019), 2011.
Aránguiz, R., González, G., González, J., Catalán, P., Cienfuegos, R., Yagi, Y., Okuwaki, R., Urra, L., Contreras, K., Del Río, I., and Rojas, C.: The 16 September 2015 Chile Tsunami from the Post-Tsunami Survey and Numerical Modeling Perspectives, Pure Appl. Geophys., 173, 333–348, 2016.
Arikawa, T.: Development of High Precision Tsunami Simulation Based on a Hierarchical Intelligent Simulation, in: Proceedings of the 34th JSST Annual International Conference on Simulation Technology, Toyama, Japan, 12–14 October 2015, https://doi.org/10.15748/jasse.3.151, 2015.
Berg, S., Fernández del Río, J., Gommers, R., Haldane, A., Harris, C., Hoyer, S., Picus, M., Smith, N., Taylor, J., Virtanen, P., van der Walt, S., and Wieser, E.: NumPy [code], https://numpy.org/ (last access: 11 January 2021), 2020.
Birkmann, J.: Indicators and criteria for measuring vulnerability: Theoretical bases and requirements, in: Measuring Vulnerability to Natural Hazards: Towards Disaster Resilient Societies, United Nations University Press, Tokyo, Japan, 55–77, ISBN 9280811355, 2006.
Birkmann, J., Teichman, K. V., Welle, T., González, M., and Olabarrieta, M.: The unperceived risk to Europe's coasts: tsunamis and the vulnerability of Cadiz, Spain, Nat. Hazards Earth Syst. Sci., 10, 2659–2675, https://doi.org/10.5194/nhess-10-2659-2010, 2010.
Breiman, L.: Random forests, Mach. Learn., 45, 5–32, https://doi.org/10.1023/A:1010933404324, 2001.
Buchmueller, S. and Weidmann, U.: Parameters of pedestrians, pedestrian traffic and walking facilities, IVT Schriftenreihe, vol. 132, Institute for Transport Planning and Systems, ETH Zürich, Zurich, https://doi.org/10.3929/ethz-b-000047950, 2006.
Carvajal, M., Cisternas, M., and Catalán, P. A.: Source of the 1730 Chilean earthquake from historical records: Implications for the future tsunami hazard on the coast of Metropolitan Chile, J. Geophys. Res.-Solid, 122, 3648–3660, https://doi.org/10.1002/2017JB014063, 2017.
Catalán, P., Aránguiz, R., González, G., Tomita, T., Cienfuegos, R., González, J., Shrivastava, M. N., Kumagai, K., Mokrani, C., Cortés, P., and Gubler, A.: The 1 April 2014 Pisagua tsunami: observations and modeling, Geophys. Res. Lett., 42, 2918–2925, 2015.
Dewi, R. S.: A-Gis Based Approach of an Evacuation Model for Tsunami Risk Reduction, J. Integr. Disast. Risk Manage., 2, 108–139, https://doi.org/10.5595/idrim.2012.0023, 2012.
Dill, J.: Measuring network connectivity for bicycling and walking, in: 83rd Annual Meeting of the Transportation Research Board, Washington, DC, 11–15 January 2004, https://repository.difu.de/jspui/bitstream/difu/126156/1/DB0499.pdf (last access: 11 December 2020), 2004.
Dohi, Y., Okumura, Y., Koyama, M., and Kiyono, J.: Evacuee Generation Model of the 2011 Tohoku Tsunami in Ishinomaki, in Journal of Earthquake and Tsunami, World Scientific Publishing Company, 10, 1640010, https://doi.org/10.1142/S1793431116400108, 2016.
Dormann, C. F., Elith, J., Bacher, S., Buchmann, C., Carl, G., Carré, G., Marquéz, J. R. G., Gruber, B., Lafourcade, B., Leitão, P. J., Münkemüller, T., Mcclean, C., Osborne, P. E., Reineking, B., Schröder, B., Skidmore, A. K., Zurell, D., and Lautenbach, S.: Collinearity: A review of methods to deal with it and a simulation study evaluating their performance, Ecography, 36, 27–46, https://doi.org/10.1111/J.1600-0587.2012.07348.X, 2013.
Drápela, J., Calisto, I., and Moreno, M.: Locking-derived tsunami scenarios for the most recent megathrust earthquakes in Chile: implications for tsunami hazard assessment, Nat. Hazards, 107, 35–52, https://doi.org/10.1007/S11069-021-04572-5, 2021.
Eckert, S., Jelinek, R., Zeug, G., and Krausmann, E.: Remote sensing-based assessment of tsunami vulnerability and risk in Alexandria, Egypt, Appl. Geogr., 32, 714–723, https://doi.org/10.1016/J.APGEOG.2011.08.003, 2012.
Fakhrurrazi, F. and Van Nes, A.: Space and Panic. The application of Space Syntax to understand the relationship between mortality rates and spatial configuration in Banda Aceh during the tsunami 2004, in: Eighth International Space Syntax Symposium, Santiago, 3–6 January 2012, http://sss8.cl/8004.pdf (last access: 18 March 2021), 2012.
Fraser, S. A., Wood, N. J., Johnston, D. M., Leonard, G. S., Greening, P. D., and Rossetto, T.: Variable population exposure and distributed travel speeds in least-cost tsunami evacuation modelling, Nat. Hazards Earth Syst. Sci., 14, 2975–2991, https://doi.org/10.5194/nhess-14-2975-2014, 2014.
Frazier, T. G., Thompson, C. M., and Dezzani, R. J.: A framework for the development of the SERV model: A Spatially Explicit Resilience-Vulnerability model, Appl. Geogr., 51, 158–172, https://doi.org/10.1016/J.APGEOG.2014.04.004, 2014.
Fritz, H., Petroff, C., Catalan, P., Cienfuegos, R., Winckler, P., Kalligeris, N., Weiss, R., Barrientos, S., Meneses, G., Valderas-Bermejo, C., Ebeling, C., Papadopoulos, A., Contreras, M., Almar, R., Domínguez, J., and Synolakis, C.: Field Survey of the 27 February 2010 Chile Tsunami, Pure Appl. Geophys., 168, 1989–2010, 2011.
Fujii, Y. and Satake, K.: Slip Distribution and Seismic Moment of the 2010 and 1960 Chilean Earthquakes Inferred from Tsunami Waveforms and Coastal Geodetic Data, Pure Appl. Geophys., 170, 1493–1509, https://doi.org/10.1007/S00024-012-0524-2, 2012.
González-Riancho, P., Aliaga, B., Hettiarachchi, S., González, M., and Medina, R.: A contribution to the selection of tsunami human vulnerability indicators: conclusions from tsunami impacts in Sri and Japan (2011), Nat. Hazards Earth Syst. Sci., 15, 1493–1514, https://doi.org/10.5194/nhess-15-1493-2015, 2015.
González-Riancho, P., Aguirre-Ayerbe, I., Aniel-Quiroga, I., Abad, S., González, M., Larreynaga, J., Gavidia, F., Gutiérrez, O. Q., Álvarez-Gómez, J. A., and Medina, R.: Tsunami evacuation modelling as a tool for risk reduction: application to the coastal area of El Salvador, Nat. Hazards Earth Syst. Sci., 13, 3249–3270, https://doi.org/10.5194/nhess-13-3249-2013, 2013.
Goto, Y. and Nakasu, T.: Human vulnerability index for evaluating tsunami evacuation capability of communities, https://www.jstage.jst.go.jp/article/jaee/18/6/18_6_1/_article/-char/ja/ (last access: 31 August 2021), 2018.
Handy, S., Paterson, R. G., and Butler, K.: Planning for Street Connectivity: Getting from Here to There, American Planning Association, Chicago, ISBN 9781884829864, 2003.
Hillier, B.: Studying cities to learn about minds: some possible implications of space syntax for spatial cognition, Environ. Plan. B, 39, 12–32, 2009.
Hillier, B. and Iida, S.: Network effects and psychological effects: a theory of urban movement, in: 5th Int. Sp. Syntax Symp., Delft, 13–17 June 2005,https://doi.org/10.1007/11556114_30, 2005.
Imamura, F., Muhari, A., Mas, E., Pradono, M. H., Post, J., and Sugimoto, M.: Tsunami Disaster Mitigation by Integrating Comprehensive Countermeasures in Padang City, Indonesia, J. Disast. Res., 7, 48–64, 2012.
INE: Censo 2017, http://www.censo2017.cl/ (last access: 25 March 2021), 2018.
INE: Porcentaje de población expuesta a inundación por tsunami, https://insights.arcgis.com/#/embed/445a814f141a4b099a656a459bb7ce3d, last access: 8 September 2021.
IPCC: The concept of risk in the IPCC Sixth Assessment Report: a summary of cross – Working Group discussions, Geneva, Switzerland, https://www.ipcc.ch/site/assets/uploads/2021/02/Risk-guidance-FINAL_15Feb2021.pdf (last access: 30 June 2021), 2020.
James, G., Witten, D., Hastie, T., and Tibshirani, R.: An Introduction to Statistical Learning, Springer US, New York, NY, ISBN 9781461471370, 2013.
Kitamura, F., Inazu, D., Ikeya, T., and Okayasu, A.: An allocating method of tsunami evacuation routes and refuges for minimizing expected casualties, Int. J. Disast. Risk Reduct., 45, 101519, https://doi.org/10.1016/j.ijdrr.2020.101519, 2020.
Klein, E., Vigny, C., Fleitout, L., Grandin, R., Jolivet, R., Rivera, E., and Métois, M.: A comprehensive analysis of the Illapel 2015 Mw 8.3 earthquake from GPS and InSAR data, Earth Planet. Sc. Lett., 469, 123–133, 2017.
Koshimura, S. and Shuto, N.: Response to the 2011 Great East Japan Earthquake and Tsunami disaster, Philos. T. Roy. Soc. A, 373, 1–15, https://doi.org/10.1098/RSTA.2014.0373, 2015.
Koshimura, S., Oie, T., Yanagisawa, H., and Imamura, F.: Developing Fragility Functions for Tsunami Damage Estimation Using Numerical Model and Post-Tsunami Data from Banda Aceh, Indonesia, Coast. Eng. J., 51, 243–273, https://doi.org/10.1142/S0578563409002004, 2009.
Kubisch, S., Guth, J., Keller, S., Bull, M. T., Keller, L., and Braun, A. C.: The contribution of tsunami evacuation analysis to evacuation planning in Chile: Applying a multi-perspective research design, Int. J. Disast. Risk Reduct., 45, 101462, https://doi.org/10.1016/j.ijdrr.2019.101462, 2020.
Lagos, M. and Gutiérrez, D.: Simulación del tsunami de 1960 en un estuario del centro-sur de Chile, Rev. Geogr. Norte Gd., 33, 5–18, https://www.redalyc.org/pdf/300/30003301.pdf (last access: 8 September 2021), 2005.
Latcharote, P., Leelawat, N., Thamarux, P., and Imamura, F.: Estimation of fatality ratios and investigation of influential factors in the 2011 Great East Japan Tsunami, Int. J. Disast. Risk Reduct., 29, 37–54, https://doi.org/10.1016/J.IJDRR.2017.06.024, 2018.
Léon, J.: NHESS shared data, sharepoint [data set], https://usmcl-my.sharepoint.com/:f:/g/personal/, last access: 28 August 2022.
León, J., Mokrani, C., Catalán, P., Cienfuegos, R., and Femenías, C.: The Role of Built Environment's Physical Urban Form in Supporting Rapid Tsunami Evacuations: Using Computer-Based Models and Real-World Data as Examination Tools, Front. Built Environ., 4, 89, https://doi.org/10.3389/fbuil.2018.00089, 2019.
León, J., Castro, S., Mokrani, C., and Gubler, A.: Tsunami evacuation analysis in the urban built environment: a multi-scale perspective through two modeling approaches in Viña del Mar, Chile, Coast. Eng. J., 62, 389–404, https://doi.org/10.1080/21664250.2020.1738073, 2020.
León, J., Catalán, P. A., and Gubler, A.: Assessment of Top-Down Design of Tsunami Evacuation Strategies Based on Drill and Modelled Data, Front. Earth Sci., 9, 1, https://doi.org/10.3389/FEART.2021.744193, 2021a.
León, J., Vicuña, M., Ogueda, A., Guzmán, S., Gubler, A., and Mokrani, C.: From urban form analysis to metrics for enhancing tsunami evacuation: Lessons from twelve Chilean cities, Int. J. Disast. Risk Reduct., 58, 102215, https://doi.org/10.1016/j.ijdrr.2021.102215, 2021b.
Lomnitz, C.: Major earthquakes of Chile: a historical survey, 1535–1960, Seismol. Res. Lett., 75, 368–378, 2004.
Løvholt, F., Setiadi, N. J., Birkmann, J., Harbitz, C. B., Bach, C., Fernando, N., Kaiser, G., and Nadim, F.: Tsunami risk reduction – are we better prepared today than in 2004?, Int. J. Disast. Risk Reduct., 10, 127–142, https://doi.org/10.1016/j.ijdrr.2014.07.008, 2014.
Lundberg, S. M.: SHAP (SHapley Additive exPlanations), GitHub [code], https://github.com/slundberg/shap (last access: 11 January 2021), 2020.
Lundberg, S. M. and Lee, S.-I.: A Unified Approach to Interpreting Model Predictions, in: Advances in Neural Information Processing Systems 30, Long Beach, CA, 4765–4774, https://github.com/slundberg/shap (last access: 15 October 2020), 2017.
Makinoshima, F., Imamura, F., and Abe, Y.: Behavior from Tsunami Recorded in the Multimedia Sources at Kesennuma City in the 2011 Tohoku Tsunami and Its Simulation by Using the Evacuation Model with Pedestrian–Car Interaction, Coast. Eng. J., 58, 1–28, 2016.
Makinoshima, F., Imamura, F., and Abe, Y.: Enhancing a tsunami evacuation simulation for a multi-scenario analysis using parallel computing, Simul. Model. Pract. Theory, 83, 36–50, https://doi.org/10.1016/J.SIMPAT.2017.12.016, 2018.
Makinoshima, F., Imamura, F., and Oishi, Y.: Tsunami evacuation processes based on human behaviour in past earthquakes and tsunamis: A literature review, Prog. Disast. Sci., 7, 100113, https://doi.org/10.1016/J.PDISAS.2020.100113, 2020.
Makinoshima, F., Oishi, Y., Nakagawa, M., Sato, S., and Imamura, F.: Revealing complex tsunami evacuation process patterns induced by social interactions: A case study in Ishinomaki, Int. J. Disast. Risk Reduct., 58, 102182, https://doi.org/10.1016/J.IJDRR.2021.102182, 2021.
Marín Maureira, V. and Karimi, K.: The everyday and the post-disaster urban systems as one thing. A configurational approach to enchance the recovery and resilience of cities affected by tsunamis, in: Proceedings of the 11th Space Syntax Symposium, Lisbon, 3–7 July 2017, https://spacesyntax.com/wp-content/uploads/2017/09/The-everyday-and-the-post-disaster-urban-systems-as-one-thing.pdf (last access: 16 October 2020), 2017.
Mas, E., Suppasri, A., Imamura, F., and Koshimura, S.: Agent-based Simulation of the 2011 Great East Japan Earthquake/Tsunami Evacuation: An Integrated Model of Tsunami Inundation and Evacuation, J. Nat. Disast. Sci., 34, 41–57, 2012a.
Mas, E., Koshimura, S., Suppasri, A., Matsuoka, M., Matsuyama, M., Yoshii, T., Jimenez, C., Yamazaki, F., and Imamura, F.: Developing Tsunami fragility curves using remote sensing and survey data of the 2010 Chilean Tsunami in Dichato, Nat. Hazards Earth Syst. Sci., 12, 2689–2697, https://doi.org/10.5194/nhess-12-2689-2012, 2012b.
Mas, E., Koshimura, S., Imamura, F., Suppasri, A., Muhari, A., and Adriano, B.: Recent Advances in Agent-Based Tsunami Evacuation Simulations: Case Studies in Indonesia, Thailand, Japan and Peru, Pure Appl. Geophys., 172, 3409–3424, https://doi.org/10.1007/s00024-015-1105-y, 2015.
Mas, E., Paulik, R., Pakoksung, K., Adriano, B., Moya, L., Suppasri, A., Muhari, A., Khomarudin, R., Yokoya, N., Matsuoka, M., and Koshimura, S.: Characteristics of Tsunami Fragility Functions Developed Using Different Sources of Damage Data from the 2018 Sulawesi Earthquake and Tsunami, Pure Appl. Geophys., 177, 2437–2455, https://doi.org/10.1007/S00024-020-02501-4, 2020.
McKinney, W., Van den Bossche, J., Augspurger, T., Hoyer, S., Reback, J., and Cloud, P.: pandas [code], https://pandas.pydata.org/ (last access: 11 January 2021), 2020.
Medina, M., Riquelme, S., Fuentes, M., and Campos, J.: Tsunami Modeling in the South American Subduction Zone Inferred from Seismic Coupling and Historical Seismicity, Pure Appl. Geophys. 2021, 1–25, https://doi.org/10.1007/S00024-021-02808-W, 2021.
Mohareb, N. I.: Emergency evacuation model: accessibility as a starting point, Proc. Inst. Civ. Eng. Urban Des. Plan., 164, 215–224, 2011.
Mostafizi, A., Wang, H., Cox, D., Cramer, L. A., and Dong, S.: Agent-based tsunami evacuation modeling of unplanned network disruptions for evidence-driven resource allocation and retrofitting strategies, Nat. Hazards, 88, 1347–1372, https://doi.org/10.1007/s11069-017-2927-y, 2017.
Mostafizi, A., Wang, H., Cox, D., and Dong, S.: An agent-based vertical evacuation model for a near-field tsunami: Choice behavior, logical shelter locations, and life safety, Int. J. Disast. Risk Reduct., 34, 467–479, 2019.
Mosteller, F. and Tukey, J.: Data analysis, including statistics, in: Handbook of Social Psychology, edited by: Lindzey, G. and Aronson, E., Addison-Wesley Pub. Co., Reading, Massachusetts, ISBN 9780470137475, 1968.
Murakami, H., Takimoto, K., and Pomonis, A.: Tsunami Evacuation Process and Human Loss Distribution in the 2011 Great East Japan Earthquake – A Case Study of Natori City, Miyagi Prefecture, in: 15 WCEE, Lisbon, 24–28 September 2012, https://www.iitk.ac.in/nicee/wcee/article/WCEE2012_1587.pdf (last access: 29 November 2019), 2012.
Murray-Tuite, P. and Wolshon, B.: Evacuation transportation modeling: An overview of research, development, and practice, Transp. Res. Pt. C, 27, 25–45, https://doi.org/10.1016/J.TRC.2012.11.005, 2013.
Nateghi, R., Bricker, J. D., Guikema, S. D., and Bessho, A.: Statistical Analysis of the Effectiveness of Seawalls and Coastal Forests in Mitigating Tsunami Impacts in Iwate and Miyagi Prefectures, PLoS One, 11, e0158375, https://doi.org/10.1371/JOURNAL.PONE.0158375, 2016.
ONEMI: Recomendaciones para la preparación y respuesta ante tsunamis, ONEMI, Santiago, Chile, https://repositoriodigital.onemi.gov.cl/bitstream/handle/123456789/3354/tsunami_2020_Covid.pdf?sequence=35 (last access: 22 July 2021), 2014.
Papazachos, B., Scordilis, E., Panagiotopoulos, D., Papazachos, C., and Karakaisis, G.: Global Relations Between Seismic Fault Parameters And Moment Magnitude Of Earthquakes, Bull. Geol. Soc. Greece, 36, 1482–1489, https://doi.org/10.12681/bgsg.16538, 2004.
Perry, R. W., Lindell, M. K., and Greene, M. R.: Evacuation Planning in Emergency Management, Lexington Books, Lexington, Massachusetts, ISBN 9780669046502, 1981.
Porta, S., Crucitti, P., and Latora, V.: The Network Analysis of Urban Streets: A Primal Approach, Environ. Plan. B, 33, 705–725, https://doi.org/10.1068/b32045, 2006.
Priest, G. R., Stimely, L. L., Wood, N. J., Madin, I. P., and Watzig, R. J.: Beat-the-wave evacuation mapping for tsunami hazards in Seaside, Oregon, USA, Nat. Hazards, 80, 1031–1056, https://doi.org/10.1007/s11069-015-2011-4, 2016.
Sasabe, M., Fujii, K., and Kasahara, S.: Road network risk analysis considering people flow under ordinary and evacuation situations, Environ. Plan. B, 47, 759–774, https://doi.org/10.1177/2399808318802940, 2020.
SECTRA: Encuestas de Movilidad de Centros Urbanos, http://www.sectra.gob.cl/encuestas_movilidad/encuestas_movilidad.htm (last access: 26 July 2019), 2014.
SECTRA: Encuesta de Origen-Destino de Viajes Gran Valparaíso, Ministerio de Obras Públicas, Transportes y Telecomunicaciones, Santiago, Chile, http://www.sectra.gob.cl/encuestas_movilidad/encuestas_movilidad.htm (last access: 26 July 2019), 2016.
Sevtsuk, A., Mekonnen, M., and Kalvo, R.: Urban Network Analysis. Toolbox for ArcGIS 10/10.1/10.2, City Form Lab, Singapore University of Technology & Design in collaboration with MIT, Singapore, https://cityform.mit.edu/projects/urban-network-analysis.html (last access: 14 May 2021), 2013.
Sharifi, A.: Resilient urban forms: A review of literature on streets and street networks, Build. Environ., 147, 171–187, 2019.
SHOA: Proyecto CITSU, http://www.shoa.cl/index.htm (last access: 14 June 2021), 2012.
Shuto, N.: Tsunamis: Their Coastal Effects and Defense Works, in: Scientific Forum on the Tsunami, its Impact and Recovery, edited by: Tingsanchali, T., Asian Institute of Technology, Bangkok, Thailand, 1–12, https://www.worldscientific.com/doi/abs/10.1142/9789814449434_0003 (last access: 12 May 2021), 2005.
Sugimoto, T., Murakami, H., Kozuki, Y., and Nishikawa, K.: A Human Damage Prediction Method for Tsunami Disasters Incorporating Evacuation Activities, Nat. Hazards, 29, 585–600, 2003.
Suppasri, A., Mas, E., Charvet, I., Gunasekera, R., Imai, K., Fukutani, Y., Abe, Y., and Imamura, F.: Building damage characteristics based on surveyed data and fragility curves of the 2011 Great East Japan tsunami, Nat. Hazards, 66, 319–341, 2012a.
Suppasri, A., Shuto, N., Imamura, F., Koshimura, S., Mas, E., and Yalciner, A. C.: Lessons learned from the 2011 Great East Japan tsunami: Performance of tsunami countermeasures, coastal buildings, and tsunami evacuation in Japan, Pure Appl. Geophys., 170, 993–1018, 2012b.
Suppasri, A., Shuto, N., Imamura, F., Koshimura, S., Mas, E., and Yalciner, A. C.: Lessons Learned from the 2011 Great East Japan Tsunami: Performance of Tsunami Countermeasures, Coastal Buildings, and Tsunami Evacuation in Japan, Pure Appl. Geophys., 170, 993–1018, https://doi.org/10.1007/s00024-012-0511-7, 2013.
Suppasri, A., Hasegawa, N., Makinoshima, F., Imamura, F., Latcharote, P., and Day, S.: An Analysis of Fatality Ratios and the Factors That Affected Human Fatalities in the 2011 Great East Japan Tsunami, Front. Built Environ., 2, 32, https://doi.org/10.3389/fbuil.2016.00032, 2016.
Takabatake, T., Nistor, I., and St-Germain, P.: Tsunami evacuation simulation for the District of Tofino, Vancouver Island, Canada, Int. J. Disast. Risk Reduct., 48, 101573, https://doi.org/10.1016/J.IJDRR.2020.101573, 2020.
Tarbotton, C., Dall'osso, F., Dominey-Howes, D., and Goff, J.: The use of empirical vulnerability functions to assess the response of buildings to tsunami impact: Comparative review and summary of best practice, Earth-Sci. Rev., 142, 120–134, 2015.
Taubenböck, H., Goseberg, N., Setiadi, N., Lämmel, G., Moder, F., Oczipka, M., Klüpfel, H., Wahl, R., Schlurmann, T., Strunz, G., Birkmann, J., Nagel, K., Siegert, F., Lehmann, F., Dech, S., Gress, A., and Klein, R.: “Last-Mile” preparation for a potential disaster – Interdisciplinary approach towards tsunami early warning and an evacuation information system for the coastal city of Padang, Indonesia, Nat. Hazards Earth Syst. Sci., 9, 1509–1528, https://doi.org/10.5194/nhess-9-1509-2009, 2009.
Ting, Y., Khew, J., Jarzebski, P., Dyah, F., Carlos, R. S., Gu, J., Esteban, M., Aránguiz, R., and Akiyama, T.: Assessment of social perception on the contribution of hard-infrastructure for tsunami mitigation to coastal community resilience after the 2010 tsunami: Greater Concepcion area, Chile, Int. J. Disast. Risk Reduct., 13, 324–333, https://doi.org/10.1016/j.ijdrr.2015.07.013, 2015.
Tobler, W.: Three presentations on geographical analysis and modeling: Non-isotropic geographic modeling; Speculations on the geometry of geography; and Global spatial analysis, National Center For Geographic Information And Analysis, Santa Barbara, CA, https://escholarship.org/uc/item/05r820mz (last access: 10 September 2021), 1993.
Tomita, T., Honda, K., and Kakinuma, T.: Application of storm surge and tsunami simulator in ocean and coastal areas (STOC) to tsunami analysis, in: Wind and Seismic Effects: Proceedings of the Joint Panel Conference of the US-Japan Cooperative Program in Natural Resources, US Department of Commerce, National Bureau of Standards, 38, p. 109, https://www.pwri.go.jp/eng/ujnr/joint/38/paper/38-41tomita.pdf (last access: 9 March 2018), 2006.
Tsimopoulou, V., Jonkman, S. N., Kolen, B., Maaskant, B., Mori, N., and Yasuda, T.: A multi-layered safety perspective on the tsunami disaster in Tohoku, Japan, in: FLOODrisk 2012: The 2nd European Conference on FLOODrisk Management, Rotterdam, the Netherlands, 20–22 November 2012, https://edepot.wur.nl/347024 (last access: 3 March 2021), 2012.
Tumini, I., Villagra-Islas, P., Herrmann-Lunecke, G., and Cl, G. H.: Evaluating reconstruction effects on urban resilience: a comparison between two Chilean tsunami-prone cities, Nat. Hazards, 85, 1363–1392, https://doi.org/10.1007/s11069-016-2630-4, 2017.
Turner, A.: From Axial to Road-Centre Lines: A New Representation for Space Syntax and a New Model of Route Choice for Transport Network Analysis, Environ. Plan. B, 34, 539–555, https://doi.org/10.1068/b32067, 2007.
UNDRR: Terminology, https://www.undrr.org/terminology, last access: 6 January 2022.
Villagra, P. and Quintana, C.: Disaster Governance for Community Resilience in Coastal Towns: Chilean Case Studies, Int. J. Environ. Res. Publ. Health, 14, 1063, https://doi.org/10.3390/IJERPH14091063, 2017.
Villagra, P., Rojas, C., Ohno, R., Xue, M., and Gómez, K.: A GIS-base exploration of the relationships between open space systems and urban form for the adaptive capacity of cities after an earthquake: The cases of two Chilean cities, Appl. Geogr., 48, 64–78, https://doi.org/10.1016/j.apgeog.2014.01.010, 2014.
Wang, H., Mostafizi, A., Cramer, L. A., Cox, D., and Park, H.: An agent-based model of a multimodal near-field tsunami evacuation: Decision-making and life safety, Transp. Res. Pt. C, 64, 86–100, https://doi.org/10.1016/J.TRC.2015.11.010, 2016.
Wang, Z. and Jia, G.: A novel agent-based model for tsunami evacuation simulation and risk assessment, Nat. Hazards, 105, 2045–2071, https://doi.org/10.1007/S11069-020-04389-8, 2020.
Wang, Z. and Jia, G.: A novel agent-based model for tsunami evacuation simulation and risk assessment, Nat. Hazards, 105, 2045–2071, https://doi.org/10.1007/s11069-020-04389-8, 2021.
WHO: Tsunamis, https://www.who.int/health-topics/tsunamis#tab=tab_1, last access: 12 August 2021.
Wood, N., Jones, J., Schelling, J., and Schmidtlein, M.: Tsunami vertical-evacuation planning in the US Pacific Northwest as a geospatial, multi-criteria decision problem, Int. J. Disast. Risk Reduct., 9, 68–83, 2014.
Wood, N., Jones, J. M., Yamazaki, Y., Kwok-Fai, C., Brown, J., Jones, J. L., and Abdollahian, N.: Population vulnerability to tsunami hazards informed by previous and projected disasters: a case study of American Samoa, Nat. Hazards, 95, 505–528, https://doi.org/10.1007/s11069-018-3493-7, 2018.
Wood, N., Peters, J., Wilson, R., Sherba, J., and Henry, K.: Variations in community evacuation potential related to average return periods in probabilistic tsunami hazard analysis, Int. J. Disast. Risk Reduct., 50, 101871, https://doi.org/10.1016/j.ijdrr.2020.101871, 2020.
Yavuz, C., Kentel, E., and Aral, M. M.: Tsunami risk assessment: economic, environmental and social dimensions, Nat. Hazards, 104, 1413–1442, https://doi.org/10.1007/S11069-020-04226-Y, 2020.
Yun, N.-Y. and Hamada, M.: Evacuation Behavior and Fatality Rate during the 2011 Tohoku-Oki Earthquake and Tsunami, Earthq. Spectra, 31, 1237–1265, https://doi.org/10.1193/082013EQS234M, 2015.
Zamora, N., Catalán, P. A., Gubler, A., and Carvajal, M.: Microzoning Tsunami Hazard by Combining Flow Depths and Arrival Times, Front. Earth Sci., 8, 747, https://doi.org/10.3389/feart.2020.591514, 2021.