the Creative Commons Attribution 4.0 License.
the Creative Commons Attribution 4.0 License.
 | 02 Aug 2022
Effectiveness of Sentinel-1 and Sentinel-2 for flood detection assessment in Europe
Angelica Tarpanelli
Alessandro C. Mondini
Stefania Camici
Inundation is one of the major natural hazards in Europe. The evaluation of the flood hazard and risk is not straightforward mainly due to the monitoring system that is poor or not uniformly distributed in the territory. The ESA Earth Observation Program, including a series of satellites, Sentinels, for the operative observation of the natural phenomenon, e.g. the inundations, can potentially reduce the gap. Sentinel-1 (SAR: synthetic aperture radar) and Sentinel-2 (optical) have been demonstrated to be suitable for mapping flooded areas, but despite the medium–high spatial and temporal resolution of the sensors, the mapping of inundated territories is often partial or missing. The objective of this study is to evaluate through a synthetic study the effectiveness of Sentinel-1 and Sentinel-2 in the systematic assessment of floods in Europe, where the flood events have durations ranging from some hours to a few days. To reach the target, we analysed 10 years of river discharge data over almost 2000 sites in Europe, and we extracted flood events over some established thresholds as proxies of riverine inundations. Based on the revisit time of the satellite constellations and cloud coverage, we derived the percentage of potential inundation events that Sentinel-1 and Sentinel-2 could be able to observe. Results show that assuming the configuration of a constellation of two satellites for each mission and considering the ascending and descending orbit, on average 58 % of flood events are potentially observable by Sentinel-1 and only 28 % by Sentinel-2 due to the cloud coverage.
- Article
(3746 KB) - Full-text XML
-
Supplement
(13291 KB) - BibTeX
- EndNote


According to the European Directive 2007/60/EC (Directive 2007/60/EC), “flood” is defined as “the temporary covering by water of land not normally covered by water” (art. 2.1), and it includes “floods from rivers, mountain torrents, Mediterranean ephemeral water courses, and floods from the sea in coastal areas, and may exclude floods from sewerage systems” (art. 2.1). Floods are one of the most common and costly natural hazards (IFRC, 2020). Catastrophic floods endanger lives and cause human tragedy, as well as heavy economic losses. According to the data elaborated by the International Disaster Database (EM-DAT, 2019; Luo et al., 2015) from 1980 and 2021 (July), in Europe 614 flood events led to more than 4000 fatalities, affected 12 million people and caused USD 141 billion in total damage. After the dramatic floods occurred in 2002, the European administrative authorities agreed to draw up guidelines for flood prediction, prevention and mitigation described in the well-known Directive 2007/60/EC (2007) on the assessment and management of flood risk. The main target of the directive is to reduce the adverse consequences on human health, the environment, cultural heritage and economic activity associated with floods. For this purpose, it is required for each member state to develop three kinds of products: (i) a preliminary flood risk assessment, in order to evaluate the level of flood risk in each river basin and select areas that are particularly critical to flood risk, (ii) flood hazard and risk maps under specific scenarios of inundation, and (iii) flood risk management plans.
For the evaluation of flood hazard, vulnerabilities and risk, the maps of historical flood events are of paramount importance because they represent the benchmark for calibrating the parameters of the hydrodynamic models (Moramarco et al., 2014; Massari et al., 2015; Schumann et al., 2011) that provide precious information on the evolution of flood in the floodplain and the environment around. Furthermore, rapid mapping of new events is fundamental for early warning activities and then mitigating the impact on society. The knowledge of the flood delineation helps stakeholder in the decision-making process and in territory planning and supports the local authorities in the activities aimed to protect lives and properties.
Flood inundation modelling including empirical, hydrodynamic and simple conceptual models can provide a valuable tool for delineating the flooded area, and many examples can be found in the literature (see Teng et al., 2017; Mudashiru et al., 2021; for a review). Often the modelling is carried out before the flood event occurs in order to collect inundation scenarios and identify the edge of the potential flooded areas.
Useful support to flood monitoring, modelling and mapping is offered by satellite sensors launched for Earth observation (Di Baldassarre et al., 2009; Domeneghetti et al., 2019). Indeed, remotely sensed data can contribute to monitor emergency situations, supporting the development of an efficient early warning system, the acts of evacuations and the impact of future flooding. From the medium to high resolutions, optical sensors (e.g. MODIS, MERIS, Landsat, SPOT, IKONOS, GeoEye, WorldView) have produced imageries used for monitoring inundation events before, during and after the crisis (Sakamoto et al., 2007; Ogilvie et al., 2015). During the rainfall events, however, due to the incapability of the optical sensors to penetrate clouds, the delineation of the boundaries of flooded areas is hampered in near-real time. They can be useful in the next phase of the flood extension and damage assessment (Uddin et al., 2019; Caballero et al., 2019).
Alternatively, the active microwaves of a synthetic aperture radar (SAR) sensor penetrate clouds and provide day and night images. The comparison between images pre- and post-event is used to map inundated floodplains (Uddin et al., 2019; Anusha and Bharathi, 2019) or inundation levels (Cohen et al., 2018).
The availability of these two instruments, optical and SAR, in the satellite platform assures a global coverage and, in some of the cases, a cost-free source of data.
On these bases, the ESA Sentinels constitute the first series of operational satellites responding to European operational and policy needs of the Global Monitoring for Environment and Security (GMES) programme. They are planned to provide global coverage of environmental parameters with high spatial and temporal resolutions (Berger et al., 2012; Aschbacher and Milagro-Pérez, 2012). Among the satellite constellations developed for natural resource management and climate and environmental research, Sentinel-1 and Sentinel-2 are the most suitable for mapping flooded areas (Malenovský et al., 2012).
Starting from the availability of satellite sensors, the European Copernicus programme provides the civil protection services of the member states with the Emergency Management Service, a rapid mapping service for the production of damage assessment maps caused by natural or man-made disasters. The service offers a 24 h and 7 d contact point for receiving activation requests, previously authorised by the European Commission through the Emergency Response and Coordination Centre (ERCC) at DG ECHO (Directorate-General for European Civil Protection and Humanitarian Aid Operations) and takes care of the whole service chain up to the delivery of the finished map products through a public portal (http://emergency.copernicus.eu, last access: 28 July 2022). The Copernicus Emergency Management Service has two components: (i) mapping (rapid mapping and risk and recovery mapping), to provide digital and vector formats information based on satellite imagery for geospatial analysis to support decision-making by emergency managers; and (ii) an early warning system, through the European Flood Awareness System (EFAS), to strengthen the preparedness of national and local authorities and to support preparatory measures before major flood events strike. In 2021, a new operational, near-real-time global flood monitoring (GFM) was integrated into GloFAS (Global Flood Awareness System). The new GFM analyses all the incoming Sentinel-1 images through three independent state-of-the-art satellite flood mapping algorithms (HASARD, ALGORITHM2 and ALGORITHM3) and provides a timely and high-quality product based on the ensemble flood mapping.
Since the launch of Sentinel-1A in 2014, a series of flood events have been mapped in Europe thanks to Sentinel-1 and Sentinel-2 imageries. Examples from the Copernicus Emergency Management Service affect all the European countries, from the past (11 January 2016 in Northern Ireland) to the more recent flood events (13–16 July 2021 in Germany, Belgium, Switzerland, the Netherlands). Although the potential of Sentinel missions has been highlighted and well described in the literature (Cao et al., 2019; Plank, 2014), and despite the use at operational level showing an effective functionality, still many flood events are not mapped due to the spatial and temporal limits of the satellite measurements. In fact, the spatial and temporal resolutions, although improved with respect to the past missions, can be not sufficient to map the maximum extension of the flood event when the evolution of a flood event covers a time span from some hours to a few days.
On this context, the objective of this study is to evaluate the effectiveness of a systematic use of Sentinel-1 and Sentinel-2 in the detection of floods in Europe through a frequency analysis of the actual passages of the satellites over the rivers.
To reach the target, we collected and analysed 10 years of river discharge data over almost 2000 sites in Europe, and we extracted the flood events from each discharge hydrograph through the use of specific thresholds of river discharge as proxies of riverine inundations. Based on the revisit time of Sentinel-1 (S1) and Sentinel-2 (S2) over Europe, we synthetically derived the percentage of inundation events that are potentially observable. The reliability of the results was tested through a real case analysis over three stations where the river discharges were available during the working period of Sentinel-1 and Sentinel-2.
This section contains a brief description of the satellite data from optical and SAR sensors, the observed time series of river discharge for Europe, and the main procedure adopted for the analysis.
2.1 Sentinel-1 SAR imagery and its current use in flood detection and mapping
The Sentinel-1 mission is a C-band synthetic aperture radar (SAR) constellation of two polar-orbiting satellites. Sentinel-1 comprises a C-band SAR sensor at 10 m spatial resolution to provide a high revisit time (6 d in constellation mode) and all-weather day-and-night supply of imagery (Torres et al., 2012). Sentinel-1 ensures the continuity of C-band SAR data, building on ESA's and Canada's heritage SAR systems on ERS-1, ERS-2, Envisat and RADARSAT, providing wide swath coverage and frequent revisit in dual polarisation. Being an active microwave sensor, SAR penetrates clouds and provides images in both day and night. Smooth water surface, which reflects the radar radiation away from the sensor, shows low backscatter values. The weak return signal is represented by dark tonality on radar images. Under windy conditions and/or the presence of vegetation, the water surface gets rough and the backscatter increases, reducing the contrast between flooded and non-flooded areas. In this situation the detection of flooded areas is more difficult.
The high revisit time of the satellite is sufficient to detect flood inundations of a duration longer than 1 week but often fails for flash floods. The revisit time of the satellite is 12 d for one satellite, but if we consider the constellation of two satellites (A and B) and the ascending/descending orbits, the revisit time at the European latitude increases to 2–3 d. However, Sentinel-1B, launched in April 2016, malfunctioned in December 2021 due to power issue, with consequent loss of data transmission.
The capability to estimate inundation events from Sentinel-1 is already demonstrated by several studies (Landuyt et al., 2019; Notti et al., 2018; Huang et al., 2018), as well as in Europe (Amitrano et al., 2018; Bioresita et al., 2018; Twele et al., 2016). An image during or after the event is used to map the inundated floodplains. The comparison with a pre-event imagery (change detection approach) allows information on the permanent water to be obtained (Clement et al., 2018; Uddin et al., 2019; Anusha and Bharathi, 2019; Tarpanelli et al., 2013). When detecting changes in SAR images, the customary way of comparing a pair of multitemporal images is the application of the log-ratio operator (Bazi et al., 2005; Carincotte et al., 2006; Martinez and Le Toan, 2007; Celik, 2010; Takeuchi, et al., 1999), which is defined as the logarithm of the ratio of the backscattered signals. Methods for the classification of flooded areas in the measures of changes are based on region growing (Schumann et al., 2011), statistical active contour model (Mason et al., 2007), composite image (Long and Trong, 2001), grey level dependence method (Seiler et al., 2009), fuzzy C-means (Amici et al., 2004) and supervised classification (Townsend, 2002).
The flooded areas are also classified applying the largely used method of histogram (or radiometric) threshold (Yonghua et al., 2007; Matgen et al., 2007; Martinis et al., 2009; Mason et al., 2012; Giustarini et al., 2013; Hostache et al., 2009; Tarpanelli et al., 2013) that allows for the “flood” and “non-flood” pixels to be discriminated by means of a representative backscattering coefficient threshold value. Oberstadler et al. (1997) introduced the visual interpretation approach, stating that it is able to provide more accurate results than an automatic procedure, and many studies were based on that (Matgen et al., 2007; Tarpanelli et al., 2013). However, such methods, although robust and reliable, have mostly been developed for a few images and demonstrated only at local level. With the proliferation of spatial data (Schumann and Domeneghetti, 2016) there is a great emphasis on globally scalable algorithms powered by artificial intelligence and machine learning and big data analytics. In such a prospective, a rigorous validation at global scale of satellite products is fundamental and strongly recommended (Schumann, 2019).
2.2 Sentinel-2 optical imagery and its current use in flood detection and mapping
Sentinel-2 routinely delivers high-resolution optical images globally, providing enhanced continuity of Satellite Pour l'Observation de la Terre (SPOT)- and Landsat-type data. Sentinel-2 carries an optical payload with visible, near-infrared (NIR) and shortwave-infrared (SWIR) sensors comprising 13 spectral bands at 10, 20 and 60 m spatial resolution with a swath width of 290 km. Being an optical sensor, Sentinel-2 can observe floods only during the daytime and in good weather condition because the solar light cannot penetrate the clouds in the visible range (Drusch et al., 2012). Under these conditions, the number of chances to detect the maximum extent of a flood event is reduced because the cloud coverage adds to the satellite's revisit time.
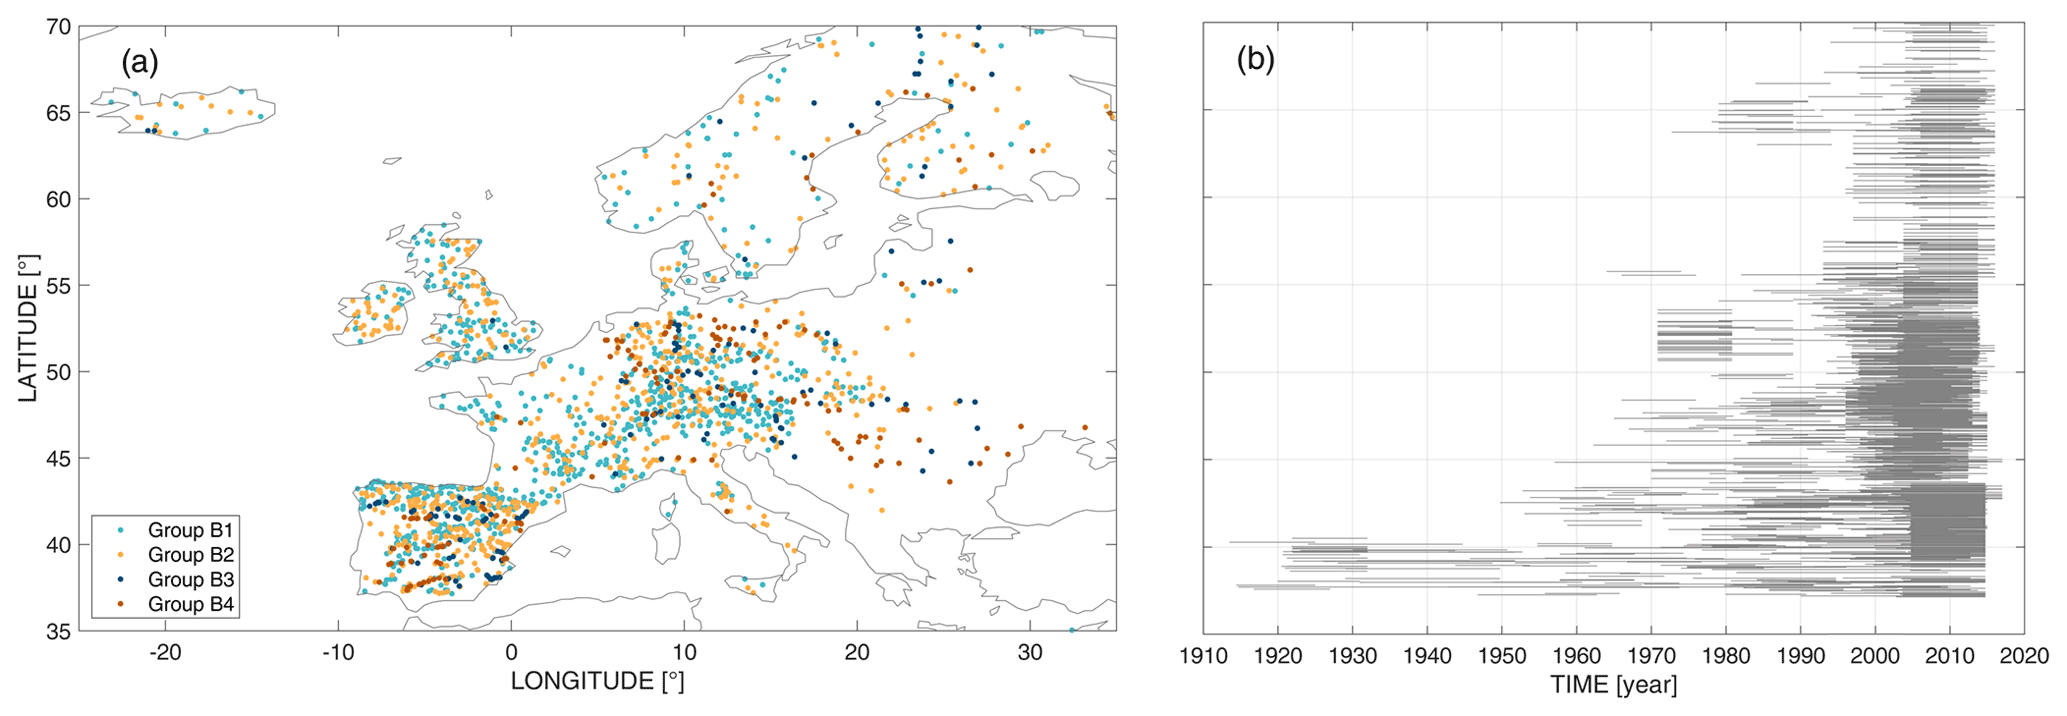
Figure 1(a) Location of the selected gauge stations where the river discharge is recorded (based on the Global Runoff Data Centre and the Italian and Spanish basin authority datasets) and (b) operating period for each ground station from 1913 to 2016 listed based on the latitude.
For optical data, water areas are generally detected by using the near-infrared (NIR) band because in the NIR band, the reflectance of water surface is in general much lower than the reflectance given by other land cover types. However, optical images can be easily affected by atmospheric conditions, surface reflection of sunlight and water turbidity, making difficult to set a common threshold value for flood detection. To mitigate the problem, band algebra is used, e.g. Normalized Difference Vegetation Index (NDVI) and/or Normalized Difference Water Index (NDWI), computed from combinations of visible, NIR and shortwave-infrared (SWIR) bands (Takeuchi et al., 1999; Townsend and Walsh, 1998; Seiler et al., 2009; Sakamoto et al., 2007). Commonly, the flooded area detection is derived by thresholding such indexes. Alternatively, numerous other techniques such as intensity hue and saturation (IHS; Yonghua et al., 2007; Goffi et al., 2020), principal component analysis (PCA; Gianinetto et al., 2006), support vector machine (SVM) and C-mean clustering (Longbotham et al., 2012) are employed to detect flooded areas from the optical imagery.
2.3 In situ data of river discharge
We used river discharge time series recorded in the GRDC dataset (The Global Runoff Data Centre, 56068 Koblenz, Germany) joint with Italian and Spanish basin authority datasets collecting data from 1913 to 2016 (see Fig. 1a) for a total of 1957 in situ gauge stations across Europe. The series of river discharge are in general discontinuous in time due to problems in maintenance, impact of big floods or deinstallation of the instrument (Hanna et al., 2011; Crochemore et al., 2020). Our series are shown in Fig. 1b, where the grey lines represent the period of continuous data for each station, listed based on the latitude. We selected data from each station having a period of at least 10 years of continuous daily data, a time period similar to the expected lifetime of the Sentinel mission (6 to 12 years; Drusch et al., 2012).
The selected time span of the ground data is variable inside the working period of the hydrometric gauges and does not necessarily co-exist with the Sentinel missions' lifetime. We selected those stations located in basins with area (Ab) greater than 100 km2 and maximum observed discharge greater than 10 m3 s−1. Indeed, smaller river discharges would generate flood events that are short in time and of negligible peak values, which are difficult to map at the Sentinels' spatial resolution. The stations are grouped in four classes (Meybeck et al., 2006): B1 (Ab < 500 km2), B2 (500 < Ab < 5000 km2), B3 (5000 < Ab < 15 000 km2) and B4 (Ab > 15 000 km2), where Ab is the area of the basin in which the station was/is installed. The division is useful to analyse whether satellites are able to detect floods in small basins like over larger basins. Figure 2 shows the distribution of the sites in terms of basin area and the maximum and median values of river discharge. Respectively, the total number of sites in each group is 887 (B1), 746 (B2), 149 (B3) and 175 (B4). Only 17 % of the sites has a basin area larger than 5000 km2 with maximum discharge reaching 56 200 m3 s−1 (Pechora River at Oksino, Russia).

Figure 2Histograms of the basin area (km2) (top panels), maximum river discharge (m3 s−1) (middle panels) and median discharge (m3 s−1) (bottom panels) of the ground European dataset. The 1957 stations are divided in four groups based on the basin area: Ab: B1 (Ab < 500 km2), B2 (500 < Ab < 5000 km2), B3 (5000 < Ab < 15 000 km2) and B4 (Ab > 15 000 km2).
2.4 Working framework
In this work, we assume that it is always possible to map inundated areas from satellite images as shown by several examples in the literature (Notti et al., 2018; Giordan et al., 2018; Musa et al., 2015; Schumann and Moller, 2015) and the operative Copernicus Emergency Management Service. However, we are aware that this is a strong assumption (see Sect. 3.3 “Discussion” for details), and it can be acceptable for a synthetic study in favour of the usability of the systematic exploitation of the constellation. Therefore, the analysis concentrates on the chances that the satellite will intercept a flood.
In our analysis, we focused on floods caused by heavy and intense rains that provoked overflow of swollen water courses from their usual bed or basin. Overflow is strictly dependent on the volume of water coming from upstream, the lateral inflow, the capacity of the river cross section and the roughness condition of the river. Specifically, a volume of water flowing into a channel causes flooding when the cross section is not sufficient to contain it during the flow. Assuming that the cross-sections in the period of analysis remain unchanged (hence, no significant sediment loads affect the shape of the cross-section), we monitor the magnitude and the duration of the flood event through the analysis of the river discharge times series, or hydrographs. Figure 3a shows the hydrograph of the Loire River at the Mont Jean gauge station (belonging to B4 group with 110 000 km2). Floods events tend to occur in correspondence to some extreme values of the hydrograph and stagnate for periods of some hours to several days depending on the conditions and the settings of the area. This temporal window can be suitable for the detection using satellite imagery when their frequency of acquisition is adequate.

Figure 3Example of event selection by ground-observed daily discharge (a) and assuming satellite revisit times of 3 d (b), 6 d (c) and 12 d (d) for the Loire River at Mont Jean gauge site.
We assume here that a flood can occur when the river discharge overcomes a specific threshold. To identify the threshold for the river discharge, we assume that in 10 years flooding occurs for very high river discharge and that these high discharges are determined by setting thresholds equal to or higher than the 95th percentile on the sample. For multi-peak event, if the peaks occur within 4 consecutive days, we consider it as a unique flood event. In the example in Fig. 3a the selected river discharges cover the period from 1970 to 1980, and during these 10 years, the 95th percentile is overpassed 16 times, meaning that for these 16 times the river flooded the floodplain around. To identify a reliable threshold, we created four scenarios using thresholds at 95th, 97th, 99th and 99.5th percentiles calculated in the same period of 10 years selected for the analysis and variable for each station.
Table 1Configurations used in the study for different revisit times based on the combinations of satellites.
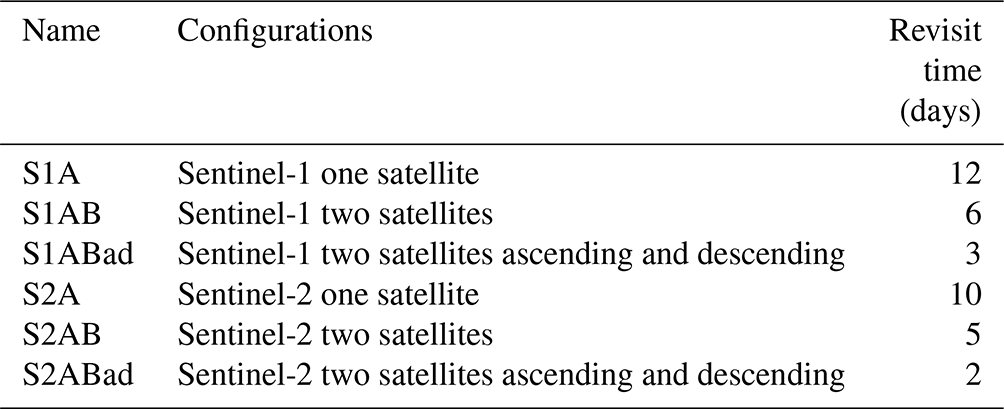
To mimic the temporal sampling of Sentinel satellite observation, we assumed six different configurations based on the number of satellites in orbit: 12 d if only one satellite, Sentinel-1, is in orbit, 6 d for two satellites, A and B, and 3 d if ascending and descending orbits are considered. For Sentinel-2, assuming the same configurations as before, we considered 10, 5 and 2 d (see Table 1). The simulation of the flood events captured by satellite observation was carried out by sampling the daily observed river discharge during the overpasses of the satellites according to the six configurations. From the river discharge time series sampled at the satellite temporal sampling, we counted how many times the different configurations could have sampled the river discharge series in flooding situations (see Fig. 3b–d). The comparison between the number of synthetic satellite events and the actual ground-observed flood events provides the degree of reliability of the satellites to catch the inundation areas in Europe. We used the ratio between the number of events detected by Sentinel and the total number of events observed on the ground as performance index, F. In doing so, the time of peak flow is considered to coincide with the time of peak flood. In reality, the two moments are shifted by a lag time that varies with the properties of the basin and channel. We can reasonably accept this approximation considering that the phenomenon is not immediate but that the maximum flood generally occurs sometime after the peak flow and still remains for a few hours (even days). The satellite may pass over the river during this time and be able to capture the flooded area. In this case, instead of associating the inundation with a probably lower river discharge, we prefer to associate it with the event that causes it.
Along with the index F that defines the effectiveness of Sentinels to sample floods, the duration of the event helps us to understand its magnitude and its compatibility with the observation from space. Specifically, the duration of an event is determined according to the following steps: (1) select a flood event by calculating a local maximum in the temporal series, (2) separate the hydrograph between baseflow and event flow, (3) calculate the magnitude (height) of the event by the distance between the minimum discharge event flow (step 2) and the peak value, and (4) the duration is calculated as the width corresponding to half the height. This approach is preferable with respect to considering the entire base width of the flood event because it does not take into account the baseflow of the hydrograph. Indeed, if we integrate the baseflow in the evaluation of a flood event, the results can be biased from a large number of low values. Considering the width at half height we are more confident that the event can produce a flood inundation.
Whereas Sentinel-1 is able to observe the Earth in all weather conditions, Sentinel-2 cannot penetrate clouds, and because the floods are usually caused by heavy and intense rainfall, the possibility to catch the high value of river discharge decreases. To take into account this phenomenon, we introduced in the analysis the cloud coverage concept. Specifically, we referred to the cloud dataset by Wilson and Jetz (2016, https://www.earthenv.org/cloud, last access: 28 July 2022). The dataset provides the average monthly and annual percentage of clouds all over the world at 1 km resolution. We extracted the values for each station and plotted the results in Fig. 4. As expected, higher latitudes show high mean percentage of clouds, but Scandinavian countries and Iceland are less affected on average by clouds with respect to Great Britain and Germany.
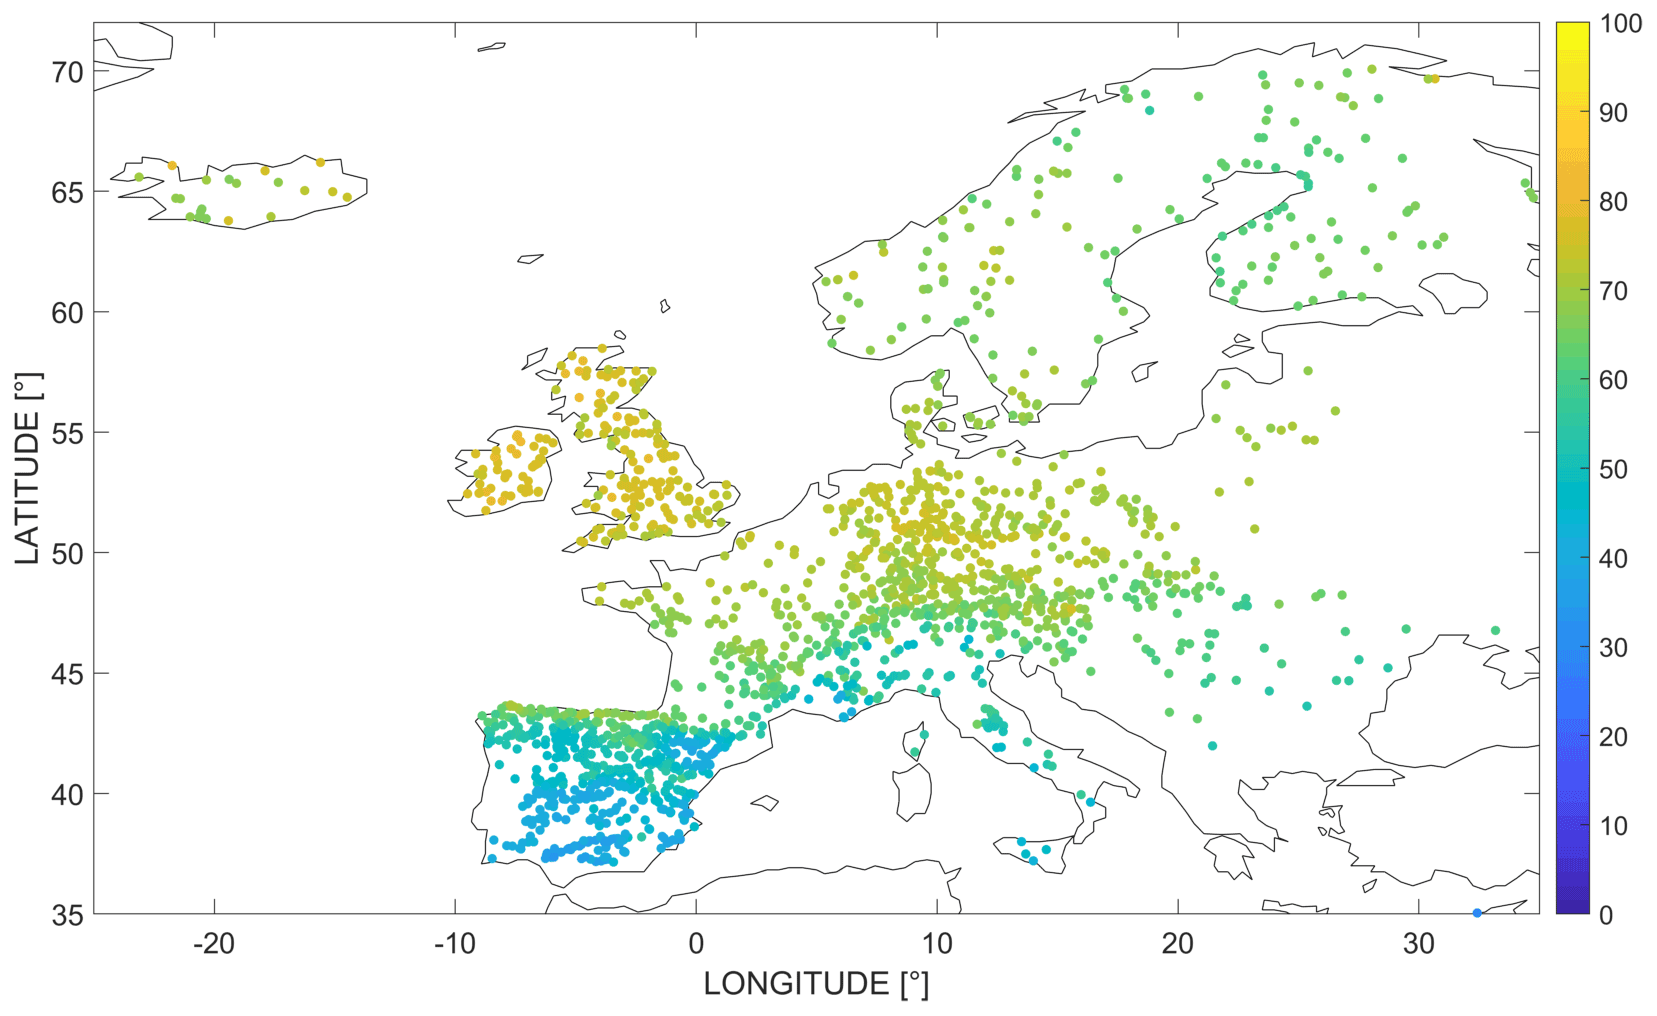
Figure 4Annual percentage of clouds for the 1957 selected stations according the cloud dataset by Wilson and Jetz (2016).
In order to simulate the rate of events that the optical sensor can detect, we multiplied the number of events potentially extracted by Sentinel-2 times the average annual percentage of cloud-free probability (calculated as 1-probability of clouds).
Here, the results of the synthetic analysis are described both in terms of index F and of duration of flood events. The same analysis is shown for the three case studies in the actual conditions to demonstrate the consistency and the robustness of the synthetic analysis. After, a paragraph of discussion lists some considerations along with the limits of the procedure.
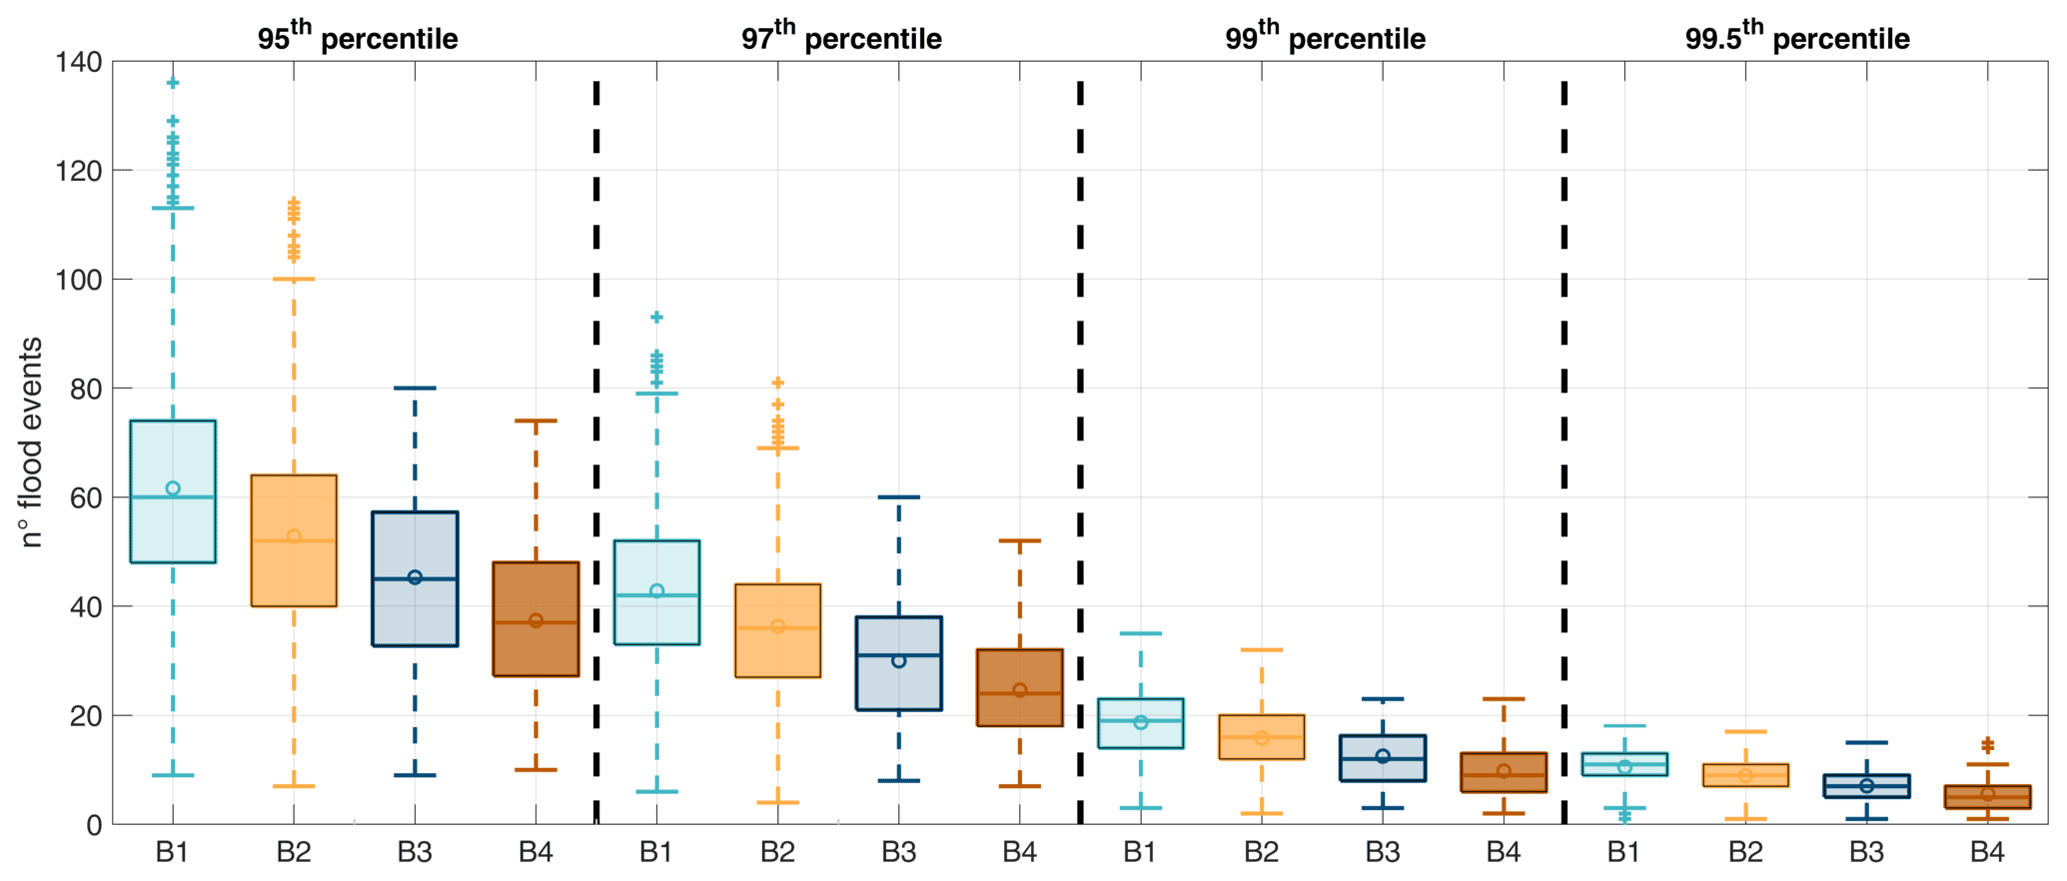
Figure 5Box plot of the number of flood events extracted by selecting four different thresholds (95th, 97th, 99th, 99.5th percentile) over the four different groups of basins (B1–B4).
3.1 Synthetic cases
Based on the selected dataset, Fig. 5 shows the box plot of the number of flood events extracted from the original observed time series based on the different thresholds for the four groups. The thresholds at the 95th and 97th percentiles include the higher number of events that can be interpreted as unrealistic values: in fact, an average of 60 flood events extracted over the 95th percentile for the B1 group is equivalent to 6 flood events per year on average, which is not credible with respect to the numbers published by the International Disaster Database (EM-DAT, 2019; as described in the “Introduction”). The two thresholds at the 99th and 99.5th percentiles seem more reliable and plausible for an extraction of flood events that cause inundations, with values ranging on average from 20 to 10 and from 12 to 6 floods, respectively, in a period of 10 years.
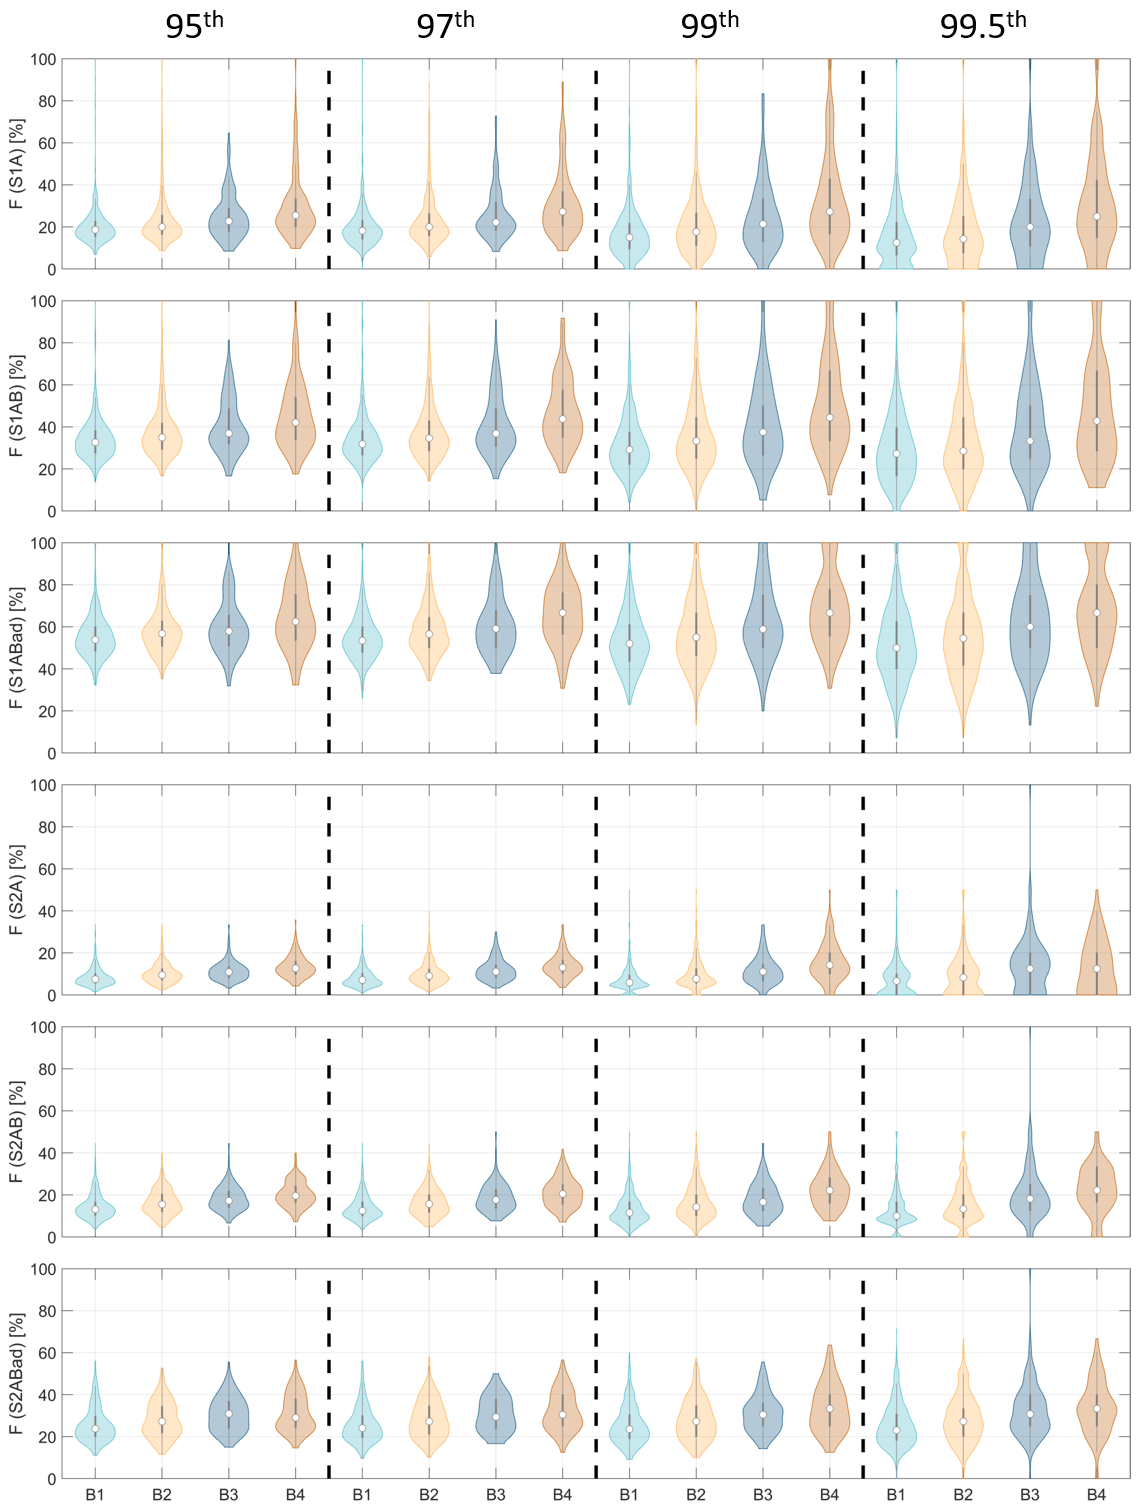
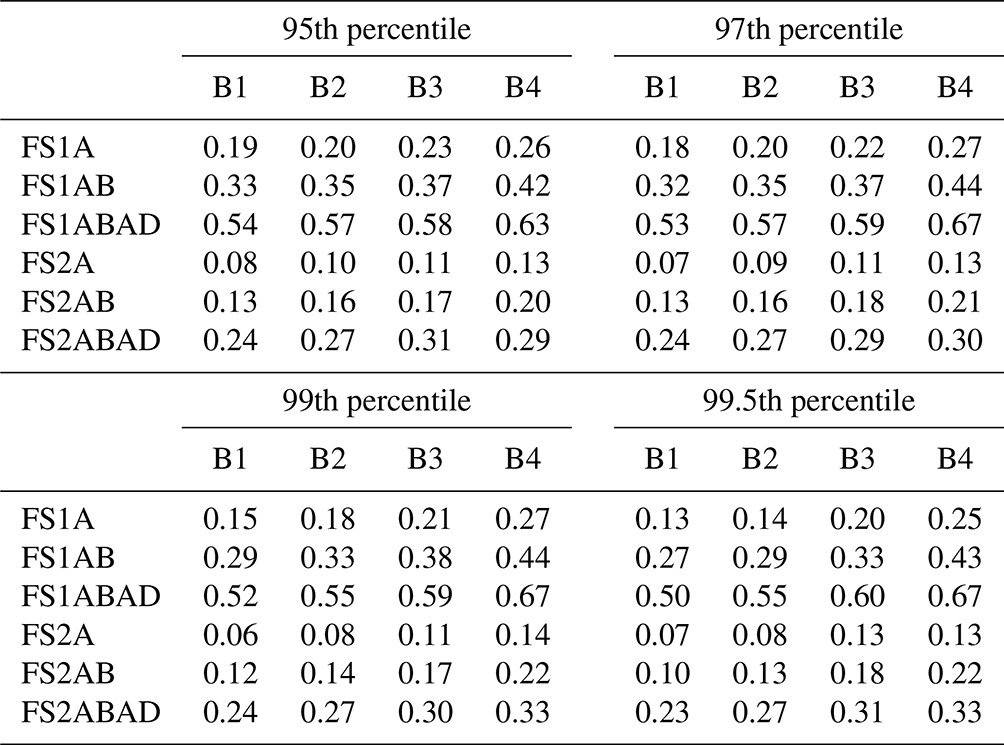
Figure 6Violin plots of the percentage of events detected by satellite observations with respect to the total events observed at ground sites. The six scenarios are explained on Table 1.
Figure 6 shows the range of variability in the performance index F for each configuration and for each group of basins above the four different thresholds. With respect to the number of flood events observed by ground stations, no satellite configurations reach similar performance (F=100). As expected, an increased number of satellites provide an increased number of detected events: configurations S1A and S2A have low observed events, and S1ABad and S2ABad are able to observe a greater number of flood events, whereas S1AB and S2AB are in the middle. Notwithstanding the revisit times of Sentinel-1 being greater than those of Sentinel-2, the number of events potentially detected by the optical satellite is lower due to the average annual cloud coverage that affects the observations. As a result, all the configurations of Sentinel-2 intercept a reduced number of events with respect to those observed with Sentinel-1. On average, satellites are more suitable to observe floods over large basins. Median values of F for B4 are always greater than those of the other groups. Table 2 reports median values of the boxplots along with the median values of the analysis considering all the discharge dataset. The results for the entire dataset (all the groups together) show that at the threshold of the 99th percentile on average only 20 % of the flood events can be detected by the one satellite of Sentinel-1 (18 % if the threshold is the 99.5th percentile), and this percentage increases to 58 % if two satellites are in orbit and if we consider the ascending and the descending orbits (configuration S1Abad for both the 99th and 99.5th thresholds). However, this result is affected by the large number of basins owing to the group B1 and B2 with respect to the others of the groups B3 and B4. Indeed, if we look at the large basins higher percentages are obtained: the configuration S1ABad is able to detect from 58 % to 60 % of the basins for B3 and from 63 % to 67 % for B4, based on the different thresholds. For Sentinel-2 the performances are slightly low because of the presence of clouds. Only 9 % of the events with the 99th percentile threshold (10 % with the 99.5th threshold) can be observed by one satellite (S2A), whereas the best configuration (S2ABad) provides a coverage of 29 % of the basins. The same conclusions of Sentinel-1 can be drawn for the different sizes of the basins for Sentinel-2: over large basins a greater number of flood events can be observed. In any case, in the configuration with more observations, 33 % of the flood events can be observed, and this is considerably lower than the one of Sentinel-1 (67 %).
Table 2F median value for the satellite configurations and for the four groups of sites (values are in terms of percentage, %).
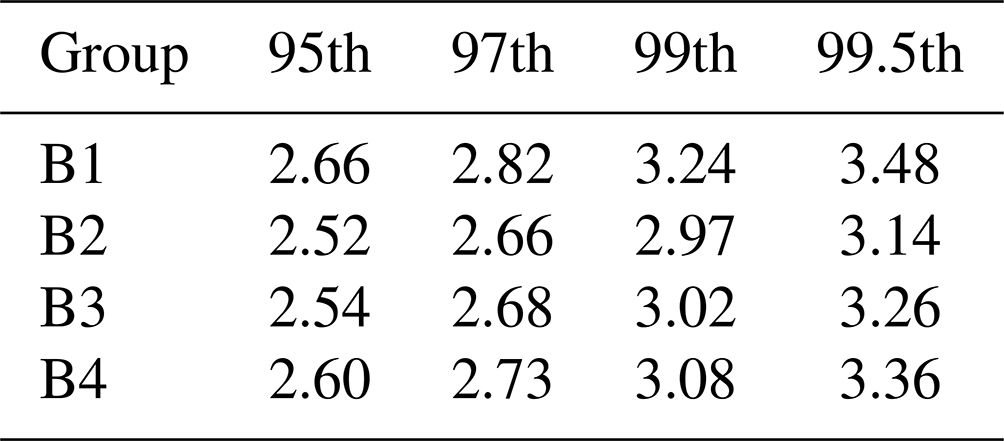
The different performances in the groups of basins is due to the duration of flood events. Plots in Fig. 7 show the median values of the duration of the selected flood events extracted above the threshold at the 99.5th percentile for every group.
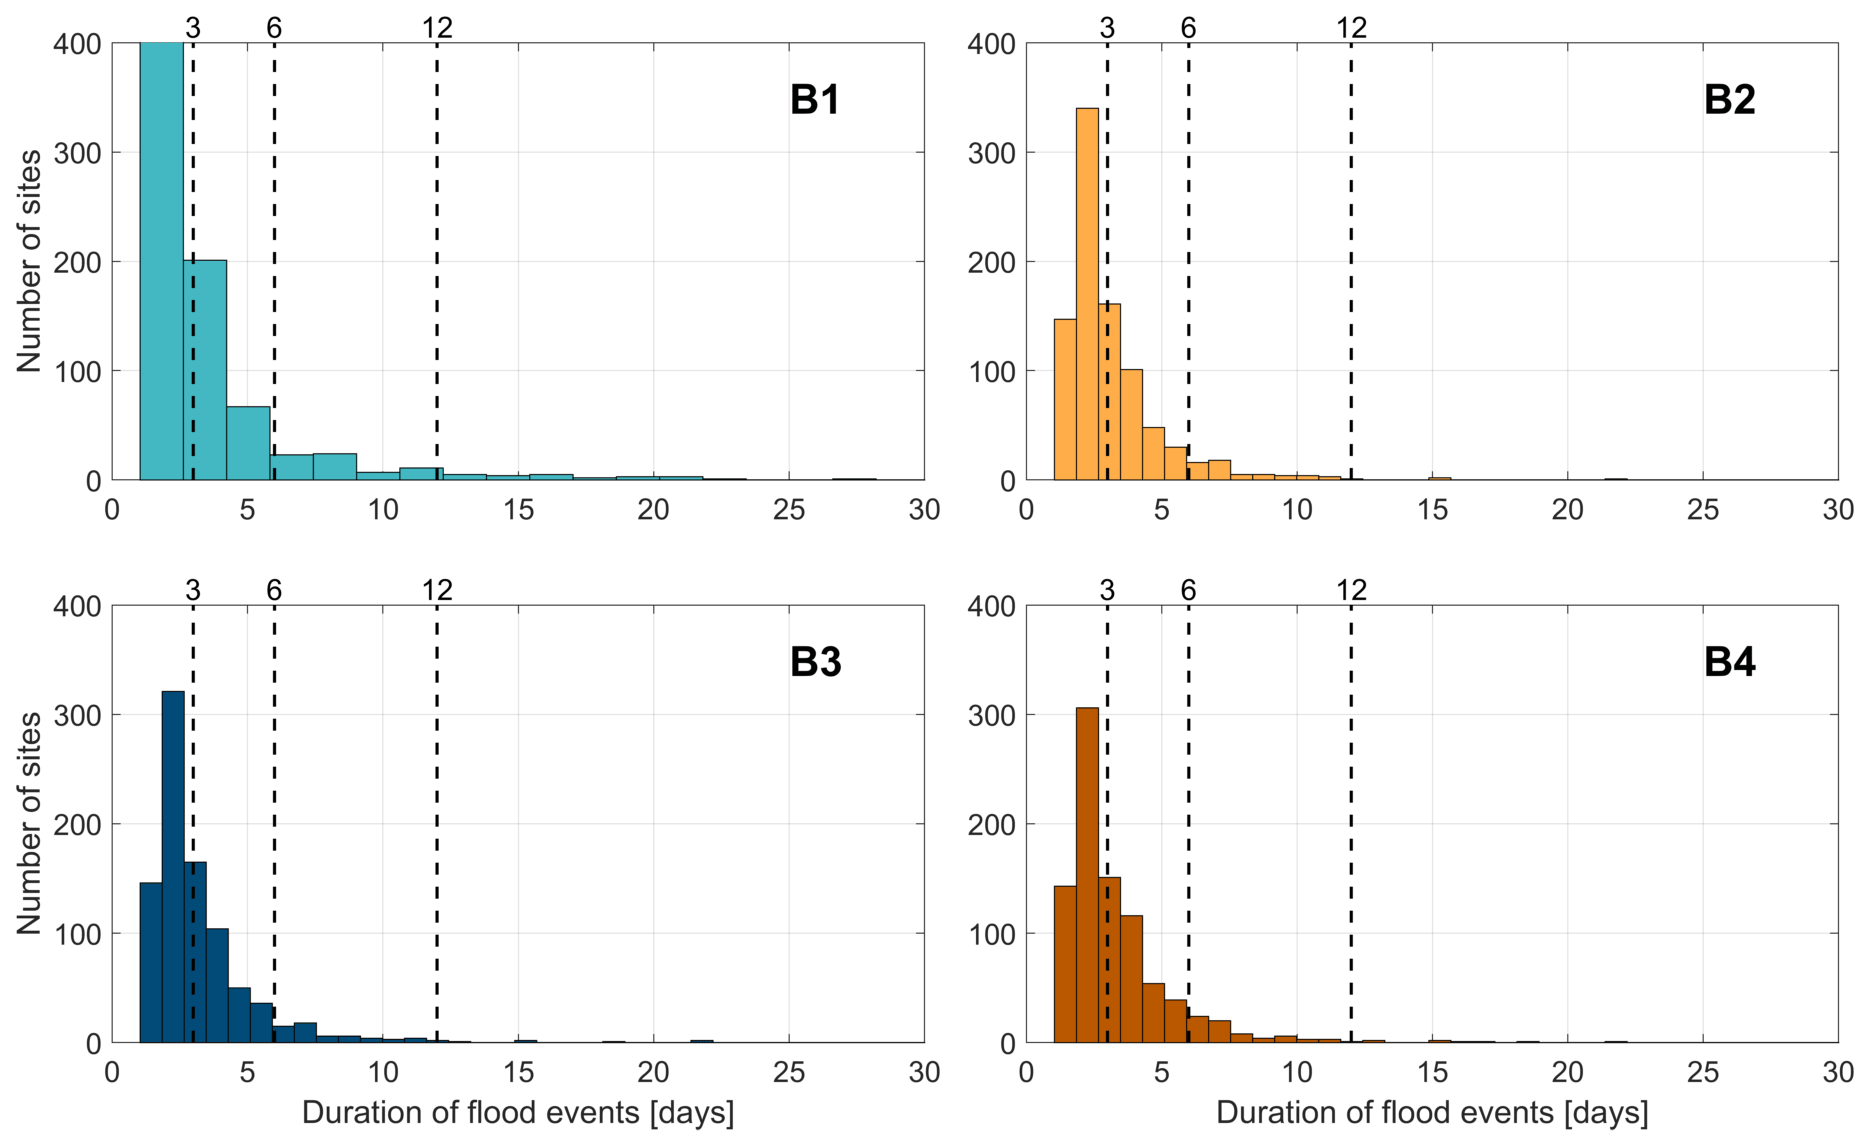
Figure 7Median values of duration of the flood events extracted by a threshold of the 99.5th percentile for each group of basins (B1–B4). The dashed lines represent the revisit time related to the three configurations of Sentinel-1: 3, 6 and 12 d.
In general, the duration of a flood event is below 3 d (see the averaged distribution of durations in Table 3 for all the thresholds) for the groups of basins, and in particular the 50th percentile of the events has a durations greater than the revisit time related to the configuration S1ABad; therefore the possibility to observe flood events from this satellite becomes significant. Around 25 % of the events have durations greater than 6 d and around 5 % greater than 12 d. For the smaller thresholds (95th, 97th, 99th percentiles) results show that a lower number of events can be observed with the constellation of satellites and a few events with a single satellite.
Table 3Average duration in days of a flood event belonging to the different groups and extracted above the different thresholds.
3.2 Real cases
We tested the effectiveness of our framework in three study areas (two in B2 and one in B4) where important flood events occurred in the recent period:
-
Zaragoza station (latitude: 41.5950, longitude: −0.7702) along the Ebro River in Spain in February–March 2015 (https://emergency.copernicus.eu/mapping/list-of-components/EMSR120, last access: 28 July 2022),
-
Skelton station (latitude: 42.7919, longitude: −1.7886) along the Ouse River in England during the December 2015 flood event occurring close to the city of York (https://emergency.copernicus.eu/mapping/list-of-components/EMSR150, last access: 28 July 2022),
-
Moncalieri station (latitude: 42.7919, longitude: −1.7886) along the Po River in Italy during the event of November–December 2016 (https://emergency.copernicus.eu/mapping/list-of-components/EMSR192, last access: 28 July 2022).
We selected the dates of Sentinel-1 and Sentinel-2 image acquisition in Google Earth Engine cloud computing platform (Gorelick et al., 2017) according to the availability of ground-based observations. For the three study areas, Fig. 8 shows the river discharges observed at the gauge stations of Zaragoza (Fig. 8a), Skelton (Fig. 8b) and Moncalieri (Fig. 8c) along with the acquisition dates of the available images from Sentinel-1 and Sentinel-2. Flood events mapped by the Copernicus Emergency Service are identified with the yellow background, while thresholds at the 95th, 97th, 99th and 99.5th percentiles are shown with dashed horizontal lines, and they are calculated with respect to a period of 10 years selected for each single site.
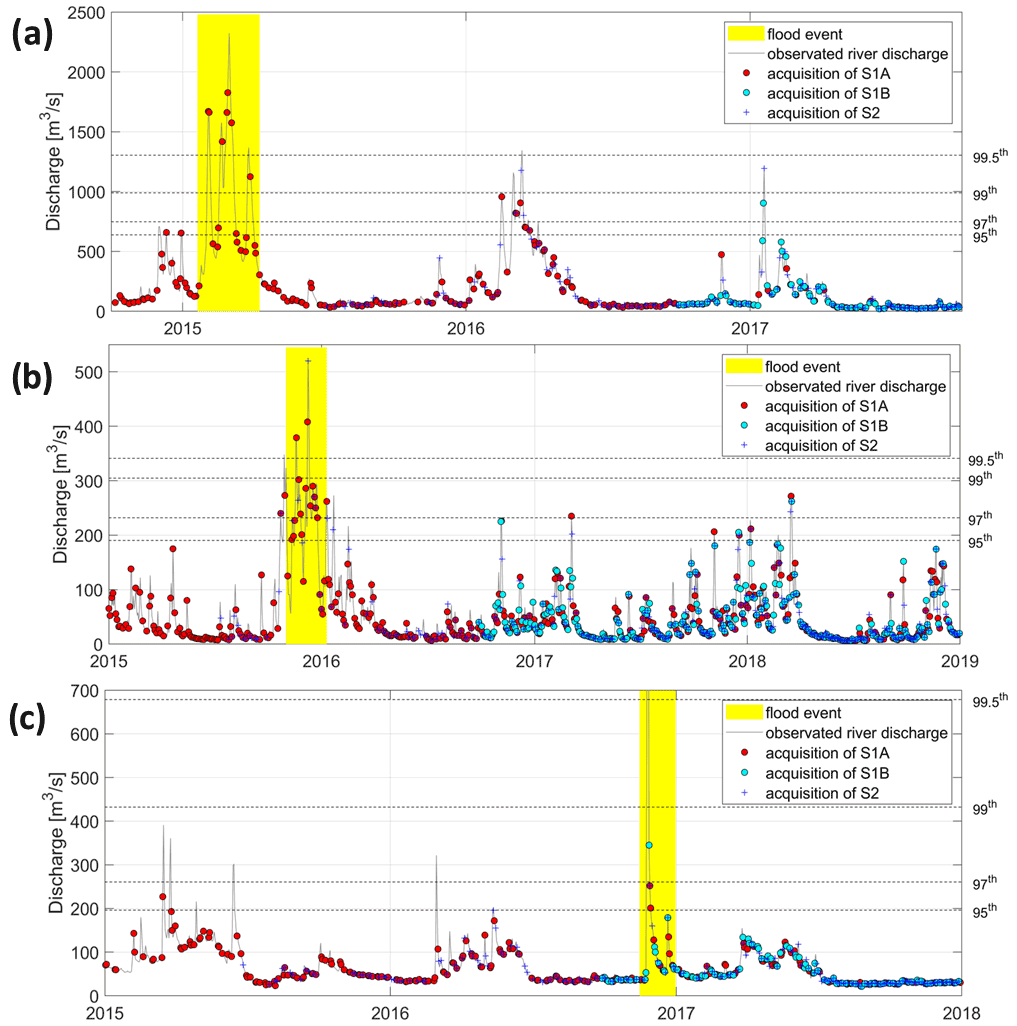
Figure 8River discharges observed at the gauge stations of Zaragoza (a), Skelton (b) and Moncalieri (c) along with the acquisition dates of the available images from Sentinel-1 (circles) and Sentinel-2 (plus). The period of flood event selected by Copernicus Emergency Service is identified with the yellow background, while dashed horizontal lines identify the thresholds at the 95th, 97th, 99th and 99.5th percentiles.
For the case of Zaragoza, the hydrograph at the gauge station from the period 2015–2017 shows three big multi-peak flood events, all extracted at the 95th percentile threshold (to be noted that for this station all the thresholds were calculated in the period 2004–2013). These high values of river discharge occurring in 2016 and 2017 provoked some ephemeral inundations in some meanders, but they did not affect the city and the settlements around. The flood event occurring in February–March 2015 is the only one extracted above the 99.5th threshold of that provoking a significant inundation, with flooded areas upstream and downstream of the city of Zaragoza. The event was well monitored by several images acquired by Sentinel-1A (the video in the Supplement shows the evolution of the flood event from January to April 2015). The first moderate inundation occurred at the beginning of February 2015 and was perfectly observed by Sentinel-1A with two acquisitions on 3 and 4 February (see Fig. 9a). After, a double peak flood occurred with substantial flooding until the beginning of March and was observed by Sentinel-1A on 5 March. From some days later, the water started to recede, leaving the ground saturated (compare Fig. 9b and e), which favoured further flooding in the event at the end of March despite the fact that the flow values were not very high (compare Fig. 9f with Fig. 9a and c).
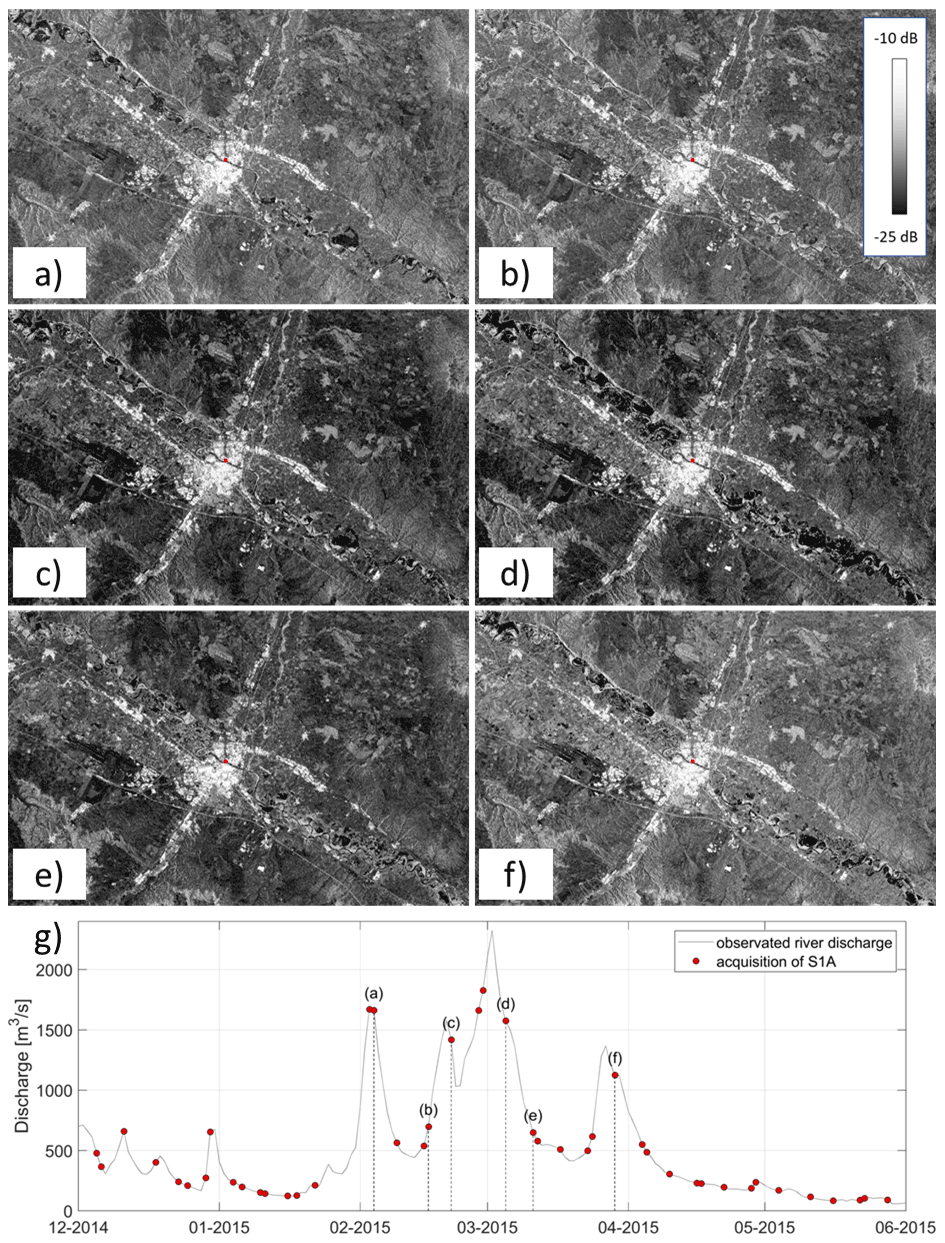
Figure 9Flood event occurring in the period February–March 2015 at Zaragoza (g). The letters in the hydrograph (a–f) correspond to the SAR images on the top (© Google Earth Engine).
The basin at Zaragoza station belongs to the B4 group with a basin area around 40 000 km2. F index calculated for the 3-year period is consistent with the violin plot of Fig. 6 for all the four thresholds. In particular, around 32 % of flood events were correctly identified by Sentinel-1A, whereas a lower value of 10 % of floods was observed by Sentinel-2 (specifically, a single image of 19 January 2017 is cloud-free).
The basin at Skelton station belongs to the group B2 (basin area around 1756 km2). F index calculated for Sentinel-1A is equal to 32 %, 33 %, 40 % and 50 % for the thresholds at the 95th, 97th, 99th and 99.5th percentiles (calculated for the period October 2003–September 2013), quite in line with the synthetic analysis. Again, for Sentinel-2 the values are in the range 16 %–25 % even if focusing on the December 2015 flood event, and any peaks are observed in cloud-free images. Only a cloud-free image was acquired for 29 December 2015, showing large inundation over the city of York. The flood event discharge was lower than the threshold at the 95th percentile, but the flood event being very large, the inundation lasted a long time before receding.
Moncalieri station is not included in the dataset of the synthetic discharges selected in the analysis. The station is located along the upper part of the Po River with a basin area of 4965 km2. For this station, the four thresholds of percentiles were calculated for a period of 10 years from January 2010 to December 2019. Focusing on the period of 3 years of data, the flood events are few, and only the high values of discharge in November–December 2016 led to inundation over the city of Moncalieri. For this event, a couple of images acquired days later with the peak value of 1823 m3 s−1 were available. The inundation was visible only with SAR images, the Sentinel-2 images being full of clouds.
3.3 Discussion
The above simulation can provide useful hints on the effectiveness of the use of Sentinel-1 and Sentinel-2 for systematic flood mapping. The real cases supported some assumptions in the analysis. Despite the procedure seeming reliable for a good evaluation of the effectiveness of Sentinels in the observation of flood events, we need to focus on several aspects to underline advantages and limitations.
First, the thresholds to extract flood peaks from river discharge (ranging from the 95th percentile to the 99.5th percentile) over a period of 10 years are arbitrary. This number of peaks above the thresholds can vary significantly when analysing the data over a different period of time. Generally, the thresholds at the 95th and 97th percentiles extract an improbable number of flood events (on average ranging from 62 and 25), whereas for the other two thresholds, 99th and 99.5th, the number of flood events are under 20, meaning on average a couple of events per year (see Fig. 5). This can be considered a good trade-off between the number of events and the possibility of inundation caused by the same events.
Second, during the period of 10 years, it is not necessarily that each peak corresponds to a flood. On one hand, the increase in discharge can be perfectly contained within the embankments without generating any floodplain inundation. On the other hand, ordinary flood events can produce flooded areas if bridges are obstructed or if levees are broken. These cases are difficult to predict and/or simulate. In addition, it is desirable that in places where the measuring instrument is present, which typically coincides with the most critical areas (urban areas, confluences, etc.), protective measures have been put in place to prevent flooding. However, recent events in Europe have shown that extreme events are abundantly higher than they were a few years ago and that the protection measures taken previously are no longer sufficient to protect against flooding. In any case, the real cases shown in the study seem to support the simplified procedure here proposed with a series of inundations caused by the biggest floods occurred in the 3-year period from 2015 to 2018.
Third, often the flooded areas can be observed from satellite for most of the duration of the recession limb of the hydrograph because terrain hit by the inundation remains wet for a long period. In this case, the stagnation time of the water in the surrounding terrain may vary depending on several aspects: the type of soil, the topography (if the ground is flat or sloping may be different) and the volume of water that overflowed. The case of Moncalieri station is a demonstration of the fact that after a flood event, even if the discharge is relatively low, it is still possible to observe inundations (in this case observable from Sentinel-2).
Four, we multiplied the number of events extracted by Sentinel-2 by the average annual value representing the percentage of clouds for each site. Generally, a flood event caused by rainfall is accompanied by cloud cover, and if we consider an average annual value, we probably overestimate the number of flood events that are possible to observe by satellite. In fact, clouds are concentrated during flood events rather than for low flows, and this exacerbates the difficulties of mapping the inundation with an optical sensor. However, the advantage is that in many cases the water remains in the flooded areas for a while, favouring mapping even several days later: unfortunately, in those cases the mapping of the maximum extent of the flood is compromised.
The analysis here presented cannot take into account all these factors endogenous. It is rather a rough assessment of the potential of Sentinels for the evaluation of hydraulic risk in Europe. However, the three cases illustrated in Sect. 3.2 demonstrate that the analysis is plausible and the Sentinels are able to catch 30 % and 10 % of the flood events.
Fifth, the initial assumption that it is always possible to map inundated areas from satellite images is an optimistic and unrealistic hypothesis for several reasons (Schumann, 2021): (i) the presence of frequent, persistent and large-scale cloud cover is the most severe aspect to consider for optical sensors especially in the case of flash floods; (ii) the vegetation is still an arduous problem for both optical satellite sensors (DeVries et al., 2017) and SAR because of the side-looking nature and the diffusivity and volume scattering caused by vegetation (Schumann and Moller, 2015); (iii) the urban areas present important challenges above all for SAR due to the inadequate spatial resolution of the sensor and man-made features, which cause a lot of signal distortion (Chini et al., 2012; Giustarini et al., 2013); (iv) the quality of the images, especially of the rapid mapping products can be very poor (Brill et al., 2021). Therefore, the percentages extracted from this analysis can be seen as an optimistic view of potentially observable flood events but which should be translated into reality in much lower percentage values if we are to address the challenges mentioned above and demand sufficient quality.
As a tool to manage the emergency response after a flood inundation event, flood mapping helps us to assess the extent of the affected areas on a large scale. It is the base not only for the coordinating recovery activities but also for preventative measures of mitigation in the case of upcoming events. In the last 20 years, a common practice is to map inundation events through the Earth-observing satellites, especially with synthetic aperture radar, SAR, or optical sensors. The Copernicus Emergency Management Service, EMS, provides information for emergency response to a wide range of natural or man-made disasters. Among them, the service covers floods. Indeed, one of the purposes of the Sentinel missions, particularly Sentinel-1 and Sentinel-2, is to contribute to the Copernicus EMS and, more in general, to support disaster relief efforts thanks to the short revisit time and the rapid acquisition and delivery of the images.
To evaluate the effective capability of Sentinel-1 and Sentinel-2 to map floods in Europe, this paper carried out a synthetic analysis measuring how many flood events the satellites can observe in their lifetime. To reach this target, we analysed the daily river discharges that have been observed at 1957 gauge sites along more than 1300 rivers. We extracted the flood events for every site defining four thresholds of the 95th, 97th, 99th and 99.5th percentiles of each time series. Successively, considering different configurations of revisit time for each satellite and assuming that each time the satellite overpasses the river, it is able to acquire an image correctly, we estimated the percentage of potentially observable flood events by Sentinel-1 and Sentinel-2.
From the analysis, the following conclusions can be drawn.
-
On average, Sentinel-1 with a revisit time of 12 d is able to observe 20 % of flood events with a single satellite, whereas Sentinel-2, with 10 d of revisit time, is able to observe only 10 % with a single sensor. However, we need to point out that for Sentinel-2 this percentage can also be overestimated because the clouds are generally intense during flood events.
-
More satellites increase the chances of observing a flood event. If two satellite constellations are orbiting and both ascending and descending orbits are considered, the percentages of flood events potentially being observed increase up to 58 % for Sentinel-1 and 28 % for Sentinel-2.
-
The ability of satellites to observe a flood event in a site changes depending on the size of the catchment area subtended by the section. In the configuration of more orbiting satellites and the higher threshold (99.5th percentile), Sentinel-1 is able to detect 50 % of flood events at sites with basin areas smaller than 500 km2 and 67 % of flood events at sites with basin areas greater than 15 000 km2. In the similar configuration, the percentages of flood events observable by Sentinel-2 vary from 23 % for the smaller basins to 33 % for the bigger basins.
-
The advantage of having stagnant water in the floodplain areas after the flood peak makes it is possible to observe the extent of the flooding even after several days. However, when analysing the average duration time of a flood event, in most cases this value is around 2.5–3.5. Therefore, if the satellite orbit were programmed to have an average revisit time of 2 d, almost all events could be mapped.
All the codes and the input data are available on Zenodo: https://doi.org/10.5281/zenodo.6939820 (Tarpanelli, 2022).
The river discharge data are available from the Global Runoff Data Centre (https://www.bafg.de/GRDC/EN/01_GRDC/grdc_node.html; GRDC, 2022). The Sentinel-1 and Sentinel-2 data from the real cases were taken from the Google Earth Engine platform (https://earthengine.google.com/; Google Earth Engine, 2022), whereas the information about the flood events are provided by the Emergency Response and Coordination Centre (ERCC) at DG ECHO, (https://emergency.copernicus.eu/; Copernicus, 2022).
The video is available in the Supplement. The supplement related to this article is available online at: https://doi.org/10.5194/nhess-22-2473-2022-supplement.
ACM designed the experiments. AT developed the model code and performed the simulations. SC provided the in situ data of river discharge and contributed to the model code. AT prepared the manuscript with contributions from all co-authors.
The contact author has declared that none of the authors has any competing interests.
Publisher's note: Copernicus Publications remains neutral with regard to jurisdictional claims in published maps and institutional affiliations.
This research has been supported by the European Space Agency (grant no. ESRIN/1-7831/14/I-NB).
This paper was edited by Kai Schröter and reviewed by two anonymous referees.
Amici, G., Dell'Acqua, F., Gamba, P., and Pulina, G.: A comparison of fuzzy and neuro-fuzzy data fusion for flooded area mapping using SAR images, Int. J. Remote Sens., 25, 4425–4430, https://doi.org/10.1080/01431160412331269634, 2004.
Amitrano, D., Di Martino, G., Iodice, A., Riccio, D., and Ruello, G.: Unsupervised Rapid Flood Mapping Using Sentinel-1 GRD SAR Images, IEEE T. Geosci. Remote, 56, 3290–3299, https://doi.org/10.1109/tgrs.2018.2797536, 2018.
Anusha, N. and Bharathi, B.: Flood detection and flood mapping using multi-temporal synthetic aperture radar and optical data Egypt, J. Remote Sens. Space Sci., 23, 207–219, https://doi.org/10.1016/j.ejrs.2019.01.001, 2019.
Aschbacher, J. and Milagro-Pérez, M. P.: The European Earth monitoring (GMES) programme: Status and perspectives, Remote Sens. Environ., 20, 3–8, https://doi.org/10.1016/j.rse.2011.08.028, 2012.
Bazi, Y., Bruzzone, L., and Melgani, F.: An Unsupervised Approach Based on the Generalized Gaussian Model to Automatic Change Detection in Multitemporal SAR Images, IEEE T. Geosci. Remote, 43, 874–887, https://doi.org/10.1109/TGRS.2004.842441, 2005.
Berger, M., Moreno, J., Johannessen, J. A., Levelt, P. F., and Hanssen, R. F.: ESA's sentinel missions in support of Earth system science, Remote Sens. Environ., 20, 84–90, https://doi.org/10.1016/j.rse.2011.07.023, 2012.
Bioresita, F., Puissant, A., Stumpf, A., and Malet, J. P.: A Method for Automatic and Rapid Mapping of Water Surfaces from Sentinel-1 Imagery, Remote Sens., 10, 217, https://doi.org/10.3390/rs10020217, 2018.
Brill, F., Schlaffer, S., Martinis, S., Schröter, K., and Kreibich, H.: Extrapolating Satellite-Based Flood Masks by One-Class Classification – A Test Case in Houston, Remote Sens., 13, 2042, https://doi.org/10.3390/rs13112042, 2021.
Caballero, I., Ruiz, J., and Navarro, G.: Sentinel-2 satellites provide near-real time evaluation of catastrophic floods in the west mediterranean, Water, 11, 2499, https://doi.org/10.3390/w11122499, 2019.
Cao, H., Zhang, H., Wang, C. ,and Zhang, B.: Operational flood detection using Sentinel-1 SAR data over large areas, Water, 11, 786, https://doi.org/10.3390/w11040786, 2019.
Carincotte, C., Derrode, S., and Bourennane, S.: Unsupervised Change Detection on SAR Images Using Fuzzy Hidden Markov Chains, IEEE T. Geosci. Remote, 44, 432–441, https://doi.org/10.1109/TGRS.2005.861007, 2006.
Celik, T.: A Bayesian approach to unsupervised multiscale change detection in synthetic aperture radar images, Signal Process., 90, 1471–1485, https://doi.org/10.1016/j.sigpro.2009.10.018, 2010.
Chini, M., Pulvirenti, L., and Pierdicca, N.: Analysis and interpretation of the COSMO-SkyMed Observations of the 2011 Japan Tsunami, IEEE Geosci. Remote Sens. Lett., 9, 467–471, https://doi.org/10.1109/LGRS.2011.2182495, 2012.
Clement, M. A., Kilsby, C. G., and Moore, P.: Multi-temporal synthetic aperture radar flood mapping using change detection, J. Flood Risk Manage., 11, 152–168, https://doi.org/10.1111/jfr3.12303, 2018.
Cohen, S., Brakenridge, G. R., Kettner, A., Bates B., Nelson, J., McDonald, R., Huang, Y.-F., Munasinghe, D., and Zhang, J.: Estimating floodwater depths from flood inundation maps and topography, J. Am. Water Resour. Assoc., 54, 847–858, https://doi.org/10.1111/1752-1688.12609, 2018.
Copernicus: Copoernicus Emergency Management Service, https://emergency.copernicus.eu/, last access: 2 August 2022.
Crochemore, L., Isberg, K., Pimentel, R., Pineda, L., Hasan, A., and Arheimer, B.: Lessons learnt from checking the quality of openly accessible river flow data worldwide, Hydrolog. Sci. J., 65, 699–711, https://doi.org/10.1080/02626667.2019.1659509, 2020.
DeVries, B., Huang, C., Lang, M. W., Jones, J. W., Huang, W., Creed, I. F., and Carroll, M. L.: Automated quantification of surface water inundation in wetlands using optical satellite imagery, Remote Sens., 9, 807, https://doi.org/10.3390/rs9080807, 2017.
Di Baldassarre, G., Schumann, G., and Bates P. D.: A technique for the calibration of hydraulic models using uncertain satellite observations of flood extent, J. Hydrol., 367, 276–282, https://doi.org/10.1016/j.jhydrol.2009.01.020, 2009.
Directive 2007/60/EC: DIRECTIVE 2007/60/EC Of The European Parliament And Of the Council of 23 October 2007 on the assessment and management of flood risks, https://eur-lex.europa.eu/legal-content/EN/TXT/?uri=CELEX:32007L0060, (last access: 28 July 2022), 2007.
Domeneghetti, A., Schumann, G. J., and Tarpanelli, A.: Preface: remote sensing for flood mapping and monitoring of flood dynamics, Remote Sens., 11, 943, https://doi.org/10.3390/rs11080943, 2019.
Drusch, M., Del Bello, U., Carlier, S., Colin, O., Fernandez, V., Gascon, F., Hoersch, B., Isola, C., Laberinti, P., Martimort, P., Meygret, A., Spoto, F., Sy, O., Marchese, F., and Bargellini, P.: Sentinel-2: ESA's optical high-resolution mission for GMES operational services, Remote Sens. Environ., 120, 25–36, https://doi.org/10.1016/j.rse.2011.11.026, 2012.
EM-DAT: C. R. E. D., The international disasters database, https://www.emdat.be (last access: 6 September 2021), 2019.
Gianinetto, M., Villa, P., and Lechi, G.: Postflood Damage Evaluation Using Landsat TM and ETM+ Data Integrated With DEM, IEEE T. Geosci. Remote, 44, 236–243, https://doi.org/10.1109/TGRS.2005.859952, 2006.
Giordan, D., Notti, D., Villa, A., Zucca, F., Calò, F., Pepe, A., Dutto, F., Pari, P., Baldo, M., and Allasia, P.: Low cost, multiscale and multi-sensor application for flooded area mapping, Nat. Hazards Earth Syst. Sci., 18, 1493–1516, https://doi.org/10.5194/nhess-18-1493-2018, 2018.
Giustarini, L., Hostache, R., Matgen, P., Schumann, G., Bates, P., and Mason, D. C.: A change detection approach to flood mapping in urban areas using TerraSar-X, IEEE T. Geosci. Remote, 51, 2417–2430, https://doi.org/10.1109/TGRS.2012.2210901, 2013.
Goffi, A., Stroppiana, D., Brivio, P. A., Bordogna, G., and Boschetti, M.: Towards an automated approach to map flooded areas from Sentinel-2 MSI data and soft integration of water spectral features, Int. J. Appl. Earth Obs., 84, 101951, https://doi.org/10.1016/j.jag.2019.101951, 2020.
Google Earth Engine: A planetary-scale platform for Earth science data & analysis, https://earthengine.google.com/, last access: 2 August 2022.
Gorelick, N., Hancher, M., Dixon, M., Ilyushchenko, S., Thau, D., and Moore, R.: Google Earth Engine: Planetary-scale geospatial analysis for everyone, Remote Sens. Environ., 202, 18–27, https://doi.org/10.1016/j.rse.2017.06.031, 2017.
GRDC – The Global Runoff Data Centre: The GRDC - the world-wide repository of river discharge data and associated metadata, GRDC, Koblenz, Germany, https://www.bafg.de/GRDC/EN/01_GRDC/grdc_node.html, last access: 28 July 2022.
Hanna, D. M., Demuth, S., van Lanen, H. A. J., Looser, U., Prudhomme, C., Rees, G., Stahl, K., and Tallaksen, L. M.: Large-scale river flow archives: Importance, current status and future needs, Hydrol. Process., 25, 1191–1200, https://doi.org/10.1002/hyp.7794, 2011.
Hostache, R., Matgen, P., Schumann, G., Puech, C., Hoffmann, L., and Pfister, L.: Water Level Estimation and Reduction of Hydraulic Model Calibration Uncertainties Using Satellite SAR Images of Floods, IEEE T. Geosci. Remote, 47, 431–441, https://doi.org/10.1109/TGRS.2008.2008718, 2009.
Huang, W., DeVries, B., Huang, C., Lang, M. W., Jones, J. W., Creed, I. F., and Carroll, M. L.: Automated Extraction of Surface Water Extent from Sentinel-1 Data, Remote Sens., 10, 797, https://doi.org/10.3390/rs10050797, 2018.
IFRC: World Disasters Report 2020: Come Heat or High Water, in: World Disaster Report 2020, https://www.ifrc.org/document/world-disasters-report-2020 (last access: 28 July 2022), 2020.
Landuyt, L., Van Wesemael, A., Schumann, G. J. P., Hostache, R., Verhoest, N. E. C., and Van Coillie, F. M. B.: Flood Mapping Based on Synthetic Aperture Radar: An Assessment of Established Approaches, IEEE T. Geosci. Remote, 57, 722–739, https://doi.org/10.1109/TGRS.2018.2860054, 2019.
Long, N. T. and Trong, B. D.: Flood monitoring of Mekong river delta, Vietnam using ERS SAR data, in: 22nd Asian Conference on Remote Sensing, 5–9 November 2001, Singapore International Convention and Exhibition Centre, Singapore, 2001.
Longbotham, N., Pacifici, F., Glenn, T., Zare, A., Volpi, M., Tuia, D., Christophe, E., Michel, J., Inglada, J., Chanussot, J., and Du, Q.: Multi-modal change detection, application to the detection of flooded areas: Outcome of the 2009–2010 data fusion contest, IEEE J. Selct. Top. Appl., 5, 331–342, https://doi.org/10.1109/JSTARS.2011.2179638, 2012.
Luo, T., Maddocks, A., Iceland, C., Ward, P., and Winsemius, H.: World's 15 Countries with the Most People Exposed to River Floods, World Resources Institute, https://www.wri.org/blog/2015/03/world-s-15-countries-most-people-exposed-river-floods (last access: 2 March 2021), 2015.
Malenovský, Z., Rott, H., Cihlar, J., Schaepman, M. E., García-Santos, G., Fernandes, R., and Berger, M.: Sentinels for science: Potential of Sentinel-1, -2, and -3 missions for scientific observations of ocean, cryosphere, and land, Remote Sens. Environ., 120, 91–101, https://doi.org/10.1016/j.rse.2011.09.026, 2012.
Martinez, J. M. and Le Toan, T.: Mapping of flood dynamics and vegetation spatial distribution in the Amazon flooplain using multitemporal SAR data, Remote Sens. Environ., 108, 209–233, https://doi.org/10.1016/j.rse.2006.11.012, 2007.
Martinis, S., Twele, A., and Voigt, S.: Towards operational near real-time flood detection using a split-based automatic thresholding procedure on high resolution TerraSAR-X data, Nat. Hazard Earth Syst Sci.., 9, 303–314, https://doi.org/10.5194/nhess-9-303-2009, 2009.
Mason, D. C., Horritt, M. S., Dall'Amico, J. T. , Scott, T. R., and Bates, P. D.: Improving river flood extent delineation from synthetic aperture radar using airborne laser altimetry, IEEE T. Geosci. Remote, 45, 3932–3943, https://doi.org/10.1109/TGRS.2007.901032, 2007.
Mason, D. C., Schumann, G. J. P., Neal, J. C., Garcia-Pintado, J., and Bates, P. D.: Automatic near real-time selection of flood water levels from high resolution synthetic aperture radar images for assimilation into hydraulic models: a case study, Remote Sens. Environ., 124, 705–716, https://doi.org/10.1016/j.rse.2012.06.017, 2012.
Massari, C., Tarpanelli, A., and Moramarco, T.: A fast simplified model for predicting river flood inundation probabilities conditioned on flood extent data, Hydrol. Process., 29, 2275–2289, https://doi.org/10.1002/hyp.10367, 2015.
Matgen, P., Schumann, G., Henry, J. B., Hoffmann, L., and Pfister, L.: Integration of SAR-derived river inundation areas, high-precision topographic data and a river flow model toward near real-time flood management, Int. J. Appl. Earth Obs., 9, 247–263, https://doi.org/10.1016/j.jag.2006.03.003, 2007.
Meybeck, M., Dürr, H. H., and Vörösmarty, C. J.: Global coastal segmentation and its river catchment contributors: A new look at land-ocean linkage, Global Biogeochem. Cy., 20, GB1S90, https://doi.org/10.1029/2005GB002540, 2006.
Moramarco, T., Barbetta, S., Pandolfo, C., Tarpanelli, A., Berni, N., and Morbidelli, R.: The spillway collapse of the Montedoglio dam on the Tiber River (central Italy): data collection and event analysis, J. Hydrol. Eng., 19, 1264–1270, https://doi.org/10.1061/(ASCE)HE.1943-5584.0000890, 2014.
Mudashiru, R. B., Sabtu, N., Abustan, I., and Balogun, W.: Flood hazard mapping methods: A review, J. Hydrol., 603, 126846, https://doi.org/10.1016/j.jhydrol.2021.126846, 2021.
Musa, Z. N., Popescu, I., and Mynett, A.: A review of applications of satellite SAR, optical, altimetry and DEM data for surface water modelling, mapping and parameter estimation, Hydrol. Earth Syst. Sci., 19, 3755–3769, https://doi.org/10.5194/hess-19-3755-2015, 2015.
Notti, D., Giordan, D., Caló, F., Pepe, A., Zucca, F., and Galve, J. P.: Potential and Limitations of Open Satellite Data for Flood Mapping, Remote Sens., 10, 1673, https://doi.org/10.3390/rs10111673, 2018.
Oberstadler, R., Hönsch, H., and Huth, D.: Assessment of the mapping capabilities of ERS‐1 SAR data for flood mapping: a case study in Germany, Hydrol. Process., 11, 1415–1425, https://doi.org/10.1002/(SICI)1099-1085(199708)11:10<1415::AID-HYP532>3.0.CO;2-2, 1997.
Ogilvie, A., Belaud, G., Delenne, C., Bailly, J., Bader, J., Oleksiak, A., Ferry, L., and Martin, D.: Decadal monitoring of the Niger Inner Delta flood dynamics using MODIS optical data, J. Hydrol., 523, 368–383, https://doi.org/10.1016/j.jhydrol.2015.01.036, 2015.
Plank, S.: Rapid damage assessment by means of multi-temporal SAR – A comprehensive review and outlook to Sentinel-1, Remote Sens., 6, 4870–4906, https://doi.org/10.3390/rs6064870, 2014.
Sakamoto, T., Van Nguyen, N., Kotera, A., Ohno, H., Ishitsuka, N., and Yokozawa, M.: Detecting temporal changes in the extent of annual flooding within the Cambodia and the Vietnamese Mekong Delta from MODIS time-series imagery, Remote Sens. Environ., 109, 295–313, https://doi.org/10.1016/j.rse.2007.01.011, 2007.
Schumann, G. J.: The Full Potential of EO for Flood Applications: Managing Expectations, in: Earth Observation for Flood Applications, Elsevier, 305–320, https://doi.org/10.1016/B978-0-12-819412-6.00014-6, 2021.
Schumann, G. J. P.: The need for scientific rigour and accountability in flood mapping to better support disaster response, Hydrol. Process., 33, 3138–3142, https://doi.org/10.1002/hyp.13547, 2019.
Schumann, G. J. P. and Domeneghetti, A.: Exploiting the proliferation of current and future satellite observations of rivers, Hydrol. Proceess., 30, 2891–2896, https://doi.org/10.1002/hyp.10825, 2016.
Schumann, G. J. P. and Moller, D. K.: Microwave remote sensing of flood inundation, Phys. Chem. Earth Pt. A/B/C, 83, 84–95, https://doi.org/10.1016/j.pce.2015.05.002, 2015.
Schumann, G. J. P., Neal, J. C., Mason, D. C., and Bates, P. D.: The accuracy of sequential aerial photography and SAR data for observing urban flood dynamics, a case study of the UK summer 2007 floods, Remote Sens. Environ., 115, 2536–2546, https://doi.org/10.1016/j.rse.2011.04.039, 2011.
Seiler, R., Schmidt, J., Diallo, O., and Csaplovics, E.: Flood monitoring in a semi-arid environment using spatially high resolution radar and optical data, J. Environ. Manage., 90, 2121–2129, https://doi.org/10.1016/j.jenvman.2007.07.035, 2009.
Takeuchi, S., Konishi, T., Suga, Y., and Kishi, S.: Comparative study for flood detection using JERS-1 SAR and Landsat TM data, in: Proceedings of IGARSs'99, Hamburg, Germany, 873–875, https://doi.org/10.1109/IGARSS.1999.774470, 1999.
Tarpanelli, A.: Codes and dataset of the publication “Effectiveness of Sentinel-1 and Sentinel-2 for Flood Detection Assessment in Europe” (1.0), Zenodo [code and data set], https://doi.org/10.5281/zenodo.6939820, 2022.
Tarpanelli, A., Brocca, L., Melone, F., and Moramarco, T.: Hydraulic modelling calibration in small basins by using coarse resolution synthetic aperture radar imagery, Hydrol. Process., 27, 1321–1330, https://doi.org/10.1002/hyp.9550, 2013.
Teng, J., Jakeman, A. J., Vaze, J., Croke, B. F., Dutta, D., and Kim, S. J. E. M.: Flood inundation modelling: A review of methods, recent advances and uncertainty analysis, Environ. Model. Softw., 90, 201–216, https://doi.org/10.1016/j.envsoft.2017.01.006, 2017.
Torres, R., Snoeij, P., Geudtner, D., Bibby, D., Davidson, M., Attema, E., Potin, P., Rommen, B., Floury, N., Brown, M., Navas Traver, I., Deghaye, P., Duesmann, B., Rosich, B., Miranda, N., Bruno, C., L'Abbate, M., Croci, R., Pietropaolo, A., Huchler, M., and Rostan, F.: GMES Sentinel-1 mission, Remote Sens. Environ., 120, 9–24, https://doi.org/10.1016/j.rse.2011.05.028, 2012.
Townsend, P. A.: Estimating forest structure in wetlands using multitemporal SAR, Remote Sens. Environ., 79, 288–304, https://doi.org/10.1016/S0034-4257(01)00280-2, 2002.
Townsend, P. A. and Walsh, S. J.: Modelling flood plain inundation using integrated GIS with radar and optical remote sensing, Geomorphology, 21, 295–312, https://doi.org/10.1016/S0169-555X(97)00069-X, 1998.
Twele, A., Cao, W., Plank, S., and Martinis, S.: Sentinel-1-based flood mapping: a fully automated processing chain, Int. J. Remote Sens., 37, 2990–3004, https://doi.org/10.1080/01431161.2016.1192304, 2016.
Uddin, K., Matin, M. A., and Meyer, F. J.: Operational flood mapping using multi-temporal Sentinel-1 SAR images: a case study from Bangladesh, Remote Sens., 11, 1581, https://doi.org/10.3390/rs11131581, 2019.
Wilson, A. M. and Jetz, W.: Remotely Sensed High-Resolution Global Cloud Dynamics for Predicting Ecosystem and Biodiversity Distributions, PLoS Biol., 14, e1002415, https://doi.org/10.1371/journal.pbio.1002415, 2016.
Yonghua, S., Xiaojuan, L., Huili, G., Wenji, Z., and Zhaoning, G.: A study on optical and SAR data fusion for extracting flooded area, in: Geoscience and Remote Sensing Symposium, IGARSS 2007, 23–27 July 2007, Barcelona, Spain, 3086–3089, 2007.