the Creative Commons Attribution 4.0 License.
the Creative Commons Attribution 4.0 License.
 | 12 Jul 2022
Fault slip potential induced by fluid injection in the Matouying enhanced geothermal system (EGS) field, Tangshan seismic region, North China
Guangliang Gao
Shihuai Zhang
Dongsheng Sun
Siyu Zhu
Chengxuan Tan
Xiaodong Ma
The Tangshan region is one of the most seismically active areas in the North China, and the 1976 M 7.8 earthquake occurred on 28 July near the Tangshan fault zone. The Matouying enhanced geothermal system (EGS) field is located ∼90 km away from the city of Tangshan. Since late 2020, preliminary hydraulic stimulation tests have been conducted at depths of ∼3965–4000 m. Fluid injection into geothermal reservoir facilitates a heat exchanger system. However, fluid injection may also induce earthquakes. In anticipation of the EGS operation at the Matouying uplift, it is essential to assess how the fault slip potential of the nearby active and quiescent faults will change in the presence of fluid injection. In this study, we first characterize the ambient stress field in the Tangshan region by performing stress tensor inversions using 98 focal-mechanism data (ML≥2.5). Then, we estimate the principal stress magnitudes near the Matouying EGS field by analyzing in situ stress measurements at shallow depths (∼600–1000 m). According to these data, we perform a quantitative risk assessment using the Mohr–Coulomb framework in order to evaluate how the main active faults might respond to hypothetical injected-related pore pressure increases due to the upcoming EGS production. Our results mainly show that most earthquakes in the Tangshan seismic region have occurred on the faults that have relatively high fault slip potential in the present ambient stress field. At well distances of less than 15 km, the probabilistic fault slip potential on most of the boundary faults increases with continuing fluid injection over time, especially on the faults with well distances of ∼6–10 km. The probabilistic fault slip potential (fsp) increases linearly with the fluid injection rate. However, the fsp values decrease exponentially with increased unit permeability. The case study of the Matouying EGS field has important implications for deep geothermal exploitation in China, especially for Gonghe EGS (in Qinghai Province) and Xiong'an New Area (in Hebei Province) geothermal reservoirs that are close to the Quaternary active faults. Ongoing injection operations in the regions should be conducted with these understandings in mind.
- Article
(24697 KB) - Full-text XML
-
Supplement
(1506 KB) - BibTeX
- EndNote


Enhanced geothermal systems (EGSs) are a promising source of renewable energy for a decarbonizing world and can provide a valuable contribution to the production of renewable energy (Lee et al., 2019). The EGS technologies exploit geothermal resources through hydraulic stimulation, which involves the injection of high-pressure cold water into the target formation in order to increase the unit permeability by creating new fractures or causing preexisting fractures to widen (Terakawa et al., 2012; Grigoli et al., 2018; Lee et al., 2019). To economically produce electricity and heat with an EGS, it is necessary to employ an efficient hydraulic subsurface heat exchanger system that can circulate through the hot rock that hosts the permeable fracture network (Bromley et al., 1987; Häring et al., 2008).
The industrial process of hydraulic stimulation involves creating tensile fractures and subsequently increasing the permeability of the target rock formations via the controlled injection of pressurized fluid (Ellsworth, 2013). However, while the injection of fluid into reservoir rocks facilitates oil and gas recovery, plays a key role in EGS, and aids in the disposal of wastewater and CO2 gas, fluid injection may also induce earthquakes (Shapiro et al., 2005; Evans et al., 2012; Zoback and Gorelick, 2012; Ellsworth, 2013; Zang et al., 2014; McGarr et al., 2015; Walsh and Zoback, 2015; Lei et al., 2017; Kim et al., 2018; Lee et al., 2019). Seismic events caused by fluid injection are a possible hazard faced by nearly all engineering endeavors that result in changes to the ambient subsurface stress or pore pressure (Evans et al., 2012).
For the past 40 years, induced seismicity has been documented in geothermal settings such as the Philippines (Bromley et al., 1987), Japan (Nagano et al., 1994), Kenya (Simiyu, 1999), North America and South America (Henderson et al., 1999), Australia (Baisch et al., 2006), and New Zealand (Hunt and Latter, 1982). Evans et al. (2012) compiled a survey of induced seismic events caused by fluid injection in European geothermal reservoirs. Annually, thousands of seismic events (with local magnitudes ML<2.0) are generated during the exploitation of geothermal fields (Evans et al., 2012). Furthermore, EGS case studies have demonstrated that injecting water into basement rock mass may also produce large earthquakes (with moment magnitude 0). For example, in 2006 and 2007, four M 3.0 earthquakes were caused by the high-pressure injection of water into impermeable basement rocks beneath Basel, Switzerland (Deichmann and Giardini, 2009; Terakawa et al., 2012; Ellsworth, 2013; McGarr et al., 2015). In 2017, a M 5.5 earthquake occurred near an EGS drill site in Pohang, South Korea (Zang et al., 2014; Kim et al., 2018; Grigoli et al., 2018; Lee et al., 2019; Woo et al., 2019). Geological and geophysical data from this study area suggest that the Pohang earthquake was caused by the injection of fluid directly into the near-critically stressed Yangsan fault zone (Kim et al., 2018; Grigoli et al., 2018).
On 30 June 2019, the No. 2 Exploration Team of the Hebei Bureau of Coal Geological Exploration in China announced that their team had drilled to a depth of 3965 m into the Matouying (MTY) uplift (Fig. 1). With a temperature of 150 ∘C, this area of hot dry rock is located ∼90 km away from the city of Tangshan in northern China (Qi et al., 2020; Zhang et al., 2020). At the time, geological prospecting surveys indicated that the two target areas for the MTY EGS field had areas of 80 km2 (at a depth of 4000 m) and 500 km2 (at a depth of 5000 m) and may yield as much as the equivalent of and t of standard coal, respectively. In 2020, preliminary hydraulic stimulation tests were conducted at depths of ∼3965–4000 m (Qi et al., 2020).
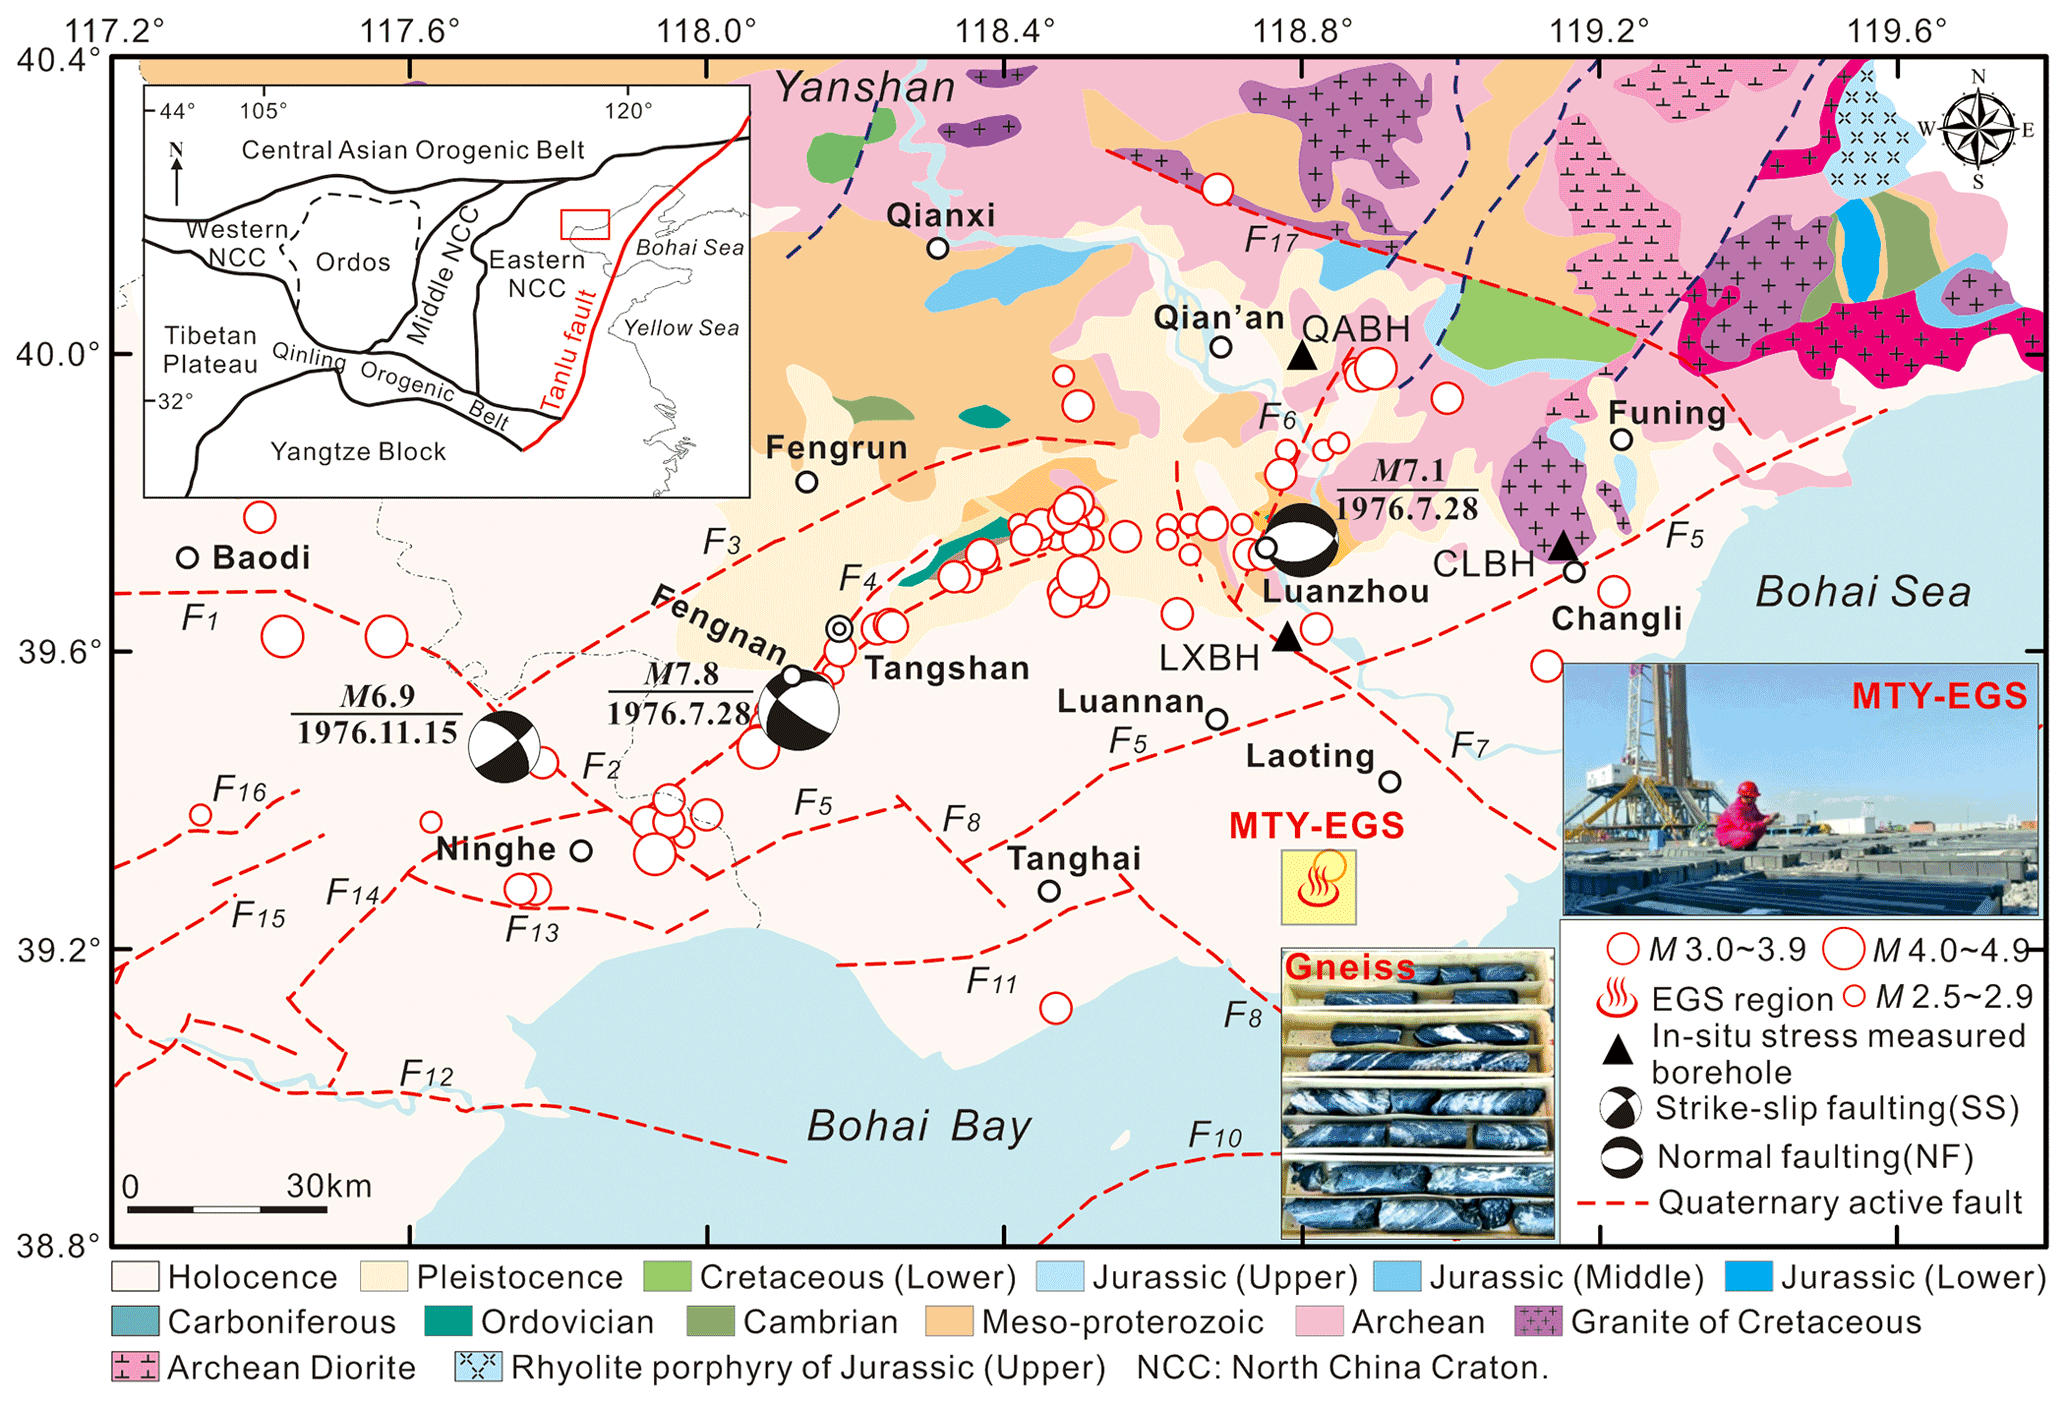
Figure 1The geological seismogenic structures and the earthquakes (M≥2.5) from 2006 to 2019 in the Tangshan seismic region, North China (modified after Feng et al., 2019). The earthquakes are gathered from the National Earthquake Data Center (NEDC), China (https://data.earthquake.cn, last access: 15 May 2022). Focal mechanisms of the Tangshan M 7.8 (28 July 1976), Luanzhou M 7.1 (28 July 1976), and Ninghe M 6.9 (15 November 1976) earthquakes were determined by Huang and Yeong (1997). The tectonic faults in the Tangshan seismic region that are pertinent to this work are as follows (Guo et al., 2011): F1 – Baodi fault, F2 – Jiyunhe fault, F3 – Yejituo fault, F4 – Tangshan fault belt, F5 – Changli–Ninghe fault, F6 – Lulong fault, F7 – Luanzhou–Laoting fault, F8 – Baigezhuang fault, F9 – Qinbei fault (visible in Fig. 2), F11 – Xi'nanzhuang fault, F12 – Haihe fault, F13 – Hangu fault, F14 – Cangdong fault, and F17 – Lengkou fault. The yellow square denotes the Matouying (MTY) enhanced geothermal system (EGS) field approximately 90 km away from the city of Tangshan in Hebei Province, China (Qi et al., 2020; Zhang et al., 2020).
The Tangshan region is one of the most seismically active areas in the North China Basin (Jiang, 2006; Feng et al., 2019). On 28 July 1976, a M 7.8 earthquake (focal depth of 10 km) struck the city of Tangshan in northern China, 160 km east of Beijing (Fig. 1) (Guo et al., 1977; Chen et al., 1979). The largest aftershock (the M 7.1 Luanzhou earthquake) occurred on the same day approximately 45 km northeast of the mainshock location (Fig. 1). Another large aftershock (the M 6.9 Ninghe earthquake) near Ninghe District occurred on 15 November 1976 (Fig. 1) (Nábělek et al., 1987; Huang and Yeong, 1997). The Tangshan M 7.8 earthquake, which was one of the most devastating earthquakes of the last 100 years worldwide, was responsible for more than 242 000 deaths and 800 000 injuries and ultimately destroyed the city of Tangshan (Li et al., 2018). Northern China is marked by unusually active intraplate seismicity and Quaternary tectonic movement (Ye et al., 1985; Nábělek et al., 1987). Previous studies indicate that most faults in the Tangshan seismic region, such as the Tangshan fault belt, the Luanzhou–Laoting fault, the Changli–Ninghe fault, and the Jiyunhe fault, were created by Late Pleistocene–Holocene tectonic activity (Li et al., 1998; You et al., 2002; Jiang, 2006; Guo and Zhao, 2019). While the seismic activity in the Tangshan region has decreased over the past 40 years (Zhang et al., 2017), some ML 4.0–5.0 earthquakes still occurred in the past 10 years – e.g., on 28 May 2012 (ML 5.2), 14 September 2015 (ML 4.2), 10 September 2016 (ML 4.2), 24 March 2017 (ML 4.4), and 2 August 2019 (ML 4.4) (Yang et al., 2016; Lin et al., 2017; Feng et al., 2019; Fan et al., 2019).
In anticipation of the EGS operation at the MTY uplift in the Tangshan seismic region, it is essential to assess how the fault slip potential of the nearby active and quiescent faults will change in the presence of fluid injection. In this study, we first characterize the ambient stress field in the Tangshan region by performing stress tensor inversions using focal-mechanism data (ML≥2.5) from the past 14 years. With these inversions, we determine the principal compressive stress orientations, the prevailing stress regime, and the critical coefficients of friction throughout our study area. By analyzing in situ stress measurements at shallow depths (∼600–1000 m) in the Tangshan seismic region (Tan et al., 2014, 2015; Niu et al., 2015; Feng et al., 2019), we estimate the principal stress magnitudes near the MTY EGS field. We then perform a quantitative risk assessment using the Mohr–Coulomb framework in order to evaluate how the main active faults in the Tangshan seismic region might respond to hypothetical injected-related pore pressure increases due to the upcoming MTY EGS production. This assessment is based on the FSP v.1.0 software package from the Stanford Center for Induced and Triggered Seismicity of Stanford University (Walsh and Zoback, 2015, 2016; Lund Snee and Zoback, 2018). In our analysis, we use only publicly available information related to the most active faults in the Tangshan seismic region. Finally, we conduct a seismic hazard assessment by predicting the maximum moment magnitudes of injection-induced seismic events in the MTY EGS field in response to different net fluid injection volumes.
The Tangshan seismic region is situated in the northern part of the North China Plain. This large basin began to form in the early to middle Eocene (Ye et al., 1985). As with many other basins, rifting was the primary mode of tectonic activity in the initial stages of basin development (Shedlock et al., 1987). This basin is bounded to the north by the Yanshan and to the east and the south by Bohai Bay. The topography is higher in the northern part of the basin than it is in the southern part of the basin (Guo and Zhao, 2019) (Fig. 1). Structurally, the Tangshan seismic region is a part of the Kailuan sag–fold system in the Yanshan fold belt; the basement material is the NE-trending Kaiping synclinorium, a Yanshan stage formation that consists of Paleozoic rocks (Guo et al., 2011). Geophysical prospecting (Hao et al., 1998; Li et al., 1998, 2009; Yang et al., 2010; Liu et al., 2011; Ran et al., 2013; Zhang et al., 2013), geological mapping (Zheng et al., 1981; Gao et al., 2001; Guo et al., 2011; Guo and Zhao, 2019), and identification of geomorphic features (Qiu et al., 2005) have revealed the existence of various fault systems in this region (Fig. 1); the orientations of these fault systems are NEN (e.g., the Lulong fault – F6), ENE (e.g., the Tangshan fault belt – F4, the Yejituo fault – F3, the Changli–Ninghe fault – F5, the Cangdong fault – F14, and the Xi'nanzhuang fault – F11), NW (e.g., the Jiyunhe fault – F2, the Luanzhou–Laoting fault – F7, and the Baigezhuang fault – F8), WNW (e.g., the Lengkou fault – F17), and nearly EW (e.g., the Hangu fault – F13 and the Haihe fault – F12). The NE-trending faults, which are the most prominent faults in the area, run throughout the entire length of the Tangshan seismic region (Ye et al., 1985). Some of the fault sets (F2, F3, F4, F5, and F7) divide the basin into rhombic and triangular blocks. Furthermore, these faults show signs of recent normal and strike-slip movement (Nábělek et al., 1987; Liu et al., 2011; Feng et al., 2019).
Based on the co-seismic crustal deformation, previous studies have concluded that the mainshock of the 1976 M 7.8 Tangshan earthquake sequence ruptured along a right-lateral fault with a strike of 30–53∘ E and a dip of 76–89∘ SE (Butler et al., 1979; Wan et al., 2017). The Luanzhou M 7.1 earthquake was associated with pure normal faulting on a plane with a strike of 30∘ W and a dip of 45–53∘ NE (Huang and Yeong, 1997; Wan et al., 2017). The Ninghe M 6.9 earthquake was characterized by left-lateral strike-slip faulting with a small normal component on a NW-striking (36∘ W) fault plane with a dip of 67∘ NE (Huang and Yeong, 1997; Wan et al., 2008, 2017).
The Mohr–Coulomb failure criteria is a useful framework for understanding how increasing the pore fluid pressure via fluid injection can trigger seismic slip (Hubbert and Rubey, 1959; Healy et al., 1968; Jaeger et al., 2007; Zoback and Gorelick, 2012; Walsh and Zoback, 2015, 2016). Because of the critically stressed nature of the crust, a given fault will remain in a locked state as long as the applied shear stress is lower than the strength of the contact (Hubbert and Rubey, 1959). The critical shear stress is the product of the coefficient of friction and the effective normal stress given by the difference between the applied normal and the pore pressure (Hubbert and Rubey, 1959; Raleigh et al., 1976; Byerlee, 1978). Then, the critical shear stress on the earthquake fault under static friction is given by the following expression:
where τc is the critical shear stress (MPa), σn is the normal stress (MPa), Pf is the total pore pressure (MPa), μ is the coefficient of friction, P0 is the natural pore pressure (MPa), and ΔP is the increasing pore pressure (MPa) via fluid injection.
In ambient conditions, the effective normal stress, which is oriented normally to the plane of the fault, effectively clamps the fault closed and reduces the likelihood of slip occurring on the fault. During fluid injection, as the pore fluid pressure increases, the effective normal stress decreases proportionally; this reduction in the normal stress unclamps the fault and may result in slip along preexisting subcritical ruptures (Jaeger et al., 2007; Langenbruch and Shapiro, 2015; Walsh and Zoback, 2015).
Fluid injection in deep wells can trigger earthquakes when the injection causes the pore pressure to increase near preexisting potentially active faults (Rutledge et al., 2004; Zoback and Gorelick, 2012; Catalli et al., 2013). In these near-critical pressure conditions, relatively small perturbations to the ambient pore fluid pressure conditions can and do trigger earthquakes; the Basel and Pohang events are examples of earthquakes that were triggered by insignificant stress perturbations caused by fluid injection (Terakawa et al., 2012; Walters et al., 2015; Kim et al., 2018; Woo et al., 2019).
Injection of fluids into a porous medium causes an increase in pore pressure that decays exponentially with radial distance from the injection source. This pressure change radiates away from the well axisymmetrically as injection continues; as such, the model calculates a radially symmetric pressure profile for each injection well at a given time using Eqs. (2) and (3) (Ferris et al., 1962; Bear, 1979; Hsieh and Bredehoeft, 1981):
where h is the vertically averaged buildup of hydraulic head above the initial head (m), T is the principal value of the transmissivity (m2 s−1), S is the storage coefficient, Q(t) is the variable injection rate (L s−1), r is the specific weight of the fluid (N m−3), ΔP is the vertically averaged pressure increase (MPa), W(u) is the well function, and Rad is the radius distance away from the injection well (m).
These groundwater flow equations describe the two-dimensional (2D) radial flow in a vertically confined aquifer containing a variable injection rate well. The idealized model of the reservoir makes several simplifying assumptions to compute pressure buildup and the subsequent falloff caused by fluid injection (Ferris et al., 1962; Papadopulos, 1966; Bear, 1979; Hsieh and Bredehoeft, 1981; Walsh et al., 2017): (1) the porous medium is fully saturated and has a uniform pressure distribution; (2) the hydraulic head is the same everywhere before the injection; (3) injection wells are treated as point sources in the 2D grid; (4) the permeability and porosity are constant and isotropic; and (5) interacting pressure plumes are superimposed linearly. Using this hydrologic model, Hsieh and Bredehoeft (1981) approximated the pressure buildup in response to injection of fluid wastes into the fractured Precambrian crystalline bedrock beneath the Rocky Mountain Arsenal (RMA) near Denver, which triggered earthquakes in the 1960s, and their results showed that the increase in fluid pressure triggered the swarm of earthquakes at the RMA.
In this study, we utilize the FSP v.1.0 software package to estimate the slip potential on the active faults throughout the Tangshan seismic region. The FSP program allows for either a deterministic or a probabilistic geomechanical analysis of the fault slip potential based on the Mohr–Coulomb failure criteria. Both the deterministic and the probabilistic geomechanical models rely on several simplifying assumptions (Walsh et al., 2017): (1) the natural pore pressure and stress tensor are uniform across the study area and linearly increase in magnitude with depth; (2) one of the principal stress vectors is vertical; and (3) the stress state is determined by the relative magnitude of the vertical stress vector (maximum, intermediate, or minimum). The FSP tool allows the user to estimate the likelihood that the planar fault segments in question will be critically stressed within a local stress field. When the ratio of the resolved shear stress to the normal stress reaches a specific failure criterion (determined using the linearized Mohr–Coulomb failure envelope), the fault becomes critically stressed (Lund Snee and Zoback, 2018). It should be noted that the FSP program does not predict earthquakes. Instead, the FSP program assesses the cumulative conditional probability of slip occurring on known faults, rather than quantifying the seismic hazard of a given fault (Walsh et al., 2017).
Despite some limitations, FSP provides a forward-looking probabilistic screening tool for known faults near injection operations. Using the FSP tool, Walsh and Zoback (2016) calculated the conditional probability of slip on mapped faults in response to injection-related increases in pore pressure in north-central Oklahoma (USA), where widespread injection of produced saltwater has triggered thousands of small- to medium-sized earthquakes; Lund Snee and Zoback (2018) estimated the potential for slip on mapped faults across the Permian Basin of west Texas in response to injection-related pressure changes at depth that might be associated with future oil and gas development activities in the region. Hennings et al. (2019) conducted a probabilistic assessment of fault slip potential on the regionally mapped faults in the hydrocarbon-producing Fort Worth Basin of north-central Texas, coinciding spatiotemporally with injection of 2 billion barrels of wastewater into deep aquifers.
4.1 Stress field inversion from earthquake focal mechanisms
Michael (1984) developed a linearized stress field inversion scheme that can be solved by applying a least-squares technique. Based on Michael's method, Vavryčuk (2014) proposed a new iterative stress inversion technique (MATLAB software package STRESSINVERSE) that not only allows the user to determine the stress and fault orientations but also accurately calculates the shape ratio. Furthermore, using the focal-mechanism data, STRESSINVERSE allows the user to estimate the frictional coefficients of the seismogenic faults. In this study, we used the STRESSINVERSE software package to perform a crustal tectonic stress field inversion in the Tangshan seismic region. The shape ratio Rs (Gephart and Forsyth, 1984) is expressed as
where σ1, σ2, and σ3 represent the maximum, intermediate, and minimum principal stress, respectively.
To resolve the spatial variations in the inversion stress regime, we use the regime stress ratio (RSR) parameter defined by Simpson (1997):
where n is equal to 0 for normal faulting (NF), 1 for strike-slip faulting (SS), and 2 for thrust (or reverse) faulting (TF) (Hergert and Heidbach, 2011).
An advantage of the RSR parameter is that it provides a continuous scale from pure normal faulting (RSR = 0.0), normal and strike-slip faulting (0.5–1.5), pure strike-slip faulting (RSR = 1.5), reverse/strike-slip faulting (1.5–2.5), and pure reverse faulting (RSR = 2.5) (Simpson, 1997).
Using full waveform data, Lin et al. (2017) determined the focal mechanisms of 918 earthquakes (ML≥2.5) that occurred between January 2010 and June 2014 in North China using the FOCMEC (Snoke, 2009) and TDMT (Dreger and Helmberger, 1991; Minson and Dreger, 2008) methods. In this massive data set, they identified 572 especially robust focal mechanisms. In our study, we used 75 focal-mechanism data (ML≥2.5) from the Lin et al. (2017) data set that sample the Tangshan seismic region (with latitudes of 38.8–40.4∘ N and longitudes of 117.2–119.8∘ E) as the input data for our crustal tectonic stress field inversion. Moreover, we also used 23 focal mechanisms (ML≥3.0) from earthquakes that occurred between November 2006 and November 2009 (Huang and Wan, 2015; Fan et al., 2019) and between November 2015 and March 2019 (Yang et al., 2016; Feng et al., 2019). Our total Tangshan seismic region data set is comprised of 98 focal mechanisms (ML≥2.5) that occurred during 2006–2019 (Fig. 2 and Table S1 in the Supplement). The focal mechanisms, which summarize the prevailing sense of slip during a seismic event, are generally classified as thrust faulting (TF), normal faulting (NF), normal faulting with a strike-slip-faulting component (NS), thrust faulting with a strike-slip-faulting component (TS), or pure strike-slip faulting (SS) (Zoback, 1992).

Figure 2Focal mechanisms from 98 earthquakes (M≥2.5) from 2006 to 2019 in the Tangshan seismic region (gathered from Lin et al., 2017) and in situ-stress-measured boreholes (black triangles) by the hydraulic fracturing method in the north of the MTY EGS field (Tan et al., 2014; Niu et al., 2015; Feng et al., 2019).
Previous studies show that there are spatial stress variations in the Tangshan seismic region (Feng et al., 2019). In order to investigate the crustal tectonic stress field in this area, we divide the Tangshan seismic region into bins, where each bin contains at least one earthquake. With a confidence interval of 95 %, the results of the inversion in each bin include the predominant maximum principal compressive stress orientation (σ1), the regime stress ratio (RSR), and the frictional coefficient (μ).
4.2 Present tectonic stress field in the Tangshan seismic region
As shown in Fig. 3a, the Tangshan seismic region is characterized by local stress heterogeneity. The maximum principal stress (σ1) orientations of ENE–EW dominate the Tangshan seismic region, while some WNW (∼100–112∘) σ1 orientations occur near the Lulong fault (F6) in Luanzhou. Zhang et al. (2008) suggest that the σ1 axis has orientations of ∼70–80∘ (ENE), 91∘ (EW), and 91∘ (EW) in the Tangshan, Ninghe, and northern Luanzhou counties, respectively. While investigating the tectonic field homogeneity in the Tangshan area, Yang et al. (2016) found that the σ1 axes had orientations of ∼87–92∘ (ENE–EW) and 103∘ (WNW) near the Tangshan fault and the Lulong fault, respectively. Our σ1 axis results generally coincide with those of previous studies (Zhang et al., 2008; Yang et al., 2016). Furthermore, our regional tectonic stress field inversion, which was constrained using all 98 focal mechanisms (Fig. 3b), revealed that 83∘ E is the dominant σ1 orientation in the Tangshan seismic region; this result is also consistent with previous studies in our study area (Li et al., 1980; Huang and Wan, 2015; Lin et al., 2017; Fan et al., 2019) and in northern China (Xu et al., 2008).
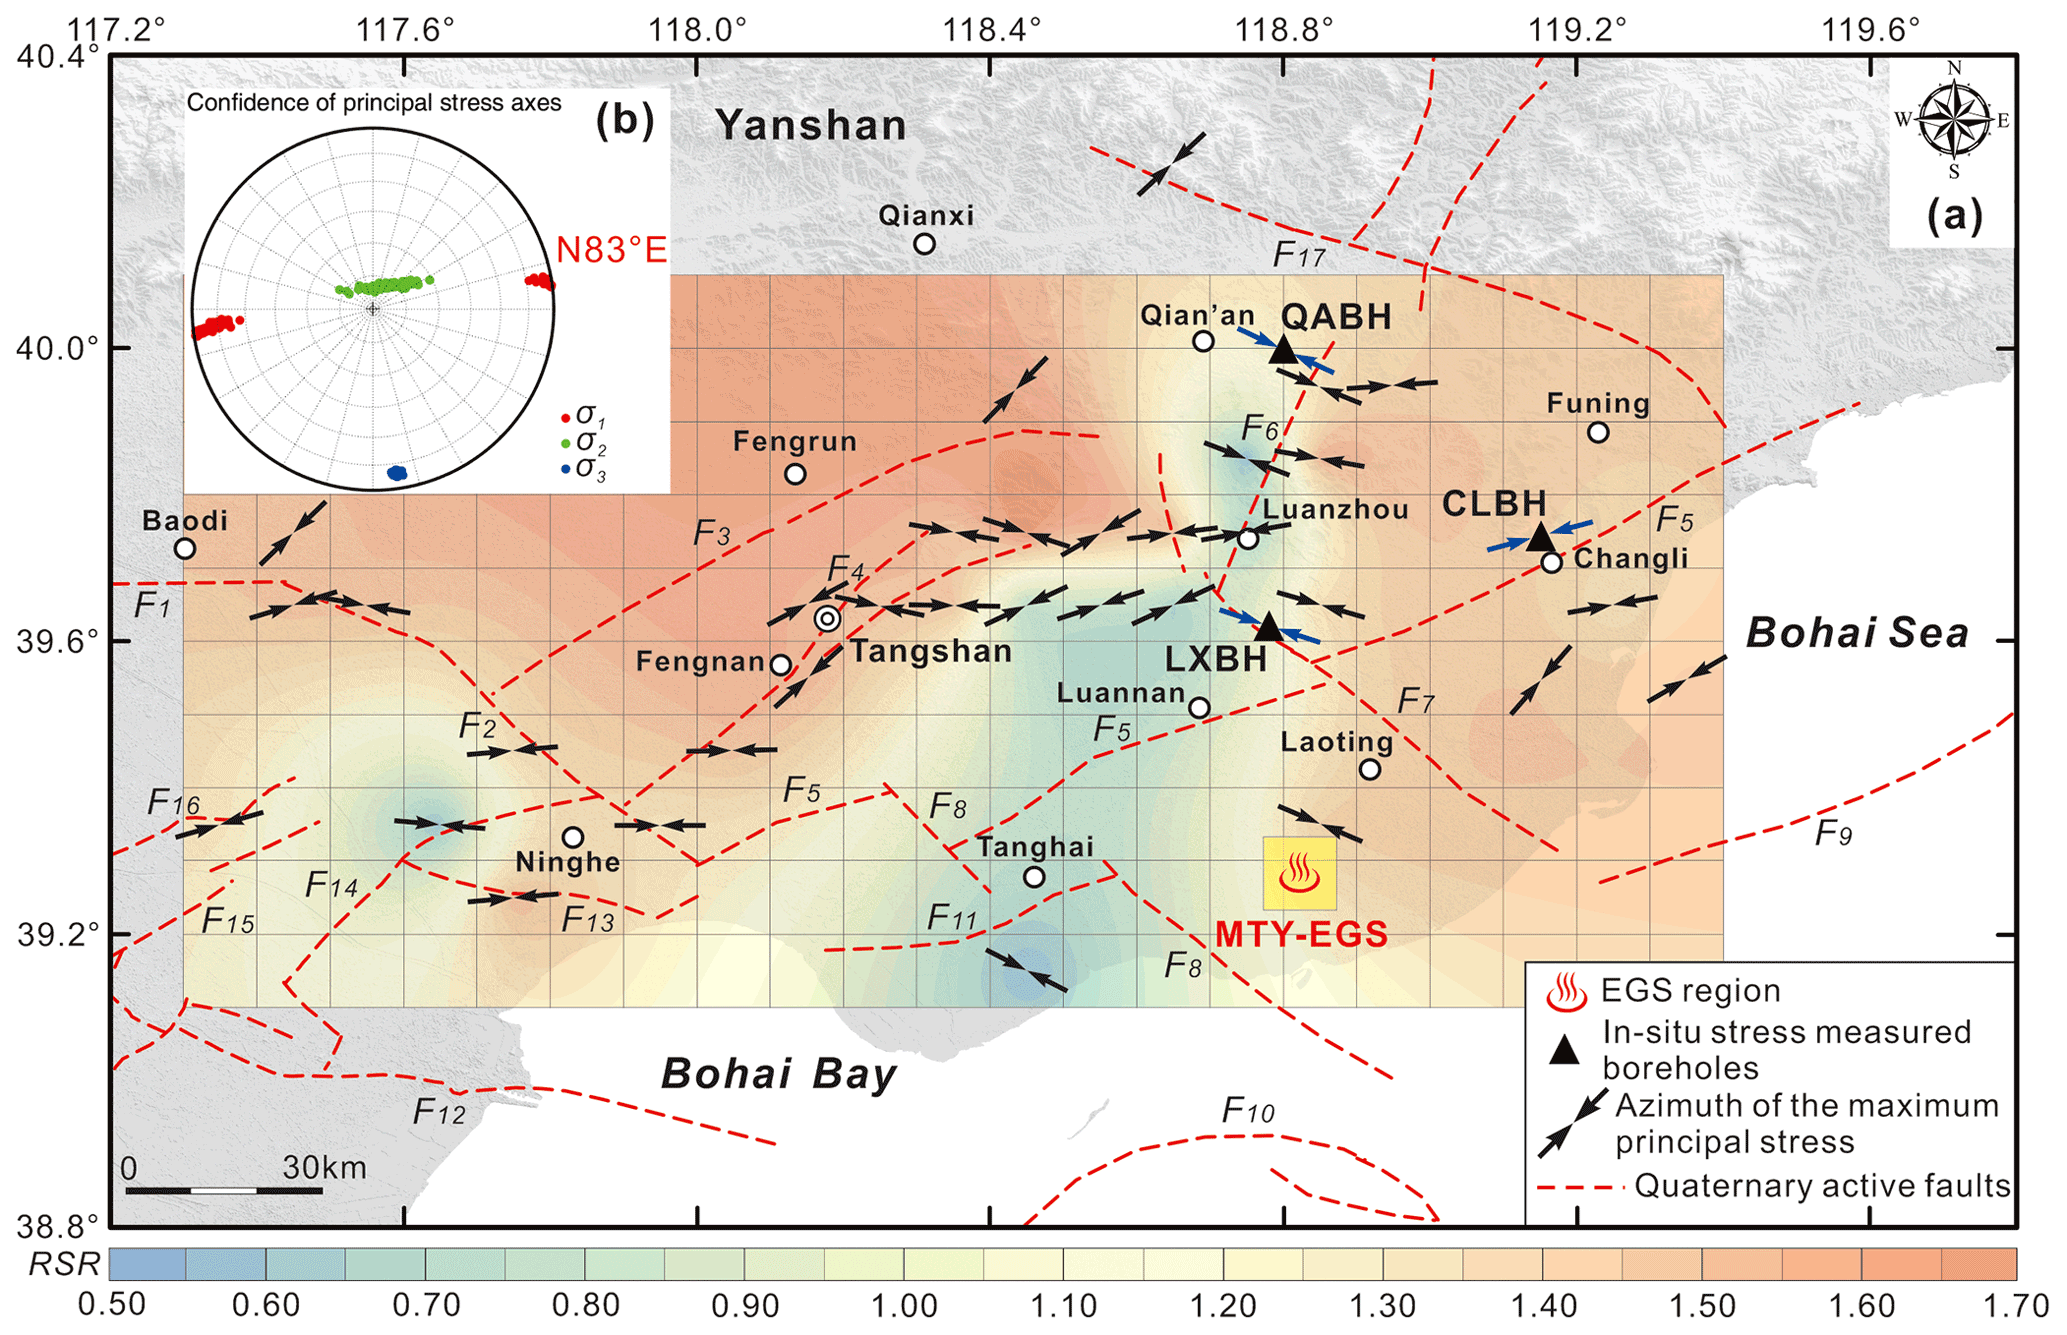
Figure 3Crustal stress field in the Tangshan seismic region, as determined by inversion of 98 focal mechanisms shown in Fig. 2 using the STRESSINVERSE software package (Vavryčuk, 2014). (a) The results of the inversion in each bin () include the predominant maximum principal compressive stress orientation (σ1) and the regime stress ratio (RSR). (b) The dominant σ1 orientation in the Tangshan seismic region was constrained using all 98 focal mechanisms with a confidence interval of 95 %.
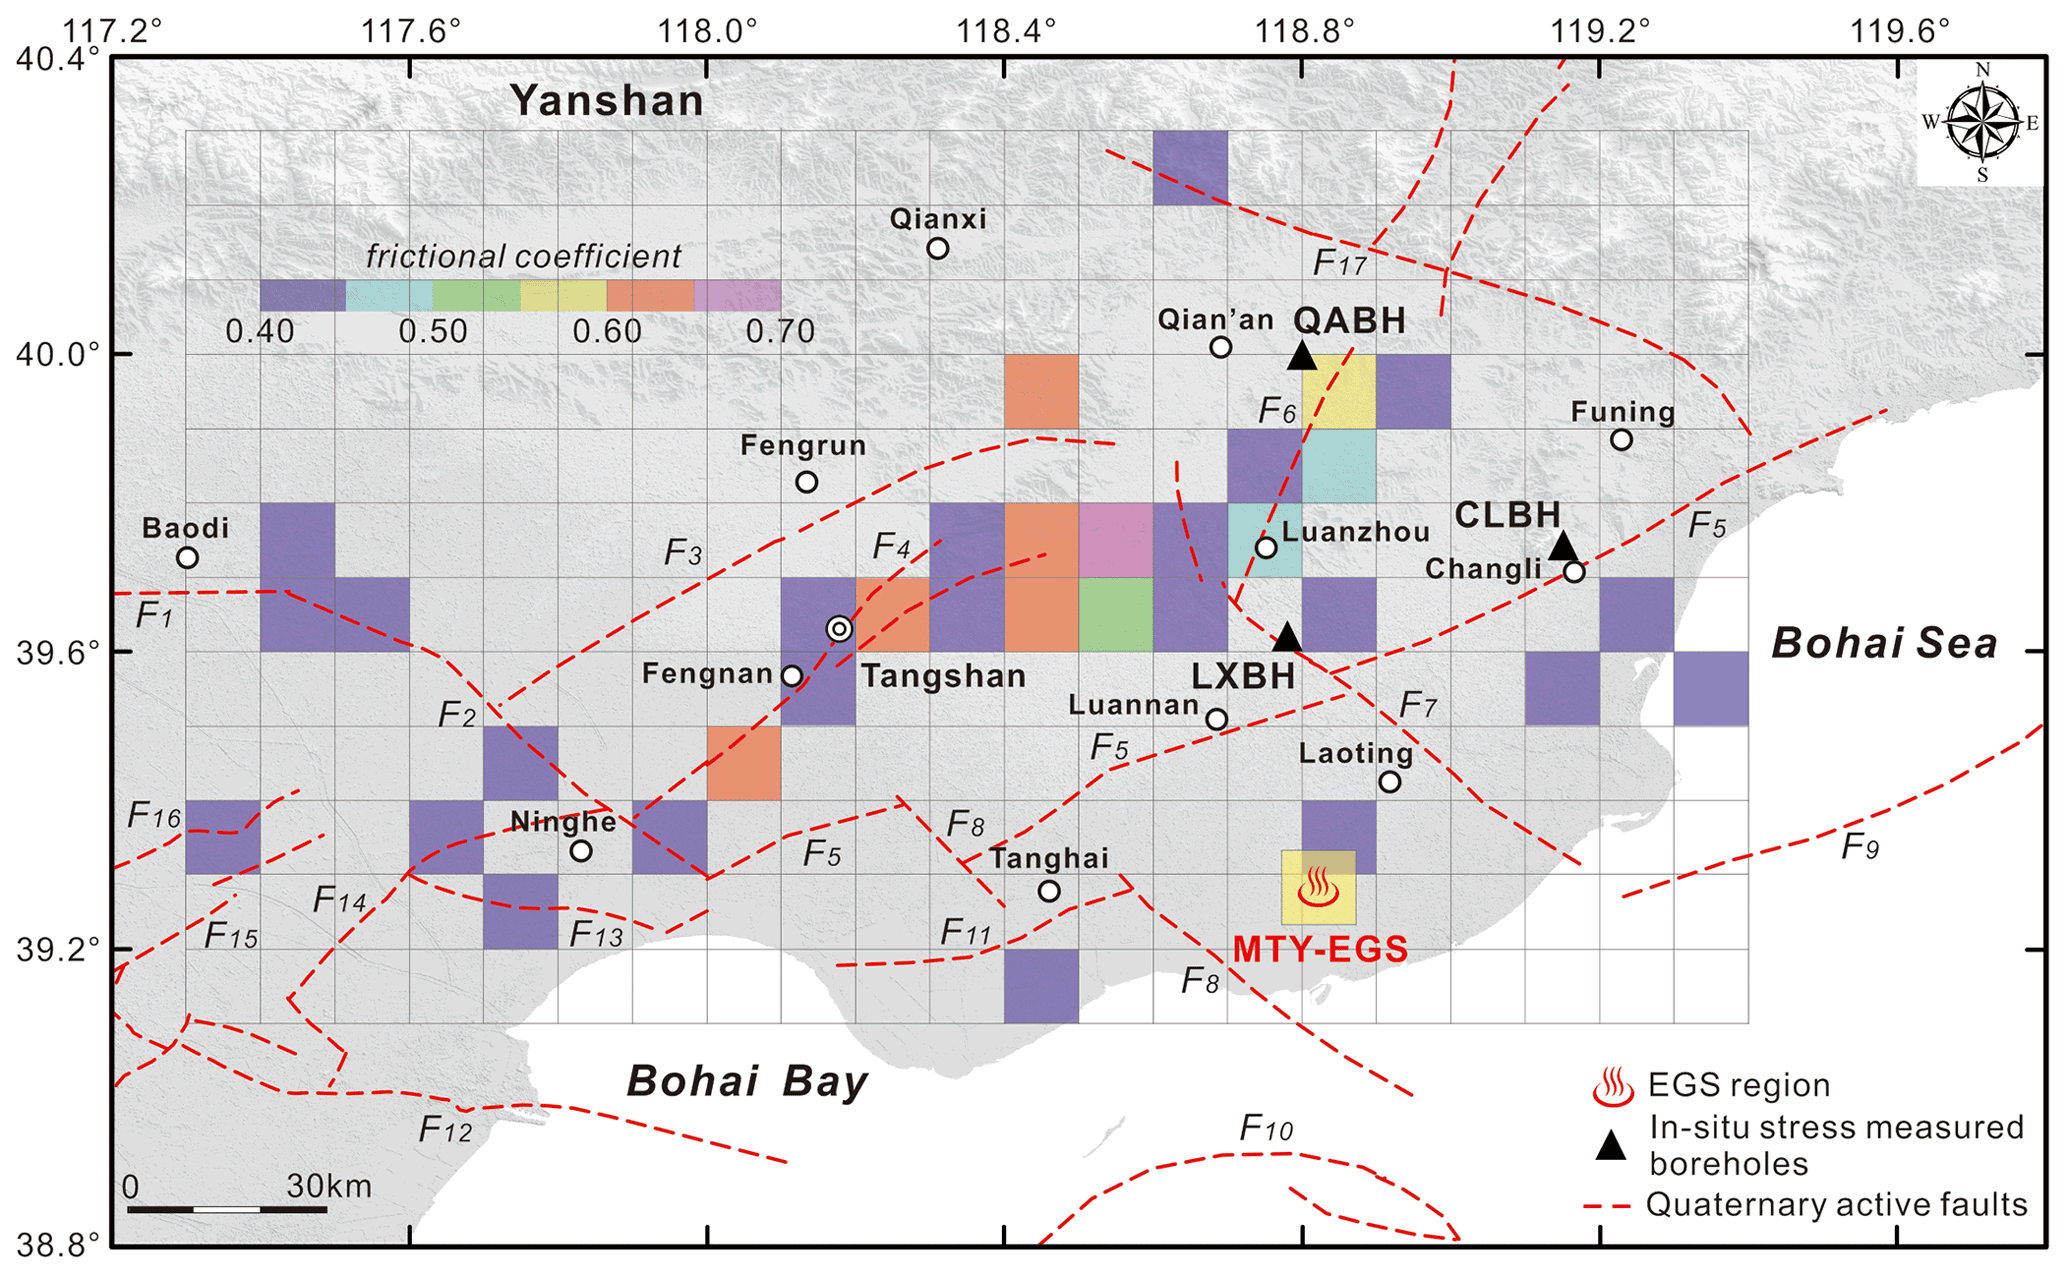
Figure 4The critical coefficient of friction of the main seismic faults in the Tangshan seismic region, as determined by inversion of 98 focal mechanisms (seen in Fig. 2) using the STRESSINVERSE software package (Vavryčuk, 2014).
Additionally, Fig. 3a suggests that the predominant RSR values vary between 0.66 and 1.58; these values coincide with a normal-faulting–strike-slip-faulting stress regime. This stress regime is characterized by significant strike-slip faulting in the western (e.g., in Tangshan, Fengnan, Fengrun, and Ninghe counties with RSR values of ∼1.10–1.60) and eastern (e.g., in Funing, Changli, and Laoting counties with RSR values of ∼1.20–1.45) parts of the Tangshan seismic region. The prevailing stress regime in the central Tangshan seismic region is characterized by normal faulting with a small component of strike-slip faulting (e.g., in Tanghai, Luannan, and Luanzhou counties with RSR values of ∼0.55–0.85). These stress regimes are consistent with both the fault rupturing that occurred during the 1976 Tangshan earthquake sequence (Butler et al., 1979; Huang and Yeong, 1997; Wan et al., 2017) and the present active features of the main seismogenic faults in this area (Jiang, 2006; Guo et al., 2011; Guo and Zhao, 2019).
Table 1General conditions of three in situ stress boreholes measured in the Tangshan seismic region.

Figure 4 shows that the estimated friction coefficients near the main seismogenic faults mainly vary between 0.4–0.6; the Tangshan fault belt, the Luanzhou–Laoting fault, the Changli–Ninghe fault, the Jiyunhe fault, and the Cangdong fault all have a friction coefficient of ∼0.4. Byerlee (1978) summarized numerous laboratory experiments on different rock types and stated that at elevated effective normal stresses (<100 MPa), the corresponding friction coefficient fell in the range of ∼0.6–1.0. Townend and Zoback (2000) suggested that the ratio of the maximum to minimum effective stresses corresponds to friction coefficients ranging from 0.6 to 1.0; these values indicate a state of crustal equilibrium. When it comes to assessing the fault slip potential, an empirical friction coefficient of 0.6 is typically invoked as the critical value (Zoback and Healy, 1992; Zoback et al., 2003; Moeck et al., 2009; Qin et al., 2015; Lund Snee and Zoback, 2016; Lee and Ong, 2018; Zhang and Ma, 2021). However, because the prevailing friction coefficient in our study area (0.40) is lower than the empirical critical value of 0.6, we infer the presence of some weaker seismogenic faults in the Tangshan seismic region; this conclusion agrees with the low friction coefficients (μ of 0.21–0.45) found in the Changli area of eastern Hebei Province (Feng et al., 2017). Multiple studies have reported low friction coefficients near strong earthquake seismogenic faults. For example, the San Andreas fault system has μ values of ∼0.18–0.26 (Hickman and Zoback, 2004; Carpenter et al., 2012), the Yingxiu–Beichuan fault (a branch of the Longmenshan fault zone in the eastern margin of the Tibetan Plateau) is characterized by a μ value of 0.4 (Verberne et al., 2010), and the friction coefficients of ∼0.2–0.5 are found in the Yishu fault zone (a branch of the Tan–Lu fault zone in eastern China) (Li et al., 2019).
4.3 Hydraulic fracturing measurements in the MTY EGS field
Currently, there are no in situ stress measurements of the MYT EGS field. However, we performed hydraulic fracturing at the Qian'an borehole (QABH, depth of 600 m), the Changli borehole (CLBH, depth of 600 m), and the Luanzhou borehole (LXBH, depth of 1000 m) from 2009 to 2013 in the northern part of the MTY EGS field (Fig. 1). The QABH, CLBH, and LXBH boreholes are approximately 70, 55, and 30 km away from the MTY EGS field, respectively (Fig. 1). The locations, rock types, and rock mass integrity of the QABH, CLBH, and LXBH boreholes are listed in Table 1. The in situ stress measurements derived from our hydraulic fracturing tests at three boreholes are shown in Table 2 (Tan et al., 2014, 2015; Niu et al., 2015; Feng et al., 2017, 2019). Based on these in situ stress measurements, we can estimate the magnitude of the principal stresses at shallow depths near the MTY EGS field.
Table 2Hydraulic fracturing in situ stress results at QABH, CLBH, and LXBH boreholes near the MTY EGS field.

Note that Pb, Pr, and Ps denote the breakdown, reopening, and shut-in pressure, respectively. σH, σh, and σv denote the maximum and minimum horizontal principal stresses and vertical principal stress, respectively. P0 is the natural pore pressure, and T indicates the tensile strength of rock being equal to the difference between Pb and Pr.
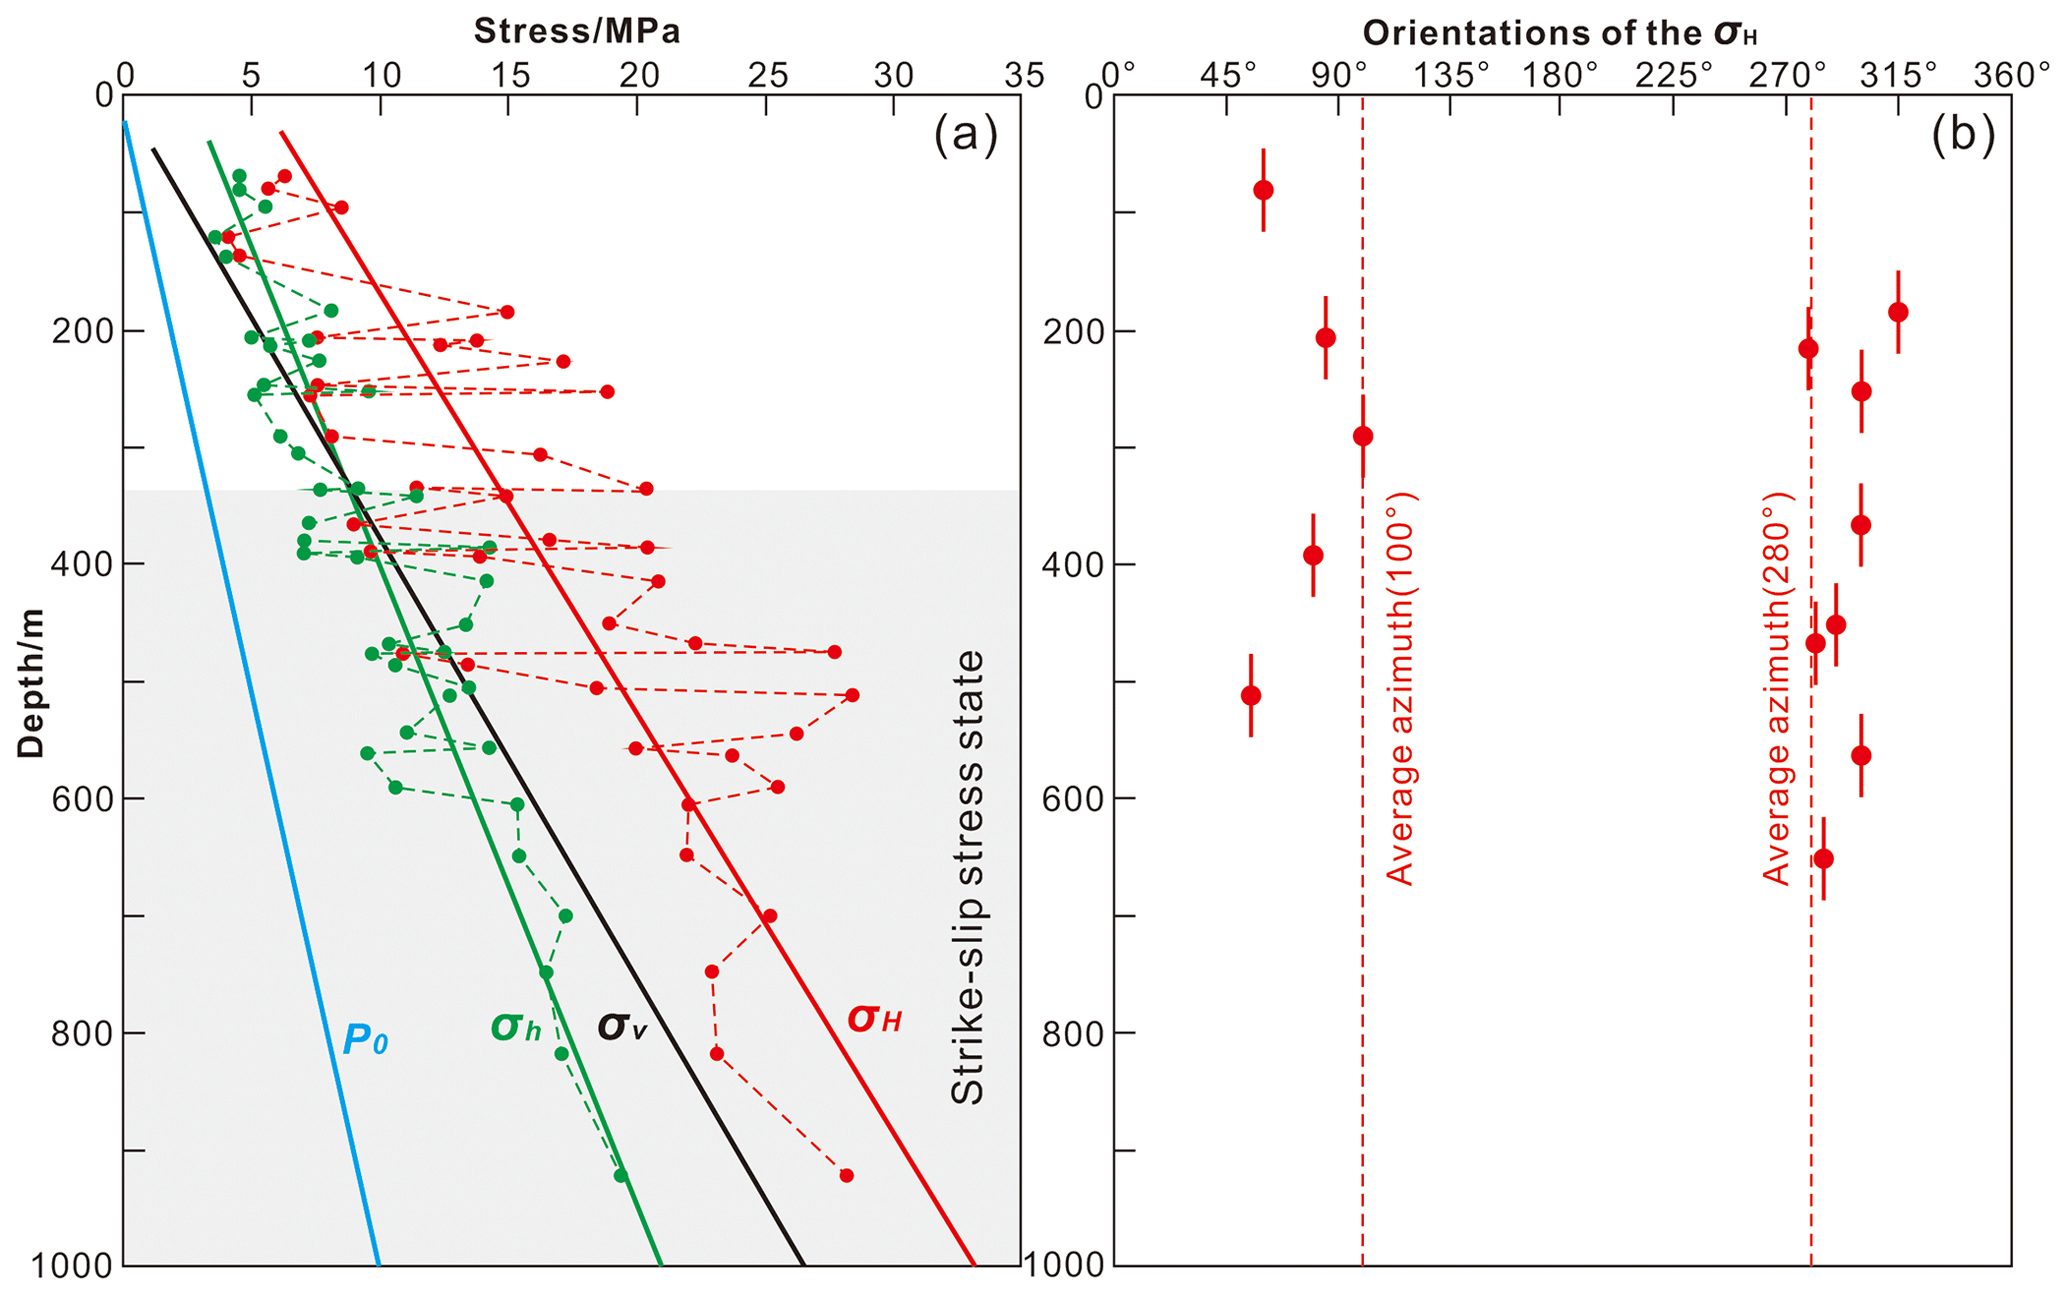
Figure 5Hydraulic fracturing in situ stress results at shallow depths (<1000 m) near the MTY EGS field in the Tangshan seismic region. (a) The magnitudes of three principal stresses with depth. (b) The orientations of the maximum horizontal principal stress (σH).
Table 2 shows that the magnitudes of σH, σh, and σv vary between 4.04–28.51, 3.75–19.46, and 1.79–24.44 MPa, respectively, over a depth range of 67.5–922.44 m. The magnitudes of the horizontal principal stresses (σH and σh) and the natural pore pressure (P0) increase with depth (Fig. 5a). From these data together, we used linear regressions to determine how principal stresses and the natural pore pressure vary with depth:
where R2 is the regression coefficient.
The linear gradients of σH and σh are 0.0278 and 0.0183 MPa m−1, respectively, near the MTY EGS region. These gradients are slightly larger than those found in northern China above a depth of 4000 m (σH gradient of ∼0.0229–0.0233 MPa m−1 and σh gradient of ∼0.0162–0.0170 MPa m−1) (Yang et al., 2012; Huang et al., 2013), suggesting that there is a higher stress accumulation in the Tangshan seismic region than there is throughout the rest of northern China (Niu et al., 2015; Feng et al., 2019). Because the three principal stresses have magnitudes of below a depth of 328 m, we infer that this area is dominated by a strike-slip-faulting regime (Fig. 5a). The stress state at shallow depths (<1000 m) is consistent with the results of the focal-mechanism inversion performed at seismogenic depths in the Tangshan seismic region (Fig. 3).
The measured σH orientations vary from 47 to 82∘ W (average of 65±18∘ W) at borehole QABH (depth range of 184.10–590.32 m), from 55∘ E to 82∘ W (average of 75±20∘ E) at borehole CLBH (depth range of 67.50–485.50 m), and from 60 to 74∘ W (average of 68±8∘ W) at borehole LXBH (depth range of 340.00–922.44 m). The average σH orientation for all three boreholes at shallow depths (<1000 m) is 80∘ W (or 100∘), which is similar to the predominant σ1 axis orientation (83∘ E) throughout the entire Tangshan seismic region (Figs. 3b and 5b).
Table 3The tensorial mean of hydraulic fracturing in situ stress results at similar depths in three boreholes near the MTY EGS field.
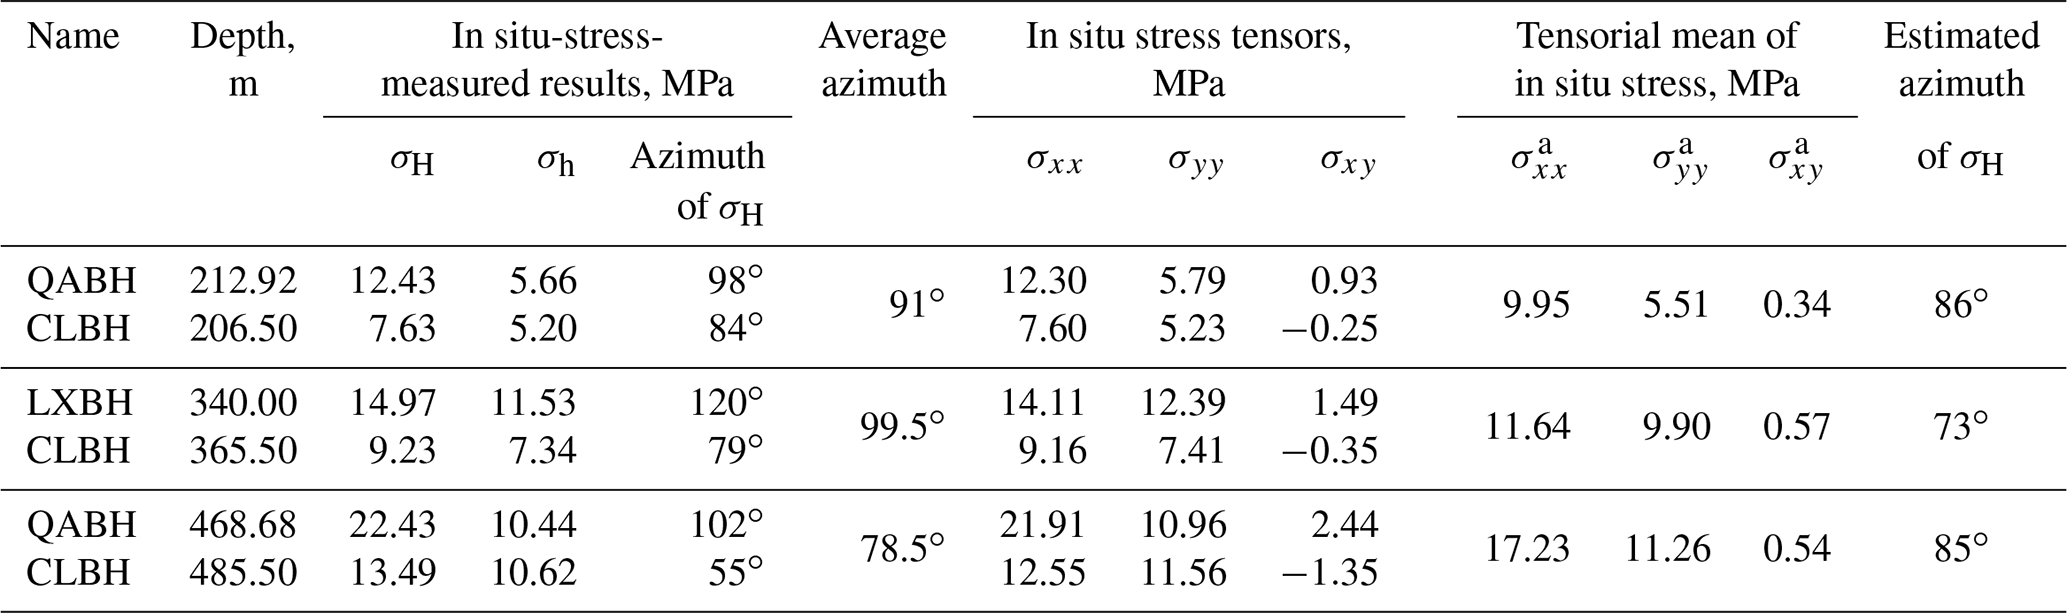
Note that normal compressive stress is defined as positive, while tensional stress is negative. Shear stress is positive (block clockwise rotation). For the x–o–y coordinate system, the positive direction of the x axis and y axis is the same as the azimuth of the east (E) and north (N), respectively.
Previous studies suggest that the customary vector approach, which involves averaging the orientation of the maximum principal stresses, may yield unreasonable results and violate the tensorial nature of the stress variable (Gao and Harrison, 2017). Using Eq. (A2) from Feng et al. (2020) and our in situ stress data (Table 2), we first calculate the two-dimensional stress tensors at similar depths in the x (east)–o–y (north) coordinate system and then determine the tensorial mean of these stress states (Table 3). Finally, we estimate the predominant orientation of the maximum horizontal principal stress in different boreholes by applying the mean stress tensors to Eq. (6) from Feng et al. (2020). As shown in Table 3, the predominant σH orientations are 86∘ E at a depth interval of 206.50–212.92 m, 86∘ E at a depth interval of 340.00–365.50 m, and 85∘ E at a depth interval of 468.68–485.50 m. These estimated σH orientations are consistent with the tectonic stress field generated by our focal mechanisms inversion for the Tangshan area (83∘ E) (Fig. 3b).
5.1 Deterministic fault slip potential in the Tangshan seismic region under the present stress field
Here, we use only publicly available information related to the most active faults in the Tangshan seismic region. Based on the results of urban active fault explorations conducted in the city of Tianjin by the Tianjin Earthquake Agency (Zheng et al., 2006; Chen et al., 2010; Liu et al., 2013; Yan et al., 2014) and in Hebei Province, China, conducted by the Hebei Earthquake Agency (Peng and Meng, 2017), we collected location, length, strike, and dip information for the main active faults in the Tangshan seismic region. The simplified strike data for various fault segments are shown in Fig. 6. This data set contains 53 fault segments, each defined by two connected coordinate points. The three-dimensional geometries of the active faults used in the fault slip potential calculation are listed in Table 4.
Table 4The geological information of the main active faults used for calculating probabilistic fault slip potential in the Tangshan seismic region.
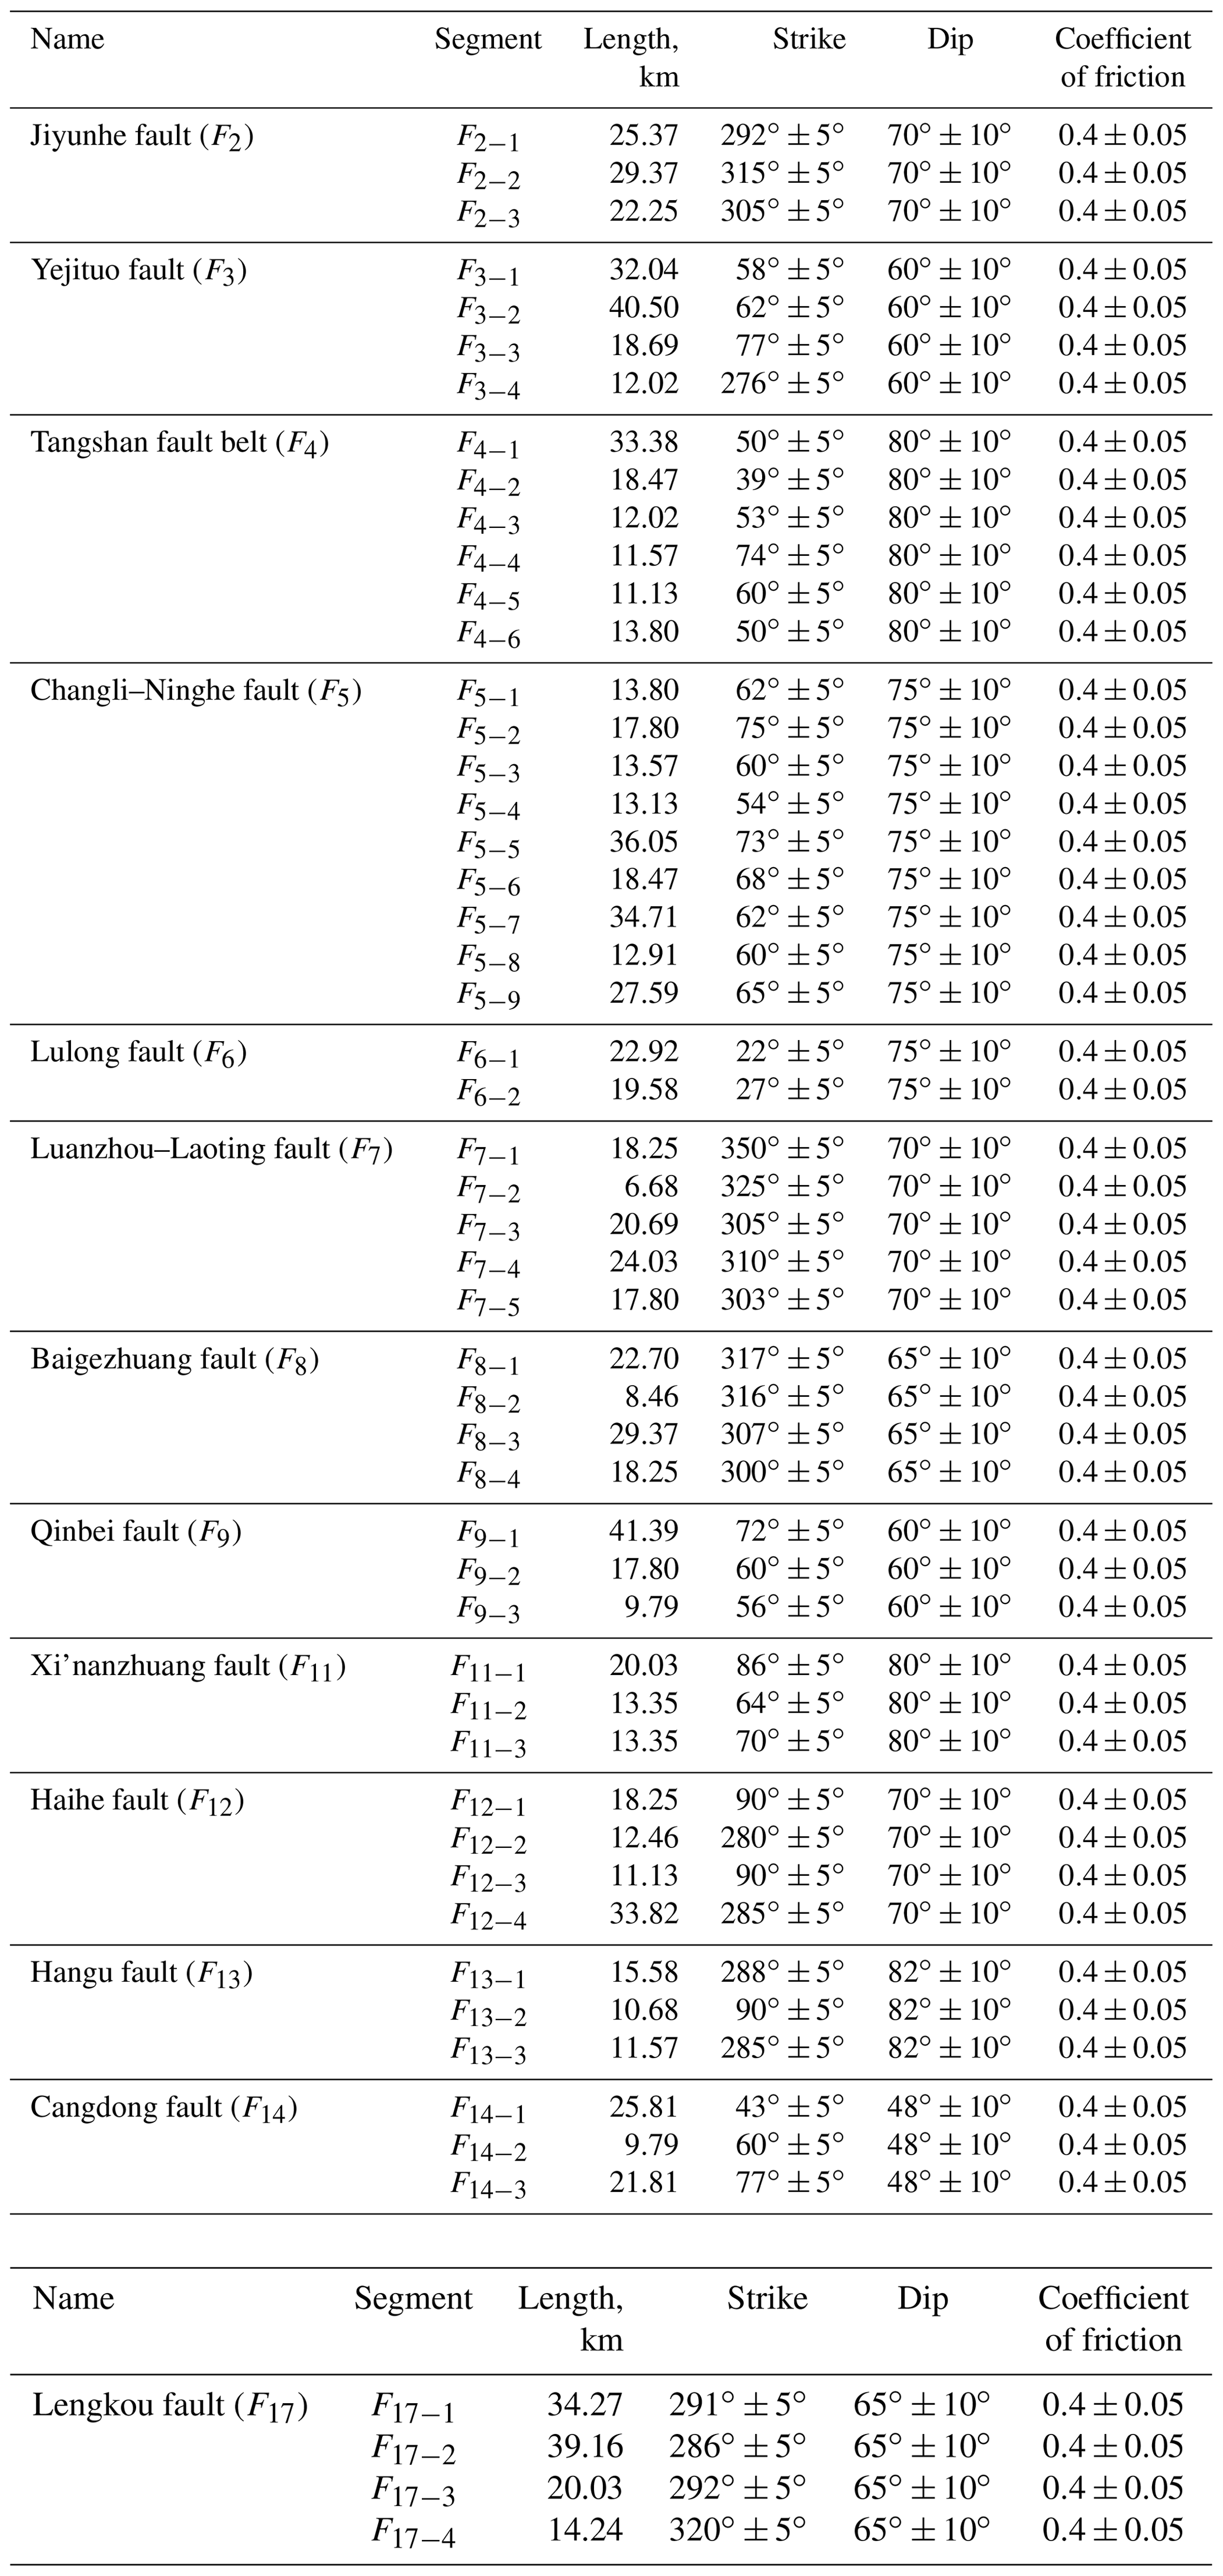
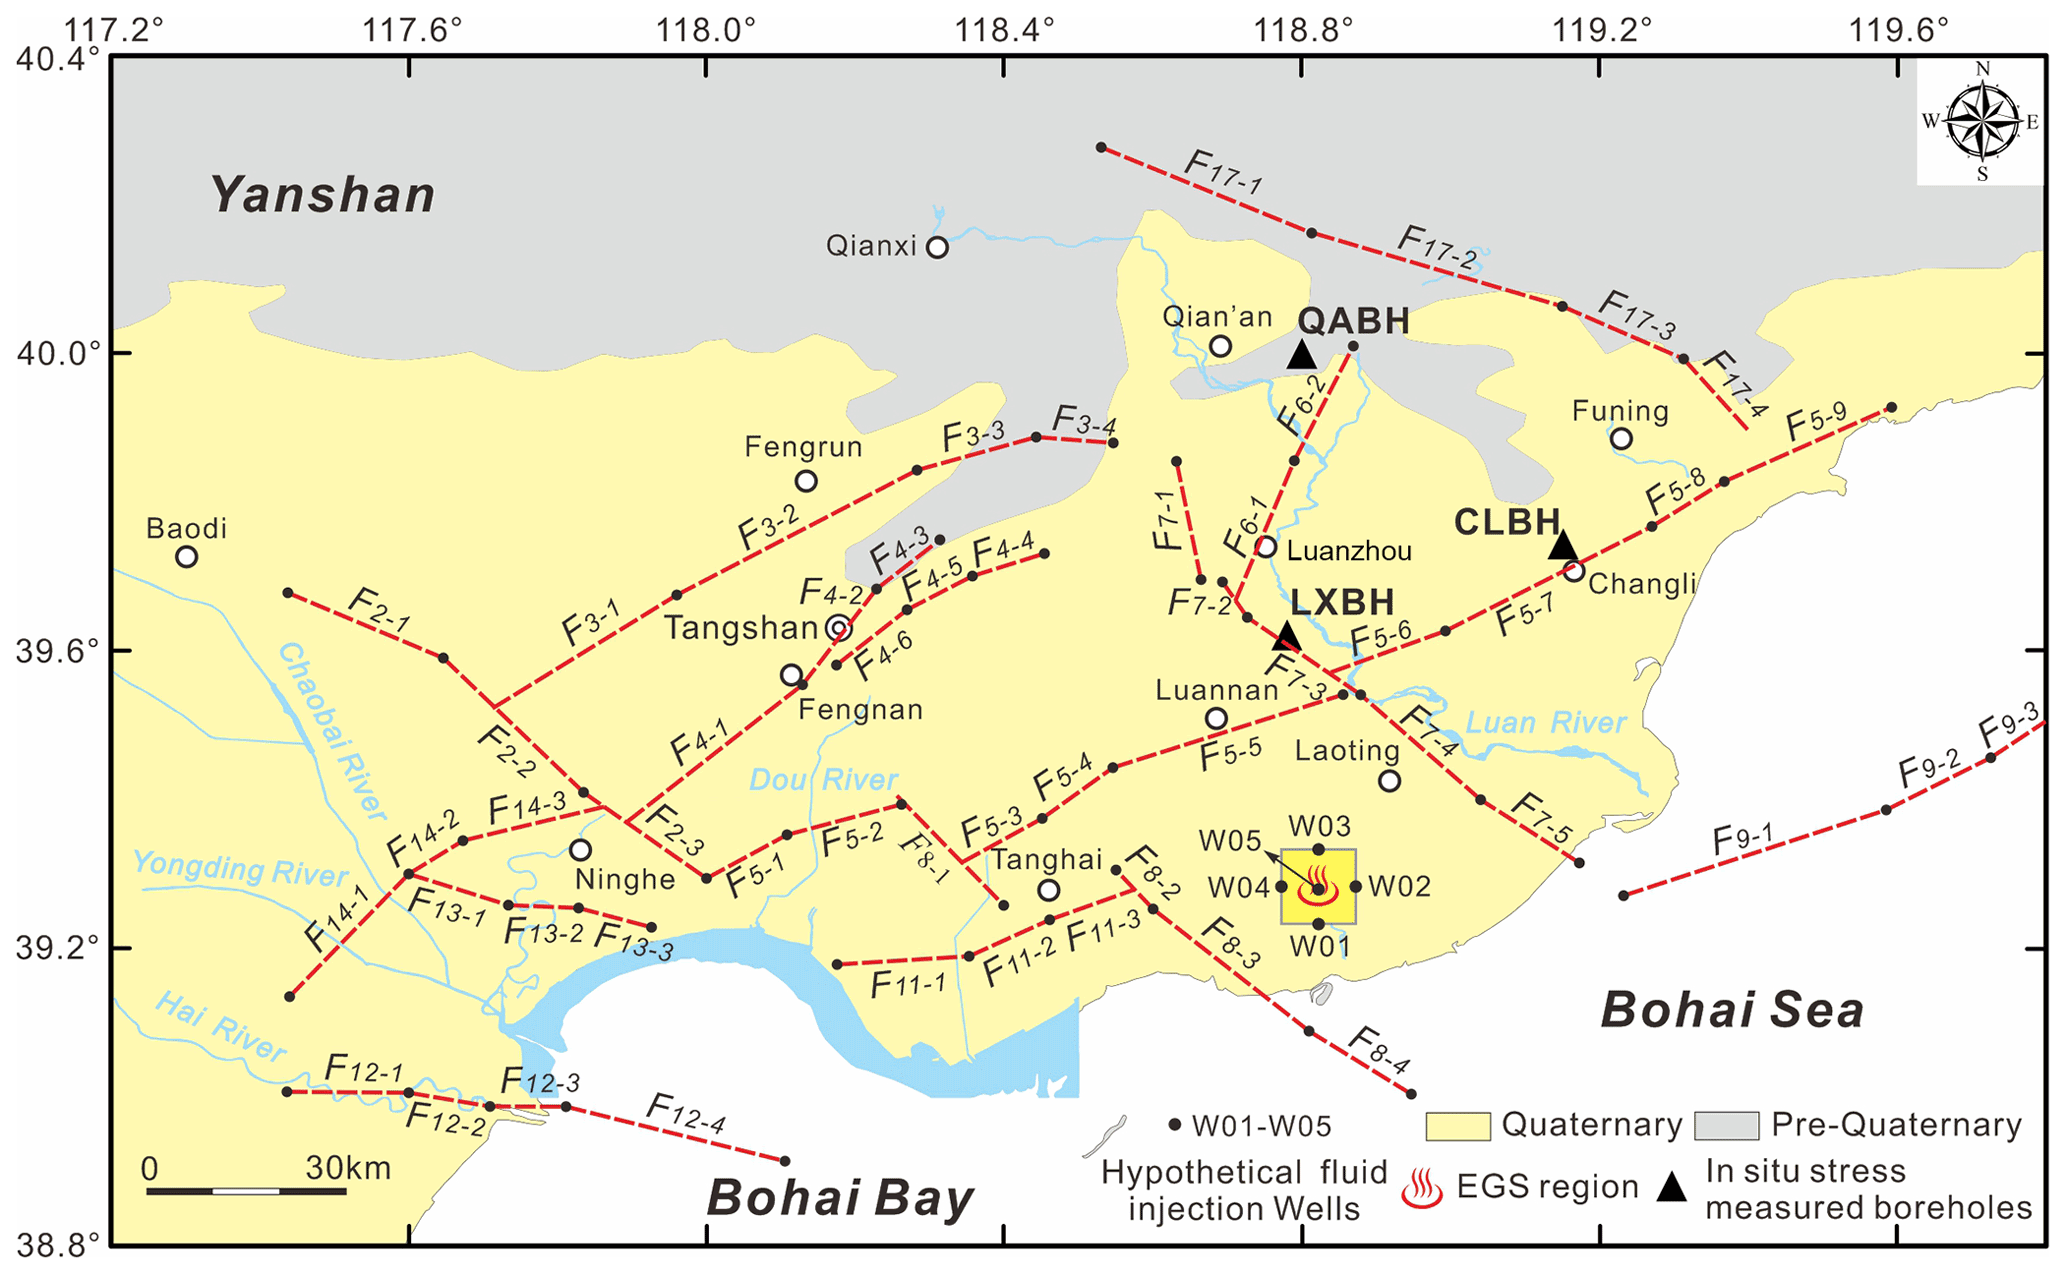
Figure 6Simplified segmental faults with different strikes in the Tangshan seismic region. There are a total of 53 segments used for calculating the fault slip potential (fsp).
We first apply the deterministic geomechanical function of the FSP tool to estimate the slip potential of the main active faults in the Tangshan seismic region in the absence of fluid injection. As shown in Eqs. (6) and (7), the maximum (σH) and minimum (σh) horizontal stress gradients are 0.0278 and 0.0183 MPa m−1, respectively. The vertical stress (σv) gradient is 0.0265 MPa m−1, and the initial pore pressure (P0) gradient is taken as 0.01 MPa m−1 (Fig. 5). The reference depth for these calculations is 3965 m, which is the depth of the uppermost boundary of the MTY EGS. We used a critical friction coefficient (μ) value of 0.4 (Fig. 4). The orientation of the maximum principal stress, 83∘ E (Fig. 3b), is also added to the stress database.
Figure 7 shows the results of a deterministic geomechanical assessment of the fault pore pressure required to generate fault slip across the Tangshan seismic region. We find that the active faults will not all instantaneously slip in the present stress field and natural pore pressure conditions (Fig. 7a). However, the deterministic pore pressures required to cause slip on each fault segment vary with the different fault strikes (Fig. 7b). About 23 % of the faults striking NE or WNW are likely to slip in response to a small fluid pressure increase (ΔP of 2.58–4.93 MPa); some of these more critical faults include the F4−1, F4−3, and F4−6 segments of the Tangshan fault belt (ΔP of 2.58–2.85 MPa); the F5−3, F5−4, and F5−8 segments of the Changli–Ninghe fault (ΔP of 3.25–4.93 MPa); and the F17−1, F17−2, and F17−3 segments of the Lengkou fault (ΔP of 4.49–4.72 MPa) (Fig. 7c). Many (∼49 %) of the NE–ENE- or WNW-striking faults are likely to slip in response to a modest pore pressure increase (ΔP of 5.40–10.70 MPa); some examples of these faults include the Yejituo fault (F3) (ΔP of ∼5.47–6.15 MPa), the Haihe fault (F12) (ΔP of ∼6.67–10.70 MPa), and the Qinbei fault (F9) (ΔP of ∼5.41–6.39 MPa) (Fig. 7c). Nearly 19 % of the faults will likely slip at a large pore pressure perturbation (ΔP of 12.38–19.54 MPa); an example of these less sensitive faults is the northwestern segment of the Baigezhuang fault (F8) (Fig. 7c). The deterministic geomechanical assessment of the fault pore pressure required to generate slip is listed in Table S2.
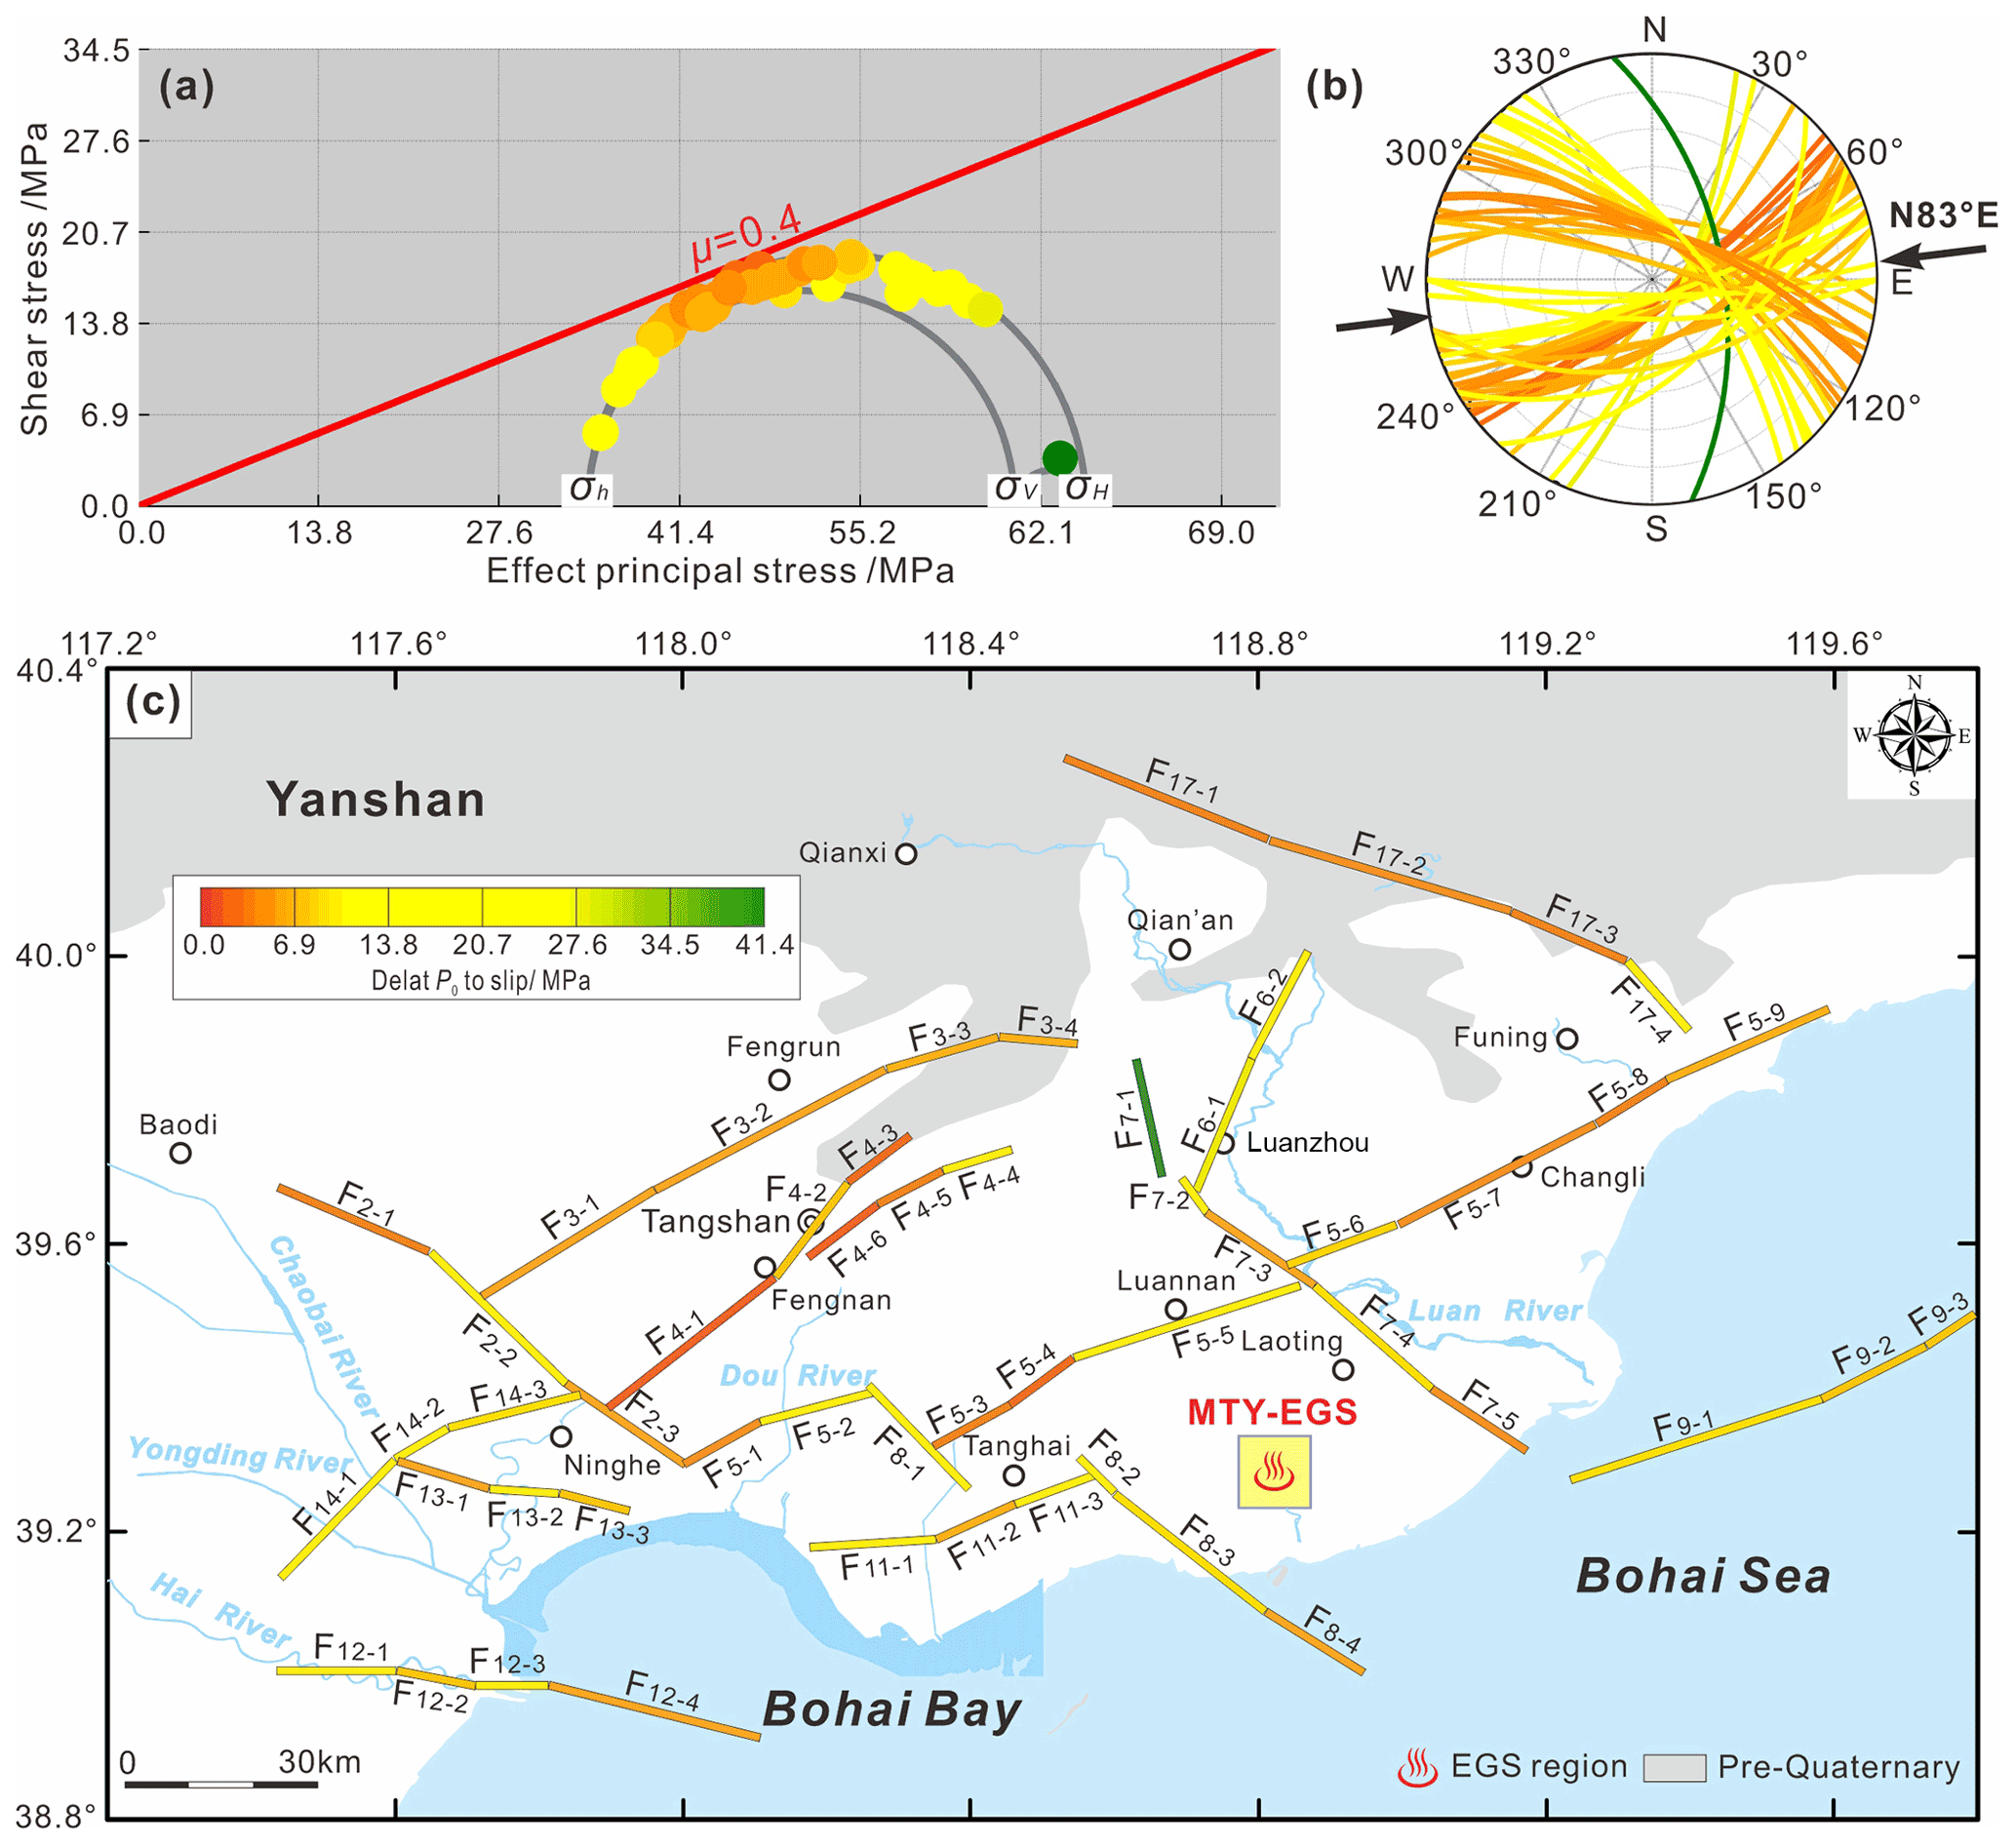
Figure 7The results of a deterministic geomechanical assessment of fault pore pressure to slip across the Tangshan seismic region. (a) The faults shown on a Mohr diagram, with effective compressive stress on the horizontal axis and shear stress on the vertical axis; principal stresses are labeled in black, and the frictional slip line is shown in red. Faults are colored by their horizontal distance to slip in megapascals (according to the color scale). (b) Fault-normal orientations plotted on a lower-hemisphere equal-angle stereonet as arcs; the azimuth of maximum horizontal compression is shown with black arrows. (c) The same faults mapped and colored by deterministic fluid pore pressure to slip.
5.2 Probabilistic fault slip potential in the Tangshan seismic region under the present stress field
Because the deterministic model ignores some uncertainties that are often present in the strike, dip, ambient stress field, and the coefficient of friction (Walsh and Zoback, 2016; Lund Snee and Zoback, 2018), the deterministic geomechanical results are not entirely reliable. To minimize these uncertainties, we use a probabilistic geomechanical function to estimate the fault slip potential (fsp) on each fault segment using a Monte Carlo-type analysis to randomly sample the specified uniform uncertainty distributions for the input parameters (Lund Snee and Zoback, 2018). A Monte Carlo approach is useful because it propagates the relevant uncertainties through the model, producing a distribution of pore pressure values that may result in fault slip (Walsh et al., 2017).
Qin et al. (2014) suggested that the gradients of σH and σh with depth are 0.0328 and 0.0221 MPa m−1 in and around the Beijing region, respectively. Huang et al. (2013) reported that the σH and σh gradients in the Zhangjiakou–Beijing–Bohai tectonic belt are approximately 0.0228 and 0.0159 MPa m−1, respectively. Considering that our study area is located in the eastern Beijing region and in the southeastern section of the Zhangjiakou–Beijing–Bohai tectonic belt, we infer that the linear σH and σh gradients near the MTY EGS field may vary between 0.0228–0.0328 and 0.0159–0.0221 MPa m−1, respectively.
Based on these assumptions, we can apply reasonable values and uncertainty ranges for the gradients of σH (0.0278±0.005 MPa m−1) and σh (0.0183±0.0024 MPa m−1) with depth. The fault strike and dip angles have uncertainties of ±5 and ±10∘, respectively; the coefficient of friction on each fault segment varies from 0.35 to 0.45 (average of 0.40±0.05), and the direction of the σ1 axis varies from 66∘ (ENE) to 100∘ (WNW) (average of ). An example of this type of analysis is shown in Fig. S1 in the Supplement for the Tangshan fault belt. The distribution of pressures required to cause slip on fault F4−1 is evaluated by randomly sampling the uniform distributions (shown in red) of the input parameter distributions for 1000 geomechanical models.
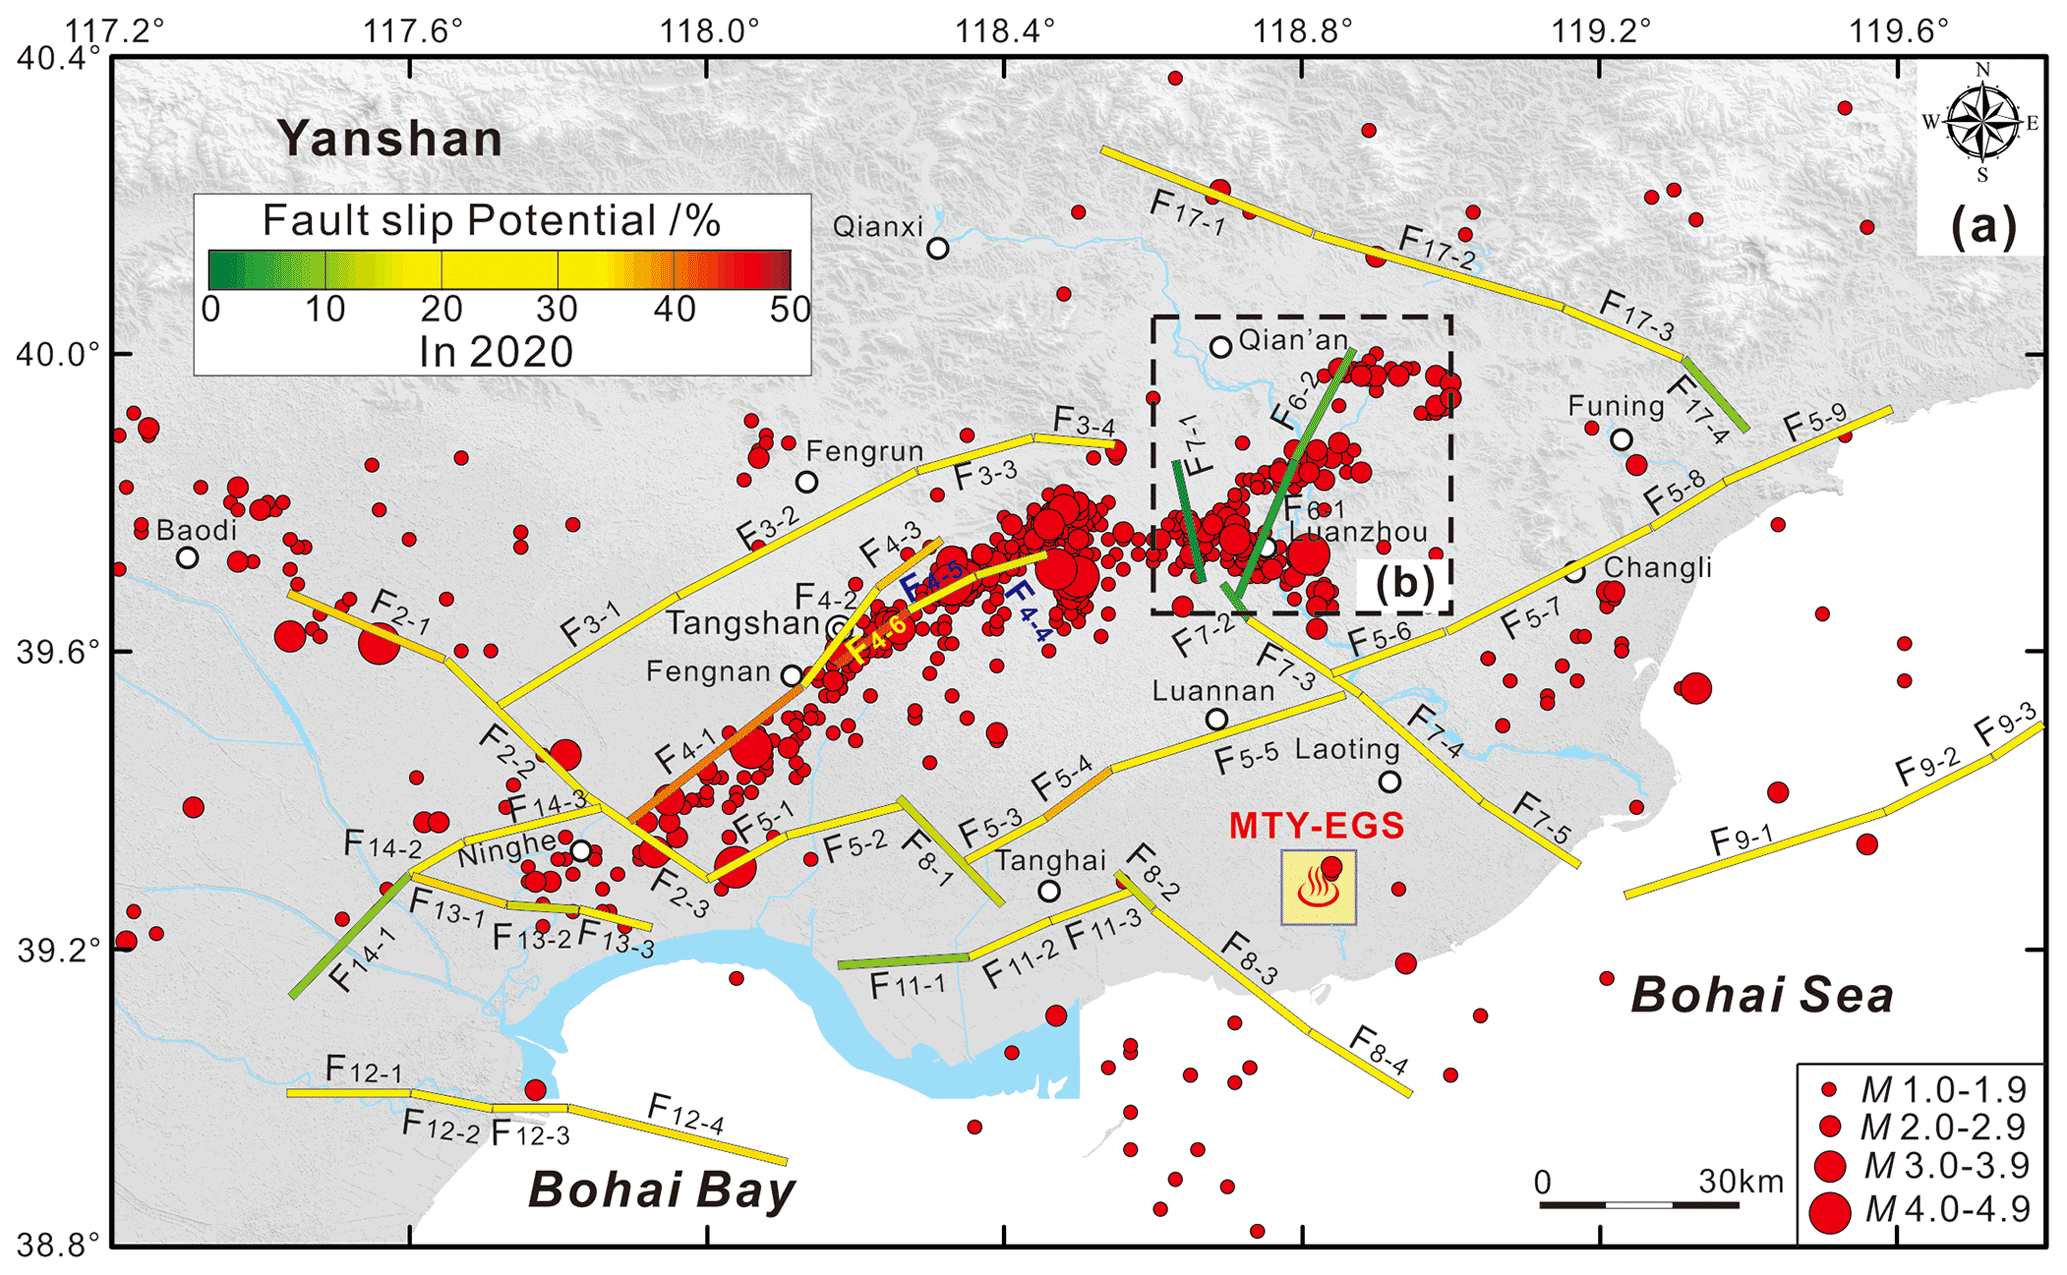
Figure 8The probabilistic fault slip potential on the mapped faults without any fluid pressure perturbation in 2020 and the recent earthquakes (2009–2019) with a magnitude of M 1.0-4.9 in the Tangshan seismic region (National Earthquake Data Center, China).
Figure 8 shows the results of our probabilistic fault slip analysis in the absence of fluid injection for 2020 with respect to the locations of recent earthquakes (2009–2019) with the magnitudes of M 1.0–4.9 in the Tangshan seismic region (National Earthquake Data Center, China). It is noteworthy that most of these earthquakes have occurred on mapped faults with relatively high fsp values; for example, the Tangshan fault belt (F4) has a 31 %–41 % probability of fault slip, the Jiyunhe fault (F2) has a 27 %–37 % probability of fault slip, and the northeastern segments of the Changli–Ninghe fault (F5−7, F5−8, F5−9) have a 23 %–35 % probability of fault slip (Fig. 8a). However, many earthquakes have also occurred on mapped faults with lower fsp values; for example, the Lulong fault (F6) and the northwestern end of the Luanzhou–Laoting fault (F7−1) have only a 5 % and 3 % probability of fault slip, respectively (Fig. 8b).
As shown in Fig. S2, we find that the probability of the fault slip potential on mapped faults F6−1, F6−2, F7−1, and F7−2 is very sensitive to the σH azimuth. In the present stress field with a σH orientation of , the fsp values on faults F6−1, F6−2, F7−1, and F7−2 are inconsistent with the high number of earthquakes observed in the Lulong Basin (Fig. 8b); from this observation, we conclude that local stress field variations are responsible for these moderate–small events. If the σH azimuth changes from to in the Lulong Basin, the probability of fault slip on faults F6−1 and F6−2 increases to 32 %–34 % (Fig. S3a). Additionally, if the σH azimuth changes from to in the Lulong Basin, the probability of fault slip on faults F7−1 and F7−2 increases to 24 %–25 % (Fig. S3b). Generally, the results shown in Fig. S3 suggest that the complex local stress field in the Lulong Basin heavily influences the fault slip potential and the earthquake activity in this area. Using the focal mechanisms from the 1982 Lulong M 6.2 earthquake and its aftershocks, Li et al. (2006) investigated the local stress field in the Lulong Basin. They found that the maximum principal stress (σ1) axis orientation changed to 43∘ E in the northern part of the Lulong Basin; this orientation is distinctly different from the dominant orientation of the regional tectonic stress field in the Tangshan seismic region (ENE–EW).

Figure 9(a) Fluid pressure perturbations from five injection wells linearly superposed onto the mapped domain of the Tangshan seismic region in 2050. (b) Increase in fluid pore pressure above natural levels due to fluid injection in each of the five wells as a function of distance in model year 2050.
5.3 Fluid pore pressure perturbations caused by fluid injection in the MTY EGS field
The MTY EGS field lies in the gneiss unit of the Baimiaozi Series in the Dantazi Group of the Archean Eon and has an area of 80 km2 at the depth of 4000 m (Qi et al., 2020; Zhang et al., 2020). The thickness of the preliminary hydraulic stimulation test is 35 m (depth range of 3965–4000 m) (Wang et al., 2013; Zhang et al., 2014). As a further simplification, horizontal two-dimensional flow is assumed. In addition, at the depth interval of 3965–4000 m, the gneiss is well compact and intact with fewer pre-existing fractures (Zhang et al., 2022). In these respects, the MTY EGS unit can be taken as an infinite and isotropic reservoir. Thus, the Hsieh and Bredehoeft (1981) hydrology model (Eqs. 2 and 3) should be acceptable for the MTY EGS field.
The necessary hydrological parameters are the injection formation thickness and the porosity and permeability of the injection layer. The average pre-enhancement porosity of the gneiss in the MTY EGS field is equal to 6.9 % (Zhou, 2003; Cao, 2016). The fractured reservoir permeability is closely related to the apertures of the fractures and the average spacing between fractures (Murphy et al., 1999). The actual fracture aperture mainly ranges from 0.05 to 2 mm, while the fracture spacing usually ranges from several meters to dozens of meters (Murphy et al., 1999; Sanyal and Butler, 2005). For a parallel fracture set, the average reservoir permeability theoretically ranges from 1 to 100 000 mD (D denotes darcy units) (Zeng et al., 2013). Based on data from the oil and gas industry, however, the fracture permeability following enhancement generally falls in the range of 1–100 mD (Sanyal and Butler, 2005; Zeng et al., 2013; Yue et al., 2015). Due to the lack of existing permeability measurements in the MTY EGS field, we must rely on a reasonable estimate of the fracture permeability. In this study, we assume that the average fracture permeability of the MTY EGS field in the presence of hydraulic stimulation is equal to 100 mD.
Five hypothetical injection wells with identical injection rates (W01, W02, W03, W04, and W05 in Fig. 6) are placed in the MTY EGS region. The injection well data describe the injection rate profile of each well over time, from 1 January 2020 to 31 December 2050. Evans et al. (2012) determined many injection parameters for large induced earthquakes that were caused by fluid injection in geothermal and CO2 reservoirs in Europe. Their results showed that the circulation injection rates associated with the largest-magnitude events ranged from 18–120 L s−1 (average of 51 L s−1). In this study, we used a fluid injection rate of 51 L s−1 (with a fluid density of 1000 kg m−3) to calculate the pore pressure diffusion near the MTY EGS field.
Figure 9 shows the fluid pressure perturbations from five injection wells linearly superposed onto the mapped domain of the Tangshan seismic region in 2050. The increasing fluid pressure due to injection into five wells varied between 0 and 11.56 MPa (Fig. 9a). Furthermore, the highest fluid pressure increases occur within ∼15–20 km of each injection well. However, beyond this range, the fluid pressure perturbations induced by fluid injection quickly decay to zero (Fig. 9b). Figures S4 and S5 also show the fluid pressure perturbations from the five injection wells linearly superposed onto the mapped domain in 2030 and 2040, respectively.
5.4 Probabilistic fault slip potential in the Tangshan seismic region in response to fluid injection in the MTY EGS field
In this section, we use the FSP v.1.0 program to determine the probability of the fault slip potential (fsp) on the mapped faults in the Tangshan seismic region via the Mohr–Coulomb mechanism, in response to a fluid-injected-related pore pressure increase in the MTY EGS field.
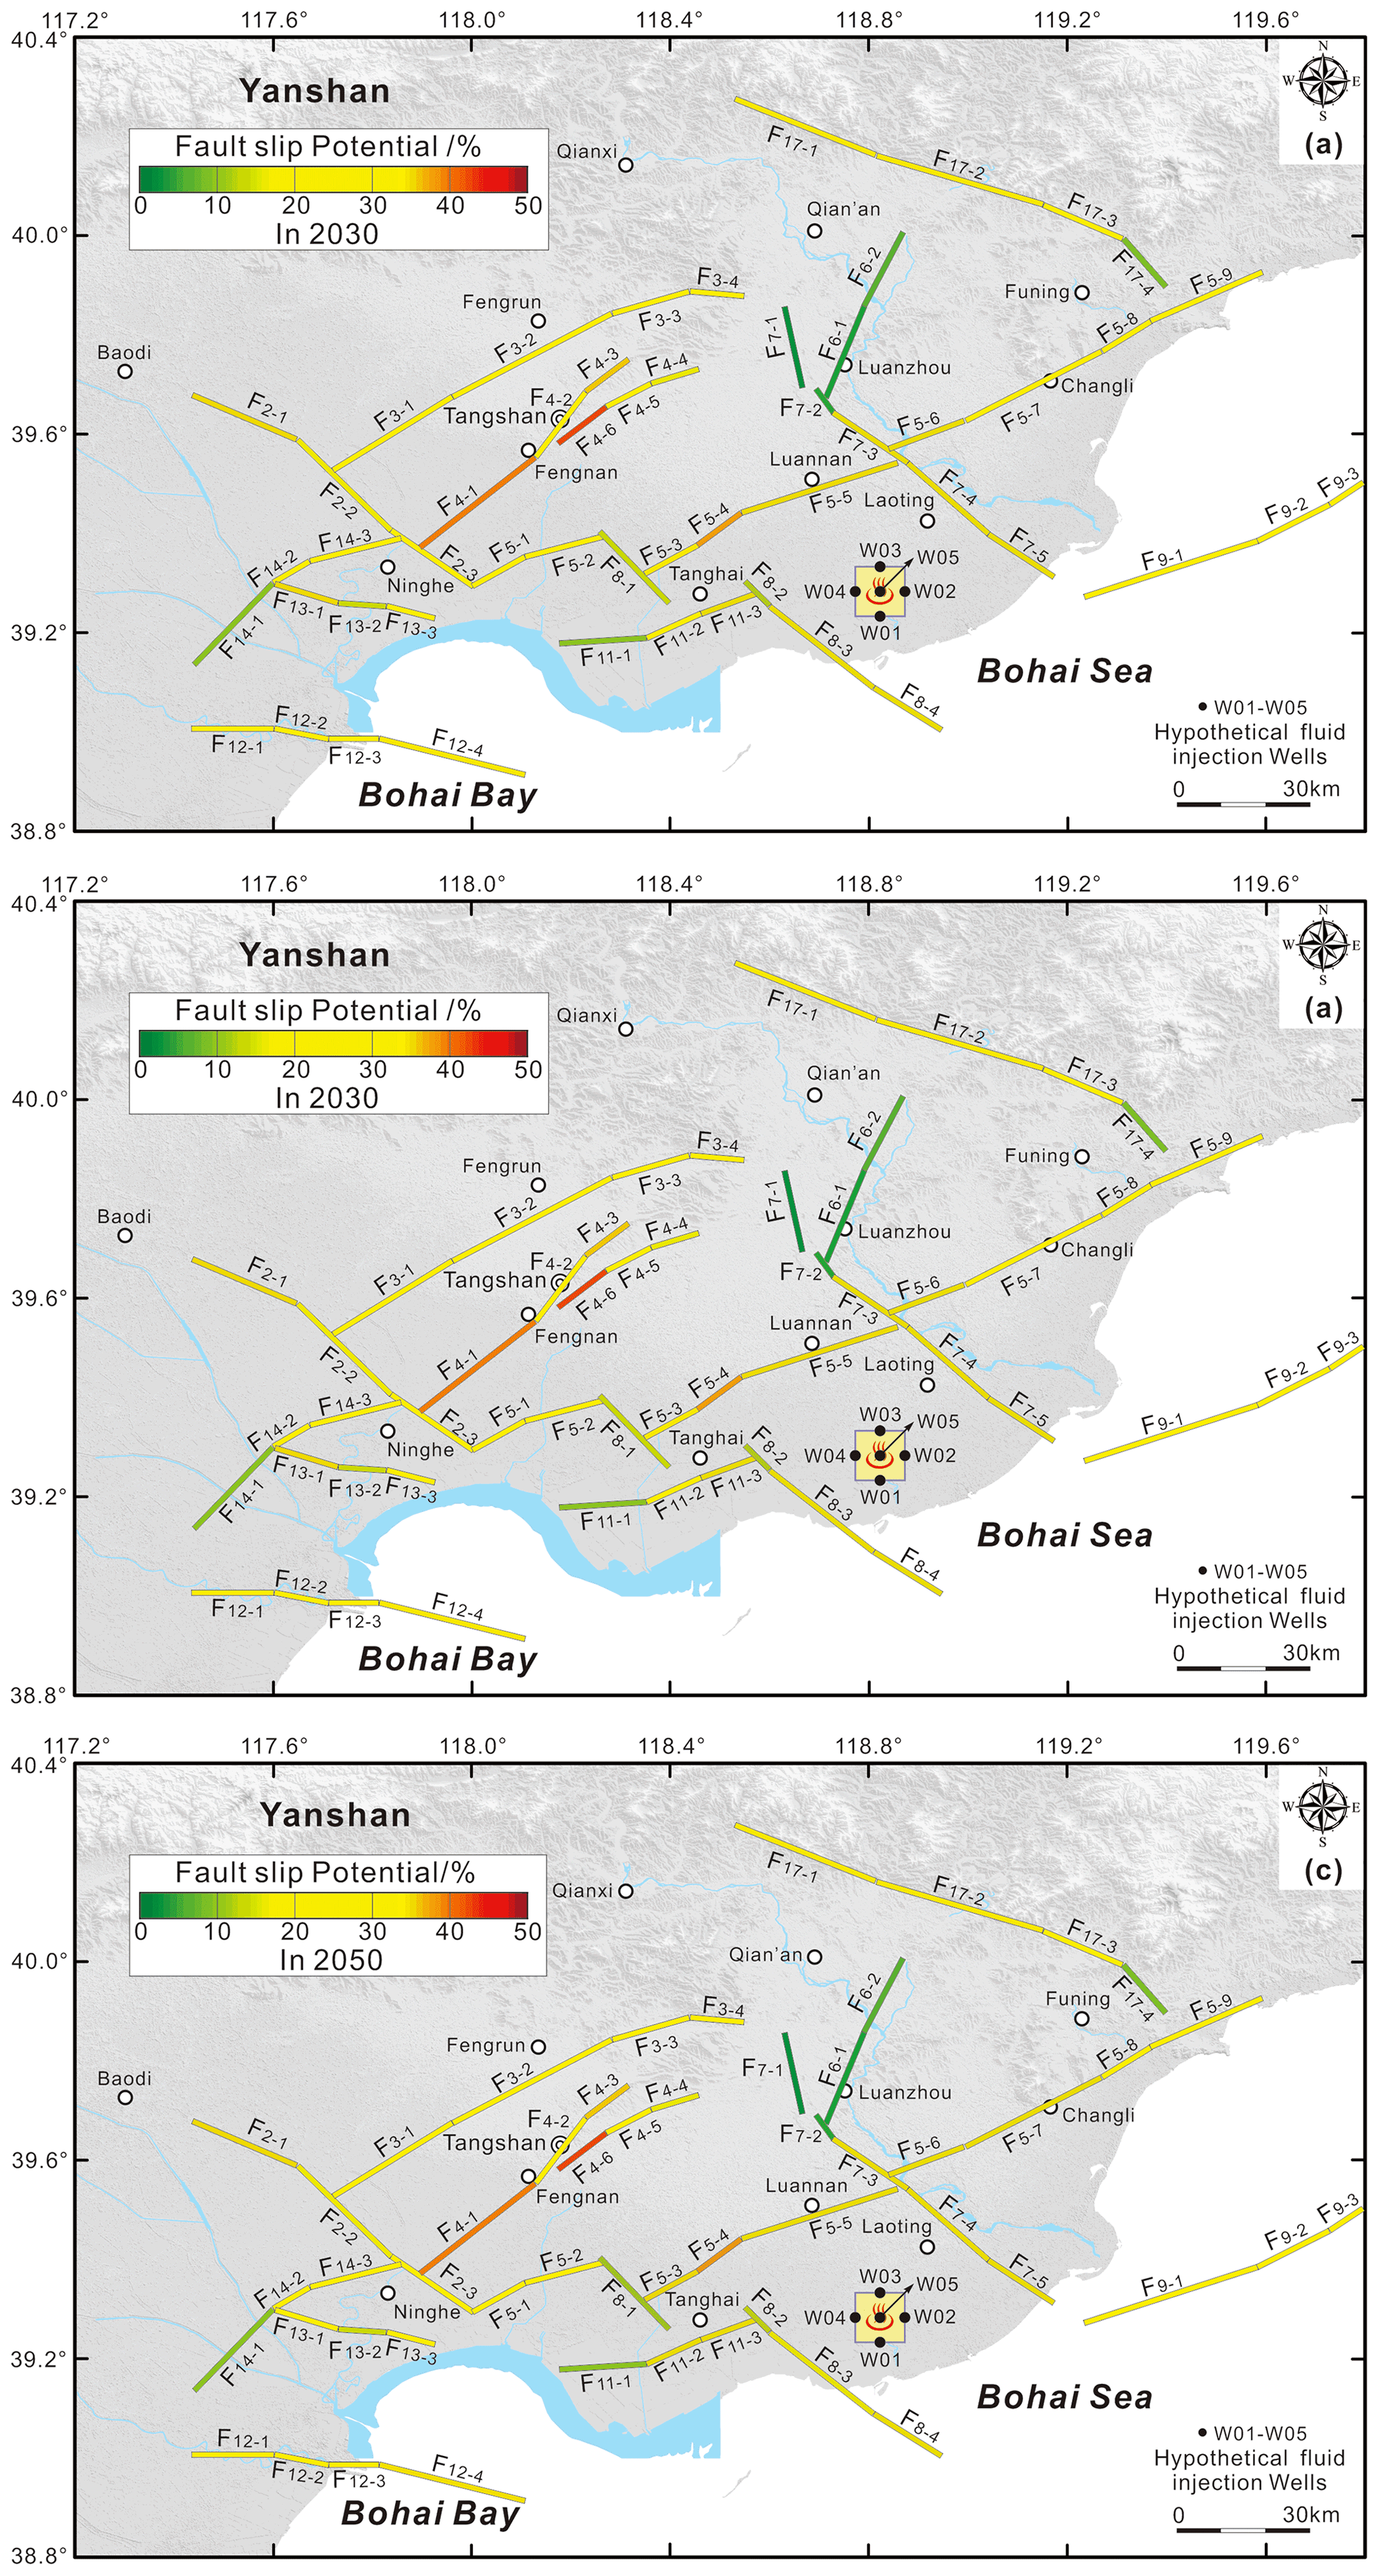
Figure 10The probabilistic fault slip potential on the mapped faults in response to the hypothetic fluid injection in the MTY EGS field in 2030 (a), 2040 (b), and 2050 (c).
Figure 10 presents the probabilistic fsp values in the presence of hypothetical fluid injection from 2030 to 2050. The detailed results are also listed in Table S3. A comparison of Fig. 10 with Fig. 8 (in 2020) suggests that the probabilistic fault slip potential on most of the active faults, such as the Jiyunhe fault (F2), the Yejituo fault (F3), the Tangshan fault belt (F4), the Lulong fault (F6), and the Xi'nanzhuang fault (F11), does not exhibit any obvious changes from 2020 to 2050 because they are more than 45 km away from the five injection wells (Table S3).
For the faults that are within ∼30–45 km of the injection wells, such as the F5−4 and F5−5 segments of the Changli–Ninghe fault, the probabilistic fsp values vary from 37 % in 2020 to 38 % in 2050 and from 18 % in 2020 to 19 % in 2050, respectively (Fig. S6a). Similarly, the probabilistic fsp values for the F7−4 and F7−5 segments of the Luanzhou–Laoting fault vary from 26 % in 2020 to 27 % in 2050 and from 32 % in 2020 to 33 % in 2050, respectively (Fig. S6b). Additionally, the probabilistic fsp values on the F8−3 segment of the Baigezhuang fault changes from 23 % in 2020 to 25 % in 2050 (Fig. S6c), while the fsp value does not change at all on the F11−2 and F11−3 segments of the Xi'nanzhuang fault (Fig. S6d). Overall, the hypothetical fluid injections only weakly impact the probabilistic fsp values for the mapped faults at distances greater than ∼30–45 km away from the hypothetical injection wells in the MTY EGS field.
5.5 Probabilistic fault slip potential in the MTY EGS field due to fluid injection
As mentioned previously, the fsp values for most active faults in the Tangshan seismic region increased very little in response to sustained fluid injections from 2020 to 2050 because they were located at distances greater than ∼30–45 km away from the injection wells in the MTY EGS field. Previous observations on injection-induced seismicity show that large-scale, field-wide injections may perturb faults and induce earthquakes at distances of ∼30–40 km away from the wells (Keranen et al., 2014; Goebel et al., 2017). Goebel and Brodsky (2018) suggested that fluid injection into sedimentary rocks can lead to larger and more distant earthquakes for a given volume of injection; this behavior corresponds to a power-law-like behavior for areas with distances from wells that exceed 15 km. As such, we investigate the probabilistic fsp values for faults located within distances of ∼15–20 km away from the hypothetical injection wells in the MTY EGS field.
Previous work focusing on the seismic interpretation and the drilling strata for oil exploration has revealed valuable information pertaining to the structures of the main boundary faults near the MTY EGS field (≤20 km) (Zhou, 2003; Dong, 2011; Zhao, 2014). As shown in Fig. 11, the MTY EGS field is located in the central Matouying uplift (II), where it is bounded to the north by the Baigezhuang lower uplift (IV), to the south by the Shi'jiutuo depression (I), and to the northeast by the Laoting depression (III and V). The boundary faults of these tectonic units (Fig. 11a), such as boundary faults Fb1–Fb6 between the Matouying uplift and the Shi'jiutuo depression and faults Fb8–Fb14 between the Matouying uplift and the Baigezhuang lower uplift, are mainly characterized as normal faults with large dips (Fig. 11b). Based on these field studies, we have determined the locations, lengths, strikes, and dips of the main boundary faults near the MTY EGS field. The various strikes of the 20 different fault segments are shown in Fig. 11a. The three-dimensional geometries of these boundary faults that are used to calculate the probabilistic fsp values are listed in Table 5. We also utilize the FSP v.1.0 program to estimate the probabilistic fsp values for these boundary faults using the same stress, hydrology, and injection well conditions as described previously.
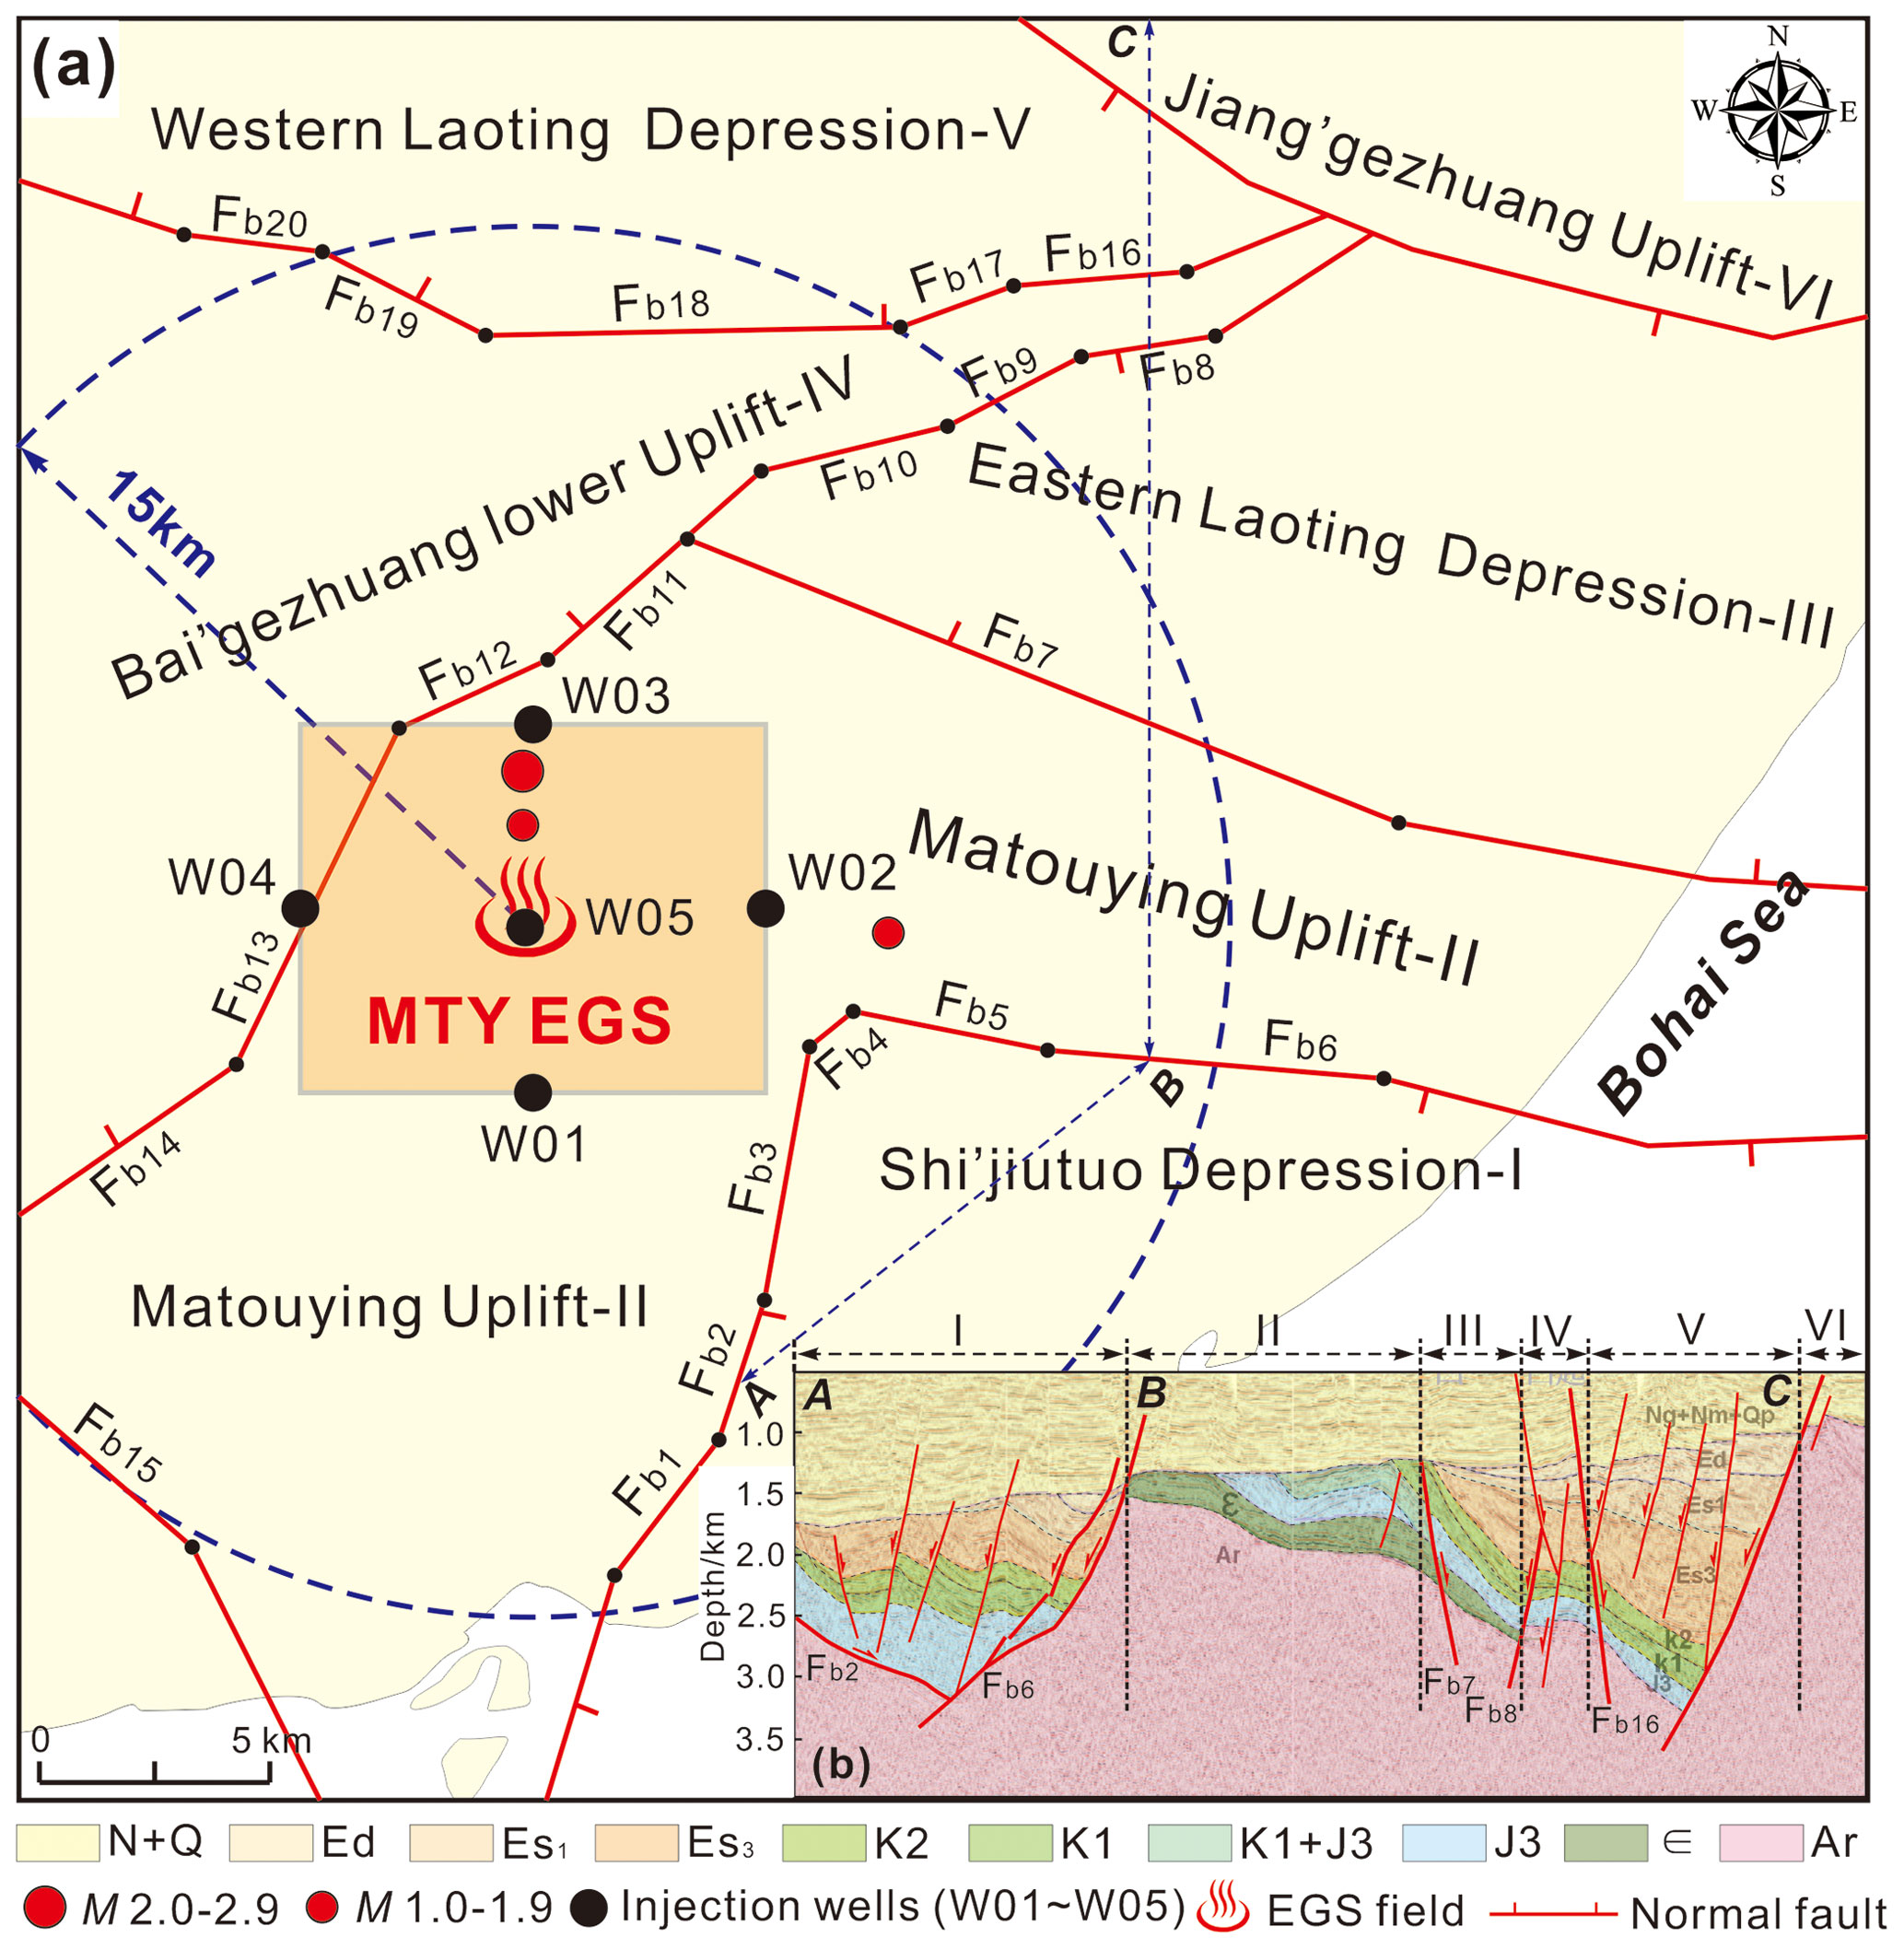
Figure 11(a) Geological structures and active faults within a range of ∼15–20 km away from the MTY EGS field. (b) The structural framework of the Matouying uplift and its vicinity from integrated seismic and geological data interpretation.
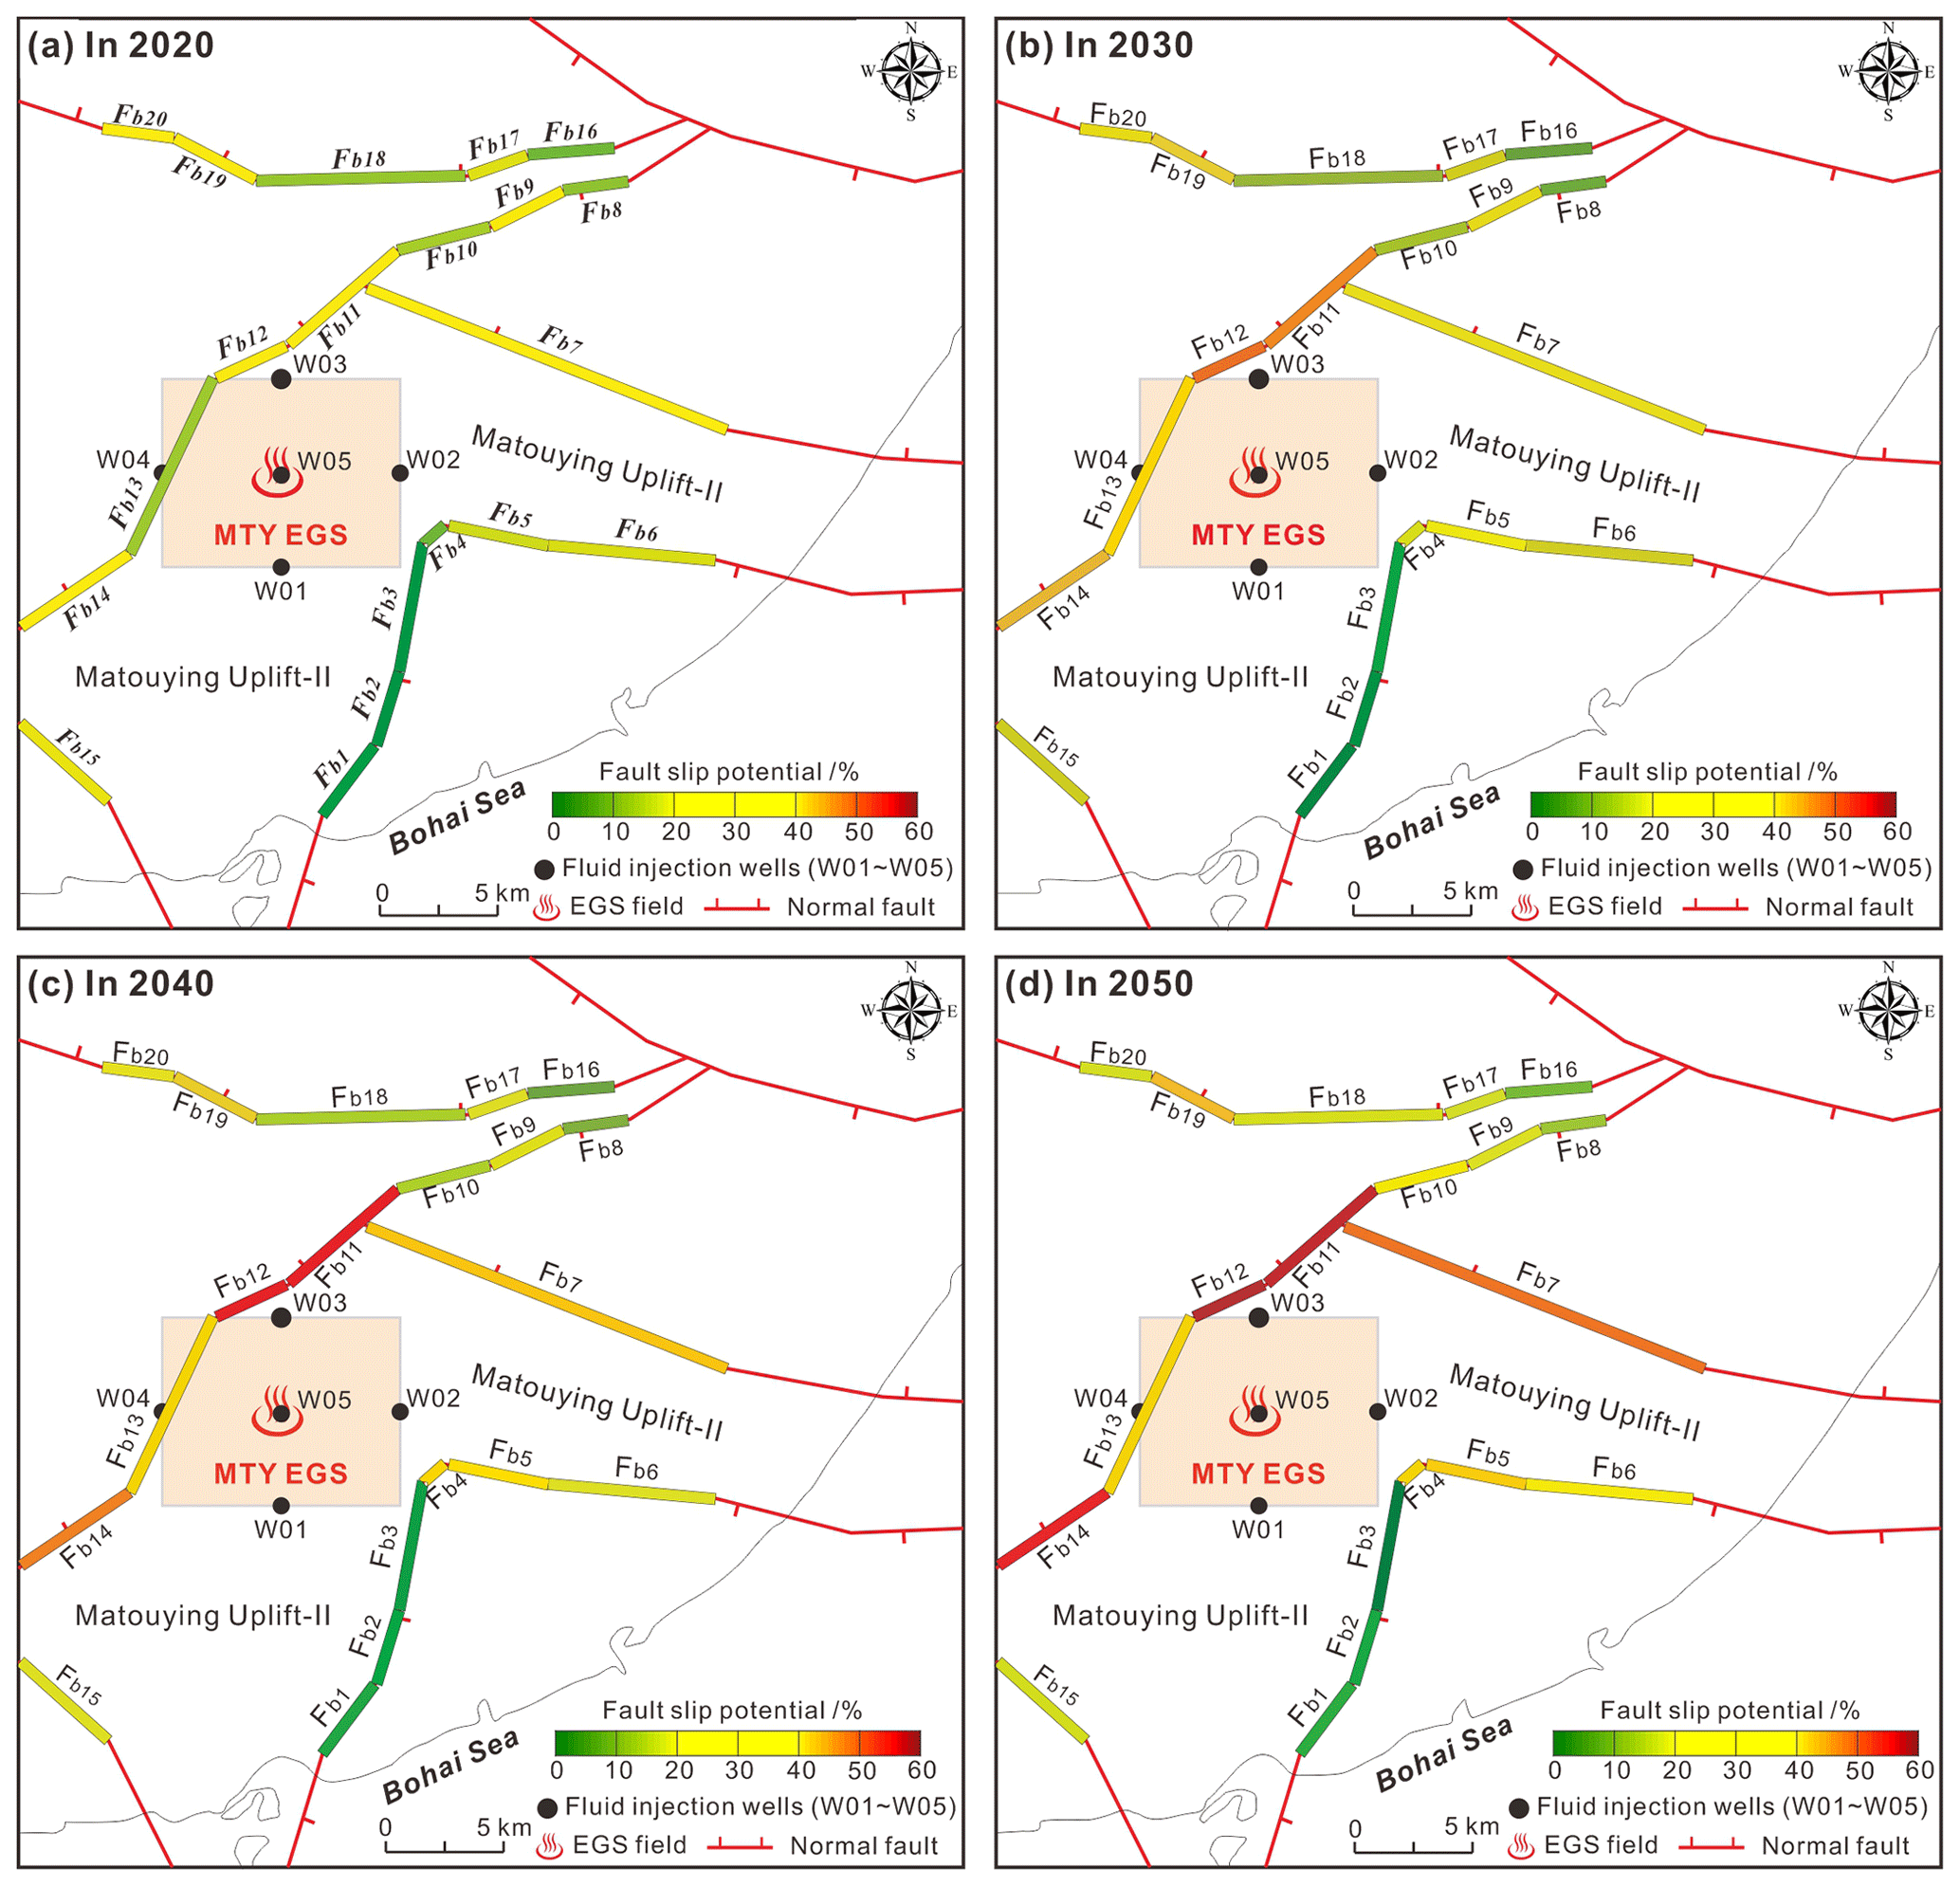
Figure 12The probabilistic fault slip potential on the mapped faults within a range of ∼15–20 km away from the MTY EGS field in response to the hypothetic fluid injection in 2020 (a), 2030 (b), 2040 (c), and 2050 (d).
Table 5The geological information of the main boundary faults used for calculating probabilistic fault slip potential in the MTY EGS field.
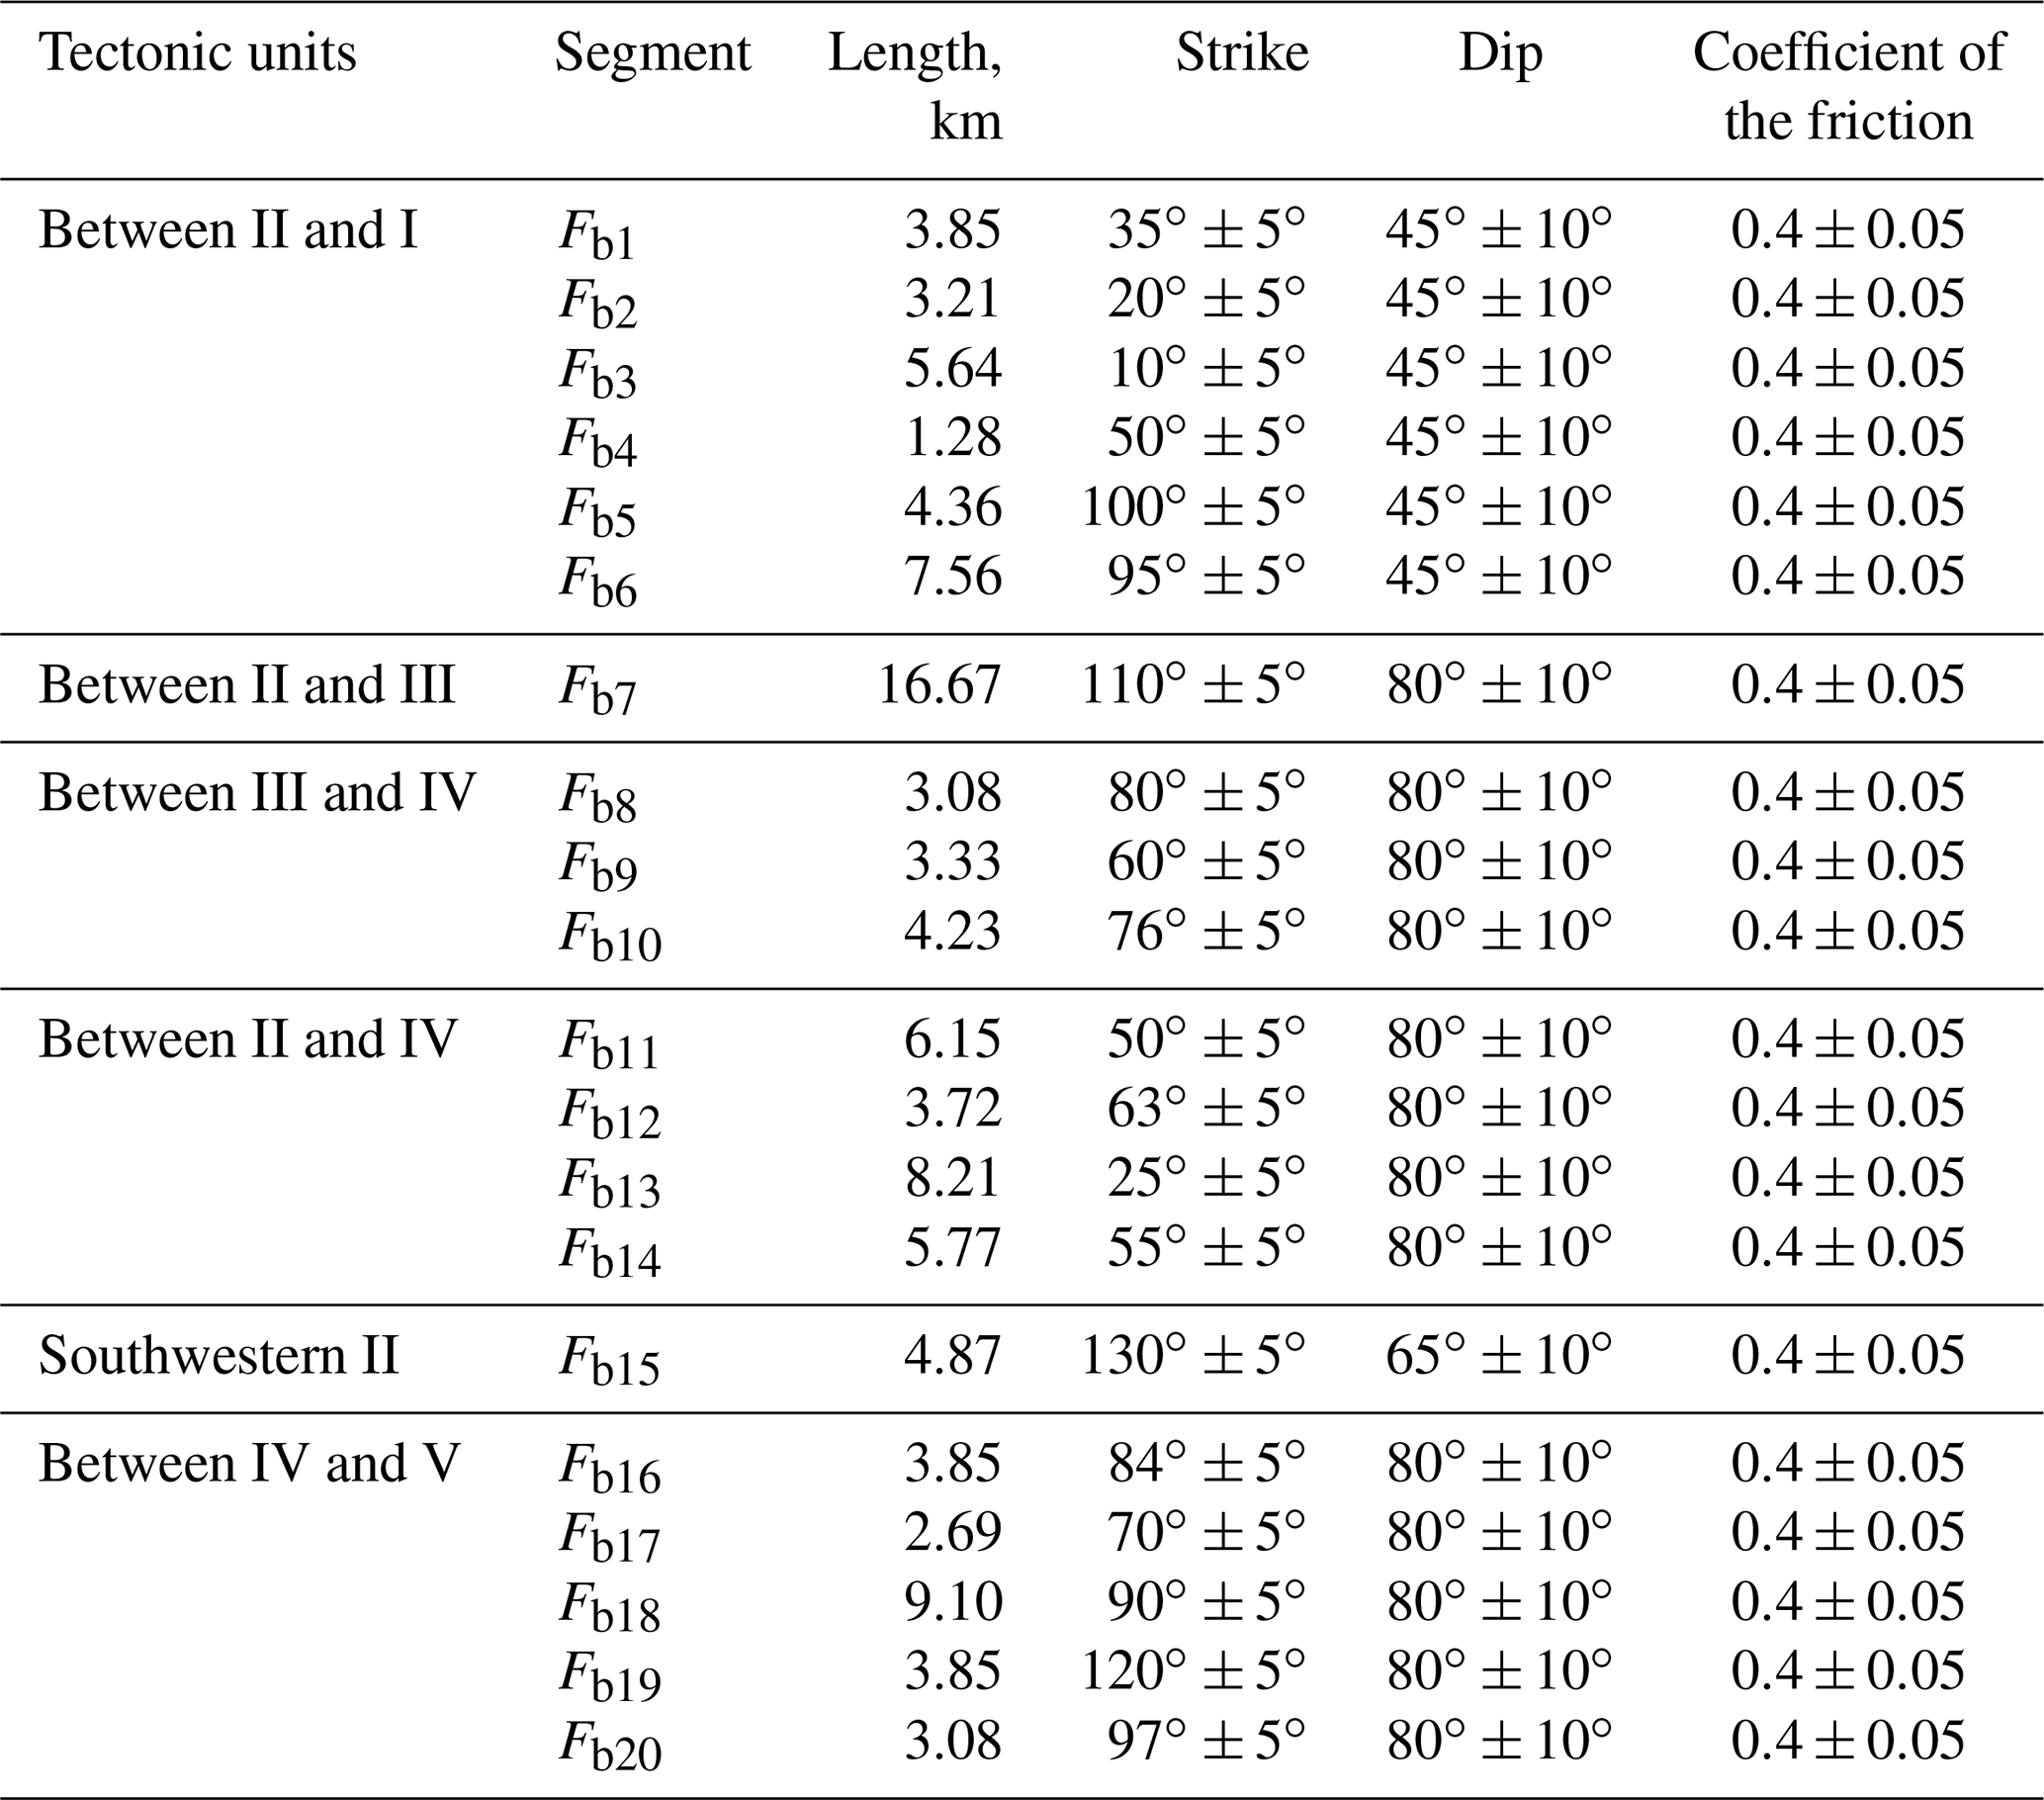
Figure 12 presents the probabilistic fsp values for the mapped faults near the MTY EGS field in 2020, 2030, 2040, and 2050. Figure S7 shows the fsp changes that have occurred on certain main boundary faults (e.g., Fb4–Fb6, Fb7, Fb8–Fb10, Fb11–Fb14, and Fb16–Fb20 segments) throughout the period of fluid injection. The detailed results are listed in Table S4. Our results suggest that with continuing fluid injection over time, the probabilistic fsp values on the boundary faults near the MTY EGS field will progressively increase, especially for those faults with well distances of less than 15 km. Additionally, the magnitude of the fsp changes varies with the fault strike and the distance from the injection wells. For example, the fsp values for Fb11, Fb12, and Fb13 (NE orientation) closest to injection wells W03 and W04 (with well distances ≤ 6 km) vary from 38.5 % in 2020 to 59.5 % in 2050, from 29.5 % in 2020 to 59.7 % in 2050, and from 11.1 % in 2020 to 35.1 % in 2050, respectively (Fig. S7d). These faults have the largest fsp changes between 2020 and 2050, with increases of 21 %, 30.2 %, and 24 %, respectively. However, the fsp values for faults Fb4 (NE orientation) and Fb5 (WNW orientation), which have similar well distances of 6 km of from injection wells W01 and W02, have smaller increases, with fsp values of 8.1 % in 2020 and 25 % in 2050 and 14.6 % in 2020 and 30.5 % in 2050, respectively (Fig. S7a). The increase in the fsp values for faults Fb4 and Fb5 are 16.9 % and 15.9 %, respectively. For fault Fb7, which is 7.5 km away from injection well W02, the fsp value varies from 35.5 % in 2020 to 47.8 % in 2050 (Fig. S7b).
Generally, the growth in the fsp values decays as the well distance increases. For example, faults Fb7 and Fb14, which are ∼6–10 km away from the injection wells, have fsp value increases of 11.8 % and 14.9 % (Fig. S7b and d). Faults Fb6, Fb9, Fb10, Fb15, Fb17, Fb18, Fb19, and Fb20, which are ∼10–15 km away from the injection wells, have fsp value increases that fall between 4.1 %–8.6 % (Fig. S7a, c, e, and f). Lastly, faults Fb8 and Fb16, which are ∼15–20 km away from the injection wells, have fsp value increases of 2.9 % and 2.0 % (Fig. S7c and e). However, faults Fb1, Fb2, and Fb3, which have NE orientations and well distances of ∼6–10 km, have very small fsp value increases of 0.1 %–2.0 % in 2020 and 0.1 %–3.6 % in 2050. The lower fsp values on these faults likely indicate that faults with a strike of NEN–NS experience additional fault stability and have higher fault strengths in the present ambient stress field.
6.1 Effect of injection rate on the fault slip potential in the MTY EGS field
The injection rates and volumes at single wells may be related to nearby earthquake activity (Walters et al., 2015). Earthquakes are more commonly associated with injection wells with high fluid injection rates (Weingarten et al., 2015). Furthermore, earthquakes tend to occur just after rapid increases in the injection rate (Kim, 2013). The likelihood of triggering earthquakes depends largely on the rate at which the pore pressure increases, rather than on the absolute magnitude of the pore pressure (Alghannam and Juanes, 2020). Moreover, high injection rates in neighboring wells can also cause a cumulative effect in the form of a large pressure halo that could trigger slip on potentially active faults (Keranen et al., 2014; Walters et al., 2015; Walsh and Zoback, 2015).
We calculated the fsp values for the fault segments that are closest to injection wells W01, W03, and W04 in 2030, 2040, and 2050 (Fb11, Fb12, Fb13, and Fb14) (Fig. 13), with different fluid injection rates ranging from 0 to 120 L s−1 in 20 L s−1 increments. As shown in Fig. 13, we found that the fsp values for these fault segments increase linearly with the fluid injection rate in 2030 (Fig. 13a), 2040 (Fig. 13b), and 2050 (Fig. 13c); the regression coefficients R2 vary between 0.961 and 0.999. Because the Fb13 fault segment has the smallest well distance of these four fault segments, this segment experiences the largest increases in the fsp gradient (%) versus fluid injection rate (L s−1); the gradient changes are 0.3857 in 2030, 0.5000 in 2040, and 0.5679 in 2050.
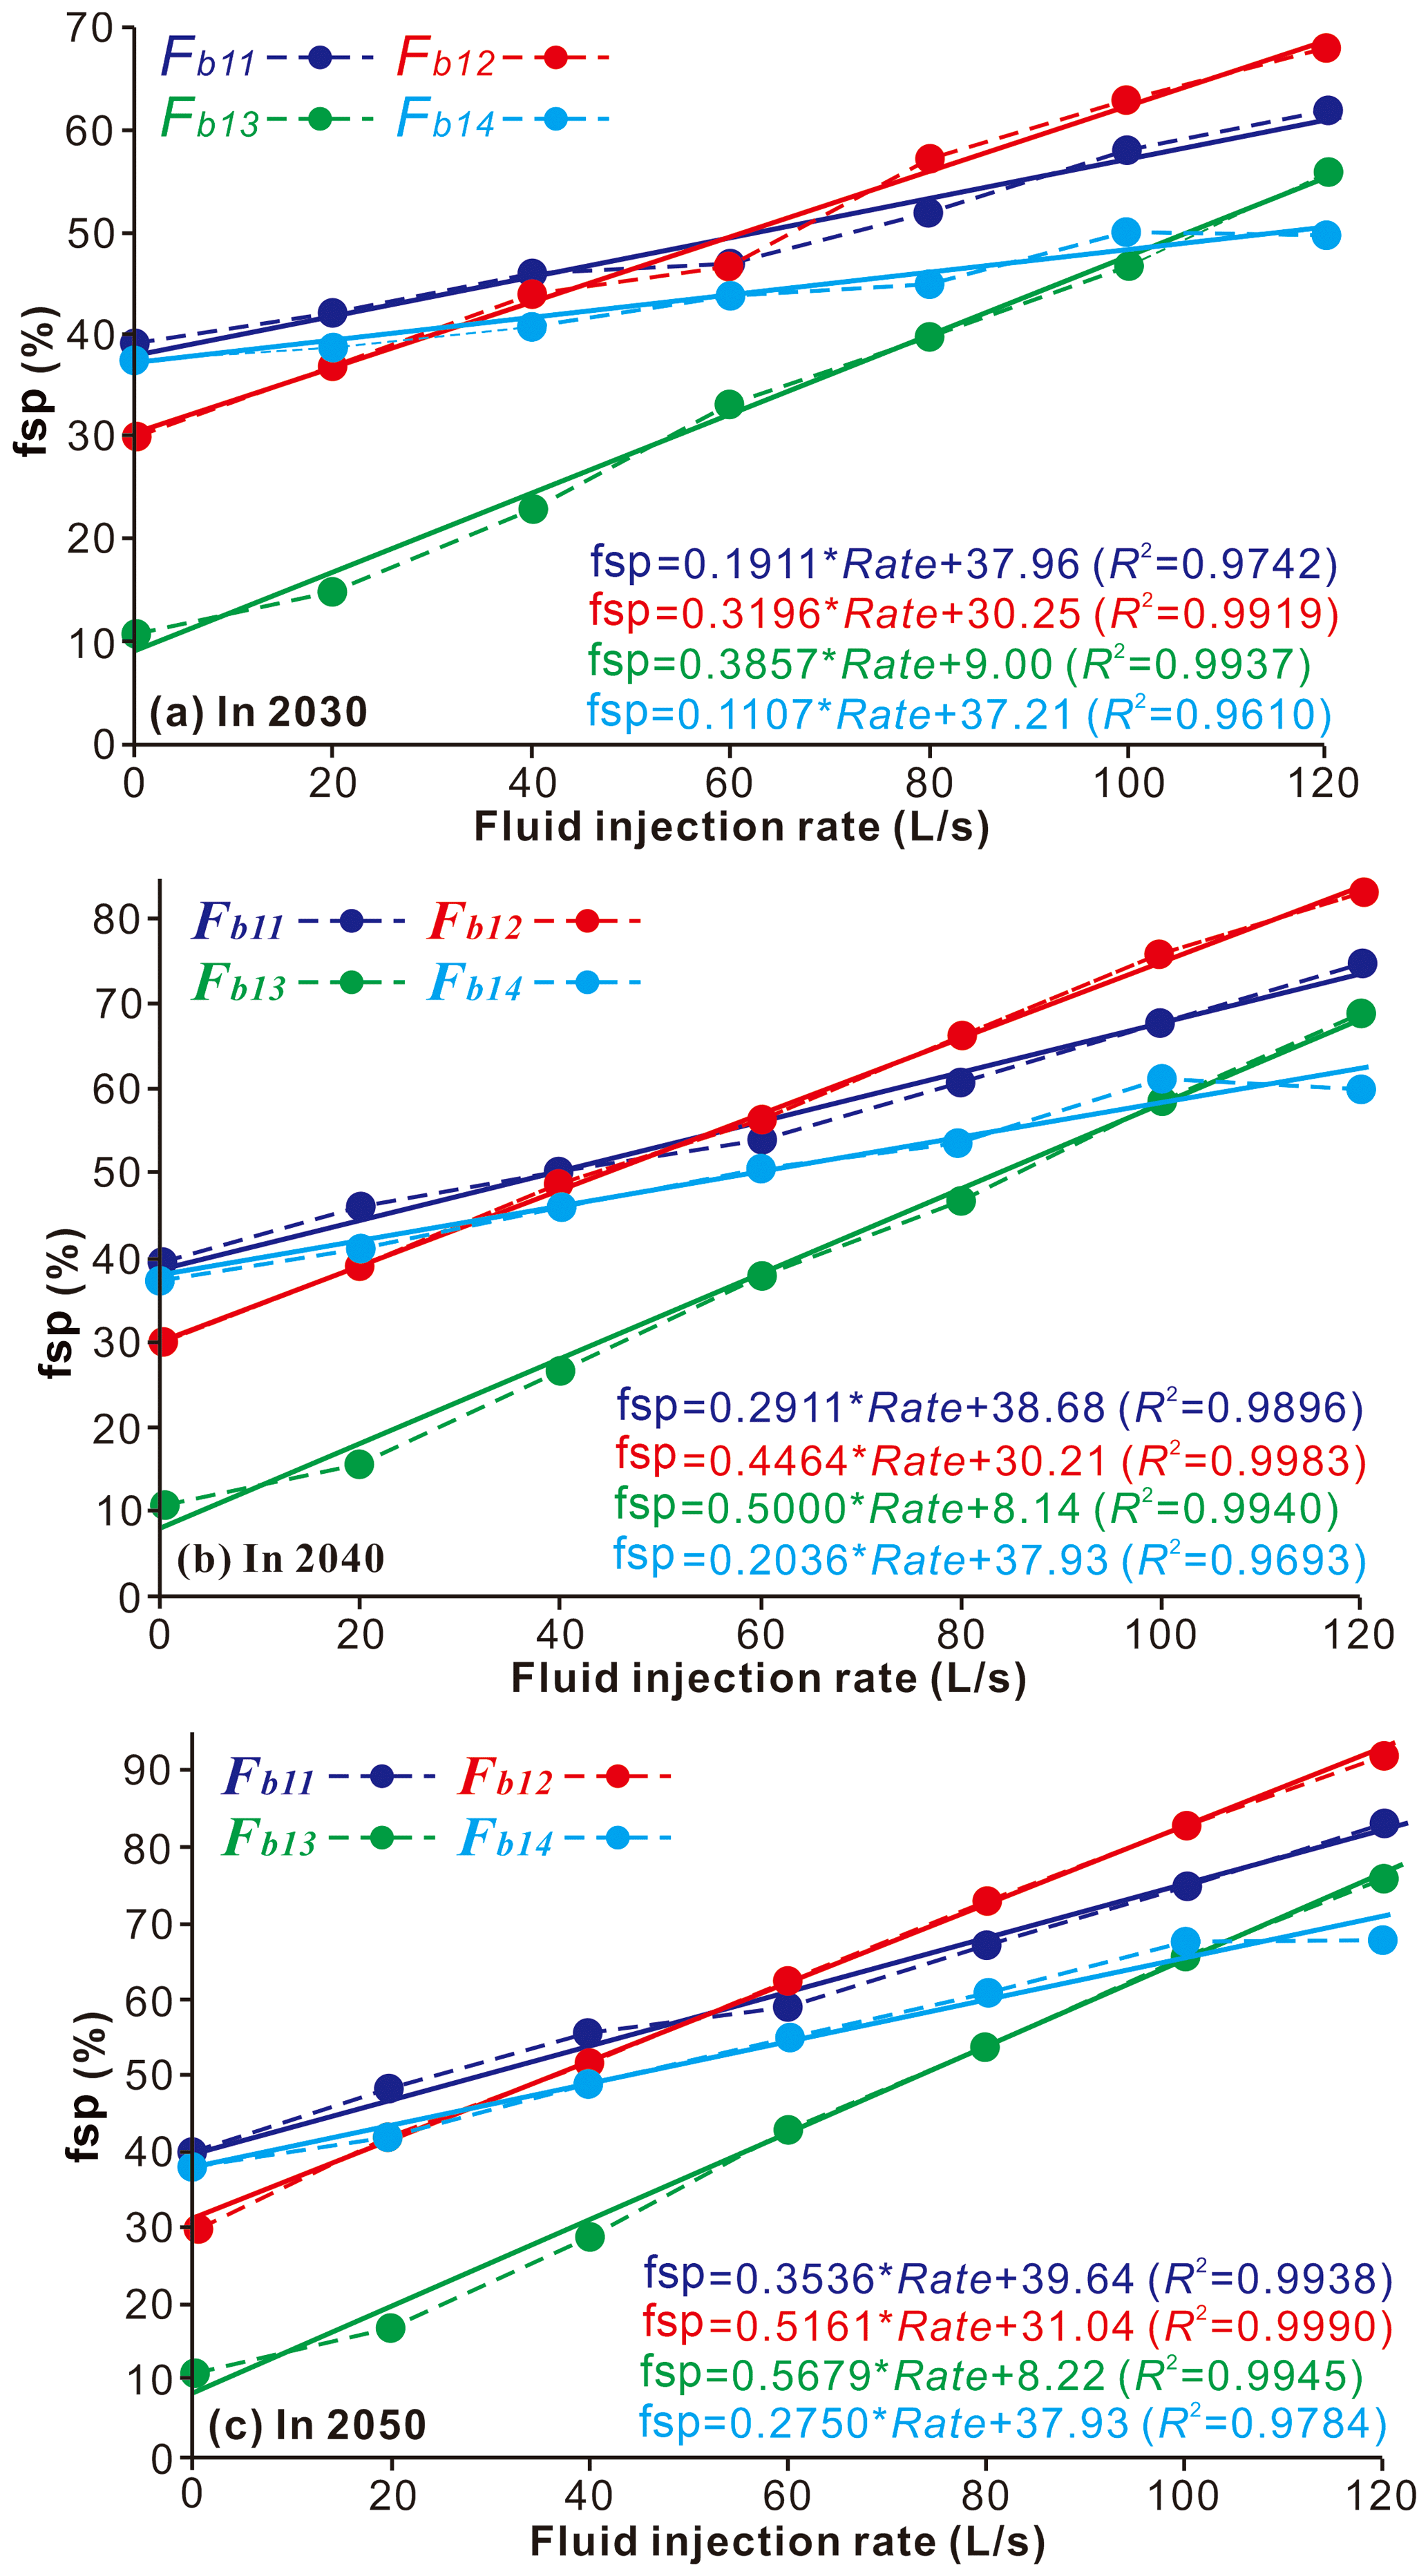
Figure 13The effect of the injection rate on probabilistic fault slip potential on the mapped faults Fb11, Fb12, Fb12, and Fb14, within a range of ∼6–10 km away from the MTY EGS field.
6.2 Effect of permeability on the fault slip potential in the MTY EGS field
As discussed previously, we calculated the fsp values for the Fb11, Fb12, Fb13, and Fb14 fault segments in response to hypothetical fluid injection near the MTY EGS field, assuming an average permeability of 100 mD. We must assume that there is some uncertainty in this permeability estimate. As such, we recalculated the probabilistic fsp values for fault segments Fb11, Fb12, Fb13, and Fb14 in 2030, 2040, and 2050, with permeability values ranging from 10 to 250 mD in 10 mD increments (Fig. 14).
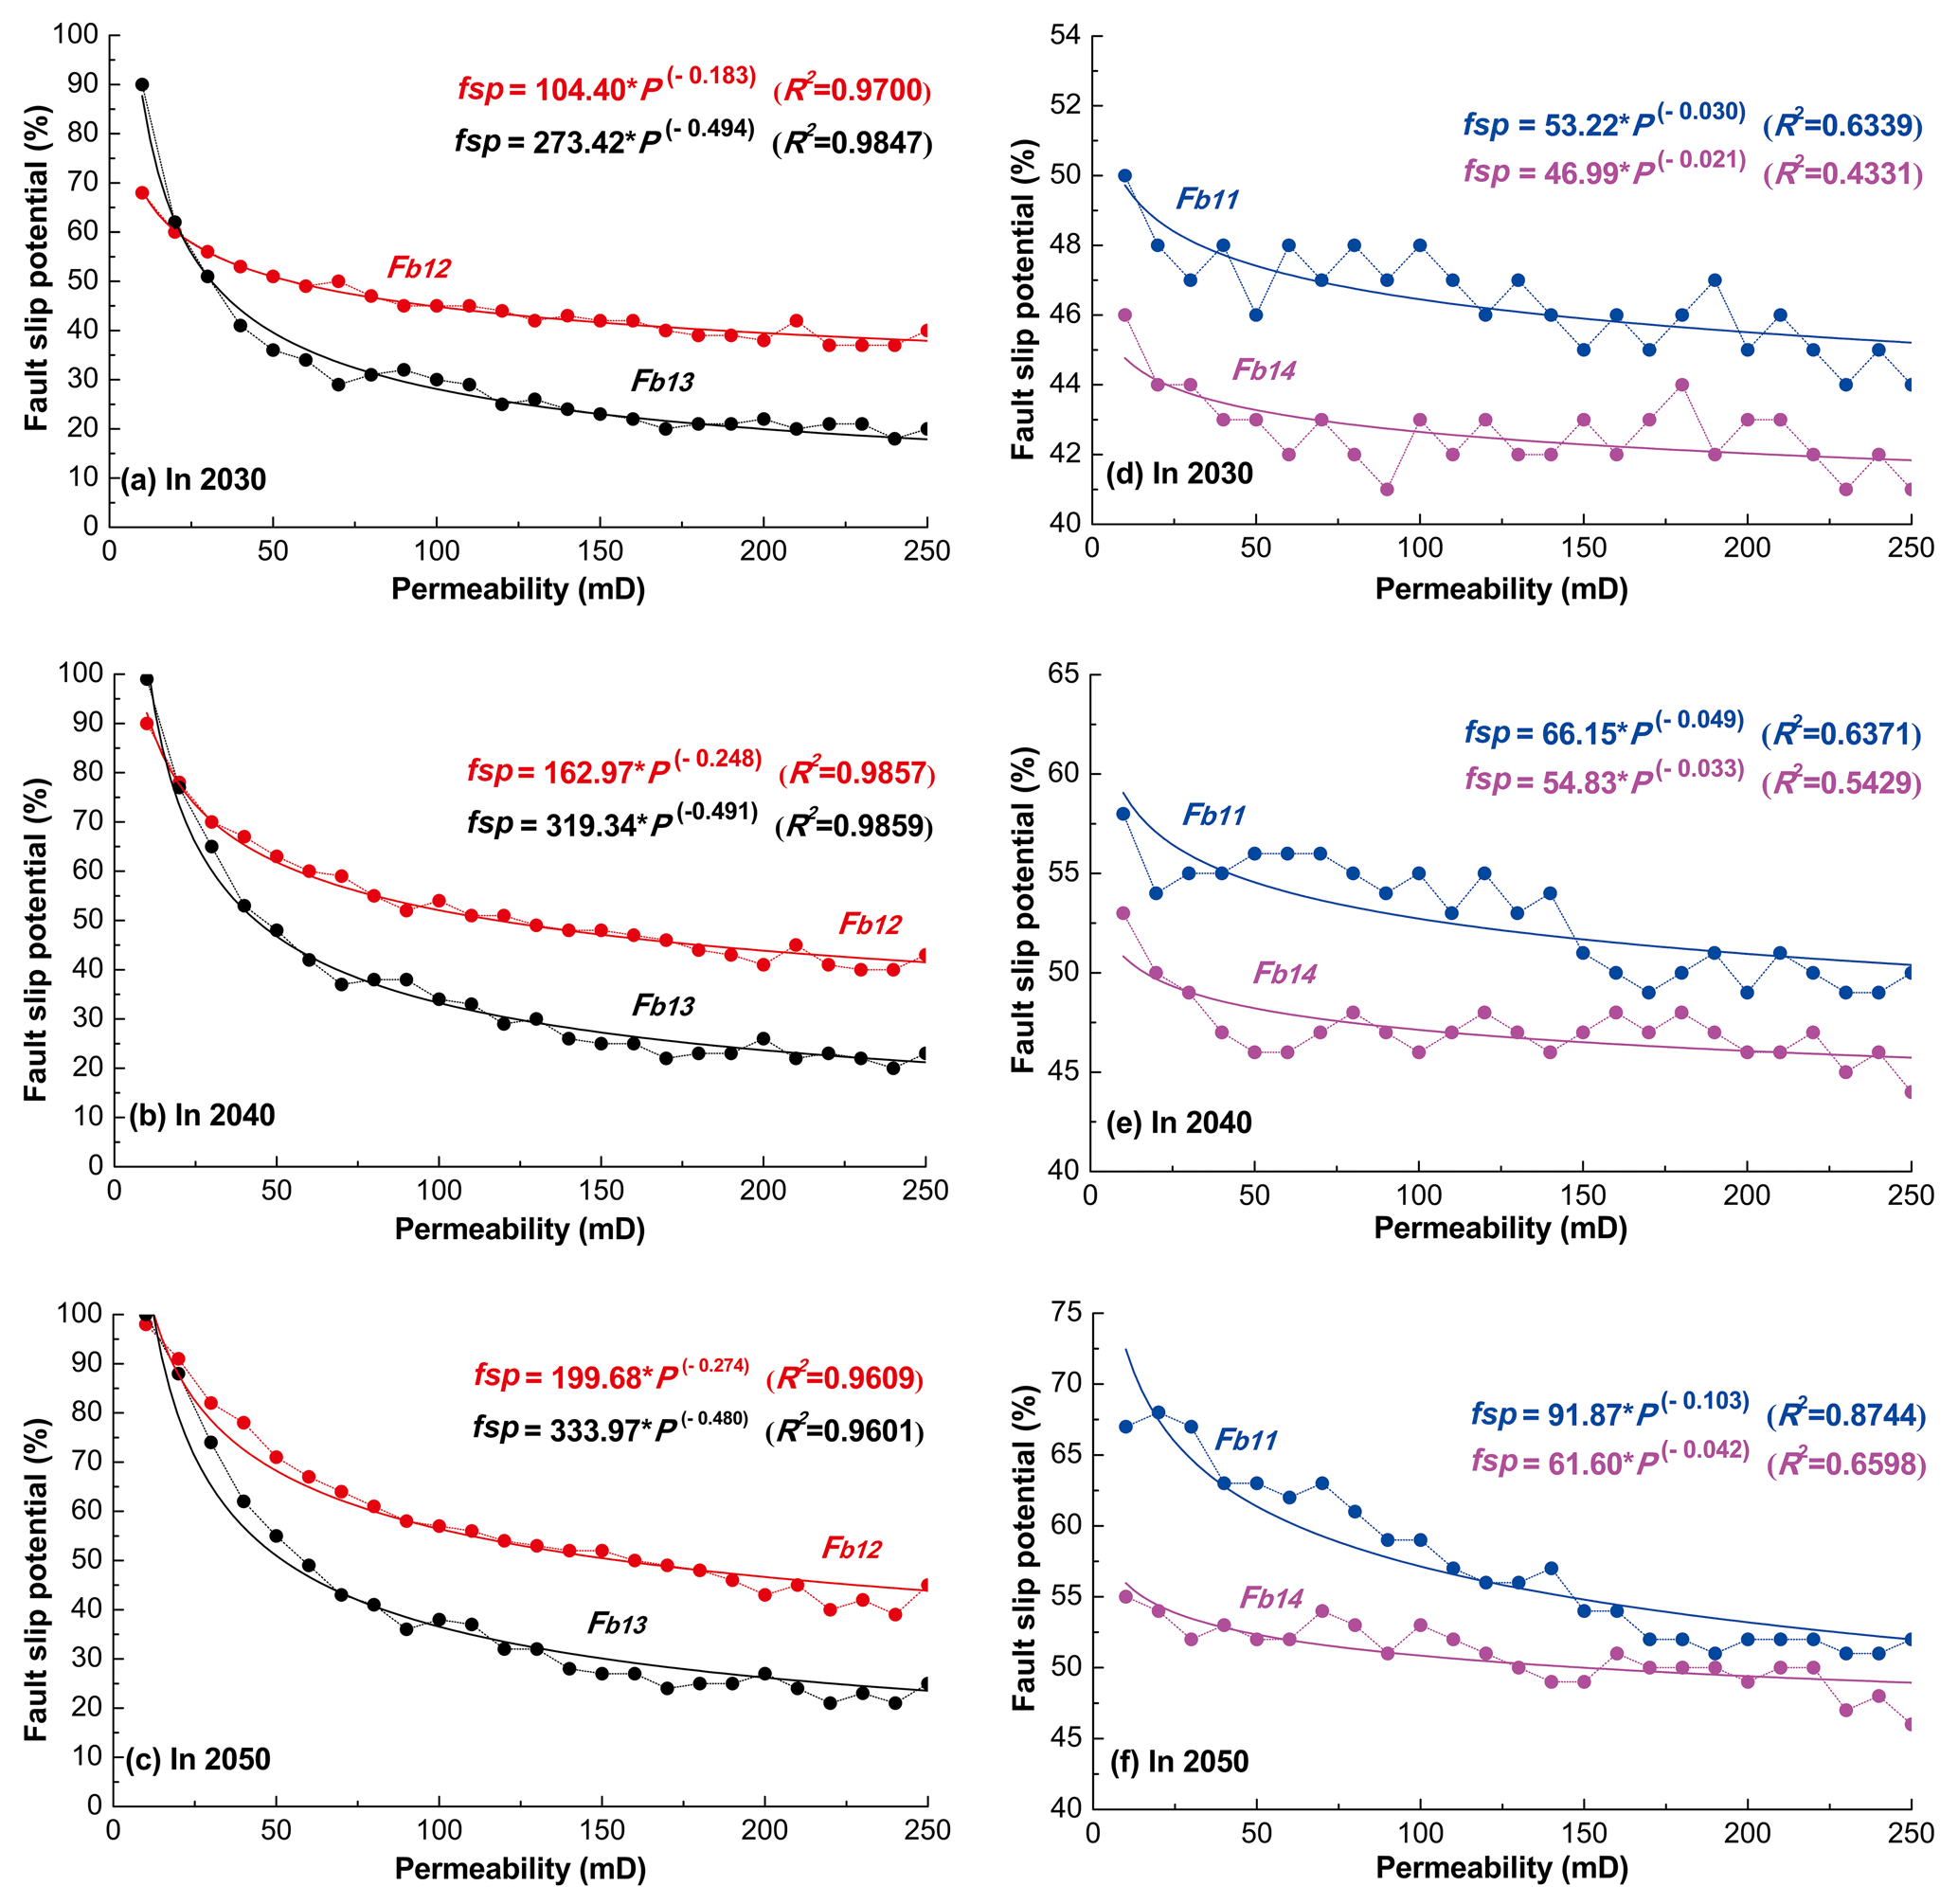
Figure 14The effect of permeability on probabilistic fault slip potential on the mapped faults Fb11, Fb12, Fb12, and Fb14, within a range of ∼6–10 km away from the MTY EGS field.
We found that an enhanced permeability could weaken the fsp values for these four fault segments in 2030, 2040, and 2050. Furthermore, the fsp values of the mapped faults decrease exponentially with higher permeability values during fluid injection. Nevertheless, Cappa et al. (2018) suggest that permeability enhancement has an important effect on the pressure diffusion and aseismic slip growth during fluid injection. Their results reveal that a more pronounced permeability enhancement results in a larger aseismic slip zone. Moreover, aseismic slip may play a significant role in triggering distant earthquake sequences located outside the target reservoir (Wei et al., 2015). As such, the permeability and aseismic slip zone should be considered when conducting the ongoing seismic hazard assessment of a given region due to fluid injection.
6.3 Effect of porosity on the fault slip potential in the MTY EGS field
The porosity of the gneiss in the Matouying and Baigezhuang uplifts mainly vary between 4.2 % and 9.6 %, with an average value of 6.9 % (Zhou, 2003). To further understand how porosity may influence the probabilistic fsp on the mapped faults near the MTY EGS field, we recalculate the fsp values for the Fb11, Fb12, Fb13, and Fb14 fault segments in 2030, 2040, and 2050, with porosity values ranging from 4.2 % to 9.6 % in 0.9 % increments (Fig. 15). We find that the fsp values of segments Fb11, Fb12, Fb13, and Fb14 do not have obvious changes (Δfsp < 6 %), with increasing porosity. This finding is well consistent with our previous results in the Rongcheng geothermal reservoir of Xiong'an New Area, North China (Zhu et al., 2022). In general, the fault slip potential on the mapped faults induced by long-term fluid injection in the MTY EGS field changes slightly in response to variations in porosity.
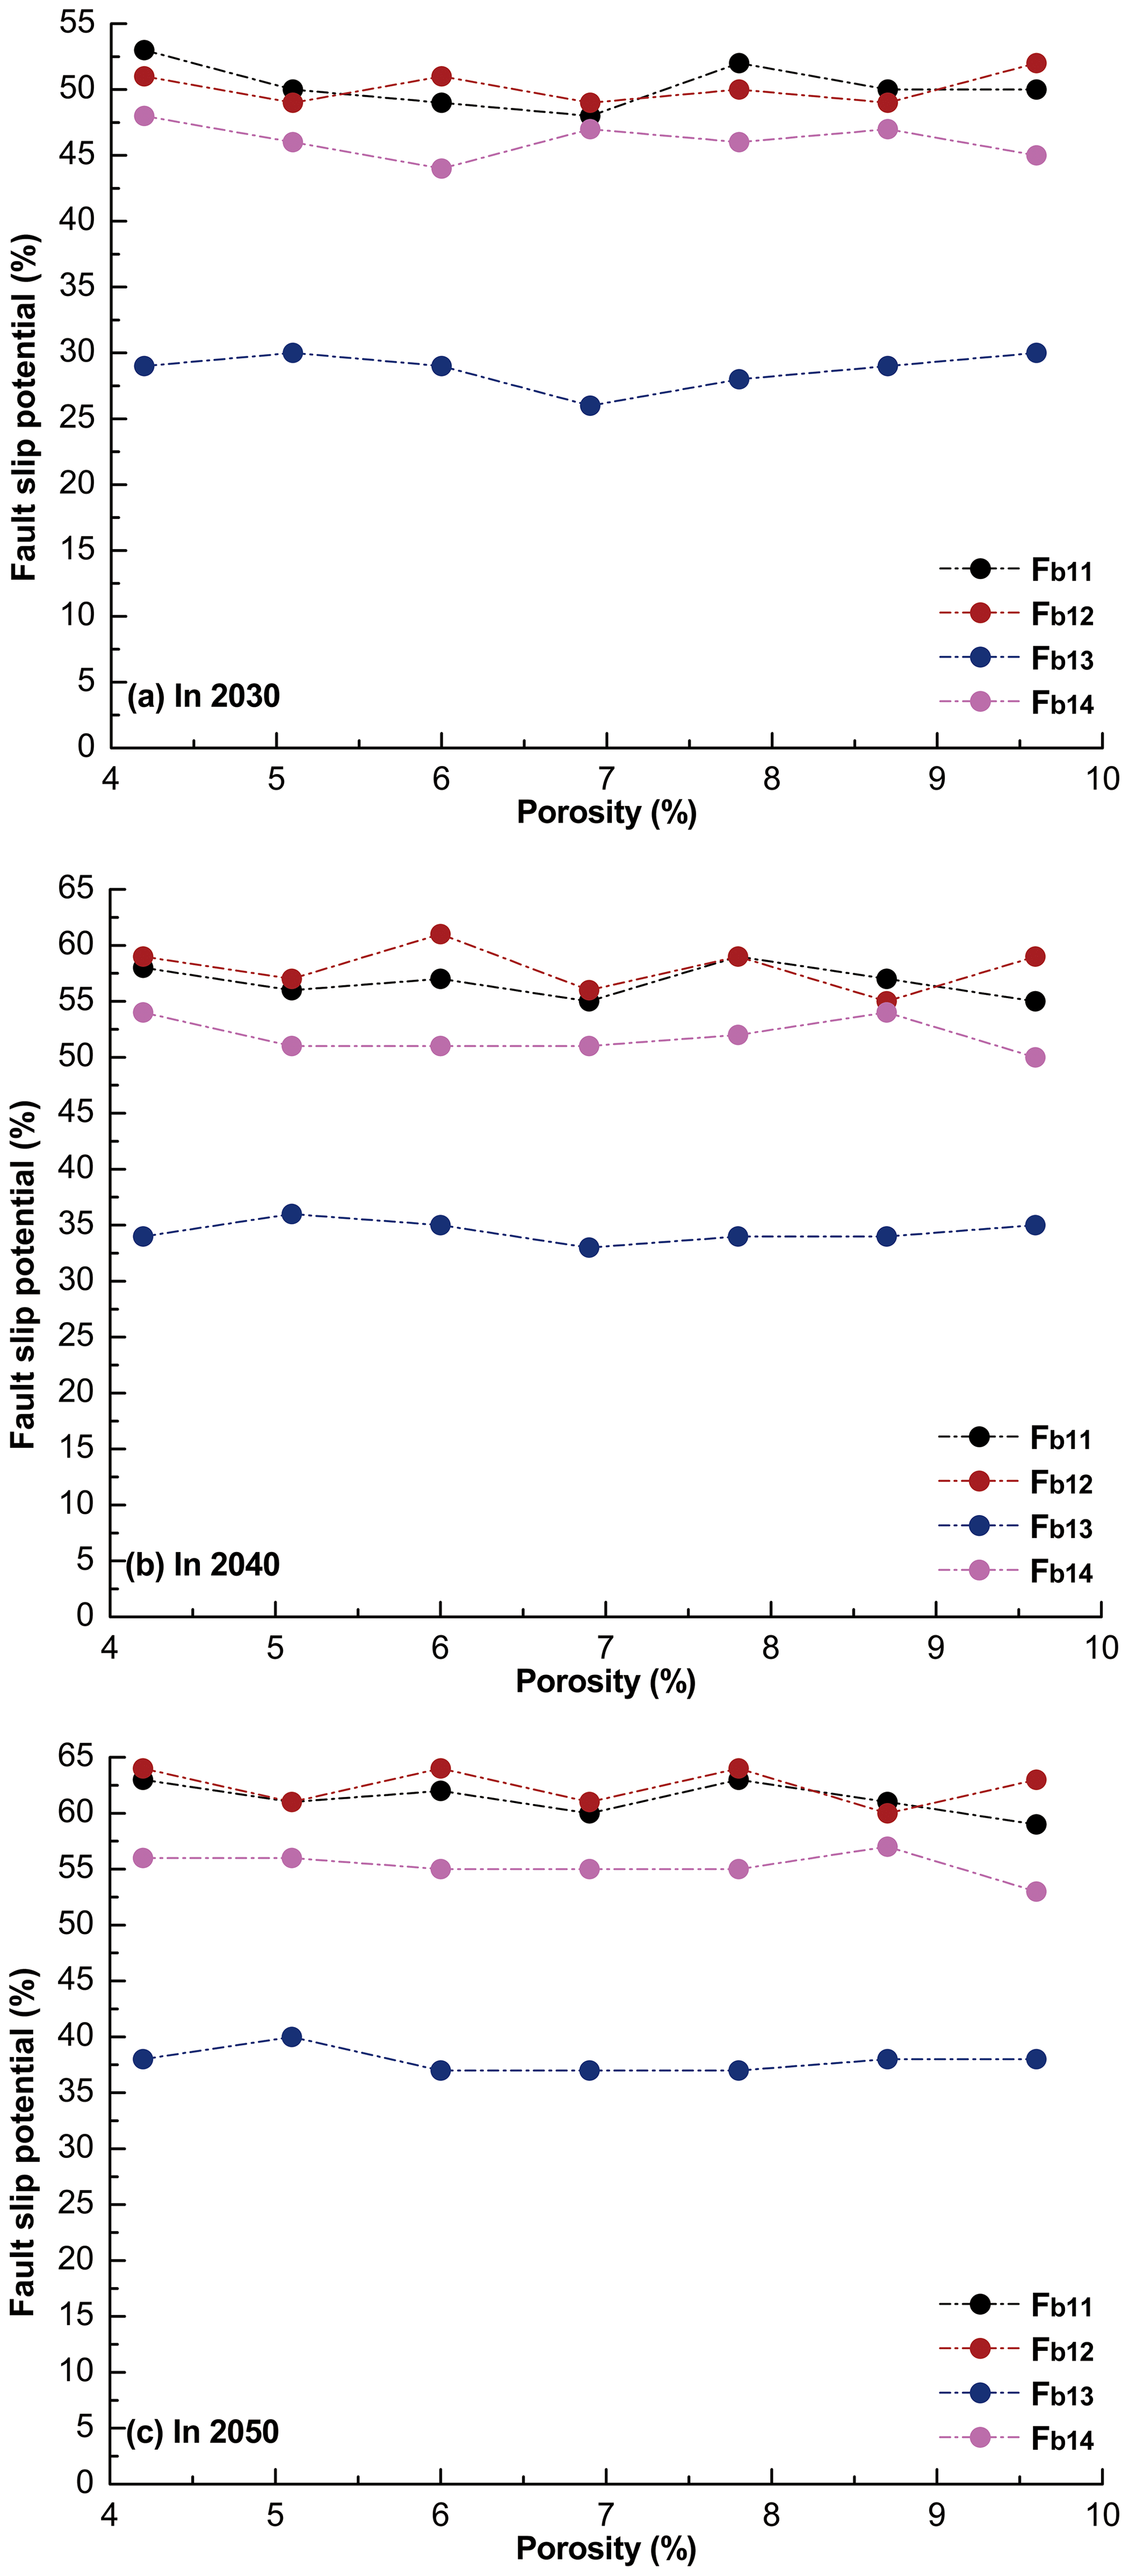
Figure 15The effect of porosity on probabilistic fault slip potential on the mapped faults Fb11, Fb12, Fb12, and Fb14, within a range of ∼6–10 km away from the MTY EGS field.
6.4 Effect of thermoelastic stress on the fault instability in the MTY EGS field
The influence of temperature has not been considered in the analyses although temperature-induced stresses may play a significant role during EGS stimulation (Ghassemi and Tao, 2016). As a thermally uncoupled case of heating of a half space, the temperature-induced horizontal stresses can be estimated using the solution provided by Cheng (2016):
where Δσhorizontal is the change in horizontal stress (MPa) with a change in temperature ΔT (∘C), αd is a drained thermoelastic effective stress coefficient (MPa ∘C−1), βd is a volumetric expansion coefficient (∘C−1), K is the bulk modulus of the reservoir rock (MPa), and ν is Poisson's ratio.
It is assumed that the temperature drop is uniform throughout the reservoir (∼3965–4000 m), and the average temperature will decline by 6 ∘C over 20 years (Segall and Fitzgerald, 1998). The average Young's modulus E of the gneiss in the MTY EGS field is equal to 20 GPa, and Poisson's ratio ν is equal to 0.23 (Li and Dong, 2013). Therefore, the bulk modulus K [] is equal to 12.35 GPa. A reasonable value for granitic gneiss can be calculated using a βd value of ∘C−1 (McTigue, 1990), resulting in the αd of 0.296 MPa ∘C−1. Then, the change in horizontal stress is calculated for a temperature drop of 6 ∘C with a value of 1.25 MPa.
Taking faults Fb7, Fb11, Fb12, Fb13, and Fb14 as examples, we determined the fault stress state in Mohr's circles in 2040, when the average temperature hypothetically declines by 6 ∘C throughout the MTY geothermal reservoir. In Fig. 16, the black dot marks the traction of the fault instability without the influence of thermoelastic stress, while the red dot marks the traction of the fault instability with the effect of temperature-induced stress changes. Generally, the effective principal stresses σH and σh both decrease by 1.25 MPa at a depth of 3965 m. The decreasing thermoelastic stress on the selected faults in 2040 shifts Mohr's circles to the left. The temperature-drop-induced stresses have a slight effect on the fault instability on the faults Fb7, Fb11, Fb12, Fb13, and Fb14 under a strike-slip-faulting stress regime.
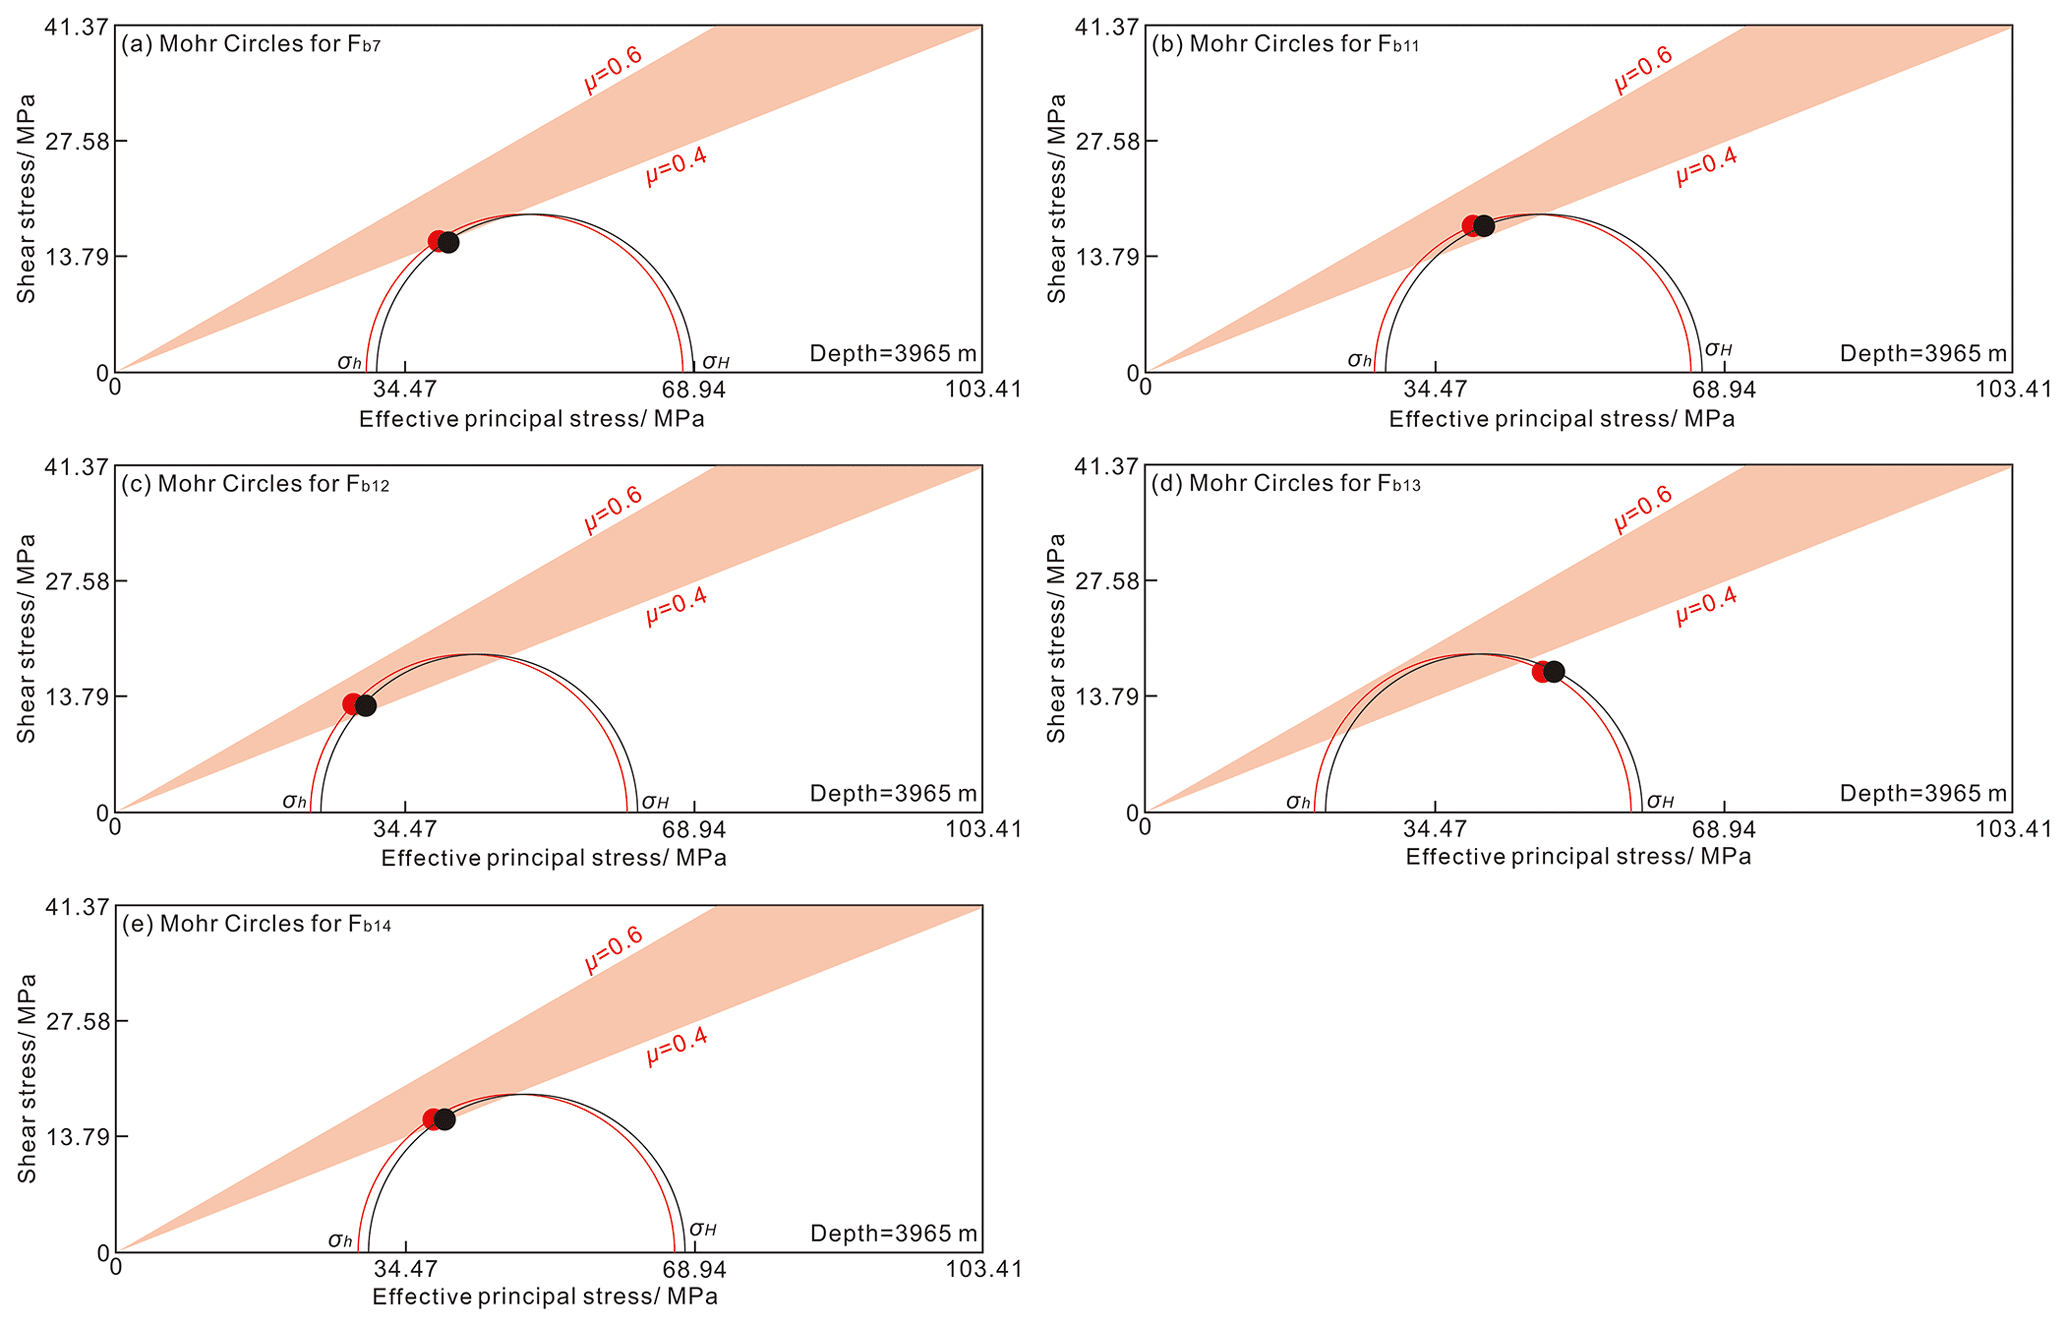
Figure 16The effect of thermoelastic stress on fault instability of the mapped faults Fb11, Fb12, Fb12, Fb13, and Fb14, within a range of ∼6–10 km away from the MTY EGS field. The changes in horizontal stress are calculated for a temperature drop of 6 ∘C with a value of 1.25 MPa. The black dot marks the traction of fault instability (a horizontal distance to slip in megapascals) without the influence of thermoelastic stress, while the red dot marks the traction of the fault instability with the effect of temperature-induced stress changes.
6.5 The predicted maximum magnitude of injection-induced seismicity in the MTY EGS field
It is possible to estimate the maximum magnitude of earthquakes induced by fluid injection through statistical, analytical, or hybrid forecasting methods (Gaucher et al., 2015; Tharaka et al., 2020). In this study, our predictions are based on the recently developed and commonly accepted models proposed by McGarr (2014), Van der Elst et al. (2016), and Galis et al. (2017).
McGarr (2014) predicted the maximum magnitude of injection-induced earthquakes by simulating a fully saturated reservoir with critically stressed and ideally oriented faults in the vicinity of an injection well. The model generates a linear relationship between the maximum magnitude and the net injected volume (ΔV):
where G is the modulus of rigidity (MPa). This model is often used to estimate the upper bound of the seismic moment (Mmax) for planned injection activities with a single well or a set of wells.
Galis et al. (2017) also proposed a quantitative physics-based model to account for specific aspects of earthquake physics. The theoretical scaling relation between the largest magnitude of the earthquakes () and the net injected volume (ΔV) can be expressed as
where Δτ0 is the background stress drop (MPa), K is the bulk modulus of the reservoir rock (MPa), μ is the friction coefficient, and TR is the reservoir thickness (m).
If earthquakes follow a Gutenberg–Richter distribution, i.e., exponentially distributed in magnitude, the total number of induced earthquakes is proportional to injection volume (ΔV). Van der Elst et al. (2016) derived an alternative expectation for the maximum magnitude Mmax based on sample size statistics. The maximum magnitude (Mmax) of induced earthquakes can be estimated as
where b is the slope of the power law and Σ is the seismogenic index and is found to be relatively constant over the lifetime of the geothermal reservoir (Shapiro et al., 2010).
For the parameters used in Eq. (7), the average Young's modulus E of the gneiss in the MTY EGS field is equal to 20 GPa and Poisson's ratio ν is equal to 0.23 (Li and Dong, 2013). Therefore, the modulus of rigidity G [G=E/2(1+ν)] is equal to 8.13 GPa. For the parameters used in Eq. (8), the bulk modulus K is equal to 12.35 GPa, the background stress drop Δτ0 in the Tangshan seismic region is about 6 MPa (Xiao et al., 1992), the friction coefficient μ in this study is 0.4, and the reservoir thickness h of the MTY EGS is equal to 35 m (∼3965–4000 m). In addition, for the parameters used in Eq. (9), the value of b is taken as 0.87 in the Tangshen seismic region (Du et al., 2021). Due to lack of the Σ at the MTY EGS sites, herein we estimate the sample size prediction for maximum magnitude (Eq. 9) using a hypothetical seismogenic index at the geothermal systems in Cooper Basin, Australia (Shapiro et al., 2010).
Using these three models, we estimated the maximum magnitude of injection-induced seismic events within well distances of ∼10–15 km in response to a monthly injection volume time series in the MTY EGS field (Fig. 17). Using a common logarithm function, we then fit these calculated results to obtain the relationship between the maximum moment magnitude (Mw) of injection-induced earthquakes in response to a net injected volume (ΔV) in the MTY EGS field:
where Eqs. (10) and (11) are the best-fitting models generated using the methods of McGarr (2014) and Galis et al. (2017), respectively. Equation (12) is simplified from the model of Van der Elst et al. (2016) with the b value of 0.87 and the Σ value of −1.2.
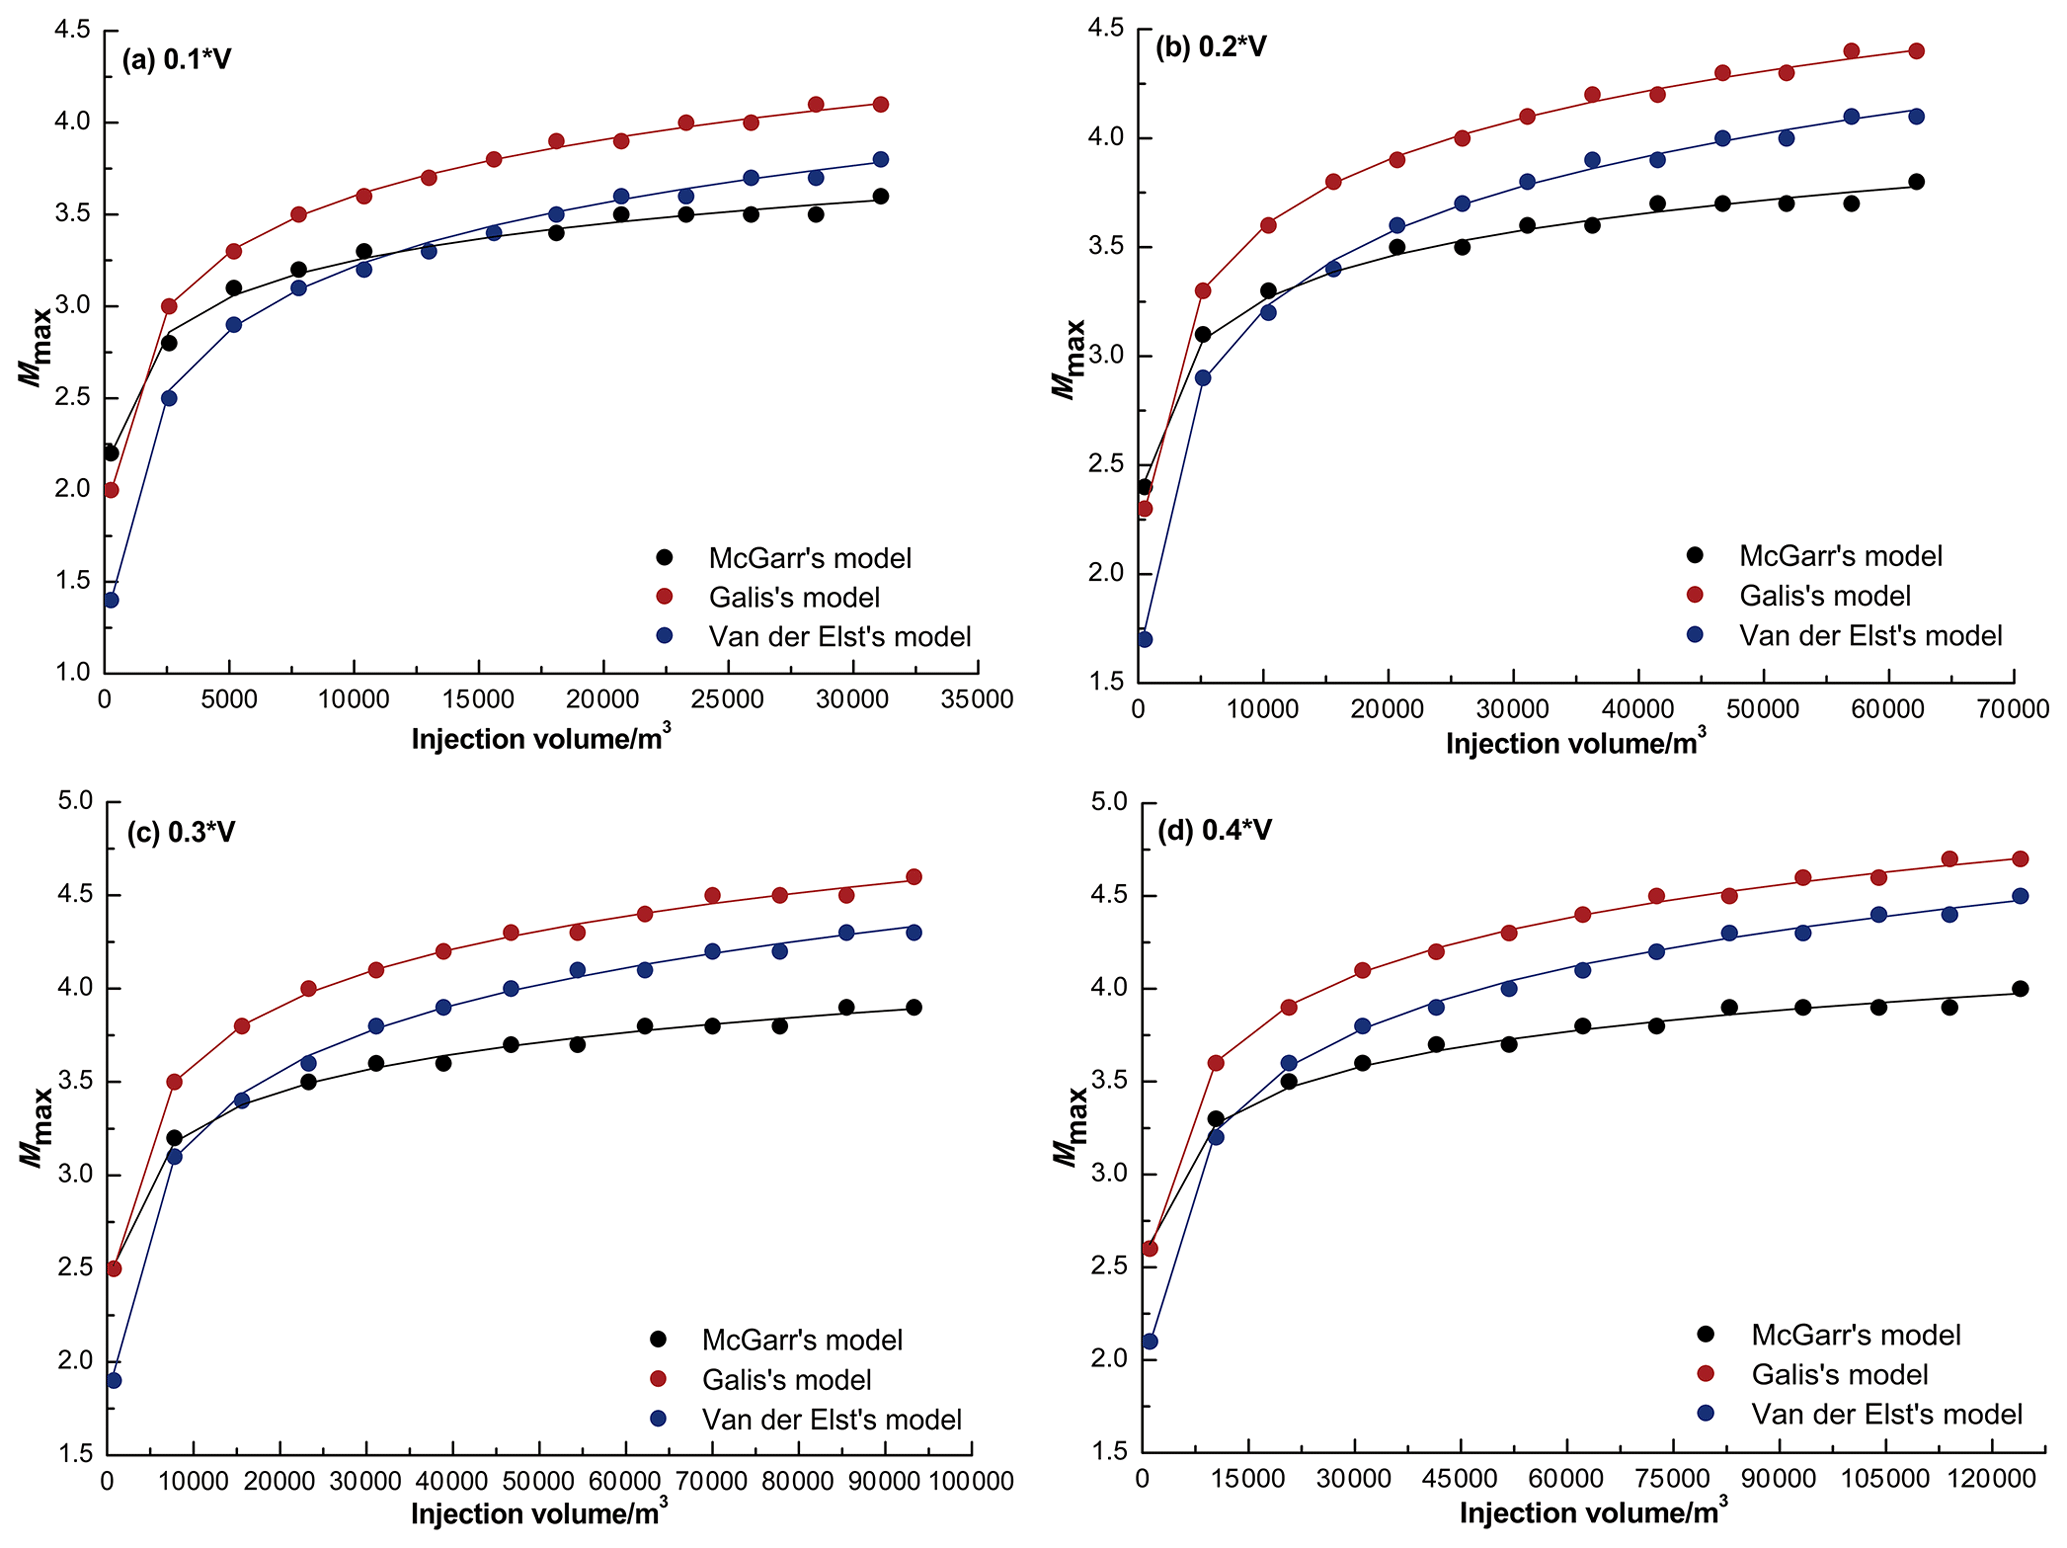
Figure 17The maximum moment magnitude of injection-induced seismicity within ∼10–15 km of the injected wells in response to monthly time series of injection volume in the MTY EGS field. In the calculation, the monthly injection volumes (V) are taken as 2.59×10³, 2.59×10⁴, 5.18×10⁴, 7.78×10⁴, 1.04×10⁵, 1.30×10⁵, 1.56×10⁵, 1.81×10⁵, 2.07×10⁵, 2.33×10⁵, 2.59×10⁵, 2.85×10⁵, and 3.11×10⁵ m3, corresponding to a fluid injection rate of 1, 10, 20, 30, 40, 50, 60, 70, 80, 90, 100, 110, and 120 L s−1, respectively.
In these calculations, we used different monthly injection volumes (V) ranging from 2.59×10³ to 3.11×10⁵ m3 and corresponding to the fluid injection rate of ∼1–120 L s−1. In addition, we also considered the net injected volume (ΔV) as 10 % V, 20 % V, 30 % V, and 40 % V, respectively, due to the fluid loss injected into the EGS reservoir (Table S5).
As shown in Fig. 17a, when the accumulated net injected volume is larger than 5000 m3, the predicted Mw slowly increases from Mw 3.1 to Mw 3.6 using the McGarr (2014) model, from Mw 2.9 to Mw 3.8 using the Van der Elst et al. (2016) model, and from Mw 3.3 to Mw 4.1 using the Galis et al. (2017) model. The Mw estimations for the three models are similar. The maximum predicted Mw for an injection-induced earthquake in the MTY EGS field under an assumption of 10 % fluid loss is Mw 4.1.
For a fluid loss of 20 %, when the accumulated net injected volume surpasses 5000 m3, the predicted Mw slowly increases from Mw 3.1 to Mw 3.8 with the McGarr (2014) model, from Mw 2.9 to Mw 4.1 with the Van der Elst et al. (2016) model, and from Mw 3.3 to Mw 4.4 with the Galis et al. (2017) model. In this scenario, the maximum Mw of an injection-induced earthquake in the MTY EGS field is Mw 4.4 (Fig. 17b).
When the fluid loss is increased to 30 % and the accumulated net injected volume is larger than 5000 m3, the predicted Mw slowly increases from Mw 3.2 to Mw 3.9 using the McGarr (2014) model, from Mw 2.9 to Mw 4.3 using the Van der Elst et al. (2016) model, and from Mw 3.5 to Mw 4.6 using the Galis et al. (2017) model. The maximum Mw of an injection-induced earthquake is Mw 4.6 in these circumstances (Fig. 17c).
As shown in Fig. 17d, when the accumulated net injected volume is larger than 5000 m3 and the fluid loss is 40 %, the predicted Mw slowly increases from Mw 3.3 to Mw 4.0 with the McGarr (2014) model, from Mw 2.9 to Mw 4.5 with the Van der Elst et al. (2016) model, and from Mw 3.6 to Mw 4.7 with the Galis et al. (2017) model. For 40 % fluid loss, the maximum Mw of an injection-induced earthquake in the MTY EGS field is Mw 4.7.
Previous studies indicate that 53 earthquakes (Mw 2.0–2.7) were caused by fluid injection (injection volume of ∼300–360 m3 d−1) in the Renqiu oilfield of North China from August to November 1986 (Fig. 18) and that 13 earthquakes (Mw 2.0–3.5) were caused by fluid injection (injection volume of ∼300–390 m3 d−1) from February to June 1987 (Fig. 18) (Zhao and Yang, 1990).
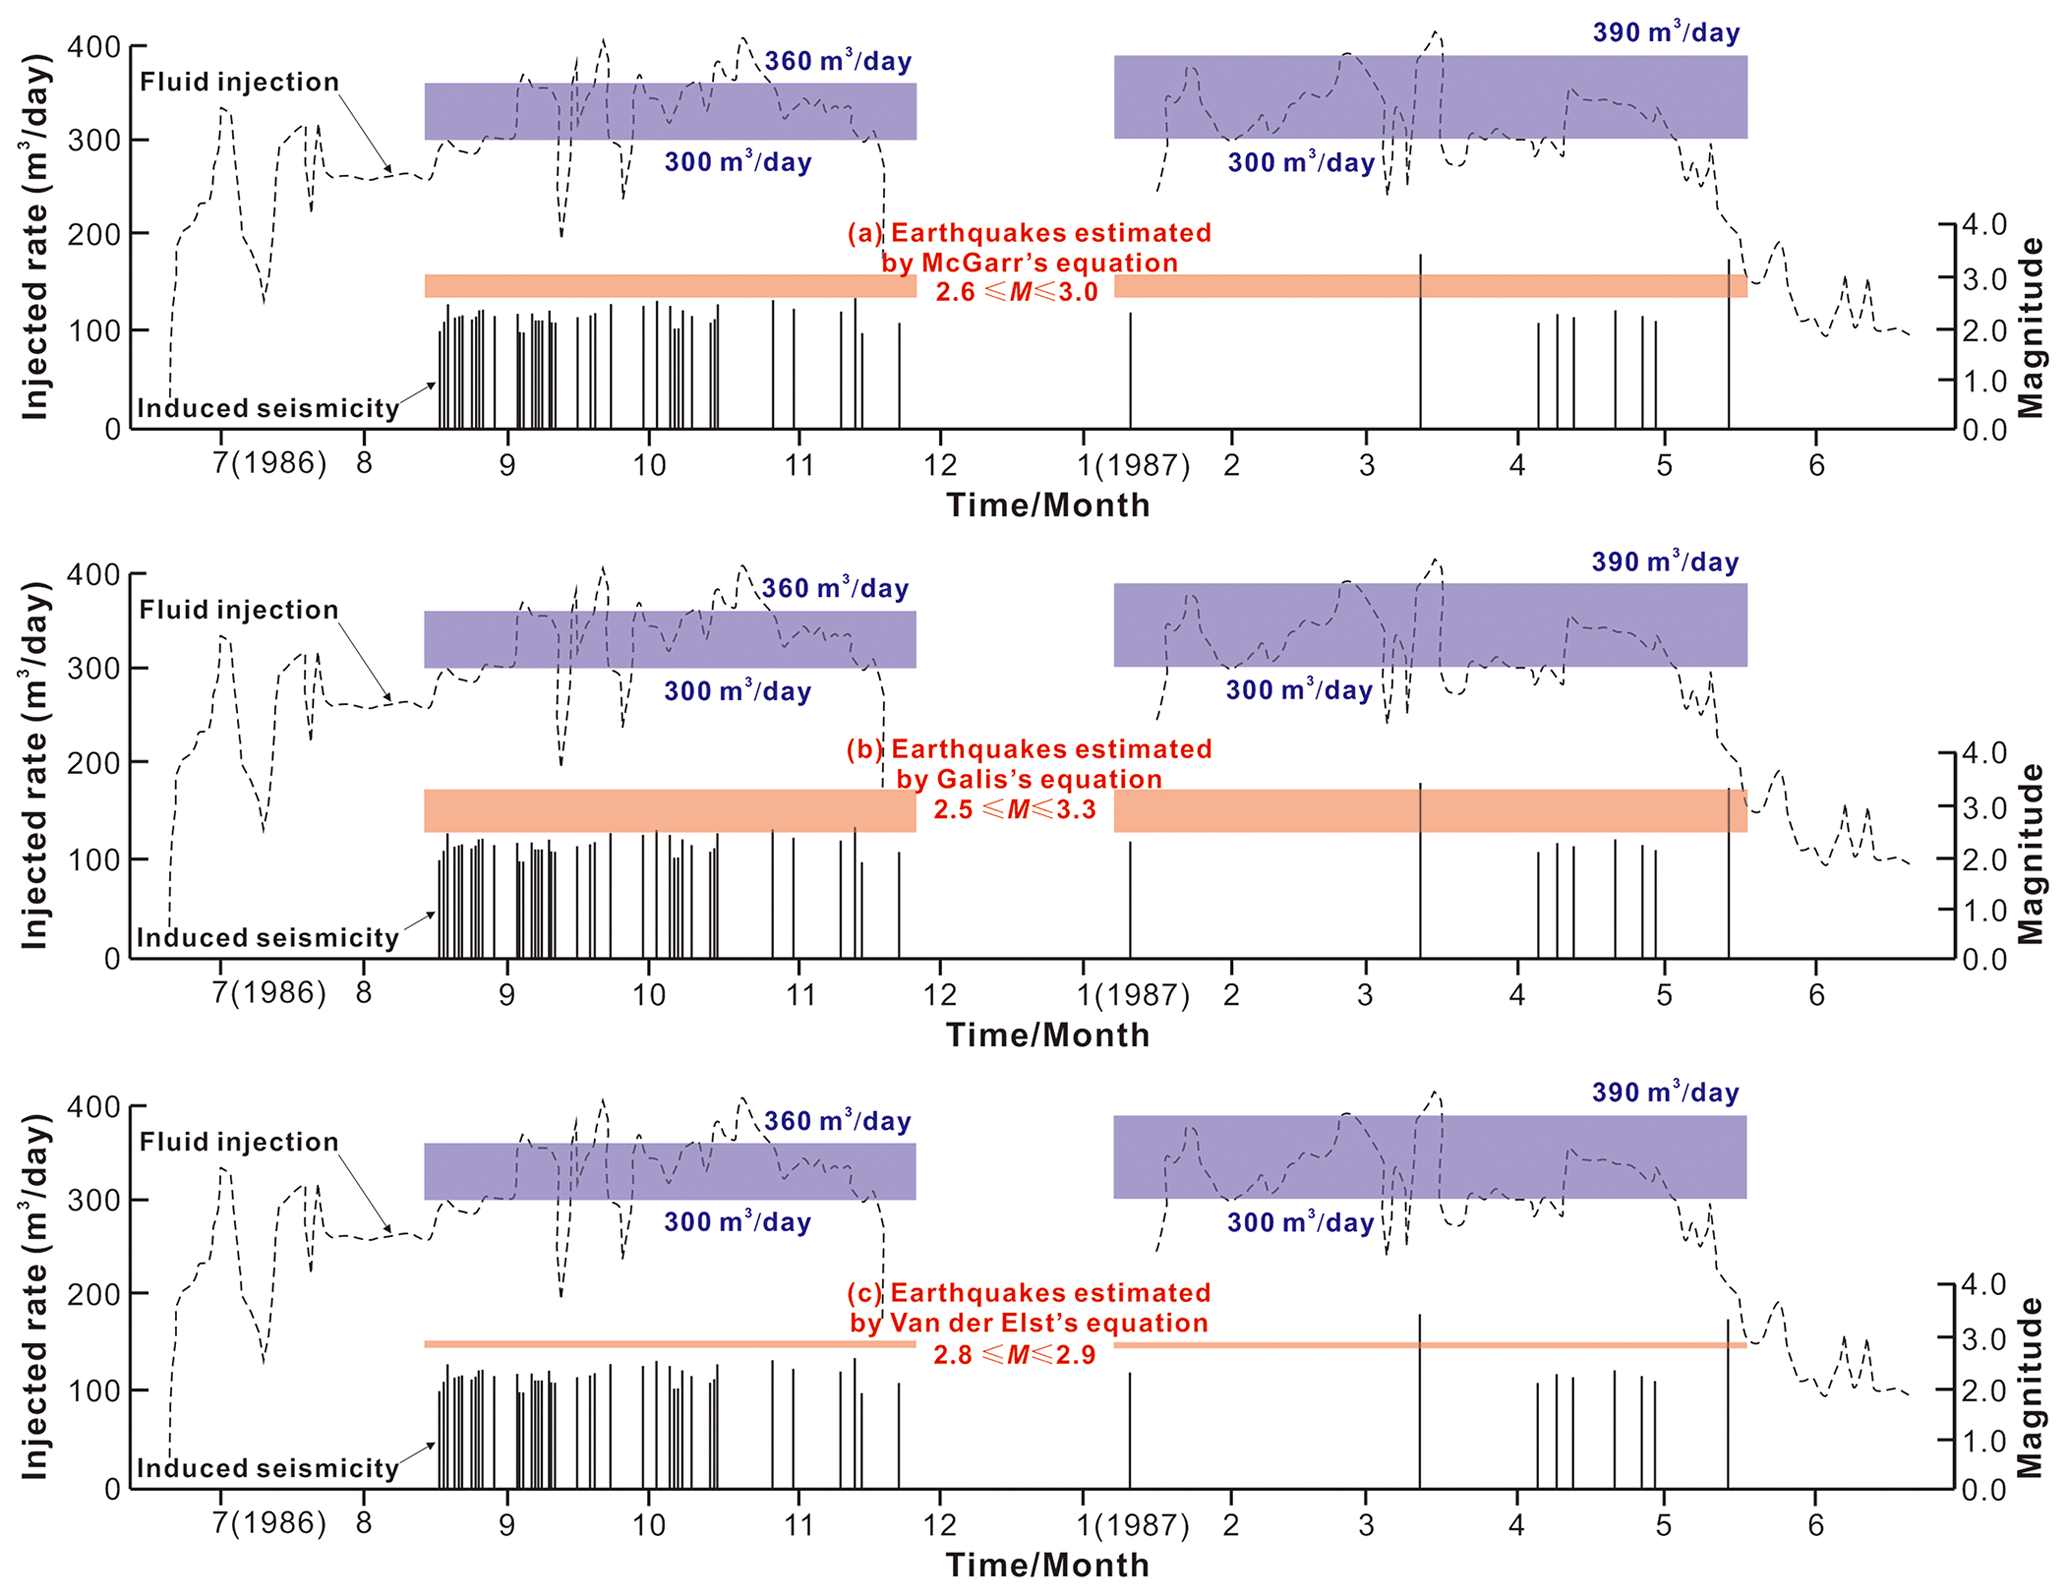
Figure 18Comparisons of the magnitudes of the injection-induced earthquakes between the observations (vertical black lines) (Zhao and Yang, 1990) and the predicted (orange rectangles) results calculated using the McGarr (2014) model (a), the Galis et al. (2017) model (b), and the Van der Elst et al. (2016) model (c) in the Renqiu oilfield of North China.
To verify our predicted models (Eqs. 14–16) for the maximum Mw of fluid-injection-induced earthquakes, we estimated the possible Mw of the injection-induced earthquake in the Renqiu oilfield, which is located ∼310 km away from the MTY EGS field. As shown in Fig. 18a, the predicted maximum Mw values of the injection-induced earthquakes that occurred between August and November 1986 using the McGarr (2014) model vary between 2.6 and 3.0 with an injected fluid loss of less than 40 %; these values are largely consistent with the observed earthquake magnitudes (Mw 2.0–2.7). With the Galis et al. (2017) model, the predicted maximum Mw values of the injection-induced earthquakes that occurred between February and June 1987 vary between 2.5 and 3.3 (Fig. 18b); these values are also consistent with the recorded magnitudes of the actual earthquakes (Mw 2.0–3.5). With the Van der Elst et al. (2016) model, the predicted maximum Mw values of the injection-induced earthquakes that occurred between February and June 1987 vary between 2.8 and 2.9 (Fig. 18c); these values are slightly smaller than the recorded magnitudes of the maximum earthquakes (Mw 3.5). By comparison, we find that the maximum magnitudes of the injection-related seismicity estimated with the Galis et al. (2017) model (Mw 3.3) are slightly greater than the values by the McGarr (2014) model (Mw 3.0) and the Van der Elst et al. (2016) model (Mw 2.9). In addition, we also find that the maximum magnitudes of the injection-related seismicity estimated with the Galis et al. (2017) model (Mw 3.3) are more similar with the observed earthquake (Mw 3.5) in the Renqiu oil field, North China.
In general, the difference in the expected maximum magnitudes estimated with three models is less than 0.5. Based on this analysis, we conclude that these three of the predicted models shown in Eqs. (10)–(12) can be adopted to estimate the maximum moment magnitude of fluid-injected seismic events in the MTY EGS field in anticipation of the upcoming EGS exploitation. As shown in Fig. 17, we find that the predicted maximum magnitude of earthquakes (Mw 4.7) induced by continuous water injection for 30 d would be much smaller than that of the largest tectonic earthquake in the Tangshan seismic region (i.e., the 1976 M 7.8 earthquake).
Our conclusions are as follows:
-
At shallow depths, the linearly increasing gradients of the maximum (σH) and minimum (σh) horizontal principal stresses near the MTY EGS field in the Tangshan seismic region of North China are 0.0278±0.005 and 0.0183±0.0024 MPa m−1, respectively. The σH orientations vary from 66 to 100∘ (average of ) near the MYT EGS field.
-
In the Tangshan seismic region, most earthquakes (M 1.0–4.9 from 2009 to 2019) have occurred on the faults that, in the present tectonic stress field, have relatively high fault slip potentials. For example, the Tangshan fault belt has fsp values ranging from 31 % to 41 % and the Jiyunhe fault belt has fsp values ranging from 27 % to 37 %. However, many earthquakes, such as those on the Lulong fault and the northwestern end of the Luanzhou–Laoting fault, have also occurred on faults with lower fsp values (3 %–5 %). The existence of these seismic events likely indicates that there is a local stress field with a σH orientation of ∼43–55∘ in the Lulong Basin.
-
The linearly superimposed fluid pressure perturbations induced by continuous injection at five hypothetical injection wells in the MTY EGS field do not exceed 12 MPa from 2020 to 2050 (average fluid injection rate of 51 L s−1). The fault segments that experience the highest fluid pressure perturbations are those with well distances of ∼15–20 km. However, beyond this range, the fluid pressure perturbations induced by fluid injection rapidly decay to zero.
-
When the well distance exceeds ∼30–45 km in the MTY EGS field, the probabilistic fault slip potential on most of the active faults does not change from 2020 to 2050 in the Tangshan seismic region. At well distances of less than 15 km in the MTY EGS field, the probabilistic fault slip potential on most of the boundary faults increases with continuing fluid injection over time, especially on faults with well distances of ∼6–10 km. For example, fault segments Fb11, Fb12, and Fb13 between the Baigezhuang lower uplift and the Matouying uplift have fsp values of 59.5 %, 59.7 %, and 35.1 %, respectively, in 2050.
-
When we experiment with fluid injection rates (0 to 120 L s−1) in our hypothetical wells, we find that on fault segments Fb11, Fb12, Fb13, and Fb14, which are the fault segments with the shortest well distances in the MTY EGS field, the probabilistic fault slip potential increases linearly with the fluid injection rate. However, the fsp values on these faults decrease exponentially with increased unit permeability during fluid injection.
-
When the monthly injection volumes fall in the range of –3.11×10⁵ m3 and the injected fluid losses vary between ∼10 %–40 %, the predicted maximum moment magnitude of an injection-induced earthquake is Mw 4.1–4.7 in the MTY EGS field. The predicted maximum magnitudes of injection-induced earthquakes would be smaller than that of the largest tectonic earthquake in the Tangshan seismic region.
-
We show how the FSP software package can be used as a quantitative screening tool to estimate the fault slip potential in a region with some uncertainties in the ambient stress field and to assess the reactivation potential on these faults of presumably higher criticality in response to fluid injection. The case study of the MTY EGS field has important implications for deep geothermal exploitation in China, especially for Gonghe EGS (in Qinghai Province) and Xiong'an New Area (in Hebei Province) geothermal reservoirs that are close to the Quaternary active faults. Ongoing injection operations in the regions should be conducted with these understandings in mind.
Fault Slip Potential (FSP) is a free tool for probabilistically screening faults near injection wells from the Stanford Center for Induced and Triggered Seismicity, developed through industry–academic collaboration. This software is also available for free from the website at https://scits.stanford.edu/fault-slip-potential-fsp (Stanford Center for Induced and Triggered Seismicity, 2020). STRESSINVERSE is a MATLAB software package for an iterative joint inversion for stress and fault orientations from focal mechanisms, developed by Václav Vavryčuk. The MATLAB code of this inversion is provided for free from the website at http://www.ig.cas.cz/stress-inverse (Vavryčuk, 2022).
The recent earthquakes (2009–2019) with magnitudes of M 1.0–4.9 in the Tangshan seismic region can be found from the website at https://data.earthquake.cn/datashare/report.shtml?PAGEID=earthquake_zhengshi (National Earthquake Data Center, 2022). Focal mechanisms (ML≥2.5) in the Tangshan seismic region are listed in Table S1. All of the fsp results estimated on the mapped faults in the Tangshan seismic region and in the MTY EGS field are available upon request to the corresponding author.
The supplement related to this article is available online at: https://doi.org/10.5194/nhess-22-2257-2022-supplement.
CF conceptualized the research, performed the tectonic stress field and fault slip potential analysis, and wrote the manuscript. SZha conceptualized the research. GG implemented the integrated seismic and geological data interpretation of the Matouying uplift and its vicinity. Both DS and CT analyzed in situ stress measurements in the Tangshan seismic region. SZhu estimated the maximum magnitude of injection-induced seismicity in MTY EGS field. XM defined the research structure and reviewed the manuscript.
The contact author has declared that neither they nor their co-authors have any competing interests.
Publisher's note: Copernicus Publications remains neutral with regard to jurisdictional claims in published maps and institutional affiliations.
The authors wish to thank the professor Qunce Chen (Institute of Geomechanics, CAGS) for providing in situ stress results measured at the Luanzhou borehole in the Tangshan seismic region. We would like to thank assistant professors Weifeng Sun, Peng Zhang, and Bangshen Qi (Institute of Geomechanics, CAGS) for conducting in situ stress measurements at the Qian'an and Changli boreholes in the Tangshan seismic region. We also thank LetPub (https://www.letpub.com/, last access: 20 December 2021) for linguistic assistance and pre-submission expert review.
This research has been supported by the China Geological Survey (grant nos. DD20190317 and DD20221738).
This paper was edited by Filippos Vallianatos and reviewed by three anonymous referees.
Alghannam, M., Juanes, R.: Understanding rate effects in injection-induced earthquakes, Nat. Commun., 11, 3053, https://doi.org/10.1038/s41467-020-16860-y, 2020.
Baisch, S., Weidler, R., Vörös, R., Wyborn, D., and Graaf, L. D.: Induced seismicity during the stimulation of a geothermal HFR reservoir in the Cooper Basin, Australia, Bull. Seismol. Soc. Am., 96,2242-2256, https://doi.org/10.1785/0120050255, 2006.
Bear, J.: Hydraulics of Groundwater, McGraw-Hill Book Company, New York, ISBN 0-07-004170-9, 1979.
Bromley, C. J., Pearson, C. F., Rigor, D. M., and PNOC-EDC.: Micoearthquakes at the puhagan geothermal field, Philippines-A case of induced seismicity, J. Volcanol. Geoth. Res., 31, 293–311, https://doi.org/10.1016/0377-0273(87)90073-4, 1987.
Butler, R., Stewart, G. S., and Kanamori, H.: The July 27, 1976 Tangshan, China earthquake-A complex sequence of intraplate events, Bull. Seismol. Soc. Am., 69, 207–220, 1979.
Byerlee, J.D.: Friction of rocks, Pure Appl. Geophys., 116, 615–626, https://doi.org/10.1007/BF00876528, 1978.
Cao, K. X.: Geological characteristics and stimulation technologies optimization for gneiss reservoir, China University of Petroleum, Beijing, CNKI:CDMD:2.1018.700257, 2016.
Cappa, F., Guglielmi, Y., Nussbaum, C., and Birkholzer, J.: On the relationship between fault permeability increases, induced stress perturbation, and the growth of aseismic slip during fluid injection, Geophys. Res. Lett., 45, 1–9, https://doi.org/10.1029/2018GL080233, 2018.
Carpenter, B. M., Saffer, D. M., and Marone, C.: Frictional properties and sliding stability of the San Andreas fault from deep drill core, Geology, 40, 759–762, https://doi.org/10.1130/G33007.1, 2012.
Catalli, F., Meier, M. A., and Wiemer, S.: The role of Coulomb stress changes for injection-induced seismicity: The Basel enhanced geothermal system, Geophys. Res. Lett., 40, 72–77, https://doi.org/10.1029/2012GL054147, 2013.
Chen, Y. K., Liu, F., Yuan, D., Li, W. D., Yang, X. L., and Gao, W. P.: Seismic risk quantitative evaluation on blind faults in Tianjin area, Seismol. Geol., 32, 138–149, https://doi.org/10.3969/j.issn.0253-4967.2010.01.014, 2010.
Chen, Y. T., Huang, L. R., Lin, B. H., Liu, M. L., and Wang, X. H.: A dislocation model of the Tangshan earthquake of 1976 from the inversion of geodetic data, Acta Geophys. Sin., 22, 201–217, 1979.
Cheng, A.: Poroelasticity, Springer Nature, ISSN 0924-6118, 2016.
Deichmann, N. and Giardini, D.: Earthquakes induced by the stimulation of an Enhanced Geothermal System below Basel (Switzerland), Seismol. Res. Lett., 80, 784–798, https://doi.org/10.1785/gssrl.80.5.784, 2009.
Dong, X. Z.: Meso-Cenozoic structural features and evolution of Laoting depression and its surrounding areas, China University of Geosciences for Master Degree, Beijing, 2011.
Dreger, D. and Helmberger, D.: Source parameters of the Sierra Madre earthquake from regional and local body waves, Geophys. Res. Lett., 18, 2015–2018, https://doi.org/10.1029/91GL02366, 1991.
Du, H., Wang, J., Zhu Y. J., Wang, D. W., Xiao, F., and Xu, N.: Temporal and spatial variation characteristics of b value of Tangshan Ms 5.1 earthquake in 2020, N. China Earthq. Sci., 39, 92–98, https://doi.org/10.3969/j.issn.1003-1375.2021.03.014, 2021.
Ellsworth, W. L.: Injection-induced earthquakes, Science, 341, 1225942, https://doi.org/10.1126/science.1225942, 2013.
Evans, K. F., Zappone, A., Kraft, T., Deichmann, N., and Moia, F.: A survey of the induced seismic responses to fluid injection in geothermal and CO2 reservoirs in Europe, Geothermics, 41, 30–54, https://doi.org/10.1016/j.geothermics.2011.08.002, 2012.
Fan, W. J., Cui, X. F., Hu, X. P., and Chen, J. W.: Focal mechanism solutions and spatio-temporal variations of the present tectonic stress field in Capital Circle region, Acta Seismol. Sin., 41, 33–45, https://doi.org/10.11939/jass.20180064, 2019.
Feng, C. J., Zhang, P., Meng, J., Qi, B. S., Qin, X. H., Niu, L. L., Sun, D. S., Sun, W. F., Tan, C. X., and Chen, Q. C.: In situ stress measurement at deep boreholes along the Tanlu fault zone and its seismological and geological significance, Prog. Geophys., 32, 946–967, https://doi.org/10.6038/pg20170302, 2017.
Feng, C. J., Qi, B. S., Wang, X. S., Zhang, P., Sun, M. Q., Meng, J., Tan, C. X., and Chen, Q. C.: Study of fault activity risk in typical strong seismic regions in northern China by in-situ stress measurements and the influence on the Xiong'an New Area, Earth Sci. Front., 26, 170–190, https://doi.org/10.13745/j.esf.sf.2019.4.17, 2019.
Feng, C. J., Yang, Y. H., Ma, X. D., Qi, B. S., Zhang, P., Meng, J., Tan, C. X., and Chen, Q. C.: Local stress perturbations associated with the 2008 Wenchuan M 8.0 earthquake near the Longmenshan fault zone in the eastern margin of the Tibetan Plateau, J. Asian Earth Sci., 200, 104429, https://doi.org/10.1016/j.jseaes.2020.104429, 2020.
Ferris, J. G., Knowles, D. B., Brown, R. H., and Stallman, R. W. Theory of aquifer tests, Geological Survey Water-Supply Paper 1536-E, US Geological Survey, 1962.
Galis, M., Ampuero, J. P., Mai, P. M., and Cappa, F.: Induced seismicity provides insight into why earthquake ruptures stop, Sci. Adv., 3, 7528, https://doi.org/10.1126/sciadv.aap7528, 2017.
Gao, K. and Harrison, P. J.: Generation of random stress tensors, Int. J. Rock Mech. Min. Sci., 97, 18–26, https://doi.org/10.1016/j.ijrmms.2016.12.011, 2017.
Gao, Z. W., Xu, J., Song, C. Q., and Sun, J. B.: The segmental character of Zhangjiakou-Penglai fault, N. China Earthq. Sci., 19, 35–54, 2001.
Gaucher, E., Schoenball, M., Heidbach, O., Zang, A., Fokker, P., van Wees, J. D., and Kohl, T.: Induced seismicity in geothermal reservoirs: a review of forecasting approaches, Renew. Sustain. Energ. Rev., 52, 1473–1490, https://doi.org/10.1016/j.rser.2015.08.026, 2015.
Gephart, J. W. and Forsyth, D.: An improved method for determining the regional stress tensor using earthquake focal mechanism data: Application to the San Fernando earthquake sequence, J. Geophys. Res.-Solid, 89, 9305–9320, https://doi.org/10.1029/JB089iB11p09305, 1984.
Ghassemi, A. and Tao, Q.: Thermo-poroelastic effects on reservoir seismicity and permeability change, Geothermics, 63, 210–224, https://doi.org/10.1016/j.geothermics.2016.02.006, 2016.
Goebel, T. H. W. and Brodsky, E. E.: The spatial footprint of injection wells in a global compilation of induced earthquake sequences, Science, 361, 899–904, https://doi.org/10.1126/science.aat5449, 2018.
Goebel, T. H. W., Weingarten, M., Chen, X., Haffener, J., and Brodsky, E. E.: The 2016 Mw 5.1 Fairview, Oklahoma earthquakes: Evidence for long-range poroelastic triggering at >40 km from fluid disposal wells, Earth Planet. Sc. Lett., 472, 50–61, https://doi.org/10.1016/j.epsl.2017.05.011, 2017.
Grigoli, F., Cesca, S., Rinaldi, A. P., Manconi, A., López-Comino, J. A., Clinton, J. F., Westaway, R., Cauzzi, C., Dahm, T., and Wiemer, S.: The November 2017 Mw 5.5 Pohang earthquake: A possible case of induced seismicity in South Korea, Science, 360, 1003–1006, https://doi.org/10.1126/science.aat2010, 2018.
Guo, H. and Zhao, J. X.: The surface rupture zone and paleoseismic evidence on the seismogenic fault of the 1976 Ms 7.8 Tangshan earthquake, China, Geomorphology, 327, 297–306, https://doi.org/10.1016/j.geomorph.2018.11.006, 2019.
Guo, H., Jiang, W. L., and Xie, X. S.: Late-Quaternary strong earthquakes on the seismogenic fault of the 1976 Ms 7.8 Tangshan earthquake, Hebei, as revealed by drilling and trenching, Sci. China Earth Sci., 41, 1009–1028, https://doi.org/10.1007/s11430-011-4218-x, 2011.
Guo, S. M., Li, Z. Y., Cheng, S. P., Chen, X. C., Chen, X. D., Yang, Z. E., and Li, R. C.: Discussion on the regional structural background and the seismogenic model of the Tangshan earthquake, Sci. Geol. Sin., 4, 305–321, 1977.
Hao, S. J., Li, J. H., Yu, Z. S., and Chu, B. G.: Shallow seismic exploration of the seismogenic structures of Tangshan earthquake, Earthq. Res. China, 14, 78–84, 1998.
Häring, M. O., Schanz, U., Ladner, F., and Dyer, B. C.: Characterisation of the Basel 1 enhanced geothermal system, Geothermics, 37, 469–495, https://doi.org/10.1016/j.geothermics.2008.06.002, 2008.
Healy, J. H., Rubey, W. W., Griggs, D. T., and Raleith, C.: The Denver earthquakes, Science, 161, 1301–1310, https://doi.org/10.1126/science.161.3848.1301, 1968.
Henderson, J. R., Barton, D. J., and Foulger, G. R.: Fractal clustering of induced seismicity in the Geysers geothermal area, California, Geophys. J. Int., 139, 317–324, https://doi.org/10.1046/j.1365-246x.1999.00939.x, 1999.
Hennings, P. H., Lund Snee, J. E., Osmond, J. L., DeShon, H. R., Dommisse, R., Horne, E., Lemons, C., and Zoback, M. D.: Injection-induced seismicity and fault-slip potential in the Fort Worth Basin, Texas, Bull. Seismol. Soc. Am., 109, 1615–1634, https://doi.org/10.1785/0120190017, 2019.
Hergert, T. and Heidbach, O.: Geomechanical model of the Marmara Sea region-II.3-D contemporary background stress field, Geophys. J. Int., 185, 1090–1102, https://doi.org/10.1111/j.1365-246x.2011.04992.x, 2011.
Hickman, S. and Zoback, M. D.: Stress orientations and magnitudes in the SAFOD pilot hole, Geophys. Res. Lett., 31, L15S12, https://doi.org/10.1029/2004GL020043, 2004.
Hsieh, P. A. and Bredehoeft, J. D.: A reservoir analysis of the Denver earthquakes: A case of induced seismicity, J. Geophys. Res., 86, 903–920, https://doi.org/10.1029/JB086iB02p00903, 1981.
Huang, B. S. and Yeong, T. Y.: The fault ruptures of the 1976 Tangshan earthquake sequence inferred from coseismic crustal deformation, Bull. Seismol. Soc. Am., 87, 1046–1057, https://doi.org/10.1029/96JB03669, 1997.
Huang, J. C. and Wan, Y. G.: Present tectonic stress field in the capital region of China determined from small and strong earthquake focal mechanisms, Earthquake, 35, 17–27, 2015.
Huang, L. Y., Yang, S. X., Cui, X. F., Chen, Q. C., and Yao, R.: Analysis of characteristics of measured stress and stability of faults in North China, Rock Soil Mech., 34, 204–213, 2013.
Hubbert, M. K. and Rubey, W. W.: Role of fluid pressure in mechanics of overthrust faulting: 1. Mechanics of fluid-filled porous solids and its application to overthrust faulting, Geol. Soc. Am. Bull., 70, 115–166, https://doi.org/10.1130/0016-7606(1959)70[115:ROFPIM]2.0.CO;2, 1959.
Hunt, T. M. and Latter, J. H.: A survey of seismic activity near Wairakei geothermal field, New Zealand, J. Volcanol. Geoth. Res., 14, 319–334, https://doi.org/10.1016/0377-0273(82)90068-3, 1982.
Jaeger, J. C., Cook, N. G. W., and Zimmerman, R. W.: Fundamentals of Rock Mechanics, 4th Edn., Wiley-Blackwell, ISBN 978-3-211-81164-1, 2007.
Jiang, W. L.: Discussion on seismogenic fault of the 1976 Tangshan earthquake, Seismol. Geol., 28, 312–318, 2006.
Keranen, K. M., Weingarten, M. W., Abers, G. A., Bekins, B. A., and Ge, S.: Sharp increase in central Oklahoma seismicity since 2008 induced by massive wastewater injection, Science, 345, 448–451, https://doi.org/10.1126/science.1255802, 2014.
Kim, K. H., Ree, J. H., Kim, Y. H., Kim, S. S., Kang, S. Y., and Seo, W.: Assessing whether the 2017 Mw 5.4 Pohang earthquake in South Korea was an induced event, Science, 360, 1007–1009, https://doi.org/10.1126/science.aat6081, 2018.
Kim, W. Y.: Induced seismicity associated with fluid injection into a deep well in Youngstown, Ohio, J. Geophys. Res.-Solid, 118, 3506–3518, https://doi.org/10.1002/jgrb.50247, 2013.
Langenbruch, C. and Shapiro, S. A.: Quantitative analysis of rock stress heterogeneity: Implications for the seismogenesis of fluid-injection-induced seismicity, Geophysics, 80, WC73–WC88, https://doi.org/10.1190/geo2015-0061.1, 2015.
Lee, H. and Ong, S. H.: Estimation of in situ stresses with Hydro-fracturing tests and a statistical method, Rock Mech. Rock Eng., 51, 779–799, https://doi.org/10.1007/s00603-017-1349-1, 2018.
Lee, K. K., Ellsworth, W. L., Giardini, D., Townend, J., Ge, S. M., Toshihiko, S., Yeo, I. W., Kang, T. S., Junkee, R., Sheen, D. H., Chang, C. D., Woo, J. U., and Langenbruch, C.: Managing injection-induced seismic risks, Science, 364, 730–732, https://doi.org/10.1126/science.aax1878, 2019.
Lei, X. L., Huang, D. J., Su, J. R., Jiang, G. M., Wang, X. L., Wang, H., Guo, X., and Fu, H.: Fault reactivation and earthquakes with magnitudes of up to Mw 4.7 induced by shale-gas hydraulic fracturing in Sichuan Basin, China, Scient. Rep., 7, 1–12, https://doi.org/10.1038/s41598-017-08557-y, 2017.
Li, J. H., Hao, S. J., Hu, Y. T., Yu, Z. S., and Chu, B. G.: A study on activity of the seismogenic fault for the Tangshan earthquake of 1976, Seismol. Geol., 20, 27–33,1998.
Li, P., Cai, M. F., Miao, S. J., and Guo, Q. F.: New insights into the current stress field around the Yishu fault zone, eastern China, Rock Mech. Rock Eng., 52, 4133–4145, https://doi.org/10.1007/s00603-019-01792-x, 2019.
Li, Q. Z., Zhang, Z. L., Jin, Y. M., Yu, X. C., and Li, Z. Y.: Focal mechanisms of Tangshan earthquakes, Seismol. Geol., 2, 59–67, 1980.
Li, S. X., Liu, B. H., Hua, Q. F., Zhao, Y. X., and Liu, C. G.: Characters of the Zhangjiakou-Penglai fault zone activity in the Bohai Sea since late Quaternary, Adv. Mar. Sci., 27, 332–341, https://doi.org/10.1016/S1874-8651(10)60080-4, 2009.
Li, W. J., Wang, P. D., and Chen, Q. F.: Moment tensor inversion of focal mechanism for the aftershock sequence of 1982 Lulong Ms 6.1 earthquake, Acta Seismol. Sin., 19, 115–122, https://doi.org/10.1007/s11589-002-0115-x, 2006.
Li, Y. L. and Dong, Y. X.: Influence of reserved stope roof thickness on its stability in the Macheng iron mine, Hydrogeol. Eng. Geol., 40, 79–82, https://doi.org/10.16030/j.cnki.issn.1000-3665.2013.02.017, 2013.
Li, Z. W., Ni, S. D., Roecker, S., Bao, F., Wei, X., and Yuen, D. A.: Seismic imaging of source region in the 1976 Ms 7.8 Tangshan earthquake sequence and its implications for the seismogenesis of intraplate earthquakes, Bull. Seismol. Soc. Am., 108, 1302–1313, https://doi.org/10.1785/0120170389, 2018.
Lin, X. D., Yuan, H. Y., Xu, P., Yang, X., Xu, Z. G., Sun, H. X., Hou, L. J., Xu, S. T., and Xi, C. X.: Zonational characteristics of earthquake focal mechanism solutions in North China, Chin. J. Geophys., 60, 4589–4622, https://doi.org/10.6038/cjg20171206, 2017.
Liu, B. J., Qu, G. S., Sun, M. X., Liu, K., Zhao, C. B., Xu, X. W., Feng, S. Y., and Kou, K. P.: Crustal structures and tectonics of Tangshan earthquake area: results from deep seismic reflection profiling, Seismol. Geol., 33, 901–912, https://doi.org/10.3969/j.issn.0253-4967.2011.04.014, 2011.
Liu, H. Y., Chen, Y. K., Yan, C. G., and Fei, Y.: Seismic risk evaluation on blind faults in Tianjin offshore areas, Technol. Earthq. Disast. Prevent., 8, 146–155, 2013.
Lund Snee, J. E. and Zoback, M. D.: State of stress in Texas: Implications for induced sesimicity, Geophys. Res. Lett., 43, 1–7, https://doi.org/10.1002/2016GL070974, 2016.
Lund Snee, J. E. and Zoback, M. D.: State of stress in the Permian Basin, Texas and New Mexico: Implications for induced seismicity, Lead. Edge, 37, 127–134, https://doi.org/10.1190/tle37020127.1, 2018.
McGarr, A.: Maximum magnitude earthquakes induced by fluid injection, J. Geophys. Res.-Solid, 119, 1008–1019, https://doi.org/10.1002/2013JB010597, 2014.
McGarr, A., Bekins, B., Burkardt, N., Dewey, J., Earle, P., Ellsworth, W. L., Ge, S., Hickman, S., Holland, A., Majer, E., Rubinstein, J., and Sheehan, A.: Coping with earthquakes induced by fluid injection, Science, 347, 830–831, https://doi.org/10.1126/science.aaa0494, 2015.
McTigue, D. F.: Flow to a heated borehole in porous, thermoelastic rock: Analysis, Water Resour. Res., 26, 1763–1774, https://doi.org/10.1016/0148-9062(91)92334-U, 1990.
Michael, A. J.: Use of focal mechanisms to determine stress: a control study, J. Geophys. Res.-Solid, 92, 357–368, https://doi.org/10.1029/JB092iB01p00357, 1984.
Minson, S. E. and Dreger, D. S.: Stable inversions for complete moment tensors, Geophys. J. Int., 174, 585–592, https://doi.org/10.1111/j.1365-246X.2008.03797.x, 2008.
Moeck, I., Kwiatek, G., and Zimmermann, G.: Slip tendency analysis, fault reactivation potential and induced seismicity in a deep geothermal reservoir, J. Struct. Geol., 31, 1174–1182, https://doi.org/10.1016/j.jsg.2009.06.012, 2009.
Murphy, H., Brown, D., Jung, R., Matsunaga, I., and Parker, R.: Hydraulics and well testing of engineered geothermal reservoirs, Geothermics, 28, 491–506, https://doi.org/10.2174/157019308786242197, 1999.
Nábělek, J., Chen, W. P., and Ye, H.: The Tangshan earthquake sequence and its implications for the evolution of the North China Basin, J. Geophys. Res., 92, 12615–12628, https://doi.org/10.1029/JB092iB12p12615, 1987.
Nagano, K., Moriya, H., Asanuma, H., Sato, M., Niitsuma, H., and Kaieda, H.: Down-hole acoustic emission measurement of hydraulic fracturing in Ogachi HDR model field, J. Geoth. Res. Soc. Jpn., 16, 85–108, https://doi.org/10.11367/grsj1979.16.85, 1994.
National Earthquake Data Center: Official earthquake catalogue, National Earthquake Data Center, China [data set], https://data.earthquake.cn/datashare/report.shtml?PAGEID=earthquake_zhengshi, last access: 15 May 2022.
Niu, L. L., Du, J. J., Feng, C. J., Meng, W., Li, G. Q., and Chen, Q. C: In-situ stress measurement of deep borehole in east of Hebei and its significance, Acta Seisml. Sin., 37, 89–102, https://doi.org/10.11939/jass.2015.01.008, 2015.
Papadopulos, I. S.: Nonsteady flow to multiaquifer wells, J. Geophys. Res., 71, 4791–4797, https://doi.org/10.1029/JZ071i020p04791, 1966.
Peng, Y. Q. and Meng, L. P.: Seismic structures of Hebei province, China, The Hebei people's Publishing House, ISBN 978-7-202-12269-3, 2017.
Qi, X. F., Shangguan, S. T., Zhang, G. B., Pan, M. M., Su, Y., Tian, L. L., Li, X., and Zhang, J. Y.: Site selection and developmental prospect of a hot dry rock resource project in the Matouying Uplift, Hebei Province, Earth Sci. Front., 27, 94–102, https://doi.org/10.13745/j.esf.2020.1.11, 2020.
Qin, X. H., Zhang, P., Feng, C. J., Sun, W. F., Tan, C. X., Chen, Q. C., and Peng, Y. R.: In situ stress measurements and slip stability of major faults in Beijing region, China, Chin. J. Geophys., 57, 2165–2180, https://doi.org/10.1002/cjg2.20113, 2014.
Qin, X. H., Chen, Q. C., Wu, M. L., Tan, C. X., Feng, C. J., and Meng, W.: In-situ stress measurements along the Beichuan-Yingxiu fault after the Wenchuan earthquake, Eng. Geol., 194, 114–122, https://doi.org/10.1016/j.enggeo.2015.04.029, 2015.
Qiu, Z. H., Ma, J., and Liu, G. X.: Discovery of the great fault of the Tangshan earthquake, Seismol. Geol., 27, 669–677, 2005.
Raleigh, C. B., Healy, J. H., and Bredehoeft, J. D.: An experiment in earthquake control at Rangely, Colorado, Science, 191, 1230–1237, https://doi.org/10.1126/science.191.4233.1230, 1976.
Ran, Z. J., Yang, Q. Y., Lv, G. J., Luo, Y. X., and Peng, Y. Q.: The preliminary study of the faults nearby Luanxian County, N. China Earthq. Sci., 31, 8–12, https://doi.org/10.3969/j.issn.1003-1375.2013.02.002, 2013.
Rutledge, J. T., Phillips, W. S., and Mayerhofer, M. J.: Faulting induced by forced fluid injection and fluid flow forced by faulting: An interpretation of hydraulic-fracture microseismicity, Carthage Cotton Valley Gas field, Texas, Bull. Seismol. Soc. Am., 94, 1817–1830, https://doi.org/10.1785/012003257, 2004.
Sanyal, S. K. and Butler, S. J.: An analysis of power generation prospects from enhanced geothermal systems, in: Proceedings World Geothermal Congress 2005, Antalya, Turkey, 24–29, 2005.
Segall, P. and Fitzgerald, S. D.: A note on induced stress changes in hydrocarbon and geothermal reservoirs, Tectonophysics, 289, 117–128, https://doi.org/10.1016/S0040-1951(97)00311-9, 1998.
Shapiro, S. A., Rentsch, S., and Rothert, E.: Characterization of hydraulic properties of rocks using probability of fluid-induced microearthquakes, Geophysics, 70, F27–F33, https://doi.org/10.1190/1.1897030, 2005.
Shapiro, S. A., Dinske, C., and Langenbruch, C.: Seismogenic index and magnitude probability of earthquakes induced during reservoir fluid stimulations, Lead. Edge, 29, 304–309, https://doi.org/10.1190/1.3353727, 2010.
Shedlock, K. M., Baranowski, J., Xiao, W., and Hu, X. L.: The Tangshan aftershock sequence, J. Geophys. Res., 92, 2791–2803, https://doi.org/10.1029/JB092iB03p02791, 1987.
Simiyu, S. M.: Induced micro-seismicity during well discharge, Geothermics, 28, 785–802, https://doi.org/10.1016/S0375-6505(99)00043-7, 1999.
Simpson, R. W.: Quantifying Anderson's fault types, J. Geophys. Res.-Solid, 102, 17909–17919, https://doi.org/10.1029/97JB01274, 1997.
Snoke, J. A.: Traveltime tables for iasp91 and ak135, Seismol. Res. Lett., 80, 260–262, https://doi.org/10.1785/gssrl.80.2.260, 2009.
Stanford Center for Induced and Triggered Seismicity: Fault Slip Potential (FSP), https://scits.stanford.edu/fault-slip-potential-fsp, last access: 7 January 2020.
Tan, C. X., Zhang, P., Feng, C. J., Qin, X. H., Sun, W. F., Chen, Q. C., and Wu, M. L.: An approach to deep borehole crustal stress measuring and real-time monitoring and its application in seismogeology research in Capital Beijing region, Acta Geolog. Sin., 88, 1436–1452, 2014.
Tan, C. X., Hu, Q. Y., Zhang, P., Feng, C. J., and Qin, X. H.: Present tectonic stress adjustment process before and after Japan Mw 9.0 earthquake in North and Northeast China and its research significance, Earth Sci. Front., 22, 345–359, https://doi.org/10.13745/j.esf.2015.01.030, 2015.
Terakawa, T., Miller, S. A., and Deichmann, N.: High fluid pressure and triggered earthquakes in the enhanced geothermal system in Basel, Switzerland, J. Geophys. Res., 117, 1–15, https://doi.org/10.1029/2011JB008980, 2012.
Tharaka, D. R., Wu, W., Ji, Y. L., and Ranjith, P. G.: Understanding injection-induced seismicity in enhanced geothermal systems: From the coupled thermo-hydro-mechanical-chemical process to anthropogenic earthquakes prediction, Earth-Sci. Rev., 205, 103182, https://doi.org/10.1016/j.earscirev.2020.103182, 2020.
Townend, J. and Zoback, M. D.: How faulting keeps the crust strong, Geology, 28, 399–402, https://doi.org/10.1130/0091-7613(2000)28<399:HFKTCS>2.0.CO;2, 2000.
Van der Elst, N. J., Page, M. T., Weiser, D. A., Goebel, T. H. W., and Hosseini, S. M.: Induced earthquake magnitudes are as large as (statistically) expected, J. Geophys. Res.-Solid, 121, 4575–4590, https://doi.org/10.1002/2016JB012818, 2016.
Vavryčuk, V.: Iterative joint inversion for stress and fault orientations from focal mechanisms, Geophys. J. Int., 199, 69–77, https://doi.org/10.1093/gji/ggu224, 2014.
Vavryčuk, V.: STRESSINVERSE package: joint inversion for stress and fault orientations from focal mechanisms, Institute of Geophysics of the Czech Acadmy os Sciences [code], http://www.ig.cas.cz/stress-inverse, 30 June 2022.
Verberne, B. A., He, C. R., and Christopher, J. S.: Frictional properties of sedimentary rocks and natural fault gouge from the Longmenshan fault zone, Sichuan, China, Bull. Seismol. Soc. Am., 100, 2767–2790, https://doi.org/10.1785/0120090287, 2010.
Walsh, F. R. and Zoback, M. D.: Oklahoma's recent earthquakes and saltwater disposal, Sci. Adv., 1, e1500195, https://doi.org/10.1126/sciadv.1500195, 2015.
Walsh, F. R. and Zoback, M .D.: Probabilistic assessment of potential fault slip related to injection-induced earthquakes: Application to north-central Oklahoma, USA, Geology, 44, G38275.1, https://doi.org/10.1130/G38275.1, 2016.
Walsh III, R., Zoback, M. D., Pais, D., Weingarten, M., and Tyrrell, T.: FSP1.0: A program for probabilistic estimation of fault slip potential resulting form fluid injection, https://scits.stanford.edu/software (last access: 7 January 2020), 2017.
Walters, R. J., Zoback, M. D., Baker, J. W., and Beroza, G. C.: Characterizing and responding to seismic risk associated with earthquake potentially triggered by fluid disposal and hydraulic fracturing, Seismol. Res. Lett., 86, 1110–1118, https://doi.org/10.1785/0220150048, 2015.
Wan, Y. G., Shen, Z. K., Diao, G. L., Wang, F.J., Hu, X. L., and Shen, S. Z.: An algorithm of fault parameter determination using distribution of small earthquakes and parameters of regional stress field and its application to Tangshan earthquake sequence, Chin. J. Geophys., 51, 793–804, 2008.
Wan, Y. G., Wan, Y. K., Jin, Z. T., Sheng, S. Z., Liu, Z. C., Yang, F., and Feng, T.: Rupture distribution of the 1976 Tangshan earthquake sequence inverted from geodetic data, Chin. J. Geophys., 60, 3378–3395, https://doi.org/10.1002/cjg2.30070, 2017.
Wang, J. H., Zhang, Y., and Wang, Y. J.: Analysis of influencing mining factors through 3D geological modeling Macheng mining area, China Min. Mag., 22, 127–134, 2013.
Wei, S., Avouac, J. P., Hudnut, K. W., Donnellan, A., Parker, J. W., Graves, R. W., Helmberger, D., Fielding, E., Liu, Z., Cappa, F., and Eneva, M.: The 2012 Brawley swarm triggered by injection-induced aseismic slip, Earth Planet. Sc. Lett., 422, 115–125, https://doi.org/10.1016/j.epsl.2015.03.054, 2015.
Weingarten, M., Ge, S., Godt, J. W., Bekins, B. A., and Rubinstein, J. L.: High-rate injection is associated with the increase in U.S. mid-continent seismicity, Science, 348, 1336–1340, https://doi.org/10.1126/science.aab1345, 2015.
Woo, J. U., Kim, M., Sheen, D. H., Kang, T. S., Rhie, J., Grigoli, F., Ellsworth, W. L., and Giardini, D.: An in-depth seismological analysis revealing a causal link between the 2017 Mw 5.5 Pohang earthquake and EGS project, J. Geophys. Res.-Solid, 124, 1–19, https://doi.org/10.1029/2019JB018368, 2019.
Xiao, W. W., Huang, Q., and Wang, R. J.: Distribution and fractal characteristics of stress drop in different earthquake regions, Acta Seismol. Sin., 14, 281–288, 1992.
Xu, J. R., Zhao, Z. X., and Ishikawa, Y.: Regional characteristics of crustal stress field and tectonic motions in and around Chinese mainland, Chin. J. Geophys., 51, 770–781, https://doi.org/10.1016/j.chemgeo.2008.02.011, 2008.
Yan, C. G., Wang, Z. S., Chen, Y. K., Ren, F., and Gao, W. P.: Comprehensive survery and investigation on the exact spatial location and activity of the Hangu fault in Tianjin, Earthq. Res. China, 30, 501–513, 2014.
Yang, K. S., Hu, P., and Dang, X .C.: A discussion on the generating mechanism of 1976 Tangshan earthquake based on the geologic structure of northern Huabei Basin, Earth Sci. Front., 17, 263–270, https://doi.org/10.1017/S0004972710001772, 2010.
Yang, S. X., Yao, R., Cui, X. F., Chen, Q. C., and Huang, L. Y.: Analysis of the characteristics of measured stress in Chinese mainland and its active blocks and North–South seismic belt, Chin. J. Geophys., 55, 4207–4217, https://doi.org/10.6038/j.issn.0001-5733.2012.12.032, 2012.
Yang, Y. Q., Wang, X. S., Wan, Y. G., Sheng, S. Z., and Chen, T.: Seismogenic fault segmentation of Tangshan earthquake sequence derived from focal mechanism solutions, Acta Seismol. Sin., 38, 632–643, https://doi.org/10.11939/jass.2016.04.009, 2016.
Ye, H., Shedlock, K. M., Hellinger, S. J., and Sclater, J. G.: The north china basin: An example of a Cenozoic rifted intraplate basin, Tectonics, 4, 153–169, https://doi.org/10.1029/TC004i002p00153, 1985.
You, H. C., Xu, X. W., Wu, J. P., and He, Z. Q.: Study on the relationship between shallow and deep structures in the 1976 Tangshan earthquake area, Seismol. Geol., 24, 571–582, 2002.
Yue, G. F., Deng, X. F., Xing, L. X., Lin, W. J., Liu, F., Liu, Y. G., and Wang, G. L.: Numerical simulation of hot dry rock exploitation using enhanced geothermal systems in Gonghe Basin, Sci. Technol. Rev., 33, 62–67, https://doi.org/10.3981/j.issn.1000-7857.2015.19.010, 2015.
Zang, A., Oye, V., Jousset, P., Deichmann, N., Gritto, R., McGarr, A., Majer, E., and Bruhn, D.: Analysis of induced seismicity in geothermal reservoirs – An overview, Geothermics, 52, 6–21, https://doi.org/10.1016/j.geothermics.2014.06.005, 2014.
Zeng, Y. C., Su, Z., and Wu, N. Y.: Numerical simulation of heat production potential from hot dry rock by water circulating through two horizontal wells at Desert Peak geothermal field, Energy, 56, 92–107, https://doi.org/10.1016/j.energy.2013.04.055, 2013.
Zhang, B. J., Gao, J., Li, Y. Y., Wang, G. L., Li, J., Xing, Y. F., and Zhao, T.: Genetic mechanism and indicative significance of hot dry rock in the Matouying, Hebei province, Acta Geol. Sin., 94, 2036–2051, https://doi.org/10.19762/j.cnki.dizhixuebao.2020226, 2020.
Zhang, H. Z., Diao, G. L., Chen, Q. F., Hu, X. L., Wang, X. S., and Zhang, Y. G.: Focal mechanism analysis of the recent earthquakes in Tangshan seismic region of M 7.6 in 1976, J. Seismol. Res., 31, 1–6, 2008.
Zhang, L. L., Song, F., Liu, X. S., She, S. Q., and Liu, D. J.: Research on the influence of Jidong iron exploitation on regional groundwater environment, Groundwater, 36, 91–94, 2014.
Zhang, S. H. and Ma, X. D.: Global frictional equilibrium via stochastic, local Coulomb frictional slips, J. Geophys. Res.-Solid, 126, e2020JB021404, https://doi.org/10.1029/2020JB021404, 2021.
Zhang, S. X., Wang, X. S., Chen, T., Gong, M., and Shan, L. J.: Seismic space-time evolution characteristics in Tangshan old seismic region during the past 40 years, N. China Earthq. Sci., 35, 32–37, https://doi.org/10.3969/j.issn.1003-1375.2017.01.005, 2017.
Zhang, W., Zhang, Q., Liu, Y. H., Zhu, W. P., and Tong, J.: Characteristics of magnetic and gravity anomalies of Lengkou fault in eastern Hebei and its geological functions, Geophys. Geochem. Explor., 37, 769–774, https://doi.org/10.11720/j.issn.1000-8918.2013.5.02, 2013.
Zhang, Y., Gao, L., Liu, X. C., Zhao, Y., Wang, D., and Zhang, J. Y.: Drilling technology of the M-1 well in hot dry rock of Matouying, Tangshan, Geol. Explor., 58, 176–186, 2022.
Zhao, G. M. and Yang, G. S.: Focal stress field by water injection-induced earthquakes and characteristics of coda wave attenuation, Seismol. Geol., 12, 303–310, 1990.
Zhao, Y. X.: The analysis of hydrocarbon accumulation conditions of the buried hill in Matouying-uplift-belt in Huanghua depression, China University of Geosciences for master of Engineering degree, Beijing, 2014.
Zheng, B. H., Guo, S. M., and Xu, H. M.: Preliminary study of principal features of the NW and NWW trending fault structures in the Yanshan region, Seismol. Geol., 3, 31–40, 1981.
Zheng, Y. P., Wang, Y., Chen, Y. K., and Han, G. Z.: Shallow tectonic characteristics of the Haihe fault in Tanggu area, Tianjin municipality, Adv. Mar. Sci., 24, 307–313, https://doi.org/10.1016/S1001-8042(06)60021-3, 2006.
Zhou, C. C.: Studies on the structure mode of Baigezhuang region and the identification and prediction of structure fracture of reservoirs, Guangzhou Institute of Geochemistry, Chinese Academy of Sciences, Guangzhou, https://kreader.cnki.net/Kreader/CatalogViewPage.aspx?dbCode=CDFD&filename=2003092513.nh&tablename=CDFD9908&compose=&first=1&uid= (last access: 9 July 2022), 2003.
Zhu, S. Y., Feng, C. J., Xing, L. X., Ren, Y. Z., Qi, B. S., Zhang, P., and Tan, C. X.: Changes in fault slip potential due to water injection in the Rongcheng deep geothermal reservoir, Xiong'an New Area, North China, Water, 14, 410, https://doi.org/10.3390/w14030410, 2022.
Zoback, M. D. and Gorelick, S. M.: Earthquake triggering and large-scale geologic storage of carbon dioxide, P. Natl. Acad. Sci. USA, 109, 10164–10168, https://doi.org/10.1073/pnas.1202473109, 2012.
Zoback, M. D. and Healy, J. H.: In situ stress measurements to 3.5 km depth in the Cajon Pass Scientific Research Borehole: Implications for the mechanics of crustal faulting, J. Geophys. Res., 97, 5039–5057, https://doi.org/10.1029/91JB02175, 1992.
Zoback, M. D., Barton, C. A., Brudy, M., Castillo, D. A., Finkbeiner, T., Grollimund, B. R., Moos, D. B., Peska, P., Ward, C. D., and Wiprut, D. J.: Determination of stress orientation and magnitude in deep wells, Int. J. Rock Mech. Min. Sci., 40, 1049–1076, https://doi.org/10.1016/j.ijrmms.2003.07.001, 2003.
Zoback, M. L.: First- and second-order patterns of stress n the lithoshpere: The World Stress Map Project, J. Geophys. Res.-Solid, 98, 11703–11728, https://doi.org/10.1029/92JB00132, 1992.
- Abstract
- Introduction
- Tectonics and seismicity in the Tangshan seismic region
- Methodology
- Present tectonic stress field in the Tangshan seismic region
- Results
- Discussion
- Concluding remarks
- Code availability
- Data availability
- Author contributions
- Competing interests
- Disclaimer
- Acknowledgements
- Financial support
- Review statement
- References
- Supplement