the Creative Commons Attribution 4.0 License.
the Creative Commons Attribution 4.0 License.
 | 11 Jul 2022
Geographic information system models with fuzzy logic for susceptibility maps of debris flow using multiple types of parameters: a case study in Pinggu District of Beijing, China
Yiwei Zhang
Jianping Chen
Qing Wang
Chun Tan
Yongchao Li
Xiaohui Sun
Yang Li
Debris flow is one of the main causes of loss of life and infrastructure damage in mountainous areas. This hazard should be recognized in the early stage of land development planning. According to field investigation and expert experience, a scientific and effective quantitative susceptibility assessment model was established in Pinggu District of Beijing. This model is based on geographic information system (GIS) combined with grey relational, data-driven and fuzzy logic methods. The influence factors, which are divided into two categories and consistent with the system characteristics of a debris flow gully, are selected, but also a new important factor is proposed. The results of the 17 models are verified using data published by the authority and validated by two other indexes, as well as area under curve (AUC). Through the comparison and analysis of the results, we believe that the streamlining of factors and scientific classification should attract attention from other researchers to optimize a model. We also propose a good perspective to make better use of the watershed feature parameters. These parameters fit well with the watershed units. With full use of insufficient data, scientific calculation and reliable results, the final optimal susceptibility map could potentially help decision makers in determining regional-scale land use planning and debris flow hazard mitigation. The model has advantages in economically weak areas with insufficient data in mountainous areas because of its simplicity, interpretability and engineering usefulness.
- Article
(5116 KB) - Full-text XML
- BibTeX
- EndNote


Debris flows are processes of rapid transport of water and soil materials in mountain watersheds, with sudden and destructive outbreaks (Di et al., 2019). Some debris flows can often cause devastating disasters and huge losses (Zhang et al., 2021), seriously threaten the lives and properties of people in the mountains and the safety of major projects, and restrict social and economic development (Iverson, 1997; Hungr et al., 2005; Hu et al., 2011; Takahashi, 2014; Wu et al., 2019). Mass movements in Beijing range in scale from shallow slope failures and rockfalls to catastrophic rock avalanches frequently mobilize to form debris flows, threatening the ecological environment of the mountainous area (Zhong et al., 2004). Especially in recent years, due to the superposition of extreme rainstorm weather and human engineering activities, debris flow events have increased gradually (Z. Li et al., 2021). As the capital of China, Beijing also has strong influence at home and abroad where geological disasters are widely concerned (Xie et al., 2004; Li et al., 2020b). With the deepening understanding of debris flow disaster and the updating of a database, a new and more accurate evaluation is also very necessary. Therefore, it is of great significance to establish an accurate and scientific debris flow susceptibility map.
Through previous studies, it can be summarized that the current research on debris flow mainly focuses on the following aspects: study on mechanism of debris flow, study on early warning and prediction of debris flow, study on numerical simulation of debris flow, and study on debris flow hazard analysis. Especially studies on debris flow hazard analysis gain the attention of the researchers as soon as they appear (Dong et al., 2009). Communicating information about debris flow hazard analysis is a crucial component of preparedness and hazard mitigation (Chiou et al., 2015). Susceptibility assessment, an important part of a hazard assessment of geological processes, is more flexible (Y. Li et al., 2021). In the early days, the susceptibility assessment of debris flows was mainly qualitative research using geomorphological information (Guzzetti et al., 1999). In 1976, the United Nations commissioned the International Union of Engineering Geology to conduct a risk assessment of debris flows, which marked the beginning of research on the susceptibility assessment of debris flows as an important research direction for disaster prevention and prediction (Li et al., 2020b). Many methods and techniques have been proposed to evaluate debris flow susceptibility assessment based on different qualitative and quantitative approaches along with geo-environmental information (Liu and Wang, 1995), such as the analytic hierarchy process (Wu et al., 2016), logistic regression method (Regmi et al., 2013; Conoscenti et al., 2015), information value (Akbar and Ha, 2011; Melo et al., 2012), support vector machine (Pourghasemi et al., 2017), frequency ratio (FR) (Sun et al., 2018), certainty factor (CF) (Tsangaratos and Ilia, 2015), neural network (Lee et al., 2003; Liu et al., 2005) and Bayesian network algorithm (Liang et al., 2012; Tien Bui et al., 2012). These methods have corresponding advantages and limitations for research subjects with different geological conditions. Generally speaking, it is easier to get satisfactory results by combining and comparing various methods (Meyer et al., 2014; Di Napoli et al., 2020; Fang et al., 2020). In summary, with the development of mathematical theory, the susceptibility assessment of debris flows has been extensively and quantitatively studied, and the research methods have also changed from single to comprehensive.
The economy in mountainous areas is often limited; we cannot supervise and verify every basin due to limited funds. The debris flow susceptibility assessment can give decision makers a basis for rational allocation of resources and determine which gullies should be focused on. In other words, the study plays a link role for other studies. Recently, with the development of mathematical theory, computer technology and the application of 3S (remote sensing, geography information systems, global positioning systems), the susceptibility assessment of debris flows has been extensively and quantitatively studied (Li et al., 2020a). As research progresses, debris flows are increasingly seen as an open system. There are many factors influencing the system, the combination of factors is nonlinear, and the interactions are chaotic. Therefore, it is very difficult to find a unified and standard evaluation model. At present, when the information is insufficient, field investigation and the experience of experts are necessary. However, the experience is often subjective and needs a lot of professional experience accumulation. It is very important to express the experience of experts objectively and understandably to serve decision makers. The application of fuzzy set theory in geographic information system (GIS) environments is effective for similar problems (Luo and Dimitrakopoulos, 2003; Porwal et al., 2006).
The main objective of this paper is to propose a GIS-based model. The results of expert experience scoring and site surveys are used as guidance and reference in the modeling process. We have tried to apply methods that can indicate the nonlinearity of the debris flow system. Finally, the modeling process should respect the laws of geomorphological evolution and the geological basis. Otherwise, the result will tend to be simply data fitting (Porwal et al., 2006).
The study area is located to the northeast of Beijing, China (Fig. 1), with a total area of 948.24 km2. The elevation of Pinggu is high in the northeast and low in the southwest. It is surrounded by mountains and accounts for about two-thirds of the total area on three sides in the southeast and north. The central and southern parts are alluvial plains. The area, geologically, is the west extension of the famous Jixian section, whose bedrock is mainly Middle and Late Proterozoic dolomite (Lü et al., 2017). The administrative unit of Pinggu District is used as the study area boundary, mainly considering that geological hazards frequently influence human economic activities, so political factors must be taken into account. Within the administrative region, inconsistent decision-making can be effectively avoided.
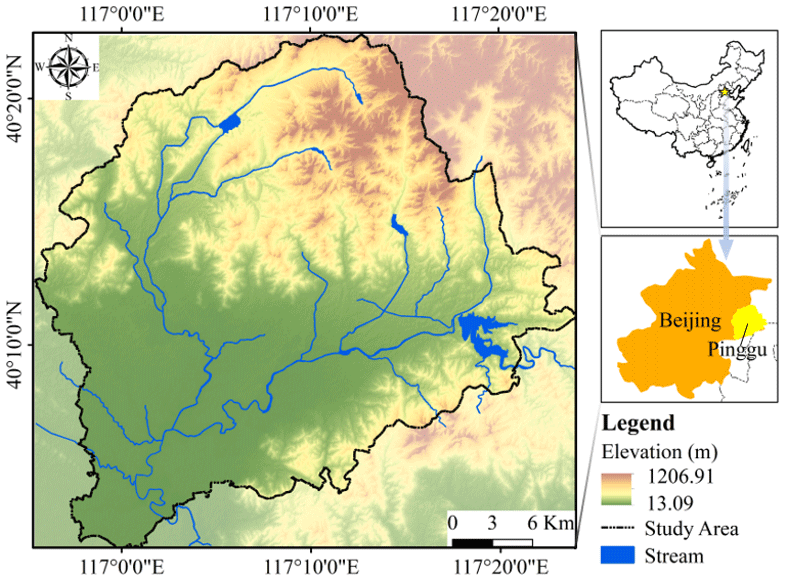
Figure 1Study area.
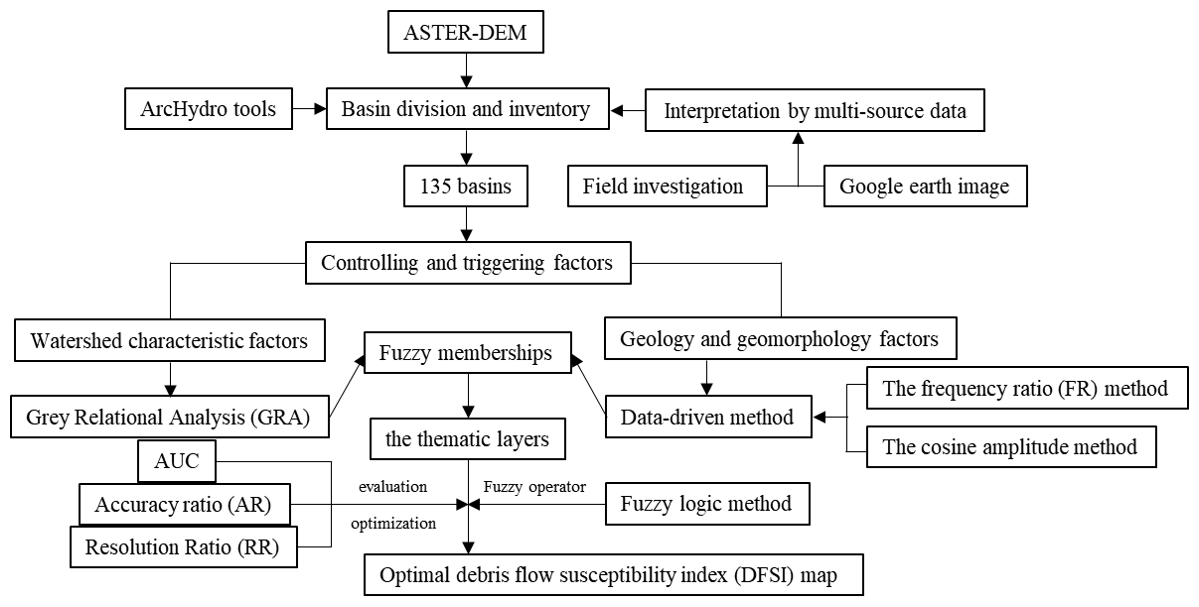
In this study, the susceptibility assessment of debris flow hazard was based on the drainage basin unit. In such a model, a hydrological response unit can fully represent the hillside hydrological process and will make the results more meaningful (Khan et al., 2013, 2016; Zou et al., 2019). First, drainage networks were extracted from the ASTER (Advanced Spaceborne Thermal Emission and Reflection Radiometer) digital elevation model (DEM) by using the ArcGIS ArcHydro Toolbox, and regions without obvious watershed characteristics were directly deleted. Then for each drainage basin, 19 controlling and triggering factors divided into two types were calculated. In addition, since these factors have different characteristics, different methods were used to calculate the fuzzy membership for different type factors. Field investigation is generally required in geological hazard surveys. If these data are applied to the model, it can help with the model building and reduce the time for model training. The weights derived from the grey relational analysis method used in the following section (Sect. 3.4.1) are based on the data from the field investigation. While geology and geomorphology factors are independent of watershed characteristics, it is suitable to use statistical methods to determine the objective weight. Finally, the debris flow susceptibility index (DFSI) map was derived by overlaying the factor thematic layers with the fuzzy logic method. The workflow of debris flow susceptibility assessment is shown in Fig. 2. First, a DEM map of the Pinggu area was downloaded. Then, the basin units were generated from the DEM map using the ArcHydro tool. The derived results were analyzed, and units that did not fit the characteristics of the watershed were removed. During the analysis, the field investigation data and Google images were referenced. After that, the controlling and triggering factors for the remaining 135 catchments were counted. For the fuzzy memberships, watershed characteristic parameters were determined by grey correlation, and the geological and geomorphological factors were determined by the frequency ratio (FR) method and the cosine amplitude method. Finally, the individual layers were overlaid by fuzzy logic operations to obtain the final map. As there were different combinations of factors, 17 results were derived. Three indexes (area under curve, AUC, accuracy ratio, AR, and resolution ratio, RR) were used to evaluate advantages and disadvantages of these results.
3.1 Debris flow basin division and inventory
There are many geological hazard points in mountainous areas, so it is not realistic to monitor them completely by professional teams. According to the monitoring and prevention staff and the villagers, the detailed field investigation (Fig. 3) for the evidence collection of debris flows will be carried out at the reported disaster point, aiming at recording the loose material, delineating the basin and exploring other important information on the debris flow gullies. Moreover, field investigation is also very important for model modification. Then based on the hydrology module in ArcGIS 10.2, the research object can be determined. Compared with grid unit and slope unit, the hydrological response unit for susceptibility of debris flow has greater advantages (Z. Li et al., 2021b; Zou et al., 2019). Finally, referring to the result of the field investigation and the remote sensing image, 135 basins are divided after removing the flat and irregular areas (Fig. 4), and of them 48 basins were investigated in the field, accounting for 36 %.
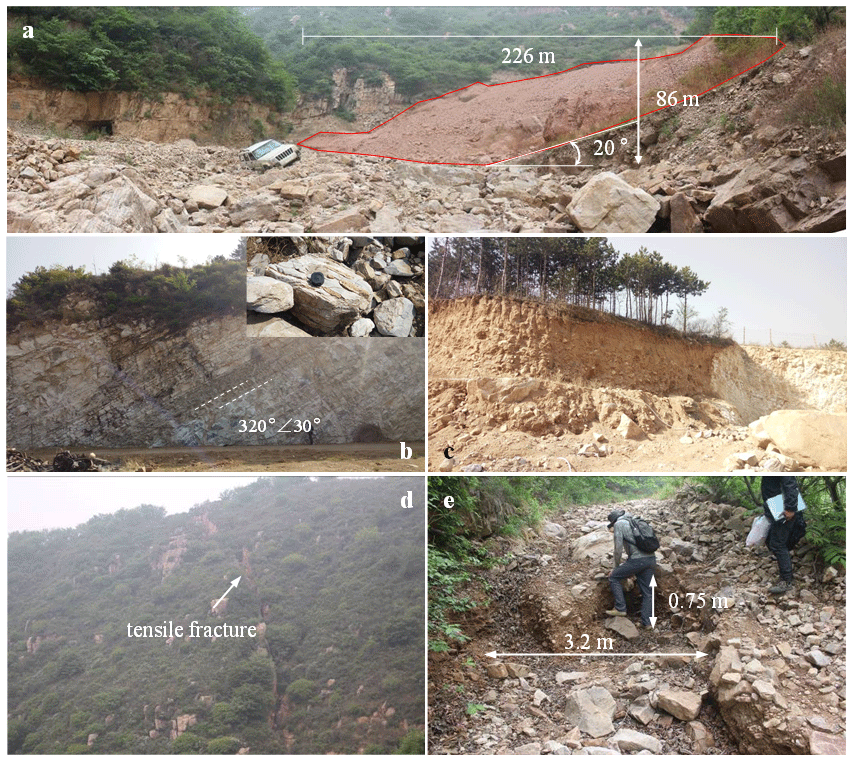
Figure 3Field investigation photos. (a) Loose material, (b) Middle and Late Proterozoic dolomite, (c) colluvium deposit, (d) slope fracture and (e) channel erosion phenomenon.
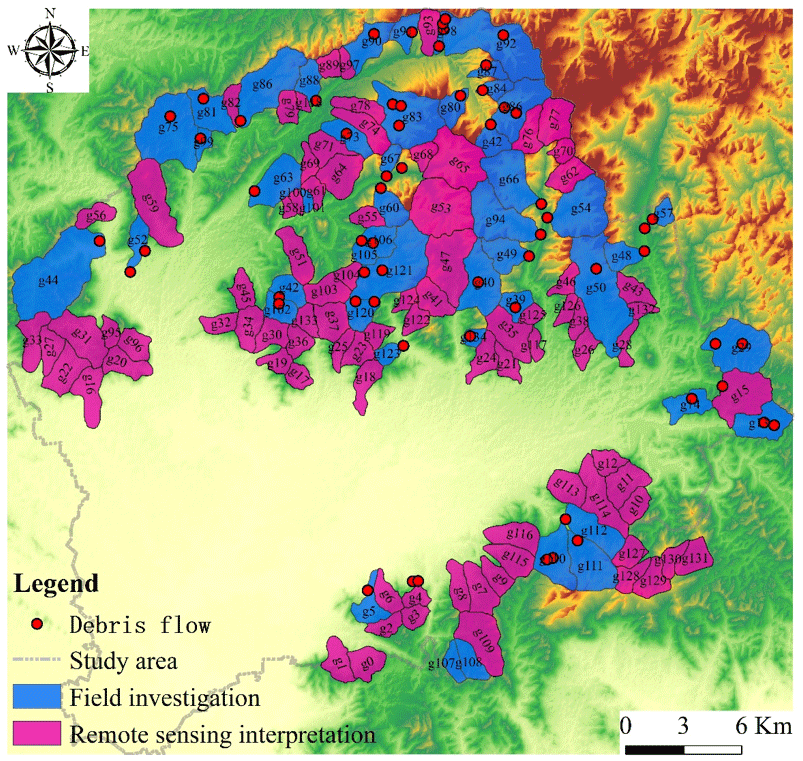
Figure 4Debris flow basin division and inventory. Note: the data of debris flow points come from the Beijing Municipal Commission of Planning and Natural Resources websites (Beijing Municipal Commission of Planning and Natural Resources, 2022).
3.2 Debris flow controlling and triggering factors
The basic requirement for the assessment of debris flows is that some factors included are easily obtainable, meaningful for susceptibility assessment, and can be used for evaluating the need for passive or active debris flow mitigation. According to previous studies, 19 factors are selected in this study. The factors are divided into two types (Table 1) because of their different characteristics. Watershed characteristic factors (Type A) can be directly quantified once the basin is determined (Fig. 5). The influence of these parameters is bounded by the watershed; geology and geomorphology factors (Type B) need to be further processed even if the watershed is determined. The scope of these parameters is independent of the watershed boundary.
Table 1Factors for susceptibility assessment.
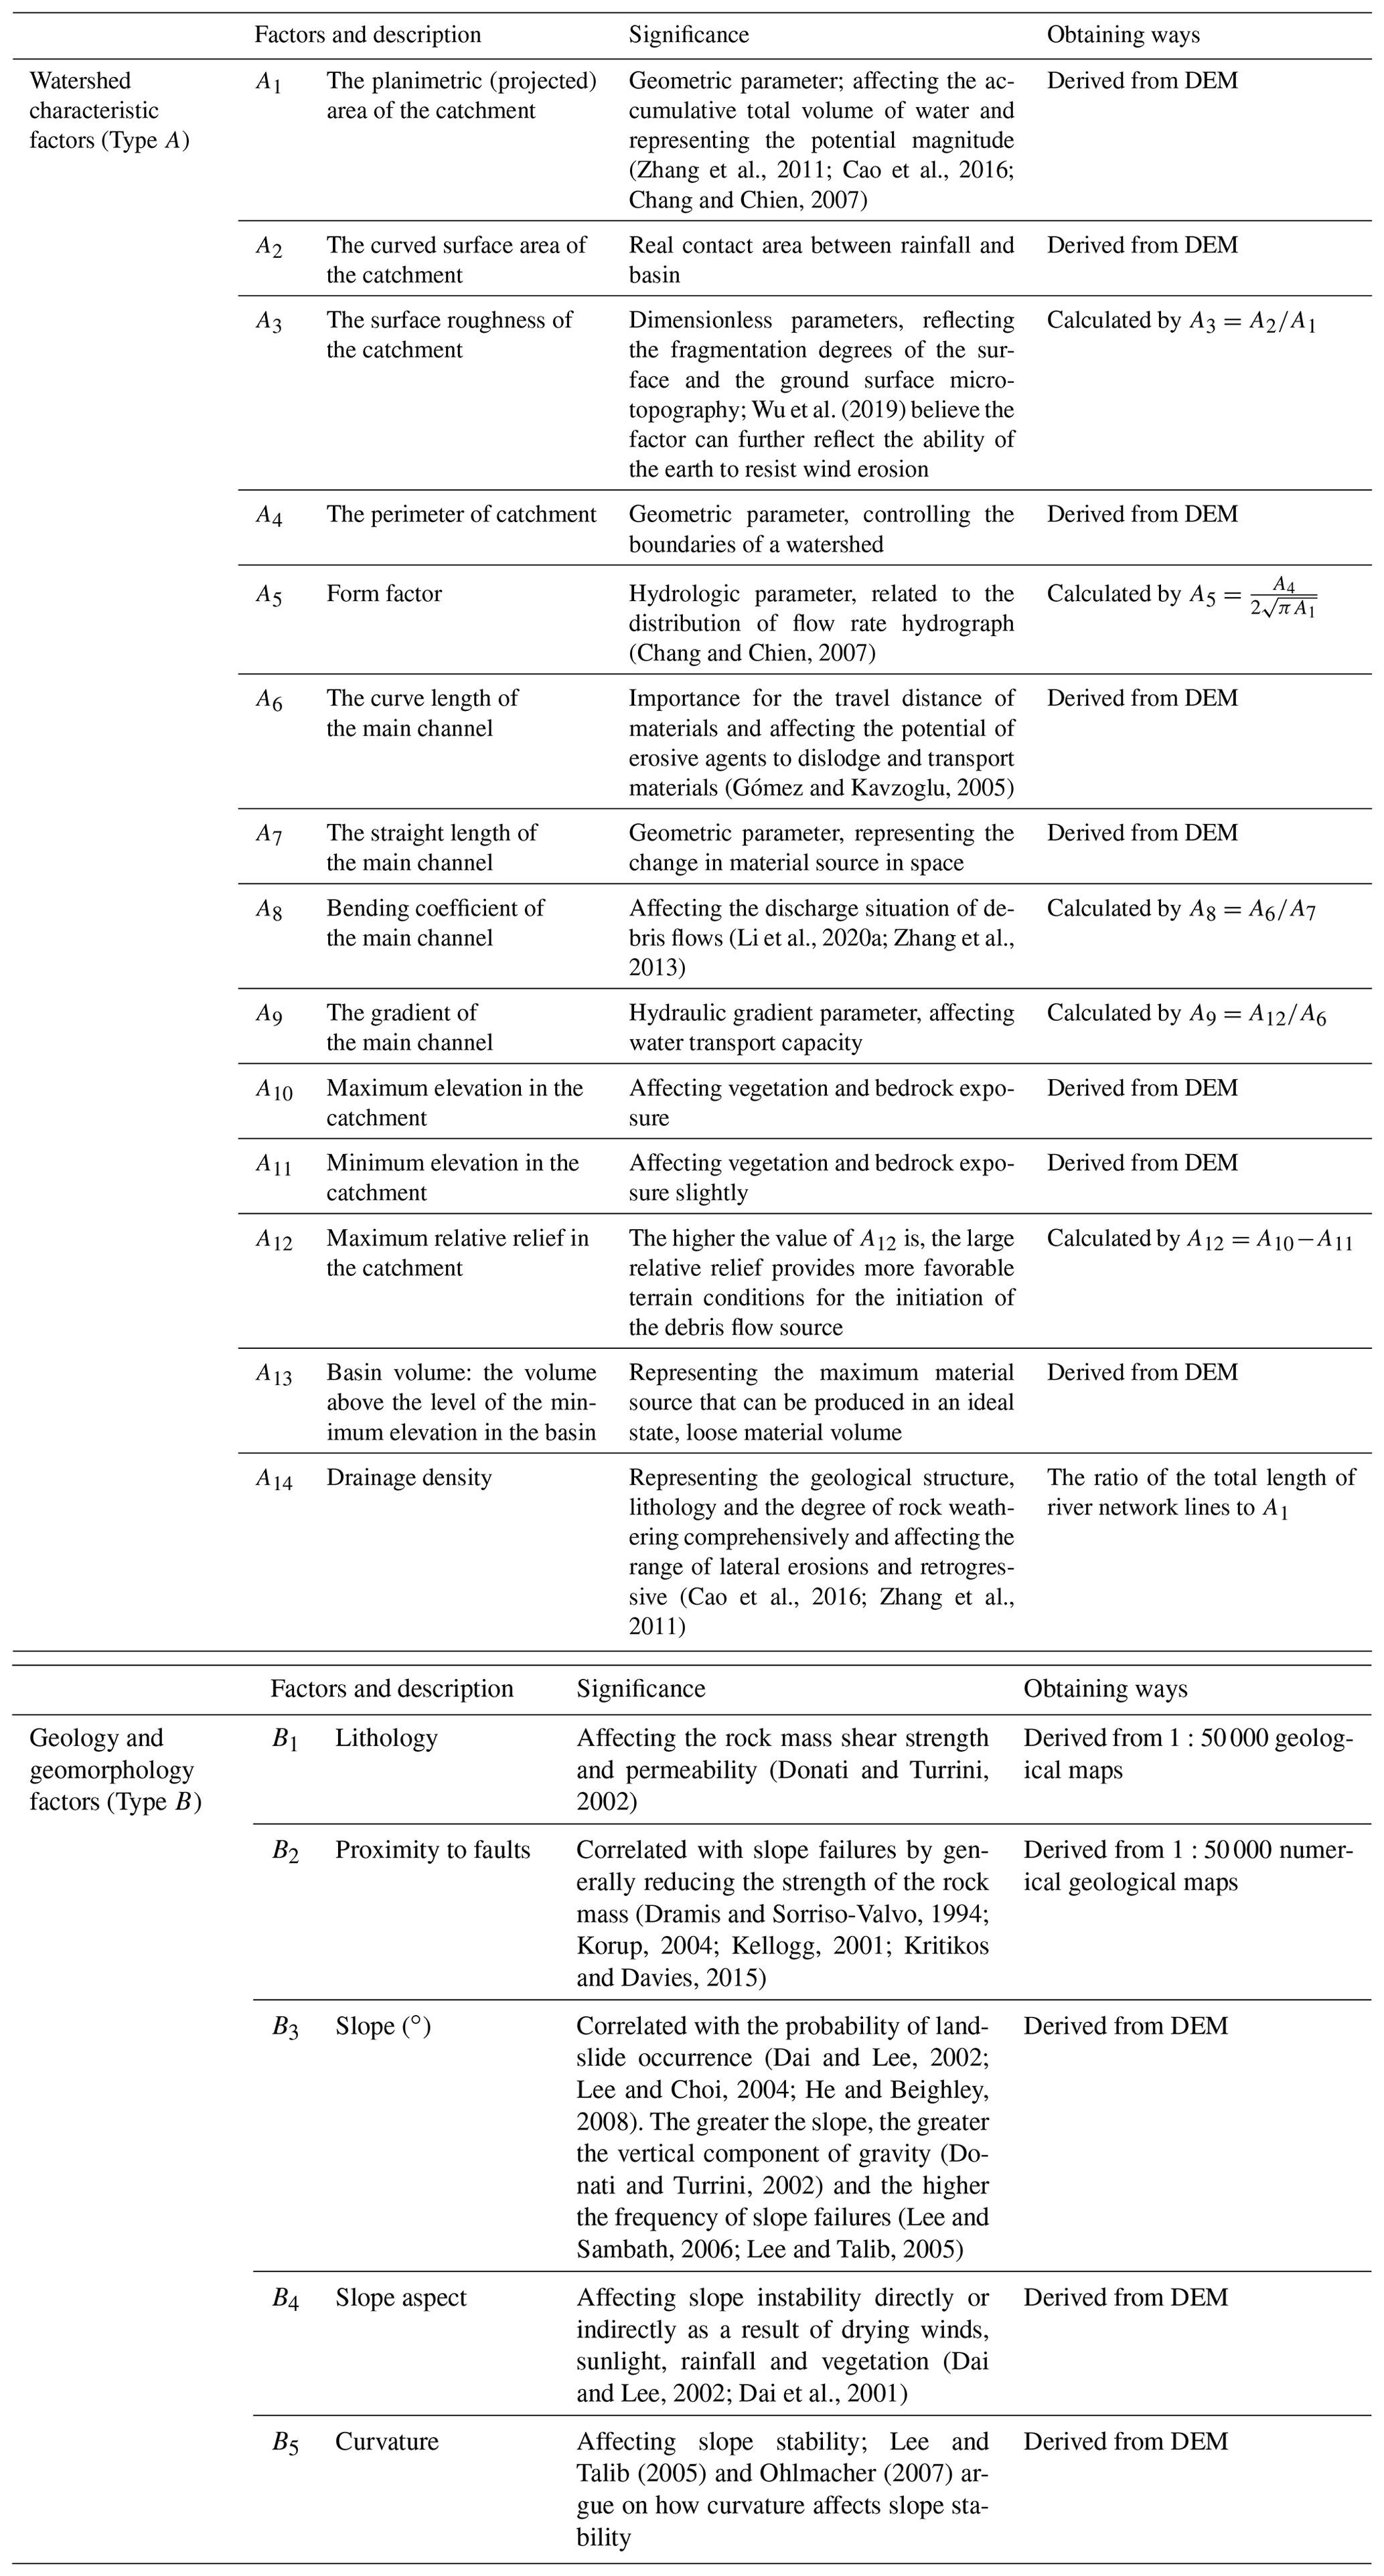
Note: the geological maps are provided by the Beijing Institute of Geological and Prospecting Engineering, and the digital elevation model (DEM) of the study area is from the Shuttle Radar Topography Mission (SRTM) DEM with a resolution of 30 m (http://www.gscloud.cn/sources/accessdata/310?pid=302, last access: 25 June 2022).
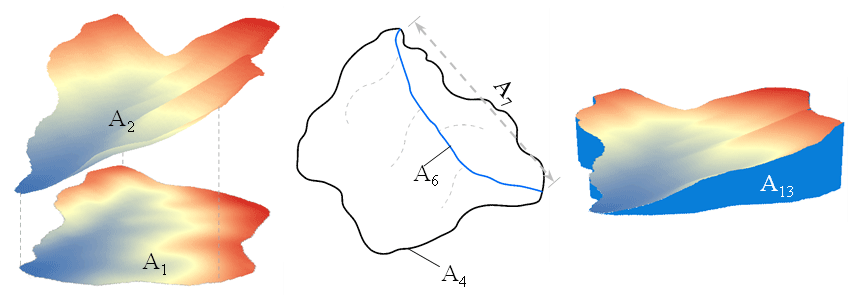
Figure 5Graphical illustration of some Type A factors. A1 is the planimetric (projected) area of the catchment, A2 is the curved surface area of the catchment, A4 is the perimeter of the catchment, A6 is the curve length of the main channel, A7 is the straight length of the main channel, and A13 is basin volume.
3.3 Fuzzy logic in susceptibility modeling
Fuzzy set theory is proposed by Zadeh (1965). It is an efficient way of expressing the concept of partial set membership degree. This concept differs from classical binary (0–1 value) logic. More words with transitional fuzzy descriptions (such as low, medium and high) are used (Kritikos and Davies, 2015). This fuzzy expression is particularly applicable to geological hazard classification. In the theory of fuzzy sets, elements have different degrees of membership in the interval [0, 1]: 1 represents complete membership, and 0 represents non membership. Ross (1995) showed that fuzzy systems are useful in two general situations (Kritikos and Davies, 2015). The method is very consistent with the characteristics of debris flow system, whose predisposing factors are fuzzy in nature and whose mechanism is complex and not fully understood. In the application of the fuzzy logic method, the critical step is to find the suitable fuzzy membership of factors. Fuzzy membership degree is equivalent to the weight in the expert scoring method, which is calculated by the objective method rather than given subjectively.
3.4 Fuzzy memberships
3.4.1 Grey relational analysis (GRA) in susceptibility modeling
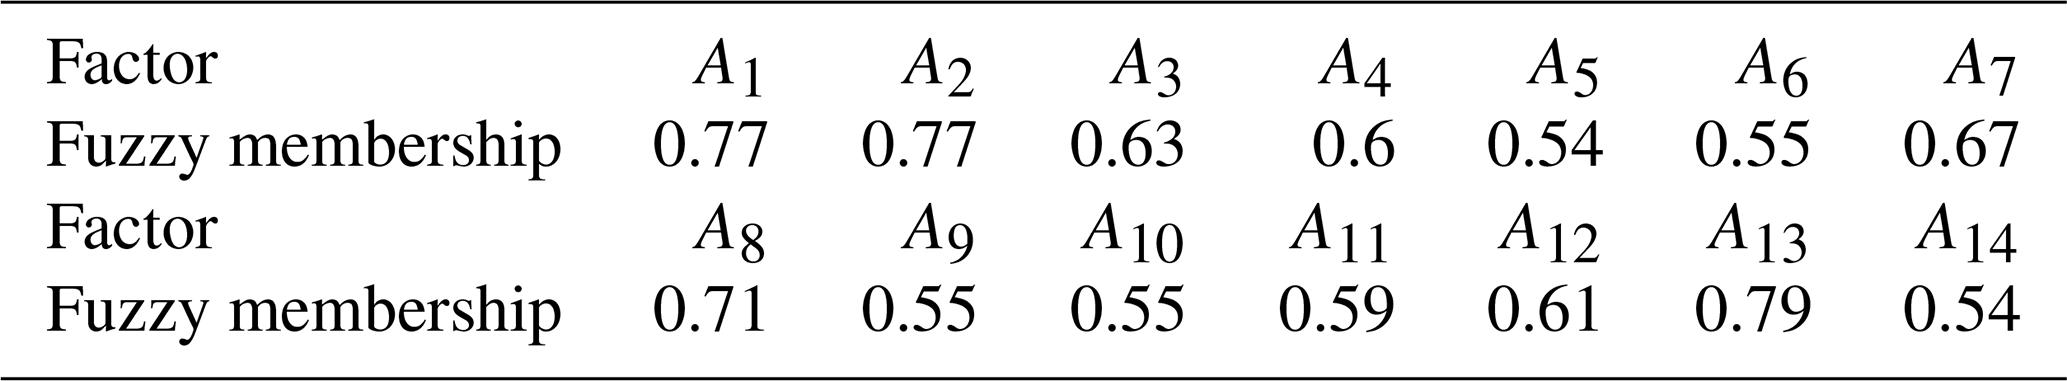
GRA is proposed by Deng (1982), and it is an important part of grey system theory (Wang et al., 2014). Comparing with mathematical statistics methods which need lots of sample data, typical probability distribution and large calculations, GRA is applicable to small sample size with the data whether regular or not. There will be no inconsistency between qualitative analysis and quantitative analysis (Deng, 1988). Moreover, it is to excogitate the leading and potential factors that affect the development of the system and quantitatively describe the development and change trend of the system by studying whether the relative change trend of the grey factor variables with complex relationship is consistent in the process of system development and evolution (Liu et al., 2004). Thus, grey correlation analysis is introduced to quantify the correlation between each factor and the evaluation results according to field investigation and expert experience. First, the procedure of GRA is to translate the performance of every alternative into a comparability sequence (Lin and Lin, 2002; Kuo et al., 2008; Wei et al., 2017). Therefore, according to the technical standard “Specification of geological investigation for debris flow stabilization (DZ/T0220-2006)” (Ministry of Natural Resources of the People’s Republic of China, 2006), published by the China Ministry of Lands and Resources, the preliminary assessment results of debris flow susceptibility are obtained, which are used as the reference sequence of the grey relation method (Table 2). Second, the grey correlation coefficient of all A factors is calculated by Eq. (1). Finally, the average grey relational coefficient (the correlation degree) is calculated by Eq. (2) as the fuzzy memberships (Table 3).
where ξi(k) is the grey relational coefficient, i= 1, 2, …, n are the number i of type A factors, k= 1, 2, …, n are the number of basins, x0(k) is the reference sequence (ideal target sequence), and xi(k) is the number i of the Type A factor sequence.
where ri is the correlation degree in the range (0, 1). N is the total number of basins in Table 2
Table 2Quantitative evaluation grade standard table for debris flow susceptibility.

Note: 130 ≥ score ≥ 116, VH; 115 ≥ score ≥ 87, M; 86 ≥ score ≥ 44, L; and 43 ≥ score ≥ 15, N. VH is very high susceptibility, M is moderate susceptibility, L is low susceptibility, and N is non-debris flow.
3.4.2 Data-driven method in susceptibility modeling
Landslide is one of the main fixed sources of debris flow in mountainous area. Shallow landslides are one of the most common categories of landslides. They frequently involve large areas and different soils in various climatic zones (Benda and Dunne, 1987; Selby, 1982; Borrelli et al., 2014). Great debris flows may result from numerous, small slope failures that subsequently coalesce (Fairchild, 1987; Roeloffs, 1996), from flow enlargement due to incorporation of bed and bank debris (Pierson et al., 1990; Bovis and Dagg, 1992), or from large, individual landslides that mobilize partially or almost totally (Vallance and Scott, 1997; Iverson et al., 1997). Debris flows may also scour steep channels to bedrock and accelerate sediment delivery to downstream, lower-gradient channels. The spatial and temporal distribution of shallow landslides are important controls on landscape evolution and a major component of both natural and management-related disturbance regimes in mountain drainage basins (Tsukamoto et al., 1982; Dietrich et al., 1986; Benda and Dunne, 1987; Crozier et al., 1990). Therefore, the landslide susceptibility assessment methods can be used for reference to debris flow susceptibility assessment.
For Type B factors which cannot be characterized by a specific number, the frequency ratio (FR) method and the cosine amplitude method can be used to derive their fuzzy memberships. The FR ratio defined as Eq. (3). Considering the fuzzy membership must be in the interval [0, 1], the FR values of the different categories are normalized by the largest FR value (Lee, 2006; Pradhan, 2010, 2011a, b) within the same type factor (Table 4) in order to derive the function.
where N(Di) is the number of debris flow pixels in the category i, N(Ci) is the total number of pixels in the category i, N(D) is total number of debris flow pixels in the study area, and N(A) is the total number of pixels in the study area.
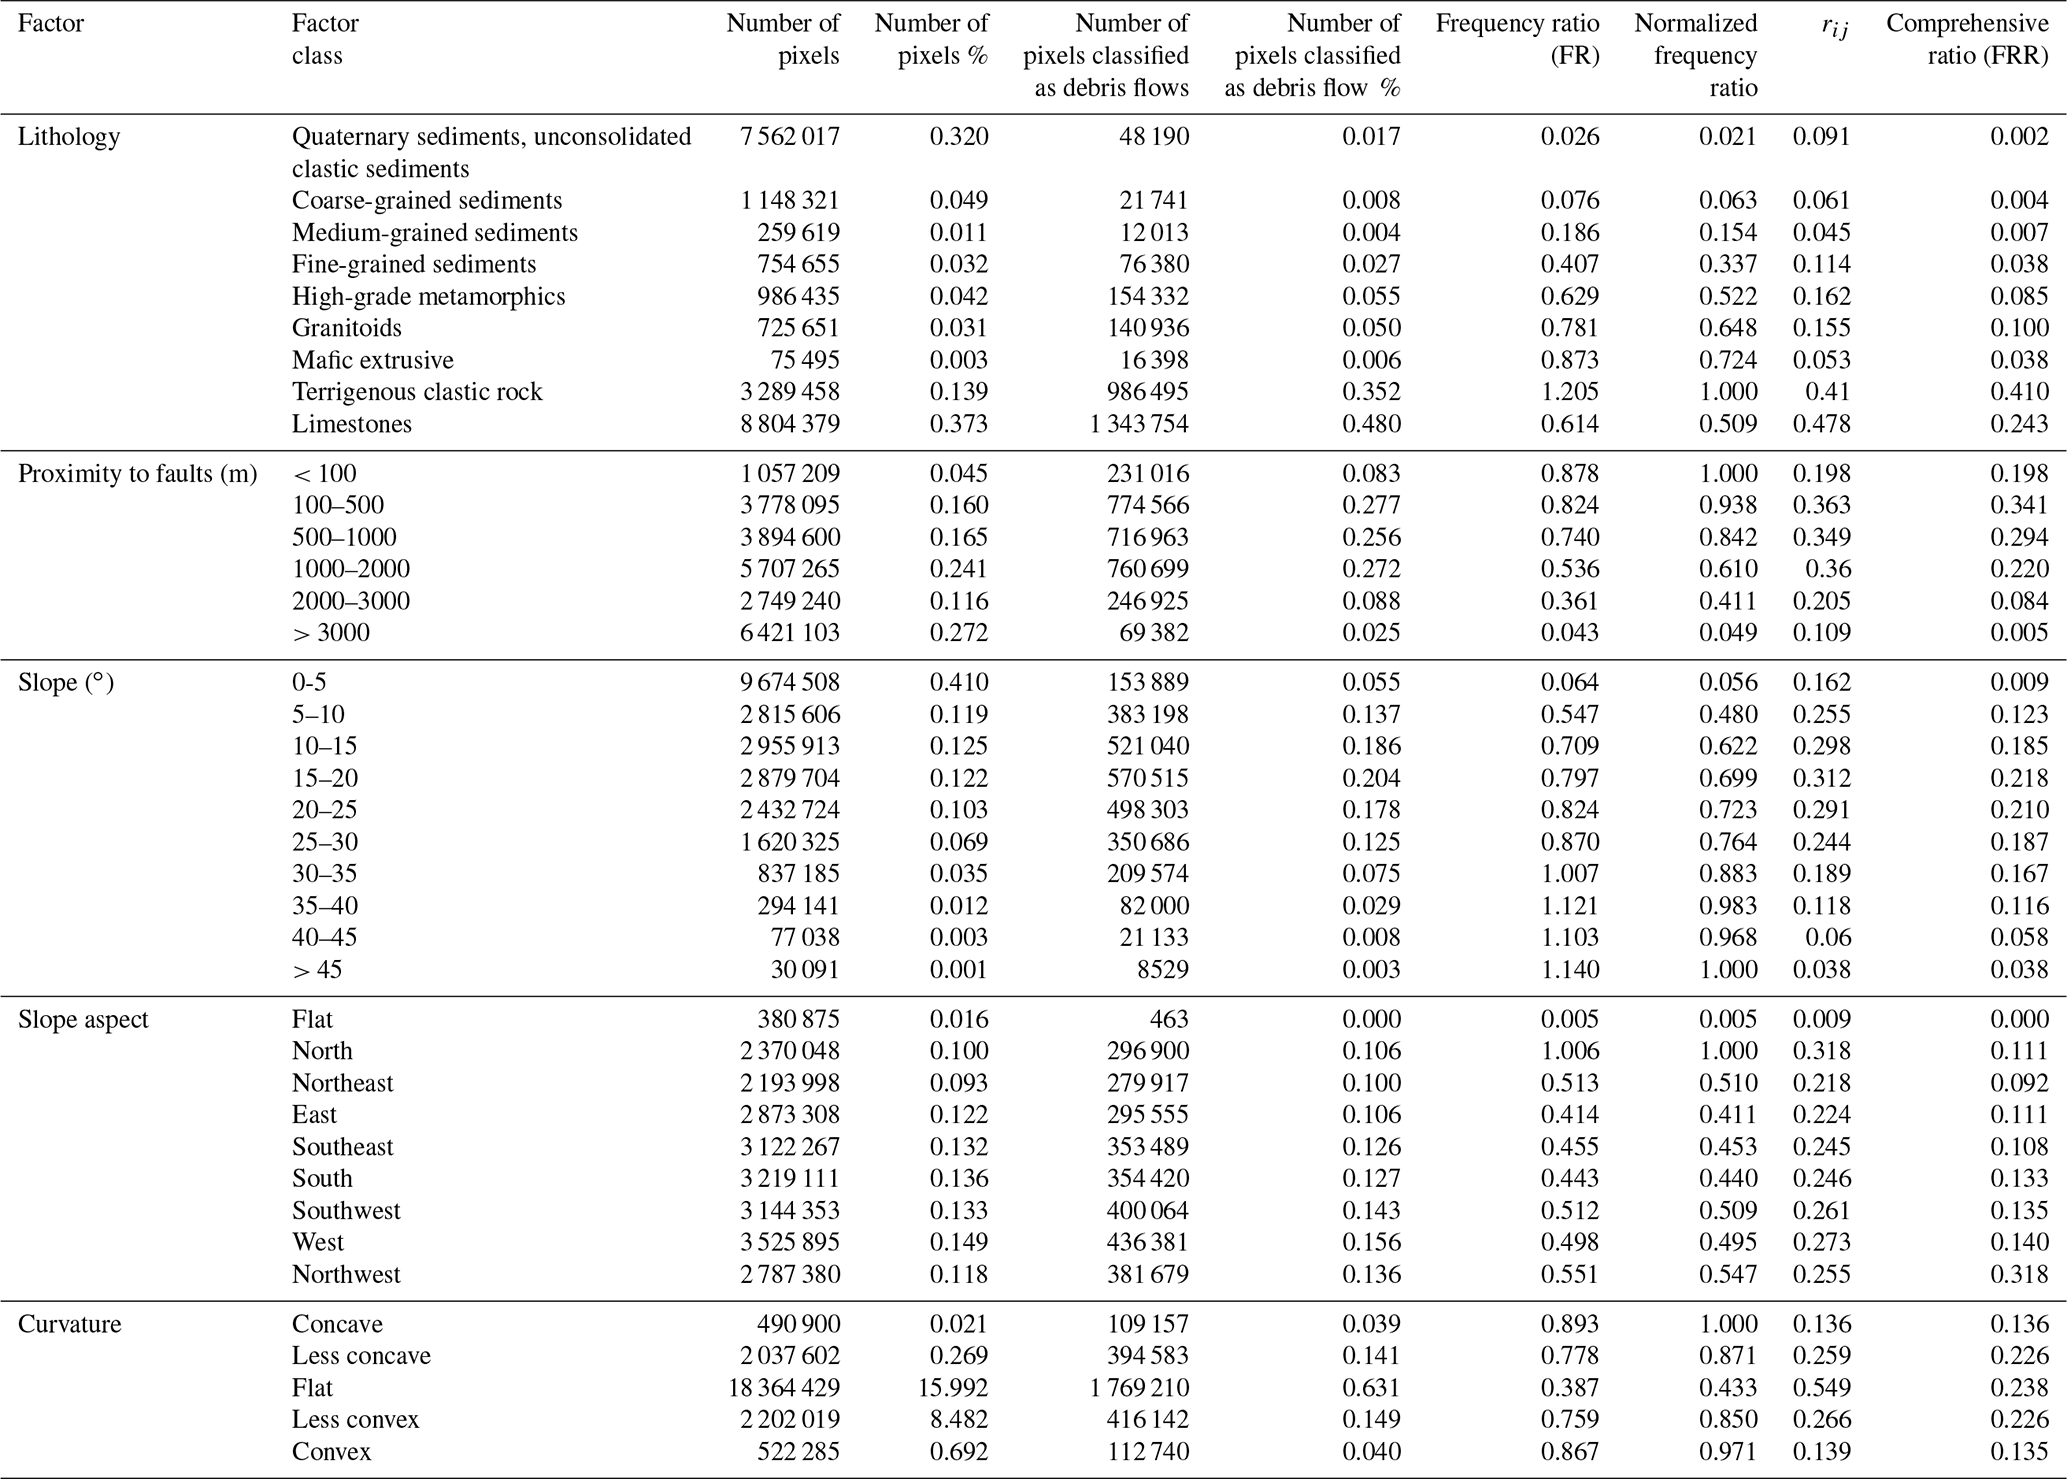
The cosine amplitude method (Ross, 1995) is also widely used (Ercanoglu and Gokceoglu, 2004; Kanungo et al., 2006, 2009; Ercanoglu and Temiz, 2011) to establish relationships among elements of two or more datasets (Kritikos and Davies, 2015). Assuming that n is the number of data samples (categories of a factor used in the analysis) represented as an array X= {x1,x2, …, xn} and that each of its elements, xi, is a vector of length m (i.e. the size of the raster image) and can be expressed as , …, xim}, then each element of a relation rij results from a pairwise comparison of a factor category xi with a category of the debris flow distribution layer xj (debris flow or non-debris flow). The memberships can be calculated by Eq. (4):
As an analogy with the study of Kanungo et al. (2006), we defined the rij value for any given factor category as the ratio of the total number of debris flow pixels in the category to the square root of the product of the total number of pixels in that category and the total number of debris flow pixels in the area. Values of rij close to 1 indicate similarity, whereas values close to 0 indicate dissimilarity between the two datasets (Kritikos and Davies, 2015). What is more, every thematic layer must use the same pixel size to use the method properly.
3.5 DFSI map
To derive the debris flow susceptibility index (DFSI) map by overlaying the factor thematic layers using the fuzzy logic method, the “fuzzified” factors represented by information layers in raster format with values ranging from 0 to 1 need to be combined. Compared with the other four fuzzy operators, fuzzy gamma (Eq. 5) is more suitable for the research (Kritikos and Davies, 2015). To determine the appropriate γ value, the results of different gamma values were compared by the greatest distance (Kritikos and Davies, 2015) between the average DFSI curves of the debris flow locations and non-debris flow locations (for example, flat pixels) (Fig. 6). Finally, 0.9 is determined for the γ value because there is the greatest difference between debris flow and non-debris flow location areas. In order to illustrate the superiority of our model through a comparison, 17 results are calculated in ArcGIS.
where μ(x) is the combined membership value, μi is the fuzzy membership function for the ith map, i= 1,2, …, n are the numbers of thematic layers to be combined, and γ is a parameter in the range (0, 1).
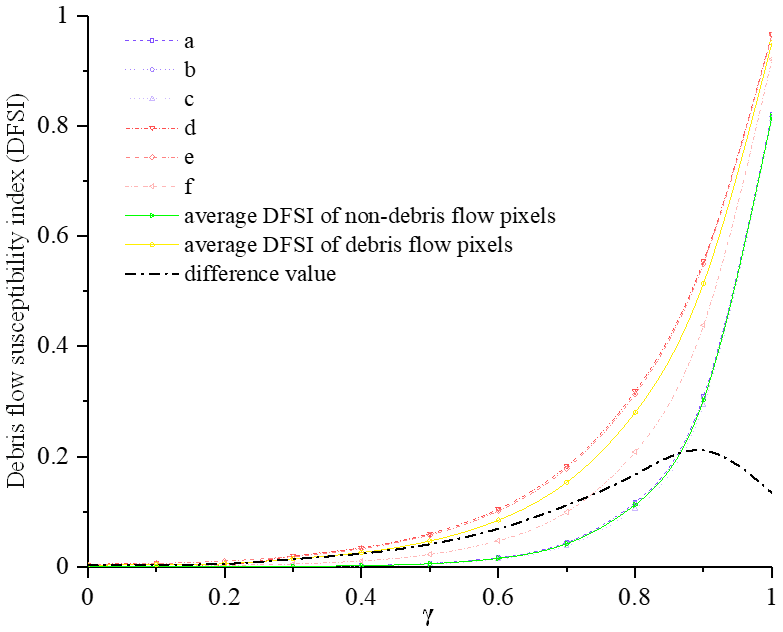
Figure 6Effect of γ value on debris flow susceptibility index (DFSI). Curves d, e and f correspond to debris flow pixels, and curves a, b and c correspond to non-debris flow area where a debris flow is unlikely. According to curve i, the maximum difference between the average DFSI values is observed for γ≈0.9.
To find the optimal model, 17 results were compared (Table 5). According to the distribution map of potential geological hazard points and susceptibility map in Pinggu District published by the Beijing Municipal Commission of Planning and Natural Resources (Beijing Municipal Commission of Planning and Natural Resources, 2022), three indexes are used to verify the validity and accuracy of the model.
Table 5Predictive performance of different models.

Note: selected A factors with fuzzy membership more than 0.6; FRR represents the product of FR and rij; performance index is normalized by the largest FR value.
The results of the model are independent of the model itself, so the predictive performance of the final map is not just “the goodness of fit” of the data (Chung et al., 1995; Remondo et al., 2003). A relatively reliable technique for quantitatively assessing how good a model is is the construction of validation or success rate curves (Chung and Fabbri, 1999; van Westen et al., 2003; Remondo et al., 2003; Frattini et al., 2010) based on a comparison between the spatial distribution of debris flows and modeled debris flow susceptibility. The curves illustrate the debris flow recorded in the area with respect to susceptibility values also expressed as cumulative percentages of the total area. The area under the curve (AUC) defines the success rate (Marjanović et al., 2011). Generally, AUC values above 0.7 indicate model performance can be acceptable, while below 0.7, the performance is considered poor (Kritikos and Davies, 2015).
Although AUC is an effective evaluation method, the results are not comprehensive as mathematical features for selecting the best measurement model because of insufficient data for validation. In order to ensure the objectivity of the results, we can only effectively use the recorded debris flow gully as positive and the others as negative. Thus, a two-category test is proposed to verify the model in this paper. First, the DFSI map of each model is divided into two categories by the natural breaks (Jenks) method (Fig. 7). Then the accuracy ratio (AR) is defined as the frequency of the number of debris flows both classified by model and simultaneously recorded on site to the number of debris flows recorded on site. The resolution ratio (RR) is defined as the number of debris flows classified by model and simultaneously recorded on site to the total number of debris flows classified by the model (in red color). Take R4, for example; there are in total 135 basins in the research area but only 46 records of debris flows (Fig. 3). In the results of two categories by the natural breaks (Jenks) method, 20 basins are divided into debris flow, while there are only 14 debris flows among them. Then 14 divided by 46 is AR, and 14 divided by 20 is RR.
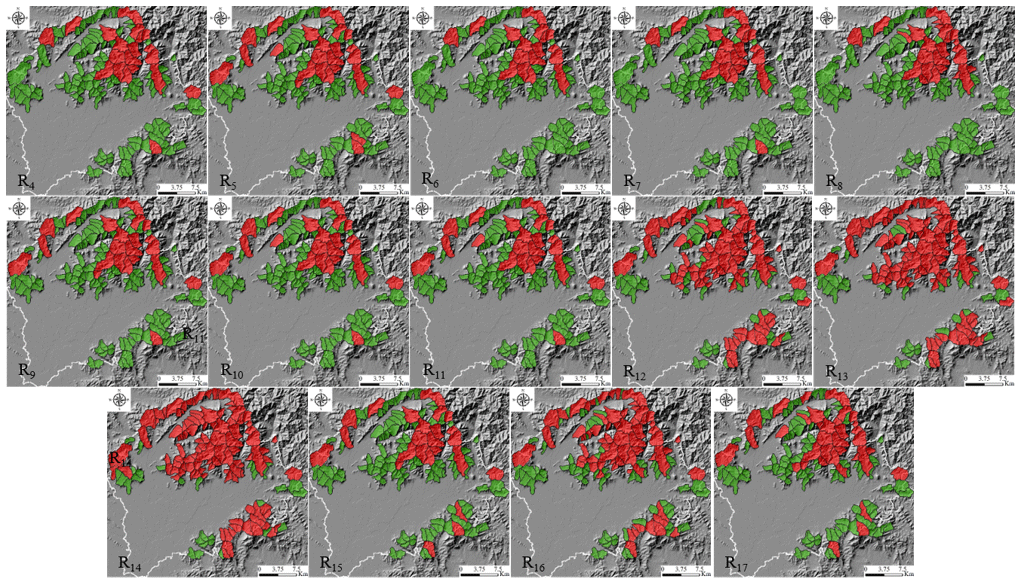
Figure 7Results of two categories by natural breaks (Jenks) method.
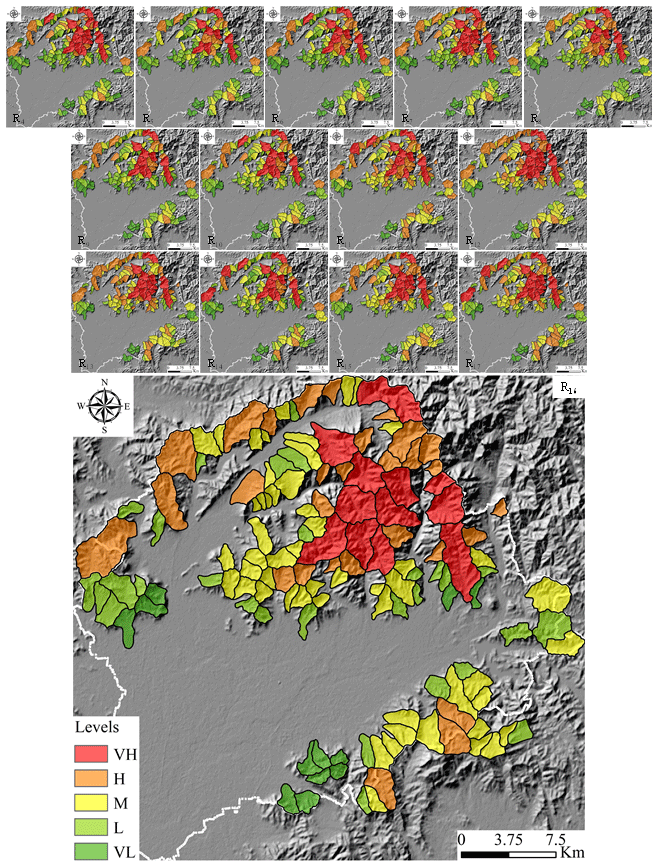
Figure 8Debris flow susceptibility maps. Note: AUC results of R1–R4 below 0.7 are not shown. VH represents very high susceptibility area, H represents high susceptibility area, M represents moderate susceptibility area, L represents low susceptibility area, and VL represents very low susceptibility area.
The higher the two values are, the better the susceptibility map is. Finally, the performance of models (P value) can be obtained by Eq. (6). AUC values less than 0.6 are directly eliminated. Comparing the results of the rest of the models, the result of R16 is optimal, and the results of the DFSI map are in good agreement with those of field investigation (Fig. 8).
Through the modeling process, relatively satisfactory results are obtained in this paper. The predictive performance of the output debris flow susceptibility maps, obtained from 17 different models, is verified by comparing them with maps published by relevant authorities. By comparing the results, the following results are discussed.
Firstly, comparing R1, R2, R3, R4 and R5, it can be concluded that the model based on field investigation and expert experience is more effective than data driven directly when the information is insufficient. This is mainly because when the basin area reaches a certain size, it is no longer controlled by one or several factors but becomes a complex system. It is not only the factors that affect the system, but also the system will react to each factor. Geomorphic evolution is basically the result of the interaction of the endogenic and exogenic geological processes. A geological period can be regarded as the beginning of one endogenic geological process to the next one. In the early stage of the geological period, endogenic geological processes play a major role, and in the later relatively stable period, exogenic geological processes will take on more important parts. In this large cycle, a small cycle of energy accumulation and release occurs in the basin continuously, which leads to extremely complex system changes. In addition, there is a contradiction between the scale of geological evolution and the scale of engineering activities. So limited information can be obtained under these conditions, which leads to the unreliability of data-driven evaluation. Therefore, in the current period, field investigation and expert experience are fundamental.
Secondly, by comparing R4 and R5, R6 and R9, R7 and R10, R8 and R11, R12 and R15, R13 and R16, and R14 and R17, it can be concluded that the accuracy and resolution of the model can be improved by simplifying the factors, which will eliminate the ones with weak correlation and independence. In practical applications, even if the susceptibility map is obtained, the classification of the susceptibility degree is still a very difficult problem because everyone's subjective definition of “susceptibility degree” is different. By simplifying the factors, the main ones can be selected, which magnifies the differences between basins, so the boundaries between different susceptibility degrees are more obvious.
Thirdly, by comparing R6 and R12, R7 and R13, R8 and R14, R9 and R15, R10 and R16, and R11 and R17, it can be concluded that the appropriate classification of factors is helpful to optimize the susceptibility assessment model because the properties of the factors divided into one category are relatively consistent, as well as the impact on the debris flow system. We can also infer that the nonlinear combination characteristics between different types are stronger and scientific classification can improve the performance of the model.
Fourthly, comparing R12 and R13, as well as R15 and R16, it can be concluded that the frequency ratio method is better than the cosine amplitude method in the study. Different from the study of Kritikos and Davies (2015), the watershed unit rather than the grid unit is used, which indicates that the former has a wide range of applications, while the latter has a disadvantage of strict conditions.
Based on the results of the above four analyses, the most optimal model should have the features of being based on expert experience, using selected factors, classifying factors before using them and using the frequency ratio method. Then the model R16 is selected according to the features, which is well in accordance with theoretical method performance score, and gets fine mutual verification.
There is also the selection of factors to discuss, which is still a very complex dilemma. Although 19 factors selected cannot fully evaluate the character of a basin, it is necessary to consider that they are easily and relatively accurately obtainable for each basin. This will facilitate a wide range of applications. Moreover, rainfall and total amount of loose material source are also very important influencing factors. But according to the Beijing hydrological manual, the rainfall change in the study area is not obvious, so it is excluded in the model. The total amount of loose material source cannot be obtained for the watershed without on-site investigation, so calculations are impossible. In fact, we indirectly consider the influence of natural loose material source by evaluating geological conditions but cannot consider the impact of human activities. As for the factors describing debris flow magnitude, usually several channels have the recorded data.
The scientific and systematic principle of model building is another challenge. To correctly classify the factors, it is necessary to grasp the characteristics of the formation, movement and accumulation of debris flow. Therefore, the classification should comprehensively consider the development background (geology, geomorphology, climate, hydrology, soil, vegetation, human activities and other factors). What the practical principle refers to is that the study should not only fully obtain scientific and accurate results but also make the professional results be understood by decision makers. Although the susceptibility grade and susceptibility value of each watershed are obtained, the results are relatively effective in this study area. In addition, with the development of technology and theory, we should replace some traditional factors which are not easy to quantify with more precise quantitative factors to improve the efficiency and accuracy of evaluation, such as surface roughness instead of drainage density.
We would like to further discuss the results derived from Table 3. It can be seen from the results that the occurrence of debris flow is highly correlated with basin volume, basin area and main gully bending coefficient with fuzzy membership above 0.7 in the Beijing area. Rainfall in the study area is abundant to induce the debris flow. Loose sources and sinks in the total volume of the catchment become more important. The watershed area determines the total volume of the catchment. For the same rainfall, generally, the larger the area is, the larger the catchment is. The bending coefficient reflects the replenishment sources along the channel. The greater the coefficient is, the slower the flow is. Then loose source along the channel has more time to replenish. Basin volume characterizes the maximum amount of loose material that can be supplied. These three features reflect the development characteristics of debris flow in the study area. It also provides ideas for disaster prevention and mitigation.
Finally, we should consider decision making under uncertainty because the debris flow phenomenon is extremely complex. The classification of geologists (high, moderate and low) is ambiguous for decision makers. It is more beneficial for them to use mathematically rigorous definitions. Considering that geological conditions tend to vary greatly from region to region, it is not appropriate to define a fixed limit. The Jenks method (chosen in this paper) can be used to classify sensitivity maps according to the characteristics of the data. We can also further process the data according to the needs of decision makers, such as identifying 10 % of the watersheds in the entire region as high risk. However, the applicability of the model to extreme rainfall and seismic conditions is not considered.
In this study, a new combination model for debris flow susceptibility based on GIS was developed in Pinggu. The objective and motivation of this study are to demonstrate a simple, extensible and convenient analytical model for the debris flow prediction. Three methods are selected in the model, each with their own advantages. GRA has great advantages in the case of fewer samples, the data-driven method is mainly used to reduce subjectivity, and fuzzy logic is fitted to solve nonlinear problems with fuzzy classification. The output optimal debris flow susceptibility maps demonstrated satisfactory performance with the relative higher susceptibility values corresponding to AUC = 0.768. The predictive performance of the susceptibility maps and the spatial correlation of debris flow gully with H and VH susceptibility with recorded debris flows illustrate that the assessment at regional scale using the proposed method is feasible. Compared with the previous results (Li et al., 2020b) based on grid units, the evaluation results are basically the same, but the model is more targeted at debris flow disasters for decision makers. Moreover, considering that the meaning of the factors used is clear and the data are easy to obtain, these conditions mentioned enable the model to be widely applied. In addition, a new factor (basin) is proposed in our study, which contributes greater weight – up to 0.79. From our 17 results by comparing the control variables, we suggest that other scholars should pay more attention to the classification and streamlining of factors, whose potential value to improve model accuracy has been indicated. It was also found that the watershed characteristic parameters can better reflect the advantages of the watershed unit, but further development is needed.
In short, an effort has been made to develop a cost- and time-efficient debris flow susceptibility assessment model. The model has an acceptable degree of accuracy for regional-scale planning and helps to make susceptibility and risk maps more accessible to individuals and local authorities. The GIS-based methods and modern data availability especially through online databases are significantly beneficial to this aim. However, a challenge remains in producing results with practical accuracy for the scale of planning using available resources. Previous studies highlight that the effectiveness of the final map depends on the quality of input data. Updating and improving existing debris flow catalogues and inventories are crucial for the development of reliable susceptibility and risk assessment methods.
The data presented in this research are available from the first or corresponding author upon reasonable request.
YZ contributed to the conceptualization, investigation, data collection and analyses, methodology, and model visualization. In addition, YZ wrote the original manuscript. JC contributed to conceptualization, methodology, validation and funding acquisition. JC also critically reviewed and edited the manuscript. QW contributed to funding acquisition and data curation. CT contributed to resources and supervision. YL contributed to the investigation, data collection and methodology. XS contributed to methodology. YL contributed to data collection. All authors have read and agreed to the published version of the manuscript.
The contact author has declared that none of the authors has any competing interests.
Publisher's note: Copernicus Publications remains neutral with regard to jurisdictional claims in published maps and institutional affiliations.
This article is part of the special issue “Advances in flood forecasting and early warning”. It is not associated with a conference.
This research was financially supported by the Key Project of NSFC-Yunnan Joint Fund (grant no. U1702241) and the National Key Research and Development Plan (grant no. 2018YFC1505301). The authors would like to thank Yuchao Li, Zhihai Li, Jiejie Shen, Feifan Gu, Zhu Liang and Meng Yao for their contributions to the collection of field data, as well as the editor and anonymous reviewers for their comments and suggestions which helped a lot in making this paper better.
This research has been supported by the Key Project of NSFC-Yunnan Joint Fund (grant no. U1702241) and the National Key Research and Development Program of China (grant no. 2018YFC1505301).
This paper was edited by Heidi Kreibich and reviewed by three anonymous referees.
Akbar, T. A. and Ha, S. R.: Landslide hazard zoning along Himalayan Kaghan Valley of Pakistan – by integration of GPS, GIS, and remote sensing technology, Landslides, 8, 527–540, https://doi.org/10.1007/s10346-011-0260-1, 2011.
Beijing Municipal Commission of Planning and Natural Resources: The distribution map of potential geological hazard points and susceptibility map in pinggu district, http://ghzrzyw.beijing.gov.cn/zhengwuxinxi/zxzt/dzzhfzzt/zzzhdcpg/202008/t20200807_1976436.html, last access: 25 June 2022.
Benda, L. E. and Dunne, T.: Sediment routing by debris flow, in: Erosion and sedimentation in the Pacific Rim, edited by: Beschta, R. L., Blinn, T., Grant, G. E., Swanson, F. J., and Ice, G. G., IAHS P., 213–223, https://doi.org/10.1111/j.1753-4887.1977.tb06503.x, 1987.
Borrelli, L., Cofone, G., Coscarelli, R., and Gullà, G.: Shallow landslides triggered by consecutive rainfall events at Catanzaro strait (Calabria–Southern Italy), J. Maps, 11, 730–744, https://doi.org/10.1080/17445647.2014.943814, 2014.
Bovis, M. and Dagg, B.: Debris flow triggering by impulsive loading - mechanical modeling and case-studies, Can. Geotech. J., 29, 345–352, https://doi.org/10.1139/t92-040, 1992.
Cao, C., Xu, P., Chen, J., Zheng, L., and Niu, C.: Hazard assessment of debris-flow along the baicha river in heshigten banner, inner mongolia, china, Int. J. Environ. Res. Pu., 14, 1–19, https://doi.org/10.3390/ijerph14010030, 2016.
Chang, T. C. and Chien, Y. H.: The application of genetic algorithm in debris flows prediction, Environ. Geol., 53, 339–347, https://doi.org/10.1007/s00254-007-0649-2, 2007.
Chiou, I. J., Chen, C. H., Liu, W. L., Huang, S. M., and Chang, Y. M.: Methodology of disaster risk assessment for debris flows in a river basin, Stoch. Env. Res. Risk. A, 29, 775–792, https://doi.org/10.1007/s00477-014-0932-1, 2015.
Chung, C.-J. F. and Fabbri, A. G.: Probabilistic prediction models for landslide hazard mapping, Photogramm. Eng. Rem. S., 65, 1389–1399, https://doi.org/10.1016/S0924-2716(99)00030-1, 1999.
Chung, C. J. F., Fabbri, A., and Westen, C. J. v.: Multivariate regression analysis for landslide hazard zonation, Adb, Nat. Technol. Haz., 5, 107–133, 1995.
Conoscenti, C., Ciaccio, M., Caraballo-Arias, N. A., Gómez-Gutiérrez, Á., Rotigliano, E., and Agnesi, V.: Assessment of susceptibility to earth-flow landslide using logistic regression and multivariate adaptive regression splines: A case of the Belice River basin (western Sicily, Italy), Geomorphology, 242, 49–64, https://doi.org/10.1016/j.geomorph.2014.09.020, 2015.
Crozier, M. J., Vaughan, E. E., and Tippett, J. M.: Relative instability of colluvium-filled bedrock depressions, Earth Surf. Proc. Land., 15, 329–339, https://doi.org/10.1002/esp.3290150404, 1990.
Dai, F. C. and Lee, C. F.: Landslide characteristics and slope instability modeling using GIS, Lantau Island, Hong Kong, Geomorphology, 42, 213–228, https://doi.org/10.1016/S0169-555X(01)00087-3, 2002.
Dai, F. C., Lee, C. F., Li, H.-Z., and Xu, C.: Assessment of landslide susceptibility on the natural terrain of Lantau Island, Hong Kong, Environ. Geol., 40, 381–391, https://doi.org/10.1007/s002540000163, 2001.
Deng, J. L.: Control problems of grey systems, Syst. Control Lett., 1, 288–294, https://doi.org/10.1016/S0167-6911(82)80025-X, 1982.
Deng, J. L.: Grey prediction and decision, Huazhong University of Science and Technology Press, Wuhan, ISBN 7-5609-0269-3, 1988.
Di, B., Zhang, H., Liu, Y., Li, J., Chen, N., Stamatopoulos, C. A., Luo, Y., and Zhan, Y.: Assessing susceptibility of debris flow in southwest china using gradient boosting machine, Sci. Rep.-UK, 9, 12532, https://doi.org/10.1038/s41598-019-48986-5, 2019.
Dietrich, W. E., Wilson, C. J., and Reneau, S. L.: Hollows, colluvium, and landslides in soil-mantled landscapes, in: Hillslope Processes, edited by: Abrahams, A. D., Allen & Unwin, Boston, 1986.
Di Napoli, M., Carotenuto, F., Cevasco, A., Confuorto, P., Di Martire, D., Firpo, M., Pepe, G., Raso, E., and Calcaterra, D.: Machine learning ensemble modelling as a tool to improve landslide susceptibility mapping reliability, Landslides, 17, 1897–1914, https://doi.org/10.1007/s10346-020-01392-9, 2020.
Donati, L. and Turrini, M. C.: An objective method to rank the importance of the factors predisposing to landslides with the GIS methodology: application to an area of the Apennines (Valnerina; Perugia, Italy), Eng. Geol., 63, 277–289, https://doi.org/10.1016/S0013-7952(01)00087-4, 2002.
Dong, J.-J., Lee, C.-T., Tung, Y.-H., Liu, C.-N., Lin, K.-P., and Lee, J.-F.: The role of the sediment budget in understanding debris flow susceptibility, Earth Surf. Proc. Land., 34, 1612–1624, https://doi.org/10.1002/esp.1850, 2009.
Dramis, F. and Sorriso-Valvo, M.: Deep-seated gravitational slope deformations, relatedlandslides and tectonics, Eng. Geol., 38, 231–243, https://doi.org/10.1016/0013-7952(94)90040-X, 1994.
Ercanoglu, M. and Gokceoglu, C.: Use of fuzzy relations to produce landslide susceptibility map of a landslide prone area (West Black Sea Region, Turkey), Eng. Geol., 75, 229–250, https://doi.org/10.1016/j.enggeo.2004.06.001, 2004.
Ercanoglu, M. and Temiz, F. A.: Application of logistic regression and fuzzy operators to landslide susceptibility assessment in Azdavay (Kastamonu, Turkey), Environ. Earth Sci., 64, 949–964, https://doi.org/10.1007/s12665-011-0912-4, 2011.
Fairchild, L. H.: The importance of lahar initiation processes, Rev. Eng. Geol., 7, 51–62, https://doi.org/10.1130/REG7-p51, 1987.
Fang, Z., Wang, Y., Peng, L., and Hong, H.: A comparative study of heterogeneous ensemble-learning techniques for landslide susceptibility mapping, Int. J. Geogr. Inf. Sci., 35, 321–347, https://doi.org/10.1080/13658816.2020.1808897, 2020.
Frattini, P., Crosta, G., and Carrara, A.: Techniques for evaluating the performance of landslide susceptibility models, Eng. Geol., 111, 62–72, https://doi.org/10.1016/j.enggeo.2009.12.004, 2010.
Gómez, H. and Kavzoglu, T.: Assessment of shallow landslide susceptibility using artificial neural networks in Jabonosa River Basin, Venezuela, Eng. Geol., 78, 11–27, https://doi.org/10.1016/j.enggeo.2004.10.004, 2005.
Guzzetti, F., Carrara, A., Cardinali, M., and Reichenbach, P.: Landslide hazard evaluation: a review of current techniques and their application in a multi-scale study, Central Italy, Geomorphology, 31, 181–216, https://doi.org/10.1016/s0169-555x(99)00078-1, 1999.
He, Y. and Beighley, R. E.: GIS-based regional landslide susceptibility mapping: a case study in southern California, Earth Surf. Proc. Land., 33, 380–393, https://doi.org/10.1002/esp.1562, 2008.
Hu, K., Wei, F., and Li, Y.: Real-time measurement and preliminary analysis of debris-flow impact force at Jiangjia Ravine, China, Earth Surf. Proc. Land., 36, 1268–1278, https://doi.org/10.1002/esp.2155, 2011.
Hungr, O., McDougall, S., and Bovis, M.: Entrainment of material by debris flows, in: Debris-flow Hazards and Related Phenomena, edited by: Jakob, M. and Hungr, O., Springer, Berlin, Heidelberg, 135–158, ISBN 978-3-540-20726-9, 2005.
Iverson, R. M.: The physics of debris flows, Rev. Geophys., 35, 245–296, https://doi.org/10.1029/97RG00426, 1997.
Iverson, R. M., Reid, M. E., and LaHusen, R. G.: Debris-flow mobilization from landslides, Annual Rev. Earth Pl. Sc., 25, 85–138, https://doi.org/10.1146/annurev.earth.25.1.85, 1997.
Kanungo, D. P., Arora, M. K., Sarkar, S., and Gupta, R. P.: A comparative study of conventional, ANN black box, fuzzy and combined neural and fuzzy weighting procedures for landslide susceptibility zonation in Darjeeling Himalayas, Eng. Geol., 85, 347–366, https://doi.org/10.1016/j.enggeo.2006.03.004, 2006.
Kanungo, D. P., Arora, M., Sarkar, S., and Gupta, R.: A fuzzy set based approach for integration of thematic maps for landslide susceptibility zonation, Georisk, 3, 30–43, https://doi.org/10.1080/17499510802541417, 2009.
Kellogg, K. S.: Tectonic controls on a large landslide complex: Williams Fork Mountains near Dillon, Colorado, Geomorphology, 41, 355–368, https://doi.org/10.1016/S0169-555X(01)00067-8, 2001.
Khan, U., Tuteja, N. K., and Sharma, A.: Delineating hydrologic response units in large upland catchments and its evaluation using soil moisture simulations, Environ. Modell. Softw., 46, 142–154, https://doi.org/10.1016/j.envsoft.2013.03.005, 2013.
Khan, U., Tuteja, N. K., Sharma, A., Lucas, S., Murphy, B., and Jenkins, B.: Applicability of Hydrologic Response Units in low topographic relief catchments and evaluation using high resolution aerial photograph analysis, Environ. Modell. Softw., 81, 56–71, https://doi.org/10.1016/j.envsoft.2016.03.010, 2016.
Korup, O.: Geomorphic implications of fault zone weakening Slope instability along the Alpine Fault South Westland to Fiordland, New Zeal. J. Geol. Geop., 47, 257–267, https://doi.org/10.1080/00288306.2004.9515052, 2004.
Kritikos, T. and Davies, T.: Assessment of rainfall-generated shallow landslide/debris-flow susceptibility and runout using a GIS-based approach: application to western Southern Alps of New Zealand, Landslides, 12, 1051–1075, https://doi.org/10.1007/s10346-014-0533-6, 2015.
Kuo, Y., Yang, T., and Huang, G.-W.: The use of grey relational analysis in solving multiple attribute decision-making problems, Comput. Ind. Eng., 55, 80–93, https://doi.org/10.1016/j.cie.2007.12.002, 2008.
Lee, S.: Application and verification of fuzzy algebraic operators to landslide susceptibility mapping, Environ. Geol., 52, 615–623, https://doi.org/10.1007/s00254-006-0491-y, 2006.
Lee, S. and Choi, J.: Landslide susceptibility mapping using GIS and the weight-of-evidence model, Int. J. Geogr. Inf. Sci., 18, 789–814, https://doi.org/10.1080/13658810410001702003, 2004.
Lee, S. and Sambath, T.: Landslide susceptibility mapping in the Damrei Romel area, Cambodia using frequency ratio and logistic regression models, Environ. Geol., 50, 847–855, https://doi.org/10.1007/s00254-006-0256-7, 2006.
Lee, S. and Talib, J. A.: Probabilistic landslide susceptibility and factor effect analysis, Environ. Geol., 47, 982–990, https://doi.org/10.1007/s00254-005-1228-z, 2005.
Lee, S., Ryu, J.-H., Min, K., and Won, J.-S.: Landslide susceptibility analysis using GIS and artificial neural network, Earth Surf. Proc. Land., 28, 1361–1376, https://doi.org/10.1002/esp.593, 2003.
Li, Y., Chen, J., Zhang, Y., Song, S., Han, X., and Ammar, M.: Debris flow susceptibility assessment and runout prediction: A case study in shiyang gully, beijing, china, Int. J. Environ. Res., 14, 365–383, https://doi.org/10.1007/s41742-020-00263-4, 2020a.
Li, Y., Chen, J., Tan, C., Li, Y., Gu, F., Zhang, Y., and Mehmood, Q.: Application of the borderline-SMOTE method in susceptibility assessments of debris flows in Pinggu District, Beijing, China, Nat. Hazards, 105, 2499–2522, https://doi.org/10.1007/s11069-020-04409-7, 2020b.
Li, Y., Chen, J., Li, Z., Han, X., Zhai, S., Li, Y., and Zhang, Y.: A case study of debris flow risk assessment and hazard range prediction based on a neural network algorithm and finite volume shallow water flow model, Environ. Earth Sci., 80, 275, https://doi.org/10.1007/s12665-021-09580-z, 2021.
Li, Z., Chen, J., Tan, C., Zhou, X., Li, Y., and Han, M.: Debris flow susceptibility assessment based on topo-hydrological factors at different unit scales: a case study of Mentougou district, Beijing, Environ. Earth Sci., 80, 365, https://doi.org/10.1007/s12665-021-09665-9, 2021.
Liang, W.-J., Zhuang, D.-F., Jiang, D., Pan, J.-J., and Ren, H.-Y.: Assessment of debris flow hazards using a Bayesian Network, Geomorphology, 171–172, 94–100, https://doi.org/10.1016/j.geomorph.2012.05.008, 2012.
Lin, C. L. and Lin, C. L.: The use of the orthogonal array with grey relational analysis to optimize the electrical discharge machining process with multiple performance characteristics, Int. J. Mach. Tools Manu., 42, 237–244, https://doi.org/10.1016/S0890-6955(01)00107-9, 2002.
Liu, L. and Wang, S.: Fuzzy comprehensive evaluation on landslide and debris flow risk degree in Zaotong, Yunnan, Mountain Research, 13, 261–266, 1995 (in Chinese).
Liu, S., Dang, Y., and Fang, Z.: Grey system theory and its applications, Science Press, Beijing, ISBN 7-03-013351-X, 2004.
Liu, Y., Guo, H. C., Zou, R., and Wang, L. J.: Neural network modeling for regional hazard assessment of debris flow in Lake Qionghai Watershed, China, Environ. Geol., 49, 968–976, https://doi.org/10.1007/s00254-005-0135-7, 2005.
Lü, J., Wang, C., Liu, H., and Zhang, X.: Division of beijing geological environment system, Urban Geol., 12, 19–25, https://doi.org/10.3969/j.issn.1007-1903.2017.03.004, 2017.
Luo, X. and Dimitrakopoulos, R.: Data-driven fuzzy analysis in quantitative mineral resource assessment, Comput. Geosci., 29, 3–13, https://doi.org/10.1016/s0098-3004(02)00078-x, 2003.
Marjanović, M., Kovačević, M., Bajat, B., and Voženílek, V.: Landslide susceptibility assessment using SVM machine learning algorithm, Eng. Geol., 123, 225–234, https://doi.org/10.1016/j.enggeo.2011.09.006, 2011.
Melo, R., Vieira, G., Caselli, A., and Ramos, M.: Susceptibility modelling of hummocky terrain distribution using the information value method (Deception Island, Antarctic Peninsula), Geomorphology, 155–156, 88–95, https://doi.org/10.1016/j.geomorph.2011.12.027, 2012.
Meyer, N. K., Schwanghart, W., Korup, O., Romstad, B., and Etzelmüller, B.: Estimating the topographic predictability of debris flows, Geomorphology, 207, 114–125, https://doi.org/10.1016/j.geomorph.2013.10.030, 2014.
Ministry of Natural Resources of the People’s Republic of China: Specification of geological investigation for debris flow stabilization (DZ/T0220-2006), Standards Press of China, https://www.docin.com/p-971592722.html (last access: 29 June 2022), ISBN 02202006, 2006.
Ohlmacher, G. C.: Plan curvature and landslide probability in regions dominated by earth flows and earth slides, Eng. Geol., 91, 117–134, https://doi.org/10.1016/j.enggeo.2007.01.005, 2007.
Pierson, T. C., Janda, R. J., Thouret, J.-C., and Borrero, C. A.: Perturbation and melting of snow and ice by the 13 November 1985 eruption of Nevado del Ruiz, Colombia, and consequent mobilization, flow and deposition of lahars, J. Volcanol. Geoth. Res., 41, 17–66, https://doi.org/10.1016/0377-0273(90)90082-q, 1990.
Porwal, A., Carranza, E. J. M., and Hale, M.: A Hybrid Fuzzy Weights-of-Evidence Model for Mineral Potential Mapping, Natural Resources Research, 15, 1–14, https://doi.org/10.1007/s11053-006-9012-7, 2006.
Pourghasemi, H. R., Yousefi, S., Kornejady, A., and Cerda, A.: Performance assessment of individual and ensemble data-mining techniques for gully erosion modeling, Sci. Total Environ., 609, 764–775, https://doi.org/10.1016/j.scitotenv.2017.07.198, 2017.
Pradhan, B.: Landslide susceptibility mapping of a catchment area using frequency ratio, fuzzy logic and multivariate logistic regression approaches, J. Indian Soc. Remote, 38, 301–320, https://doi.org/10.1007/s12524-010-0020-z, 2010.
Pradhan, B.: Manifestation of an advanced fuzzy logic model coupled with Geo-information techniques to landslide susceptibility mapping and their comparison with logistic regression modelling, Environ. Ecol. Stat., 18, 471–493, https://doi.org/10.1007/s10651-010-0147-7, 2011a.
Pradhan, B.: Use of GIS-based fuzzy logic relations and its cross application to produce landslide susceptibility maps in three test areas in Malaysia, Environ. Earth Sci., 63, 329–349, https://doi.org/10.1007/s12665-010-0705-1, 2011b.
Regmi, N. R., Giardino, J. R., McDonald, E. V., and Vitek, J. D.: A comparison of logistic regression-based models of susceptibility to landslides in western Colorado, USA, Landslides, 11, 247–262, https://doi.org/10.1007/s10346-012-0380-2, 2013.
Remondo, J., González, A., Terán, J. R. D. D., Cendrero, A., Fabbri, A., and Chung, C.-J. F.: Validation of landslide susceptibility maps; examples and applications from a case study in northern spain, Nat. Hazards, 30, 437–449, https://doi.org/10.1023/B:NHAZ.0000007201.80743.fc, 2003.
Roeloffs, E.: Poroelastic techniques in the study of earthquake-related hydrologic phenomena, Adv. Geophys., 38, 135–195, https://doi.org/10.1016/S0065-2687(08)60270-8, 1996.
Ross, T. J.: Fuzzy logic with engineering applications, McGraw-Hill, New York, ISBN 0-07-053917-0, 1995.
Selby, M. J.: Hillslope materials and processes, Oxford University Press, Oxford, ISBN 0198741278, 1982.
Sun, X., Chen, J., Bao, Y., Han, X., Zhan, J., and Peng, W.: Landslide Susceptibility Mapping Using Logistic Regression Analysis along the Jinsha River and Its Tributaries Close to Derong and Deqin County, Southwestern China, ISPRS Int. J. Geo-Inf., 7, 438, https://doi.org/10.3390/ijgi7110438, 2018.
Takahashi, T.: Debris flow mechanics,prediction and countermeasures, second, Taylor & Francis/Balkema, the Netherlands, ISBN 9781138000070, 2014.
Tien Bui, D., Pradhan, B., Lofman, O., Revhaug, I., and Dick, O. B.: Landslide susceptibility assessment in the Hoa Binh province of Vietnam: A comparison of the Levenberg–Marquardt and Bayesian regularized neural networks, Geomorphology, 171–172, 12–29, https://doi.org/10.1016/j.geomorph.2012.04.023, 2012.
Tsangaratos, P. and Ilia, I.: Landslide susceptibility mapping using a modified decision tree classifier in the Xanthi Perfection, Greece, Landslides, 13, 305–320, https://doi.org/10.1007/s10346-015-0565-6, 2015.
Tsukamoto, Y., Ohta, T., and Noguchi, H.: Hydrological and geomorphological studies of debris slides on forested hillslopes in japan, Journal des Sciences Hydrologiques, 27, 234, 1982.
Vallance, J. W. and Scott, K. M.: The Osceola mudflow from mount rainier: Sedimentology and hazard implications of a huge clay-rich debris flow, Geol. Soc. Am. Bull., 109, 143–163, https://doi.org/10.1130/0016-7606(1997)109<0143:TOMFMR>2.3.CO;2, 1997.
van Westen, C. J., Rengers, N., and Soeters, R.: Use of geomorphological information in indirect landslide susceptibility assessment, Nat. Hazards, 30, 399–419, https://doi.org/10.1023/B:NHAZ.0000007097.42735.9e, 2003.
Wang, J., Yu, Y., Yang, S., Lu, G.-H., and Ou, G.-Q.: A modified certainty coefficient method (M-CF) for debris flow susceptibility assessment: A case study for the Wenchuan earthquake meizoseismal areas, J. Mt. Sci., 11, 1286–1297, https://doi.org/10.1007/s11629-013-2781-7, 2014.
Wei, Z., Shang, Y., Zhao, Y., Pan, P., and Jiang, Y.: Rainfall threshold for initiation of channelized debris flows in a small catchment based on in-site measurement, Eng. Geol., 217, 23–34, https://doi.org/10.1016/j.enggeo.2016.12.003, 2017.
Wu, S., Chen, J., Zhou, W., Iqbal, J., and Yao, L.: A modified Logit model for assessment and validation of debris-flow susceptibility, B. Eng. Geol. Environ., 78, 4421–4438, https://doi.org/10.1007/s10064-018-1412-5, 2019.
Wu, Y., Li, W., Liu, P., Bai, H., Wang, Q., He, J., Liu, Y., and Sun, S.: Application of analytic hierarchy process model for landslide susceptibility mapping in the Gangu County, Gansu Province, China, Environ. Earth Sci., 75, 422, https://doi.org/10.1007/s12665-015-5194-9, 2016.
Xie, H., Zhong, D., Wei, F., and Wang, S.: Classification of debris flow in the mountains of beijing, J. Mt. Sci., 22, 212–219, https://doi.org/10.16089/j.cnki.1008-2786.2004.02.013, 2004.
Zadeh, L. A.: Fuzzy sets, Information & Control, 8, 338–353, https://doi.org/10.1016/S0019-9958(65)90241-X, 1965.
Zhang, W., Li, H. Z., Chen, J. P., Zhang, C., Xu, L. M., and Sang, W. F.: Comprehensive hazard assessment and protection of debris flows along Jinsha River close to the Wudongde dam site in China, Nat. Hazards, 58, 459–477, https://doi.org/10.1007/s11069-010-9680-9, 2011.
Zhang, W., Chen, J.-P., Wang, Q., An, Y., Qian, X., Xiang, L., and He, L.: Susceptibility analysis of large-scale debris flows based on combination weighting and extension methods, Nat. Hazards, 66, 1073–1100, https://doi.org/10.1007/s11069-012-0539-0, 2013.
Zhang, Y., Chen, J., Tan, C., Bao, Y., Han, X., Yan, J., and Mehmood, Q.: A novel approach to simulating debris flow runout via a three-dimensional CFD code: a case study of Xiaojia Gully, B. Eng. Geol. Environ., 80, 5293–5313, https://doi.org/10.1007/s10064-021-02270-x, 2021.
Zhong, D., Xie, H., Wang, S., Wei, F., and Jin, H.: Debris flow in Beijing mountain, Commercial Press, Beijing, ISBN 7-100-04069-8, 2004.
Zou, Q., Cui, P., He, J., Lei, Y., and Li, S.: Regional risk assessment of debris flows in China – An HRU-based approach, Geomorphology, 340, 84–102, https://doi.org/10.1016/j.geomorph.2019.04.027, 2019.