the Creative Commons Attribution 4.0 License.
the Creative Commons Attribution 4.0 License.
 | 23 Jun 2022
Different drought types and the spatial variability in their hazard, impact, and propagation characteristics
Erik Tijdeman
Veit Blauhut
Michael Stoelzle
Lucas Menzel
Kerstin Stahl
Droughts often have a severe impact on the environment, society, and the economy. The variables and scales that are relevant to understand the impact of drought motivated this study, which compared hazard and propagation characteristics, as well as impacts, of major droughts between 1990 and 2019 in southwestern Germany. We bring together high-resolution datasets of air temperature, precipitation, soil moisture simulations, and streamflow and groundwater level observations, as well as text-based information on drought impacts. Various drought characteristics were derived from the hydrometeorological and drought impact time series and compared across variables and spatial scales. Results revealed different drought types sharing similar hazard and impact characteristics. The most severe drought type identified is an intense multi-seasonal drought type peaking in summer, i.e., the events in 2003, 2015, and 2018. This drought type appeared in all domains of the hydrological cycle and coincided with high air temperatures, causing a high number of and variability in drought impacts. The regional average drought signals of this drought type exhibit typical drought propagation characteristics such as a time lag between meteorological and hydrological drought, whereas propagation characteristics of local drought signals are variable in space. This spatial variability in drought hazard increased when droughts propagated through the hydrological cycle, causing distinct differences among variables, as well as regional average and local drought information. Accordingly, single variable or regional average drought information is not sufficient to fully explain the variety of drought impacts that occurred, supporting the conclusion that in regions as diverse as the case study presented here, large-scale drought monitoring needs to be complemented by local drought information to assess the multifaceted impact of drought.
- Article
(4332 KB) - Full-text XML
- BibTeX
- EndNote


The central and northern European drought and heat wave of 2018 revealed once more the large spatiotemporal footprint and severe impacts of this natural hazard (e.g., Bakke et al., 2020; Brunner et al., 2019; Schuldt et al., 2020). Similar or worse episodes are expected to occur more often in the future given the increasing atmospheric water demand and human pressure on freshwater resources (e.g., Samaniego et al., 2018; Wanders and Wada, 2015). This prospect raises the importance of short- and long-term drought management to better cope with ongoing drought, as well as to be better prepared for future drought episodes (Wilhite et al., 2019). Good planning for drought requires information about the different components of drought risk: hazard, impacts, exposure, and vulnerability. The analysis of past droughts at different scales can provide this information. On the one hand, locally relevant drought management benefits from detailed information which considers different hydrometeorological variables and drought-related impacts and their spatiotemporal variability (e.g., Van Lanen et al., 2016). On the other hand, higher-level administrative decision-making often requires drought information in a more generalized form, e.g., indexed information aggregated to administrative regions indicating whether there is drought or not. Generalizing drought information simplifies its interpretation but may come at the cost of a loss of information as the hazard and its impacts may be highly variable in space and time (Stahl et al., 2016).
The multifaceted nature of drought results in the impracticability of a unique drought definition (Lloyd-Hughes, 2014). From a hazard perspective, drought is often defined as a below-normal hydrometeorological anomaly, in which the normal depends on space, time, and the variable of interest (e.g., Tallaksen and Van Lanen, 2004). Accordingly, a wealth of drought hazard indices has been developed to express the flux or state of a certain domain of the hydrological cycle, or the combined states and fluxes of multiple domains, as anomalous (e.g., Hao and Singh, 2015; Zargar et al., 2011). From an impact perspective, below-normal anomalies only become droughts when they have the potential to cause drought impacts, i.e., “negative consequences of drought for environment, society or economy” (Blauhut et al., 2015).
The above-described definitions of drought form the basis of many drought-related studies, which often focus on a specific type of drought such as meteorological, agricultural, hydrological, or socioeconomic drought (Wilhite and Glantz, 1985). Laaha et al. (2017) argue that our understanding of drought would benefit from a more holistic study of drought phenomena because specific drought impacts relate to droughts in certain domains of the hydrological cycle. In addition, the co-occurrence of drought in different domains of the hydrological cycle may worsen drought impacts. For example, agricultural drought impacts caused by low soil moisture can be aggravated by co-occurring streamflow droughts that limit or prohibit withdrawals of surface water for irrigation. A holistic view on drought and its impacts might further benefit from the consideration of compound hazards preceding or co-occurring with drought, e.g., heat waves, as these can further worsen drought impacts (Zscheischler et al., 2020). Finally, a temporal clustering of drought years might be worth the consideration. A second drought year in a row, as observed for meteorological drought for central and northern Europe in 2018–2019, as well as for various hydrological droughts in the UK (respectively Hari et al., 2020; Kendon et al., 2013), prevents recovery and might have an even larger impact on already weakened systems.
The connection of different drought types through so-called “drought propagation” (e.g., Changnon, 1987; Van Loon, 2015) further justifies the need for a holistic drought assessment. Drought propagation is a well-established concept on the catchment scale (e.g., Van Loon, 2015). Rainfall deficits enhanced by meteorological conditions that favor high evapotranspiration propagate to deficits in root zone soil moisture followed by recession and ultimately deficits in river flow and groundwater. Catchment-scale drought propagation exhibits various typical characteristics. One of these characteristics is the order of appearance of drought in different domains of the hydrometeorological cycle and associated time lag, in which meteorological droughts are followed by soil moisture droughts, which are eventually followed by streamflow droughts and finally groundwater droughts (e.g., Changnon, 1987; Peters, 2003). Another propagation characteristic is the attenuation of the propagating hydrometeorological signal and associated lengthening. The time series of hydrometeorological variables generally get smoother the further they propagate through the hydrological cycle; e.g., a monthly precipitation time series is often much more variable than a monthly groundwater time series. Accordingly, drought periods in less variable drought signals tend to be longer (lengthening); i.e., meteorological droughts are generally shorter than soil moisture droughts, which are shorter than streamflow droughts and groundwater droughts (e.g., Hisdal and Tallaksen, 2000, Van Loon and Van Lanen, 2012; Van Loon et al., 2014). Regional-scale drought propagation is a less well-established concept. On this regional scale, drought propagation may not happen uniformly as the propagating drought signal is affected by meteorological variability and further modified by geological differences in surface and sub-surface characteristics. Differences in meteorological conditions are driven by both larger- and smaller-scale atmospheric processes. On the larger (continental) scale, atmospheric circulation patterns and teleconnections play an important role, e.g., by blocking wet weather systems (e.g., Ionita et al., 2017; Toreti et al., 2019). On the smaller regional scale, differences in meteorological conditions appear due to the occurrence of local rainstorms or differences in topography and land cover that affect energy balance terms and hence air temperature, evapotranspiration, and mesoscale wind systems. Differences in subsurface soil and geological characteristics may also exert a strong control on regional drought propagation as these affect the total amount of storage and thereby influence how well meteorological dry spells can be buffered (e.g., Barker et al., 2016; Bloomfield and Marchant, 2013; Heudorfer et al., 2019; Stoelzle et al., 2014).
The variable occurrence and severity of drought in space, time, and among different domains of the hydrological cycle may be a major precursor of when and where different types of drought impacts occur. However, drought impact occurrence is not solely related to the hazard as drought impacts are “symptoms of vulnerability” (Knutson et al., 1998). Thus, an indicated drought hazard might not necessarily lead to an impact as the exposed system also has to be vulnerable to the hazard. For example, certain drought impacts might not occur because of appropriate mitigation measures in place. In addition, the considered spatially aggregated or single variable drought hazard information might not be representative for a specific type of local drought impact.
It is the question of whether a holistic assessment of droughts enhances the understanding of the type and amount of drought impacts that occur during certain types of drought events. If this is the case, it would highlight the need for multivariate and drought-type-specific management. It is further the question of whether concepts of catchment-scale drought propagation also exist on the regional scale as these concepts could serve as guiding principles for regional drought management. For both these questions, spatial scale, i.e., whether local or regional aggregated drought information is investigated, may play an important role. What is the unique value of different drought information sources at different scales? Is there a benefit of using local over spatially aggregated drought information in a regional drought management context? These questions have not yet been systematically explored as often data are lacking for such comprehensive analyses. To fill this gap, this study aims to shed more light on regional drought (propagation) characteristics with a multivariate view on recent droughts to enhance the understanding of drought impacts. Focusing on southwestern Germany as a case study, we aim to
-
identify drought episodes for the period 1990–2019 and investigate if these episodes can be grouped into different types with similar hazard characteristics and impacts,
-
evaluate the propagation of drought over the region for the most prominent (highest impact) type's drought episodes, and
-
assess the agreement among drought hazard and impact information across variables and scales.
2.1 Study area
Baden-Württemberg is the most southwestern federal state of Germany (Fig. 1). According to the Nomenclature of Units for Territorial Statistics (NUTS) of the European Union, Baden-Württemberg is a NUTS-1 region, which is separated into four NUTS-2 regions: Stuttgart, Karlsruhe, Freiburg, and Tübingen. In this case, these NUTS regions also have their own governmental water authorities. Hydrologically important, the river Rhine flows along the southern and western border of the state and provides an important waterway for navigation. The region encompasses both flat and lowland areas such as the Rhine Valley in the west, as well as more mountainous regions such as the Black Forest and the Swabian Alb. The topography of the region affects both precipitation (annual average sum between 600 and >2000 mm yr−1) and air temperature (annual average between 4.5 and 11.6 ∘C). The landscapes of Baden-Württemberg are diverse, with agricultural (43 %) and urban (7 %) areas mostly located in the lower-elevated regions and forested (38 %) and meadow areas (10 %) in the higher-elevated regions. Equally diverse are the region's lithological and geological characteristics. A variety of soils with different root zone depths and water holding capacities exist, ranging from thick loess layers to shallow Leptosols. Below these soils, the geology varies from metamorphic rock to porous limestone and unconsolidated rock, resulting in a hydrogeology with different aquifer types that have different storage capacities (Stoelzle et al., 2015). Aquifers also vary in size, with some larger porous aquifers in, for example, the Rhine Valley and smaller valley fill aquifers among fractured sedimentary or crystalline bedrock in, for example, the Black Forest.
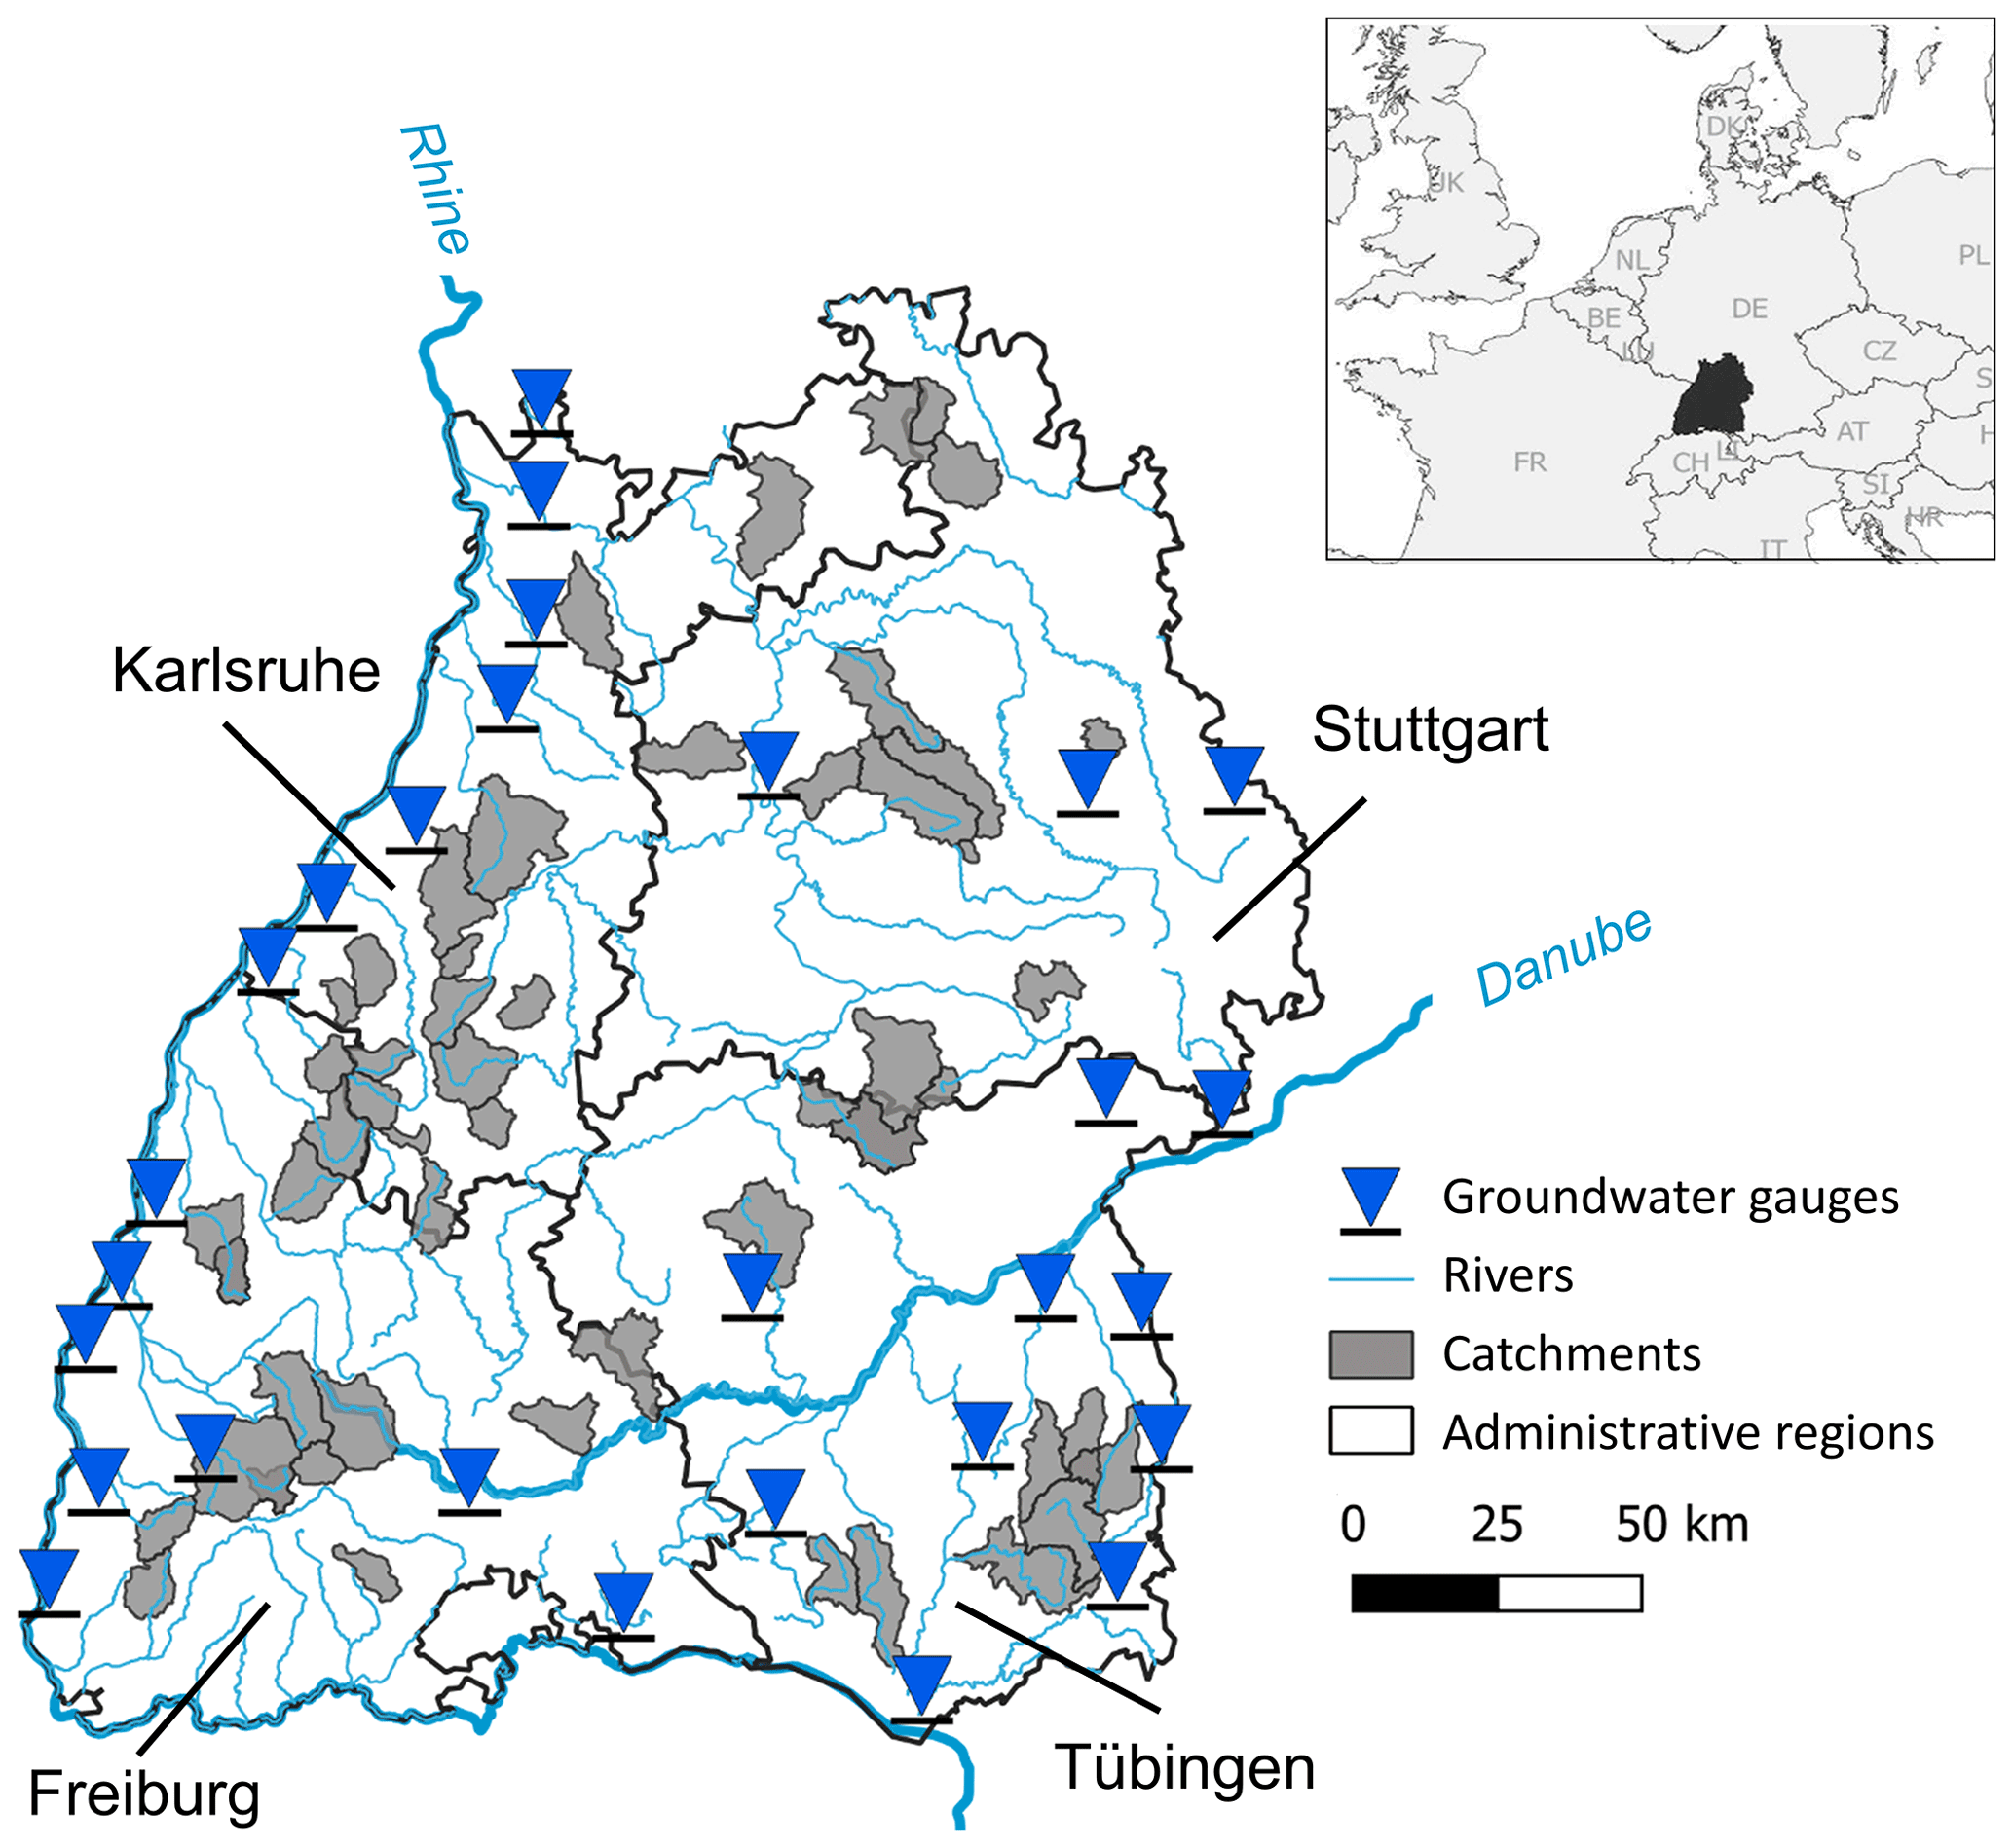
Figure 1Data basis for the study in the federal state of Baden-Württemberg (NUTS-1) with its four different administrative regions (NUTS-2).
2.2 Data and temporal aggregation
The study assembled multiple variables for the region: air temperature, precipitation, simulated soil moisture, and observed streamflow and groundwater levels. These daily hydrometeorological observations and simulations for the period 1990–2019 stem from different sources. Air temperature data come from the interpolation of climate station data over a 1 km resolution grid covering Baden-Württemberg (Tijdeman and Menzel, 2021a). Precipitation data stem from the gridded REGNIE data product (Rauthe et al., 2013) and were sourced from the Climate Data Center of the German Weather Services (DWD, 2020). Gridded simulated soil moisture data over a 1 km resolution grid were obtained from Tijdeman and Menzel (2021b). These soil moisture simulations were derived using the TRAIN (TRAnspiration and Interception) model, a physical-based model simulating fluxes and state variables on the soil–water–atmosphere interface. The performance of the TRAIN model was evaluated against soil moisture and river flow observations in Tijdeman and Menzel (2021a) and various studies mentioned therein. Daily streamflow observations at gauging stations of 54 catchments with flow unaffected by major human disturbances at the timescale relevant for our analyses were provided by the Ministry of Environment of Baden-Württemberg (LUBW). Groundwater level observations of 43 wells were obtained from the Environmental Data and Maps archive of the LUBW (UDO, 2020). We only considered those groundwater wells currently in use in the reference network of the groundwater storage assessment application of the LUBW (LUBW, 2020) given their relevance for drought monitoring. This does not mean that all groundwater level time series are completely free of human influences. Nevertheless, Baden-Württemberg is a water-rich area, and visual inspection of the groundwater level time series did not show any sharp changes associated with changes in (nearby) abstractions.
All above-described variables are continuous daily observations, except for groundwater level observations which are available at (ir-)regular intervals, e.g., at certain days of the week. To obtain a common temporal resolution, we aggregated daily hydrometeorological data to a monthly resolution by taking the mean of the daily observations or simulations. This resulted in monthly time series of precipitation (P1), air temperature (T1), simulated soil moisture (SM), streamflow (Q), and groundwater (GW) levels for either each grid cell (P1, T1, SM), catchment (Q), or well (GW). Precipitation was further aggregated to a seasonal and annual resolution (respectively P3 and P12) – one value for each calendar month – to account for both short- and long-term meteorological deficits relevant for, for example, hydrological systems with respectively a low and high buffering capacity of meteorological deficits. Air temperature was also aggregated to an annual resolution (T12) – one value for each year – to depict the general changes in climate. For T12, we deliberately looked at a static annual window and not to a moving 12-month window as we do for P12 because the former static approach is more in line with the methods to display changes in annual air temperature. Daily time series of precipitation, air temperature, and simulated soil moisture did not contain any missing values, whereas daily time series of streamflow and groundwater level observations contained occasional gaps. In the case of gaps in daily streamflow, a certain month was set to missing whenever 5 or more days in that month did not have an observation. For groundwater, we used less stringent missing data requirements given that groundwater levels were not available at a continuous daily resolution. GW in a certain month was set to “missing” when there were no observations in that month. In the end, we only selected the monthly Q and GW level time series with less than 10 % of “missing” months: respectively all of the 54 streamflow time series and 28 out of 43 of the groundwater level time series (Fig. 1).
Drought impact information stems from the European Drought Impact report Inventory (EDII; Stahl et al., 2016), a database of textual drought impact information from different sources, e.g., newspaper articles and governmental reports. These reports are manually collected, temporally and spatially referenced, and classified to one of 15 impact categories (Blauhut et al., 2015). The timestamp of an entry indicates at a minimum the year of occurrence but where available also information on the beginning and in some cases the end date of a reported impact. For this study, we considered impacts for the period 2000–2019 (n=792) given the more limited availability of impact information prior to this date. The EDII has recently been updated for the greater alpine region (Stephan et al., 2021). For the study region of Baden-Württemberg this dataset was also supplemented with additional impact information gathered from questionnaires of a survey of the hydropower sector (Siebert et al., 2021; until 2017) and a survey of the public water supply sector (Blauhut et al., 2020; until 2018). Categorical impact information was grouped by start year, season, where available start month (n=359), and NUTS-1 and NUTS-2 region. The grouping over NUTS regions was used as these regions coincide with administrative boundaries relevant for decision-making according to the state's water act.
2.3 Drought hazard information at different spatial scales
We derived drought hazard information from all meteorological and hydrological variables at three spatial scales: local, NUTS-2 average, and NUTS-1 average. Local drought information was derived for each individual grid cell, catchment, or well by transferring their time series to anomaly space (percentiles; p) using Weibull plotting positions (Weibull, 1939, Eq. 1).
where V is the variable of interest, n the sample size (in this study: n=30), and u the location identifier referring to either a grid cell, catchment, or groundwater well. The rank of V in a specific year and month is relative to historical observations in that month, e.g., P1 for August 2018 compared to P1 for all other Augusts. To derive anomalies from air temperature time series (T1, T12), we used an inverse ranking to make the percentile classification of above-normal air temperature comparable with below-normal hydrometeorological conditions. The derived percentiles express the historical non-exceedance frequencies of different variables for the considered reference period 1990–2019 (Tijdeman et al., 2020). This reference period differs from the standard reference period of the WMO (World Meteorological Organization; e.g., 1961–1990). However, using the period 1990–2019 as reference was preferred given the lower availability of continuous observations for the earlier period.
For the NUTS-1 region as a whole and for the four NUTS-2 sub-regions, regional average drought hazard information was derived by ranking the average of all available local percentile data within the region; for a given hydrometeorological or hydrological variable, the regional average p is then (Eq. 2)
where NUTS refers to either all grid cells, catchments, or wells located within either the NUTS-1 or NUTS-2 region of interest. The rank of thus compares average local percentile values for a specific NUTS-1 or NUTS-2 region, variable, year, and month to average percentile values for the same NUTS-1 or NUTS-2 region, variable, and month in all other years. The NUTS-1 and NUTS-2 average drought signals were used to identify major drought episodes over the region. These episodes then serve as a starting point to further explore the spatial variation in local drought hazard and impact information during major drought episodes.
The percentile time series of all hydrometeorological variables and scales were classified into five different groups: pV≤0.1 (severe drought or much above-normal air temperature), (moderate drought or above-normal air temperature), (normal conditions), (moderately wet or below-normal air temperatures), and pV≥0.9 (severely wet or much below-normal air temperatures). For ease of notation, we move the location identifier outside of the subscript and use the variable abbreviation to refer to its percentiles where applicable, e.g., local P1 when referring to monthly precipitation percentiles at individual locations (cells) or NUTS-1 average P1 when referring to regional average monthly precipitation percentiles.
2.4 Different drought episode types and their characteristics and impacts
We characterized past drought episodes over the period of 1990–2019 and the impacts of recent events from 2000 to 2019. First, we identified drought episodes from the NUTS-1 average percentile time series of all hydrometeorological variables. These episodes were classified into different types considering timing and length of the episode, as well as the affected domains of the hydrological cycle. These aspects of drought episodes were considered as we hypothesize that they influence the type and amount of related drought impacts that occur.
In a next step, we quantified whether different types of drought episodes also differ in hazard and impact characteristics. We first divided the NUTS-1 average percentile time series (p) of all hydrometeorological variables (V) into drought (pV≤0.25) and non-drought events (pV>0.25). We then derived the duration (D, months) and severity (S, –) of each event j (Eqs. 3 and 4, respectively):
Hence S incorporates both the duration of the event and the deviation from the threshold but has no physical relation to water quantity. S should be seen as a relative metric that only enables comparison among other variables' severity values. With regard to drought impact characteristics, we considered the number and categories that happened during the different types of drought episodes. The number of impacts gives an indication of the severity and perception of the drought events, whereas impact categories provide insight into the (diversity of) affected sectors.
2.5 Regional drought propagation
We introduce regional drought propagation, i.e., the propagation of drought through the hydrological cycle in space and time over a larger region. Focusing on the most prominent and also highly impacted drought episodes, it was investigated whether regional drought propagation exhibited typical characteristics known from catchment-scale drought propagation such as ordering, time lag, and lengthening. We first inspected whether these drought propagation characteristics were present in NUTS-1 average, NUTS-2 average, and local percentile time series. We then quantified the initiation time (I, months) and maximum duration (M, months) of each drought episode from both NUTS-1 average and all local percentile time series of all hydrometeorological variables (pV), in which
-
is the initiation time, i.e., the time between an arbitrary set starting point (e.g., start of drought development) and the first time the percentile time series reached drought (pV≤0.25), and
-
is the maximum time (months) the percentile time series was continuously in drought (pV≤0.25) during the drought episode.
From and of all local percentile time series of each variable, we derived the 5th and 95th quantile to differentiate between quick-developing () and slow-developing () local drought conditions, as well as short () and prolonged () local drought conditions. Quickly developing indicates the time it took for the first 5 % of local drought signals to reach drought conditions and slowly developing to the time it took for 95 % of the local drought signals to reach drought conditions.
The ordering and difference of among variables is indicative for respectively the ordering and time lag between drought events appearing in different domains of the hydrological cycle. An amplification in M when drought events propagate through the hydrological cycle is indicative of lengthening. We hypothesize that the order of appearance, time lag, and lengthening of drought during drought episodes are generally visible in the NUTS-1 average and local drought signals such that
-
the precipitation drought develops before the soil moisture drought, the soil moisture drought develops before the streamflow drought, and the streamflow drought develops before groundwater droughts ();
-
the precipitation drought is shorter than the soil moisture drought, the soil moisture drought is shorter than the streamflow drought, and the streamflow drought is shorter than groundwater drought ().
However, we also speculate that regional differences in climate, soil, catchment, and aquifer characteristics can modify the order of appearance and lengthening of local drought conditions over a larger region such that
-
slower-developing local soil moisture drought conditions develop later than more quickly developing local streamflow drought conditions, and slower-developing local streamflow drought conditions develop later than quickly developing local groundwater drought conditions (; );
-
the most prolonged local soil moisture drought conditions exceed the duration of the shortest local streamflow drought conditions, and the most prolonged streamflow drought conditions exceed the duration of the shortest local groundwater drought conditions (; ).
2.6 Agreement among different drought information sources
The usefulness of different levels and sources of drought information was assessed based on their agreement (A; between 0 and 100). In this study, we assess the agreement between NUTS-1 average drought signals () with drought signals of other variables () at different scales and locations (u). Depending on the scale (NUTS-1, NUTS-2, local), u (utotal) refers to either the (total number of) NUTS regions, local grid cells, rivers, or groundwater wells. A was derived by dividing the number of times two drought information sources ( and ) were in drought (Eq. 5),
by the total number of times the second drought information source (PV2) was in drought,
such that A is (Eq. 7)
where t=1 indicates the start of the drought episode of interest and T the end of this period. For this analysis, one prominent drought episode was chosen so that t=1 indicates the first month of this episode and T the last month. The lower the A is among two different drought information sources, the higher the unique value of each individual source is, and vice versa: the higher the A, the lower the unique value of each individual source. In addition, we investigated the agreement between drought impact occurrence and drought hazard information of different variables at different scales and locations by replacing the conditional statement in Eq. (5) with the condition that at least one impact has started in month t. Finally, to gain more insight in the variability in hydrometeorological conditions beyond agreement metric A, we also derived the percentile class distributions of the NUTS-1, NUTS-2, and local percentile time series for all months in which the NUTS-1 average percentile time series was in drought or all months in which at least one drought impact report started.
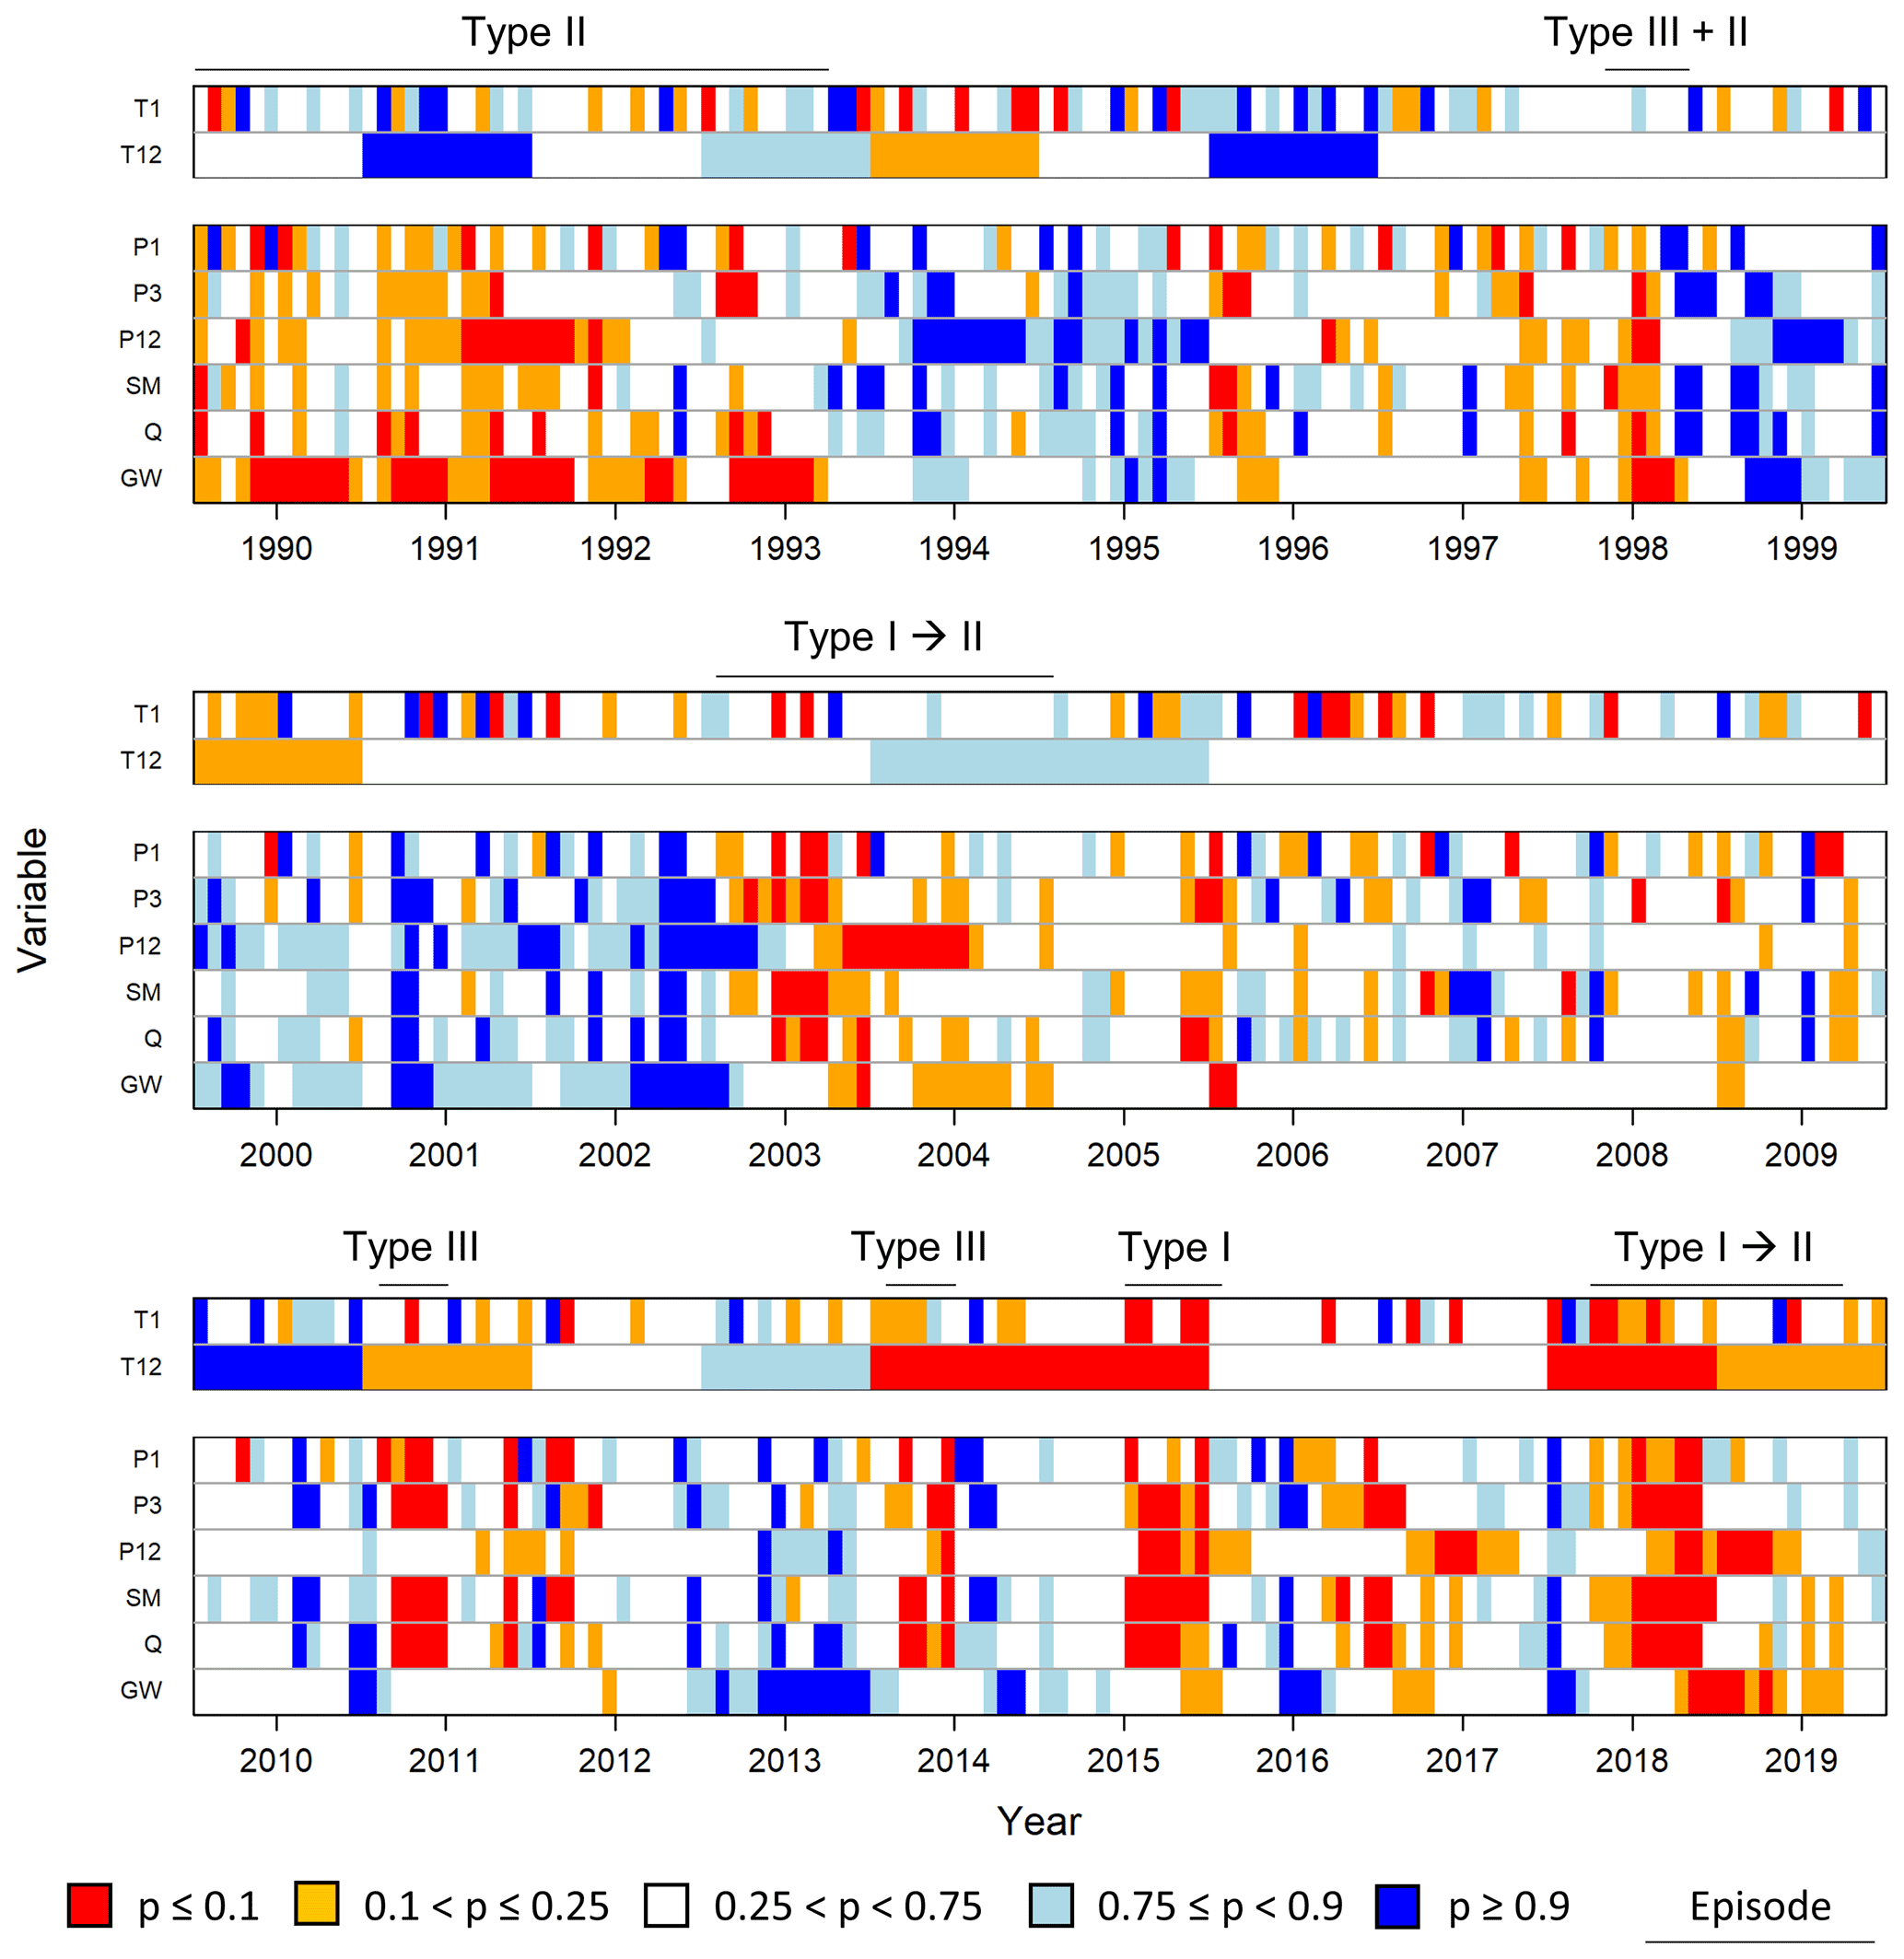
Figure 2Drought episode types identified from NUTS-1 average classified percentile (p) time series of monthly and annual air temperature (respectively T1 and T12), precipitation accumulated over different periods (P1, P3, and P12), simulated soil moisture (SM), and observed streamflow (Q) and groundwater (GW) levels. Tick marks on the x axis showing the years were placed on the first of July of that year.
3.1 Different drought episode types and their characteristics and impacts
NUTS-1 average percentile time series of different variables reveal several past drought episodes in the study region (Fig. 2). Based on common characteristics, these episodes can be grouped into three distinct types and two combinations of them:
-
intense multi-seasonal drought episodes peaking in summer as in 2003, 2015, and 2018 (Type I),
-
long-term and less intense drought episodes in, for example, the early 1990s (Type II),
-
short-term episodes as in, for example, 2011 and 2014 (Type III),
-
Type I episodes that transition to Type II episodes as in, for example, 2004 and 2019 (referred to as Type I → II), and
-
Type III episodes that coincide with Type II episodes as in, for example, 1998 (referred to as Type III + II).
Type I episodes showed persistent meteorological dry spells over the growing season according to NUTS-1 average P1 and P3 that caused severe and prolonged deficits in NUTS-1 average SM and Q. Type II and Type I → II episodes were characterized by long-term meteorological dryness as indicated by NUTS-1 average P12 and were associated with persistent below-normal NUTS-1 average GW, occasionally interrupted by some wetter months. The shorter Type III episodes caused below-normal NUTS-1 average SM and Q. However, the impact of these shorter dry spells on NUTS-1 average GW varied among the years and depended on the initial conditions of the groundwater systems at the start of the drought. The Type III+II episode of 1998 was preceded by a period of long-term dryness and coincided with below-normal NUTS-1 average GW, whereas the Type III episodes of 2011 and 2014 happened after a relatively wet period and did not cause below-normal NUTS-1 average GW.
The temperature setting in which these different types of drought occurred varied among drought years. There is a general increasing trend towards higher annual air temperatures, and NUTS-1 average T12 of 4 out of the last 6 years (2014–2019) was warmer than average (relative to the period 1990–2019). Nevertheless, there can be a lot of within-year monthly variability according to NUTS-1 average T1. Type I episodes all coincided with at least a few months of extremely high air temperatures. On the other hand, the Type II episode of the early 1990s happened in a relatively cold setting. Air temperature was below normal for the Type III + II episode that occurred in 1998, whereas the Type III episodes in 2011 and 2014 coincided with one or a few warmer months.
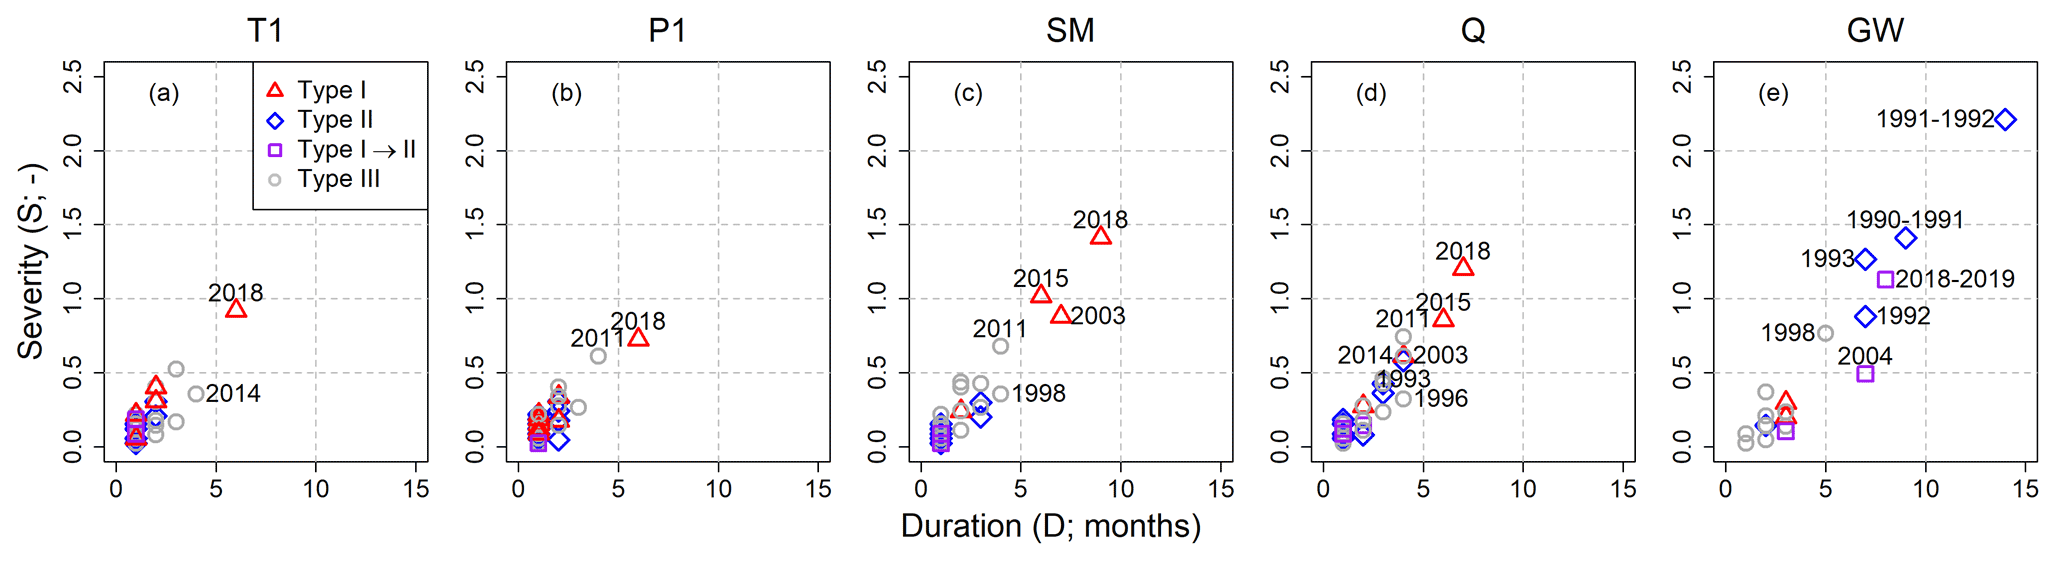
Figure 3Duration (D) and severity (S) of hydrometeorological drought events during different types of drought episodes derived from monthly NUTS-1 average percentile time series with (a) air temperature (T1), (b) precipitation (P1), (c) simulated soil moisture (SM), (d) streamflow (Q), and (e) groundwater (GW). Events with a duration ≥ 4 months are labeled.
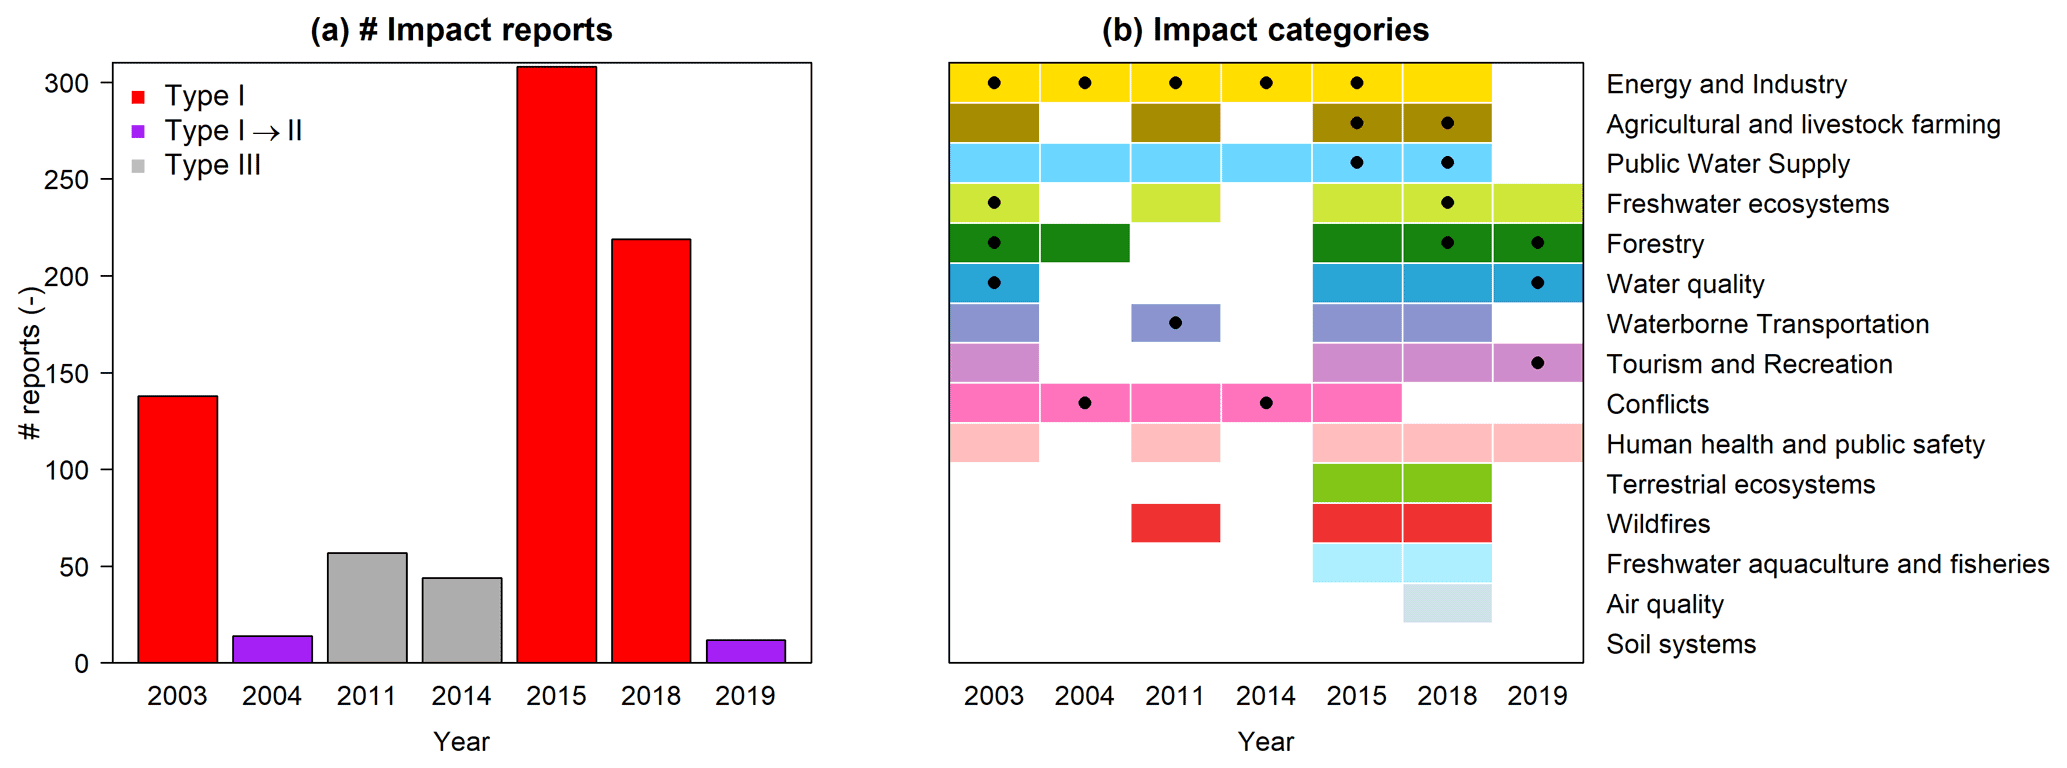
Figure 4Reported impacts of drought episodes from 2000 to 2019. (a) Annual number of impacts in the European Drought Impact Inventory by drought type and (b) reported drought impact categories for different drought years, sorted descending by total number of reports. Black dots indicate impact categories that account for more than 10 % of all impact reports in a specific year.
The duration (D) and severity (S) of past drought episodes derived from NUTS-1 average percentile time series vary among variables and drought types (Fig. 3). D and S of meteorological dry spells were generally low (Fig. 3a and b). A notable exception was the meteorological drought of 2018 with and of 6 months. For Type I droughts, D and S increased when droughts propagated from precipitation to soil moisture and streamflow (Fig. 3c and d). Such an amplification in drought characteristics was not visible for the other drought types. On the other hand, the DGW and SGW of Type II episodes were exceptional (Fig. 3e). For this drought type, multiple shorter meteorological drought events coincided with prolonged periods of groundwater drought. DGW and SGW were also high after part of the Type I drought episodes (2004, 2018–2019).
The total number of reported drought impacts varied among drought years, as well as drought types (Fig. 4a). Most impacts were reported for the Type I episodes, fewer for the Type III episodes, and the least for the Type I → II episodes. The categorical composition of drought impacts revealed that the largest shares of impacts related to the energy and industry sector, agriculture and livestock farming, public water supply, and freshwater ecosystems (Fig. 4b). The most frequently reported impact type in the category of energy and industry was reduced hydropower production. Agricultural impacts include the reduction in harvest quantity and quality or the restriction in irrigation. Public water supply impacts are often related to water-use restrictions or the need to allocate water from other sources, whereas freshwater ecosystem impacts, for example, are related to fish die-off. In addition to the more commonly reported impacts, a large variety of other impacted sectors became visible, including forestry, water quality, waterborne transportation, tourism and recreation, and drought-related conflicts. The categorical distribution of reported impacts for Baden-Württemberg further reveals drought-type-specific differences (Fig. 4b). In general, the highest diversity in impact categories was reported for the Type I drought episodes, whereas drought impacts of Type I → II and Type III episodes were less diverse. A comparison by years further shows event-specific differences. In 2015 and 2018, a relatively large share of impacts on agriculture were reported. The drought of 2011 was dominated by impacts attributed to hydrological drought, i.e., anomalies in streamflow and groundwater levels, such as energy and industry, waterborne transportation, and public water supply. However, no impacts on forestry and agriculture were observed. In contrast, the year 2019 showed a large share of forestry-related issues, especially related to the dieback of spruce and bark beetle infestations.
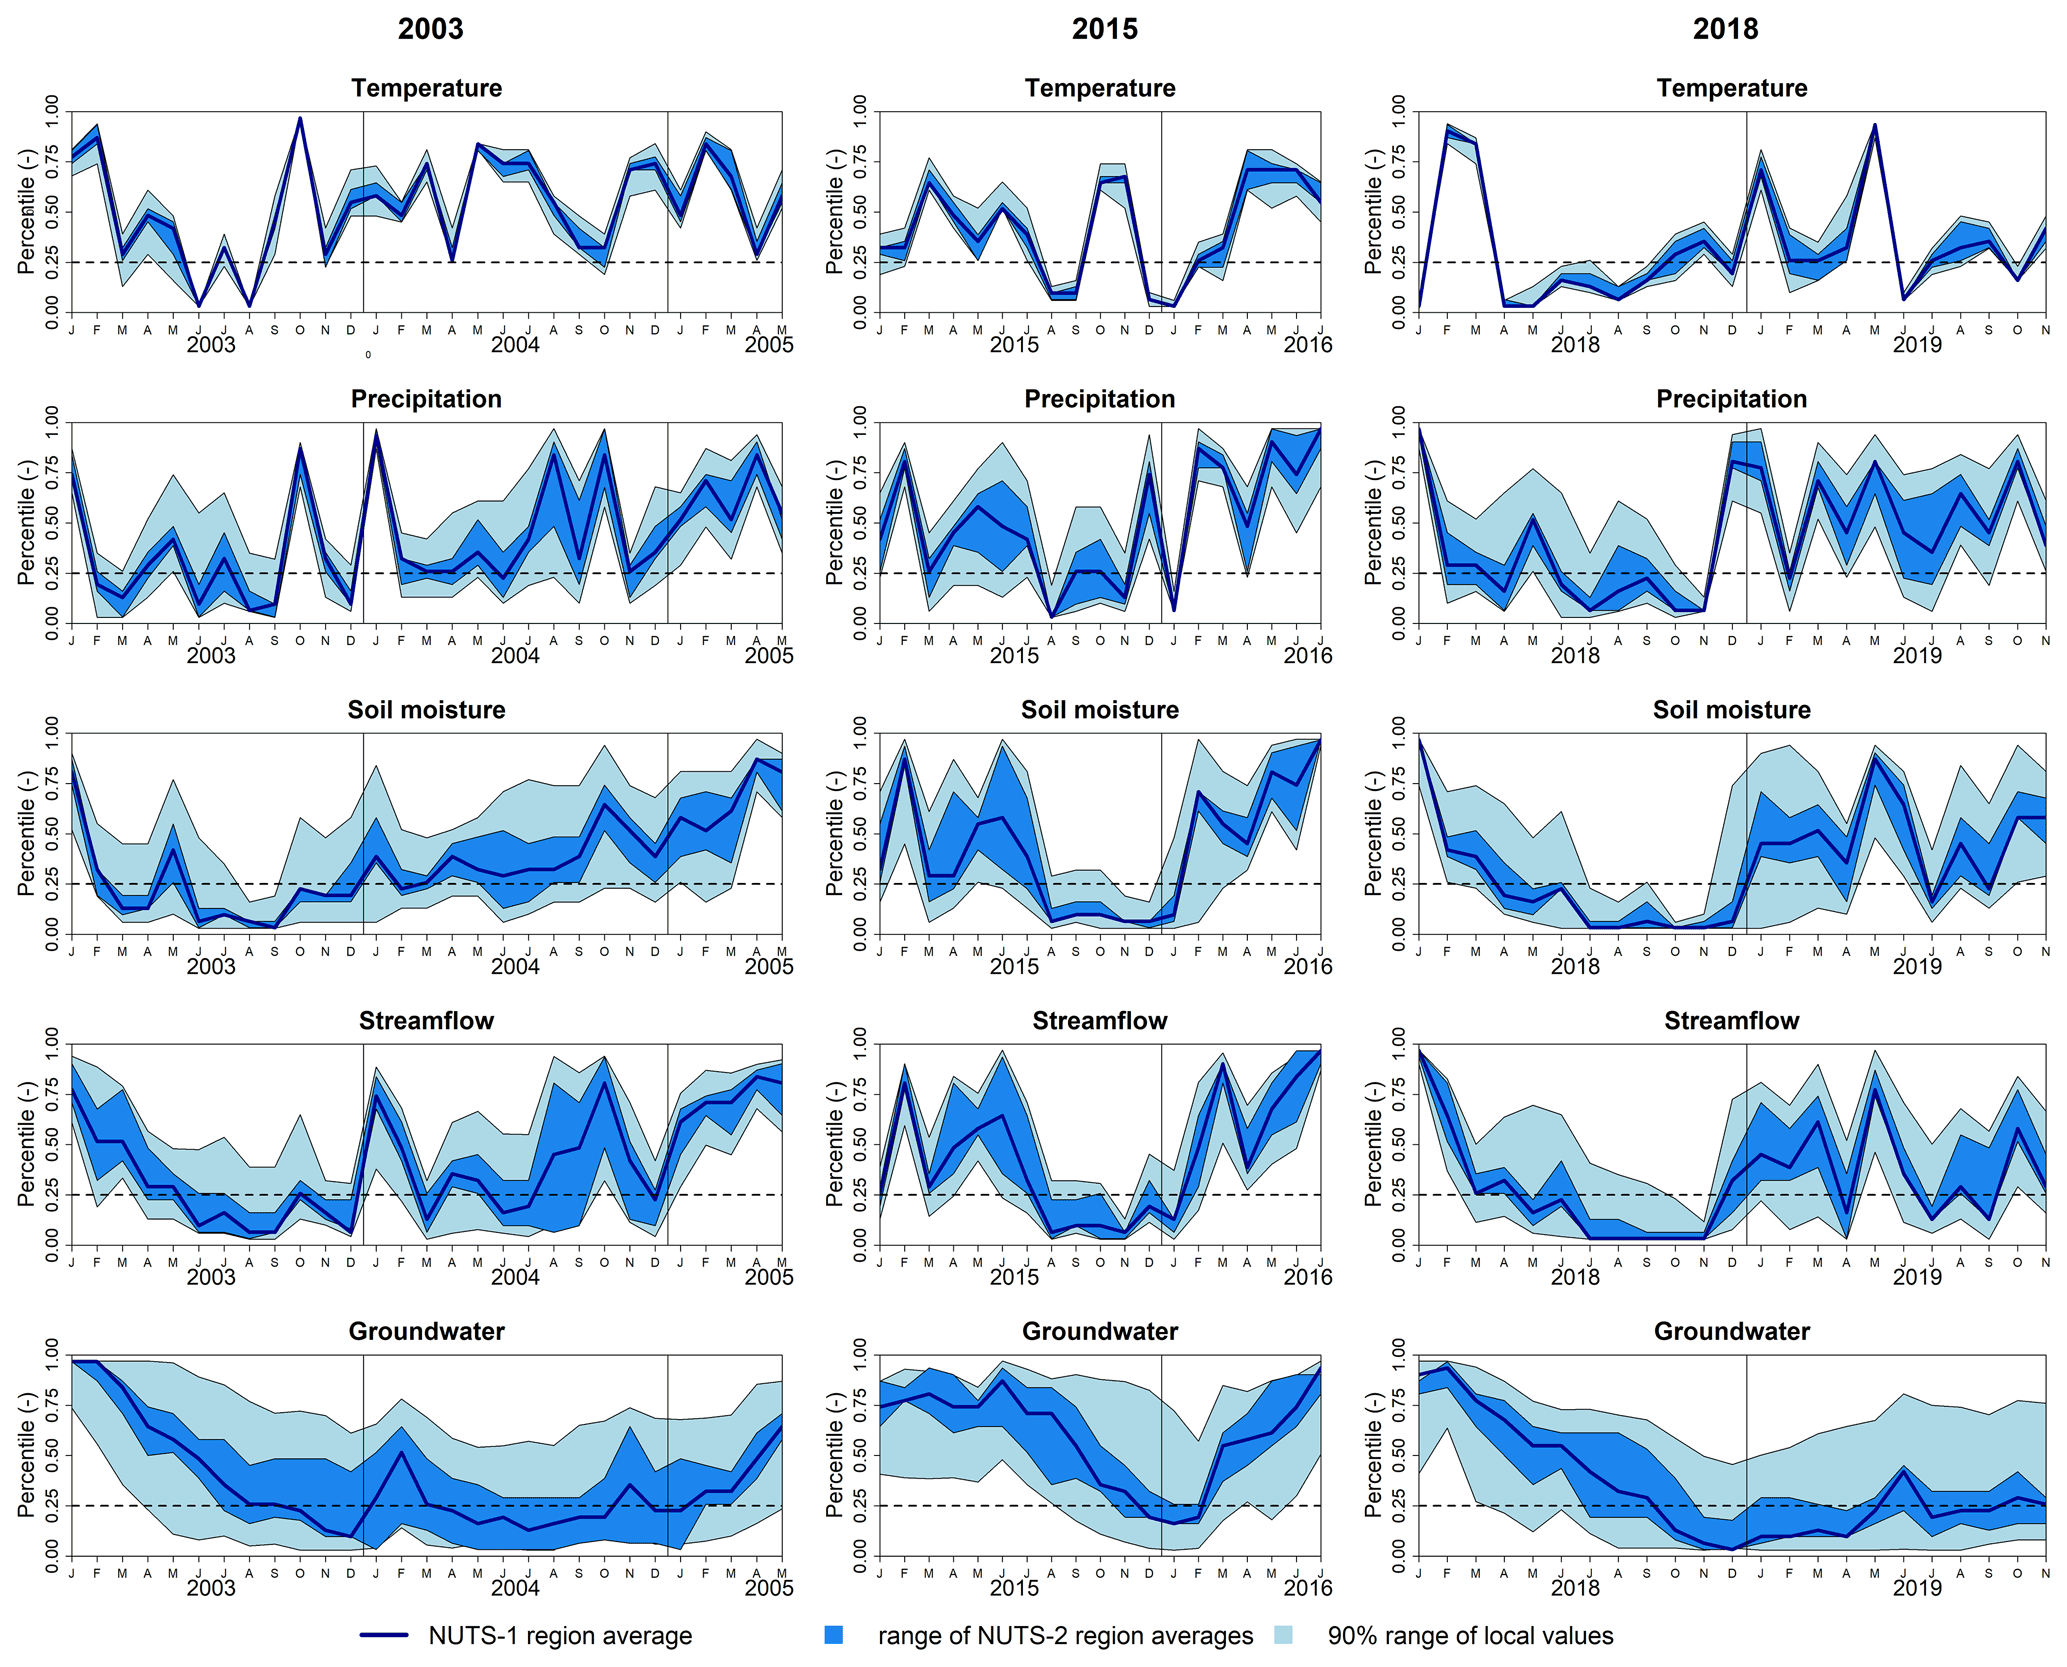
Figure 5Spatiotemporal propagation of prominent droughts (Type I and Type I → II) according to (ranges in) NUTS-1, NUTS-2, and local percentile time series relative to the reference period 1990–2019 (Sect. 2.4). The dashed line indicates the moderate drought or above-normal air temperature threshold.
3.2 Regional drought propagation characteristics of prominent Type I and Type I → II episodes
A similarity for the prominent Type I and Type I → II drought episodes is their common start from relatively wet initial conditions in winter (Fig. 5). From that point, several months with below-normal P clustered together in prolonged periods of below-normal SM and Q and eventually reached a state of below-normal GW. Another similarity is that local drought signals become more variable in space when propagating through the hydrological cycle, as shown by the increasing ranges in local drought conditions. A further similarity among prominent drought years is the occurrence of some relatively wet months in the following winter. In 2003 and 2018, these single wet months generally recovered drought for SM and Q but only had a small impact on GW, which often stayed low or continued to decline. The wet January in 2004 was not sufficient for a full recovery of GW, which meant that part of the groundwater levels dropped again to below-normal conditions that would persist for the remainder of 2004 and the first part of 2005. The same was observed for the drought starting in 2018; some relatively wet winter months had little effect on most of the groundwater levels, which stayed below normal throughout the year 2019. On the other hand, the drought of 2015 was followed by multiple wet winter and spring months, which alleviated drought conditions by the start of the summer of 2016.
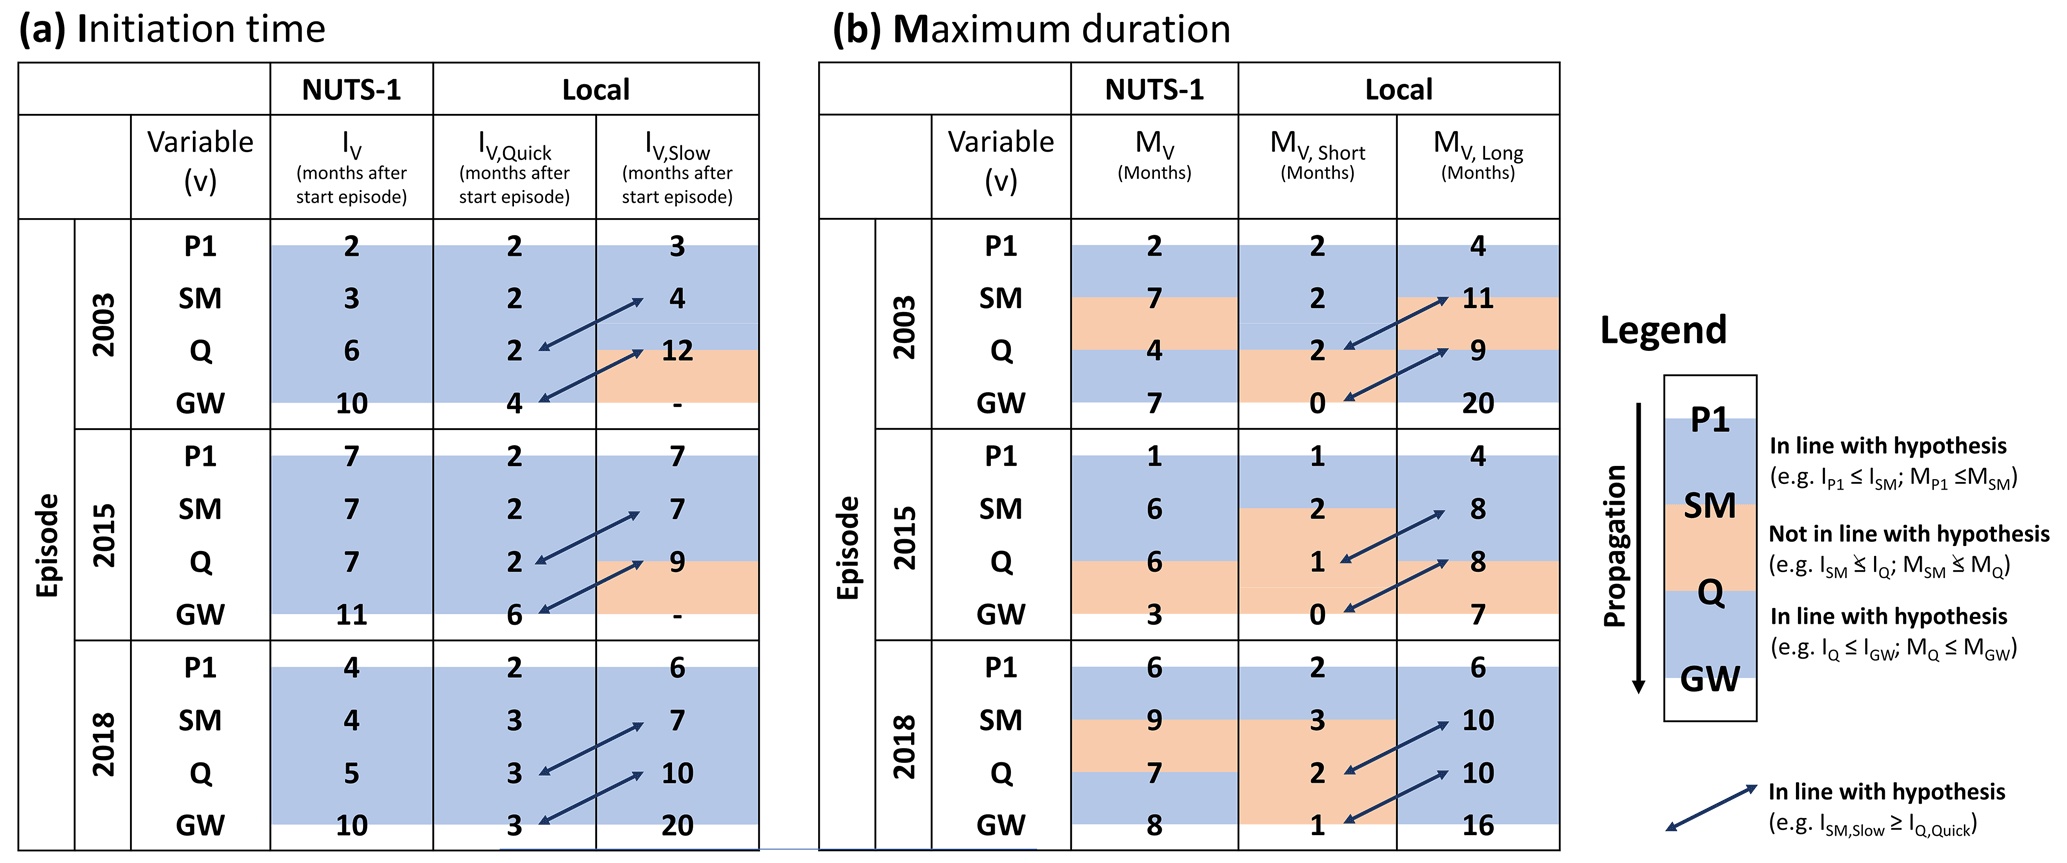
Figure 6Typical NUTS-1 average and local drought propagation characteristics: (a) initiation time (IV, IV,Quick, and IV,Slow; in months after the start of the indicated year) and (b) maximum duration (MV, MV,Short, and MV,Long; months) derived from NUTS-1 average and local percentile time series of monthly precipitation (P1), simulated soil moisture (SM), streamflow (Q), and groundwater (GW) for the three prominent drought episodes. Colors reflect whether drought propagation characteristics are in line with our hypothesis (Sect. 2.5).
Various typical drought propagation characteristics, i.e., ordering, time lag, and lengthening, can be recognized from the (ranges in) NUTS-1, NUTS-2, and local percentile time series (Fig. 5). The occurrence of these drought propagation characteristics is partly confirmed when comparing initiation time (IV) and maximum duration (MV) among the different variables (Fig. 6). For all three drought episodes, the hypothesized ordering and time lag are visible in NUTS-1 IV and local IV,Quick (Fig. 6a; i.e., , e.g., for 2003: months). Local IV,Slow shows this expected ordering for P, SM, and Q. However, not all local GW observations reached drought during the drought episodes of 2003 and 2015. The lengthening of drought is visible when P1 droughts propagate to SM droughts (). However, MQ is occasionally lower than MSM (e.g., 2003), and MGW is occasionally lower than MQ (e.g., 2015; Fig. 6b).
The ranges in Fig. 5 indicate that local drought conditions within a region according to the same variable may vary strongly at one moment in time. The variation also suggests that the temporal sequencing of different drought types was not uniform over a larger region. This is confirmed when comparing local IV,Quick and IV,Slow (diagonal arrows in Fig. 6a). For example, GW of some responsive aquifers reached below-normal conditions prior to Q of some less responsive catchments (, e.g., for 2003: 12≥4 months). This is also confirmed when comparing MV,Short and MV,Long. For example, the longest time local SM was continuously in drought exceeds the shortest time local Q was continuously in drought (, e.g., for 2003: 11≥2 months).
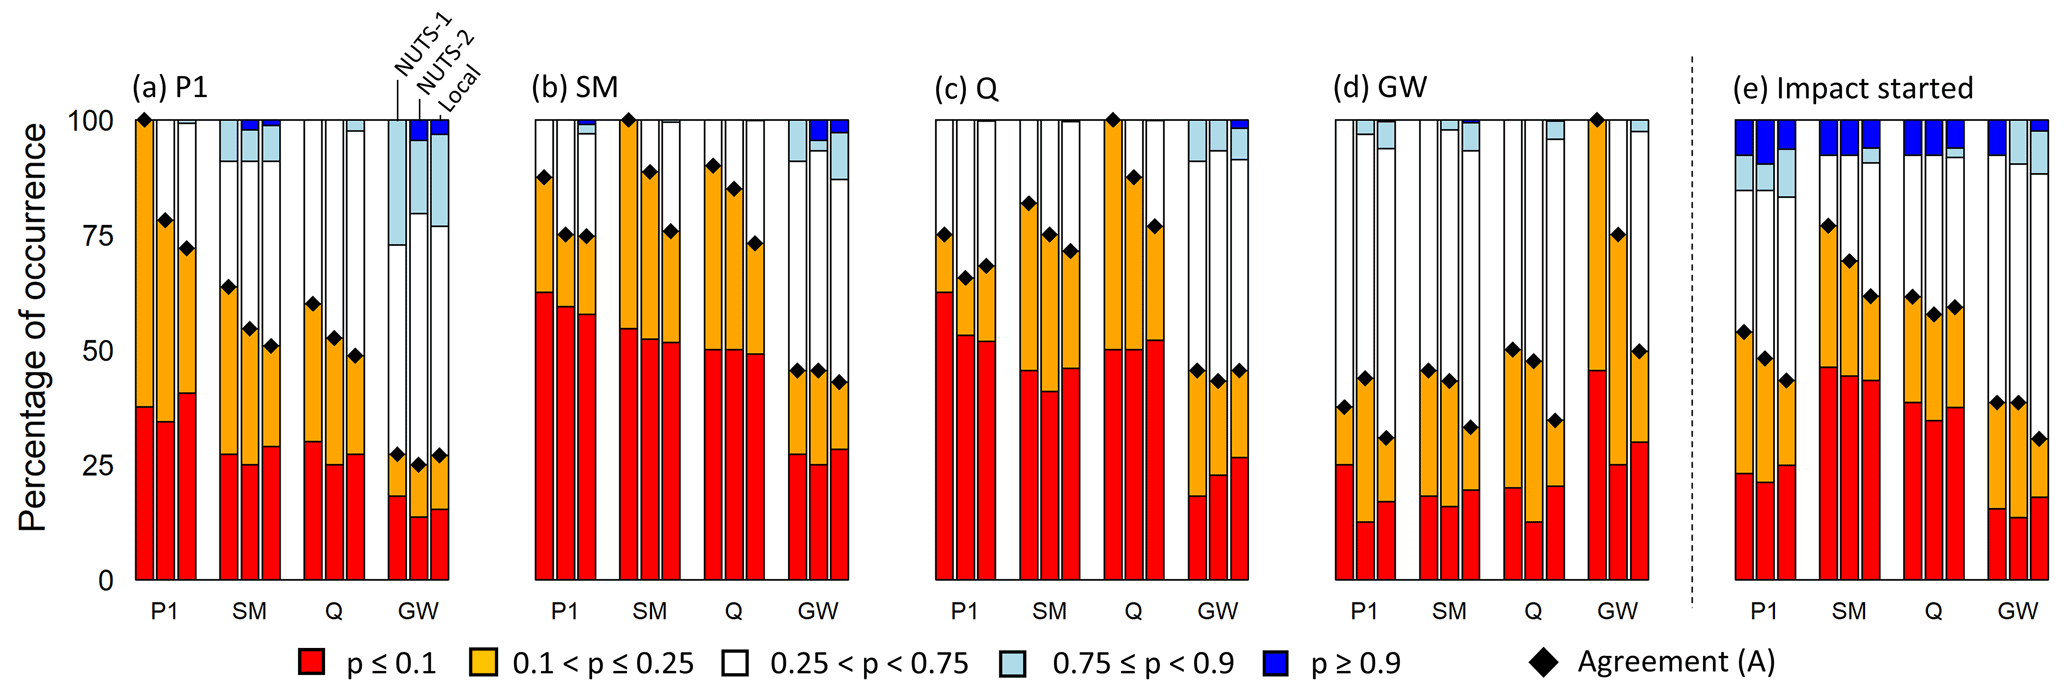
Figure 7Classified percentile (p) distributions of different variables (x axis) at different scales (bar triplets: NUTS-1, NUTS-2, and local) during the drought episode of 2018–2019 for all months with NUTS-1 average drought conditions (pV<0.25) according to (a) monthly precipitation (P1), (b) simulated soil moisture (SM), (c) streamflow (Q), (d) groundwater (GW), and (e) all months in which at least one impact started.
3.3 Agreement among drought information sources: the case of the drought of 2018–2019
The variability in propagating drought signals affects the agreement between different drought information sources. This agreement (A) among different drought information sources is indicative of the unique value of an individual source as indicator of drought occurrence. In general, this agreement and the classified percentiles of different variables at different scales reveal that hydrometeorological conditions can be quite variable whenever NUTS-1 average conditions of one variable indicated drought (Fig. 7). The strongest agreement was found between NUTS-1 and NUTS-2 or local percentile time series of the same variable for P1, SM, and Q (Fig. 7a–c). Whenever the NUTS-1 average percentile time series of P1, SM, or Q were in drought, NUTS-2 average and local percentile time series of these variables often showed drought conditions as well (A=75 %–90 %). However, lesser agreement was observed between NUTS-1 average GW and NUTS-2 average and local GW (A=50 %–70 %; Fig. 7d). Lesser agreement was also observed among NUTS-1 average and NUTS-2 average or local percentile time series of different variables. Whenever NUTS-1 average P1 was in drought, NUTS-1 average, NUTS-2 average, and local percentile time series of other variables were as well for 25 %–60 % of cases (Fig. 7a). SM and Q agree relatively well with each other (A=70 %–85 %) but not so much with P1 and GW (A=50 %–80 %; Fig. 7b and c). NUTS-1 average GW often did not agree with percentile time series of other variables (A=30 %–50 %; Fig. 7d). The agreement between impact start and drought hazard information reflects how well different drought hazard information sources can predict the start date of an impact. In general, it can be seen that hydrometeorological conditions can be quite variable at the start date of an impact (Fig. 7e). The strongest agreement between impact start and drought hazard occurrence was found for SM and Q (A=60 %–75 %). Lesser agreement was found between impact start and drought hazard occurrence according to P and GW (A=30 %–55 %).
The medium agreement between various drought hazard information sources (Fig. 7a–d) and the fact that not one single drought information source fully agreed with the start of drought impacts (Fig. 7e) motivate a further exploration of the advantages of using local multivariate over single variable regional average drought information (Fig. 8). Characterizing the drought of 2018–2019 by single variable NUTS-1 average drought information provides an incomplete picture and fails to predict part of the drought impacts (Fig. 8a and c). For example, NUTS-1 average P1 picked up the peak of the drought in 2018 (Fig. 8a). However, NUTS-1 average P1 missed the prolonged duration of the NUTS-1 average GW drought in 2019 and associated impacts; i.e., NUTS-1 average P1 does indicate drought recovery in winter 2018–2019. In contrast, NUTS-1 average GW missed the occurrence of drought in the summer of 2018 and fails to predict the manifold impacts that occurred. NUTS-1 average P1 also missed the occurrence of some NUTS-1 average SM and Q drought months and associated impacts in the summer of 2019. The difference between NUTS-1 average and local drought information revealed that average drought information missed the early onset and delayed recovery of part of the local hydrological drought conditions. According to the regional average drought signal, the drought of 2018 started in April–May (Fig. 8a). However, local drought information revealed that drought conditions developed earlier for part of the study region, which matches with the earlier start of impacts related to public water supply in winter as reported for some NUTS-2 regions (Fig. 8b and c). The same was observed for GW, i.e., the NUTS-1 average GW drought of 2018 starting in autumn, whereas local GW conditions reached drought much earlier, which matches with the earlier occurrence of local summer impacts in 2018 that described wells running dry.

Figure 8Differences among drought information sources displayed for the drought of 2018–2019 ranging from regional average single variable information to local multivariate drought information of precipitation (P1), simulated soil moisture (SM), streamflow (Q), and groundwater (GW): (a) NUTS-1 average and (b) local monthly drought hazard information expressed as the percentage of grid cells, catchments, or wells in drought. (c) Start of drought impacts by impact category and season, with numbers indicating for how many NUTS-2 regions impacts were reported (maximum four).
4.1 Typical droughts and their hazard and impact characteristics
Our first objective was to identify and characterize past drought episodes in Baden-Württemberg based on a multi-variable assessment. The analyses revealed different types of drought, of which the intense multi-seasonal dry spells peaking in summer (Type I) that occurred in 2003, 2015, and 2018 were most prominent according to the duration and severity of the drought hazard and the amount and variety of drought-related impacts (Figs. 2–4). The episodes of 2003 and 2015 are relatively well known and documented (e.g., Ionita et al., 2017; Laaha et al., 2017; Van Lanen et al., 2016). Compared to these episodes, the drought of 2018 in the study area was generally more extreme in terms of the duration and severity of precipitation, soil moisture, and river flow deficits, which is in line with findings for northern Europe and Switzerland (respectively Bakke et al., 2020; Brunner et al., 2019). Our study further revealed a multi-year nature of the drought of 2018 that made the event more impactful, which is in line with drought impacts that were reported in the media for Germany over this prolonged period (De Brito et al., 2020) and findings for the groundwater drought in the Netherlands (Brakkee et al., 2022). Hydrological droughts for part of the catchments and wells persisted far into 2019. This delayed development and prolonged recovery of hydrological drought has been reported for previous drought episodes in various studies (e.g., Parry et al., 2016; Peters et al., 2005).
The Type I drought episodes of 2003, 2015, and 2018 all coincided with some months in the growing season with above-normal air temperatures. These above-normal air temperatures were revealed to have a compounding effect on drought impacts, contributed to soil moisture or hydrological drought development (e.g., Brunner et al., 2021), and could have caused a more rapid intensification of drought conditions also known as “flash droughts” (e.g., Nguyen et al., 2019). The generally increasing air temperatures will exacerbate drought and its impacts and present a challenge for future drought management (Brunner et al., 2021; Markonis et al., 2021; Pendergrass et al., 2020). The Type I events studied here might be seen as a precursor of intense warm-climate drought events and their typical impacts.
The impacts of Type I episodes in the study area were severe, diverse, and, thanks to the data collection in impact databases such as the EDII, well documented. Based on the textual descriptions provided with each impact, we discuss the type of impacts that occurred and their causes. Reported impacts in the sector “agriculture and livestock farming” were related to, for example, reduced crop yield and quality, a lack of food for livestock, or increased cost for irrigation water. Losses in agriculture are mostly attributed to low soil water availability and heat (see also, for example, Peichl et al., 2019), whereas the increased cost in irrigation relate to low (sub-)surface water levels and the consequent need to use alternative water sources. Impacts on forestry relate to tree growth and vitality and were associated with low soil moisture and groundwater levels in the impact reports, depending on the kind and age of the tree (e.g., Skiadaresis et al., 2019). Energy and industry impacts relate to reduced hydropower production due to low surface water availability or the shutdown of hydropower plants for technical or ecological reasons, e.g., a lack of cooling water or the exceedance of ecological thresholds (see also, for example, Van Vliet et al., 2016). Furthermore, streams with a number of hydropower plants experienced hydropeaking and emerging water conflicts among users with different interests, e.g., energy production versus ecology (see also, for example, Bruder et al., 2016). Public water supply presented challenges during drought, e.g., resulting in the use of alternative resources such as other wells or rivers. Nevertheless, water security was strong thanks to regional water exchange networks and long-distance water transfers (Blauhut et al., 2020). Merely a few high-altitude settlements had to be supported with deliveries. Impacts on aquatic and terrestrial ecosystems and ecology were also diverse, ranging from fish die-off to the spreading of plant diseases exacerbated by drought conditions. We found that the drivers of these impacts were above-normal temperatures (heat stress) and below-normal water availability. Overall, the manifold causes of a large variety of drought impacts highlight the need for multivariate drought management.
Drought types other than Type I droughts often receive less attention by media or in research. However, according to the EDII, these drought types can also be associated with a variety of impacts and, therefore, deserve more attention and awareness. Type I → II droughts are mainly characterized by prolonged drought conditions in less responsive hydrological systems that develop after intense Type I droughts (Figs. 3 and 5). Notable is their asynchronous development and recovery; i.e., hydrological drought can develop and recover long after meteorological and soil moisture drought. This behavior might not be accurately represented in hydrological models, particularly some of the large-scale ones (Tallaksen and Stahl, 2014). This asynchronous development meant that the slowly developing hydrological drought did not necessarily coincide with droughts in other domains of the hydrological cycle or with heat waves. This meant that the impacts of Type I → II droughts were different compared to, for example, Type I droughts (Fig. 4). First, the number of reported impacts and categories is lower, suggesting that Type I → II droughts are less impactful and visible. Second, different impact categories comprise larger shares in the overall impact category distribution. For example, impacts starting in the year 2019 mostly relate to forestry as prolonged hydrological (groundwater) drought episodes might be especially critical for some tree species (Tegel et al., 2020). Furthermore, the effects of drought on trees can be creeping and accumulating; drought-weakened trees can be affected by a variety of pests and diseases which can result in delayed diebacks (Schuldt et al., 2020). We further expect hydrologically induced impacts on, for example, public water supply that started during the Type I droughts to continue. However, this needs to be further investigated, as most impacts only report a start and no end date, which aligns with the general challenge of identifying when a drought and its impacts have been fully recovered from (e.g., Parry et al., 2016). In addition, the survey to gather additional impacts on the public water supply sector for the impact database ended in 2018. Altogether, a relatively wet winter after a Type I drought episode might give a false sign of drought recovery as some less visible hydrological deficits and consequent impacts linger on.
The Type II groundwater droughts of the early 1990s exceed other groundwater droughts in both duration and severity (Fig. 3). These prolonged groundwater drought conditions might be associated with the long-term meteorological water deficits and the absence of distinct wet periods (Fig. 2), as also reported for parts of central Europe (e.g., Hannaford et al., 2011; Spinoni et al., 2015). Nevertheless, (changes in) groundwater abstraction cannot be ruled out for all wells and might have had an influence. Groundwater-related impacts for this period were not available in the EDII for Baden-Württemberg. This absence of impact reports in the EDII mostly relates to the lower research attention towards droughts in this period, as well as to the lower impact-data availability prior to the digital era. Nevertheless, neighboring NUTS-1 regions show evidence of impacts of this episode in the EDII related to, for example, cargo transport on the river Rhine or tree vitality.
Type III droughts describe shorter meteorological dry spells mainly affecting soil moisture and streamflow (Fig. 3). These meteorological dry spells were not intense enough to cause a strong decline in groundwater but could nevertheless coincide with and worsen ongoing groundwater droughts (Type III + II). The Type III episodes of 2011 and 2014 occurred before the summer season. Their timing in occurrence, together with their relatively short duration, affected the impact categories that occurred, which were mostly related to energy (hydropower) and water-use conflicts. Typical summer impacts enhanced by high air temperatures related to, for example, water quality or agriculture were absent. What was remarkable about the drought of 2011 was the large share of impacts related to waterborne transportation, which is related to low water levels in the Rhine towards the end of spring but also in a very dry November (see also Kohn et al., 2014). Type III droughts also occurred in the winters of, for example, 2005–2006 and 2016–2017. We did not consider these winter droughts in the results section because of their limited range in impacts due to their timing. The Type III + II episode of 1998 revealed the joint occurrence of soil moisture, streamflow, and groundwater drought. There is not much evidence in the EDII on the impacts of this episode given the general lower impact availability prior to the year 2000. Nevertheless, we hypothesize that such Type III + II episodes provide extra stress for, for example, irrigated agriculture or tree vitality given the joint occurrence of limited soil moisture, streamflow, and groundwater supply.
Overall, different drought types share common characteristics and impacts. This similarity among drought types highlights the potential of drought-type-specific management and research (Markonis et al., 2021). Our results imply that such a typology should not only consider the timing of drought but also the domain of the hydrological cycle in which the drought appeared and whether droughts in different domains of the hydrological cycle, as well as high temperatures, coincided or not. Most well-known and impactful were the Type I drought episodes, and these episodes can be adopted as worst-case benchmarks for drought management. However, the Type I drought episodes of the past decades never coincided with persistent long-term hydrological (groundwater) drought. An important question remains of what would have happened if a drought episode like 2018 started when storage in hydrological systems was low, i.e., a Type I + II episode. Stress tests or scenario studies can be used to explore the impacts of such worst-case episodes, as well as to prepare drought management for the future (e.g., Grecksch, 2019; Hellwig et al., 2021; Stoelzle et al., 2020).
4.2 Regional drought propagation characteristics
Our second aim was to evaluate the (variability in) regional drought propagation signals. We showed that drought propagation of Type I droughts of 2003, 2015, and 2018 generally followed the hypothetical order and time lag of drought propagation as described in, for example, Van Loon (2015). This suggests that the concept of drought propagation could be a general guiding principle for regional drought management. However, we also found several deviations from the general concept of drought propagation that need to be considered.
First, drought propagation does not have to complete the full cycle, which means that the expected ordering and lengthening is not always observed (Figs. 2, 5, and 6). For example, the relatively short meteorological droughts of 2011 and 2014 propagated to below-normal soil moisture and river flow, but groundwater levels often stayed in the normal range, especially for the less responsive aquifer types. On the other hand, short dry spells can severely threaten groundwater systems when the initial conditions are low at the start of the dry spell as occurred in, for example, summer 1998. This implies the importance of tracking non-drought conditions (approaching drought) in a drought management context, especially for the more slowly responding rivers and aquifers. For these slowly responding hydrological systems, the initial conditions can be an important precursor for the likelihood of future drought conditions (e.g., Parry et al., 2018). Another deviation from the general drought propagation concept is the occasional absence of lengthening in propagating drought signals, which relates to the time lag in the development of deficits and consequent chances of having drought-recovering wet conditions prior to drought reaching its full extent. For example, we showed for the prominent drought episode of 2015 that groundwater reached drought conditions after a prolonged meteorological dry spell and associated persistent soil moisture and river flow droughts (Figs. 5 and 6). However, a very wet period followed soon after the development of the still relatively small groundwater deficits, which meant a quick recovery. Finally, the spatial variation in drought conditions revealed that local drought propagation over a larger region does not necessarily follow the expected sequencing of different drought types (Fig. 6). For example, a responsive groundwater aquifer with a low amount of storage reached below-normal conditions before a less responsive river underlain by a high-storage aquifer (see also Stoelzle et al., 2014). The spatially variable response time was also visible in the impacts; e.g., the start dates of local impacts on public water supply in 2018 ranged from early to late in the year (Fig. 8c). These variable hydrological responses to meteorological dry spells underpin the need for the consideration of local differences in response to meteorological drought among different (hydrological) systems at different timescales (Vicente-Serrano et al., 2021; Wu et al., 2021).
4.3 Disagreement among drought information sources
Our third aim was to assess the variability in drought hazard signals and consequent disagreement among drought information sources. The variability found in propagating drought signals across variables and scales implies complexities in the use of single variable or regional average (composite) drought information for comprehensive drought assessments as relevant variations are lost (Figs. 7 and 8). Single variable or regional average drought hazard information, especially of soil moisture and streamflow, could predict the start of part of the drought impacts (Fig. 7e). However, regional average single variable drought hazard information was not sufficient to predict the start of all drought impact occurrences. Part of the reason in the mismatch between drought hazard information and the start of drought impacts might be related to inaccuracies in reporting. However, another explanation might be the mismatch between drought hazard information sources; e.g., regional single variable information might miss the earlier onset or delayed recovery of some (hydrological) systems (Fig. 8). This suggests, together with the variety of causes of drought impacts (Sect. 4.1), that the joint consideration of different variables at a local rather than regional scale is needed to predict the full range of impacts during different stages of drought. Drought monitoring and management would benefit from future efforts towards joint portals that include near-real-time multivariate drought hazard and impact information at different scales. Such portals might be used to design or implement operational definitions of drought, paving the way towards more targeted, sector- and location-specific drought management.
Past drought episodes and their impacts in southern Germany ranged from intense multi-seasonal drought episodes with severe soil moisture and streamflow deficits and compounding heat waves to less intense but more prolonged multi-year drought episodes and associated low groundwater levels. The identified drought types each share common hazard, propagation, and impact characteristics, which suggests that drought-type-specific management options could be designed. Of the different drought types, intense multi-seasonal drought episodes with compounding heat waves (as in 2003, 2015, and 2018) caused the largest number and variety of impacts. This drought type might become a challenge for future drought management in a warming climate. The drought of 2018, as an example, stood out by the length of the meteorological dry spell and consequent prolonged and severe soil moisture and river flow deficits. Groundwater deficits in 2018 generally developed slower but lasted well beyond the end of 2018. This multi-year nature of drought highlights the need of continuous drought monitoring beyond the peak of the drought in summer.
Drought monitoring and early warning are important components of risk management but often rely on assumptions of drought propagation and on concepts such as sequencing, time lag, and lengthening. Studying the regional propagation of droughts mostly confirmed the validity of these concepts also on a regional scale and can thereby be expected to be a useful general guide to raise regional drought awareness for multiple water-use sectors. However, we also found deviations from the general drought propagation concept as drought propagation did not always affect the full hydrological cycle, and the length of the dry spell did not always increase. Further, the order of appearance and lengthening was not necessarily visible in local drought conditions; e.g., streamflow drought in a less responsive river might develop later and persist longer compared to groundwater drought in a more responsive aquifer. Regional average single variable drought hazard information favors easy interpretation. However, drought information derived from different variables at different scales can show a low agreement. Therefore, in any region as diverse as the case study shown here, a drought assessment based on only regional average drought information may not be sufficient to explain the occurrence of some of the impacts.
The methodology used can be reproduced by following the methods described in Sect. 2, using the data that are stored in an online repository (see the data availability statement below).
Local percentile time series of all drought hazard variables used in the paper (P1, P3, P12, SM, Q, GW) can be found at https://doi.org/10.5281/zenodo.6449934 (Tijdeman et al., 2022).
All authors conceptualized the study. ET did the formal analyses and the writing of the first draft. Visualization was done by ET, MS, and VB. VB, MS, LM, and KS reviewed and edited the manuscript. Funding acquisition was done by LM and KS.
The contact author has declared that neither they nor their co-authors have any competing interests.
Publisher's note: Copernicus Publications remains neutral with regard to jurisdictional claims in published maps and institutional affiliations.
This work contributes to the DRIeR project supported by the Wassernetzwerk Baden-Württemberg (Water Research Network), which is funded by the Ministerium für Wissenschaft, Forschung und Kunst Baden-Württemberg (Ministry of Science, Research, and the Arts of the State Baden-Württemberg) (grant no. AZ. 7532.21/2.1.6). We acknowledge support by the open-access publication fund of the University of Freiburg. We further acknowledge the DWD and LUBW for providing data. Financial support of the German Research Foundation (DFG) for SDS@hd – Scientific Data Storage is acknowledged. All analyses were carried out with the open-source software R (https://www.r-project.org/, last access: 19 June 2022).
This research has been supported by the Ministerium für Wissenschaft, Forschung und Kunst Baden-Württemberg (grant no. AZ. 7532.21/2.1.6).
This open-access publication was funded by the University of Freiburg.
This paper was edited by Gregor C. Leckebusch and reviewed by two anonymous referees.
Bakke, S. J., Ionita, M., and Tallaksen, L. M.: The 2018 Northern European Hydrological Drought and Its Drivers in a Historical Perspective, Hydrol. Earth Syst. Sci., 24, 5621–5653, https://doi.org/10.5194/hess-24-5621-2020, 2020.
Barker, L. J., Hannaford, J., Chiverton, A., and Svensson, C.: From Meteorological to Hydrological Drought Using Standardised Indicators, Hydrol. Earth Syst. Sci., 20, 2483–2505, https://doi.org/10.5194/hess-20-2483-2016, 2016.
Blauhut, V., Gudmundsson, L., and Stahl, K.: Towards Pan-European Drought Risk Maps: Quantifying the Link between Drought Indices and Reported Drought Impacts, Environ. Res. Lett., 10, 014008, https://doi.org/10.1088/1748-9326/10/1/014008, 2015.
Blauhut, V., Stahl, K., and Falasca, G.: Dürre Und Die Öffentliche Wasser- Versorgung in Baden-Württemberg: Folgen, Umgang Und Wahrnehmung, Wasserwirtschaft, 11, 31–36, 2020.
Bloomfield, J. P. and Marchant, B. P.: Analysis of groundwater drought building on the standardised precipitation index approach, Hydrol. Earth Syst. Sci., 17, 4769–4787, https://doi.org/10.5194/hess-17-4769-2013, 2013.
Brakkee, E., van Huijgevoort, M. H. J., and Bartholomeus, R. P.: Improved understanding of regional groundwater drought development through time series modelling: the 2018–2019 drought in the Netherlands, Hydrol. Earth Syst. Sci., 26, 551–569, https://doi.org/10.5194/hess-26-551-2022, 2022.
Bruder, A, Tonolla, D., Schweizer, S. P., Vollenweider, S., Langhans, S. D., and Wüest, A.: A Conceptual Framework for Hydropeaking Mitigation, Sci. Total Environ., 568, 1204–1212, https://doi.org/10.1016/j.scitotenv.2016.05.032, 2016.
Brunner, M. I., Liechti, K., and Zappa, M.: Extremeness of Recent Drought Events in Switzerland: Dependence on Variable and Return Period Choice, Nat. Hazards Earth Syst. Sci., 19, 2311–2323, https://doi.org/10.5194/nhess-19-2311-2019, 2019.
Brunner, M. I., Swain, D. L., Gilleland, E., and Wood, A. W.: Increasing Importance of Temperature as a Contributor to the Spatial Extent of Streamflow Drought, Environ. Res. Lett., 16, 024038, https://doi.org/10.1088/1748-9326/abd2f0, 2021.
Changnon, S. A.: Detecting Drought Conditions in Illinois, Illinois State Water Survey Champaign, Illinois, USA, https://www.isws.illinois.edu/pubdoc/C/ISWSC-169.pdf (last access: 19 June 2022), 1987.
De Brito, M. M., Kuhlicke, C., and Marx, A: Near-real-time drought impact assessment: a text mining approach on the 2018/19 drought in Germany, Environ. Res. Lett., 15, 1040a9, https://doi.org/10.1088/1748-9326/aba4ca, 2020.
DWD: Climate and Environment Observations, http://opendata.dwd.de/climate_environment/CDC/ (last access: 4 March 2021), 2020.
Grecksch, K.: Scenarios for Resilient Drought and Water Scarcity Management in England and Wales, Int. J. River Basin Manage., 17, 219–217, https://doi.org/10.1080/15715124.2018.1461106, 2019.
Hannaford, J., Lloyd-Hughes, B., Keef, C., Parry, S., and Prudhomme, C.: Examining the Large-Scale Spatial Coherence of European Drought Using Regional Indicators of Precipitation and Streamflow Deficit, Hydrol. Process., 25, 1146–1162, https://doi.org/10.1002/hyp.7725, 2011.
Hao, Z. and Singh, V. P.: Drought Characterization from a Multivariate Perspective: A Review, J. Hydrol., 527, 668–678, https://doi.org/10.1016/j.jhydrol.2015.05.031, 2015.
Hari, V., Rakovec, O., Markonis, Y., Hanel, M., and Kumar, R.: Increased Future Occurrences of the Exceptional 2018–2019 Central European Drought under Global Warming, Sci. Rep., 10, 12207, https://doi.org/10.1038/s41598-020-68872-9, 2020.
Hellwig, J., Stoelzle, M., and Stahl, K.: Groundwater and baseflow drought responses to synthetic recharge stress tests, Hydrol. Earth Syst. Sci., 25, 1053–1068, https://doi.org/10.5194/hess-25-1053-2021, 2021.
Heudorfer, B., Haaf, E., Stahl, K., and Barthel, R.: Index-Based Characterization and Quantification of Groundwater Dynamics, Water Resour. Res., 55, 5575–5592, https://doi.org/10.1029/2018WR024418, 2019.
Hisdal H, Tallaksen L. Drought event definition, Technical Report, ARIDE Technical Report No. 6, University of Oslo, Oslo, Norway, https://www.droughtmanagement.info/literature/UNIVERSITYofOSLO_Drought_Event_Definition_2000.pdf (last access: 19 June 2022), 2000.
Ionita, M., Tallaksen, L. M. Kingston, D. G., Stagge, J. H., Laaha, G., Van Lanen, H. A. J., Scholz, P., Chelcea, S. M., and Haslinger, K.: The European 2015 Drought from a Climatological Perspective, Hydrol. Earth Syst. Sci., 21, 1397–1419, https://doi.org/10.5194/hess-21-1397-2017, 2017.
Kendon, M., Marsh, T., and Parry, S.; The 2010–2012 Drought in England and Wales, Weather, 68, 88–95, https://doi.org/10.1002/wea.2101, 2013.
Knutson, C., Hayes, M., and Phillips, T.: How to Reduce Drought Risk, Western Drought Coordination Council, Preparedness and Mitigation Working Group, National Drought Mitigation Center, Nebraska, USA, https://drought.unl.edu/archive/Documents/NDMC/Planning/risk.pdf (last access: 19 June 2022), 1998.
Kohn, I., Rosin, K., Freudiger, D., BeIz, J. U., Stahl, K., and Weiler, M.: Niedrigwasser in Deutschland 2011, Hydrol. Wasserbewirt., 58, 4–17, https://doi.org/10.5675/HyWa_2014,1_1, 2014.
Laaha, G., Gauster, T., Tallaksen, L. M., Vidal, J. P., Stahl, K., Prudhomme, C., Heudorfer, B., Vlnas, R., Ionita, M., Van Lanen, H. A. J., Adler, M. J., Caillouet, L., Delus, C., Fendekova, M., Gailliez, S., Hannaford, J., Kingston, D. Van Loon, A. F., Mediero, L., Osuch, M., Romanowicz, R., Sauquet, E., Stagge, J. H., and Wong, W. K.: The European 2015 Drought from a Hydrological Perspective, Hydrol. Earth Syst. Sci., 21, 3001–3024, https://doi.org/10.5194/hess-21-3001-2017, 2017.
Lloyd-Hughes, B.: The Impracticality of a Universal Drought Definition, Theor. Appl. Climatol., 117, 607–611, https://doi.org/10.1007/s00704-013-1025-7, 2014.
LUBW: Bewertungsmessnetz Grundwasservorräte, https://guq.lubw.baden-wuerttemberg.de/ (last access: 4 March 2021), 2020.
Markonis, Y., Kumar, R., Hanel, M., Rakovec, O., and Máca, P., and AghaKouchak, A.: The Rise of Compound Warm-Season Droughts in Europe, Sci. Adv., 7, eabb9668, https://doi.org/10.1126/sciadv.abb9668, 2021.
Nguyen, H., Wheeler, M. C., Otkin, J. A., Cowan, T., Frost, A., and Stone, R.: Using the evaporative stress index to monitor flash drought in Australia, Environ. Res. Lett., 14, 064016, https://doi.org/10.1088/1748-9326/ab2103, 2019.
Parry, S., Wilby, R. L., Prudhomme, C., and Wood, P. J.: A Systematic Assessment of Drought Termination in the United Kingdom, Hydrol. Earth Syst. Sci., 20, 4265–4281, https://doi.org/10.5194/hess-20-4265-2016, 2016.
Parry, S., Wilby, R. L., Prudhomme, C., Wood, P., and McKenzie, A.: Demonstrating the Utility of a Drought Termination Framework: Prospects for Groundwater Level Recovery in England and Wales in 2018 or Beyond, Environ. Res. Lett., 13, 064040, https://doi.org/10.1088/1748-9326/aac78c, 2018.
Peichl, M., Thober, S. Samaniego, L., Hansjürgens, B., and Marx, A.: Climate Impacts on Long-Term Silage Maize Yield in Germany, Sci. Rep., 9, 7674, https://doi.org/10.1038/s41598-019-44126-1, 2019.
Pendergrass, A. G., Meehl, G. A., Pulwarty, R., Hobbins, M., Hoell, A., AghaKouchak, A., Bonfils, C. J. W., Gallant, A. J. E., Hoerling, M., Hoffmann, D., Kaatz, L., Lehner, F., Llewellyn, D., Mote, P., Neale, R. B., Overpeck, J. T., Sheffield, A., Stahl, K., Svoboda, M., Wheeler, M. C., Wood, A. W., and Woodhouse, C. A.: Flash droughts present a new challenge for subseasonal-to-seasonal prediction, Nat. Clim. Change, 10, 191–199, https://doi.org/10.1038/s41558-020-0709-0, 2020.
Peters, E.: Propagation of drought through groundwater systems: illustrated in the Pang (UK) and Upper-Guadiana (ES) catchments, PhD Thesis, Wageningen University, Wageningen, the Netherlands, https://edepot.wur.nl/121490 (last access: 19 June 2022), 2003.
Peters, E., Van Lanen, H. A. J. , Torfs, P. J. J. F., and Bier, G.: Drought in Groundwater – Drought Distribution and Performance Indicators, J. Hydrol., 306, 302–317, https://doi.org/10.1016/j.jhydrol.2004.09.014, 2005.
Rauthe, M., Steiner H., Riediger, U., Mazurkiewicz, A., and Gratzki, A.: A Central European Precipitation Climatology – Part I: Generation and Validation of a High-Resolution Gridded Daily Data Set (HYRAS), Meteorol. Z., 22, 235–256, https://doi.org/10.1127/0941-2948/2013/0436, 2013.
Samaniego, L., Thober, S., Kumar, R., Wanders, N., Rakovec, O., Pan, M., Zink, M., Sheffield, J., Wood, E. F., and Marx, A.: Anthropogenic Warming Exacerbates European Soil Moisture Droughts, Nat. Clim. Change, 8, 421–426, https://doi.org/10.1038/s41558-018-0138-5, 2018.
Schuldt, B., Buras, A., Arend, M., Vitasse, Y., Beierkuhnlein, C., Damm, A., Gharun, M., Grams, T. E. E., Hauck, M., Hajek, P., Hartmann, H., Hiltbrunner, E., Hoch, G., Holloway-Phillips, G., Körner, C., Larysch, E., Lübbe, T., Nelson, D. B., Rammig, A., Rigling, A., Rose, L., Ruehr, N. K., Schumann, K., Weiser, F., Werner, C., Wohlgemuth, T., Zang, C. S., and Kahmen, A.: A First Assessment of the Impact of the Extreme 2018 Summer Drought on Central European Forests, Basic Appl. Ecol., 45, 86–103, https://doi.org/10.1016/j.baae.2020.04.003, 2020.
Siebert, C., Blauhut, V., and Stahl, K.: Das Dürrerisiko des Wasserkraftsektors in Baden-Württemberg, Wasserwirtschaft, 6, 48–51, https://doi.org/10.1007/s35147-021-0846-z, 2021.
Skiadaresis, G., Schwarz, J. A., and Bauhus, J.: Groundwater Extraction in Floodplain Forests Reduces Radial Growth and Increases Summer Drought Sensitivity of Pedunculate Oak Trees (Quercus Robur L.), Front. Forest. Global Change, 2, 1–16, https://doi.org/10.3389/ffgc.2019.00005, 2019.
Spinoni, J., Naumann, G., Vogt, J. V., and Barbosa, P.: The Biggest Drought Events in Europe from 1950 to 2012, J. Hydrol.: Reg. Stud. 3, 509–524, https://doi.org/10.1016/j.ejrh.2015.01.001, 2015.
Stahl, K., Kohn, I., Blauhut, V., Urquijo, J., De Stefano, L., Acácio, V., Dias, S., Stagge, J. H., Tallaksen, L. M., Kampragou, E., Van Loon, A. F., Barker, L. J., Melsen, L. A., Bifulco, C., Musolino, D., de Carli, A., Massarutto, A., Assimacopoulos, D., and Van Lanen, H. A. J.: Impacts of European drought events: insights from an international database of text-based reports, Nat. Hazards Earth Syst. Sci., 16, 801–819, https://doi.org/10.5194/nhess-16-801-2016, 2016.
Stephan, R., Erfurt, M., Terzi, S., Žun, M., Kristan, B., Haslinger, K., and Stahl, K.: An inventory of Alpine drought impact reports to explore past droughts in a mountain region, Nat. Hazards Earth Syst. Sci., 21, 2485–2501, https://doi.org/10.5194/nhess-21-2485-2021, 2021.
Stoelzle, M., Stahl, K., Morhard, A., and Weiler, M.: Streamflow sensitivity to drought scenarios in catchments with different geology, Geophys. Res. Lett., 41, 6174–6183, https://doi.org/10.1002/2014GL061344, 2014.
Stoelzle, M., Weiler, M., Stahl, K., Morhard, A., and Schuetz, T.: Is There a Superior Conceptual Groundwater Model Structure for Baseflow Simulation?, Hydrol. Process., 29, 1301–1313, https://doi.org/10.1002/hyp.10251, 2015.
Stoelzle, M., Staudinger, M., Stahl, K., and Weiler, M.: Stress testing as complement to climate scenarios: recharge scenarios to quantify streamflow drought sensitivity, Proc. IAHS, 383, 43–50, https://doi.org/10.5194/piahs-383-43-2020, 2020.
Tallaksen, L. M. and Van Lanen, H. A. J.: Hydrological Drought, Processes and Estimation Methods for Streamflow and Groundwater, in: Developments in Water Science, vol. 48, Elsevier Science B.V., Amsterdam, the Netherlands, ISBN 9780444516886-579, 2004.
Tallaksen, L. M. and Stahl, K.: Spatial and Temporal Patterns of Large-Scale Droughts in Europe: Model Dispersion and Performance, Geophys. Res. Lett., 41, 429–434, https://doi.org/10.1002/2013GL058573, 2014.
Tegel, W., Seim, A., Skiadaresis, G., Ljungqvist. F. C., Kahle, H. P., Land, A., Muigg, B., Nicolussi, K., and Büntgen, U.: Higher Groundwater Levels in Western Europe Characterize Warm Periods in the Common Era, Sci. Rep., 10, 16284, https://doi.org/10.1038/s41598-020-73383-8, 2020.
Tijdeman, E. and Menzel, L.: The development and persistence of soil moisture stress during drought across southwestern Germany, Hydrol. Earth Syst. Sci., 25, 2009–2025, https://doi.org/10.5194/hess-25-2009-2021, 2021a.
Tijdeman, E. and Menzel, L.: Daily Gridded Soil Moisture Simulations on a 1 Km Resolution Grid Covering Baden-Württemberg, version 1, Heidata repository [data set], https://doi.org/10.11588/data/PRXZAS, 2021b.
Tijdeman, E., Stahl, K. and Tallaksen, L. M.: Drought Characteristics Derived Based on the Standardized Streamflow Index – a Large Sample Comparison for Parametric and Nonparametric Methods, Water Resour. Res., 56, e2019WR026315, https://doi.org/10.1029/2019WR026315, 2020.
Tijdeman, E. Blauhut, V., Stoelzle, M., Menzel, L., and Stahl, K.: Data set: Different drought types and the spatial variability in their hazard, impact, and propagation characteristics (1.0), Zenodo [data set], https://doi.org/10.5281/zenodo.6449934, 2022.
Toreti, A., Belward, A., Perez-Dominguez, I., Naumann, G., Luterbacher, J., Cronie, O., Seguini, L., Manfron, G., Lopez-Lozano, R., Baruth, B., Van den Berg, M., Dentener. F., Ceglar, A., Chatzopoulos, T., and Zampieri, M.: The Exceptional 2018 European Water Seesaw Calls for Action on Adaptation, Earth's Future, 7, 652–663, https://doi.org/10.1029/2019EF001170, 2019.
UDO: Umwelt-Daten Und -Karten Online, https://udo.lubw.baden-wuerttemberg.de/ (last access: 4 March 2021), 2020.
Van Lanen, H. A. J., Laaha, G., Kingston, D. G., Gauster, T., Ionita, M., Vidal, J.-P., Vlnas, R., Tallaksen, L. M., Stahl, K., Hannaford, J., Delus, C., Fendekova, M., Mediero, L., Prudhomme, C., Rets, E., Romanowicz, R. J., Gailliez, S., Wong, W. K., Adler, M.-J., Blauhut, V., Caillouet, L., Chelcea, S., Frolova, N., Gudmundsson, L., Hanel, M., Haslinger, K., Kireeva, M., Osuch, M., Sauquet, E., Stagge, J. H., and Van Loon, A. F.: Hydrology Needed to Manage Droughts: The 2015 European Case, Hydrol. Process., 30, 3097–3104, https://doi.org/10.1002/hyp.10838, 2016.
Van Loon, A. F.: Hydrological Drought Explained, WIRES Water, 2, 359–392, https://doi.org/10.1002/wat2.1085, 2015.
Van Loon, A. F. and Van Lanen, H. A. J.: A process-based typology of hydrological drought, Hydrol. Earth Syst. Sci., 16, 1915–1946, https://doi.org/10.5194/hess-16-1915-2012, 2012.
Van Loon, A. F., Tijdeman, E., Wanders, N., Van Lanen, H. J., Teuling, A. J., and Uijlenhoet, R.: How climate seasonality modifies drought duration and deficit, J. Geophys. Res.-Atmos., 119, 4640–4656, https://doi.org/10.1002/2013JD020383, 2014.
Van Vliet, M. T. H., Sheffield, J., Wiberg, D., and Wood, E. F.: Impacts of Recent Drought and Warm Years on Water Resources and Electricity Supply Worldwide, Environ. Res. Lett., 11, 124021, https://doi.org/10.1088/1748-9326/11/12/124021, 2016.
Vicente-Serrano, S. M., Peña-Angulo, D., Murphy, C., López-Moreno, J. I., Tomas-Burguera, M., Domínguez-Castro, F., Tian, F., Eklundh, L., Cai, Z., Alvarez-Farizo, B., Noguera, I., Camarero, J. J., Sánchez-Salguero, R., Gazol, A., Grainger, S., Conradt, T., Boincean, B., and El Kenawy, A.: The Complex Multi-Sectoral Impacts of Drought: Evidence from a Mountainous Basin in the Central Spanish Pyrenees, Sci. Total Environ., 769, 144702, https://doi.org/10.1016/j.scitotenv.2020.144702, 2021.
Wanders, N. and Wada, Y.: Human and Climate Impacts on the 21st Century Hydrological Drought, J. Hydrol., 526, 208–220, https://doi.org/10.1016/j.jhydrol.2014.10.047, 2015.
Weibull, W.: A Statistical Theory of Strength of Materials, Ing. Vet. Ak. Handl., Stockholm, Sweden, https://www.scribd.com/doc/220393982/A-Statistical-Theory-of-Strength-of-Materials-by-Weibull (last access: 19 June 2022), 1939.
Wilhite, D. A. and Glantz, M. H.: Understanding: The Drought Phenomenon: The Role of Definitions, Water Int., 10, 111–120, https://doi.org/10.1080/02508068508686328, 1985.
Wilhite, D. A., Easterling, W. E., and Wood, D. A.: Planning for Drought: Toward a Reduction of Societal Vulnerability, Routledge, New York, USA, ISBN 9780367282981, 2019.
Wu, J., Chen, X., Yao, H., and Zhang, D.: Multi-timescale assessment of propagation thresholds from meteorological to hydrological drought, Sci. Total Environ., 765, 144232, https://doi.org/10.1016/j.scitotenv.2020.144232, 2021.
Zargar, A., Sadiq, R., Naser, B., and Khan, F. I.: A Review of Drought Indices, Environ. Rev., 19, 333–349, https://doi.org/10.1139/a11-013, 2011.
Zscheischler, J., Martius, O., Westra, S., Bevacqua, E., Raymond, C., Horton, R. M., Van den Hurk, B., AghaKouchak, A., Jézéquel, A., Mahecha, M. D., Maraun, D., Ramos, A. M., Ridder, N. N., Thiery, W., andVignotto, E.: A Typology of Compound Weather and Climate Events, Nat. Rev. Earth Environ., 1, 333–347, https://doi.org/10.1038/s43017-020-0060-z, 2020.