the Creative Commons Attribution 4.0 License.
the Creative Commons Attribution 4.0 License.
 | 14 Jun 2022
Travel and terrain advice statements in public avalanche bulletins: a quantitative analysis of who uses this information, what makes it useful, and how it can be improved for users
Kathryn C. Fisher
Patrick Mair
Recreationists are responsible for developing their own risk management plans for travelling in avalanche terrain. To help recreationists mitigate their exposure to avalanche hazard, many avalanche warning services include explicit travel and terrain advice (TTA) statements in their daily avalanche bulletins where forecasters offer guidance about what specific terrain to avoid and what to favour under the existing conditions. However, the use and effectiveness of this advice has never been tested to ensure it meets the needs of recreationists developing their risk management approach for backcountry winter travel.
We conducted an online survey in Canada and the United States to determine which user groups are paying attention to the TTA in avalanche bulletins, what makes these statements useful, and if modifications to the phrasing of the statements would improve their usefulness for users. Our analysis reveals that the core audience of the TTA is users with introductory-level avalanche awareness training who integrate slope-scale terrain considerations into their avalanche safety decisions. Using a series of proportional-odds ordinal mixed-effect models, we show that reducing the jargon used in the advice helped users with no or only introductory-level avalanche awareness training understand the advice significantly better and adding an additional explanation made the advice more useful for them. These results provide avalanche warning services with critical perspectives and recommendations for improving their TTA so that they can better support recreationists who are at earlier stages of developing their avalanche risk management approach and therefore need the support the most.
- Article
(595 KB) - Full-text XML
- BibTeX
- EndNote


Mountainous areas with untracked powder slopes are popular destinations for winter backcountry recreationists including backcountry skiers and snowboarders, mountain snowmobile riders, and snowshoers. Even though detailed information on participation in winter backcountry recreation is sparse, there is strong anecdotal evidence that increasing numbers of people are taking to the mountains to pursue their mountain objectives, exercise, or simply enjoy nature (e.g., Birkeland et al., 2017; Techel et al., 2016; Winkler et al., 2016). However, recreating in the backcountry comes with serious risks. In North America alone, avalanches were responsible for the deaths of 334 recreationists between 2011 and 2020 and an unknown number of injuries and near misses (Avalanche Canada, 2019; CAIC, 2020). To safely recreate in avalanche terrain, recreationists must continuously monitor the severity of avalanche hazard and make informed decisions about what type of terrain is acceptable to travel in under the current conditions (CAA, 2016). While some recreationists hire certified mountain guides to manage the risk from avalanches for them, most make their own decisions about when, where, and how to travel in the backcountry.
Having a good understanding of the existing avalanche conditions is critical for putting together a meaningful avalanche risk management approach for a trip into the backcountry. To assist recreationists with this process, most western countries with mountainous regions have public avalanche warning services that publish daily avalanche condition reports, commonly known as “avalanche bulletins” or “avalanche forecasts”. The main objective of these condition reports is to inform the reader about the severity of the existing avalanche hazard, which, in the context of public avalanche forecasting, is defined as the potential for avalanches to cause harm to backcountry recreationists (Statham, 2008). In North America, public avalanche forecasters assess avalanche hazard according to the conceptual model of avalanche hazard (CAA, 2016; Statham et al., 2018). Based on the available weather, snowpack, and avalanche observations, forecasters develop a picture of the types of existing avalanche problems, the locations where these problems can be found in the terrain, the likelihood of associated avalanches, and their expected destructive size (Statham et al., 2018). This information is then summarized into a set of three danger ratings that describe the overall severity of the conditions in the three elevation bands of alpine, treeline, and below treeline according to the North American public avalanche danger scale (Statham et al., 2010). Reflecting this process, avalanche bulletins in North America present the avalanche hazard information to their readers in a pyramid-like structure with the overall hazard rating given first; then details of avalanche problems; and finally additional details about snowpack structure, avalanche observations, and weather conditions. Avalanche bulletins in Europe use a similar but slightly different structure (EAWS, 2021).
While avalanche bulletins provide an expert assessment of the existing hazard, recreationists must manage the associated risk by controlling their hazard exposure through their choices about when and where to go into the backcountry. These decisions can be made at different levels of sophistication, which were recently described in the bulletin user typology of St. Clair et al. (2021). Bulletin user type B, for example, exclusively bases their decision to go into the backcountry at all on the danger rating, whereas type D users use the avalanche problem information to distinguish between suitable and unsuitable areas for travel. A follow-up survey study by Finn (2020) showed that while bulletin users generally have a decent understanding of the concepts presented in the bulletin, roughly half of his survey participants exhibited challenges applying the information in a hypothetical slope evaluation task. This highlights that there might be a considerable gap between understanding the hazard information and combining it with terrain selection to make good risk management decisions.
There are several existing avenues through which recreationists can develop skills in forming a risk management plan and learn about selecting terrain to reduce exposure. Avalanche awareness courses taught by mountain guides and avalanche educators offer an important resource for recreationists to learn about practical avalanche risk management skills that can be used to understand both avalanche hazard and how to control risk through terrain selection. This was confirmed by Finn (2020), who found a strong association between the avalanche awareness training level of survey participants and their performance at evaluating appropriate slopes for travel. To further assist recreationists in selecting appropriate terrain, various products have been developed including specialized maps, decision aids, and web applications. For example, Statham et al. (2006) developed the Avalanche Terrain Exposure Scale (ATES) to describe the severity of backcountry trips with respect their general exposure to avalanche hazard using the three ordinal categories of “simple”, “challenging”, and “complex”. This expert terrain rating system has been used extensively to rate backcountry recreation areas in Canada (see https://www.avalanche.ca/planning/trip-planner, last access: 9 June 2022), but ATES has also been applied in Norway (Larsen et al., 2020), Spain (Gavaldà et al., 2013), and Switzerland (Pielmeier et al., 2014). While the ATES system provides an expert assessment of the terrain, Harvey et al. (2018) took a more physical process-oriented approach to classifying terrain when developing avalanche terrain maps based on GIS (geographic information system) algorithms that explicitly identify potential avalanche release areas, possible runout zones, areas with the potential for remote triggering, and areas where small or medium-sized avalanches might lead to serious injures or deep burials due to terrain traps.
In addition to these terrain classifications, various decision frameworks have been developed to help recreationists combine the hazard information provided in avalanche bulletins with terrain characteristics of intended trips to make informed decisions about avalanche risk. Examples include the ground-breaking Reduction Method developed by Munter (1997), which combines the published danger rating with several terrain characteristics and group factors to determine whether the associated risk is acceptable, and the Avaluator Trip Planner (Haegeli, 2010), which combines the danger rating of the bulletin and the ATES rating of an intended trip graphically to provide users with guidance about what level of training and experience is required to effectively manage avalanche risk under the given conditions. Most recently, some of the concepts presented by these decision aids have been implemented as web applications. Avalanche Canada has an online trip planner that displays Avaluator assessments for selected recreation areas based on their ATES ratings and the current avalanche danger rating (https://www.avalanche.ca/planning/trip-planner, last access: 9 June 2022), and the Swiss https://skitourenguru.ch/ (last access: 9 June 2022) website has implemented a version of the reduction method to provide detailed daily risk assessments of backcountry routes in the central European Alps (Schmudlach and Köhler, 2016).
The terrain classification systems and decision aids described above exist separately from the hazard information in avalanche bulletins and provide only generic guidance, and their application requires some training and experience. However, many avalanche bulletins also include travel and terrain advice (TTA) statements where avalanche forecasters directly communicate with their users to offer guidance about what specific terrain to avoid and what to favour under the existing hazard conditions. Avalanche warning services have taken a varied approach to including TTA statements in their bulletins. The Northwest Avalanche Center in Washington State, for example, presents the advice as part of their “bottom-line” summary at the top of their bulletin web page, while the Colorado Avalanche Information Center presents the information after the avalanche danger rating (NWAC, 2021; CAIC, 2021). In contrast, Swiss avalanche bulletins include the information along with the general hazard description (SLF, 2021). Avalanche Canada historically included the TTA statements on the avalanche problem tab but moved them below to the danger rating at the beginning of the 2020/21 winter season. These statements are the primary source of information on appropriate terrain selection found in avalanche bulletins.
Despite the important role of TTA statements for guiding users towards an appropriate risk management plan by linking daily hazard and terrain selection, there have been no studies to date that specifically examine how these statements of advice are used by recreationists. In this study, we address this knowledge gap by
-
identifying which users pay the most attention to the TTA information,
-
examining factors that contribute to the usefulness of a TTA statement, and
-
testing how simple modifications could increase the usefulness of these statements.
In the spring of 2020, we conducted a large-scale online survey to empirically examine different options for improving communication of hazard and terrain information in avalanche bulletins. This paper focuses on the results pertaining to the travel and terrain advice (TTA) statements, whereas additional analyses investigating information graphics and bulletin interactivity are presented in Fisher et al. (2021, 2022).
2.1 Survey design
To investigate the primary audience of the TTA statements in the bulletin, we asked all survey participants how much attention they generally pay to the TTA statements. This was to better understand which users are engaging with the TTA, as well as to target subsequent questions about the TTA towards participants who actually use it. Users were asked to rate their attention to the TTA on a four-level ordinal scale of “none”, “a little”, “a considerable amount”, and “a large amount”. Users who selected any response other than none were directed towards a section with more detailed questions about specific TTA statements.
We created a database of 18 TTA statements (Appendix A) drawn from a larger database of statements provided by Avalanche Canada. The 18 statements selected covered a variety of snow conditions, terrain features, or behaviours participants should be mindful of while recreating in avalanche terrain. We also ensured the statements represented a mix of communication styles (see the statement type column in Table A1) including direct recommendations for actions, mindsets to adopt while travelling, or simply bringing attention to certain key features. For each statement, the research team created a second statement that altered the original statement to vary the amount of jargon in the statement or add additional explanatory details about conditions described in the statement. Additional details included more detailed descriptions of the impacts of a condition or information on how to identify a feature into the statement. The end result was a database of 36 statements divided across four treatments: “more jargon”, “less jargon”, “no explanation”, and “added explanation”. This structure allowed us to compare the impact of the statement treatment while controlling for the subject of the statement.
Each participant was shown three TTA statements drawn semi-randomly from the database of 18 paired statements. Each participant saw a combination of original and modified statements, and the survey structure was designed so that individual participants were not presented with both the original and modified versions of the same statement.
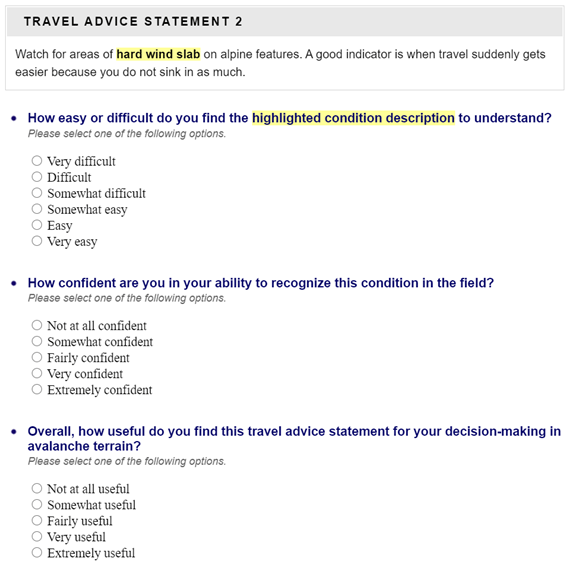
To comprehensively capture participants' perspective of the statements, we asked participants to rate each of the presented statements with respect to three different aspects (Fig. 1). First, if the TTA included a key phrase (e.g., “minimize exposure”, “hard wind slab”, and “thick melt–freeze surface crust”), the phrase was highlighted, and participants were asked how easy it was to understand the phrases on a six-level scale including “very difficult”, “difficult”, “somewhat difficult”, “somewhat easy”, “easy”, and “very easy”. All but two TTA statements included this question. Second, if the key phrase described a snow condition or terrain feature that users need to recognize in the field to apply the statement meaningfully, participants were asked how confident they were about recognizing the highlighted condition in the field on a five-level scale with response options including “not at all confident”, “somewhat confident”, “fairly confident”, “very confident”, and “extremely confident”. This question was only included with six pairs of TTA statements. Finally, for all statements, participants were asked how useful they thought the statement was overall for their avalanche risk management practices using a five-level scale including “not at all useful”, “somewhat useful”, “fairly useful”, “very useful”, and “extremely useful”. The aim of this three-question setup was to provide deeper insight on why TTA statements are considered useful (or not) and how that perspective is affected by our statement alterations.
The survey contained additional background questions so that we could contextualize and identify patterns among respondents. We drew from questions included in Finn's (2020) survey and incorporated questions about participants' primary modes of winter recreation in the backcountry, how many years and days per year of experience they had, and their bulletin user type as described by St. Clair (2019). Further questions collected basic sociodemographic items including self-identified gender, age, education level, and location of residence. Additional sections included in the survey to address the other research questions are described in Fisher (2021) and Fisher et al. (2021, 2022).
The survey was developed during the early part of the 2019/20 winter season and extensively tested in February and March 2020 prior to release. Survey testing began with an initial round of testers with moderate to high levels of winter backcountry recreation experience and avalanche industry experts. A second round of testing included users from novice to expert participants. The survey was also reviewed and approved by the Office for Research Ethics of Simon Fraser University (SFU ethics approval 2020s0074).
2.2 Recruitment and survey development
The primary target audience for our survey was North American avalanche bulletin users, which we recruited in a variety of ways. The foundation of our recruitment was 3047 bulletin users who participated in previous avalanche bulletin surveys conducted by our research group and indicated that they were interested in participating in future studies. The survey was officially launched on 23 March 2020, by sending invitation emails to 300 individuals from this existing panel of prospective participants. This soft launch allowed us to monitor the initial responses and address any survey issues if necessary. However, the survey worked as designed, and no modifications were required. On 26 March 2020, we sent invitation emails to the rest of our panel of prospective participants (2747 individuals), and between 26 March and 1 April 2020, the survey was also actively promoted by our partnering avalanche warning services (Avalanche Canada, Parks Canada, Colorado Avalanche Information Center, and Northwest Avalanche Center). Each of these warning services helped us recruit participants by including a banner on their bulletin website and promoting the survey through their social media channels. We also advertised our study by posting on various social media sites popular among winter backcountry users, such as South Coast Touring and Backcountry YYC on Facebook, and by reaching out to community leaders to distribute the survey among their followers.
The survey sample for the present analysis was drawn on 31 May 2020, after which no additional surveys were included in analysis. At the close of the survey, 6789 individuals had visited our survey and 3668 (55.3 %) had completed it. The vast majority of the dropouts (1829, 27.6 %) did not continue after looking at the first page of the survey that described the objective of the study and structure of the survey. The dropout rate for individual survey pages was 1 % or less except the page that introduced the route-ranking task (57, 3.4 %). Of the individuals who completed the survey, 1600 (44.6 %) were participants of previous survey studies of our research group who received an invitation email. Other substantial recruitment sources included announcements on avalanche bulletin websites (17.5 % of participants who completed the survey), social media posts by collaborating avalanche warning services (9.2 %), and other posts in social media groups (e.g., Facebook and Instagram) focused on winter backcountry recreation (21.5 %).
2.3 Data analysis
Our analysis approach started with the use of standard descriptive statistics to describe the nature of the analysis dataset and explore the relationships between different variables. We used a standard proportional-odds ordinal regression model to evaluate how much attention users paid to the TTA in general, but since each of our participants evaluated multiple statements, we employed a series of proportional-odds ordinal mixed-effect regression models to explore how participants rated their understanding of key phrases highlighted in the statements, how confident they felt recognizing those conditions in the field, and how useful they found the statements overall. Mixed-effect models are a type of regression model that accounts for correlations that emerge from repeated measure designs or nested data structures (Harrison et al., 2018; Zuur et al., 2019). To accommodate these data structures, mixed-effect models include both fixed and random effects in the regression equations. The fixed effects, which are equivalent to the intercept and slope estimates in traditional regression models, capture the relationship between the predictor and response variables for the entire dataset. While traditional regression models assign the remaining unexplained variance in the data (i.e., randomness) entirely to the global error term, mixed-effect models partition the unexplained variance that originates from groupings within the dataset into random effects. Thus, random effects highlight how groups within the dataset deviate from the overall pattern described by the fixed effects included in the model. While there is some judgement involved in deciding what predictors are included in the model as a fixed or random effect, it is generally the grouping variables that are not explicitly of interest that enter the analysis as random effects. In our analysis, this includes the participants as they assessed three TTA statements each, as well as the 18 pairs of original and modified versions of the TTA statements.
Since the TTA statements included in our study had their wording modified to either reduce jargon (11 statements; Table A1) or include additional explanations (7 statements; Table A1) but not both, we estimated two sets of three ordinal regression models to separately examine the effect of these modifications on the understandability of the statements, participants' confidence to recognize the conditions in the field, and the overall usefulness of the statements. All analyses required the use of mixed-effect models except the model examining participants' confidence recognizing the condition when an additional explanation was added because we only had a single TTA statement where this question was relevant (see statement 8 of Table A1). For this analysis, we used a standard ordinal logistic regression model instead.
To explore our main research question, we included the predictor variables of “statement treatment” (less jargon, more jargon, no explanation, and added explanation) and “avalanche training” (none, introductory, advanced, and professional) as fixed effects in all of our regression models by default. Since we were interested in better understanding how the different statement treatments affect the responses of participants with different levels of training, we also included this interaction in the models for all three questions. In addition, we included “statement type”, “years of experience”, “days per winter in backcountry”, “bulletin user type”, and “country of residence” in the initial models by default but removed them if their parameter estimates did not reveal a significant influence on the model (i.e., p values > 0.050). However, we also took the magnitude of the observed effect into account for deciding whether including the parameter was meaningful. After an initial model was estimated, the parameter estimates of ordinal predictor variables were examined for linear relationships, and if a linear relationship was present and meaningful, the specific ordinal predictor variable was replaced with a numeric variable to produce a more parsimonious model. Because our experimental setup included more statements where we modified the amount jargon, we estimated the jargon models first and subsequently estimated the models for examining the effect of the added explanation with the same parameter settings. This ensured that both analysis streams considered the same covariates and were comparable despite varying sample sizes.
The distributions of many of our predictor and response variables were considerably skewed with many participants selecting options higher on the scale (e.g., use of the TTA: a considerable amount or a large amount) and only few choosing lower options (e.g., use of the TTA: not at all). To address this issue, we examined the distributions of all variables prior to estimating the models and combined categories with extremely small counts (e.g., <1 %). This resulted in the following changes in our variables: (a) we combined “1–2 d” and “3–10 d” into a single category in our backcountry days per winter predictor variable, and (b) we merged very difficult and difficult into a single category for the level-of-understanding rating. While these changes help to even out the distributions of the values in our variables, many of our response variables are still highly skewed. While these distributions contain meaningful insight, it can be difficult for ordinal regression models to properly represent them, and it is possible that categories with very low response frequencies are overpredicted. To examine whether our models describe the observed responses adequately, we performed a posterior predictive check (Gelman and Hill, 2007, p. 158) where we simulated the distributions of the response variable using the fitted model and then compared them to the observed data. Our results indicated that all of our models capture the observed frequencies of the response variables nicely, and there was no need to further combine response categories.
Since our models include predictor variables with considerable correlations (e.g., avalanche awareness training and bulletin user type), there is the risk of variance inflation, which affects the standard errors and produces incorrect p values. To explore the impact of correlations on the standard errors in the regression parameters, we computed the generalized variance inflation factor (GVIF) and used the general rule of thumb for categorical variables that to assess whether there is any issue (Fox and Monette, 1992).
We conducted our entire analysis in R (version 4.1.3; R Core Team, 2022) and
used the clmm function of the ordinal package (Christensen, 2019) to estimate our ordinal mixed-effect models and the polr function of the MASS package (Venables and Ripley, 2002) to estimate our standard ordinal logistic regression models. While we performed the posterior predictive check manually, since the posterior_predictive_check function in the performance package (Lüdecke et al., 2021) has not been implemented for our model types, we used the gvif function from the car package (Fox and Weisberg, 2019) to calculate the generalized variance inflation factors. Since neither of these checks can be performed on mixed-effect models, we also estimated standard ordinal regression models with the same parameter setting for all mixed-effect models and used those to simulate the distribution of the response variable and calculate the GVIF.
Since parameter estimates of ordinal logistic regression models are notoriously difficult to interpret directly, we used effect plots that show
the probabilities for selecting specific levels of the response variable to
illustrate the results. We used the ref_grid and emmeans functions of the emmeans package (Lenth, 2019) to both estimate these probabilities and conduct post hoc pairwise comparisons to explicitly test for significant differences between different combinations of predictor variables. To counteract the issue of type I error inflation from multiple comparisons, p values were calculated with the default correction approach implemented in the function. When reading about the results and examining the effect plots, it is important to remember that the shown probabilities are calculated for a specific combination of predictor values and cut point in the response variable to illustrate a particular pattern. Hence it is more important to look at the general pattern and significance of the differences in these probabilities than their absolute values, as they change depending on the chosen predictor values.
3.1 Participant demographics
To ensure meaningful results, we only included participants in our analysis dataset who completed all pages of the survey, whose reported residence was in Canada or the United States, who were over the age of 201, and whose choices for primary activity and avalanche awareness training aligned with the predefined options. In addition, we excluded participants who took less than 10 min or more than 2.5 h to complete the survey and participants who did not respond to the question about how much attention they pay to the travel and terrain advice (TTA). We also disqualified participants who spent less than 30 s or more than 10 min viewing the travel advice page to remove participants who just clicked through it or got interrupted while completing the page. We also eliminated participants who did not provide information on their years of backcountry experience and how many days they spend in the backcountry each year, as they play a critical role in our analysis. Finally, we removed participants whose self-reported bulletin user type was A or F due to the low number of participants in each group, as well as to reduce correlation among variables. The final analysis dataset consisted of 2998 participants, which represented 81.7 % of the 3668 individuals who completed the survey. These participants provided a total of 8900 TTA statement assessments. However, the datasets for the individual analyses vary, as not all three assessment questions were relevant for every TTA statement.
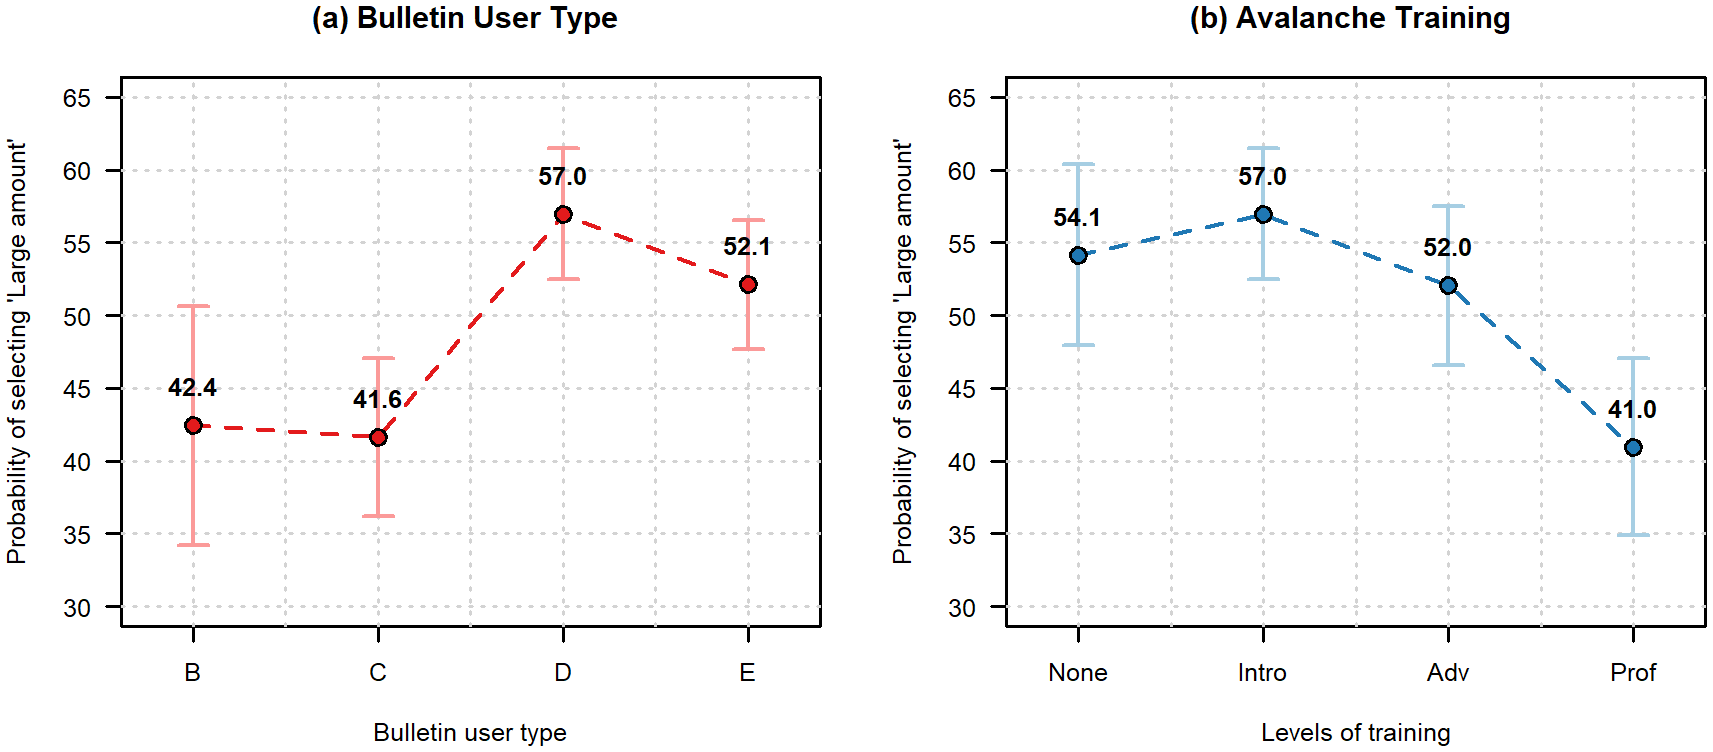
Figure 2Estimated marginal probabilities for selecting a large amount for (a) different bulletin user types and (b) different avalanche training levels. Error bars represent 95 % confidence intervals for probabilities calculated from the subsample for the particular parameter level. Variable levels for calculations of estimated marginal probabilities: bulletin user type – type D (b only), avalanche awareness training – introductory (a only), days in backcountry per winter – 11–20 d, and country of residence – Canada.
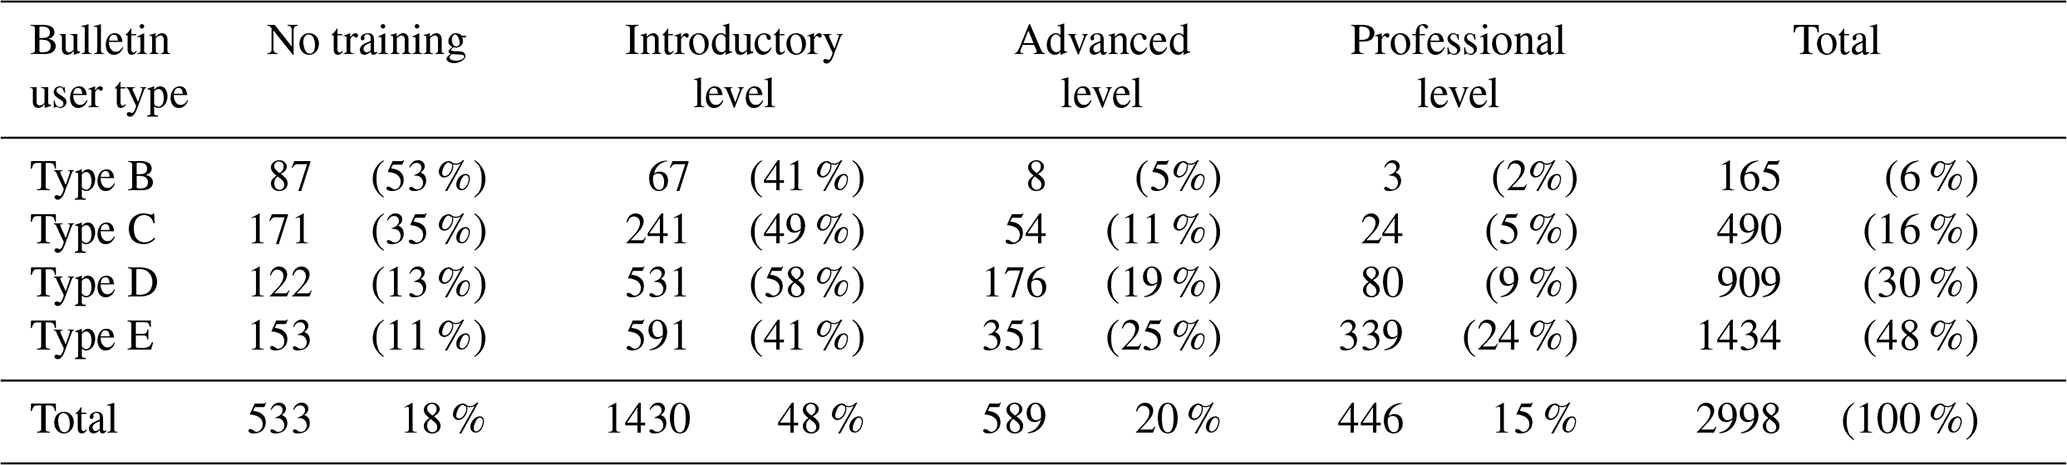
Of the 2998 participants, 76.6 % identified as male (2273 participants), 36.8 % were between 25 and 34 years old (1101 participants), 80.4 % had an education level of university or higher (2304 participants), and 82.2 % had completed at least an introductory avalanche safety training course (2465 participants). Backcountry skiers represented the highest proportion of recreationists in the study with 78.1 % of the sample (2341 participants) identifying backcountry skiing as their primary backcountry winter activity. Additional types of recreationists present in our sample included out-of-bounds skiers (7.7 %, 230 participants), snowshoers (5.8 %, 173 participants), and snowmobilers (5.0 %, 151 participants), and less than 2 % are ice climbers and snowmobile-accessed backcountry skiers. The largest group of participants (31.6 %, 947 participants) were relatively new to their sport, with between 2 and 5 years of experience. However, the distribution of years of experience was relatively even with 19.7 %, 19.1 %, and 25.0 % of the sample stating that they had 6–10 years, 11–20 years, and more than 20 years of backcountry experience, respectively. Only 4.5 % of the sample (136 participants) reported that this was their first year of backcountry recreation. Bulletin user types “D – distinguish and integrate avalanche problem conditions” and “E – extends analysis” made up 30.3 % and 47.8 % of participants, respectively (909 and 1434). While we observed a significant correlation between avalanche training and bulletin user type (Spearman rank correlation: 0.350, p value < 0.0001), the analysis sample included a range of training levels at each bulletin user type (Table 1). Finally, 70.4 % (2110) of responses were from residents of the United States.
Table 1Distribution of avalanche training levels with respect to self-identified bulletin user type within the final dataset. Percentage values are row percentages except in the total column where they represent column percentages.
3.2 Attention to travel and terrain advice
Of the 2998 participants included in the analysis dataset, 52.3 % (1569) stated that they pay a large amount of attention to the TTA statements in the avalanche bulletin (scale: none, a little, a considerable amount, and a large amount). Thirty-nine percent (1169) of respondents stated that they pay a considerable amount of attention to the TTA; 8.1 % (244) indicated that they only pay a little bit of attention to the TTA; and less than 1 % (16) responded that they pay no attention to the TTA.
Our ordinal regression model for the probability of participants' response selections revealed four significant predictors, which included the bulletin user type of the participant, the level of avalanche training they had completed, how many days they spend per year engaged in their preferred backcountry activity, and their country of residence (Table B1). Initial model explorations showed that the effect of the number of days in the backcountry per winter was strongly linear, and we decided to replace this ordinal variable with a numerical one to produce a more parsimonious model. The posterior predictive check showed that the skewed distribution of the response variable was well captured by our model, and all of the generalized variance inflation factors were well below 5, indicating that there were no issues with predictor correlations.
Participants who self-identified as a bulletin user type D were the most likely to pay attention to the TTA statements. Figure 2a illustrates this effect by showing the estimated marginal probabilities for selecting a large amount for the different bulletin user types with avalanche awareness training set to introductory, 11–20 d in the backcountry per winter, and Canada as the country of residence. Using these parameter values, the model estimates a 57.0 % chance that participants of user type D respond that they pay a large amount of attention to the advice, followed by user type E at 52.1 %. This difference was not statistically significant (post hoc pairwise comparison: p value = 0.0663), even though the p value is close to the 5 % threshold. However, user types C and B were significantly less likely to indicate that they pay a large amount of attention to the TTA than user type D (42.4 % and 41.6 %, respectively, both with a p value < 0.0001).
In addition to the bulletin user type, the level of avalanche training a participant had completed was also a significant predictor of how much attention they pay to the TTA statements (Fig. 2b). Participants with professional-level training were significantly less likely to report that they pay a large amount of attention to the TTA statements (41.0 %) than participants with advanced-level training (52.0 %, p value = 0.0007), which was no different than participants with introductory training (57.0 %, p value = 0.1197) or no training (54.1 %, p value = 0.5914).
Another predictor of participants' attention to the TTA included the average number of days they spend in the backcountry during a typical winter, which we interpreted as their level of engagement in the activity. Participants who spend more days in the backcountry were more likely to indicate lower levels of attention to the TTA, while participants who spend fewer days in the backcountry are likely to state that they pay more attention to the TTA. Finally, participants residing in the United States were more likely to indicate higher levels of attention to the TTA than Canadian residents.
3.3 Overall usefulness of travel and terrain advice
Our dataset for this analysis consisted of 8900 usefulness ratings. Most participants found the TTA useful, with 54.8 % of participants reporting that they found the statements either very useful or extremely useful (scale: not at all useful, somewhat useful, fairly useful, very useful, and extremely useful), and only 2.9 % (262) of the ratings were not at all useful. Of the available usefulness assessments, 5529 (62.1 %) related to statements where the amount of jargon was modified, and 3371 (37.9 %) assessments are linked to statements where explanations were added. Overall, the statements in the jargon sample were rated significantly more useful than the explanation statements (58.3 % versus 49.1 % rating them very useful or extremely useful; Kruskal–Wallis rank sum test: p value < 0.001).
We built separate ordinal mixed-effect regression models to understand the influence of jargon and added explanation on the reported usefulness with participant ID (identification), statement ID, and statement version code as random effects. Prior to estimating the models, we created explicit “not applicable” (n/a) categories for the level of understanding and confidence-in-recognition variables, since these ratings were not relevant (and therefore not asked) for all TTA statements included in the study (Table A1). This allowed us to include the entire dataset in the analysis. Overall, 1081 (12.1 %) TTA statement assessments did not have a level-of-understanding rating, and 5564 (62.5 %) statements did not have a confidence in recognition rating. Note that all the not-applicable values for the level of understanding ended up in the explanation model, and none of them were in the jargon model. Hence, there is no parameter estimate for not applicable in the jargon model.
Our final model for examining the influence of jargon included five predictors (statement treatment, level of avalanche training, attention to TTA statements, level of understanding, and recognition confidence) as main effects and the interaction effect between statement type and level of avalanche awareness training. We used the same predictor variables for examining the effect of the added explanation to make sure that the results are comparable. Readers interested in more details are invited to examine the precise model specifications in the accompanying R code published in Haegeli et al. (2022). Our posterior predictive checks indicated that the skewed distributions of the response variable were well captured by our models, and the low generalized variance inflation factors confirmed no issues with predictor correlations.
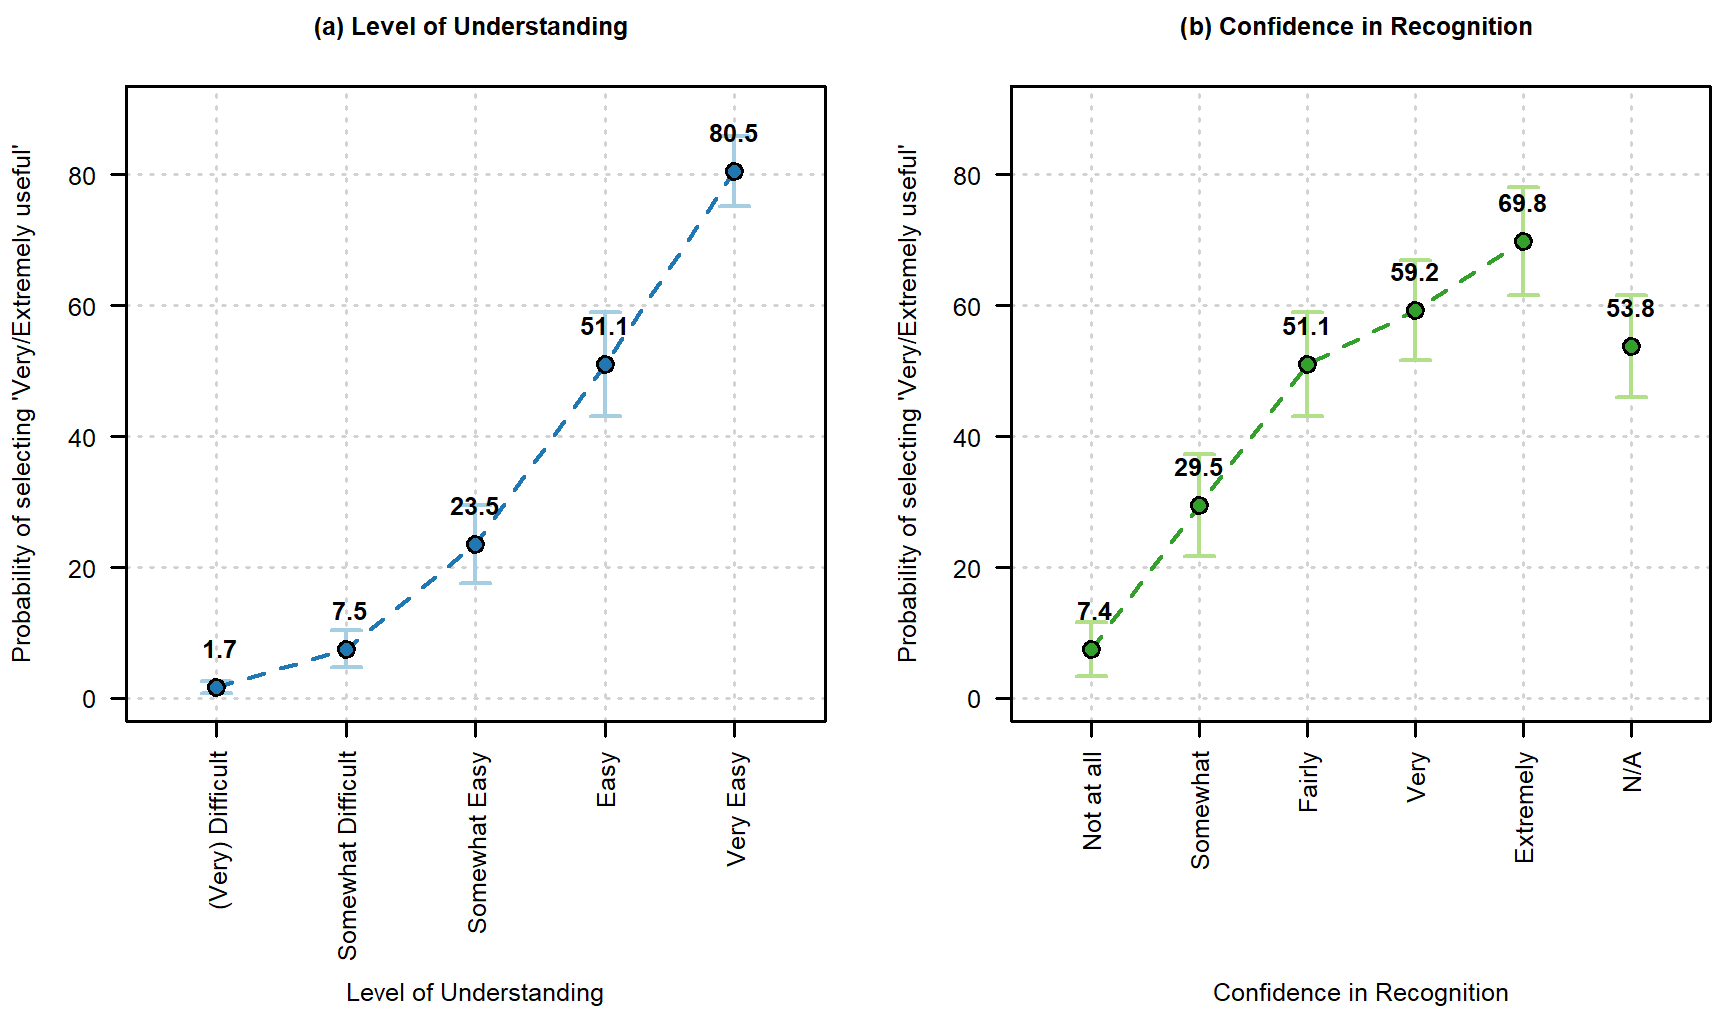
Figure 3Estimated marginal probabilities for selecting very useful or extremely useful for usability of the statement as a function of (a) participants' level of understanding and (b) their confidence in recognizing the condition or feature. Error bars represent 95 % confidence intervals for probabilities calculated from the subsample for the particular parameter level. Variable levels for calculations of estimated marginal probabilities: avalanche awareness level – introductory, attention to TTA statements – considerable, years of backcountry experience – 6–10 years, average number of days in the backcountry per winter – 11–20 d, level of understanding – easy (b only), and confidence in recognition – fairly confident (a only).
Overall, the two models examining what makes a TTA statement useful revealed very similar main-effect patterns with the results of the jargon model generally being more significant due to the larger sample size (Table B2). Hence, our presentation of the results focuses on the jargon model unless explicitly stated. The strongest predictor that emerged from our analysis was how well participants understand the statement. Figure 3a illustrates this effect by presenting estimated marginal probabilities for selecting very useful or extremely useful as a function of the level of understanding calculated for participants with introductory-level avalanche awareness training and 6–10 years of winter backcountry experience, who spend an average of 11–20 d in the backcountry each winter, who pay considerable attention to the TTA statements, and who are fairly confident in their ability to recognize the condition in the field. In this scenario, participants who found a statement difficult to understand had the lowest percent chance of finding the statement very useful or extremely useful (1.7 %). However, with every increase in rating of how easy it is to understand the statements, the chance of a high usefulness rating becomes significantly higher. Participants who rated the advice as somewhat difficult have a 7.5 % chance of finding the advice very useful or extremely useful, but the percentage value jumps to 23.5 % for participants who found it somewhat easy and up to 51.1 % (p value < 0.0001) and 80.5 % (all consecutive post hoc comparisons: p value < 0.0001) for participants who found it easy or very easy to understand the statements.
In addition to the ease of understanding, participants' confidence in their ability to recognize the condition in the field was also a significant predictor for how useful they find a statement (Fig. 3b). Our estimated marginal means with the same settings as for the previous calculations for participants who find the statement easy to understand show that participants who were not at all confident in their ability to recognize a specific condition in the field only had a 7.4 % chance of finding the statement very useful or extremely useful, while participants who were somewhat confident had a 29.5 % chance of the same responses (post hoc pairwise comparison: p value < 0.0001). This effect continues for higher confidence levels, with the percentage chance of finding the statements very useful or extremely useful rising to 51.1 % (p value < 0.0001) for participants expressing that they were fairly confident at recognizing a condition in the field, 59.2 % (p value = 0.0073) for those very confident, and 69.8 % (p value = 0.0036) for those extremely confident. The presented effects of the level of understanding and the recognition confidence on the perceived usefulness of the TTA statement were very similar and highly significant in both the jargon and explanation models. The factors influencing participants' level of understanding of the TTA statement and their confidence in recognizing the stated condition in the field are discussed in detail in Sect. 3.4 and 3.5, respectively.
Another factor that led to higher reported usefulness of the statements in both models was the amount of attention participants pay to the travel advice in general (Table B2). As the attention increases, the chance a statement will be considered useful also increases.
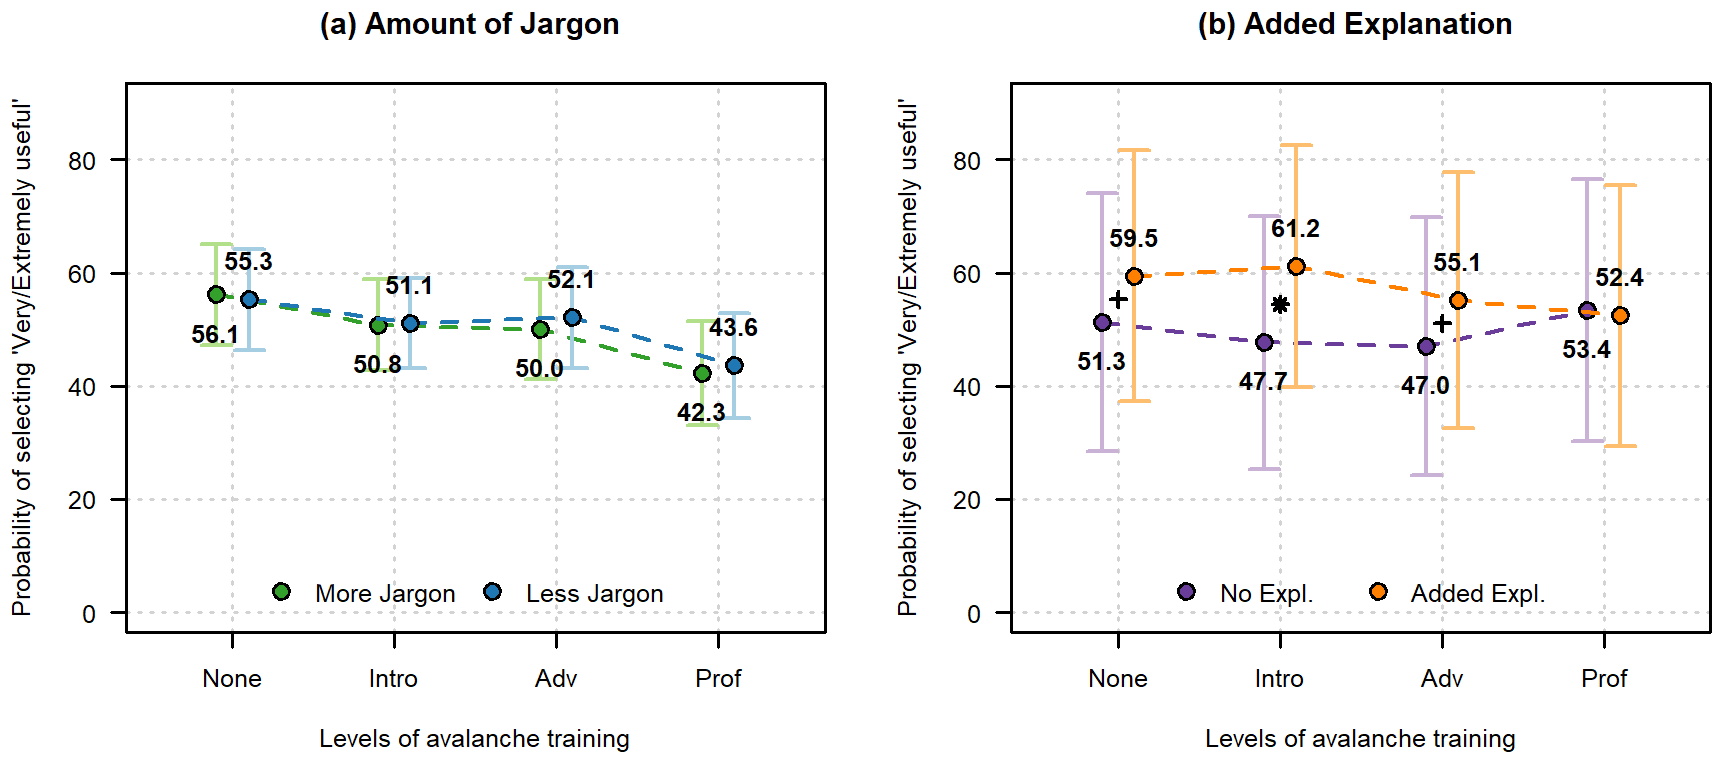
Figure 4Estimated marginal probabilities for selecting very useful or extremely useful for usability of the statement as a function of (a) the interaction effect of avalanche training and amount of jargon and (b) the interaction effect of avalanche training and added explanation. Error bars represent 95 % confidence intervals for probabilities calculated from the subsample for the particular parameter level. Significant post hoc pairwise comparisons are indicated with asterisks (p values < 0.01), diagonal crosses (0.01 ≤ p values < 0.05), or horizontal crosses (0.05 ≤ p values < 0.1). Variable levels for calculations of estimated marginal probabilities: attention to TTA statements – considerable, level of understanding – easy, and confidence in recognition – fairly confident.
In contrast to these similarities, how participants' usefulness ratings are influenced by participants' avalanche awareness education and the TTA statement treatment differs substantially between the two models. In the jargon model, avalanche awareness training emerged as a significant main effect with participants with professional-level training finding the TTA statements significantly less useful (Table B2 and Fig. 4a). Somewhat surprisingly, there was no significant direct impact of the level of jargon on the participants' usefulness ratings, which is illustrated by the almost perfectly overlapping lines in Fig. 4a. In the explanation model, on the other hand, avalanche awareness training did not have a direct effect on participants' usefulness ratings, but we found an interesting main and interaction effect for the added explanation (Fig. 4b). Our calculations of estimated marginal probabilities for participants who pay considerable attention to the TTA statements, find them easy to understand, and have fairly high confidence in their ability to recognize the conditions in the field show that the added explanation significantly increases the change in participants with introductory avalanche awareness training to rate the statement as very or extremely useful (46.7 % versus 58.6 %; post hoc comparison: p value < 0.0001). While the observed increases for participants with no and advanced avalanche awareness training were also substantial (approx. 7 percentage point increase), they were statistically only marginally significant with their p values being close to the 5 % threshold (0.0720 and 0.0613, respectively). The added explanation did not make a difference in the usefulness ratings of participants with professional-level avalanche awareness training (p value = 0.8508).
In both models, there was greater unexplained variance associated with individual participants than with the statements used. This indicates that which specific statements participants saw did have a smaller impact on their responses compared to the variations in the nature of participation not accounted for in the model. This gives us confidence that the specific selection of statements used did not unduly impact our results. Additionally, statement type, which describes the nature of the TTA statement (“action”, “attitude”, and “fact”; see Appendix A), did not emerge as a significant predictor for the statements' usefulness ratings. This means that participants did not find any of the three types fundamentally more or less useful. Hence, the statement type parameter was removed from the model during the development of the model.
3.4 Understanding of key phrase
Participants provided a total of 7819 understanding ratings, and overall, they found the key phrases highlighted within the travel and terrain statements easy to understand, with 70.5 % of the ratings at easy to very easy to understand (scale: very difficult, difficult, somewhat difficult, somewhat easy, easy, and very easy). As explained in Sect. 2.3, the levels of very difficult and difficult were combined due to a very low number of times very difficult was selected. Overall, only 3.4 % of the rating selected the lowest two levels.
We built two ordinal mixed-effect regression models with participant ID, statement ID, and statement version ID as random effects to explore how participants understand key phrases in TTA statements, with one model examining on how jargon affects understanding and the other one studying the effect of added explanations. The sample size for the jargon model was 5529 ratings (70.7 % of dataset), and the explanation dataset consisted of 2290 ratings (29.3 %). Similar to the dataset used for the usability analysis presented in Sect. 3.3, the understandability ratings differed significantly between the two datasets. In the jargon dataset, 72.5 % of the ratings were easy or very easy, whereas the same ratings were only chosen 65.6 % in the explanation dataset (Kruskal–Wallis rank sum test: p value < 0.001).
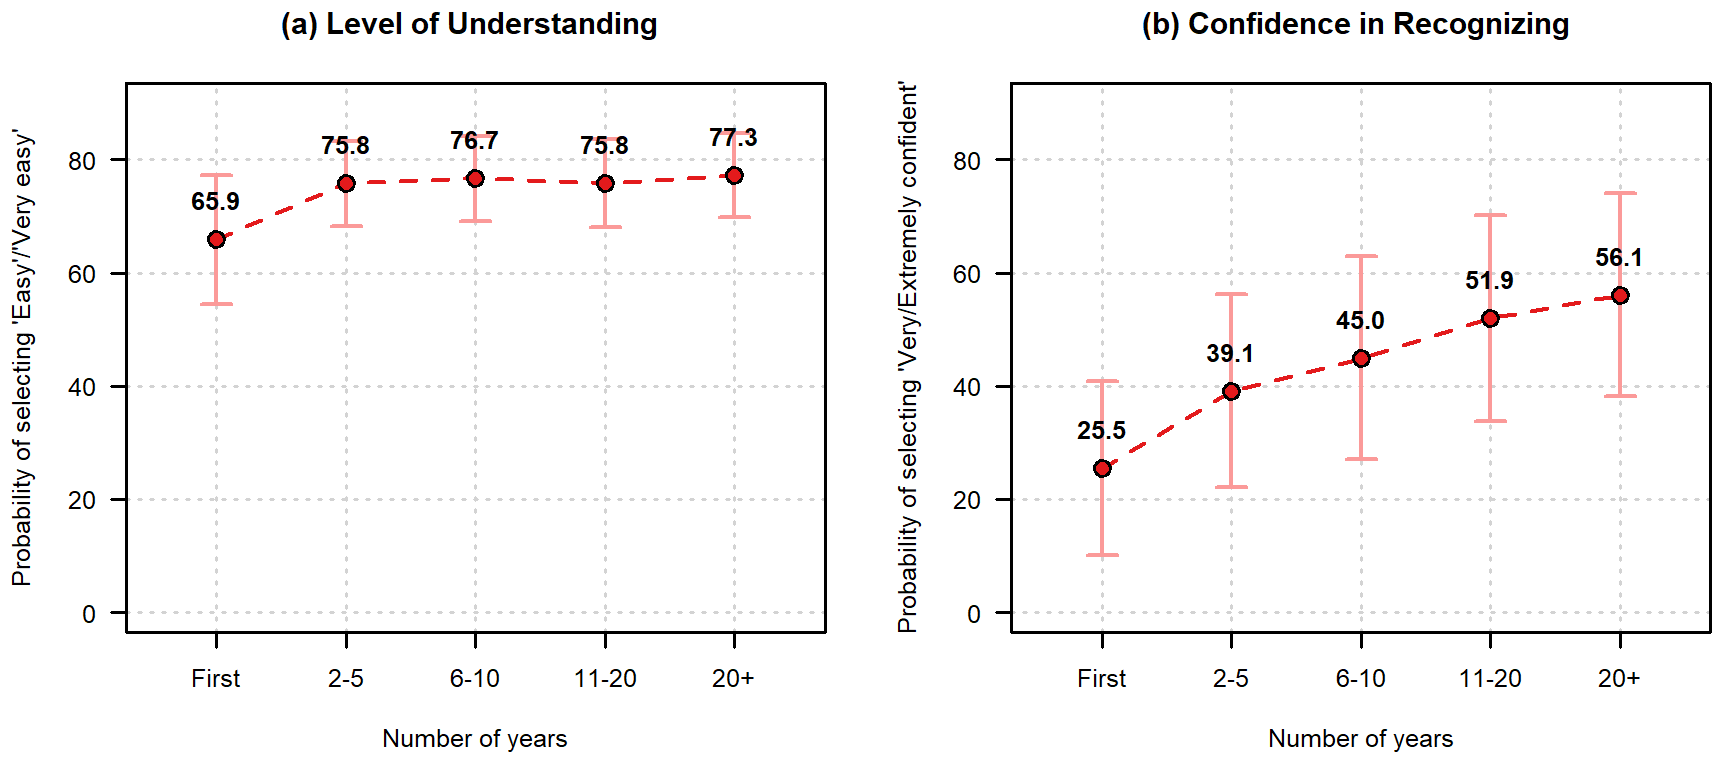
Figure 5Estimated marginal probabilities for selecting easy or very easy for understandability of the statement (a) and selecting very or extremely for confidence in recognizing the key phrase in the field (b) as a function of years of backcountry experience in the jargon model. Error bars represent 95 % confidence intervals for probabilities calculated from the subsample for the particular parameter level. Variable levels for calculations of estimated marginal probabilities: attention to TTA statements – considerable, days spent in the backcountry each winter – 1–20 d, avalanche awareness training – introductory, bulletin user type – type D, and statement treatment – less jargon.
Our final model for the analysis of jargon included six predictors (statement treatment, bulletin user type, level of avalanche training, reported level of attention to avalanche bulletin, years of experience in the winter backcountry, and the number of days spent in the backcountry each winter) as main effects and the interaction between the level of training and the statement treatment (Table B3). We used the same predictor variables for examining the effect of the added explanation to make sure that the results are comparable. Readers interested in more details are invited to examine the precise model specifications in the accompanying R code published in Haegeli et al. (2022). Just like for the usefulness models, our posterior predictive checks and generalized variance inflation factors did not raise any concerns with the models.
Similar to the results presented in the previous section, the two models examining the level of understanding of key phrases revealed similar patterns with the results of the jargon model generally being more significant due to the larger sample size (Table B3). The significant predictors that emerged from the analysis are a combination of participant and statement characteristics. Significant participant characteristics included bulletin user type, avalanche awareness training (jargon model only), number of years of experience, average number of days spent in the backcountry each winter, and how much attention they pay to the TTA statements. The overall strongest predictor was participants' self-identified bulletin user type, and participants with more advanced bulletin use practices tended to find the key phrases easier to understand. In the jargon model, for example, the estimated marginal probabilities calculated for participants with introductory avalanche awareness training and 6–10 years of backcountry experience, who spend 11–20 d in the backcountry each winter and pay considerable attention to the TTA statements, nicely illustrate the trend. With these variable settings, the calculated chance of rating the understandability of the key phrase in TTA statements with less jargon as either easy or very easy was 61.7 % of participants of user type B, 69.2 % of user type C, 76.7 % of user type D, and 81.6 % of user type E. While the difference between user types B and C was not statistically significant (post hoc pairwise comparison: p value = 0.1682), the subsequent consecutive pairwise comparisons were (C versus D: p value = 0.0028; D versus E: p value = 0.0028). This general increase was also detected in the explanation model, but there were stronger similarities between types B and C and types D and E, and the only significant consecutive pairwise comparison was between bulletin user types C and D (p value = 0.0027).
Similarly, the chance of rating the understandability of the key phrase as easy or very easy generally increased with more years of experience and more days in the backcountry per winter. An interesting pattern emerged in the relationship between years of experience and the understandability rating in the jargon model (Fig. 5a). Using the same settings for estimating marginal probabilities as above with the bulletin user type set to type D, our analysis revealed that participants in their first year in the backcountry were significantly less likely to find the statements at least easy to understand than participants with 2–5 years of experience (65.9 % versus 75.8 %, p value = 0.0416). The other cohorts for backcountry experience responded similarly to the 2–5 years group, and there were no significant differences between them. The number of days participants spend in the backcountry each winter was also included as a predictor, and the likelihood participants found the phrase at least easy to understand increased significantly with more time spent in the backcountry.
Finally, how much attention participants generally pay to the TTA statements also had a positive effect on participants' understandability ratings. Participants who pay higher amounts of attention to the TTA tended to find the statements easier to understand. While correlations naturally exist between some of these participant characteristics (e.g., a participation with more years of experience might also use the bulletin in a more sophisticated way), our examination of the generalized variance inflation factors indicated that there are no issues in our parameter estimations.
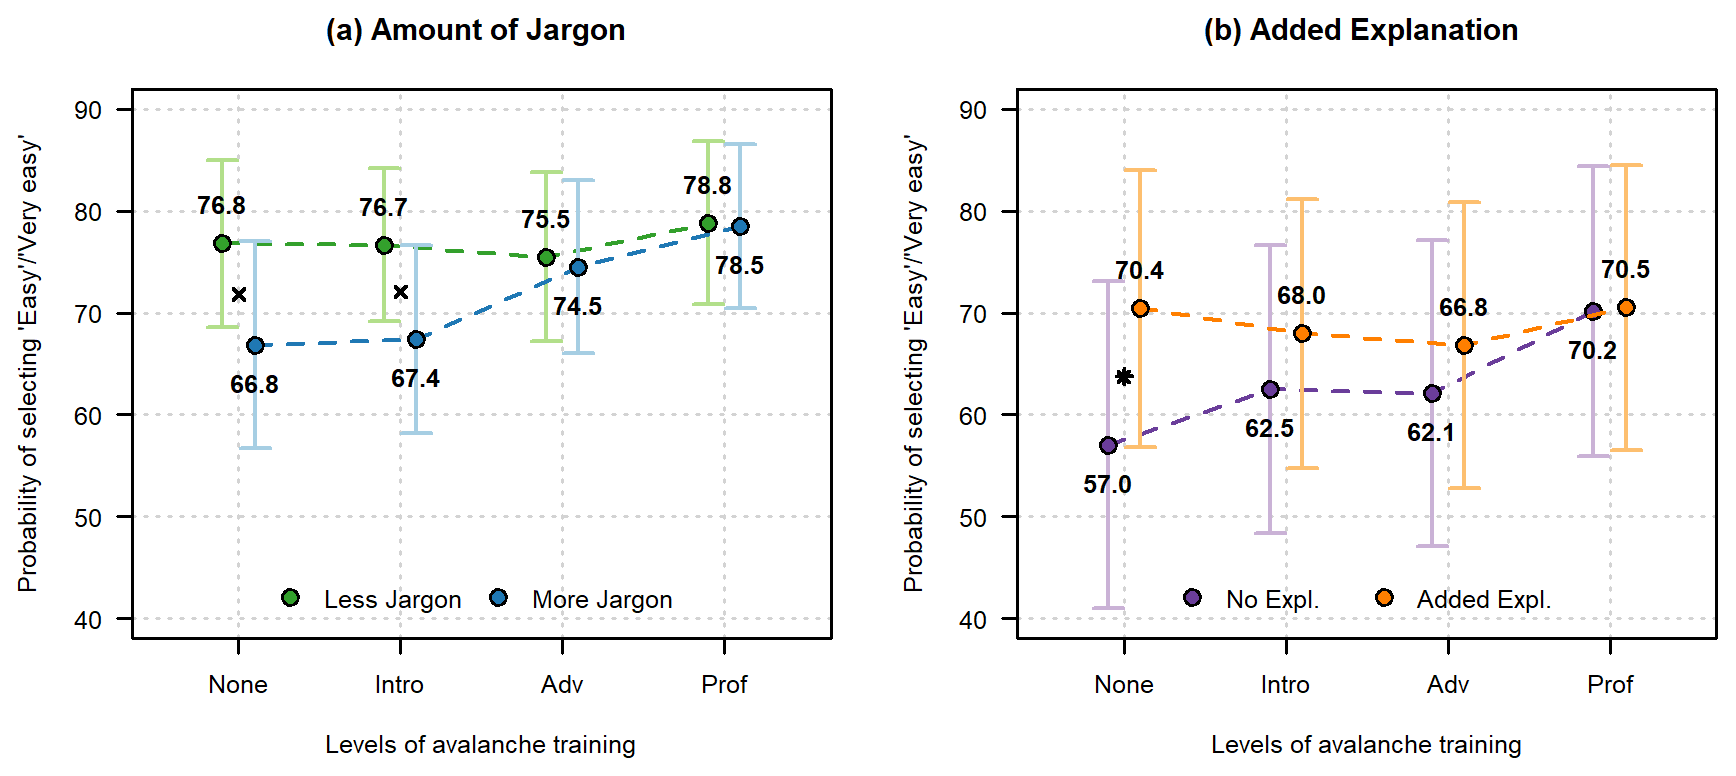
Figure 6Estimated marginal probabilities for selecting easy or very easy for understandability of the statement as a function of (a) the interaction effect of avalanche training and amount of jargon and (b) the interaction effect of avalanche training and added explanation. Error bars represent 95 % confidence intervals for probabilities calculated from the subsample for the particular parameter level. Significant post hoc pairwise comparisons are indicated with asterisks (p values < 0.01), diagonal crosses (0.01 ≤ p values < 0.05), or horizontal crosses (0.05 ≤ p values < 0.1). Variable levels for calculations of estimated marginal probabilities: bulletin user type – type D, avalanche awareness training – introductory, years of experience – 6–10 years, average days in backcountry per winter – 11–20 d, and attention to travel advice – considerable.
The level of jargon had a significant main effect on how participants rated their understanding of the highlighted phrases shown in the TTA statements (p value: 0.0224; Table B2). However, this effect was modulated by the interaction effect with the level of avalanche training a participant had completed (Fig. 6a). Professionals and recreationists with advanced-level training were overall the most likely to say they find the key phrases easy or very easy to understand, and the estimated marginal probabilities2 did not differ significantly between the version with less jargon or the version with more (advanced: 75.5 % versus 74.5 %, p value = 0.8070; professional: 78.8 % versus 78.5 %, p value = 0.9402). However, among participants with no training or introductory recreational training, it was significantly more likely that they would find the statements easy to understand if presented with a version that had less jargon (no training: 76.8 % versus 21.5 %, p value = 0.0246; introductory training: 76.7 % versus 67.4 %, p value = 0.0166). Crucially, the post hoc pairwise comparisons show that with the statement versions with less jargon do not show any significant difference in the ease-of-understanding ratings across the different training levels. In other words, all training levels reported the same ease of understanding for the less jargon-filled statements.
The explanation model revealed that the added explanation had a similar effect on participants' level-of-understanding rating as the reduced jargon (Fig. 6b). The combination of the significant main effects for avalanche awareness training and statement treatment together with their marginally significant interaction effect (Table B3) produced a response pattern where the understandability of statements without the additional explanation increased with avalanche awareness training, and the benefit of the added explanation was biggest for participants without any training (Fig. 5b: 70.4 % versus 57.0 %, p value = 0.0090). Note that the error bars for the explanation model are much larger because of the smaller sample size, but they are not directly indicative for the post hoc comparisons.
As indicated by the random effects in Tables B3, we observed greater unexplained variance with individual participants than with the statements used for the jargon variations. This indicates that which specific statements participants saw had a smaller impact on their responses than variations in the characteristics of participants that the model did not account for. This gives us confidence that the specific selection of statements used did not unduly impact our results. In contrast, the variance of the statements with the explanation types was close to the level of variation for individual participants. Similar to the usefulness models, statement type did not emerge as a significant predictor of participants' level-of-understanding ratings and was therefore removed from the analysis during the development of the models.
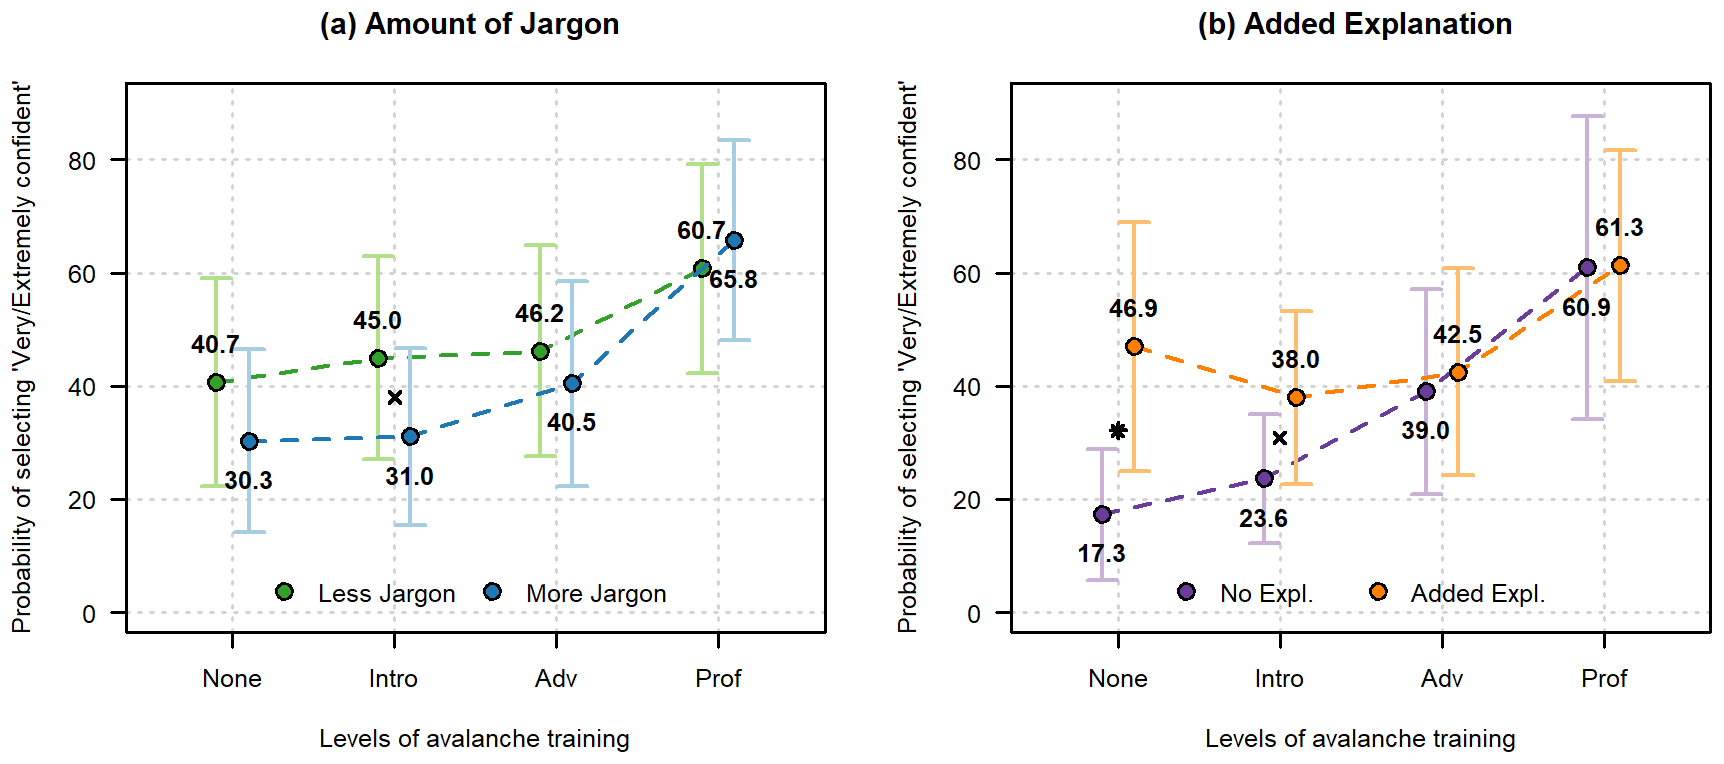
Figure 7Estimated marginal probabilities for selecting very confident or extremely confident for recognizing condition in the field as a function of (a) the interaction effect of avalanche training and amount of jargon and (b) the interaction effect of avalanche training and added explanation. Error bars represent 95 % confidence intervals for probabilities calculated from the subsample for the particular parameter level. Significant post hoc pairwise comparisons are indicated with asterisks (p values < 0.01), diagonal crosses (0.01 ≤ p values < 0.05), or horizontal crosses (0.05 ≤ p values < 0.1). Variable levels for calculations of estimated marginal probabilities: bulletin user type – type D, avalanche awareness training – introductory, years of experience – 6–10 years, and average days in backcountry per winter – 11–20 d.
3.5 Recognition confidence of key features in the field
Out of the 18 pairs of statements included in the analysis, 7 referenced a specific terrain feature or snow condition, resulting in 3336 ratings of confidence recognizing a condition in the field. Hence, this dataset is less than half the size of the dataset of the previous analysis. Approximately one-third (33.8 %) of participants who saw statements in this category reported that they would be fairly confident recognizing them in the field, and another third (33.8 %) indicated that they would be very confident recognizing them in the field (scale: not at all confident, somewhat confident, fairly confident, very confident, and extremely confident). Only 3.3 % of the ratings were not at all confident.
Similar to our approach in the other analyses, we built separate ordinal regression models to examine what factors contribute to the confidence ratings for the jargon and explanation samples separately. For the jargon sample, which consisted of 2921 ratings for 6 pairs of statements (Table A1), we used an ordinal mixed regression model with the participant ID, statement ID, and version code as random effects. Our final jargon model included five predictors (bulletin user type, avalanche training, statement type, years of experience in the winter backcountry, and typical days per winter spent in the backcountry) as main effects and one interaction effect between statement type and avalanche training (Table B4). We subsequently built the model for the explanation sample (415 ratings) using the same predictor variables to ensure comparability of the results. However, since only one of our TTA statements with the explanation treatment included the recognition question (Table A1; statement no.8: “Watch for areas of hard wind slab on alpine features.” versus “Watch for areas of hard wind slab on alpine features. A good indicator is when travel suddenly gets easier because you do not sink in as much.”), we did not need a mixed-effect model and only estimated a standard ordinal regression model for this part of the analysis. Despite the much smaller sample size, all the included main and interaction effects emerged as significant (Table B4). However, it is important to note that the results of the explanation model lack generalizability because they only represent participants' perspective on a single statement. For the interested reader, the precise model specifications and R code for this analysis are also available in Haegeli et al. (2022).
As in the jargon model for understanding, participants' confidence ratings for identifying a particular feature in the field were partially driven by the level of jargon in a statement, participants' avalanche awareness training levels, and the interaction between these two variables (Table B4). The resulting response pattern is nicely illustrated by the estimated marginal probabilities3 for selecting very confident or extremely confident shown in Fig. 7a. Overall, we see a strong increase in confidence with higher levels of training, but this effect is modulated by the amount of jargon. The effect is most pronounced for participants with introductory-level training, who only had a 31.0 % chance of being very confident or extremely confident if they saw a statement with higher levels of jargon, but it rose to 45.0 % when they saw the version of the statement with lower levels of jargon (p value = 0.0157). While the improvements for participants with no training was still substantial (30.3 % versus 40.7 %), it was not large enough to be statistically significant (p value = 0.1125). The improvements further diminished for participants with advanced- and professional-level training (p values = 0.3933 and 0.469, respectively).
The explanation model revealed a similar pattern (Fig. 7b) with the additional explanation significantly increasing the confidence of participants with no avalanche awareness training (46.9 % versus 17.3 %, p value = 0.0020) and introductory-level training (38.0 % versus 23.6 %, p value = 0.0183). This is understandable, since the explanation that was added to the statement provided a tip for how to recognize wind slabs. The confidence ratings of participants with higher levels of training were not affected by the added explanation. Even though the orange curve for the confidence ratings with the added explanation has a distinct U shape, it is important to recognize the values do not differ significantly from each other. This is different from the jargon model (Fig. 7a), where participants with professional-level training rate their confidence significantly higher than other participants regardless of the level of jargon (p values < 0.0001 and 0.0066, respectively).
The jargon model further revealed that users with more advanced bulletin user types were more confident in their ability to recognize the conditions of the statements in the field. Participants of user type D were significantly less likely to select very confident or extremely confident than those of user type E (45.0 % versus 54.9 %, p value = 0.0001) but significantly higher than those of user type C (31.2 %, p value < 0.0001). Type C participants did not differ significantly from type B participants (24.9 %, p value = 0.3184).
Another predictor affecting participants' confidence level was their years of winter backcountry experience. Overall, participants with more years of experience were more likely to express that they were at least very confident (Fig. 5b). Participants in their first year were the least likely to report that they were at least very confident (25.5 %), and the estimated mean probabilities continuously increase to 56.1 % for participants with more than 20 years of winter backcountry experience. While this is the expected pattern, it is interesting to compare it to the effect experience has on participants' level-of-understanding ratings (Fig. 5a). Even though the two rating scales are not directly comparable, it is interesting that the level-of-understanding ratings are overall at a higher level and level out more quickly than the confidence ratings that continue to increase with more years of experience. This difference in patterns was further highlighted when the respective models were estimated with years of experience included as polynomials instead of being dummy-coded, as well as the effect of the quadratic term being larger in the understandability model (not shown here; see Haegeli et al., 2022, for details).
A final predictor that increased the likelihood of participants being confident in their ability to recognize a highlighted condition in the field was how many days they spend in the backcountry each winter (Table B4). As expected, more days tended to increase the likelihood that participants would have confidence in recognizing the condition. Not overly surprising, attention to TTA statements in general did not emerge as a significant predictor of confidence in recognizing a condition in the field.
Overall, the patterns in the parameter estimates of the standard ordinal regression model for the explanation treatment dataset were very similar to the jargon analysis, with the exception that the effect of the number of years of backcountry experience was more variable and did not exhibit the expected monotonous growth.
Similar to the models in the other jargon analyses, there was greater variance associated with individual participants than with the statements used, which means that the unaccounted variability among participants was bigger than the unaccounted variations among the TTA statements. As mentioned for the other models, this gives us confidence that the specific selection of statements used did not unduly impact our results. However, it is important to remember that the explanation model was based on a single statement. Furthermore, statement type did again not emerge as a significant predictor of participants' recognition confidence and was therefore removed during the development of the model.
In this study we examined who is paying attention to the travel and terrain advice (TTA) statements in the bulletin, how useful participants find the advice, and if modifications to the advice could make it more useful for participants. We will describe key factors driving the responses to these questions and provide recommendations for avalanche warning services to optimize their TTA in avalanche bulletins.
4.1 Who is paying attention to travel and terrain advice?
The TTA statements in an avalanche bulletin represents information that can help recreationists develop a risk management plan by guiding them towards appropriate terrain selection based on current avalanche hazard. Understanding who is using this section of the bulletin allows avalanche warning services to identify which users incorporate this advice as part of their risk management process.
Significant patterns in who pays attention to the TTA emerged based on participants' bulletin user type, training, experience in the backcountry, and country of residence. Participants self-identifying as bulletin user type D reported paying the most attention to the TTA statements included in the avalanche bulletin, followed by type E. User types B and C paid significantly less attention than types D and E, and too few participants of user type A responded to the survey to be included in the dataset. In the bulletin user typology, participants of bulletin user type D are characterized by their use of the information on the location and nature of specific avalanche problems as part of their risk management approach for determining their trip objectives (St. Clair, 2019; St. Clair et al., 2021). It is therefore not surprising that we see participants of user type D paying the greatest amount of attention to the TTA, which is the section of the bulletin explicitly targeted towards helping users develop a plan for how to travel through the terrain under the existing conditions. In contrast, participants of user type C make their travel decisions by “opening and closing” avalanche terrain at a larger scale (St. Clair, 2019), and so the drop in attention we observe in this group may be because they tend not to incorporate the specific terrain features described in the TTA into their risk management approach. The alignment of our results with predictions based of the bulletin user typology shows that the TTA statements are being incorporated as expected as part of the risk management plan of users who incorporate specific terrain features into their analysis. To support these users, the information contained in the TTA should continue to highlight relevant slope-scale terrain features.
Additionally, after controlling for the bulletin user type, we also see a relationship between the personal experiences of participants and the level of attention they pay to the TTA statements. Both higher levels of avalanche training and more years of experience in the backcountry lead to lower levels of attention to the TTA included in the bulletin. Participants with professional-level training are significantly less likely to pay attention to the TTA than participants with lower levels of training, and there is a decreasing linear trend between the years of experience a participant has and their attention to the TTA. This pattern is not surprising because more advanced users are more likely to already know the information conveyed in the TTA based on their understanding of the avalanche problem information. These relationships demonstrate that it is less trained and less experienced users who are using the TTA advice, which makes it important to ensure that the advice is targeted towards these groups and is useful to them.
Finally, participants residing in the United States indicated higher levels of attention to the TTA than Canadian residents. While the results of our study are unable to provide specific insight into the reasons for this difference, we hypothesize that it may be related to differences in avalanche bulletin format or outreach efforts. Many US-based avalanche bulletins integrate TTA statements as part of a prominent bottom-line section, whereas Canadian avalanche warning services have historically had the TTA advice in the avalanche problem section on a secondary tab of their bulletins. While Canadian bulletins have recently moved the TTA advice to the front page of the bulletin, it is possible that user habits have not caught up with the change. It is also possible that differences in presentation of the TTA statements, such as including explanatory photos in US-based bulletins, may lead to higher use by US residents. Further study is necessary to properly identify reasons for the difference between user attention to the TTA advice between participants located in Canada versus the United States.
Our results demonstrate that users who are integrating terrain into their daily planning but have lower levels of training or experience to support that integration are the current users of the TTA statements in bulletins. Hence, avalanche warning services should target the messaging of the TTA to the needs of these groups. Our findings suggest that the TTA is underused by participants who do not integrate terrain as part of their bulletin use, as well as participants who take advanced risk management approaches. Avalanche warning services can use this information to determine if additional products or information could be developed to better fit the needs of these user groups. In addition, the observed differences between Canadian and US participants should prompt additional communication between US and Canadian avalanche warning services to identify successful strategies for reaching more users in Canada.
4.2 What determines the usefulness of a travel and terrain advice statement?
With a better understanding of who is using the TTA statements, we turned towards investigating what makes TTA statements useful for users. In this section, we describe the factors that predict the usefulness of the TTA statements and how we interpret these factors.
4.2.1 Understanding and recognition confidence drive usefulness
Participants' level of understanding and their confidence in recognition of the TTA statements both had a strong influence on how useful participants found the TTA statements. Higher levels of understanding and recognition confidence both led to higher usefulness ratings, and the range of the parameter estimates shows that participants' understanding of the advice is the more dominant of the two in determining the usefulness of the statements.
Our additional regression analyses allowed us to further investigate what contributes to these two main factors determining the usefulness of TTA statements. The regression models for how well participants understood the statements indicated that increases in the bulletin user type, level of training, years of experience, days spent recreating in the backcountry, and how much attention they pay to the TTA all increased the chances that participants would find the statements easier to understand. These same factors predicted how participants rated their recognition confidence, with the exception of how much attention they pay to the TTA. The increase in both understanding and recognition confidence with additional training, experience, and a more sophisticated approach to the risk management is expected, as these are skills that develop over time and are taught as part of formal avalanche safety training courses. The absence of the attention to travel advice as a predictor for recognition confidence is also not surprising, as recognizing field conditions is not a bulletin-based skill and needs to be developed through other channels.
Within these overall trends, there are some interesting differences in the predictors that appeared in the models for both understanding and recognition confidence. The ratings of understanding increased quickly for participants with more than 1 year of experience but levelled off with no further differences between users with additional experience. In contrast, recognition confidence increased more gradually after the first year, and confidence continued to increase with additional years of experience. This suggests that confidence in recognizing conditions in the field develops more slowly than understanding. Recognizing specific terrain features or hazardous conditions is more difficult than simply understanding the phrases in the bulletin. This finding echoes the gap between comprehension and application of avalanche safety information among recreationists identified by Finn (2020). Most importantly, it highlights a need for continued opportunities for improvements in the application of the information provided in the bulletin, both during trip planning at home and in the field. Future research into strategies to develop better terrain feature recognition, such as the inclusion of visual aids along with the TTA, should be considered to help users build their confidence in recognizing field conditions mentioned in the TTA.
The strong influence of understanding and recognition confidence on overall usefulness of the statements is important because it means that variations in these factors will also indirectly influence how useful the TTA statements are. By understanding what drives these additional variables, we are able to see more clearly how participants relate to the TTA statements. Our analyses show that users with less training and less experience are more likely to struggle with both understanding TTA statements and recognizing the specific conditions mentioned in these statements. This should highlight to avalanche warning services and the avalanche safety community in general that more effort in education and skill building is needed for these groups of users.
4.2.2 Strong links between attention, usefulness, and understanding
In addition to the ease of understanding and confidence in recognition, the amount of attention participants pay to the TTA statements was a significant predictor of how useful they find the statements, as well as how well they understand them. One possible way to interpret this result is that the amount of attention participants pay to the TTA represents their bulletin use practice similar to the avalanche bulletin user types described by St. Clair (2019). Bulletin users who pay more attention to the TTA statements might become more familiar with the terminology and messages over time and therefore find them more useful. This interpretation of the attention to the TTA may also explain why bulletin user type did not emerge as a predictor in the usefulness model. Furthermore, it is consistent with the absence of this predictor in the recognition confidence model, since recognizing a condition is a field-based skill and less tightly related to bulletin use practices.
Even though this interpretation seems intuitive, it is important to remember that regression analyses can only highlight association and not determine causation, and a reasonable alternative interpretation of the observed relationship could be that bulletin users pay more attention to the TTA statements because they find the statements more useful. However, since our survey presented each participant with a different subset of TTA statements, the structure of our dataset does not allow us to integrate participants' statement-specific usefulness and understanding ratings into the regression analysis for how much attention people pay to the TTA. Despite this limitation, our analysis highlights that the relationships between attention and usefulness, attention and understanding, and understanding and usefulness are strong and work together to drive user engagement with the TTA.
4.2.3 The opposing effects of avalanche training
While higher levels of avalanche training indirectly affect the usefulness of the TTA positively by leading to increased understanding and recognition confidence, the direct effect of training on the usefulness ratings turns out to be in the opposite direction. This means that at equal levels of understanding and recognition confidence, participants with higher levels of training perceive the TTA statements to be less useful, while participants with lower levels of training find the statements to be more useful. We interpret this result to indicate that while avalanche awareness training does increase one's understanding of the TTA statement and confidence to recognize the described conditions in the field, participants with professional training may have the necessary avalanche risk management knowledge and skill to link avalanche hazard and terrain exposure without the explicit assistance provided by the TTA in the avalanche bulletin. This interpretation is consistent with the observation that the amount of attention to the TTA included in the bulletin decreases with increasing levels of avalanche awareness training. This highlights that the primary target audience for TTA statements is users with lower levels of training, and avalanche warning services should seek to make sure the statements are optimized for these types of bulletin users.
4.3 Can travel and terrain advice statements be made more accessible to users?
After controlling for all other factors, participants with the lowest levels of training not only found the TTA statements to be the most useful but also demonstrated the lowest levels of understanding of the advice and the least confidence in recognizing the conditions in the field. This suggests that there may be a potential gap that these participants could be falling into, relying on advice they do not completely understand. To close this gap, we tested two types of modifications to TTA statements to see if they could help to improve the understandability, recognition confidence, and overall usefulness of the statements.
4.3.1 Removal of jargon
Simply removing the jargon from the TTA statements was enough to increase understanding of the statements among participants with no or introductory-level training to the same level as participants with advanced- or professional-level training. Lowering jargon was also sufficient to boost the confidence in recognizing a condition in the field for participants with introductory-level training. As both understanding and recognition confidence are strong predictors of how useful participants find the TTA, it means that simply changing the phrasing of the statements will allow participants with low levels of training to make better use of the TTA without diminishing their clarity for users with more advanced training. This effect has been well documented in the science education and medical communities (e.g., Thomas et al., 2014; Bullock et al., 2019; Rau et al., 2020). Studies on both cardiac patients and parents undergoing pre-natal counselling have identified that terms commonly used by professionals are not widely understood by patients, despite having visited these professionals (Thomas et al., 2014; Rau et al., 2020). Furthermore, Bullock et al. (2019) demonstrated that jargon reduces the ability to process scientific information and even impacts willingness to consider alternative perspectives or adopt new technologies. These studies are important for the avalanche community because it is important that readers of the TTA be able to both process the information as well as be open to adjusting their terrain exposure based on information within the TTA.
Interestingly, the lower levels of jargon did not affect the usefulness of the TTA statements beyond the indirect effects captured within the models for understanding and recognition confidence. We interpret this to mean that jargon is hard for users to interpret, but once the wording has been changed, it does not further affect the usefulness of the message of the advice given in the statement.
In this study, the removal of jargon had no effect on professional- or advanced-level users in any of the models. However, other studies express nuances in how jargon is perceived among laypeople. Zimmerman and Jucks (2018) showed that increased jargon impacts professional credibility both positively and negatively depending on the target audience for the communication. Their study emphasized that it is important to match the level of jargon to the intended audience of communication efforts. In the case of the avalanche bulletin, this supports our finding that jargon should be reduced in the TTA statements used by less advanced recreationists. However, it also implies that some jargon can still be used to communicate more precisely in messages targeted towards more advanced users, such as the snowpack and avalanche activity sections of the bulletin.
4.3.2 Added explanation
In contrast to jargon, which only impacted usefulness via understanding and recognition confidence, adding additional explanations to the statements directly impacted how useful participants found the statements. Participants with introductory and advanced recreational training tended to find TTA statements with added explanations significantly more useful. The additional explanations provided information on context, how to identify the features, or the impacts of certain conditions (e.g., “Watch out for changes in the weather and snow conditions because they may increase avalanche hazard as the day progresses.”
This increase in usefulness with the added explanation has also been observed in hurricane evacuation messaging research. The experimental study of Morss et al. (2016) demonstrated that warning messages that explained the potential impacts of an approaching hurricane have a bigger impact on participants' intentions to evacuate than messages without that added explanation. Additional work has refined the importance of these types of additions to forecasts by making the distinction between fear-based and impact-based messages (Morss et al., 2018). In a study of individuals affected by Hurricane Sandy, four warning messages were trialled to determine how participants responded, including messages using non-personalized language to describe the impact of the storm and messages using personalized language to trigger a fear-based reaction. In that study, high-impact messages led to high evacuation intentions and higher risk perceptions than the fear-based message. Furthermore, the high-impact message was less likely to be perceived as overblown. From this, the authors concluded that adding impact messages that do not instil fear may have advantages. While our study did not investigate the role of fear-based messages, we suspect that the results of Morss et al. (2018) also apply to TTA statements. Given that backcountry recreationists voluntarily expose themselves to avalanche risk, including more information about the impacts of conditions in TTA statements is likely to be even more useful to participants than fear-based messaging, which may lead to warning fatigue and the loss of credibility.
Despite higher observed ratings among participants with no training or introductory training, added explanation did not significantly increase understanding or recognition confidence in participants. However, the effect was nearly significant, and a larger sample size may be sufficient to make the observed differences significant or allow for additional variables to emerge, particularly in the recognition confidence model where the sample size was reduced due to fewer questions.
4.4 Limitations
The participant sample in this study demonstrates trends consistent with previous surveys of backcountry recreation users. A high proportion of university-educated, male backcountry skiers between 25 and 34 years of age with basic avalanche education engage in online surveys about avalanche safety (Finn, 2020; Haegeli and Strong-Cvetich, 2020; Haegeli et al., 2012). The similarity in sample demographics may be drawn from the similar survey promotion techniques used between this study and Finn (2020). Although this study and Finn (2020) were able to reach a wider range of users than previous studies, it only captures the behaviour of the demographic that responds to an online survey and may underrepresent non-English speaking participants or other demographics. Additional outreach efforts to underrepresented communities and communities that do not currently engage with online avalanche safety products are necessary to capture their effects on the wider backcountry winter recreation community. Even though the survey was open to all winter backcountry recreationists, the majority of participants were backcountry skiers, and the TTA statements were designed primarily from the perspective of backcountry skiers. Future studies should test if tailoring the statements for different activity groups, such as snowmobilers, snowshoers, or ice climbers, leads to improved usefulness of the statements for these users.
Our study also relies on self-reported metrics of understanding, recognition confidence, and usefulness. We did not include knowledge-based questions to test participant understanding and did not include field studies to determine if participants' confidence in their ability to recognize conditions in the field is warranted or not. The goal of this study was to understand how participants relate to the information provided in the bulletin, so while these self-reported metrics have limitations, we believe that they are appropriate for the objectives of this study. Future research may seek to understand how participants perceptions and self-reported ratings relate to their performance in field conditions.
Our study included a limited set of potential TTA statements, and the fact that the recognition confidence analysis of the explanation treatment only included a single statement is a significant limitation of that particular aspect of our study. However, our objective was to identify principles of communication via the TTA statements rather than suggest specific wording to warning services. Further research is needed to identify if additional trends in how the TTA is phrased or if an alternate coding of statement type could lead to further insight into the usefulness of the TTA. We recommend that warning services work with members of the intended target audience to explicitly test the clarity and usefulness of their own specific TTA statements.
Selecting appropriate terrain while exposed to avalanche hazard is necessary to mitigate the risk of avalanches while travelling in the winter backcountry. While avalanche bulletins mainly focus on describing the hazard conditions, many of them also provide travel and terrain advice (TTA) statements to help recreationists put the hazard information into action and navigate the backcountry safely. For this information to be effective, avalanche warning services need to understand who is using the advice, if the advice is useful to participants, and if altering the phrasing of the advice could broaden the accessibility of the information for more users. In this study, we identified that the core audience of the TTA in avalanche bulletins is users with introductory-level avalanche awareness training who integrate slope-scale terrain considerations into their risk management decisions (i.e., bulletin user type D). Our results also highlight that simple statement modifications can considerably enhance the value of the TTA statements for the identified target audience. First, reducing jargon helps increase participants' level of understanding, which in turn makes the statements more useful for a broader audience. Second, adding additional information to the TTA statements that gives additional context or explanation to help clarify the statements makes the statements more meaningful. Taken together these findings indicate that the TTA statements are valuable for participants and that making small changes to the presentation of the TTA advice can further increase the usefulness for a wider group of users.
Avalanche warning services can implement these findings by creating communication guidelines for forecasters writing TTA statements that reduce jargon and include additional context for the statements. By improving communication of the TTA, avalanche warnings services can strengthen their role in helping recreationists understand not only avalanche hazard but also how to mitigate their exposure to the hazard.
This appendix includes all the pairs of travel and terrain advice statements used in the survey.
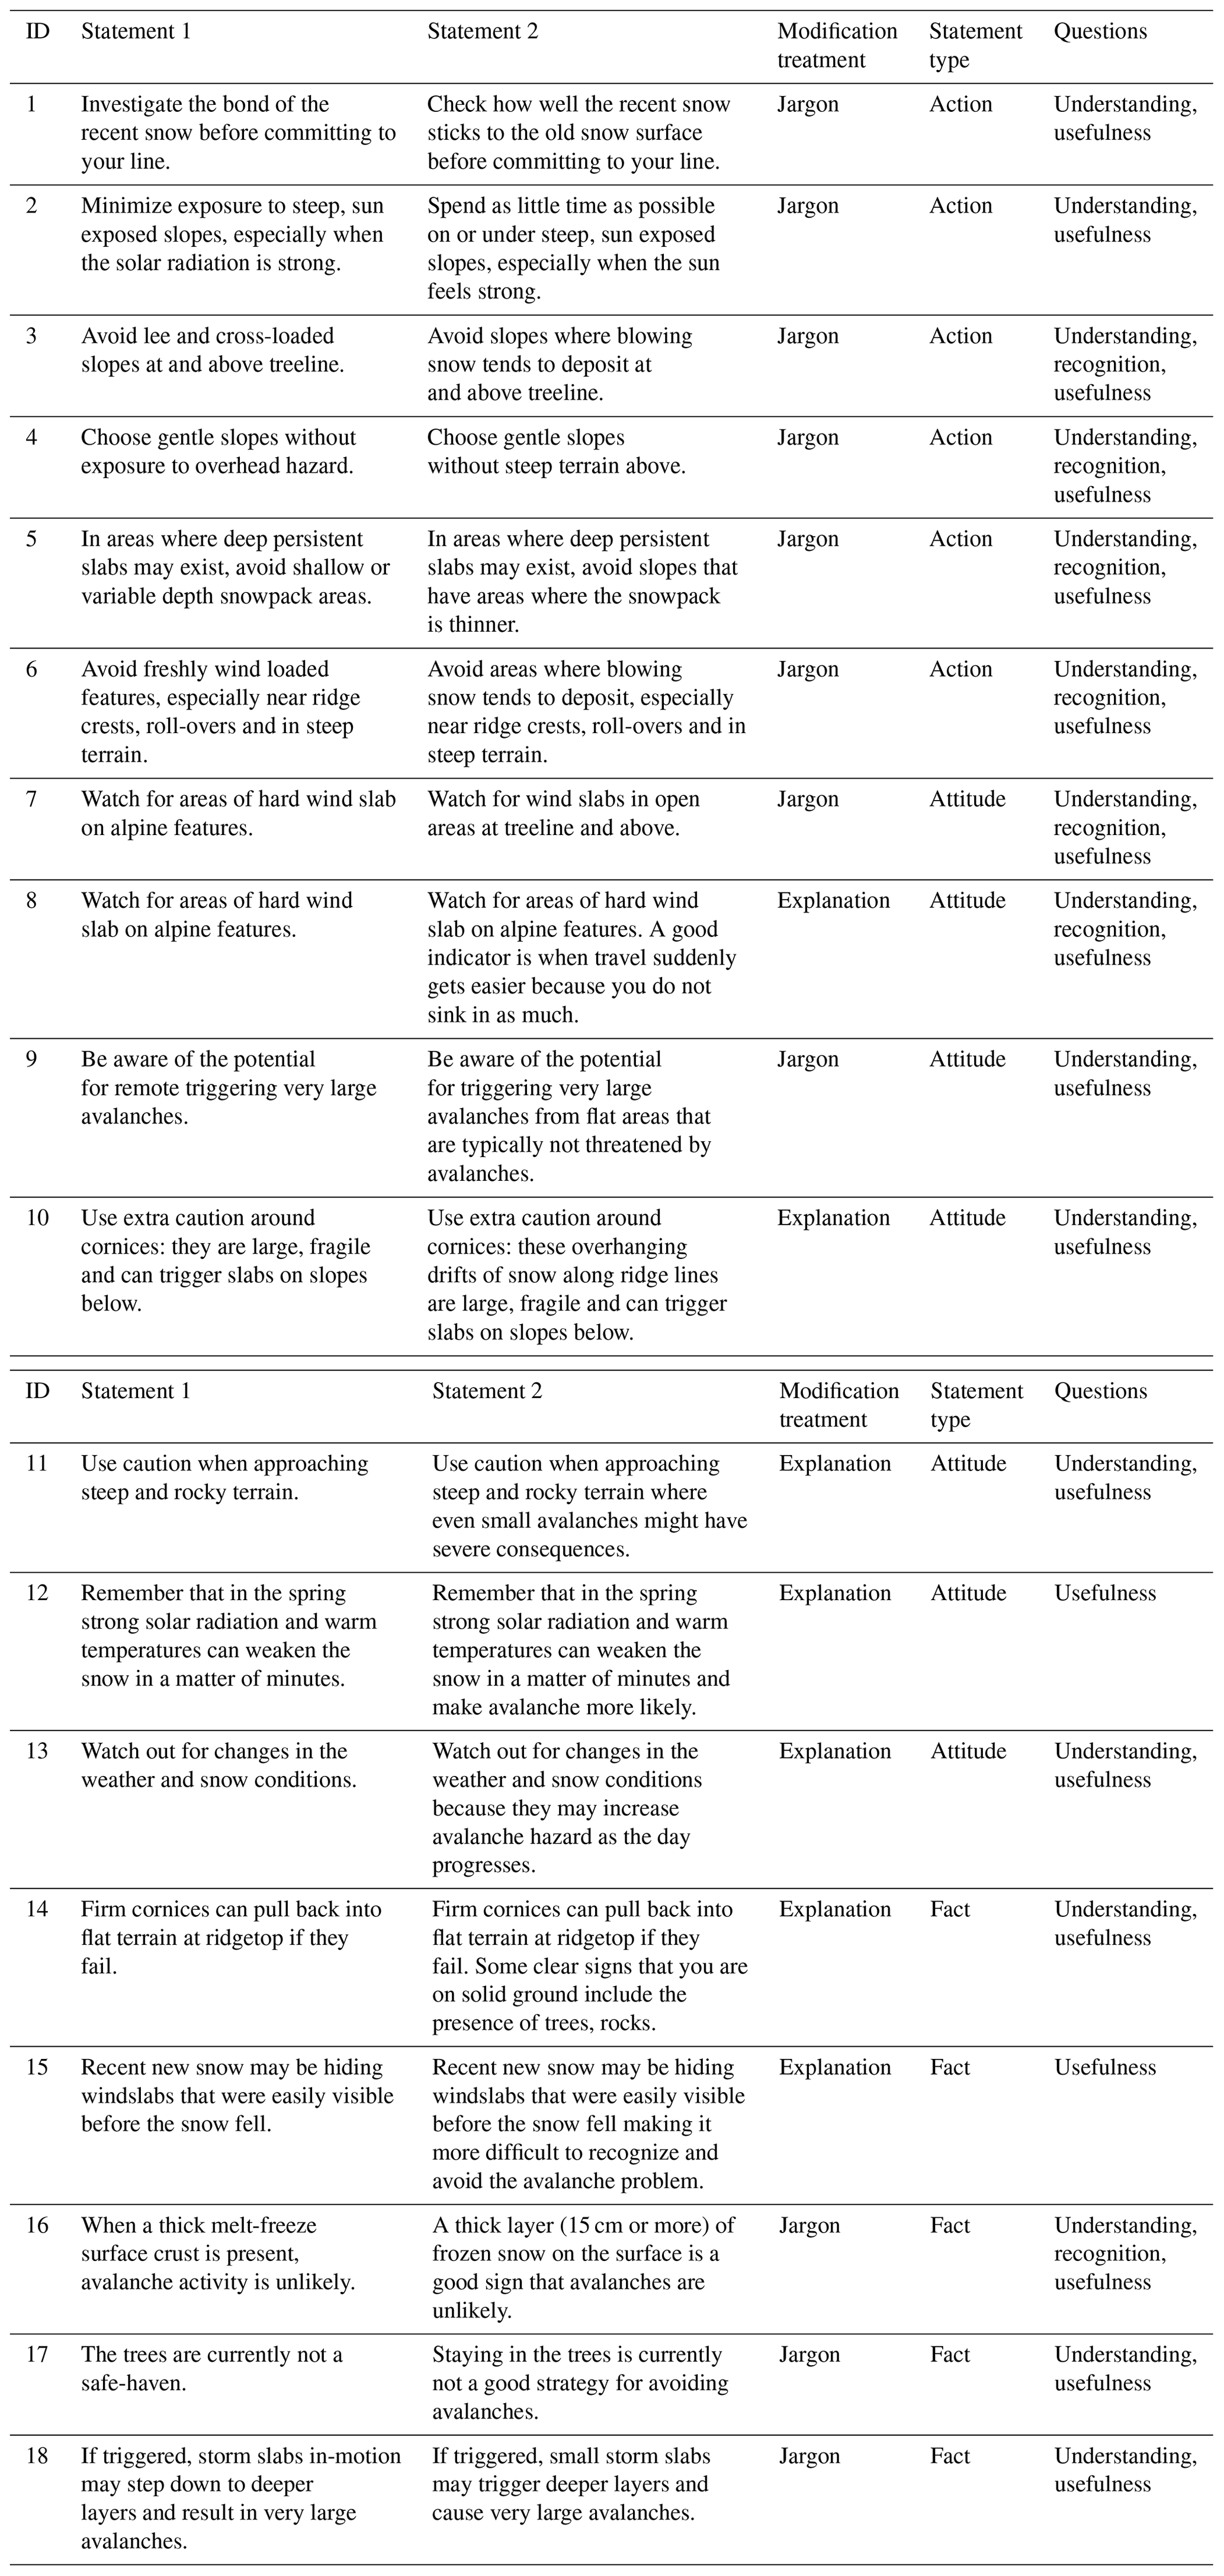
This appendix includes all parameter estimates and summary statistics for the models presented in this study.
Table B1Parameter estimates of regression model examining the attention paid to the TTA statements (number of obs.: 2998; observations). Bolded and italicized levels are used to calculate the estimated marginal probabilities for the post hoc tests.
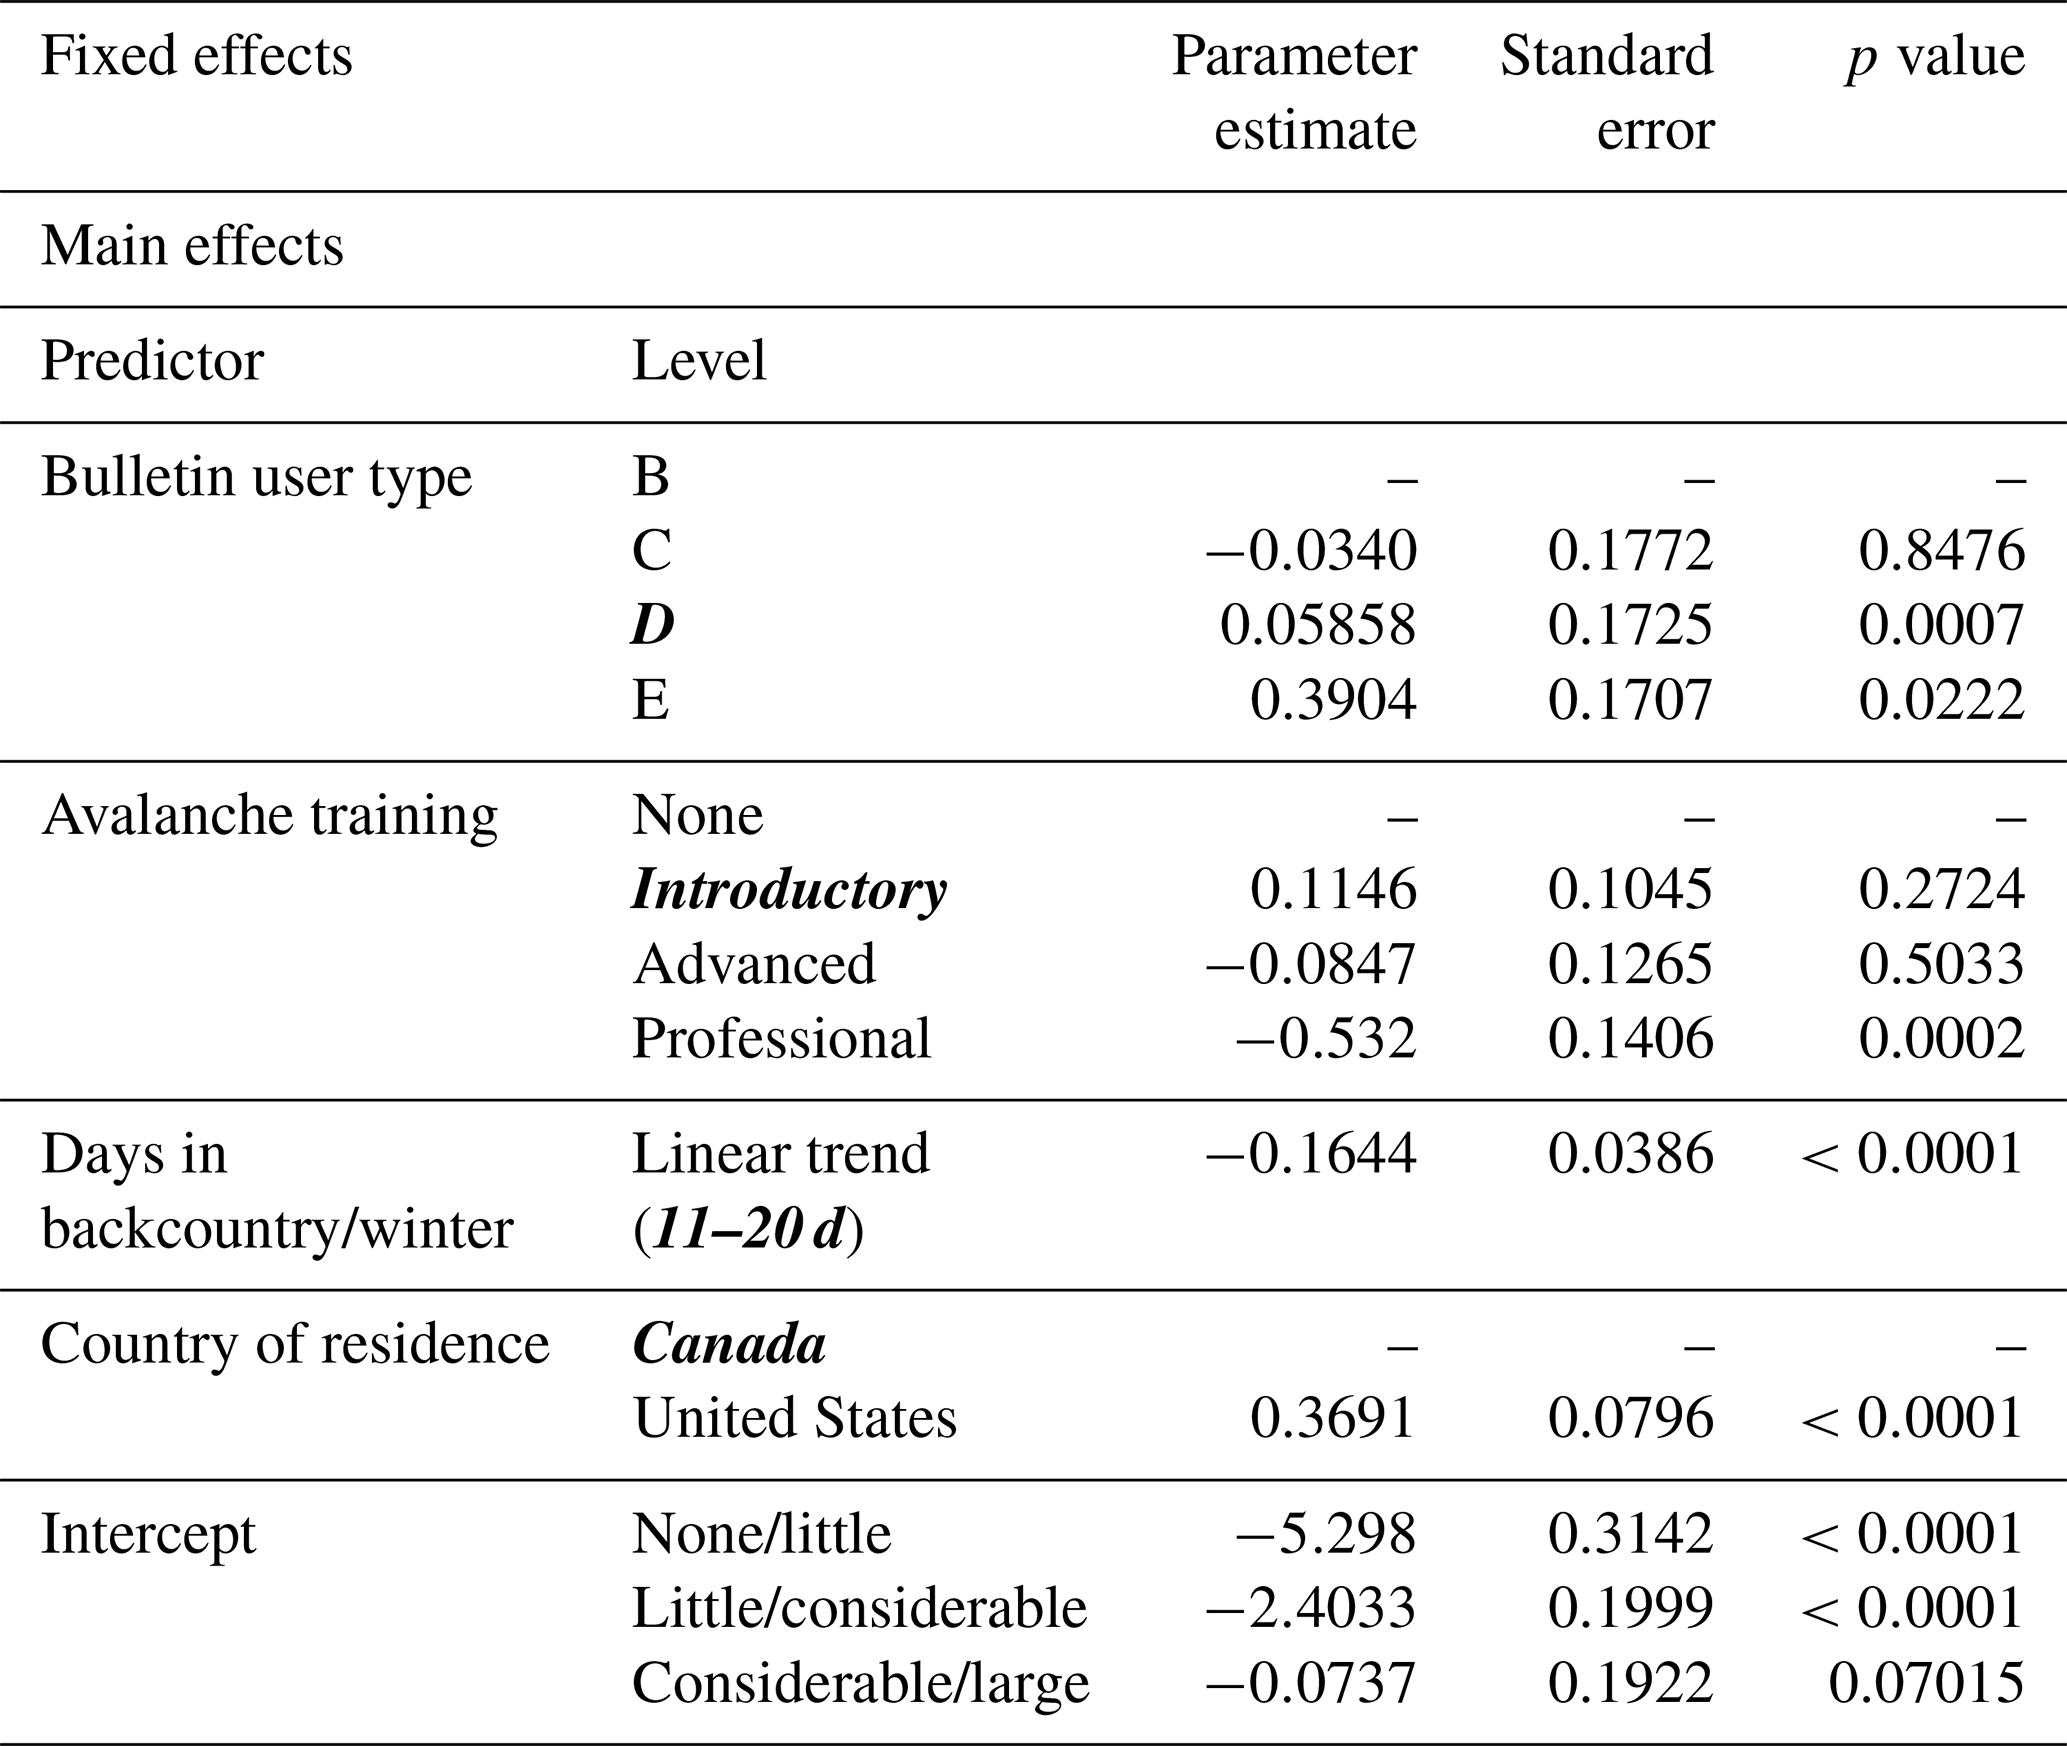
Table B2Parameter estimates of the jargon and explanation models examining participants' usefulness ratings for the TTA statements. Bolded and italicized levels are used for calculating the estimated marginal probabilities in the post hoc tests.
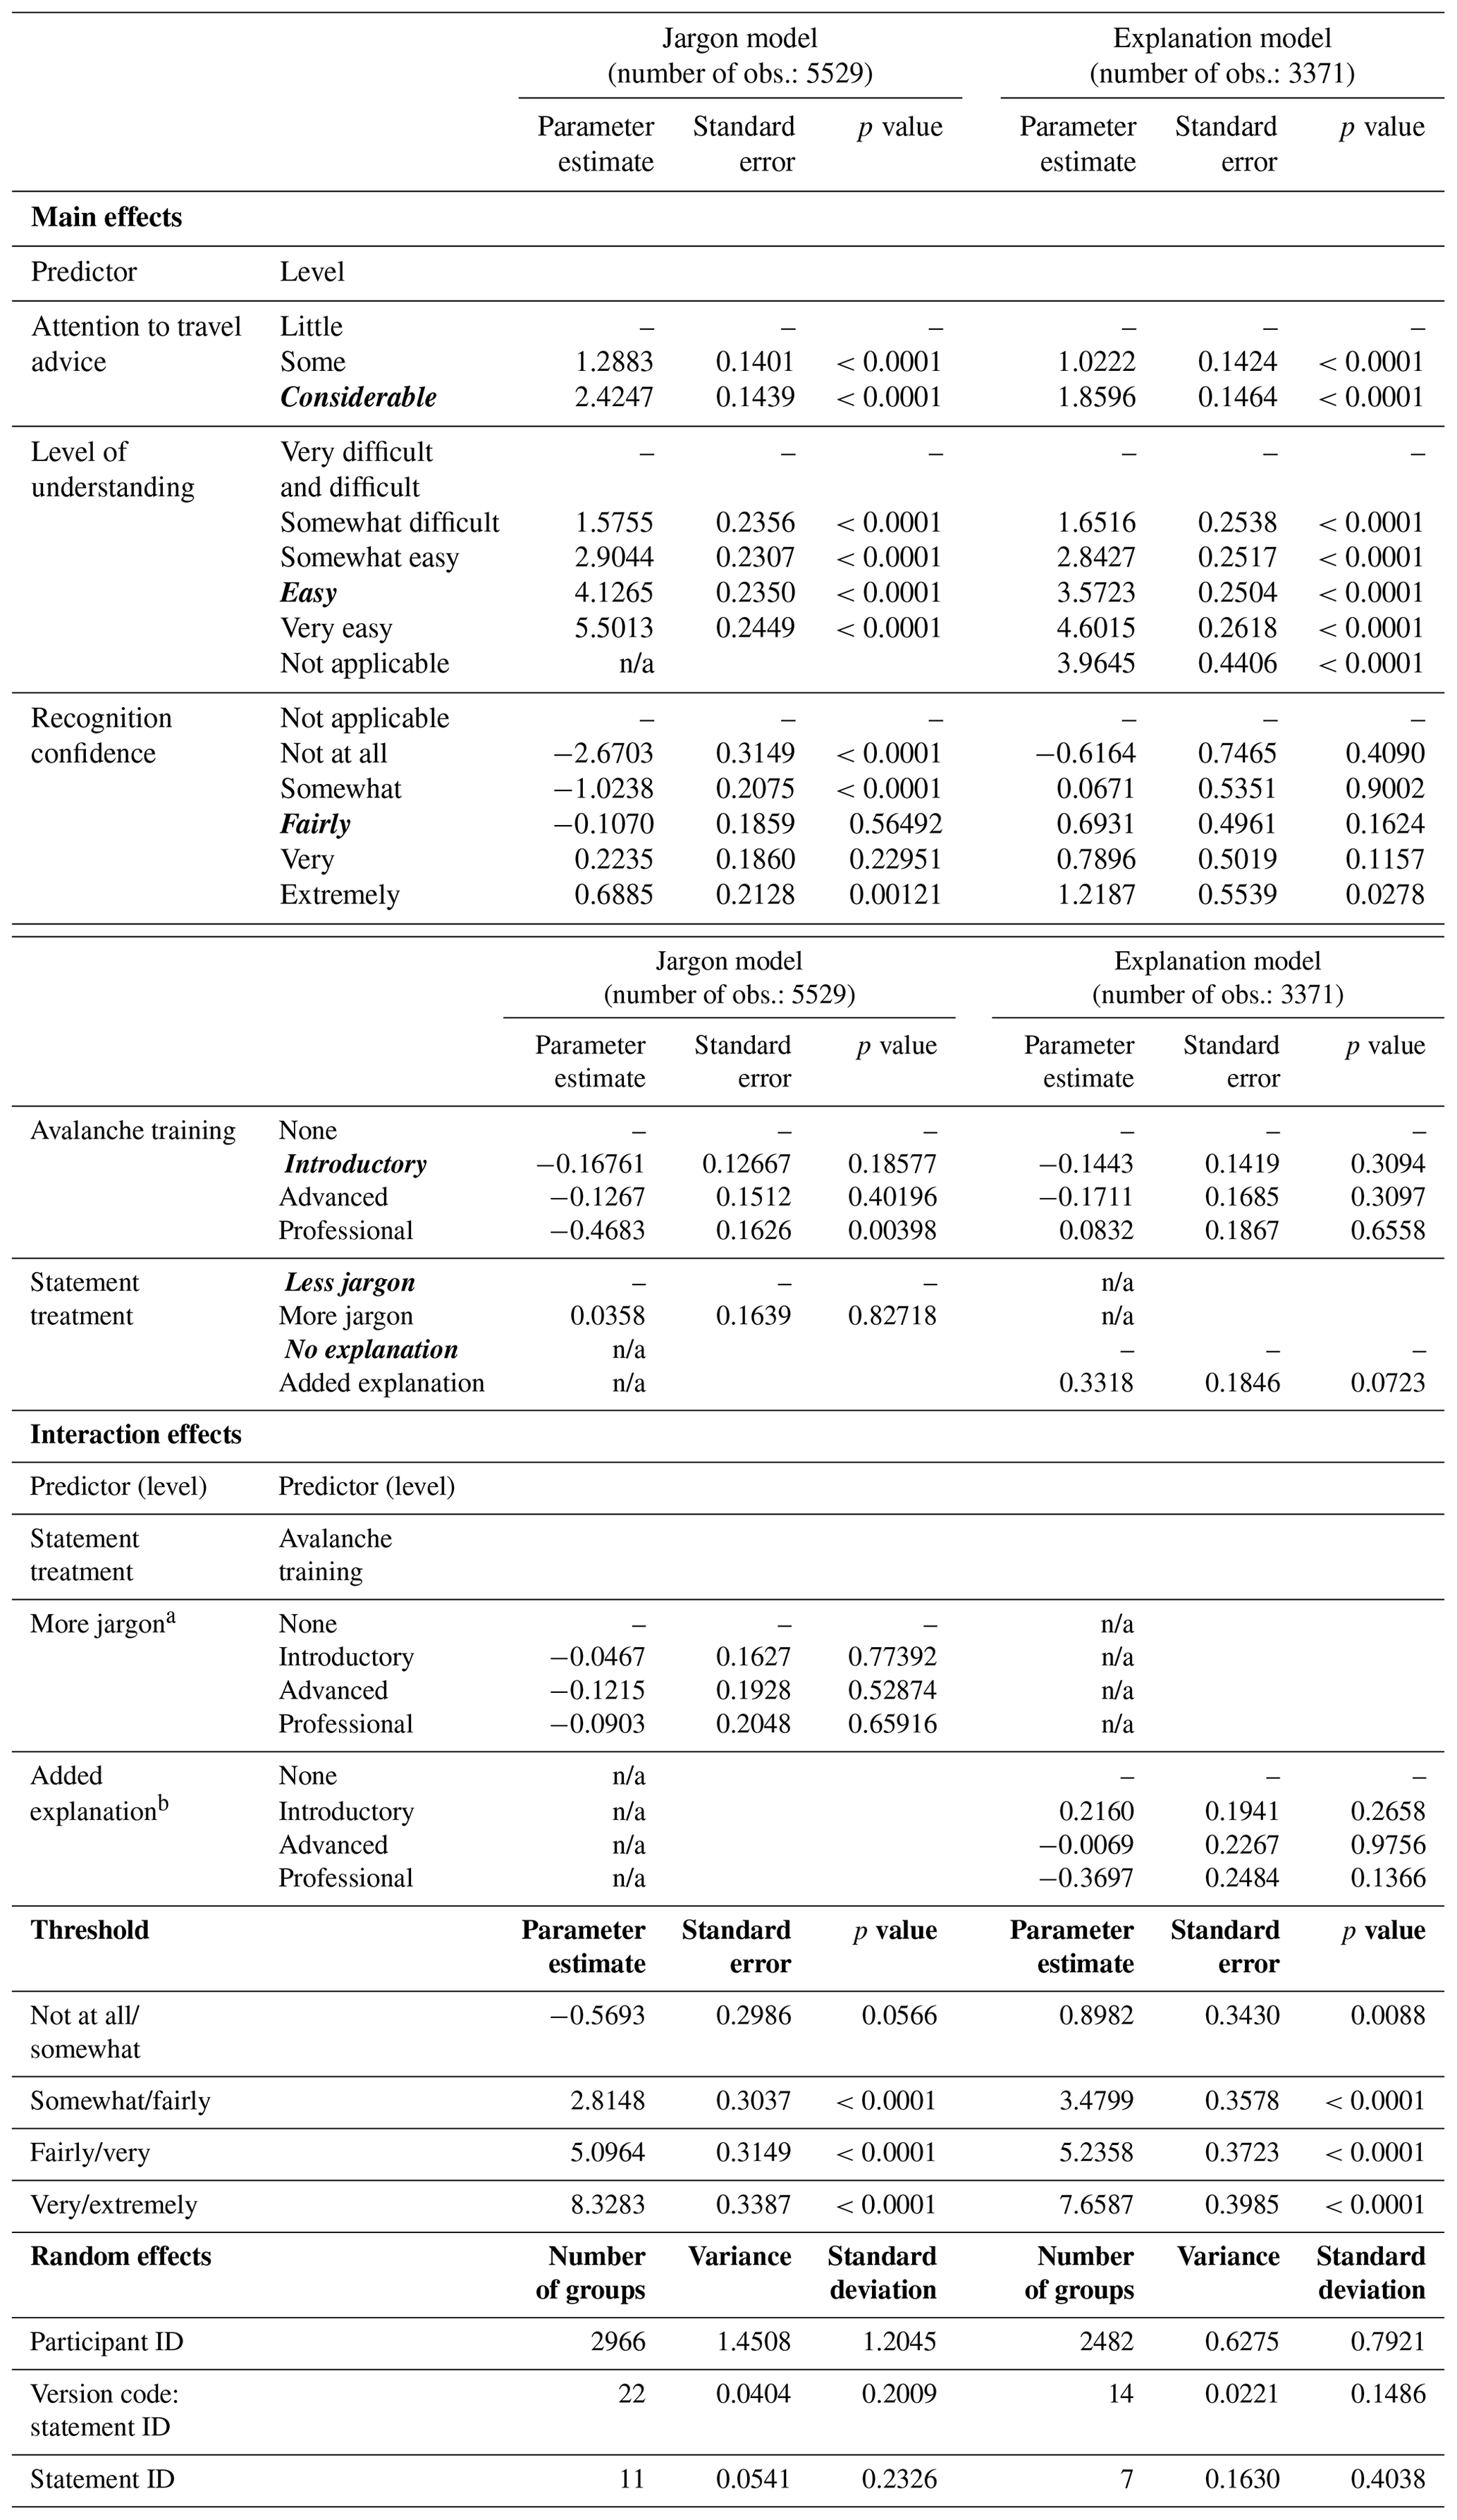
a Base level is less jargon. b Base level is no explanation. n/a: not applicable.
Table B3Parameter estimates of the jargon and explanation models examining participants' ease of understanding of the TTA statements. Bolded and italicized levels are used for calculating the estimated marginal probabilities for the post hoc tests.
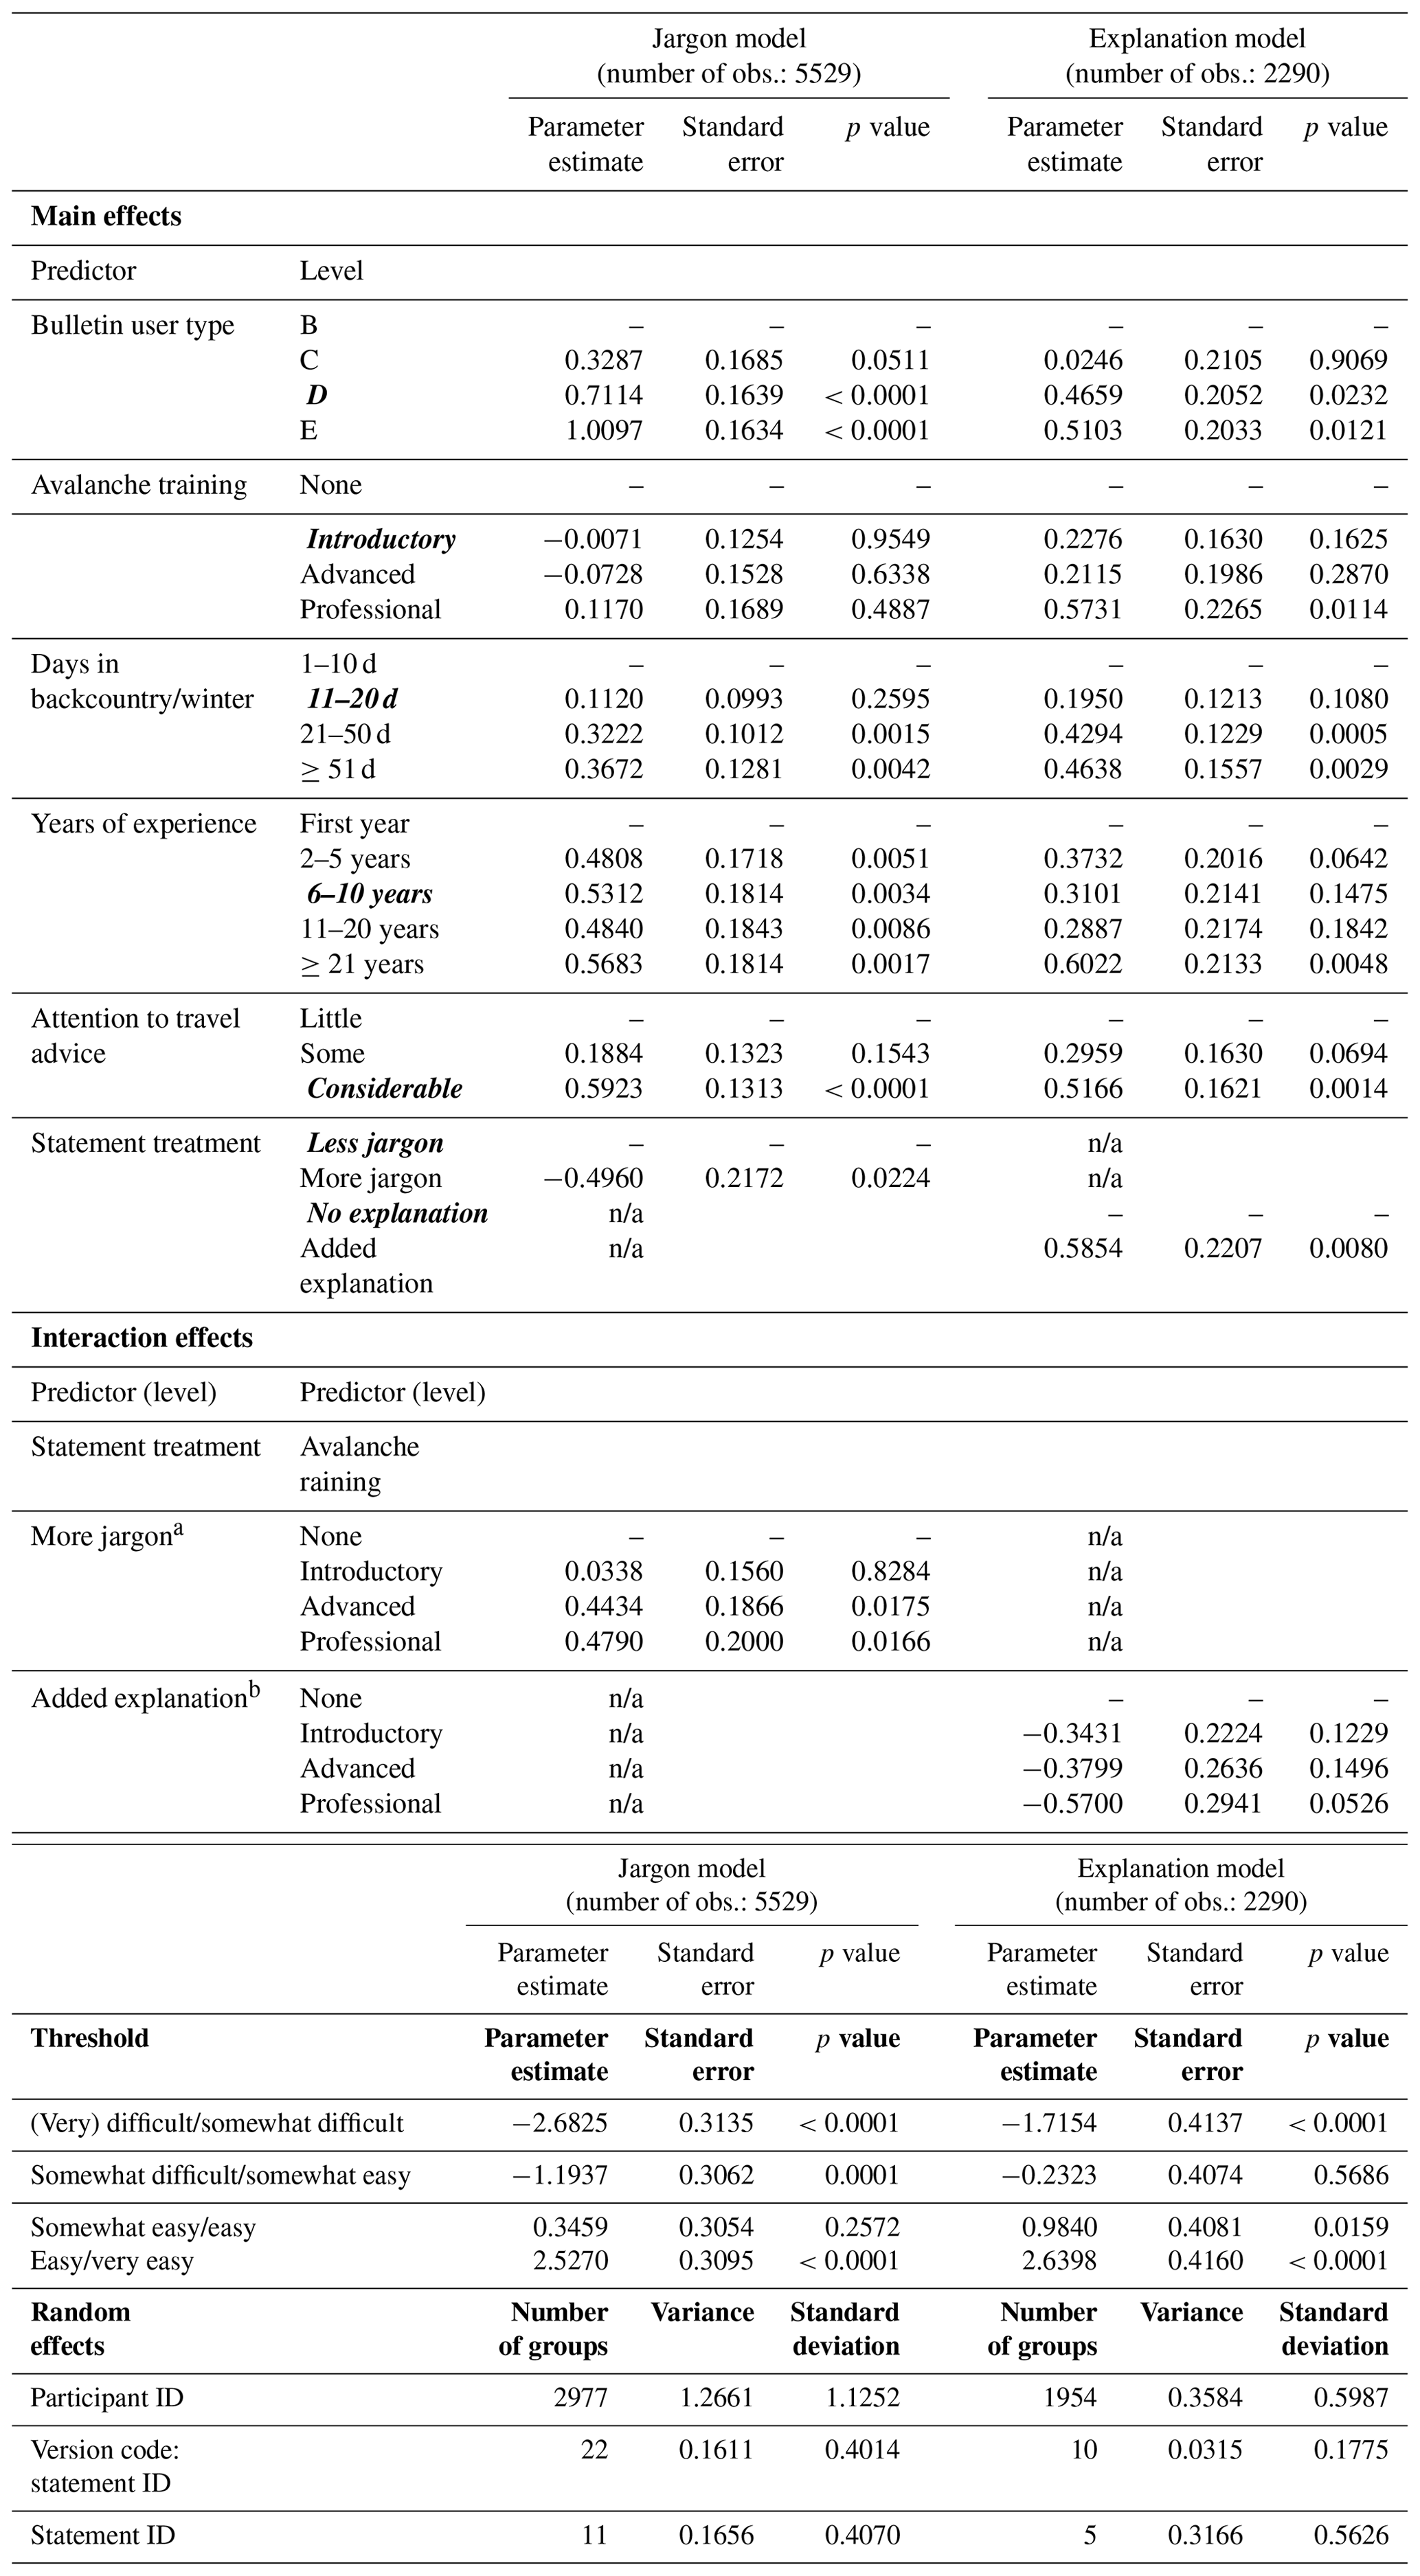
a Base level is less jargon. b Base level is no explanation.
Table B4Parameter estimates of the jargon and explanation models examining participants' confidence in recognizing the highlighted feature in the TTA statements. Bolded and italicized levels are used for calculating the estimated marginal probabilities for the post hoc tests.
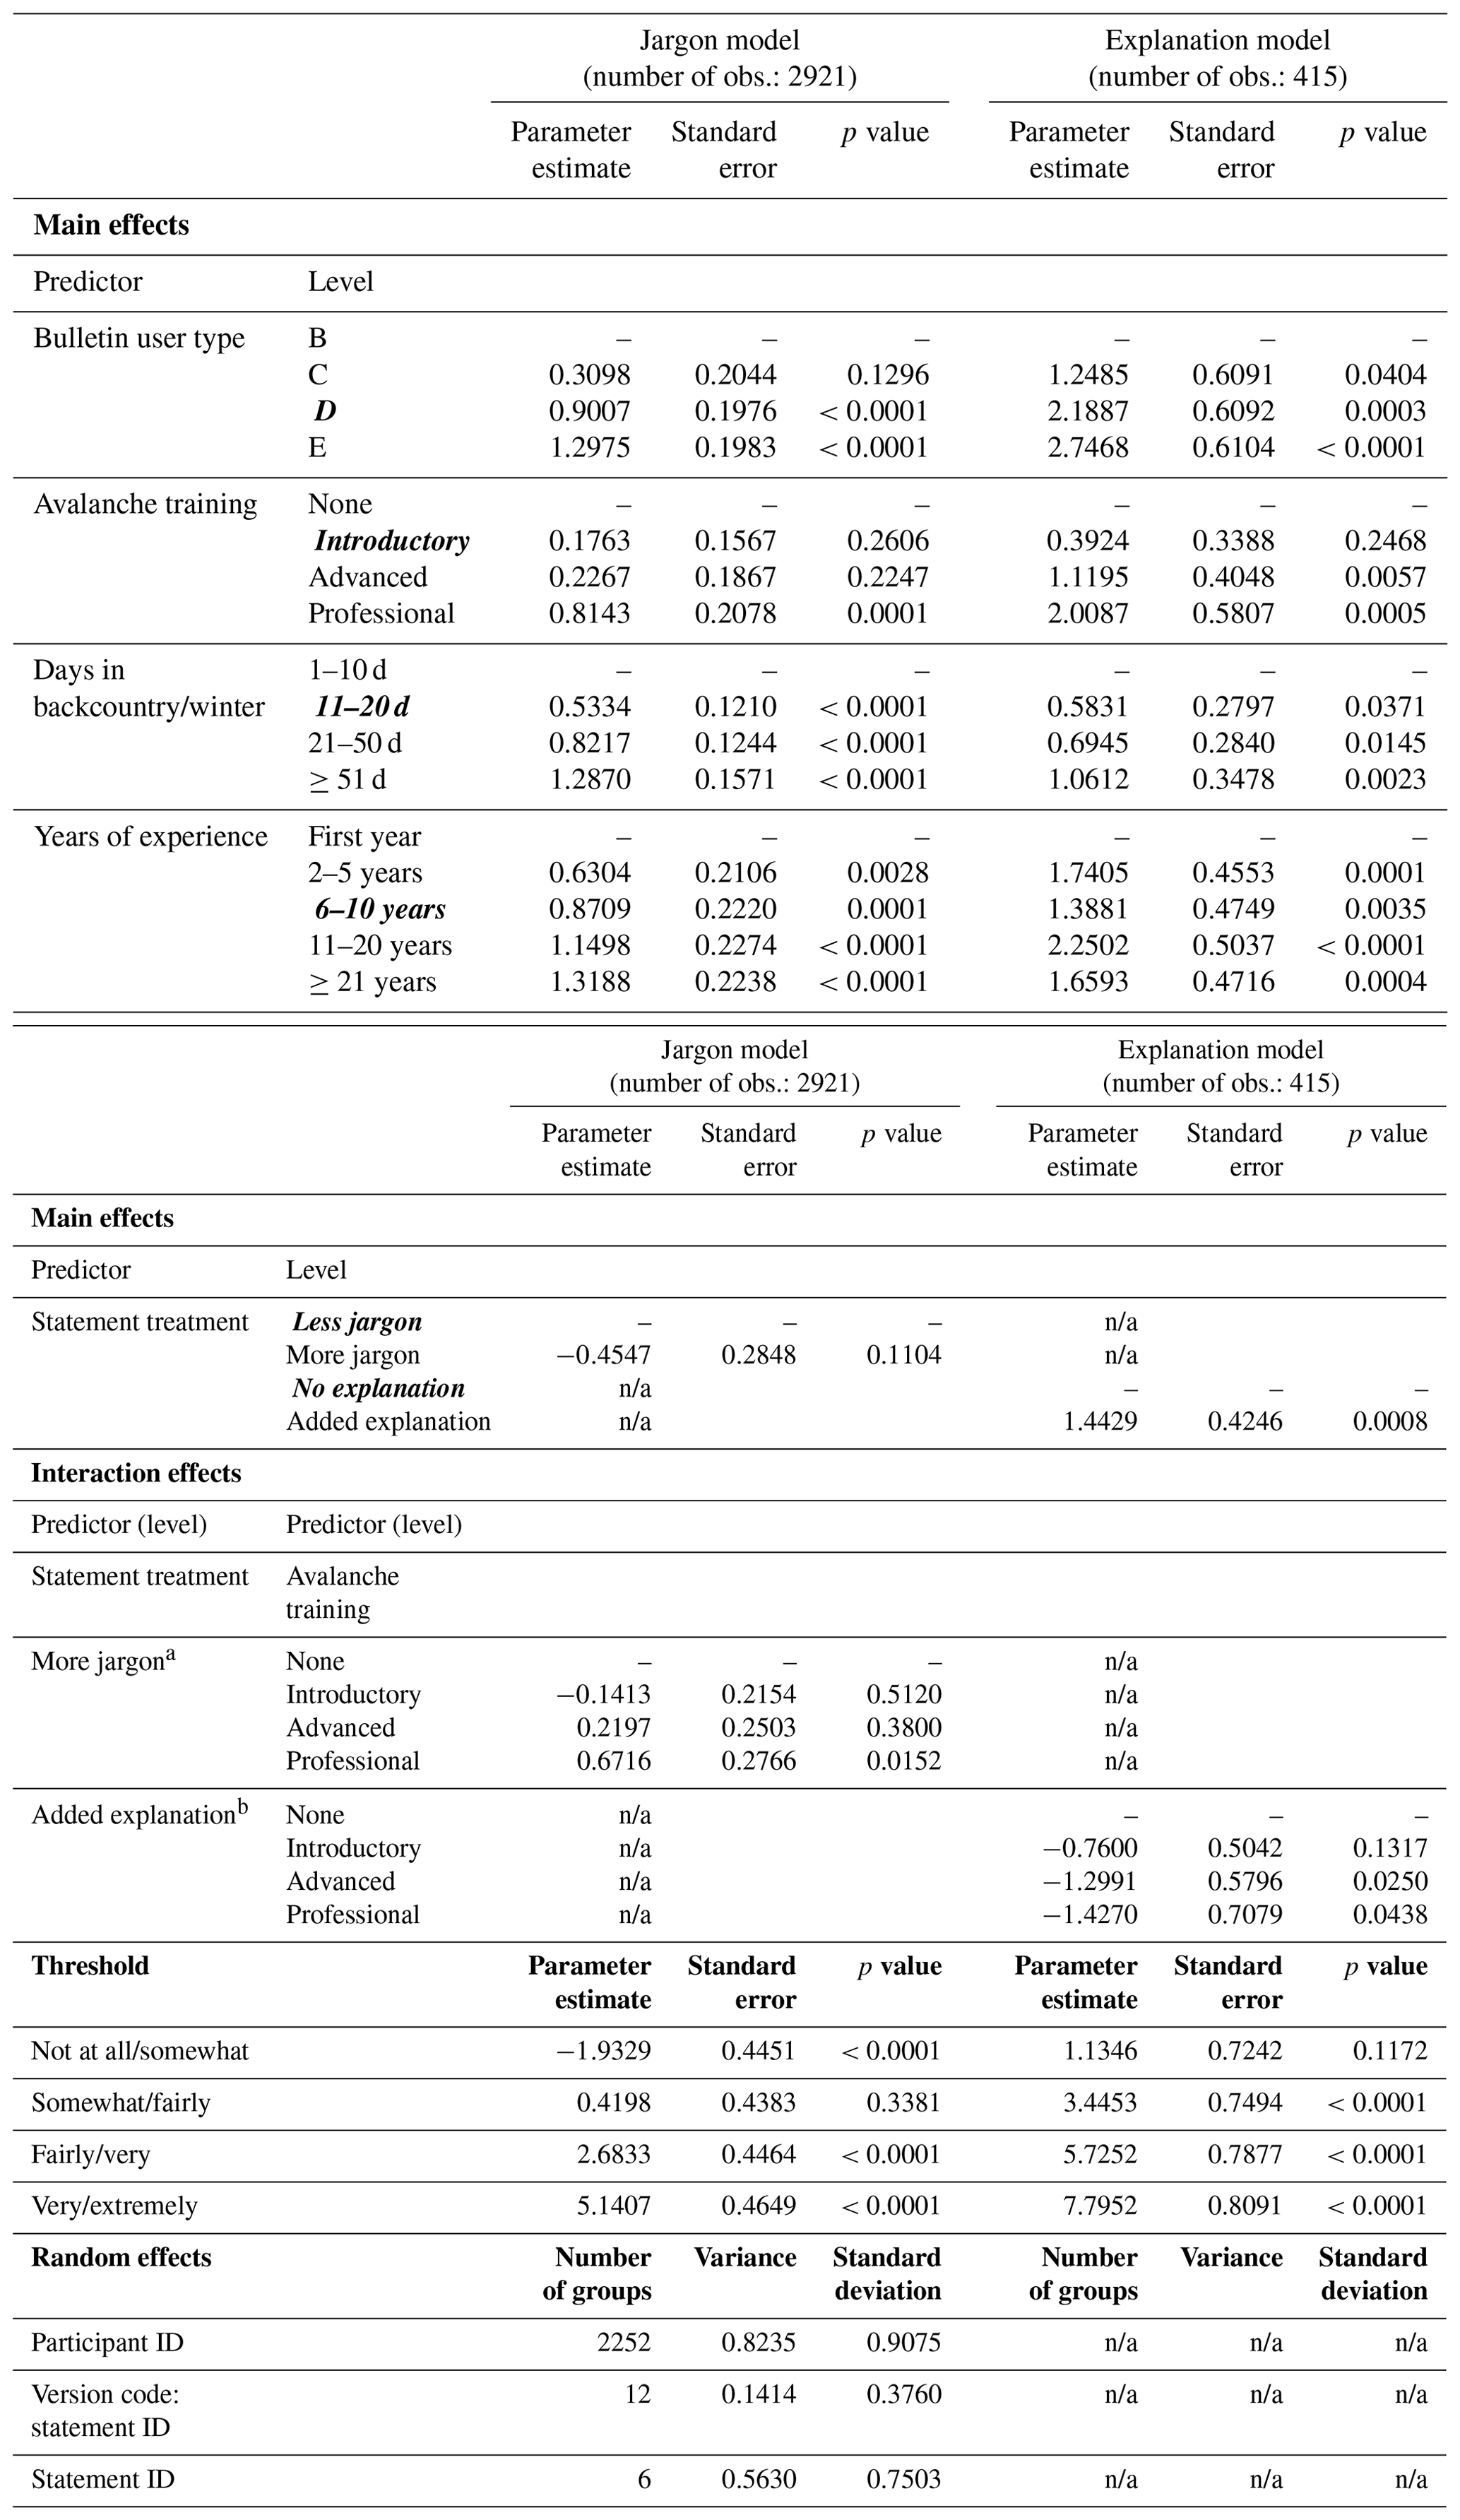
a Base level is less jargon. b Base level is no explanation. n/a: not applicable.
The data, code, and output for our analysis and the data and code for the figures and tables included in this paper are available at https://doi.org/10.17605/OSF.IO/ACZX5 (Haegeli et al., 2022).
KCF and PH designed and executed the study and prepared the original draft. PM assisted with data analysis and reviewed the manuscript. All authors reviewed the manuscript prior to submission.
At least one of the (co-)authors is a member of the editorial board of Natural Hazards and Earth System Science. The peer-review process was guided by an independent editor, and the authors also have no other competing interests to declare.
Publisher's note: Copernicus Publications remains neutral with regard to jurisdictional claims in published maps and institutional affiliations.
The authors thank Avalanche Canada, the Colorado Avalanche Information
Center, and the Northwest Avalanche Center for their input during the design
of the survey and their promotion of the study among their communities. We
also thank all of our survey participants without whose contribution this
research would not be possible. Two anonymous reviewers provided
constructive feedback that helped us improve the quality of the paper
substantially. We also thank Sven Fuchs for the handling of our paper.
We are grateful to the Coast Salish peoples including the Tsleil-Waututh
(![]() ), Kwikwetlem (
), Kwikwetlem (![]() ),
Squamish (
),
Squamish (![]() ), and Musqueam (
), and Musqueam (![]() ) Nations, on whose traditional and unceded territories Simon Fraser University and our research program resides. This research was conducted across Canada and the United States, which include the traditional territories of many other Indigenous peoples.
) Nations, on whose traditional and unceded territories Simon Fraser University and our research program resides. This research was conducted across Canada and the United States, which include the traditional territories of many other Indigenous peoples.
Kathryn C. Fisher received funding for this project from the government of Canada's Social Sciences and Humanities Research Council via a Joseph-Armand Bombardier Canada Graduate Scholarship Program Master's Scholarship (CGS M). Public avalanche safety research at the Simon Fraser University Avalanche Research Program is further supported by Avalanche Canada and the Avalanche Canada Foundation.
This paper was edited by Sven Fuchs and reviewed by two anonymous referees.
Avalanche Canada: Avalanche Canada 2019 Annual Report, https://issuu.com/avalancheca/docs/ac_2019_annual_reportissuu (last access: 9 June 2022), 2019.
Birkeland, K. W., Greene, E. M., and Logan, S.: In Response to Avalanche Fatalities in the United States by Jekich et al., Wild Environ. Med., 28, 380–382, https://doi.org/10.1016/j.wem.2017.06.009, 2017.
Bullock, O. M., Amill, D. C., Shulman, H. C., and Dixon, G. N.: Jargon as a barrier to effective science communication: Evidence from metacognition, Pub. Underst. Sci., 28, 845–853, https://doi.org/10.1177/0963662519865687, 2019.
CAA – Canadian Avalanche Association: Technical Aspects of Snow Avalanche Risk Management-Resources and Guidelines for Avalanche Practitioners in Canada, edited by: Campbell, C., Conger, S., Gould, B., Haegeli, P., Jamieson, B., and Statham, G., Canadian Avalanche Association, Revelstoke, BC, Canada, ISBN 978-1-926497-00-6, https://cdn.ymaws.com/www.avalancheassociation.ca/resource/resmgr/standards_docs/tasarm_english.pdf (last access: 9 June 2022), 2016.
CAIC – Colorado Avalanche Information Center: National Avalanche Accident Dataset, https://avalanche.state.co.us/accidents/statistics-and-reporting/ (last access: 9 June 2022), 2020.
CAIC – Colorado Avalanche Information Center: Avalanche forecast: Steamboat and Flat Tops area, https://avalanche.state.co.us/forecasts/backcountry-avalanche/steamboat-flat-tops/, last access: 27 February 2021.
Christensen, R. H. B.: ordinal – Regression Models for Ordinal Data, R package version 2019.12-10, https://CRAN.R-project.org/package=ordinal (last access: 9 June 2022), 2019.
EAWS – European Avalanche Warning Service: Information Pyramid, https://www.avalanches.org/standards/information-pyramid/, last access: 11 February 2021.
Finn, H.: Examining risk literacy in a complex decision-making environment: A study of public avalanche bulletins, M.R.M. research project no. 745, 2020-04, School of Resource and Environmental Management, Simon Fraser University, Burnaby, BC, http://summit.sfu.ca/item/20205 (last access: 9 June 2022), 2020.
Fisher, K.: How can avalanche bulletins be more useful for recreationists? Exploring three opportunities for improving communication of avalanche hazard information, M.R.M. thesis, School of Resource and Environmental Management, Simon Fraser University, Burnaby, BC, http://summit.sfu.ca/item/21746 (last access: 9 June 2022), 2021.
Fisher, K. C., Haegeli, P., and Mair, P.: Impact of information presentation on interpretability of spatial hazard information: Lessons from a study in avalanche safety, Nat. Hazards Earth Syst. Sci., 21, 3219–3242, https://doi.org/10.5194/nhess-21-3219-2021, 2021.
Fisher, K. C., Haegeli, P., and Mair, P.: Exploring the avalanche bulletin as an avenue for continuing education by including learning interventions, J. Outdoor Recreat. Tourism, 37, 100472, https://doi.org/10.1016/j.jort.2021.100472, 2022.
Fox, J. and Monette, G.: Generalized Collinearity Diagnostics, J. Am. Stat. Assoc., 87, 178–183, https://doi.org/10.2307/2290467, 1992.
Fox, J., and Weisberg, S.: An R Companion to Applied Regression, 3rd Edn., Sage Publications, Thousand Oaks, CA, 473 pp., ISBN 978-1544336473, 2019.
Gavaldà, J., Moner, I., and Bacardit, M.: Integrating the ATES into the avalanche information in Aran Valley (Central Pyrenees), in: Proceedings of 2013 International Snow Science Workshop, Grenoble, France, 381–384, https://arc.lib.montana.edu/snow-science/item/1984 (last access: 9 June 2022), 2013.
Gelman, A. and Hill, J.: Data analysis using regression and multilevel/hierarchical models. Cambridge University Press, Cambridge, NY, 654 pp., ISBN 978-0521686891, 2007.
Haegeli, P.: Avaluator V2.0 – Avalanche accident prevention card, Canadian Avalanche Centre, Revelstoke, BC, ISBN 978-0986659720, 2010.
Haegeli, P. and Strong-Cvetich, L.: Using discrete choice experiments to examine the stepwise nature of avalanche risk management decisions – An example from mountain snowmobiling, J. Outdoor Recreat. Tourism, 32, 100165, https://doi.org/10.1016/j.jort.2018.01.007, 2020.
Haegeli, P., Gunn, M., and Haider, W.: Identifying a High-Risk Cohort in a Complex and Dynamic Risk Environment: Out-of-bounds Skiing – An Example from Avalanche Safety, Prev. Sci., 13, 562–573, https://doi.org/10.1007/s11121-012-0282-5, 2012.
Haegeli, P., Fisher, K., and Mair, P.: Travel and terrain advice statements in public avalanche bulletins: A quantitative analysis of who uses this information, what makes it useful, and how can we make it better? – Data and Code, OSF [code], https://doi.org/10.17605/OSF.IO/ACZX5, 2022.
Harrison, X. A., Donaldson, L., Correa-Cano, M. E., Evans, J., Fisher, D. N., Goodwin, C. E. D., Robinson, B. S., Hodgson, D. J., and Inger, R.: A brief introduction to mixed effects modelling and multi-model inference in ecology, Peer J., 6, e4794, https://doi.org/10.7717/peerj.4794, 2018.
Harvey, S., Schmudlach, G., Bühler, Y., Dürr, L., Stoffel, A., and Christen, M.: Avalanche terrain maps for backcountry skiing in Switzerland, in: Proceedings of 2018 International Snow Science Workshop, Innsbruck, Austria, 1625–1631, http://arc.lib.montana.edu/snow-science/item/2833 (last access: 8 June 2022), 2018.
Larsen, H.T., Hendrikx, J., Slatten, M. S., and Engeset, R. V.: Developing nationwide avalanche terrain maps for Norway, Nat. Hazards, 103, 2829–2847, https://doi.org/10.1007/s11069-020-04104-7, 2020.
Lenth, R.: Estimated Marginal Means, aka Least-Squares Means, R package version 1.4.3.01, https://CRAN.R-project.org/package=emmeans (last access: 8 June 2022), 2019.
Lüdecke, D., Ben-Shachar, M. S., Patil, I., Waggoner, P., and Makowski, D.: performance: An R Package for Assessment, Comparison, and Testing of Statistical Models, J. Open Source Softw., 6, 3139, https://doi.org/10.21105/joss.03139, 2021.
Morss, R. E., Demuth, J.L., Lazo, J. K., Dickinson, K., Lazrus, H., and Morrow, B. H.: Understanding public hurricane evacuation decisions and responses to forecast and warning messages, Weather Forecast., 31, 395–417, https://doi.org/10.1175/WAF-D-15-0066.1, 2016.
Morss, R. E., Cuite, C. L., Demuth, J. L., Hallman, W. K., and Schwom, R. L.: Is storm surge scary? The influence of hazard, impact, and fear-based messages and individual differences on responses to hurricane risks in the USA, Int. J. Disast. Risk Reduct., 30, 44–58, https://doi.org/10.1016/j.ijdrr.2018.01.023, 2018.
Munter, W.: 3×3 Lawinen: Entscheiden in kritischen Situationen, Agentur Pohl & Schellhammer, Garmisch Partenkirchen, Germany, 220 pp., ISBN 978-3000020605, 1997.
NWAC – Northwest Avalanche Center: Avalanche Forecast – West Slopes North, https://nwac.us/avalanche-forecast/#/west-slopes-north, last access: 27 February 2021.
Pielmeier, C., Silbernagel, D., Dürr, L., and Stucki, T.: Applying the Avalanche Terrain Exposure Scale in the Swiss Jura Mountains, in: Proceedings of 2014 International Snow Science Workshop, Banff, AB, 883–889, https://arc.lib.montana.edu/snow-science/item/2170 (last access: 9 June 2022), 2014.
Rau, N. M., Basir, M. A., and Flynn, K. E.: Parental understanding of crucial medical jargon used in prenatal prematurity counseling, BMC Med. Inform. Decis., 20, 169, https://doi.org/10.1186/s12911-020-01188-w, 2020.
R Core Team: R: A language and environment for statistical computing, R Foundation for Statistical Computing, Vienna, Austria, https://www.R-project.org/, last access: 9 June 2022.
Schmudlach, G. and Köhler, J.: Method for an Automatized Avalanche Terrain Classification, in: Proceedings of 2016 International Snow Science Workshop, Breckenridge, CO, 729–736, http://arc.lib.montana.edu/snow-science/item/2356 (last access: 9 June 2022), 2016.
SLF – WSL Institute for Snow and Avalanche Research SLF, Avalanche Bulletin, https://www.slf.ch/en/services-and-products/forecasting-and-warning/avalanche-bulletin.html, last access: 11 February 2021.
Statham, G., McMahon, B., and Tomm, I.: The avalanche terrain exposure scale, in: Proceedings of the 2006 International Snow Science Workshop, Telluride, 491–497, https://arc.lib.montana.edu/snow-science/objects/issw-2006-491-497.pdf (last access: 9 June 2022), 2006.
Statham, G.: Avalanche hazard, danger and risk – a practical explanation, in: Proceedings of 2008 International Snow Science Workshop, Whistler, BC, 224–227, http://arc.lib.montana.edu/snow-science/item/34 (last access: 9 June 2022), 2008.
Statham, G., Haegeli, P., Birkeland, K. W., Greene, E., Israelson, C., Tremper, B., Stethem, C. J., McMahon, B., White, B., and Kelly, J.: The North American public avalanche danger scale, in: Proceedings of 2010 International Snow Science Workshop, Lake Tahoe, CA, 117–123, http://arc.lib.montana.edu/snow-science/item/353 (last access: 9 June 2022), 2010.
Statham, G., Haegeli, P., Greene, E. Birkeland, K., Israelson, C., Tremper, B., Stethem, C., McMahon, B., White, B., and Kelly, J.: A conceptual model of avalanche hazard, Nat. Hazards, 90, 663–691, https://doi.org/10.1007/s11069-017-3070-5, 2018.
St. Clair, A.: Exploring the Effectiveness of Avalanche Risk Communication: A Qualitative Study of Avalanche Bulletin Use Among Backcountry Recreationists, M.R.M. research project no. 738, 2019-10, School of Resource and Environmental Management, Simon Fraser University, Burnaby, BC, http://summit.sfu.ca/item/19807 (last access: 9 June 2022), 2019.
St. Clair, A., Finn, H., and Haegeli, P.: Where the rubber of the RISP model meets the road: Contextualizing risk information seeking and processing with an avalanche bulletin user typology, Int. J. Disast. Risk Reduct., 66, 102626, https://doi.org/10.1016/j.ijdrr.2021.102626, 2021.
Techel, F., Jarry, F., Kronthaler, G., Mitterer, S., Nairz, P., Pavšek, M., Valt, M., and Darms, G.: Avalanche fatalities in the European Alps: long-term trends and statistics, Geogr. Helv., 71, 147–159, https://doi.org/10.5194/gh-71-147-2016, 2016.
Thomas, M., Hariharan, M., Rana, S., Swain, S., and Andrew, A.: Medical jargons as hindrance in doctor-patient communications, Psychol. Stud., 59, 394–400, https://doi.org/10.1007/s12646-014-0262-x, 2014.
Venables, W. N. and Ripley, B. D.: = Modern Applied Statistics with S, , 4th Edn., Springer, New York, ISBN 0-387-954570, https://www.stats.ox.ac.uk/pub/MASS4/ (last access: 9 June 2022), 2002.
Winkler, K., Fischer, A., and Techel, F.: Avalanche Risk in Winter Backcountry Touring: Status and Recent Trends in Switzerland, in: Proceedings of 2016 International Snow Science Workshop, Breckenridge, CO, 270–277, http://arc.lib.montana.edu/snow-science/item/2277 (last access: 9 June 2022), 2016.
Zimmerman, M. and Jucks, R.: How experts' use of medical technical jargon in different types of online health forums affects perceived information credibility: Randomized experiment with laypersons, J. Med. Internet Res., 20, e30, https://doi.org/10.2196/jmir.8346, 2018.
Zuur, A. F., Ieno, E. N., Walker, N., Saveliev, A. A., and Smith, G. M. (Eds.).: Mixed effects models and extensions in ecology with R, Springer, New York, NY, ISBN 978-1441927644, 2019.
Participants younger than 20 were excluded from the analysis, since that age category could include minors, and the survey did not allow us to get consent from a parent or legal guardian.
Estimated marginal probabilities for the ease-of-understanding model were calculated using the following parameter levels: bulletin user type – type D, avalanche awareness training – introductory, years of experience – 6–10 years, average days in backcountry per winter – 11–20 d, and attention to travel advice – considerable.
Estimated marginal probabilities for the confidence of recognition models were calculated using the following parameter levels: bulletin user type – type D, avalanche awareness training – introductory, years of experience – 6–10 years, and average days in backcountry per winter – 11–20 d.