the Creative Commons Attribution 4.0 License.
the Creative Commons Attribution 4.0 License.
 | 02 Jun 2022
Idealized simulations of Mei-yu rainfall in Taiwan under uniform southwesterly flow using a cloud-resolving model
Chung-Chieh Wang
Pi-Yu Chuang
Shi-Ting Chen
Dong-In Lee
Kazuhisa Tsuboki
In this study, idealized cloud-resolving simulations are performed for horizontally uniform and steady southwesterly flow at fixed direction–speed combinations to investigate rainfall characteristics and the role of the complex topography in Taiwan during the Mei-yu season without the influence of a front or other disturbances. Eight directions (180 to 285∘, every 15∘) and eight speeds (5 to 22.5 m s−1, every 2.5 m s−1) are considered, and near-surface relative humidity is also altered (from 55 %–100 %) in a subset of these tests to further examine the effects of moisture content, yielding a total 109 experiments each having a integration length of 50 h. Three rainfall regimes that correspond to different ranges of the wet Froude number (Frw) are identified from the idealized simulations (with a grid size of 2 km). The low-Frw regime (Frw ≤ ∼ 0.3) is where the island circulation from thermodynamic effects is the main driver of rainfall in local afternoon. The lower the wind speed and Frw are, the more widespread the rainfall is, as well as its amount. On the other hand, the high-Frw regime (Frw ≥ ∼ 0.4) occurs when the flow of at least 12.5 m s−1 impinges on Taiwan terrain at a large angle (not parallel). This favors the flow-over scenario, and topographic rainfall production becomes dominant through mechanical uplift of unstable air. In this scenario, the faster and wetter the flow is, the heavier the rainfall on the windward slopes is, and maximum amounts typically occur at wind directions from 240–255∘. Between the two regimes above, a third, mixed regime also exists. The idealized results are discussed for their applicability to the real atmosphere.
- Article
(4590 KB) - Full-text XML
- BibTeX
- EndNote


The Mei-yu season in East Asia is a unique weather and climate phenomenon during the transition from the winter northeasterly to summer southwesterly monsoon, and it typically occurs from mid-May to mid-June in Taiwan (Chen, 1983, 2004; Ding, 1992). During this rainy period that provides vital water resources but also brings heavy rainfalls and related hazards to the island at times, many mechanisms can lead to rainfall in Taiwan. The most obvious feature is the repeated passages of the Mei-yu front (e.g., Kuo and Chen, 1990), where the warm and moist tropical air mass from the southwest encounters the colder and drier air from the north and thus provides low-level convergence and frontal uplift to produce rainfall. The front not only brings an unstable environment to the region, but it can also accompany organized mesoscale convective systems (MCSs) such as intense rainbands to cause heavy to extreme rainfall in Taiwan (e.g., C.-C. Wang et al., 2016, 2021; Lupo et al., 2020). Furthermore, when a Mei-yu front approaches Taiwan, the prefrontal southwesterly flow often intensifies to form low-level jets (LLJs) in response to the enhanced horizontal pressure gradient (e.g., Chen and Chen, 1995; A.-H. Wang et al., 2021), and the flow is subsequently uplifted by the steep and complex mesoscale terrain of the island (e.g., Lin, 1993; Jou et al., 2011). This is another common scenario for rainfall production in Taiwan prior to the arrival of the surface front. In the past, many studies have examined the roles of the front (e.g., Chen, 1993; Cho and Chen, 1995; Chen et al., 2008), the LLJ (e.g., Jou and Deng, 1992; Chen et al., 2005; Wang et al., 2014a; A.-H. Wang et al., 2021), the topography of Taiwan (e.g., Lin, 1993; Wang et al., 2005), and the relationships and interactions among them (e.g., Lin et al., 2001; Xu et al., 2012; Tu et al., 2014; Wang et al., 2014b).
In addition to forced uplifting, the steep topography of Taiwan also has another dynamical effect in terrain blocking (e.g., Yeh and Chen, 2002, 2003). As airflow encounters an obstacle such as the topography of Taiwan, its overall response and behavior are controlled by the Froude number (Fr), defined as Fr = (e.g., Pierrehumbert, 1984; Banta, 1990; Baines, 1995). Here, U is the speed of wind component normal to the long axis of topography, h0 is the mountain height, and N is the Brunt–Väisälä frequency and N2 = , where θ is the potential temperature. In the low-Fr regime (Fr ≤ 1), the flow tends to be blocked and move around the obstacle (e.g., Forbes et al., 1987; Bell and Bosart, 1988), and flow deflection occurs with the formation of a ridge/trough on the windward/lee side (Smith, 1982; Banta, 1990; Overland and Bond, 1995). On the contrary, in high-Fr regime when Fr > 1, the flow has enough momentum to climb over the terrain, and orographic precipitation is often the result (e.g., Manins and Sawford, 1982; Smolarkiewicz et al., 1988; Rotunno and Ferretti, 2003). In a Mei-yu case study, Wang et al. (2005) found that depending on the Fr, the blocking effect of Taiwan can shift the low-level convergence zone due to flow deceleration and deflection farther upstream (with higher Fr), thus causing rainfall over the plain area instead of near the mountains.
Besides the common ingredients of the Mei-yu front, southwesterly flow (including the LLJ), and the topography, other disturbances and mechanisms can also lead to rainfall in Taiwan. The island circulation that constitutes both the land–sea breeze and mountain–valley breeze (upslope-downslope wind) can develop under weak synoptic conditions (in low-Fr regime) with pronounced diurnal signals (Chen et al., 1999; Kerns et al., 2010). During daytime, sea breeze and upslope winds generate near-surface convergence and rainfall over the island, whereas offshore flow with divergence occurs at nights (e.g., Sha et al., 1991; Johnson, 2011). Using the data collected during the South-West Monsoon Experiment (SoWMEX; Jou et al., 2011), Ruppert et al. (2013) found that the diurnal cycle in Taiwan is more pronounced during the undisturbed periods (without the front) in the Mei-yu season, and it still exists but only weaker on average during the disturbed periods (with the presence of the front). Thus, as reviewed above, there are also thermodynamic effects of the topography, particularly under weak synoptic conditions and the low-Fr regime.
Other features and disturbances that also play various roles to produce or affect rainfall include disturbances along/near the front (e.g., Chen, 1992; Chen et al., 2008; Lai et al., 2011; Wang et al., 2014b) and leeside mesolow and vortex (e.g., Sun and Chern, 1993, 1994; Wang and Chen, 2002, 2003). Preexisting disturbances embedded in the airflow (e.g., Davis and Lee, 2012; Wang et al., 2018), often at the leading edge of stronger wind surges with convergence near the surface (Wang et al., 2014a), and gravity waves/density currents (e.g., Kingsmill, 1995; Fovell, 2005; Wang et al., 2011) are other possibilities. At the storm scale, earlier convection (e.g., Nicholls et al., 1991; Walser et al., 2004; Wang et al., 2011; Xu et al., 2012) and even the interaction between vertical wind shear and updraft of mature cells are known to affect convective evolution and thus subsequent rainfall (e.g., Wang et al., 2016).
Most of the above studies were on real events through either case studies, composites of similar cases after classification, or model simulations and sensitivity tests. Because each of the many influencing factors play a different role in different events, i.e., they are not controlled, it is very difficult to isolate the contribution from a single factor, or a small number of selected factors, and impossible to generalize the results for other events. For such a purpose, it is more effective to perform idealized simulations using numerical models, in which undesirable features can be excluded and those included in the model can be properly controlled. Thus, idealized simulations are the approach adopted in this study.
Several idealized numerical studies were performed in the past, including those of Chu and Lin (2000) and Chen and Lin (2005b) in a two-dimensional (2D) framework, Chen and Lin (2005a) and Miglietta and Rotunno (2009) in three-dimensional (3D) space, and Sever and Lin (2017) in both. These studies investigated the effects of Fr (i.e., wind speed) and the amount of convective available potential energy (CAPE) on conditionally unstable flow over a mountain ridge (mostly 2 km in height). They mainly identified several different regimes: flow with an upstream-propagating precipitation system with small Fr (≤ 0.5) and large CAPE (≥ 2000 J kg−1), stationary precipitation over the mountain with intermediate Fr (≤ 0.7) and a wide range of CAPE, downstream-propagating orographic convection with larger Fr (up to about 1.2), and flow over the terrain with stratiform precipitation typically with even larger Fr (Chen and Lin, 2005b). While these studies cover the high-Fr (flow-over) regime with strong winds (with U≥ 36 m s−1), an idealized bell-shaped topography is used, and effects of different wind directions are not investigated even in the cases of 3D simulations (which also have a limited dimension of only 10–20 km in the direction parallel to the terrain). In addition, the thermodynamic effects of the topography from radiation and the Coriolis effect associated with the earth's rotation are also turned off as controlled parameters in these experiments. Thus, while these studies help us gain better understanding on how conditionally unstable flow would respond when encountering a mountain (or a mountain chain), their results nevertheless are highly idealized and simplified.
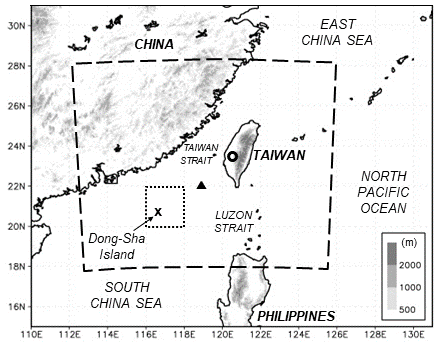
Figure 1The geography and topography (m, shading) surrounding Taiwan. The dashed lines show the CReSS model simulation domain, and the locations of Dong-Sha Island (cross), research vessel (triangle), and the reference point of the idealized initial and boundary conditions (open circle, at 23.5∘ N, 120.5∘ E) are all marked. The dotted box depicts the 2∘ × 2∘ area surrounding Dong-Sha used to compute mean wind.

Figure 2(a) The distribution of total accumulated rainfall (mm) per Mei-yu season (May–June) in the climatology of 1981–2010 (source: CWB). (b) The topography (m, color) of Taiwan and locations of rain gauge sites in 2013 (dots). The three elevation ranges of plain (< 250 m), slope (0.25–1 km), and mountain (≥ 1 km) and the four subregions of Taiwan (north, center, south, and east), as well as (c) the north–south profile of the highest topography (km). In (b), the parentheses give the percentage (%) of each subregion in Taiwan, while the percentages of the three elevation ranges (P, S, and M) in each subregion are also labeled. The four red triangles mark the locations of land-based radars used to produce the composites and rainfall estimates shown in Figs. 11–13.
Located between the Pacific Ocean and Eurasia continent in the central area of the East Asian monsoon (Fig. 1), Taiwan has a steep and complex topography as mentioned (Fig. 2b and c). The long-term climatology of 1981–2010 reveals abundant Mei-yu rainfall in the 2-month period of May–June with three maxima: two on the windward side of the Central Mountain Range (CMR) in southern and central Taiwan, respectively, and the third, less-distinct center in northern Taiwan, roughly along the northern slope of the Snow Mountain Range (SMR; Fig. 2a). It is clear that the topography of Taiwan exerts strong control on the overall Mei-yu rainfall amount and distribution (also Kuo and Chen, 1990; Lin, 1993; Yeh and Chen, 1998; Chi, 2006) with significant diurnal variations (Chen et al., 1999; Kerns et al., 2010; Ruppert et al., 2013), as reviewed. Thus, certain aspects cannot be fully explored using idealized bell-shaped topography and without diurnal effects. For idealized simulation results to be more applicable to Taiwan, both the real topography and thermodynamical effects are needed. With this motivation in mind, the scientific objective of the present study is therefore to investigate the rainfall response under idealized southwesterly flow encountering the real topography of Taiwan that exerts both dynamical and thermodynamic effects. The prescribed flow will have different direction and speed that control the Fr, as well as different moisture content that affects the CAPE and instability. Thus, the relative importance of dynamical and thermodynamic effects under different wind conditions for Taiwan can be assessed in a 3D framework, and the rainfall regime in which one dominates the other (or vice versa) can be identified (together with the range of Fr) in a more generalized fashion. Thus, the strategy adopted here is similar to Metzger et al. (2014) but has not been attempted for Taiwan previously, as reviewed above.
The remainder of this paper is arranged as follows. The data and methodology, including the model and experimental design, are described in Sect. 2. In Sect. 3, our results of rainfall regimes under prescribed and uniform southwesterly flow are presented, and the influence of moisture and instability is discussed in Sect. 4. In Sect. 5, some of our idealized results are compared with real events to evaluate their applicability. Finally, the conclusions and summary are given in Sect. 6.
2.1 Sounding data and reference profile
In this study, a reference vertical profile of sounding and winds to represent the typical conditions upstream from Taiwan is first constructed. For this purpose, the sounding data at Dong-Sha Island and from the research vessel (RV) during the Southwest Monsoon Experiment in 2008 (SoWMEX; Jou et al., 2011) after quality control (Ciesielski et al., 2010) are used (see Fig. 1). Screening is performed to exclude dates with synoptic disturbances (such as fronts and typhoons) near Taiwan, dates not in a southwesterly flow regime (wind direction outside the range of 200–270∘ or wind speed < 8 m s−1 at 850 hPa), or dates with missing data. Eventually, soundings at 00:00 UTC of seven dates are selected: 27–29 May and 1 June for Dong-Sha and 28 May and 4 and 11 June for RV. It was quite rainy on five of these days (with peak rainfall of 60–150 mm), but little rain fell on 28 May and 11 June. The averaged thermodynamic, moisture, and wind profiles in the vertical from these seven soundings (Fig. 3a–d) indicate a rather uniform south-southwesterly flow (8–13 m s−1) that veers slightly with height from the lower to middle troposphere. From 950–825 hPa, the wind speed increases from about 10–12.5 m s−1, indicating only weak vertical shear. The moisture content is high near the surface, and the atmosphere is conditionally unstable (Fig. 3a and d), with a CAPE value of 2345 J kg−1 and no convective inhibition (CIN) for a surface air parcel (at 1005.5 hPa).
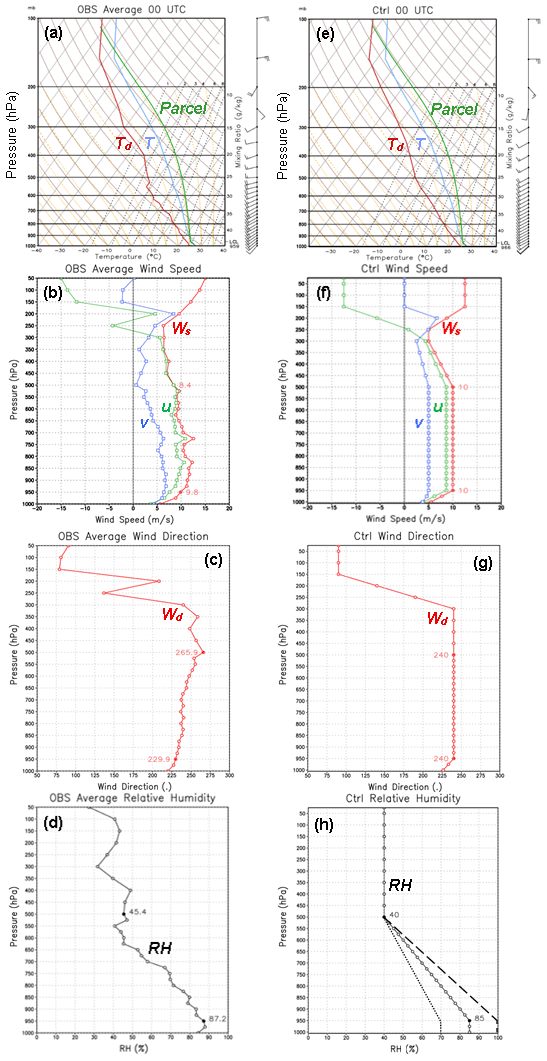
Figure 3Mean vertical profiles of (a) temperature (T, ∘C), dew-point temperature (Td, ∘C), and wind (kt), together with the process curve for a surface parcel (following dry/moist adiabatic motion) in the Skew T-log p diagram, and horizontal wind (m s−1), including (b) u and v components and wind speed (Ws, all in m s−1), (c) wind direction (Wd, ∘), and (d) relative humidity (RH, %) from seven soundings taken at Dong-Sha Island and the research vessel (RV) upstream from Taiwan (see text for details). (e–h) As in (a–d), except for the smoothed or prescribed profiles used in the CTL experiment (see text for details). In (h), the long-dashed and dotted lines depict two other RH profiles used in moisture tests, with RH = 100 % and 70 % below 950 hPa, respectively (no difference from CTL at and above 500 hPa).
Table 1The methods used to construct the idealized wind and moisture profiles (at the reference point of 23.5∘ N, 120.5∘ E) in this study.

Based on the mean sounding, the wind profiles in the control (CTL) are modified to give a uniform southwesterly flow of 10 m s−1 at 240∘ over 950–500 hPa and then change linearly to a prescribed profile at 300 hPa and above based on the observation (Fig. 3f and g). Below 950 hPa, the wind is set to change linearly downward from 950 hPa to half the speed and 15∘ to the left at the surface due to friction, also in close agreement with the observations. While the temperature (T) profile is unchanged, the moisture profile is modified to give a relative humidity (RH) of 85 % from the surface to 950 hPa and 40 % at 500 hPa and above (changed also linearly in between; Fig. 3h) and raises the CAPE to 2803 J kg−1 (Fig. 3e). This value is comparable to those found in some previous studies (e.g., Wang et al., 2005). The above method used to construct the idealized (reference) wind profile is summarized in Table 1 (top half).
Table 2The setup of CReSS model domain, ICs and BCs, and physical schemes in this study.
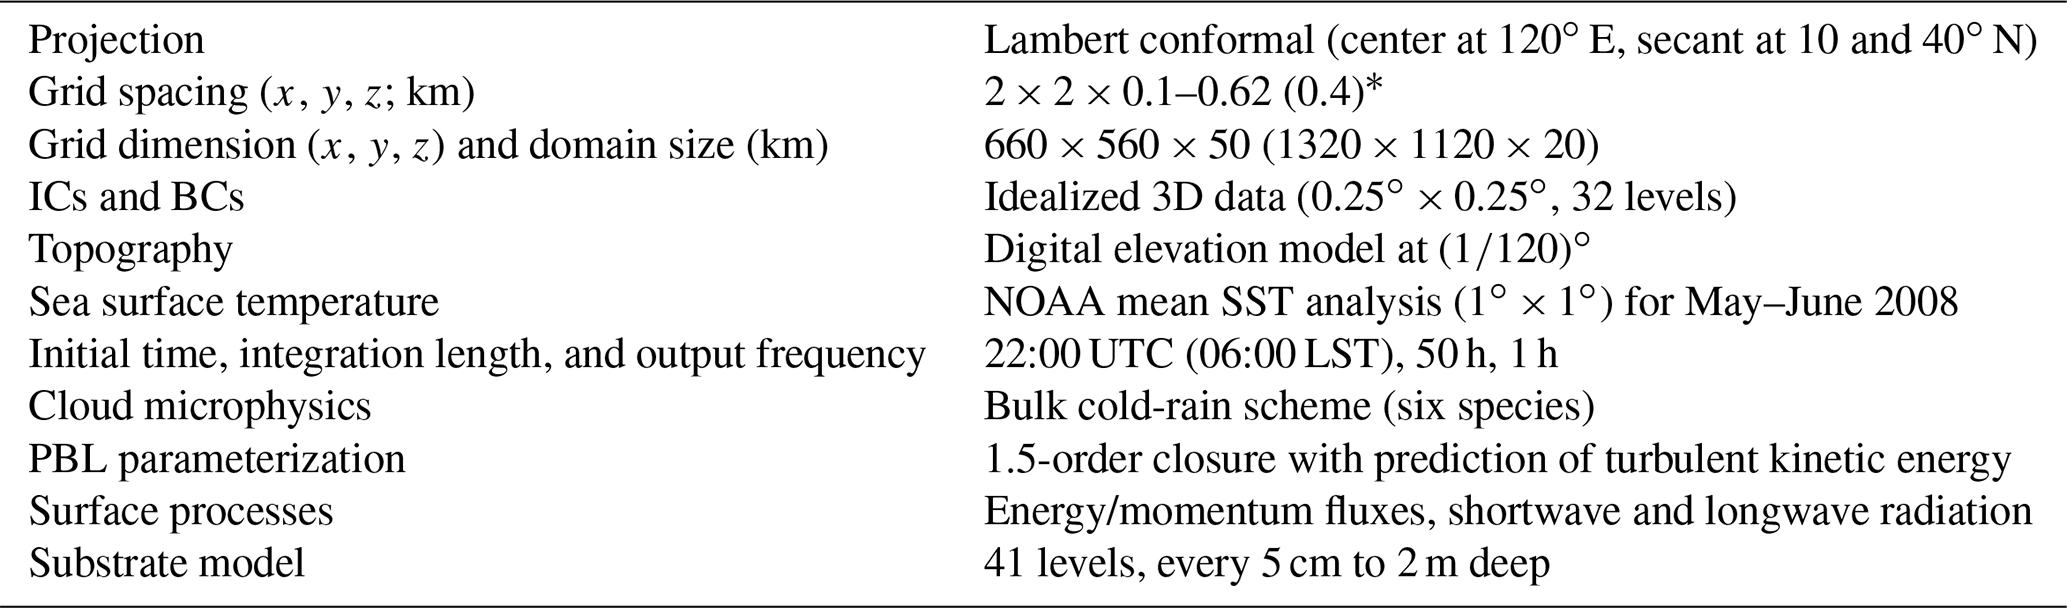
∗ The vertical grid spacing (Δz) of CReSS is stretched (smallest at the bottom), and the averaged spacing is given in the parentheses.
2.2 Idealized initial and boundary conditions
The prescribed and smoothed sounding profiles as described above (Fig. 3e–h; every 25/50 hPa below/above 500 hPa) are used to construct the 3D initial and boundary conditions (ICs and BCs) of the control (CTL) experiment. This reference sounding is assumed to be at 23.5∘ N, 120.5∘ E (near central Taiwan; see Fig. 1). From this point, the geostrophic wind relationship is used to determine the geopotential height (Φ) of a grid every 0.25∘ × 0.25∘ inside the rectangular area of 16–31∘ N, 110–131∘ E at each pressure (p) level (at and above 950 hPa) as follows:
where Vg = (ui,vj), f is the Coriolis parameter, and n is the distance in normal direction (to the left) of the wind. Thus, on each p level, u, v, T, and RH are all uniform, but Φ is not. Below 950 hPa down to the surface, the value of at 950 hPa is used instead of its own level to include friction. As time-invariant conditions are provided during the entire course of model simulation, the BCs are identical to the ICs in the CTL (as well as in each of all other experiments). In addition to the meteorological fields, digital terrain data on a ()∘ grid and the time-mean sea surface temperature (SST) analyzed by the National Oceanic and Atmospheric Administration (NOAA) using optimal interpolation (Reynolds et al., 2002) for May–June 2008 are also provided at the lower boundary (Table 2). These conditions are identical in all model runs.
2.3 The cloud-resolving model
In this study, the Cloud-Resolving Storm Simulator (CReSS) version 2.3 (Tsuboki and Sakakibara, 2002, 2007) is used for all model experiments. The CReSS model employs a non-hydrostatic and compressible equation set and a terrain-following vertical coordinate and is designed to simulate clouds at high resolution. Thus, all clouds (including shallow convection) are treated explicitly in CReSS using a 1.5-moment bulk cold-rain microphysics scheme, which is based on Lin et al. (1983), Cotton et al. (1986), Murakami (1990), Ikawa and Saito (1991), and Murakami et al. (1994) and includes a total of six water species (vapor, cloud water, cloud ice, rain, snow, and graupel). A warm-rain scheme that has no ice phase is also available but not used here. As given in Table 2, the parameterized processes at the sub-grid scale include turbulent mixing in the planetary boundary layer (Deardorff, 1980; Louis et al., 1982), surface shortwave and longwave radiation, and surface momentum and heat fluxes (Kondo, 1976; Segami et al., 1989). Substrate models are also included (Tsuboki and Sakakibara, 2007) both over land (to 2 m in depth) and the upper ocean (to 40 m). The model is open for research, and its further details can be found online (http://www.rain.hyarc.nagoya-u.ac.jp/~tsuboki/cress_html/index_cress_eng.html, last access: 21 April 2021) or in some earlier studies (e.g., Tsuboki, 2008; Wang et al., 2014a, b, 2016).
2.4 Experimental design
In CTL, in which the southwesterly winds are from 240∘ at 10 m s−1 over the depth of 950–500 hPa, the idealized ICs and BCs are provided to the CReSS model, as described earlier, with open boundary conditions. At a horizontal grid size of 2 km, the CReSS model then simulates the atmospheric evolution inside a domain surrounding Taiwan (roughly over 18–28.2∘ N, 112.5–125.8∘ E; Fig. 1 and Table 2), using a configuration similar to previous studies (e.g., Wang et al., 2011, 2014a, b, 2016). To investigate the change in flow regime and rainfall, eight different wind directions and eight different wind speeds are tested for 950–500 hPa: every 15∘ from 180–285∘ and every 2.5 m s−1 from 5–22.5 m s−1, yielding 64 experiments for this purpose. In the Mei-yu season, the southwesterly LLJ rarely exceeds 22.5 m s−1 and certainly not over a vast area if it does (e.g., Chen et al., 2003, 2008, Wang et al., 2016, C.-C. Wang et al., 2021; A.-H. Wang et al., 2021). Thus, the highest wind speed is set to 22.5 m s−1. The ICs and BCs are constructed individually for each experiment with the same T and RH profiles (as in Fig. 3e and h). For each experiment, the wind is fixed at the same direction and speed over 950–500 hPa as prescribed (Table 1, top half) and then varies linearly to 300 hPa, where the same profile further up (as in Fig. 3f and g) is used for all runs. Similarly, the wind gradually reduces in speed and turns to the left below 950 hPa, as described earlier.
Since the moisture content near the surface affects the instability and rainfall production, to further examine its effects, a subset of nine experiments from the above tests, with wind directions of 210, 240, and 270∘ and wind speeds of 10, 15, and 20 m s−1, are selected for this purpose. These combinations of direction and speed are chosen to both include the CTL and provide a wide-enough range of variations for comparison without adding an excessive number of experiments. At the lowest levels from surface to 950 hPa, the RH is changed from 85 % to other values every 7.5 %, from as dry as 55 % to as moist as 100 % (except for 62.5 %). Above 950 hPa, RH values are reduced linearly to 40 % at 500 hPa, and the same RH profile is used above that, as shown for some examples in Fig. 3h (and Table 1, bottom half). These tests thus include an additional 45 experiments (nine wind combinations × five different RH levels besides 85 %).
Starting from 22:00 UTC, each simulation is run for a length of 50 h, which allows for a 2 h spin-up period (22:00–24:00 UTC of day 0) for the flow to adjust to the topography, plus two full-day cycles (days 1 and 2; see Table 2). Essentially, all experiments produce two similar diurnal cycles during 2–50 h; thus the averages over days 1–2 will be shown for discussion (unless specified otherwise).
2.5 Result analysis and comparison
To identify the flow regime associated with each combination of wind direction and speed, the moist Froude number (Frw), which uses virtual potential temperature (θv) and = instead, is computed for each case, as in Chen and Lin (2005b). Compared to the dry Fr, Frw takes into account the effect of moisture on density since the atmospheric environment near Taiwan is often very moist in the Mei-yu season (see Fig. 3). Considering the highest topography in the north–south profile (Fig. 2c), a value of 2.5 km is used for h0. The Nw is also computed for the lowest 2.5 km, while the prescribed wind (same over 950–500 hPa) is used to obtain U (speed of wind component normal to the topography, which is oriented at 16.7–196.7∘). It should be pointed out that strictly speaking, Frw (or Fr) applies only to stable conditions (Nw > 0) with no deep convection. Finally, some real cases of southwesterly flow and daily rainfall are chosen to compare with our idealized results in Sect. 5. For this purpose, the National Centers for Environmental Prediction (NCEP) Global Forecast System (GFS) final analyses (Kalnay et al., 1990; Kleist et al., 2009) at 850 hPa, inside a 2∘ × 2∘ box near Dong-Sha (see Fig. 1), are used to identify and classify the southwesterly flow. Rain-gauge data (Hsu, 1998), satellite imagery and radar composites, and rainfall estimates (Gourley et al., 2001) are used for comparison with our model results. Only the 00:00 UTC data on each day in the Mei-yu season in 2012–2014 are used.

Figure 4The distributions of sea-level pressure (hPa, isobars, every 1 hPa; ocean only), surface wind (m s−1, wind barbs; half barb = 5 m s−1 and full barb = 10 m s−1), and hourly rainfall (mm, color) at intervals of 3–5 h from (a) 0 h to (l) 43 h in the CTL experiment. The height contours at 0.25 and 1 km are also drawn over land (gray contours). The local standard time (LST) is UTC + 8 h (i.e., 00:00 UTC = 08:00 LST).
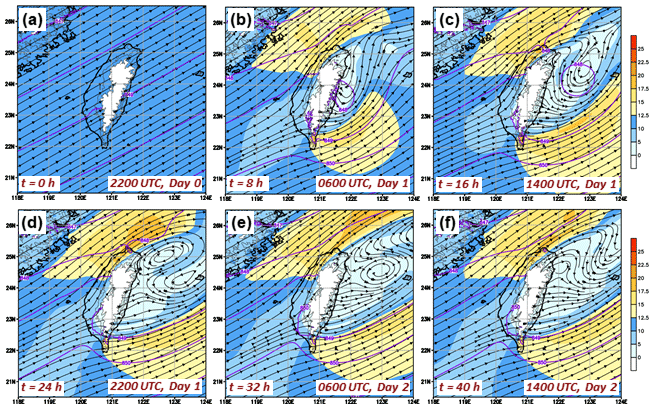
Figure 5The distributions of pressure (hPa, isobars, every 1 hPa), streamlines, and wind speed (m s−1, color) at the height of 1481 m every 8 h from (a) 0 h to (f) 40 h in the CTL experiment. The height contours at 1481 m (gray) are also drawn. In Taiwan, the LST is UTC + 8 h.
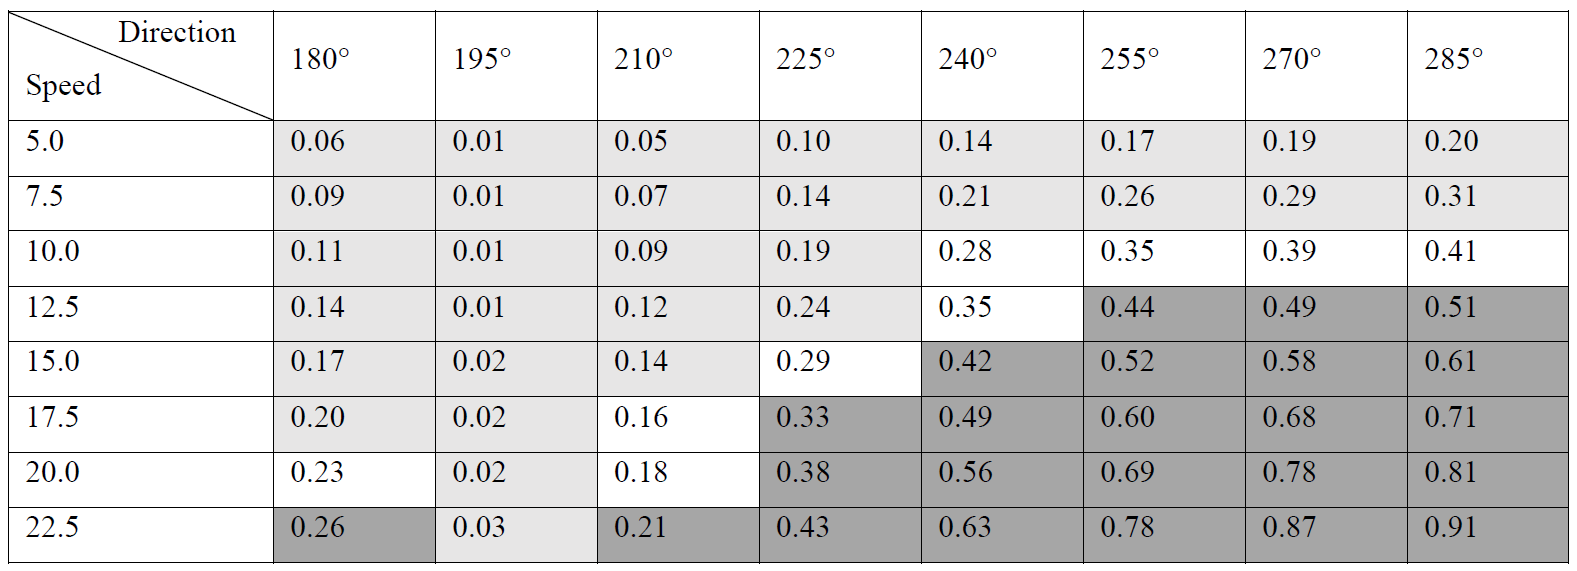
Table 3The values of moist Froude number (Frw) in the experiment set with prescribed southwesterly wind direction (∘, column) and speed (m s−1, row). Cells filled with light gray indicate a rainfall regime mainly from island circulation (with lower Frw), and those filled with medium gray indicate a regime dominated by terrain uplift (with higher Frw), based on the simulated daily rainfall pattern over Taiwan. The cells with no color indicate mixed rainfall from both mechanisms.
3.1 Control experiment
The result of the CTL run is first examined in this section in order to characterize the behavior of the model under the idealized conditions and confirm that it behaves as designed. In Fig. 4, horizontal wind and pressure fields at the surface at selected times every 3–5 h are presented, and those at the model level of 1481 m (close to 850 hPa) are shown in Fig. 5 at longer intervals. At the initial time (t = 0 h), it can be confirmed that the winds are uniform and parallel to the isobars at 1481 m (Fig. 5a) but cross the isobars at an angle of about 15∘ at the sea level (Fig. 4a). However, within a few hours into the integration (Figs. 4b, c, and 5b), the flow upstream quickly decelerates and separates into two branches to flow around the topography due to the blocking effect once it encounters the obstacle, as expected since the Frw is only 0.28 in CTL (see Table 3). At the two ends of Taiwan, the flow converges and accelerates to form barrier jets near the northwestern coast and off southeastern Taiwan (Figs. 4c–f and 5c, d), in agreement with many earlier studies (e.g., Li and Chen, 1998; Yeh and Chen, 2002, 2003; Wang et al., 2016). This low-level flow and pressure pattern remain rather steady through time after model spin-up in CTL (Figs. 4 and 5) except for eastern Taiwan where a leeside low and vortices develop and evolve (e.g., Wang and Chen, 2002, 2003). As rather transient phenomena, the formation of vortex pairs and vortex shedding are also clearly visible in Fig. 5. Overall, the model behaves as designed in the CTL, and the results are consistent with many previous studies (also Sun and Chern, 1993, 1994).
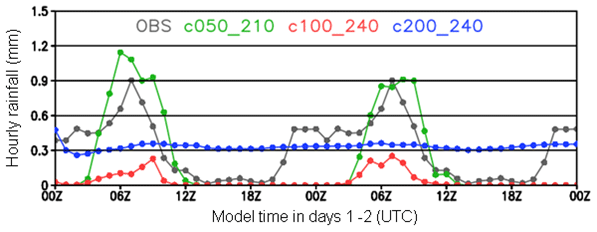
Figure 6The time series of spatially averaged hourly rainfall (mm) over Taiwan in the observations (gray) and three model experiments: with uniform southwesterly winds at 5 m s−1 from 210∘ (green), at 10 m s−1 from 240∘ (red, i.e., the CTL), and at 20 m s−1 from 240∘ (blue). The observation is the mean diurnal cycle (repeated twice) from the dates of the sounding data (27–29 May and 1, 4, and 11 June 2008).
The rainfall in CTL occurs mostly over Taiwan during 03:00–11:00 UTC (or 11:00–19:00 LST – LST is UTC + 8 h; Fig. 4c, d and i, j), mainly in local afternoon, also in agreement with the climatology and many earlier studies (e.g., Chen et al., 1999; Kerns et al., 2010; Ruppert et al., 2013) but in contrast to previous idealized results without diurnal effects in the literature (e.g., Chu and Lin, 2000; Chen and Lin, 2005a, b; Sever and Lin, 2017). Over the ocean, very little rain is produced in CTL with rather uniform flow upstream. This suggests the sole role of the terrain in triggering convection and leading to rainfall through either its dynamical or thermodynamic effects (or a combination of both), as designed in this study. The time series of hourly rainfall averaged over Taiwan also indicate two similar diurnal cycles in CTL (Fig. 6, red). However, compared to the observed rainfall cycle (gray) compiled from the six dates of the sounding data, the model seemingly produces too little rainfall. This is understandable and expected because the rainfall mechanisms in the model are only those associated with Taiwan's topography by design, whereas the clouds and rain in real events can also form by other mechanisms (such as fronts) and move in from surrounding oceans. For example, migratory rainfall systems moved in from the west during the morning on both 29 May and 4 June, producing a mean hourly rainfall of ∼ 0.5 mm during 22:00–05:00 UTC (06:00–13:00 LST) before the afternoon peak in the observed cycle. Such systems (and their enhancement by the topography) are largely absent in our idealized simulations with uniform flow and no disturbances.
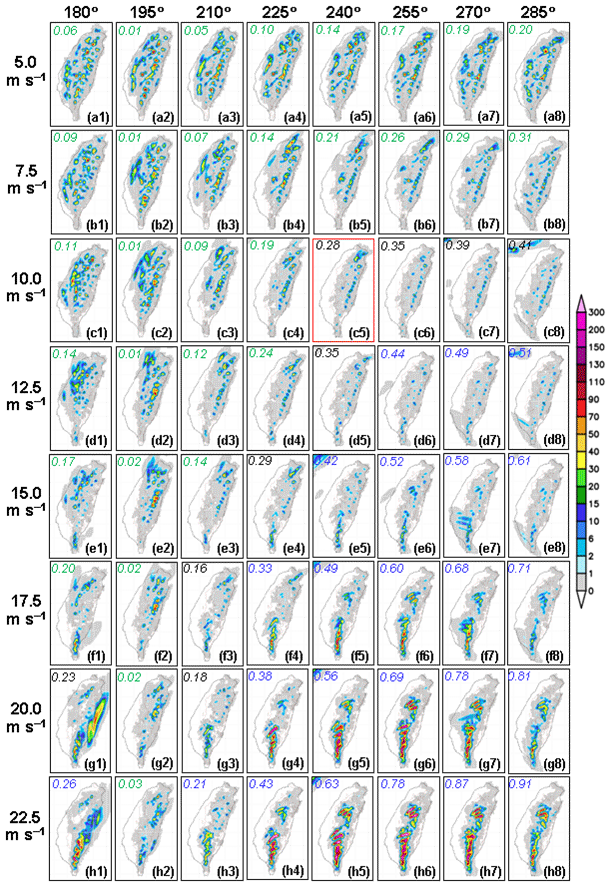
Figure 7Mean daily rainfall distribution (mm, per 24 h, scale on the right) over Taiwan in the 8 × 8 experiments of different wind directions (every 15∘ from 180–285∘) and speeds (every 2.5 m s−1 from 5.0–22.5 m s−1), as labeled on top (for direction) and the left (for speed) from (a1) to (h8). The averages are over 2 d (2–50 h). The CTL experiment (240∘, 10 m s−1) is shown in (c5) using a red box. The value of Frw is labeled in the upper-left corner in each panel, and blue, green, and black colors indicate the rainfall regime of terrain uplift, island circulation, and mixed, respectively.
3.2 Rainfall regimes of uniform southwesterly flow
The (averaged) daily rainfall distributions in the 64 experiments of eight wind directions and eight wind speeds are presented in Fig. 7, in which the Frw is also given (and in Table 3). Nearly parallel to the topography of Taiwan (along 196.7∘), the flow from 195∘ gives near-zero Frw values regardless of the speed (Table 3). Thus, the flow from 180∘ (southerly) and 210∘ (south-southwesterly) have slightly larger Frw values that are comparable to each other and also increase with wind speed (and up to about 0.25). As the flow direction becomes more westerly and perpendicular to the topography, the Frw further increases to a maximum value of 0.91 at 22.5 m s−1 from 285∘ (Table 3). Due to the high terrain of Taiwan (h0 = 2.5 km), the Frw never reaches unity. It is perhaps also worthwhile to note that, at a near-surface RH of 85 % in these experiments, the Frw is only about 4 % larger than the dry Fr, so their differences are rather small.
Based on the rainfall pattern and amount in Fig. 7, the results here are classified into three regimes: The low-Frw regime, the (relatively) high-Frw regime, and a mixed regime in between. In the low-Frw regime, the island circulation arising from the thermodynamic effects is the main driver causing rainfall over one or both sides of the mountain (by upslope winds) and possibly also over the western plains (by see breeze; see Fig. 2b). This regime includes all conditions with lower wind speeds of 5.0–7.5 m s−1 and at a higher wind speed when the flow is at a small angle to the terrain (including from 195∘), with a Frw of about 0.3 at most (Table 3). In general, the amount and spatial coverage of the rainfall increase in this regime when the flow is weak and at a smaller angle (nearly parallel) to the topography (Fig. 7), and thus the conditions are favorable for the development of a stronger island circulation (e.g., Akaeda et al., 1995; Chen et al., 1999; Kerns et al., 2010). Depicted in Fig. 8a and b as an example for the case of 5 m s−1 from 210∘, one can see that its diurnal temperature range is indeed relatively large, with convergence/rainfall during daytime (Fig. 6, green) associated with sea breeze and upslope winds (also Fig. 7a3). Incidentally and interestingly, with more daytime rainfall, this experiment produces a diurnal cycle more similar to the observations than the control run (Fig. 6).
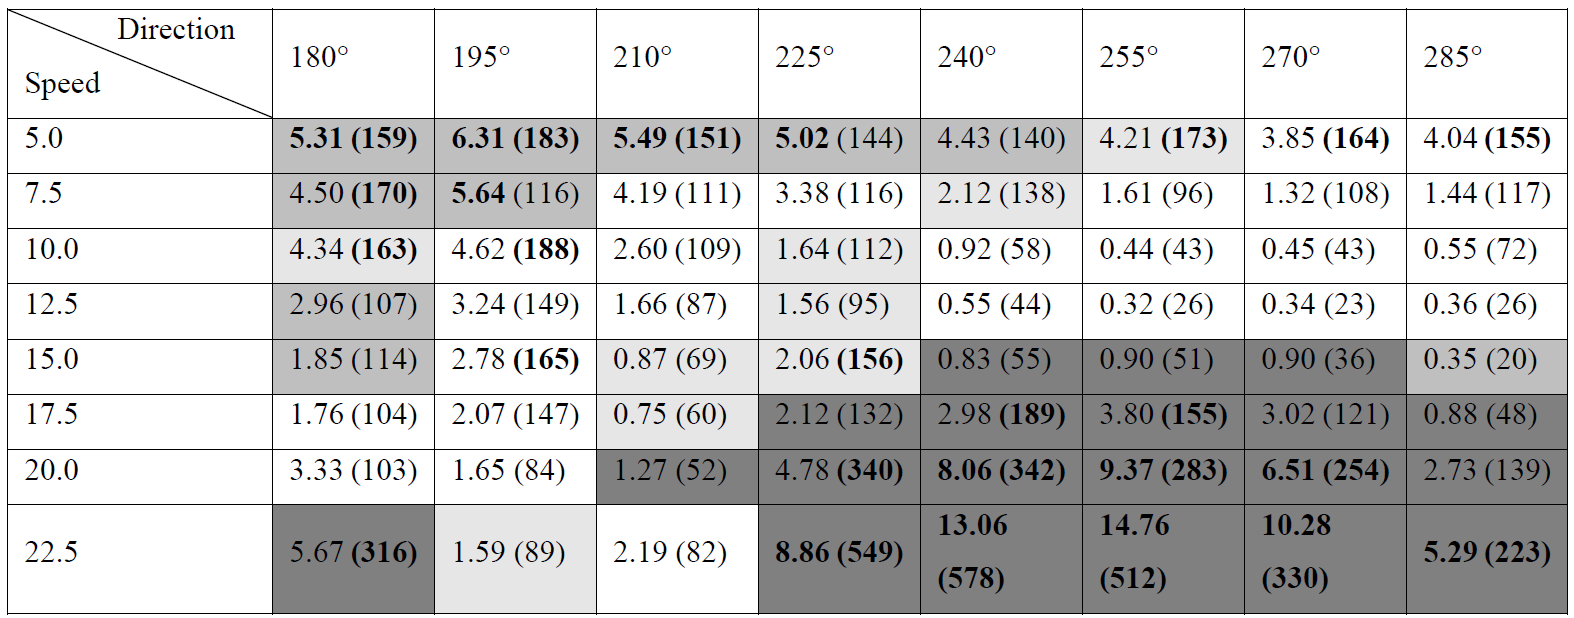
Table 4The daily mean rainfall over Taiwan (mm) and the peak amount (parentheses) in the experiment set with prescribed southwesterly wind direction (∘, column) and speed (m s−1, row). The areal-mean (peak) values ≥ 5 (150) mm are in boldface. Cells filled with light, medium, and dark gray and no color indicate that the peak amount (all in mountain elevation) occurs in the subregion of northern, central, southern, and eastern Taiwan (see Fig. 2b), respectively.
The second mode of rainfall is with a relatively high Frw of roughly 0.4 and above when the flow is at least 15 m s−1 in speed and impinges on the terrain at a large angle of ≥225∘ (Table 3 and Fig. 7). Under such scenarios, significant rainfall occurs in the mountain interiors of central Taiwan (near the intersection of SMR and CMR) and southern Taiwan along the ridge of the CMR (Fig. 7, bottom half), producing a pattern not unlike the climatology (see Fig. 2a). The rainfall also increases with wind speed and reaches a peak amount when the wind direction is near 255∘. Evidently, the dynamical effect of terrain uplift is the dominant rain-producing mechanism in these high-wind conditions as the rainfall becomes persistent with small diurnal variations. Corresponding to the case of 20 m s−1 from 240∘ (Fig. 6, blue), Fig. 8e and f also indicate convergence in the mountains and a relatively small diurnal temperature range (see Fig. 7g5). At the highest speed of 22.5 m s−1, such orographic rainfall can also take place when the flow is at a small angle (from 180∘ or 210∘) with Frw below 0.3 (Fig. 7h) since the southernmost part of the CMR is not as high (see Fig. 2). Note, nevertheless, that when the flow is from 180∘ (210∘), the eastern (western) slope of the CMR is the windward side and where the rainfall mostly occurs.
In between the above two rainfall regimes, there is a third, mixed regime of both mechanisms and rainfall characteristics, as also labeled in Table 3 (cells with no color). Such a mixed regime occurs at high speed (≥17.5 m s−1) but small angles with low Frw (about 0.15–0.25) or at medium speed (10–15 m s−1) but larger angles with Frw around 0.3–0.4 (including the CTL; see Figs. 7c5 and 8c, d). Thus, the Frw values to separate the two major rainfall regimes are not the same and are smaller (greater) when the flow is at a smaller (larger) angle to the terrain. Also, the more perpendicular the flow is to the topography in the mixed regime, the rainfall tends to be less, although the differences are often relatively small. Presumably, this is because of less of a contribution from the island circulation, as well as a stronger blocking effect on the flow (even though the Frw increases).
3.3 Rainfall regimes and their rainfall amounts
In this subsection, the three rainfall regimes are further discussed more quantitatively and with the information on the subregion of rainfall maximum in Taiwan (see Fig. 2b). Table 4 gives the daily mean rainfall (spatially averaged) and peak amounts over Taiwan, as well as the subregion where the peak amount occurs in each of the 64 experiments.
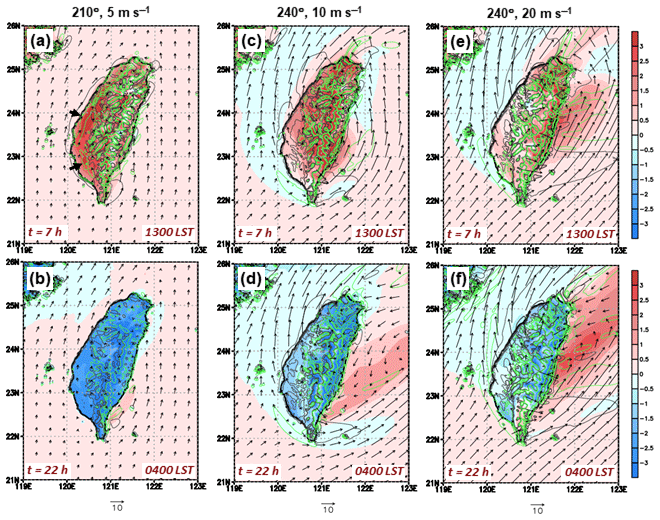
Figure 8Surface wind vectors (m s−1, at 10 m height, reference length at bottom), horizontal convergence/divergence (10−5 s−1, green/gray contours, at ± 5 and ± 30 × 10−5 s−1), and surface air temperature (∘C, at 1.5 m height) difference (color, scale to the right) from 08:00 LST (t = 2 h) to (a) 13:00 LST (t = 7 h) and (b) 04:00 LST (t = 22 h) of the first cycle for the case of 5 m s−1 and 210∘. (c–f) Same as in (a, b) except for the case of (c, d) 10 m s−1 and 240∘ and (e, f) 20 m s−1 and 240∘. The arrows in (a) mark the convergence associated with sea breeze.
When the wind speed does not exceed 12.5 m s−1, the mean rainfall over Taiwan decreases with increasing wind speed (Table 4) across the entire spectrum of wind directions from 180–285∘, and this covers mainly the low-Frw regime. Compared to other directions, the flow at 195∘ always produces the highest daily mean rainfall in Taiwan (under this regime), which can be up to 6.31 mm at 5 m s−1 (Table 4). This is however only slightly higher than those values associated with other wind directions, which are expectedly less relevant at such a low speed. When the wind speed goes slightly higher to ≥7.5 m s−1, the differences between 195∘ (3.24–5.64 mm) and other directions become more evident (Table 4). Even at 15–17.5 m s−1, the flow from 195∘ (low-Frw regime) still produces more rain than 180∘ and 210∘ (possibly in a different regime), although its mean value further decreases. Thus, at low wind speeds, the most rainfall is produced by the flow from 195∘ at 5 m s−1, with a maximum daily amount of 183 mm in central Taiwan. Similar conditions produce slightly less rainfall, with the peak value (∼ 150 mm) also often in central Taiwan (Table 4) and likely linked to the higher mean elevation and more compact topography (i.e., closer proximity of sea breeze and upslope winds; see Fig. 2b). As the wind direction changes from southerly to westerly, the sea breeze and upslope winds on the western side become less able to develop (see Fig. 7), especially when the wind speed also increases higher, and the region of maximum rainfall shifts to northern or eastern Taiwan (Table 4). These two subregions tend to be better shielded by the high topography under westerly flow, and upslope winds there are apparently less affected. Thus, even at the same flow speed, the rainfall amount and pattern also exhibit considerable sensitivity to wind direction (e.g., Metzger et al., 2014). Similarly, at higher wind conditions of 10–17.5 m s−1, the island circulation becomes more difficult to develop over the western part of the island (especially over the southern plains; see Fig. 8), and the rainfall areas shift toward the northern and eastern subregions with less overall amount, in general agreement with Kirshbaum (2011), even though the peak value can remain quite significant (around 100–180 mm). Here, it is also noted that the peak rainfall occurs in the elevation range of ≥1 km (over the mountains) in its respective subregion in all 64 runs without any exception (Table 4).
In the high-Frw regime where the convection triggered by mechanical uplift over the mountains is the major source of rainfall, the conditions are somewhat more straightforward and less complicated. From 12.5–20 m s−1, the overall rainfall in Taiwan increases with the speed for flows coming from 210–285∘ as expected, with only a few exceptions (Table 4), and generally maximizes at 255∘ as mentioned. Nevertheless, at 12.5 m s−1, the flow from 255–285∘ is at a large angle and close to normal to the topography and thus possesses a relatively high Frw (around 0.5), but the mean rainfall in Taiwan (below 0.4 mm) is among the lowest in all experiments. This sensitivity to wind direction indicates that significant blocking by the terrain under such conditions can deflect the prevailing flow and shift the rainfall area further upstream (and offshore; see Fig. 7d), as shown by Wang et al. (2005), even though an increase in Frw (from lower wind speeds) favors the flow-over regime in theory. As a result, the small peak values (∼ 25 mm) take place in the eastern subregion (as for the wind-speed cases of 10 m s−1). Therefore, the blocking effect is another factor that can come into play and affect the rainfall pattern (and cannot be realistically simulated in 2D framework). As the wind speed and Frw further increase (to ≥ 17.5 m s−1), the mechanical uplift and flow-over regime become more dominant, and both the mean rainfall and its peak value increase rapidly with wind speed (Table 4) to maxima of 14.76 mm (at 255∘) and 578 mm (at 240∘) at the highest speed of 22.5 m s−1, respectively. The locations are almost exclusively in the mountain interior of southern CMR. Similar heavy to extreme rainfall events with daily maximum in excess of 500 mm over the mountains are also observed in the Mei-yu season (e.g., Wang et al., 2016). Finally, as suggested in Table 4, strong southern flow (at 180∘) can also lead to significant rainfall in eastern or southern Taiwan, up to a mean value of >5.5 mm and a peak amount of over 300 mm.
In the mixed regime, the overall rainfall tends to be less with a peak value in eastern Taiwan when the wind is around 10 m s−1 and from 240–285∘ (Tables 3 and 4), as mentioned earlier. With the flow at 15 m s−1 from 225∘ and at 17.5 m s−1 from 210∘, the north subregion located at the leeside receives the most rainfall, which peaks at 156 mm in the former case. For the two cases with the flow from either 180∘ or 210∘ at 20 m s−1, a transition rainfall pattern occurs (see Fig. 7g) from a flow-around to a flow-over regime, and the peak rainfall is produced in western and eastern subregions (Table 4). Thus, the peak rainfall area is typically at the leeside in the mixed regime, similar to Metzger et al. (2014), while the detailed rainfall distribution can be quite variable and rather complex (see Fig. 7).

Figure 9Spatial-averaged mean daily rainfall (mm) at the three elevation ranges (plain, slope, and mountain) over Taiwan and its four subregions in three experiments, with uniform southwesterly flow (a) from 210∘ at 7.5 m s−1, (b) from 225∘ at 12.5 m s−1, and (c) from 255∘ at 20 m s−1. Note the difference in the scale of vertical axes.
To summarize the above results, the average daily rainfall in the three elevation ranges over Taiwan and the four subregions is plotted in Fig. 9 as examples for three cases with southwesterly flow from 210∘ at 7.5 m s−1 (Frw = 0.07), 225∘ at 12.5 m s−1 (Frw = 0.24), and 255∘ at 20 m s−1 (Frw = 0.69). In the first case (Fig. 9a) in which the island circulation controls rainfall production, considerable rainfall is received in northern, central, and eastern Taiwan and in all three elevation ranges. At 12.5 m s−1 from 225∘, the second case has a Frw of 0.24 and is close to the transition, and the major rainfall area is in northern Taiwan at the leeside (Fig. 9b). Finally, when the Frw is large, heavy rainfall occurs in the mountains over southern and central Taiwan through terrain uplifting (Fig. 9c).
Under a uniform and fixed southwesterly flow, the amount of low-level moisture acts as another influencing factor, although intuitively its primary role is to change the rainfall amount. Therefore, the facet of moisture content is investigated in this section to complement the study thus far and make it more complete. As discussed in Sect. 2 and shown in Fig. 3h and Table 1 (bottom half), a total of 45 experiments are performed to change the near-surface RH inside the planetary boundary layer (PBL) from 85 % to a higher value of 92.5 or 100 % and a lower one of 77.5, 77, or 55 %. These five sets of runs are for fixed southwesterly flows at 10, 15, and 20 m s−1 and from 210, 240, and 270∘ (nine runs in each set of fixed RH). As given in Table 5, the near-surface RH value affects the CAPE, which can be over 5500 J kg−1 for RH = 100 % and reduces to 464 J kg−1 for RH = 70 % or even zero for RH = 55 %. On the other hand, the impacts of RH on Frw are at most only about ± 1 % from those given in Table 3 and are therefore negligible. For this reason, the same Frw values as before are used for discussion.
Table 5The CAPE values of experiments with different near-surface moisture contents.
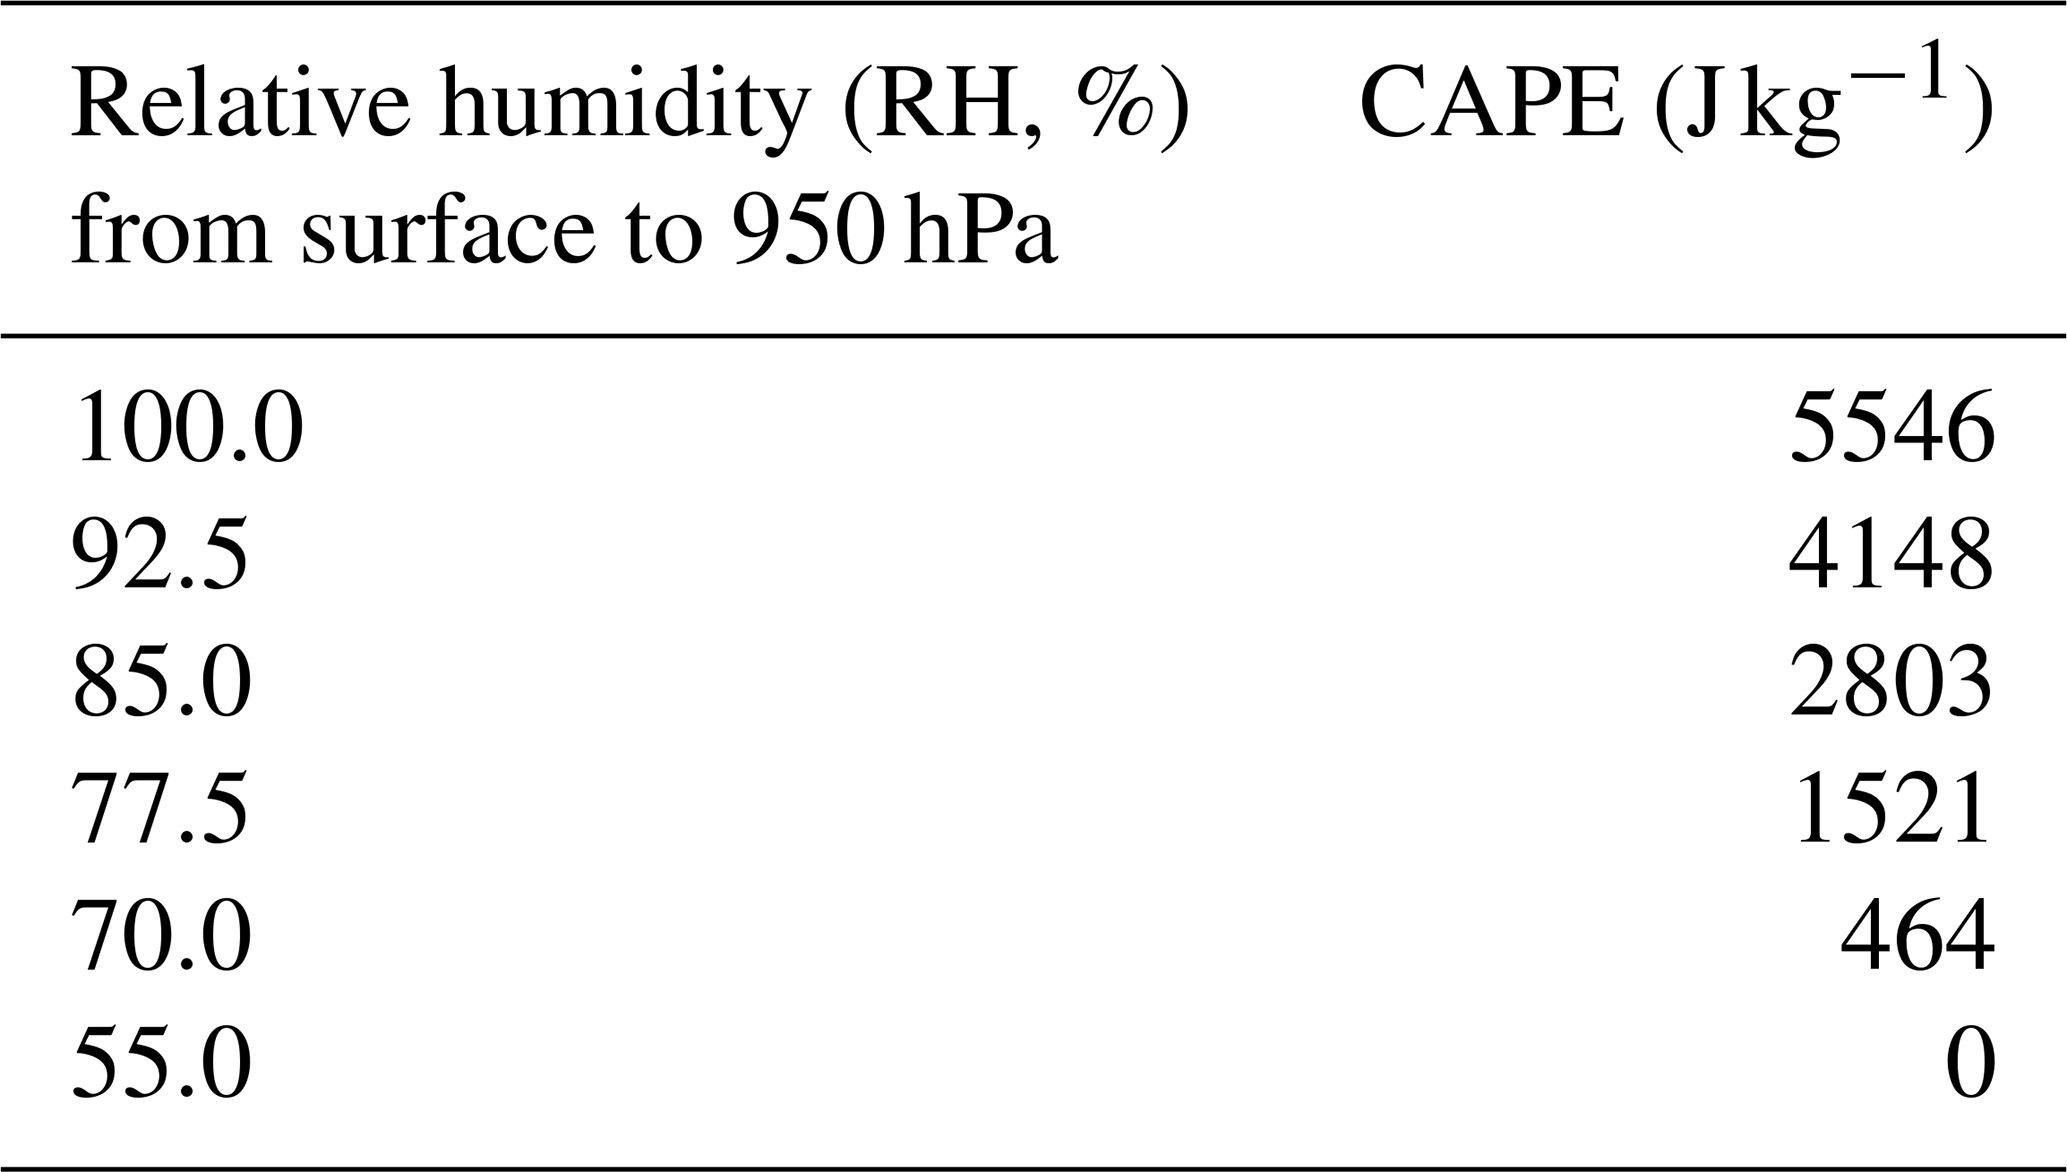
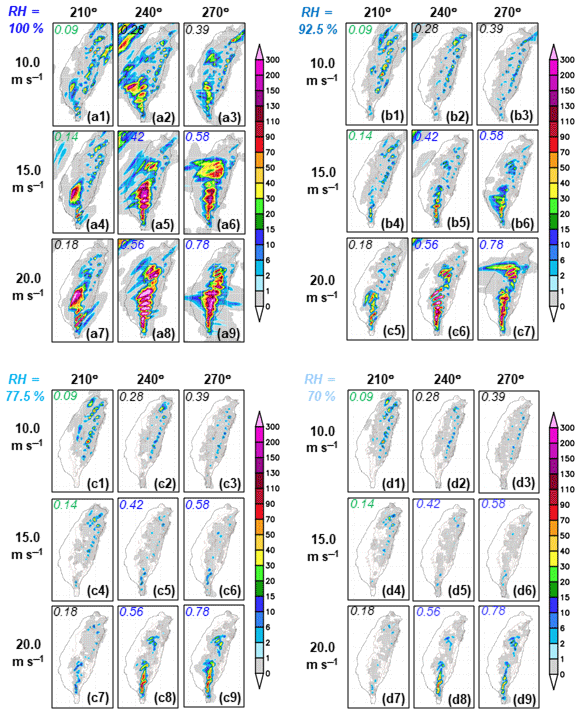
Figure 10As in Fig. 7 but for the four sets of 3 × 3 experiments of different near-surface RH values of (a) 100 %, (b) 92.5 %, (c) 77.5 %, and (d) 70 %. The wind direction (210, 240, or 270∘) and speed (10, 15, or 20 m s−1), as well as the value of Frw, are all labeled.
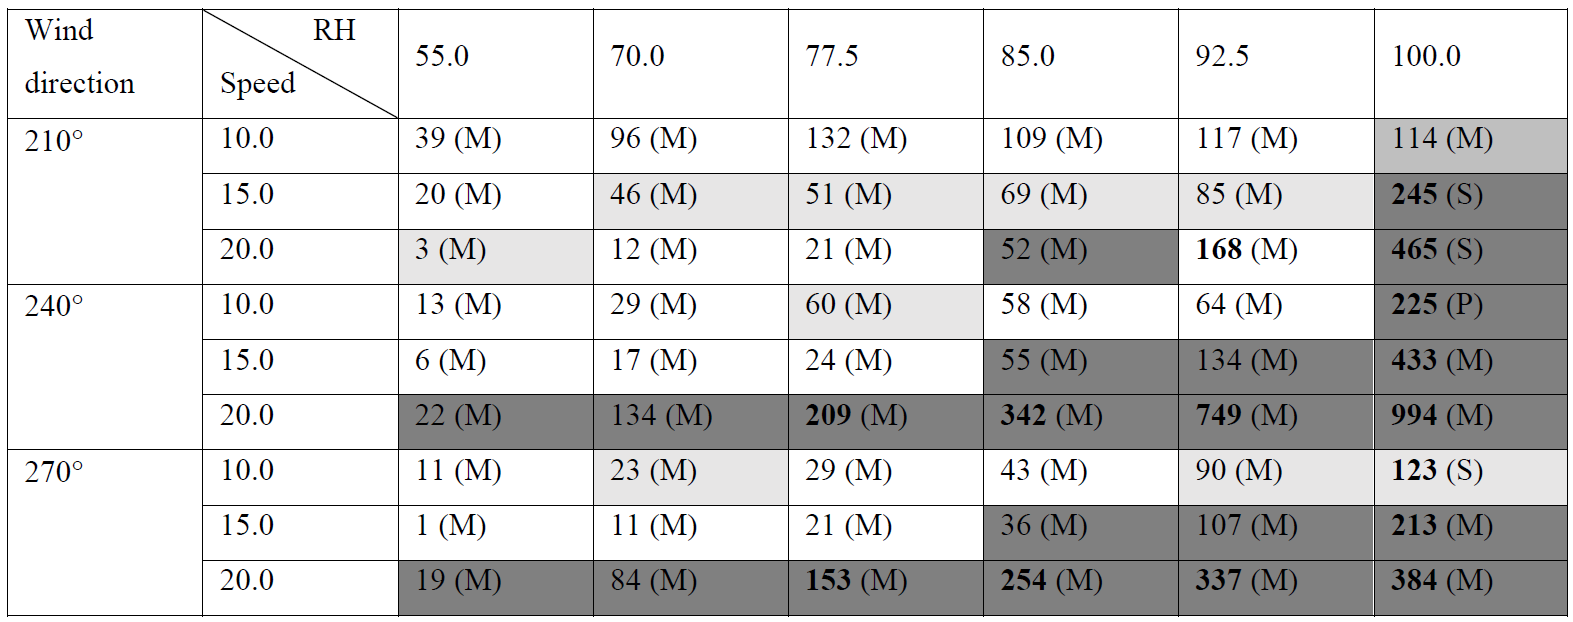
Table 6As in Table 4 but for the daily peak rainfall over Taiwan (mm) in all the experiment set to test the effects of near-surface moisture. The results for different wind speed (m s−1) and RH (%) from top to bottom are those with a wind direction from 210, 240, and 270∘. The background colors of cells and boldface have the same meaning as for the subregions in Table 4, and the parenthesis gives the elevation range (P: plain; S: slope; or M: mountain).
4.1 Effects of moisture increase
The results of mean daily rainfall distributions in the four sets of different near-surface RH values from 100 %–70 % (excluding 85 %) are presented in Fig. 10 and can be compared with the corresponding panels in Fig. 7. As the RH is altered, the changes in peak rainfall amount and its subregion are listed in Table 6 and can be compared with Table 4. In cases when the RH and CAPE are increased, the rainfall amount and spatial coverage both increase as expected, particularly at higher wind speed (15–20 m s−1), and near-surface RH reaches 100 % (Figs. 7c, e, g and 10a, b, Table 6). From 210∘ at a smaller angle, a saturated condition promotes convection at the windward side of the CMR by strong flow and shifts the peak rainfall to southern Taiwan (Table 6, also all in the mountain subregion). At an angle more perpendicular to the terrain (240 and 270∘), higher RH also increases the rainfall at the windward side, especially in central and southern Taiwan, and also over the nearby oceans in the upstream area (Fig. 10a and b). In some cases, east–west-oriented rain belts are produced across Taiwan from the convection triggered upstream, including the plain areas. While the subregion of peak rainfall remains at southern Taiwan in such a scenario (≥ 240∘ and 15–20 m s−1), the peak daily rainfall amount can reach 749 mm for the case of RH = 92.5 % and further to 994 mm for RH = 100 % (both at 20 m s−1 from 240∘) (Table 6). Thus, except for more rainfall, the increase in near-surface RH also plays a role in triggering convection more easily over the windward sides and upstream areas and subsequently in promoting rainfall in those regions over and near Taiwan.
4.2 Effects of moisture decrease
Three sets of 3 × 3 experiments are also performed to test the response when the near-surface RH is reduced from 85 % to 77.5, 70, and 55 %. In these tests, the changes in rainfall over Taiwan are quite straightforward, including a reduction in both amount and areal extent, without much difference in its general pattern (Figs. 7c, e, g and 10c, d, Table 6). Besides a reduced rainfall, some noticeable deviations include a shift in the maximum rainfall subregion from southern to eastern Taiwan under the flow of 210∘ at 20 m s−1, as the RH is lowered from 85 %–77.5 % and less. In these cases of RH = 70 %–77.5 %, the peak rainfall is located at the southernmost part of CMR (Fig. 10c7 and d7) and classified as being in the eastern subregion by our simple method (see Fig. 2b). Nevertheless, with a reduced RH, the convection becomes more difficult to be triggered and thus less active at the windward side, and thus a lowered peak amount and a shift in its subregion are caused. Other differences are more subtle and often linked to slightly different responses of rainfall centers. Thus, the findings here are also in agreement with those in the previous subsection with increased RH.
Although the results of the present study are idealized simulations with prescribed flow, it is perhaps worthwhile to explore how applicable these results are, with actual topography, to the real atmosphere in this section. In the literature, none of the previous idealized simulations attempted such a comparison (Sect. 1). In this study, a wide spectrum in the combinations of wind direction, speed, and moisture amount are simulated, and some conditions (such as low moisture content) are rare and unavailable in observations. Eventually, three sets of scenarios, with two to three cases in each, are selected below for comparison: flows with increasing speed from 210∘ in low-Frw regime (Frw ≤ 0.12), flow with increasing angle from low-Frw to almost the mixed regime (Frw ≤ 0.26), and from low-Frw to high-Frw regime at 210–240∘ (Frw up to 0.56). However, it should be stressed that the conditions are often much more complicated in real events, in which various disturbances may exist and the flow is neither horizontally uniform, steady in time, nor the same as the prescribed initial state or structure during the simulation. Therefore, the focus of our comparisons is on whether similar changes in rainfall pattern are found in both the model and observations as a response to the changing flow conditions and not necessarily on how closely the model results resemble the observations, particularly where larger differences exist in their conditions.
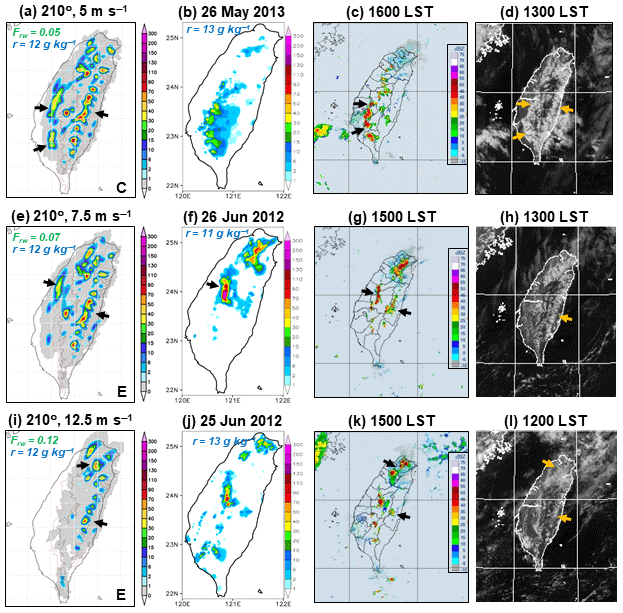
Figure 11Comparison between results of idealized daily rainfall distributions (mm) in this study (first column) and real events on specific dates under observation, including QPESUMS (mm, second column) and radar composite (dBZ, third column) and visible cloud imagery from MTSAT-2 (fourth column) at the selected time on the same day (as labeled) for the flow direction of 210∘ in the low-Frw regime. The three idealized wind speeds include (a) 5 m s−1, (e) 7.5 m s−1, and (i) 12.5 m s−1, and the corresponding dates under observation are (b–d) 26 May 2013, (f–h) 26 June 2012, and (j–l) 25 June 2012, respectively. The values of Frw and near-surface mixing ratio (g kg−1, top left), as well as the subregion of peak daily rainfall (N, C, S, or E; lower right), in the idealized results are also labeled. The arrows mark features of interest (see text). All observations are from the CWB, and the QPESUMS are also from the National Science and Technology Center for Disaster Reduction (NCDR).
5.1 Flow from 210∘ in low-Frw regime
The comparison between model-simulated daily rainfall and observations in this low-Frw scenario is shown in Fig. 11 for the southwesterly flow from 210∘ at three different wind speeds: 5, 7.5, and 12.5 m s−1. The three corresponding dates in the observations are 26 May 2013 and 26 and 25 June 2012 following the order so chosen because they also exhibited 850 hPa winds (in NCEP analyses) matching the specified conditions using the method described in Sect. 2.5. The observations include the Quantitative Precipitation Estimation and Segregation using Multiple Sensors (QPESUMS; Gourley et al., 2001), which is derived from the four land-based radars (see Fig. 2b) and calibrated by rain-gauge data over land (Hsu, 1998) over 00:00–24:00 UTC and radar composite and visible cloud imagery from the geostationary Multi-functional Transport Satellite-2 (MTSAT-2) at selected times on the same day to depict convection.
As the flow direction remains at 210∘, the Frw is proportional to wind speed but still very small at 0.05, 0.07, and 0.12, so the thermal effect and island circulation clearly dominate (Fig. 11a, e and i), similar to the undisturbed periods in Ruppert et al. (2013). While the near-surface moisture might differ slightly, the satellite cloud imagery at noon or 13:00 LST shows patterns of daytime convection on both sides of the topography that bear much similarity to the model simulations, including the cells (arrows) along the eastern slopes of the CMR (Fig. 11d, h, and l). However, the rainfall/convection over the eastern slopes is depicted neither in the QPESUMS nor the radar composite because (1) the rain gauges are scarce along the mountain ridges and over the eastern slopes, and (2) none of the four radars have a clear view of the eastern slopes at lower elevation angles due to terrain blockage (Fig. 2b; e.g., Chen et al., 2013). Thus, the agreement in the eastern subregion does not appear as good when rain gauge data or radar observations/estimates are used. In the three cases, as the wind speed increases from 5–12.5 m s−1, the model results indicate a gradual shift in rainfall in western Taiwan that is linked to the island circulation (sea breeze) from southwestern toward central Taiwan and then northern Taiwan (arrows), a phenomenon that can also be seen in the QPESUMS and radar data (Fig. 11). More specifically, some rainfall is produced along the sea-breeze front, about 50–65 km inland over the southern plains, when the flow is weak at only 5 m s−1 (arrows), and such rainfall shifts to central Taiwan at 7.5 m s−1 and further vanishes or weakens at 12.5 m s−1, in which the rainfall mainly occurs in northern (and eastern) Taiwan. The model results also suggest a reduction in overall rainfall in Taiwan, including that along the eastern slopes, in reasonable agreement with satellite cloud imagery (Fig. 11). Overall, the above tendency captured in the model is in good agreement with the satellite observations and very encouraging. However, in some cases the model does not produce enough rainfall in the mountain regions of Taiwan. As noted earlier, such discrepancies can be the result of many differences between idealized and real flow conditions. In the real events, some rainfall occurrence (e.g., afternoon convection) may also be linked to different preconditioning of the local environment (e.g., Nicholls et al., 1991; Walser et al., 2004; Wang et al., 2011), i.e., what happened or did not happen on the previous day. Of course, such differences are not considered in the idealized framework.
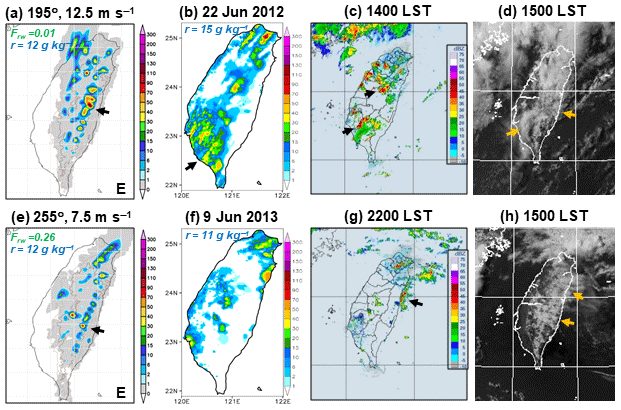
Figure 12As in Fig. 11 but between idealized results and observations (source: CWB and NCDR) for different flow directions from parallel to more perpendicular in the low-Frw regime. The two idealized cases are (a) 12.5 m s−1 from 195∘ and (e) 7.5 m s−1 from 255∘, and the corresponding dates under observation are (b–d) 22 June 2012 and (f–h) 9 June 2013, respectively.
5.2 Flow with an increasing angle to topography
Two cases in the second set are compared in Fig. 12 for the combinations of 12.5 m s−1 from 195∘ and 7.5 m s−1 from 255∘. The values of Frw are 0.01 and 0.26, while corresponding dates under observation are 22 June 2012 and 9 June 2013. These conditions are still in the low-Frw regime, but they are closer to the mixed regime (especially the latter case), and the increase in Frw mainly comes from the change in flow direction, from a small to a larger, more perpendicular angle to the topography, while the CTL can be considered to be in between them (see Fig. 7c5). The model simulation for the flow at 12.5 m s−1 from 195∘ (Fig. 12a) is not unlike the result of 7.5 m s−1 and 210∘ (see Fig. 11e) but without the rainfall by sea breeze over the central plains. When the Frw increases from almost zero to 0.26 as the prevailing flow is turned at a larger angle (but at a slower speed), the model produces less total rainfall, and the main rainfall regions change from central-northern Taiwan to eastern Taiwan (Fig. 12a and e) presumably due both to a suppression to local circulation and an increase of blocking effect. This tendency also exists in the observations (Fig. 12b–d and f–h), especially in radar and satellite images at one selected time (when the convection is less widespread). Again, while the model rainfall in the eastern subregion can be validated from the satellite cloud imagery (arrows), the observed rainfall in southwestern Taiwan in Fig. 12b was caused by migratory rainfall systems from upstream (i.e., the northern South China Sea).
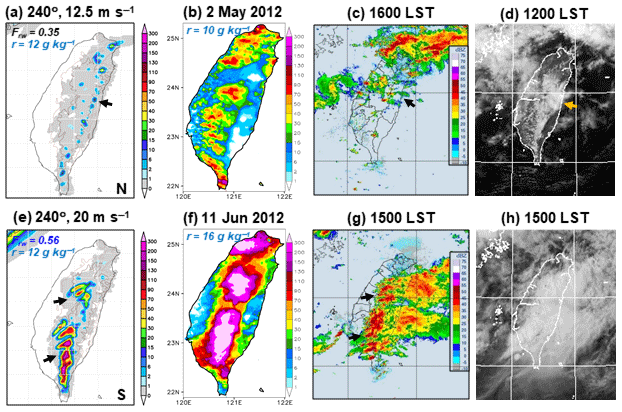
Figure 13As in Fig. 11 but between idealized results and observations (source: CWB and NCDR) for flow directions from 240∘ at an increased speed and thus from the intermediate- to high-Frw regime. The two idealized cases are (a) 12.5 m s−1 and (e) 20 m s−1 (both from 240∘), and the corresponding dates under observation are (b–d) 2 May and (f–h) 11 June 2012, respectively.
5.3 Flow from low-Frw to high-Frw regime
The final two cases of model and observed results are shown in Fig. 13, and the Frw increases from 0.35–0.56 at a considerable angle to the terrain (12.5 to 20 m s−1 from 240∘) and therefore from the mixed to high-Frw regime. When the Frw is lower, the result has been shown for the case of 12.5 m s−1 from 210∘ (Frw = 0.12) in Fig. 11 (bottom row). Some of these conditions are similar to the disturbed periods in Ruppert et al. (2013) but before frontal arrival. In the model, when the flow is in low-Frw, mixed, and high-Frw regimes (see Table 4), the rain-producing mechanisms are island circulation, mixed, and topographic uplift, following the order. This change in rainfall mechanism is evident both in the model (Figs. 11i and 13a, e) and in the observations (Figs. 11j–l and 13b–d, f–h). Not only in pattern, the dramatic increase in rainfall amount in the high-Frw regime when the southwesterly flow reaches 20 m s−1, with maxima in mountain interiors of central and southern CMR (arrows), is well exemplified in Fig. 13e and in good agreement with both Fig. 13h and i (before the arrival of frontal rainband). While the event on 11–12 June 2012 in northern Taiwan was from two successive rainbands associated with the front and was both extreme and rare (e.g., Wang et al., 2016), the overall rainfall distribution in the mountains (Fig. 13f) highly resembles the climatology (see Fig. 2a) and asserts the dominant role of the large events toward the total rainfall in the Mei-yu season. In Fig. 13f, considerably more rainfall was observed in the real event compared to the idealized model result (see Fig. 13e) since, in reality, the near-surface moisture content was higher, and many rain-producing clouds also moved in from upstream throughout the day. The latter reason also likely led to more observed rainfall than simulated by the model in our mixed case (Fig. 13a–d), although the moisture content was lower in the observations. In both cases in Fig. 13, the rainfall in northern Taiwan was caused by a migratory system or linked to the Mei-yu front (Wang et al., 2016), i.e., by mechanisms not existent in the model simulations. Overall, it is found that many responses in rainfall distributions in the model as the flow conditions are changed can be applied to the real atmosphere with a similar tendency, although some departures from the conditions in real events still exist and are not avoidable.
In this work, the rainfall regime and characteristics in Taiwan during the Mei-yu season are studied through idealized simulations using the CReSS model at a grid size of 2 km under prescribed wind direction and speed combinations of southwesterly flow in the lower to middle troposphere but with real topography and diurnal effects. Thus, compared to earlier idealized studies (e.g., Chu and Lin, 2000; Chen and Lin, 2005a, b; Sever and Lin, 2017), both the dynamic and thermodynamic roles played by the topography can be isolated and examined without the influence of Mei-yu front or other disturbances commonly found in real events. Based on an averaged and smoothed sounding profile, 3D idealized flow fields are constructed using the geostrophic wind relationship in the free atmosphere and modified to take into account friction inside the PBL: eight wind directions from 180–285∘ every 15∘ and eight wind speeds from 5–22.5 m s−1 every 2.5 m s−1, giving a total of 64 combinations of prescribed flows that are fixed over 950–500 hPa. Then, these horizontally uniform and steady fields are provided to the CReSS model as ICs and BCs for an integration of 50 h, in which the first 2 h are for spin-up and excluded from analysis. The rainfall amounts and patterns under different flow (and wet Froude number, or Frw) conditions are analyzed to illustrate the role of Taiwan's topography. To investigate the effects of moisture content inside the PBL, several RH values are specified (from 70 %–100 % every 7.5 % plus 55 %) for 9 of the 64 combinations (210, 240, and 270∘ for wind direction and 10, 15, and 20 m s−1 for wind speed); thus another 45 experiments are carried out for this purpose.
From the model results in response to different southwesterly wind direction and speed combinations, in which the RH near the surface is set to 85 % (based on the mean sounding) and corresponds to a CAPE of ∼ 2800 J kg−1, three rainfall regimes in Taiwan with different ranges of Frw are identified. The first regime is the low-Frw regime, in which the wind speed is typically no more than 10 m s−1 or at a higher speed but small angle to the topography, with a Frw of about 0.3 or less. In this regime reminiscent of the undisturbed periods of Ruppert et al. (2013), the island circulation from thermodynamic effects (including upslope winds and see breeze) during daytime is the main cause of rainfall, which exhibits a pronounced diurnal cycle (in local afternoon). Under such conditions, the lower the prevailing wind speed is, the more rainfall there is. When the flow speed is higher but more parallel to the terrain, the rainfall tends to reduce in amount and spatial coverage and shift toward the leeside area (from southern toward northern and eastern Taiwan).
The second regime is the (relatively) high-Frw regime when the flow is at least 12.5 m s−1 and impinging on the topography at a large angle as Frw is mostly ≥ 0.35–0.4 and can be up to 0.91 (flow at 22.5 m s−1 from 285∘). Under such conditions, the flow-over scenario takes place, and topographic rainfall becomes dominant through mechanical uplift of unstable air, with rainfall maxima over the windward slopes of the mountains (or near the ridge) in southern and central Taiwan. While some conditions in this regime are not unlike those in Chen and Chen (1995), Li and Chen (1998), and the disturbed periods of Ruppert et al. (2013), the most rainfall (peaking at 578 mm per day) occurs around the direction from 240–255∘ at a given speed, and the rain (and Frw) also increases with speed. It is also found that as the flow turns more perpendicular (from 255–285∘) to the elongated mesoscale topography of Taiwan, the rainfall tends to decrease due to a stronger blocking effect, as found in previous studies (e.g., Wang et al., 2005), even though the value of Frw increases. As the dynamical effect of terrain uplifting becomes more evident, the rainfall also becomes more persistent throughout the day with a reduced range of diurnal variations.
Between the two above rainfall regimes, there exists a third and mixed regime, with intermediate-Frw values and rainfall characteristics in transition. Not identified in previous studies, such a mixed regime occurs at high speed (≥ 17.5 m s−1) but small angles with Frw of about 0.15–0.25 or at medium speed (10–15 m s−1) but larger angles with Frw of around 0.3–0.4. In the three above regimes, a comparison between selected cases with observations indicate that many responses in rainfall distributions in the model as the flow conditions are changed can be applied to the real atmosphere with a similar tendency, but some discrepancies also exist.
For the effects of moisture content inside the PBL, the results indicate an increase (decrease) in overall and peak rainfall amount when the RH is increased (reduced) from the control value of 85 %, as expected intuitively. However, the near-surface RH also plays a role in affecting the instability and how easily the convection can be triggered in the model (easier in an environment with a higher RH inside the PBL). Thus, not only the amount of rainfall but also specific details such as where the peak rainfall would occur in Taiwan can be affected by the RH value in our tests. Overall, Taiwan's topography plays an important role in determining the rainfall amounts, distributions, and characteristics even under idealized southwesterly flow conditions with prescribed direction and speed.
The CReSS model and its user guide are publicly available at http://www.rain.hyarc.nagoya-u.ac.jp/~tsuboki/cress_html/index_cress_eng.html (last access: 24 January 2017). The sounding and other data needed to reproduce our results can be accessed at https://doi.org/10.29840/DBAR.DB_CReSSBD/Dataset (Wang et al., 2022, last access: 24 May 2022).
CCW developed the research idea, formulated its aims, designed the experiments, helped with the simulations, analysis, and interpretation, provided funding and project administration, and prepared the manuscript with contributions from all co-authors. PYC and STC performed the simulations and analysis. DIL contributed to the research idea, design of experiments, and funding. KT created and provided the model code and helped with the simulations.
The contact author has declared that neither they nor their co-authors have any competing interests.
Publisher's note: Copernicus Publications remains neutral with regard to jurisdictional claims in published maps and institutional affiliations.
The authors would like to thank the anonymous reviewers for their valuable comments. All observational data and rainfall plots in Fig. 2a and those used in Figs. 11–13 are provided by the CWB, and the QPESUMS data are from the NCDR.
This research has been supported by the Ministry of Science and Technology (MOST) of Taiwan (grant nos. MOST 103-2119-M-003-001-MY2, MOST 108-2111-M-003-005-MY2, MOST 109-2625-M-003-001, MOST 110-2111-M-003-004, and MOST 110-2625-M-003-001) and also by the Atmospheric Environmental Research Institute of Pukyong National University, Busan, Korea.
This paper was edited by Joaquim G. Pinto and reviewed by three anonymous referees.
Akaeda, K., Reisner, J., and Parsons, D.: The role of mesoscale and topographically induced circulations in initiating a flash flood observed during the TAMEX project, Mon. Weather Rev., 123, 1720–1739, https://doi.org/10.1175/1520-0493(1995)123%3C1720:TROMAT%3E2.0.CO;2, 1995.
Baines, P. G.: Topographic Effects in Stratified Flows, 1st edn., Cambridge University Press, Cambridge, England, UK, 1995.
Banta, R. M.: The Role of Mountain Flows in Making Clouds, in: Atmospheric Processes over Complex Terrain, edited by: Blumen, W., Meteorological Monographs, 23, Am. Meteorol. Soc., Boston, Massachusetts, US, 229–284, https://doi.org/10.1007/978-1-935704-25-6_9, 1990.
Bell, G. D. and Bosart, L. F.: Appalachian cold-air damming, Mon. Weather Rev., 116, 137–161, https://doi.org/10.1175/1520-0493(1988)116%3C0137:ACAD%3E2.0.CO;2, 1988.
Chen, G. T.-J.: Observational aspects of the Mei-Yu phenomenon in subtropical China, J. Meteorol. Soc. Jpn., 61, 306–312, https://doi.org/10.2151/jmsj1965.61.2_306, 1983.
Chen, G. T.-J.: Mesoscale features observed in the Taiwan Mei-Yu season, J. Meteorol. Soc. Jpn., 70, 497–516, https://doi.org/10.2151/jmsj1965.70.1B_497, 1992.
Chen, G. T.-J.: Research on the phenomena of Meiyu during the past quarter century: An overview, in: East Asian Monsoon, edited by: Chang, C.-P., World Scientific, Toh Tuck Link, Singapore, 357–403, https://doi.org/10.1142/9789812701411_0010, 2004.
Chen, G. T.-J., Wang, C.-C., and Liu, S. C.-S.: Potential vorticity diagnostics of a Mei-Yu front case, Mon. Weather Rev., 131, 2680–2696, 2003.
Chen, G. T.-J., Wang, C.-C., and Lin, D. T.-W.: Characteristics of low-level jets over northern Taiwan in mei-yu season and their relationship to heavy rain events, Mon. Weather Rev., 133, 20–43, https://doi.org/10.1175/MWR-2813.1, 2005.
Chen, G. T.-J., Wang, C.-C., and Chang, S.-W.: A diagnostic case study of Mei-yu frontogenesis and development of wavelike frontal disturbances in the subtropical environment, Mon. Weather Rev., 136, 41–61, https://doi.org/10.1175/2007MWR1966.1, 2008.
Chen, S., Hong, Y., Cao, Q., Kirstetter, P.-E., Gourley, J. J., Qi, Y., Zhang, J., Howard, K., Hu, J., and Wang, J.: Performance evaluation of radar and satellite rainfalls for Typhoon Morakot over Taiwan: Are remote-sensing products ready for gauge denial scenario of extreme events?, J. Hydrol., 506, 4–13, 2013.
Chen, S.-H. and Lin, Y.-L.: Orographic effects on a conditionally unstable flow over an idealized three-dimensional mesoscale mountain, Meteorol. Atmos. Phys., 88, 1–21, https://doi.org/10.1007/s00703-003-0047-6, 2005a.
Chen, S.-H. and Lin, Y.-L.: Effects of moist Froude number and CAPE on a conditionally unstable flow over a mesoscale mountain ridge, J. Atmos. Sci., 62, 331–350, https://doi.org/10.1175/JAS-3380.1, 2005b.
Chen, T.-C., Yen, M.-C., Hsieh, J.-C., and Arritt, R. W.: Diurnal and seasonal variations of the rainfall measured by the Automatic Rainfall and Meteorological Telemetry System in Taiwan, B. Am. Meteorol. Soc., 80, 2299–2312, https://doi.org/10.1175/1520-0477(1999)080%3C2299:DASVOT%3E2.0.CO;2, 1999.
Chen, X. A. and Chen, Y.-L.: Development of low-level jets during TAMEX, Mon. Weather Rev., 123, 1695–1719, https://doi.org/10.1175/1520-0493(1995)123%3C1695:DOLLJD%3E2.0.CO;2, 1995.
Chen, Y.-L.: Some synoptic-scale aspects of the surface fronts over southern China during TAMEX, Mon. Weather Rev., 121, 50–64, https://doi.org/10.1175/1520-0493(1993)121%3C0050:SSSAOT%3E2.0.CO;2, 1993.
Chi, S.-S.: The Mei-Yu in Taiwan, SFRDEST E-625 06-MT-03-4, Chung-Shin Engineering Technology Research and Development Foundation, Taipei, Taiwan, 65 pp, 2006 (in Chinese).
Cho, H. R. and Chen, G. T.-J.: Mei-Yu frontogenesis, J. Atmos. Sci., 52, 2109–2120, https://doi.org/10.1175/1520-0469(1995)052%3C2109:MYF%3E2.0.CO;2, 1995.
Chu, C.-M. and Lin, Y.-L.: Effects of orography on the generation and propagation of mesoscale convective systems in a two-dimensional conditionally unstable flow, J. Atmos. Sci., 57, 3817–3837, https://doi.org/10.1175/1520-0469(2001)057%3C3817:EOOOTG%3E2.0.CO;2, 2000.
Ciesielski, P. E., Chang, W.-M., Huang, S.-C., Johnson, R. H., Jou, B. J.-D., Lee, W.-C., Lin, P.-H., Liu, C.-H., and Wang, J.: Quality-controlled upper-air sounding dataset for TiMREX/SoWMEX: Development and corrections, J. Atmos. Ocean. Tech., 27, 1802–1821, https://doi.org/10.1175/2010JTECHA1481.1, 2010.
Cotton, W. R., Tripoli, G. J., Rauber, R. M., and Mulvihill, E. A.: Numerical simulation of the effects of varying ice crystal nucleation rates and aggregation processes on orographic snowfall, J. Appl. Meteorol. Clim., 25, 1658–1680, https://doi.org/10.1175/1520-0450(1986)025%3C1658:NSOTEO%3E2.0.CO;2, 1986.
Davis, C. A. and Lee, W.-C.: Mesoscale analysis of heavy rainfall episodes from SoWMEX/TiMREX, J. Atmos. Sci., 69, 521–537, https://doi.org/10.1175/JAS-D-11-0120.1, 2012.
Deardorff, J. W.: Stratocumulus-capped mixed layers derived from a three-dimensional model, Bound.-Lay. Meteorol., 18, 495–527, https://doi.org/10.1007/BF00119502, 1980.
Ding, Y.: Summer monsoon rainfalls in China, J. Meteorol. Soc. Jpn., 70, 373–396, https://doi.org/10.2151/jmsj1965.70.1B_373, 1992.
Forbes, G. S., Anthes, R. A., and Thompson, D. W.: Synoptic and mesoscale aspects of an Appalachian ice storm associated with cold-air damming, Mon. Weather Rev., 115, 564–591, https://doi.org/10.1175/1520-0493(1987)115%3C0564:SAMAOA%3E2.0.CO;2, 1987.
Fovell, R. G.: Convective initiation ahead of the sea-breeze front, Mon. Weather Rev., 133, 264–278, https://doi.org/10.1175/MWR-2852.1, 2005.
Gourley, J. J., Zhang, J., Maddox, R. A., Calvert, C. M., andHoward, K. W.: A real-time precipitation monitoring algorithm—quantitative precipitation estimation using multiple sensors (QPE-SUMS), Preprints, symp. on precipitation extremes: prediction, impacts, and responses, Albuquerque, NM, Am. Meteor. Soc., 57–60, 2001.
Hsu, J.: ARMTS up and running in Taiwan, Väisälä News, 146, 24–26, 1998.
Ikawa, M. and Saito, K.: Description of a nonhydrostatic model developed at the Forecast Research Department of the MRI, Technical Report, 28, Meteorological Research Institute, Tsukuba, Ibaraki, Japan, 245 pp, https://doi.org/10.11483/mritechrepo.28, 1991.
Johnson, R. H.: Diurnal cycle of monsoon convection, in: The Global Monsoon System: Research and Forecast, 2nd edn., edited by: Chang, C.-P., Ding, Y., Lau, N.-C., Johnson, R. H., Wang, B., Yasunari, T., World Scientific, Toh Tuck Link, Singapore, 257–276, https://doi.org/10.1142/9789814343411_0015, 2011.
Jou, B. J.-D. and Deng, S.-M.: Structure of a low-level jet and its role in triggering and organizing moist convection over Taiwan: A TAMEX case study, Terr. Atmos. Ocean. Sci., 3, 39–58, https://doi.org/10.3319/TAO.1992.3.1.39(A), 1992.
Jou, B. J.-D., Lee, W.-C., and Johnson, R. H.: An overview of SoWMEX/TiMREX and its operation, in: The Global Monsoon System: Research and Forecast, edited by: Chang, C.-P., Ding, Y., Lau, N.-C., Johnson, R. H., Wang, B., Yasunari, T., World Scientific, Toh Tuck Link, Singapore, 303–318, https://doi.org/10.1142/9789814343411_0018, 2011.
Kalnay, E., Kanamitsu, M., and Baker, W. E.: Global numerical weather prediction at the National Meteorological Center, B. Am. Meteorol. Soc., 71, 1410–1428, https://www.jstor.org/stable/26228046 (last access: 21 April 2021), 1990.
Kerns, B. W. J., Chen, Y.-L., and Chang, M.-Y.: The diurnal cycle of winds, rain, and clouds over Taiwan during the mei-yu, summer, and autumn rainfall regimes, Mon. Weather Rev., 138, 497–516, https://doi.org/10.1175/2009MWR3031.1, 2010.
Kingsmill, D. E.: Convection initiation associated with a sea-breeze front, a gust front, and their collision, Mon. Weather Rev., 123, 2913–2933, https://doi.org/10.1175/1520-0493(1995)123%3C2913:CIAWAS%3E2.0.CO;2, 1995.
Kirshbaum, D.: Cloud-resolving simulations of deep convection over a heated mountain. J. Atmos. Sci., 68, 361–378, 2011.
Kleist, D. T., Parrish, D. F., Derber, J. C., Treadon, R., Wu, W. S., and Lord, S.: Introduction of the GSI into the NCEP Global Data Assimilation System, Weather Forecast., 24, 1691–1705, https://doi.org/10.1175/2009WAF2222201.1, 2009.
Kondo, J.: Heat balance of the China Sea during the air mass transformation experiment, J. Meteorol. Soc. Jpn., 54, 382–398, https://doi.org/10.2151/jmsj1965.54.6_382, 1976.
Kuo, Y.-H. and Chen, G. T.-J.: The Taiwan Area Mesoscale Experiment (TAMEX): An overview, B. Am. Meteorol. Soc., 71, 488–503, https://doi.org/10.1175/1520-0477(1990)071%3C0488:TTAMEA%3E2.0.CO;2, 1990.
Lai, H.-W, Davis, C. A., and Jou, B. J.-D.: A subtropical oceanic mesoscale convective vortex observed during SoWMEX/TiMREX, Mon. Weather Rev., 139, 2367–2385, https://doi.org/10.1175/2010MWR3411.1, 2011.
Li, J. and Chen, Y.-L.: Barrier jets during TAMEX, Mon. Weather Rev., 126, 959–971, https://doi.org/10.1175/1520-0493(1998)126%3C0959:BJDT%3E2.0.CO;2, 1998.
Lin, Y.-L.: Orographic effects on airflow and mesoscale weather systems over Taiwan, Terr. Atmos. Ocean. Sci., 4, 381–420, https://doi.org/10.3319/TAO.1993.4.4.381(A), 1993.
Lin, Y.-L., Farley, R. D., and Orville, H. D.: Bulk parameterization of the snow field in a cloud model, J. Appl. Meteorol. Clim., 22, 1065–1092, https://doi.org/10.1175/1520-0450(1983)022%3C1065:BPOTSF%3E2.0.CO;2, 1983.
Lin, Y.-L., Chiao, S., Wang, T.-A., Kaplan, M. L., and Weglarz, R. P.: Some common ingredients for heavy orographic rainfall, Weather Forecast., 16 633–660, https://doi.org/10.1175/1520-0434(2001)016%3C0633:SCIFHO%3E2.0.CO;2, 2001.
Louis, J. F., Tiedtke, M., and Geleyn, J. F.: A short history of the operational PBL parameterization at ECMWF, in: Proceedings of Workshop on Planetary Boundary Layer Parameterization, Shinfield Park, Reading, UK, 25–27 November 1981, 59–79, https://www.ecmwf.int/node/10845 (last access: 21 April 2021), 1982.
Lupo, K. M., Torn, R. D., and Yang, S.-C.: Evaluation of stochastic perturbed parameterization tendencies on convective permitting ensemble forecasts of heavy rainfall events in New York and Taiwan, Weather Forecast., 35, 5–24, https://doi.org/10.1175/WAF-D-19-0064.1, 2020.
Manins, P. C. and Sawford, B. L.: Mesoscale observations of upstream blocking, Q. J. Roy. Meteor. Soc., 108, 427–434, https://doi.org/10.1002/qj.49710845608, 1982.
Metzger, J., Barthlott, C., and Kalthoff, N.: Impact of upstream flow conditions on the initiation of moist convection over the island of Corsica, Atmos. Res. 145–146, 279–296, https://doi.org/10.1016/j.atmosres.2014.04.011, 2014.
Miglietta, M. M. and Rotunno, R.: Numerical simulations of conditionally unstable flows over a mountain ridge, J. Atmos. Sci., 66, 1865–1885, https://doi.org/10.1175/2009JAS2902.1, 2009.
Murakami, M.: Numerical modeling of dynamical and microphysical evolution of an isolated convective cloud—The 19 July 1981 CCOPE cloud, J. Meteorol. Soc. Jpn., 68, 107–128, https://doi.org/10.2151/jmsj1965.68.2_107, 1990.
Murakami, M., Clark, T. L., and Hall, W. D.: Numerical simulations of convective snow clouds over the Sea of Japan: Two-dimensional simulation of mixed layer development and convective snow cloud formation, J. Meteorol. Soc. Jpn., 72, 43–62, https://doi.org/10.2151/jmsj1965.72.1_43, 1994.
Nicholls, M. E., Pielke, R. A., and Cotton, W. R.: A two-dimensional numerical investigation of the interaction between sea breezes and deep convection over the Florida peninsula, Mon. Weather Rev., 119, 298–323, https://doi.org/10.1175/1520-0493(1991)119%3C0298:ATDNIO%3E2.0.CO;2, 1991.
Overland, J. E. and Bond, B. A.: Observations and scale analysis of a coastal wind jet, Mon. Weather Rev., 123, 2934–2941, https://doi.org/10.1175/1520-0493(1995)123%3C2934:OASAOC%3E2.0.CO;2, 1995.
Pierrehumbert, R. T.: Linear results on the barrier effects of mesoscale mountains, J. Atmos. Sci., 41, 1356–1367, https://doi.org/10.1175/1520-0469(1984)041%3C1356:LROTBE%3E2.0.CO;2, 1984.
Reynolds, R. W., Rayner, N. A., Smith, T. M., Stokes, D. C., and Wang, W.: An improved in situ and satellite SST analysis for climate, J. Climate, 15, 1609–1625, https://doi.org/10.1175/1520-0442(2002)015%3C1609:AIISAS%3E2.0.CO;2, 2002.
Rotunno, R. and Ferretti, R.: Orographic effects on rainfall in MAP cases IOP 2b and IOP 8, Q. J. Roy. Meteor. Soc., 129, 373–390, https://doi.org/10.1256/qj.02.20, 2003.
Ruppert, J. H., Jr., Johnson, R. H., and Rowe, A. K.: Diurnal circulations and rainfall in Taiwan during SoWMEX/TiMREX (2008), Mon. Weather Rev., 141, 3851–3872, https://doi.org/10.1175/MWR-D-12-00301.1, 2013.
Segami, A., Kurihara, K., Nakamura, H., Ueno, M., Takano, I., and Tatsumi, Y.: Operational mesoscale weather prediction with Japan Spectral Model, J. Meteorol. Soc. Jpn., 67, 907–924, https://doi.org/10.2151/jmsj1965.67.5_907, 1989.
Sever, G. and Lin, Y.-L.: Dynamical and physical processes associated with orographic precipitation in a conditionally unstable uniform flow: Variation in basic wind speed, J. Atmos. Sci., 74, 449–466, https://doi.org/10.1175/JAS-D-16-0077.1, 2017.
Sha, W., Kawamura, T., and Ueda, H.: A numerical study on sea/land breezes as a gravity current: Kelvin–Helmholtz billows and inland penetration of the sea-breeze front, J. Atmos. Sci., 48, 1649–1665, https://doi.org/10.1175/1520-0469(1991)048%3C1649:ANSOSB%3E2.0.CO;2, 1991.
Smith, R. B.: Synoptic observations and theory of orographically disturbed wind and pressure, J. Atmos. Sci., 39, 60–70, https://doi.org/10.1175/1520-0469(1982)039%3C0060:SOATOO%3E2.0.CO;2, 1982.
Smolarkiewicz, P. K., Rasmussen, R., and Clark, T. L.: On the dynamics of Hawaiian cloud band: Island forcing, J. Atmos. Sci., 45, 1872–1905, https://doi.org/10.1175/1520-0469(1988)045%3C1872:OTDOHC%3E2.0.CO;2, 1988.
Sun, W.-Y. and Chern, J.-D.: Diurnal variation of lee vortices in Taiwan and the surrounding area, J. Atmos. Sci., 50, 3404–3430, https://doi.org/10.1175/1520-0469(1993)050%3C3404:DVOLVI%3E2.0.CO;2, 1993.
Sun, W.-Y. and Chern, J.-D.: Numerical experiments of vortices in the wakes of large idealized mountains, J. Atmos. Sci., 51, 191–209, https://doi.org/10.1175/1520-0469(1994)051%3C0191:NEOVIT%3E2.0.CO;2, 1994.
Tsuboki, K.: High-resolution simulations of high-impact weather systems using the cloud-resolving model on the Earth Simulator, in: High Resolution Numerical Modeling of the Atmosphere and Ocean, edited by: Hamilton, K. and Ohfuchi, W., Springer, New York, New York, USA, 141–156, https://doi.org/10.1007/978-0-387-49791-4_9, 2008.
Tsuboki, K. and Sakakibara, A.: Large-scale parallel computing of cloud resolving storm simulator, in: High Performance Computing, edited by: Zima, H. P., Joe, K., Sato, M., Seo, Y., and Shimasaki, M., Springer, Berlin, Heidelberg, Germany, 243–259, https://doi.org/10.1007/3-540-47847-7_21, 2002.
Tsuboki, K. and Sakakibara, A.: Numerical Prediction of High-Impact Weather Systems: The Textbook for the Seventeenth IHP Training Course in 2007, Hydrospheric Atmospheric Research Center, Nagoya University, Nagoya, Japan, and UNESCO, Paris, France, 273 pp, 2007.
Tu, C.-C., Chen, Y.-L., Chen, C.-S., Lin, P.-L., and Lin, P.-H.: A comparison of two heavy rainfall events during the Terrain-influenced Monsoon Rainfall Experiment (TiMREX) 2008, Mon. Weather Rev., 142, 2436–2463, https://doi.org/10.1175/MWR-D-13-00293.1, 2014.
Walser, A., Lüthi, D., and Schär, C.: Predictability of precipitation in a cloud-resolving model, Mon. Weather Rev., 132, 560–577, https://doi.org/10.1175/1520-0493(2004)132%3C0560:POPIAC%3E2.0.CO;2, 2004.
Wang, A.-H., Wang, C.-C., and Chen, G. T.-J.: A study on synoptic conditions leading to the extreme rainfall in Taiwan during 10-12 June 2012, Atmophsere, 12, 1255, https://doi.org/10.3390/atmos12101255, 2021.
Wang, C.-C. and Chen, G. T.-J.: Case study of the leeside mesolow and mesocyclone in TAMEX, Mon. Weather Rev., 130, 2572–2592, https://doi.org/10.1175/1520-0493(2002)130%3C2572:CSOTLM%3E2.0.CO;2, 2002.
Wang, C.-C. and Chen, G. T.-J.: On the formation of leeside mesolows under different Froude number flow regime in TAMEX, J. Meteorol. Soc. Jpn., 81, 339–365, https://doi.org/10.2151/jmsj.81.339, 2003.
Wang, C.-C., Chen, G. T.-J., Chen, T. C., and Tsuboki, K.: A numerical study on the effects of Taiwan topography on a convective line during the mei-yu season, Mon. Weather Rev., 133, 3217–3242, https://doi.org/10.1175/MWR3028.1, 2005.
Wang, C.-C., Chen, G. T.-J., and Huang, S.-Y.: Remote trigger of deep convection by cold outflow over the Taiwan Strait in the Mei-yu season: A modeling study of the 8 June 2007 case, Mon. Weather Rev., 139, 2854–2875, https://doi.org/10.1175/2011MWR3613.1, 2011.
Wang, C.-C., Hsu, J. C.-S., Chen, G. T.-J., and Lee, D.-I.: A study of two propagating heavy-rainfall episodes near Taiwan during SoWMEX/TiMREX IOP-8 in June 2008. Part I: Synoptic evolution, episode propagation, and model control simulation, Mon. Weather Rev., 142, 2619–2643, https://doi.org/10.1175/MWR-D-13-00331.1, 2014a.
Wang, C.-C., Hsu, J. C.-S., Chen, G. T.-J., and Lee, D.-I.: A study of two propagating heavy-rainfall episodes near Taiwan during SoWMEX/TiMREX IOP-8 in June 2008. Part II: Sensitivity tests on the roles of synoptic conditions and topographic effects, Mon. Weather Rev., 142, 2644–2664, https://doi.org/10.1175/MWR-D-13-00330.1, 2014b.
Wang, C.-C., Chiou, B.-K., Chen, G. T.-J., Kuo, H.-C., and Liu, C.-H.: A numerical study of back-building process in a quasistationary rainband with extreme rainfall over northern Taiwan during 11–12 June 2012, Atmos. Chem. Phys., 16, 12359–12382, https://doi.org/10.5194/acp-16-12359-2016, 2016.
Wang, C.-C., Chen, G. T.-J., Ngai, C.-H., and Tsuboki, K.: Case study of a morning convective rainfall event over southwestern Taiwan in the Mei-yu season under weak synoptic conditions, J. Meteorol. Soc. Jpn., 96, 461–484, https://doi.org/10.2151/jmsj.2018-051, 2018.
Wang, C.-C., Li, M.-S., Chang, C.-S., Chuang, P.-Y., Chen, S.-H., and Tsuboki, K.: Ensemble-based sensitivity analysis and predictability of an extreme rainfall event over northern Taiwan in the Mei-yu season: The 2 June 2017 case, Atmos. Res., 259, 105684, https://doi.org/10.1016/j.atmosres.2021.105684, 2021.
Wang, C.-C., Chuang, P.-Y., Chen, S.-T., Lee, D.-I., and Tsuboki, K.: Cloud-Resolving Storm Simulator Binary Data, DBAR [data set], https://doi.org/10.29840/DBAR.DB_CReSSBD/Dataset, 2022.
Xu, W., Zipser, E. J., Chen, Y.-L., Liu, C., Liou, Y.-C., Lee, W.-C., and Jou, B. J.-D.: An orography-associated extreme rainfall event during TiMREX: Initiation, storm evolution, and maintenance, Mon. Weather Rev., 140, 2555–2574, https://doi.org/10.1175/MWR-D-11-00208.1, 2012.
Yeh, H.-C. and Chen, Y.-L.: Characteristics of rainfall distributions over Taiwan during the Taiwan Area Mesoscale Experiment (TAMEX), J. Appl. Meteorol. Clim., 37, 1457–1469, https://doi.org/10.1175/1520-0450(1998)037%3C1457:CORDOT%3E2.0.CO;2, 1998.
Yeh, H.-C. and Chen, Y.-L.: The role of offshore convergence on coastal rainfall during TAMEX IOP 3, Mon. Weather Rev., 130, 2709–2730, https://doi.org/10.1175/1520-0493(2002)130%3C2709:TROOCO%3E2.0.CO;2, 2002.
Yeh, H.-C. and Chen, Y.-L.: Numerical simulations of the barrier jet over northwestern Taiwan during the Mei-Yu Season, Mon. Weather Rev., 131, 1396–1407, https://doi.org/10.1175/1520-0493(2003)131%3C1396:NSOTBJ%3E2.0.CO;2, 2003.
- Abstract
- Introduction
- Data methodology
- Results of prescribed and uniform southwesterly flow
- Effects of near-surface moisture on rainfall
- Comparison of idealized results to real events
- Conclusion and summary
- Code and data availability
- Author contributions
- Competing interests
- Disclaimer
- Acknowledgements
- Financial support
- Review statement
- References