the Creative Commons Attribution 4.0 License.
the Creative Commons Attribution 4.0 License.
 | 02 Jun 2022
Rapid landslide risk zoning toward multi-slope units of the Neikuihui tribe for preliminary disaster management
Zih-Yi Li
Taiwan features steep terrain and a fragile geological environment accompanied by frequent earthquakes and typhoons annually. Meanwhile, with the booming economy and rapid population growth, activities pivot from metropolises to Taiwan's suburban and mountain areas. However, for example, the Neikuihui tribe in northern Taiwan experiences landslide disasters during extreme rainfall events. To rapidly examine landslide risk in the tribe area for preliminary disaster management, the well-known principle of risk, which comprises hazard, exposure, and vulnerability, was carefully adapted to scrutinize 14 slope units around the Neikuihui tribe region. The framework of risk zoning is improved based on the previous quantified findings regarding the inventory of the deep-seated landslides in southern Taiwan. Moreover, the proposed procedures comprehensively assess susceptibility, activity, exposure, and vulnerability of each slope unit. The rapid risk zoning analysis of multi-slope units delivers a sloping unit with a high level of landslide risk, and this slope unit did suffer from landslide disasters in the 2016 typhoon event. This study preliminarily proves that the proposed framework and details of rapid risk zoning can help identify a relatively high-risk slope unit around a tribal region and address pre-countermeasures for disaster management.
- Article
(53878 KB) - Full-text XML
- BibTeX
- EndNote


Disasters due to regional landslides, soil yield, and sediment production have received more attention in recent decades (Keefer and Larsen, 2007), and one of the highly correlated causes can be global warming, which drastically affects the climate phenomenon, as pointed out by the Intergovernmental Panel on Climate Change (IPCC; 2014). For instance, rainfall is concentrated in fewer but more violent rain events in Taiwan, where about 75 % of the land is mountains, accompanied by steep terrains, fragile geology conditions, and seismic activity. Therefore, Taiwan suffers several geological disasters due to rainfall events annually. Nevertheless, increasing landslides expand the area of bare land in Taiwan (Chen and Huang, 2010) because of rapid economic development and population growth that force land use into mountainous areas. Taking Typhoon Ophelia in 1990 and Typhoon Herb in 1996, rainfall events caused landslides in Tomong Village (eastern Taiwan) and Nantou (central Taiwan), respectively, and led to costly restoration. During Typhoon Morakot in 2009, the mountainous area in southern Taiwan formed another hot zone for landslides (Lin et al., 2008, 2011; Chen, 2016). Moreover, Nantou's mountainous regions became a spotlight after the Chichi earthquake in 1999 and Typhoon Toraji in 2001 (Lin et al., 2008).
Due to the increase in natural disasters, it is necessary to execute risk management to reduce losses (Chen et al., 2010) and propose an efficient risk assessment to determine where the priority must be initiated by governance in the case of limited time and resources (Zheng, 2018). Varnes et al. (1984) revealed a risk assessment principle as risk = hazard × exposure × vulnerability based on the requests above. Dai et al. (2002) proposed a framework for deep-seated landslide risk assessment, in which triggering, preparatory, and landslide are the primary tasks. Fell et al. (2008) provided guidelines for landslide susceptibility, hazard, and risk zoning for land use planning. Moreover, Corominas and Mavrouli (2011) stated that a completed deep-seated landslide risk assessment must include susceptibility, hazard, vulnerability, and risk. Cantarino et al. (2021) applied the risk evaluation with hazard, exposure, and vulnerability on expansive residential areas in La Marina, Spain.
To describe hazard, Parise and Wasowski (1999) proposed the areal frequency method to further quantify the activity area of a landslide with specified surface features such as scarps, tension cracks, and slip marks. The equal area can be identified and drawn from the aerial photos before and after the disaster. Then the activity area ratio (AAR) is defined as the percentage of the active area divided by the total area and operated to express the activity of a landslide. Grecu (2002) indicated that rock strength, topography (formation process, slope, and distribution of watersheds), soil, and vegetation are essential factors for distinguishing whether slopes are dangerous or not. Guzzetti (2006) sorted out landslide susceptibility evaluations, in which five methods involve geomorphological mapping, analysis of landslide inventories, heuristic zoning, statistical method, and deterministic models. Among these, a statistical method usually collects numerous landslides to analyze the relationship between slope failure and its factors, such as topographical and geological conditions. Then these factors are weighted and ranked to objectively provide interpretations for landslide activity.
Remondo et al. (2005) developed the method to quantitatively assess landslide hazards and risks based on the 140 km2 study area in the lower part of the Deva River Valley, Givascua, Spain. The method incorporated the past landslide inventory frequency and intensity to convert landslide sensitivity into a quantitative hazards model. Remondo et al. (2005) further obtained vulnerability by quantitatively appraising the damage of exposed infrastructure, buildings, and land resources. A comprehensive analysis of landslide hazard and vulnerability models can support a quantitative risk model with monetary significance. Di et al. (2008) reported a risk assessment of debris flows in Sichuan Province, China, based on the on-site interpretation from aerial photographs and satellite images. They determined the locations of the debris flows and applied GIS (geographic information system) to build a database including hydrology, topography, geology, and social and economic aspects. A regression analysis revealed the relationship between the 24 h rainfall records and the abovementioned geological and topographic factors. Finally, social and economic information was joined to establish a debris flow vulnerability model, and it was further employed to be integrated with debris flow hazard and exposure to form a four-stage risk map.
Ahmad et al. (2012) also showed a quantitative risk evaluation method that contains nine environmental risk factors, including casualties of people, soil properties, earth coverage, soil grading characteristics, land use suitability, factor of safety, blasting area, and distance between the proposed structure to landslide. Then they implemented the method to examine Penang Island, Malaysia's development area, and the results were divided into five levels of risk: extremely low, low, medium, high, and extremely high. After this comprehensive analysis, relevant personnel can operate the environmental risk map to measure the feasibility of the risk assessment.
To evaluate the susceptibility areas for deep-seated landslides in southern Taiwan, the forestry bureau initiated a project from 2012 to 2013 at Gaoping River and Zengwen River basins (He and Lin, 2007). The high-precision digital terrain model (DTM) surveyed by the lidar completed the interpretation of the deep-seated landslide susceptibility area, and a total of 2523 places were identified accordingly. In this project, a criterion was that a landslide area greater than 10 ha was defined for a susceptible deep-seated landslide. Then each slope was systematically examined using aerial photographs, hillshade maps via DTM, and interpretations from various geological and topographic factors. Afterward, susceptibility positions of various deep-seated landslides in the project area were carefully located, and further in situ inspections were suggested by confirming sliding depth, local geological survey, and unfavorable hydrological factors. The related products verified the activity of slopes and scale of the landslide dam due to a deep-seated landslide. It is called the evaluation of the occurrence of deep-seated landslide susceptibility. Pan et al. (2019) established a risk assessment framework applied to a deep-seated landslide in Taiwan, including landslide susceptibility, hazard, vulnerability of protected objects, and risk level. They further considered the landslide activity to assist deep-seated landslides' hazard assessment. Moreover, the vulnerability of local households, residents, and infrastructure due to landslide run-out and deposition was also advised. Therefore, a deep-seated landslide risk assessment guide was formed based on the above project in southern Taiwan.
Although the relevant documents above have provided the basic framework required for risk assessment of deep-seated landslides in southern Taiwan, it seems like a pitfall of applying analysis for different landslide types and failure mechanisms (van Westen et al., 2008). Hence, this study refers to the previous framework and aims to provide a rapid landslide risk zoning based on the improvements, significantly contributing to a smaller scale and multiple slope units around the tribe region. After the comprehensive interpretations of the risk zoning of Neikuihui, the historical disaster event further verifies the feasibility of the proposed method for disaster management.
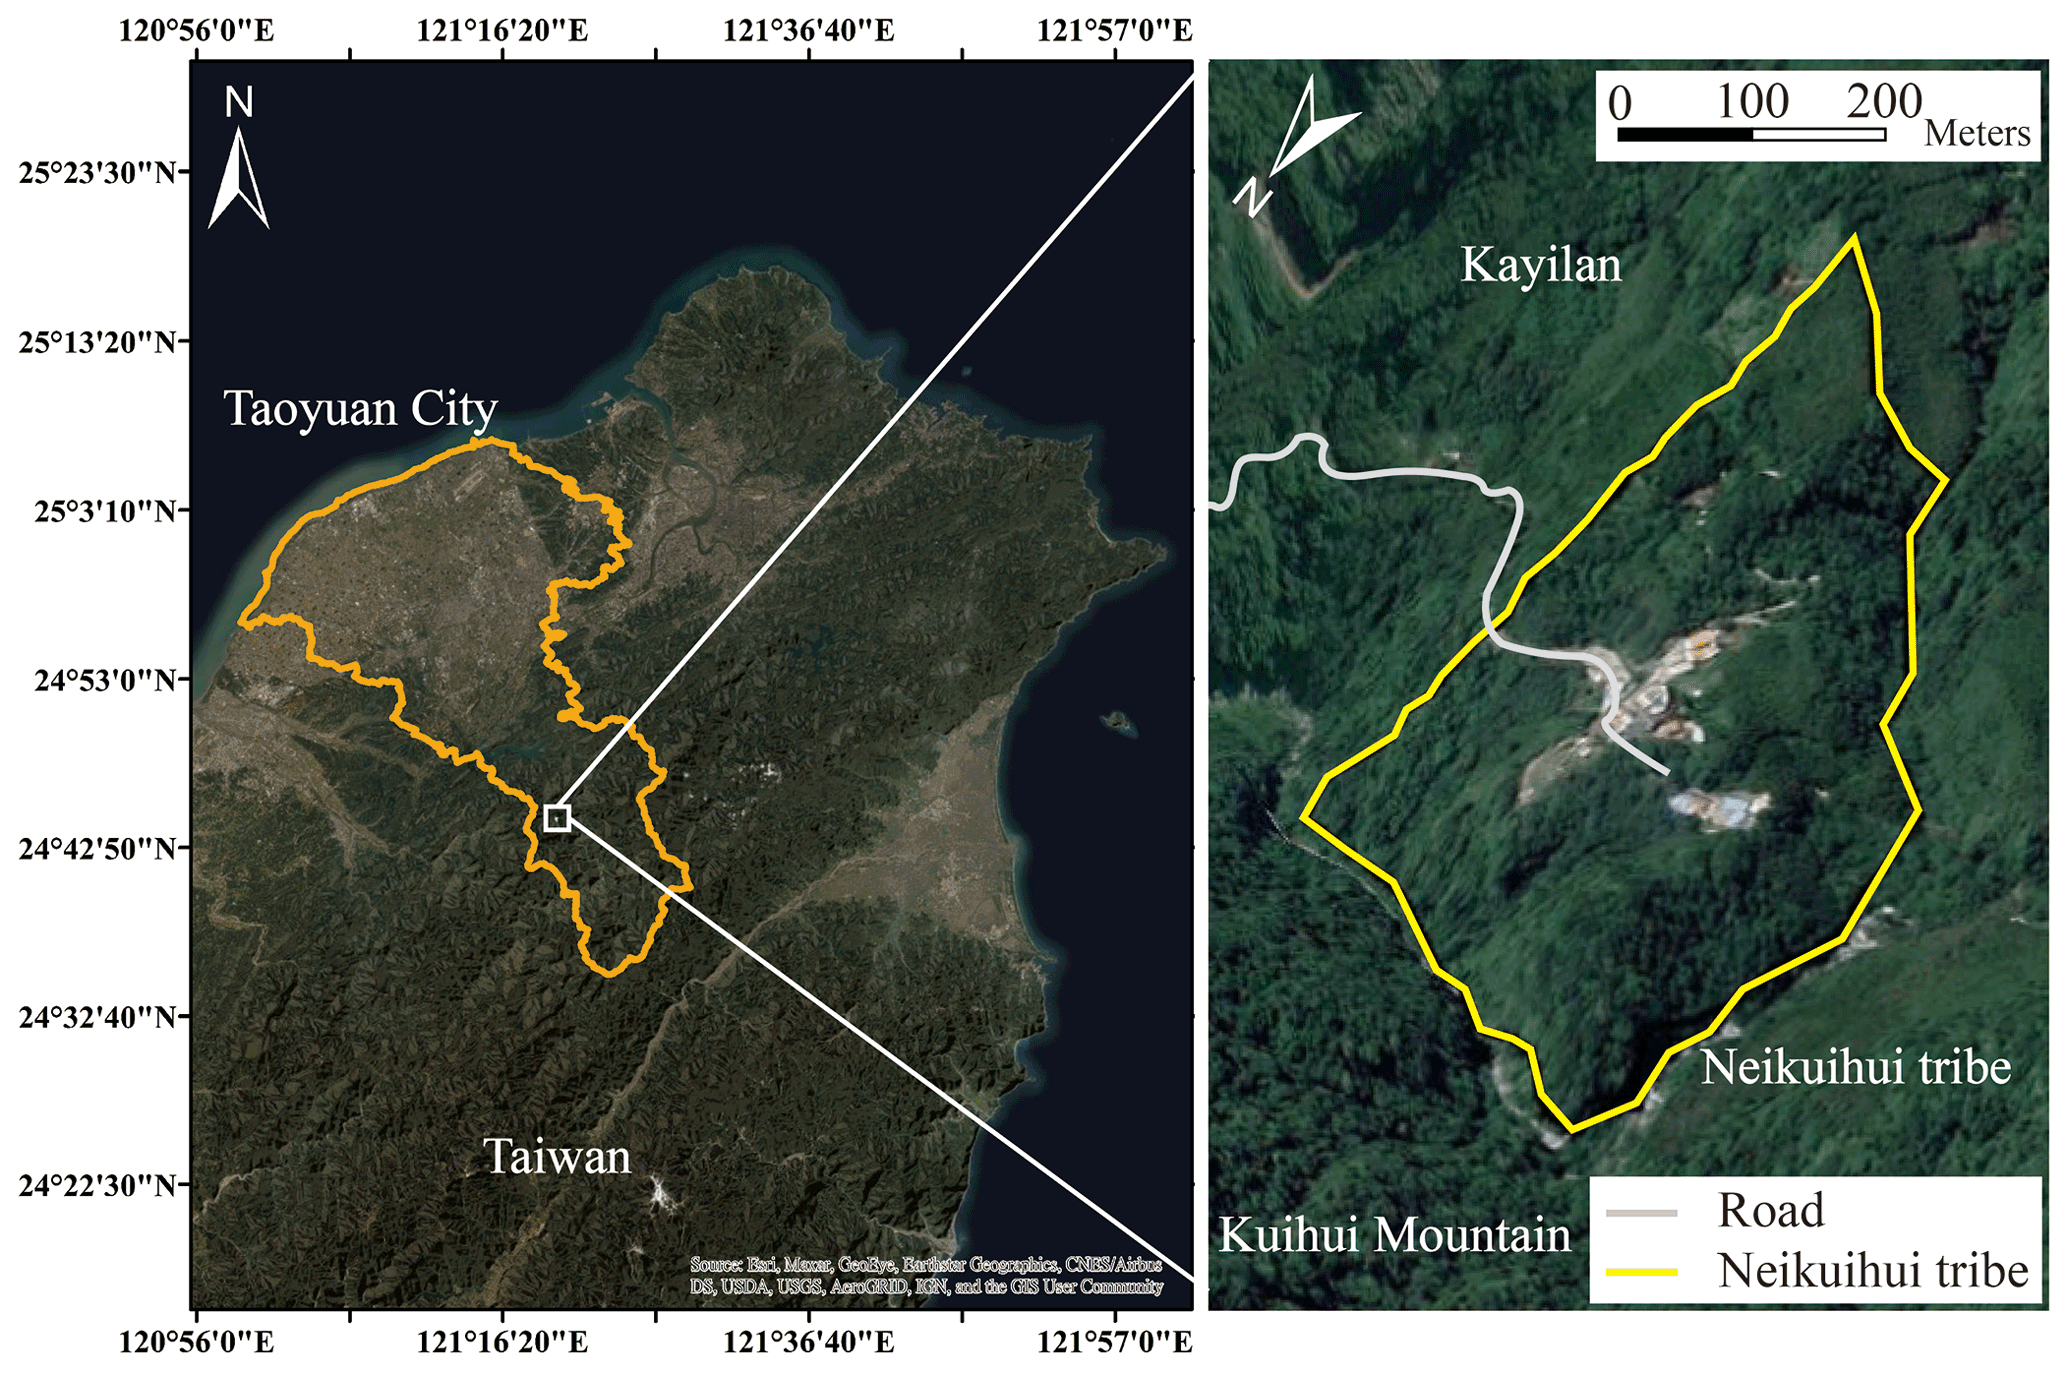
Figure 1Location of the Neikuihui tribe (image source: Esri, DigitalGlobe, GeoEye, Earthstar Geographics, CNES/Airbus DS, USDA, USGS, AeroGRID, IGN, and the GIS User Community; aerial: ESRI ArcGIS 10.4).
The administrative area of the Neikuihui tribe belongs to Taoyuan City, as shown in Fig. 1. The total area is around 21 ha, and most of the residents live in the northwest of the tribe. It is located on the southern slope of the Yanshan ridge of the Kuihui Mountain, looking to the Ronghua Valley, and is 2 km northwest of Kayilan. Most residents are aborigines in Taiwan. Since the Neikuihui tribe has only one external road and frequent rockfall disasters, most residents have moved north to Kuihui Village, and only about 15 households are left in the Neikuihui tribe.
To better visualize the terrain features, the 1 m × 1 m digital elevation model (DEM) is employed as a basis in Fig. 2. The overall slope aspect of the tribe is mainly northwest (Fig. 2a), with an average slope degree of 43.9∘ (Fig. 2b). Figure 2c and d show the CS (curvature slope) map and relief map based on the 1 m × 1 m DEM, respectively. The CSMapMaker plugin on QGIS produced by Asahi (2014) was applied to generate the CS map, in which a CS topographic map is made of altitude, curvature, and slope degree (Asahi 2014). Figure 2c is provided with color attributes suggested by Asahi (2014): light blue indicates valleys and light red indicates the ridge. Meanwhile, the Relief Visualization Toolbox application (Zakšek et al., 2011; Kokalj et al., 2019) is applied for generating the relief map (Fig. 2d) with the following attributes: the darker the color is, the closer the river valley will be, and the lighter color means that it is the closer to the ridge. CS and relief maps can support the characterization of the slope features quickly.
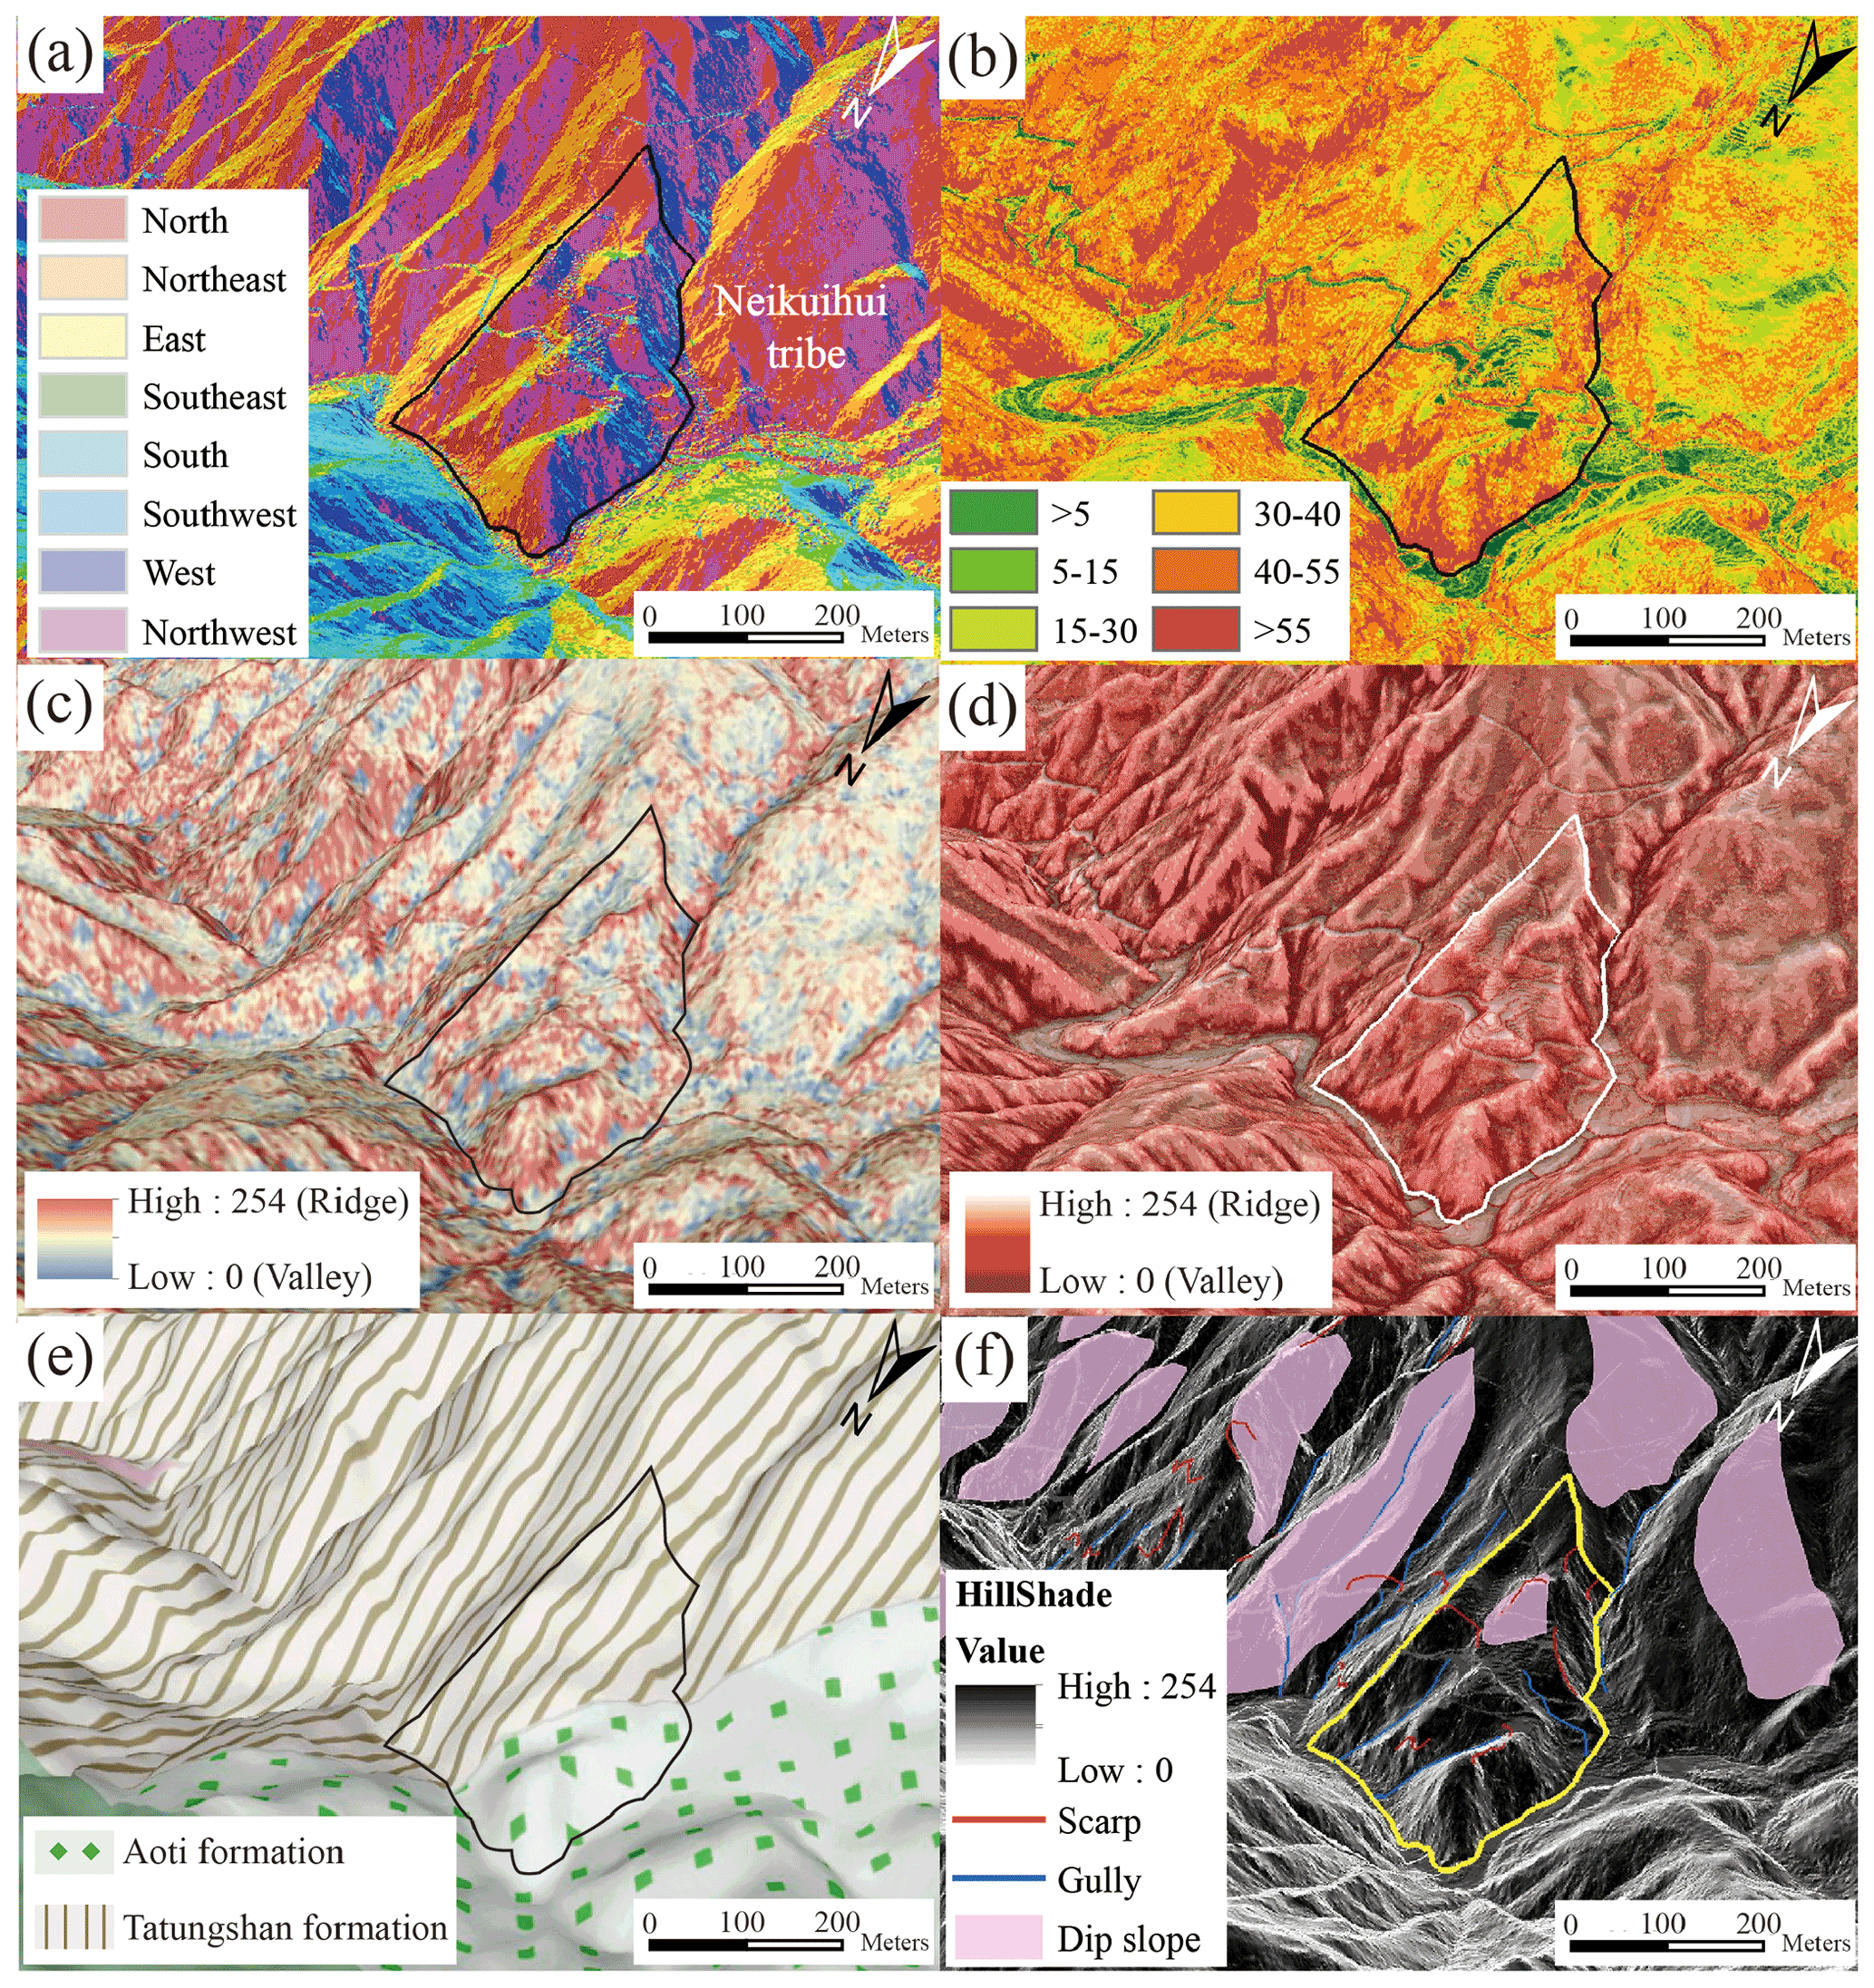
Figure 2Basic geology and environment of the Neikuihui tribe: (a) slope aspect (modified from 2020 data from the Department of Lands, Ministry of the Interior, for research purposes only); (b) slope map (modified from 2020 data from the Department of Lands, Ministry of the Interior, for research purposes only); (c) CS map (modified from 2020 data from the Department of Lands, Ministry of the Interior, for research purposes only); (d) relief map (modified from 2020 data from the Department of Lands, Ministry of the Interior, for research purposes only); (e) 1:250 000 geological map (modified from Central Geological Survey, 2020); and (f) geologically sensitive area distribution map (modified from 2020 data from the Department of Lands, Ministry of the Interior, for research purposes only) with a hillshade-based map; aerial: ESRI ArcGIS 10.4.
Figure 2e is a 1:25 000 geological map of the Central Geological Survey (2020). The strata include the Tatongshan and the Aoti formations, of which the Tatongshan formation is composed of interbedded hard black shale and siltstone, often forming steep slopes along the river bed. The Aoti Formation is composed of sandstone with a coal seam. Moreover, there is a Ronghua Stream flowing through the Neikuihui tribe region. Figure 2f is visualized based on a hillshade map from a 1 m × 1 m DEM. Figure 2f also reveals the locations of dip slopes from the Central Geological Survey (2020), and these dip slopes are geologically sensitive to the safety of the local settlements.
3.1 Delimited slope units
Quantitative geomorphological and environmental analysis requires the adoption of well-defined spatial domains as basic mapping units. The spatial domains provide local boundaries to aggregate environmental and morphometric variables for related analyses (Alvioli et al., 2020). Grid cells and slope units are commonly adapted among the spatial domain processes of delimited slope units (Reichenbach et al., 2018). Grid cells, typically aligned with a digital elevation model, are the standard mapping unit preference (Alvioli et al., 2020). Usually, grid cells are directly derived through a DTM or DEM, and the resolution of the predictor variables is assumed as corresponding to that of the DEM pixels. Therefore, the grid cell division is considered fast and straightforward for modeling (Van Den Eeckhaut et al., 2009; Rotigliano et al., 2011; Lombardo et al., 2015; Cama et al., 2017). Despite its popularity and operational advantages, grid cells have apparent drawbacks for susceptibility modeling (Guzzetti et al., 1999). First, there is no physical relationship between landslides and a grid cell or a group of grid cells since landslides from slope processes acting at different spatial and temporal scales result in geomorphological forms of very different shapes and sizes (Malamud et al., 2004; Guzzetti et al., 2012). An alternative to grid cells is the method of slope units, which refers to hydrological terrain divisions bounded by drainage and ridges (Carrara, 1983; Carrara et al., 1991; Carrara and Guzzetti, 1995; Guzzetti et al., 1999). Based on an analysis of the Imera Settentrionale watershed in northern Sicily, Italy, Martinello et al. (2020) found slope units to be superior for representing landslide susceptibility as a real spatial scale in geomorphological form.
The size of the slope units can be tailored to the type and size of the landslides since a slope unit has more geomorphological and geological significance than a grid unit (Carrara et al., 1991; Alvioli et al., 2016). Accordingly, a modified method is introduced to delimit slope units and depict slope profiles based on a high-resolution DEM (1 m × 1 m) via GIS in this study. The slope-unit delimiting method is supported by a GIS-based hydrological analysis and modeling tool, Arc Hydro, which originally incorporates DEM and reversed DEM approaches (Maidment, 2002; Xie et al., 2003; Wang et al., 2016). Based on the Xie et al. (2004) classification, GIS-based hydrological analysis and modeling tools are implemented to divide the watershed into slope units through the proposed processing chart of delimited slope units, as illustrated in Fig. 3.

Figure 3Process of delimited slope units (modified from Wang et al., 2016).
Figure 4a depicts the 14 delimited slope units around the Neikuihui tribe based on 1 m × 1 m DEM via the Arc Hydro tool in ArcGIS (Xie et al., 2004), and Fig. 4b illustrates the slope units mapping to the aerial photo. Subsequently, related environmental factors and features were analyzed, including slope aspect, slope degree, valley, and ridge, as pointed out in Fig. 2. Then 14 slope units accompanied with scarps and eroded gullies are manually drawn based on Fig. 2f and aerial photos. According to the improved framework of risk zoning as proposed in Fig. 5, the 14 slope units were graded regarding landslide hazard, exposure, and vulnerability factors. The corresponding risk scores of each slope unit were consequently obtained. These scores are expected to reveal the risk level and a disaster reduction strategy for the slope unit to reduce the impact of the disaster.
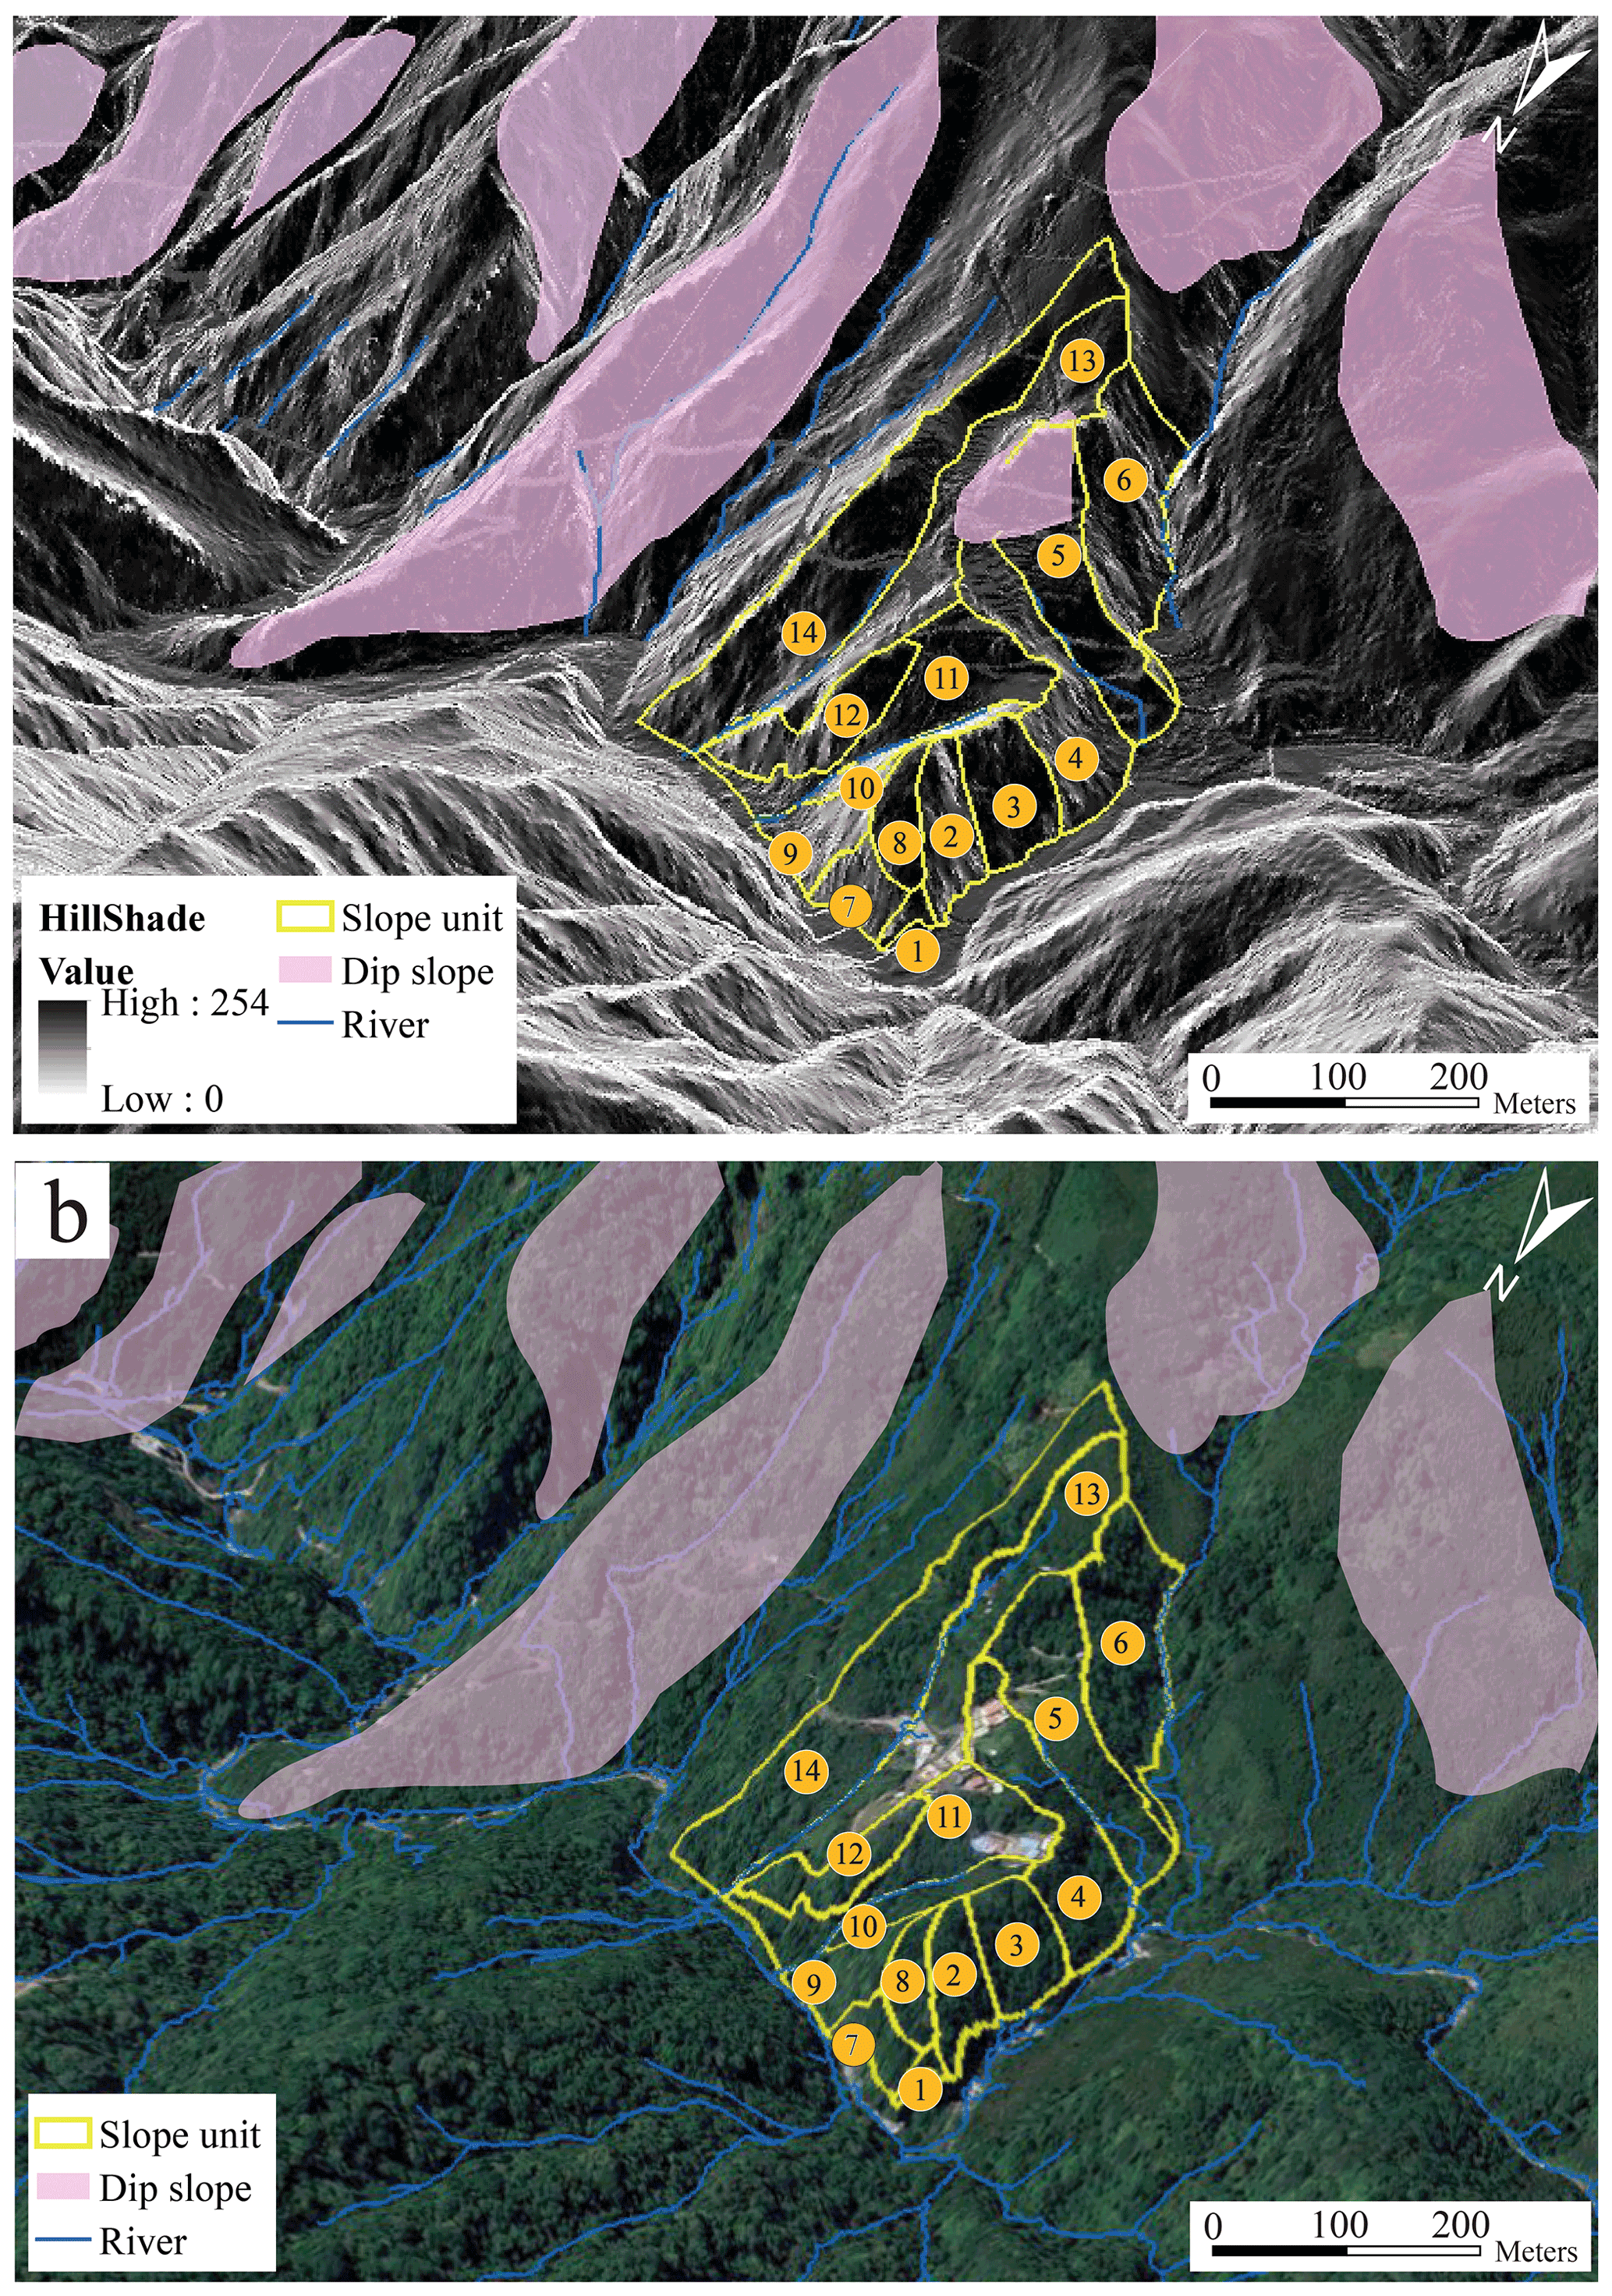
Figure 4(a) Distributions of 14 slope units around the Neikuihui tribe (background: modified from 2020 data from the Department of Lands, Ministry of the Interior, for research purposes only; aerial: ESRI ArcGIS 10.4); (b) household distribution map (background: modified from © Google Earth 2021; aerial: ESRI ArcGIS 10.4).
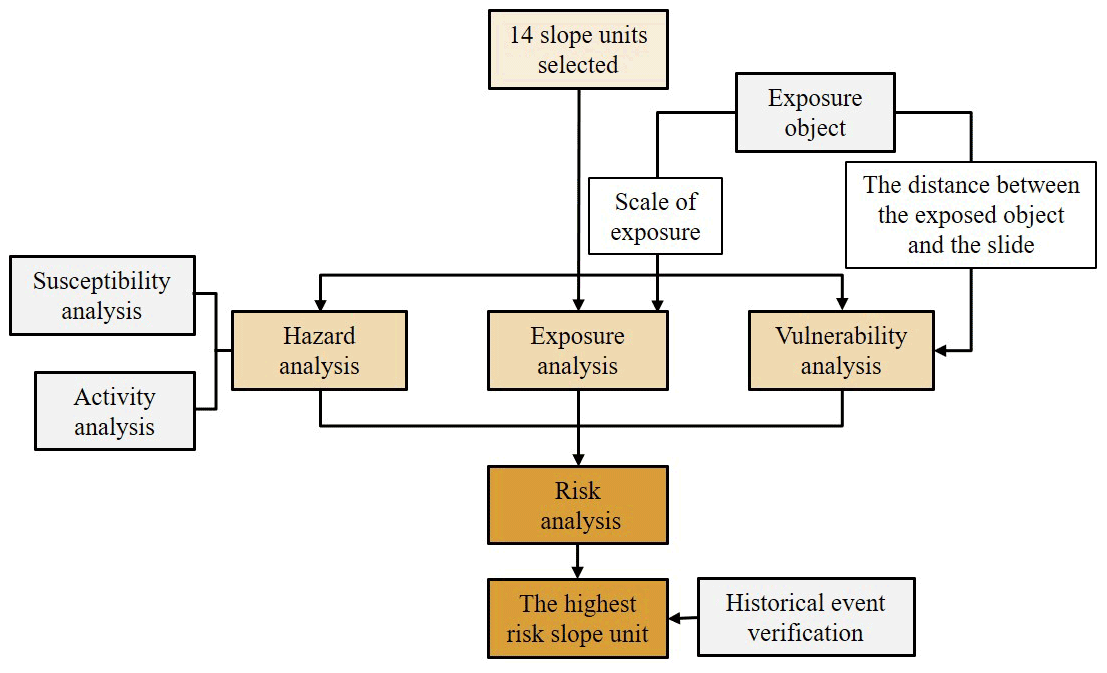
Figure 5Improved framework of risk zoning for multi-slope units and the corresponding verification.
3.2 Hazard analysis
This study refers to the hazard of a landslide by considering the indexes of susceptibility and activity to identify a landslide in spatial distribution. Although more environmental and morphometric indexes can be involved for hazard analysis, the proposed simplified analysis requires the necessary information for rapid risk zoning as described.
3.2.1 Susceptibility analysis
Guzzetti (2006) sorted out the evaluation of the susceptibility of a landslide, which can be classified into five methods: geomorphological mapping, analysis of inventories, heuristic zoning, statistical methods, and deterministic models. Statistical approaches require representative landslide inventories as the training data set which are used to characterize the corresponding unstable slopes. Factors such as topographical and geological conditions are marked with weights and rankings in the statistical method, leading to objective results in practice. Lin (2013) in Taiwan further reported the related results of the river basins in southern Taiwan by including 2523 landslide areas. Then susceptibility of the landslide was evaluated with the logistic regression, resulting in the main factors of the slope degree, lithology, and dip slope, as well as the adjacent conditions to a river and fault. The aforementioned factors were proceeded in ArcGIS using the 5 m grid-size DEM and the improved Gaopingxi watershed geological maps. Afterward, regional statistical results were applied to define the occurrence index from 1 to 2, then Lin (2013) proposed the grade results as listed in Table 1. Zheng (2018) also proposed the susceptibility assessment qualitatively and quantitatively by considering past regional landslide events, geological conditions, slope, and aspect.
This study adopts the previous suggestions to classify the susceptibility of landslides with factors and the corresponding grades. Noticeably, this study designs higher grades of slope degrees larger than 45∘ and river across or adjacent to the slope unit based on the previous experience. Consequently, the grades are further accumulated to evaluate the susceptibility level of the landslide, as listed in Table 1, and Table 2 reveals the susceptibility level of the landslide.
Table 1Susceptibility grades of environmental factors (modified from Lin, 2013).
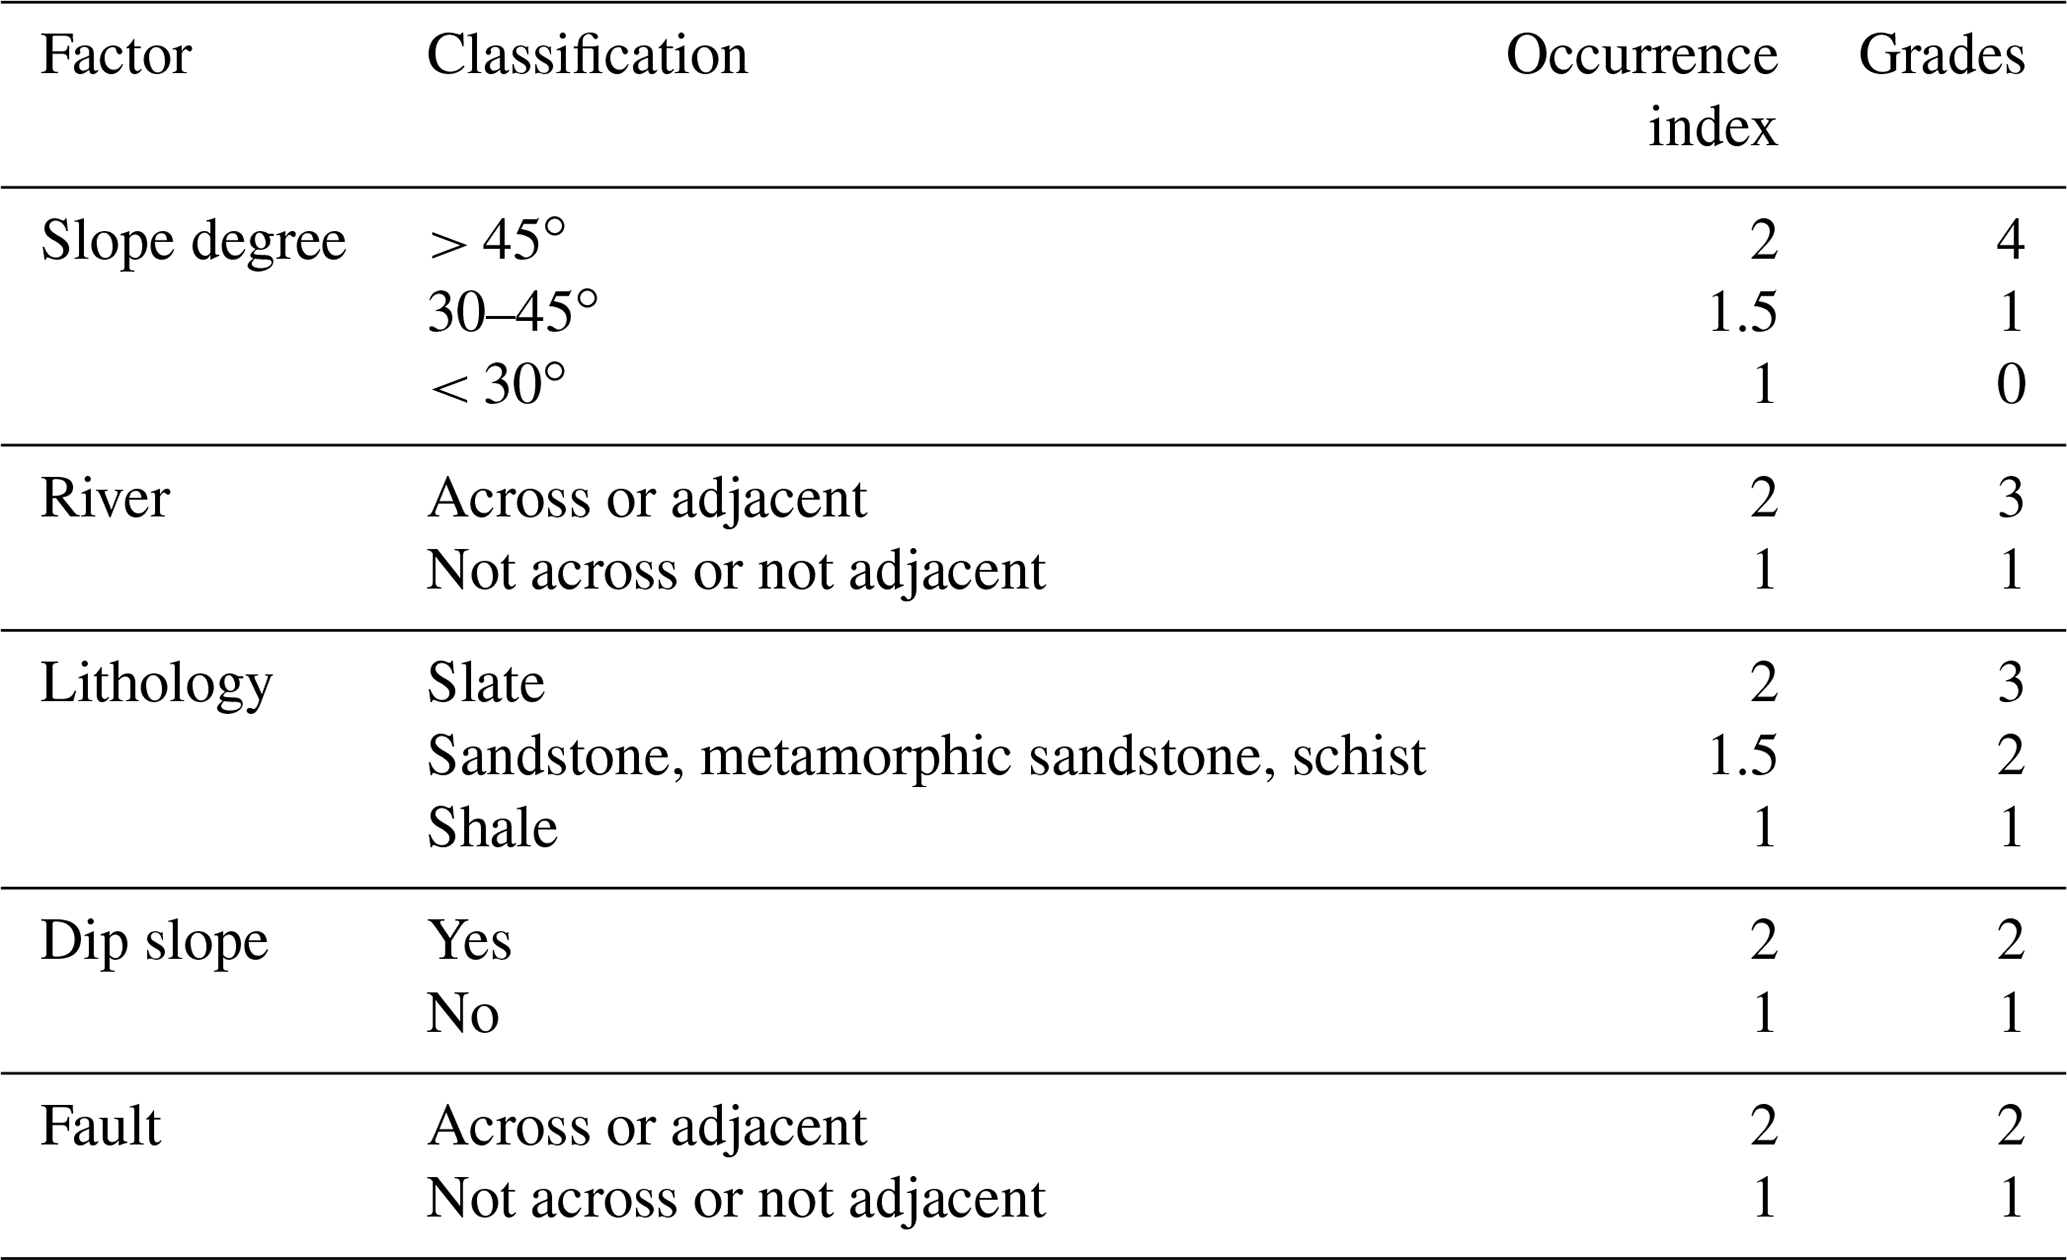
Table 2Susceptibility level of landslide (modified from Lin, 2013).
3.2.2 Activity analysis
Susceptibility is typically applied for the landslide risk assessment of large-scale geological conditions accompanied by common environmental factors, as mentioned previously. To rapidly assess the landslide risk of a tribe region, this study refers to the susceptibility findings of deep-seated landslide inventories and carefully includes activity analysis, especially for a small-scale slope unit. The activity of a slope can be obtained from long-term monitoring by examining evolutions of slopes through aerial photos of different periods. Parise and Wasowski (1999) proposed activity area ratio (AAR) to quantify the activity of a slope. AAR is defined as the percentage of the active area to the total area, and the active area often contains specified features such as scarps, tension cracks, and sliding traces. These features can usually be drawn from the aerial photos before and after the slide events. Based on the aforementioned findings, this study applied the 2.5 m × 2.5 m orthophoto map and Google Earth aerial photos to identify the features mentioned above in each small slope unit around the Neikuihui tribe.
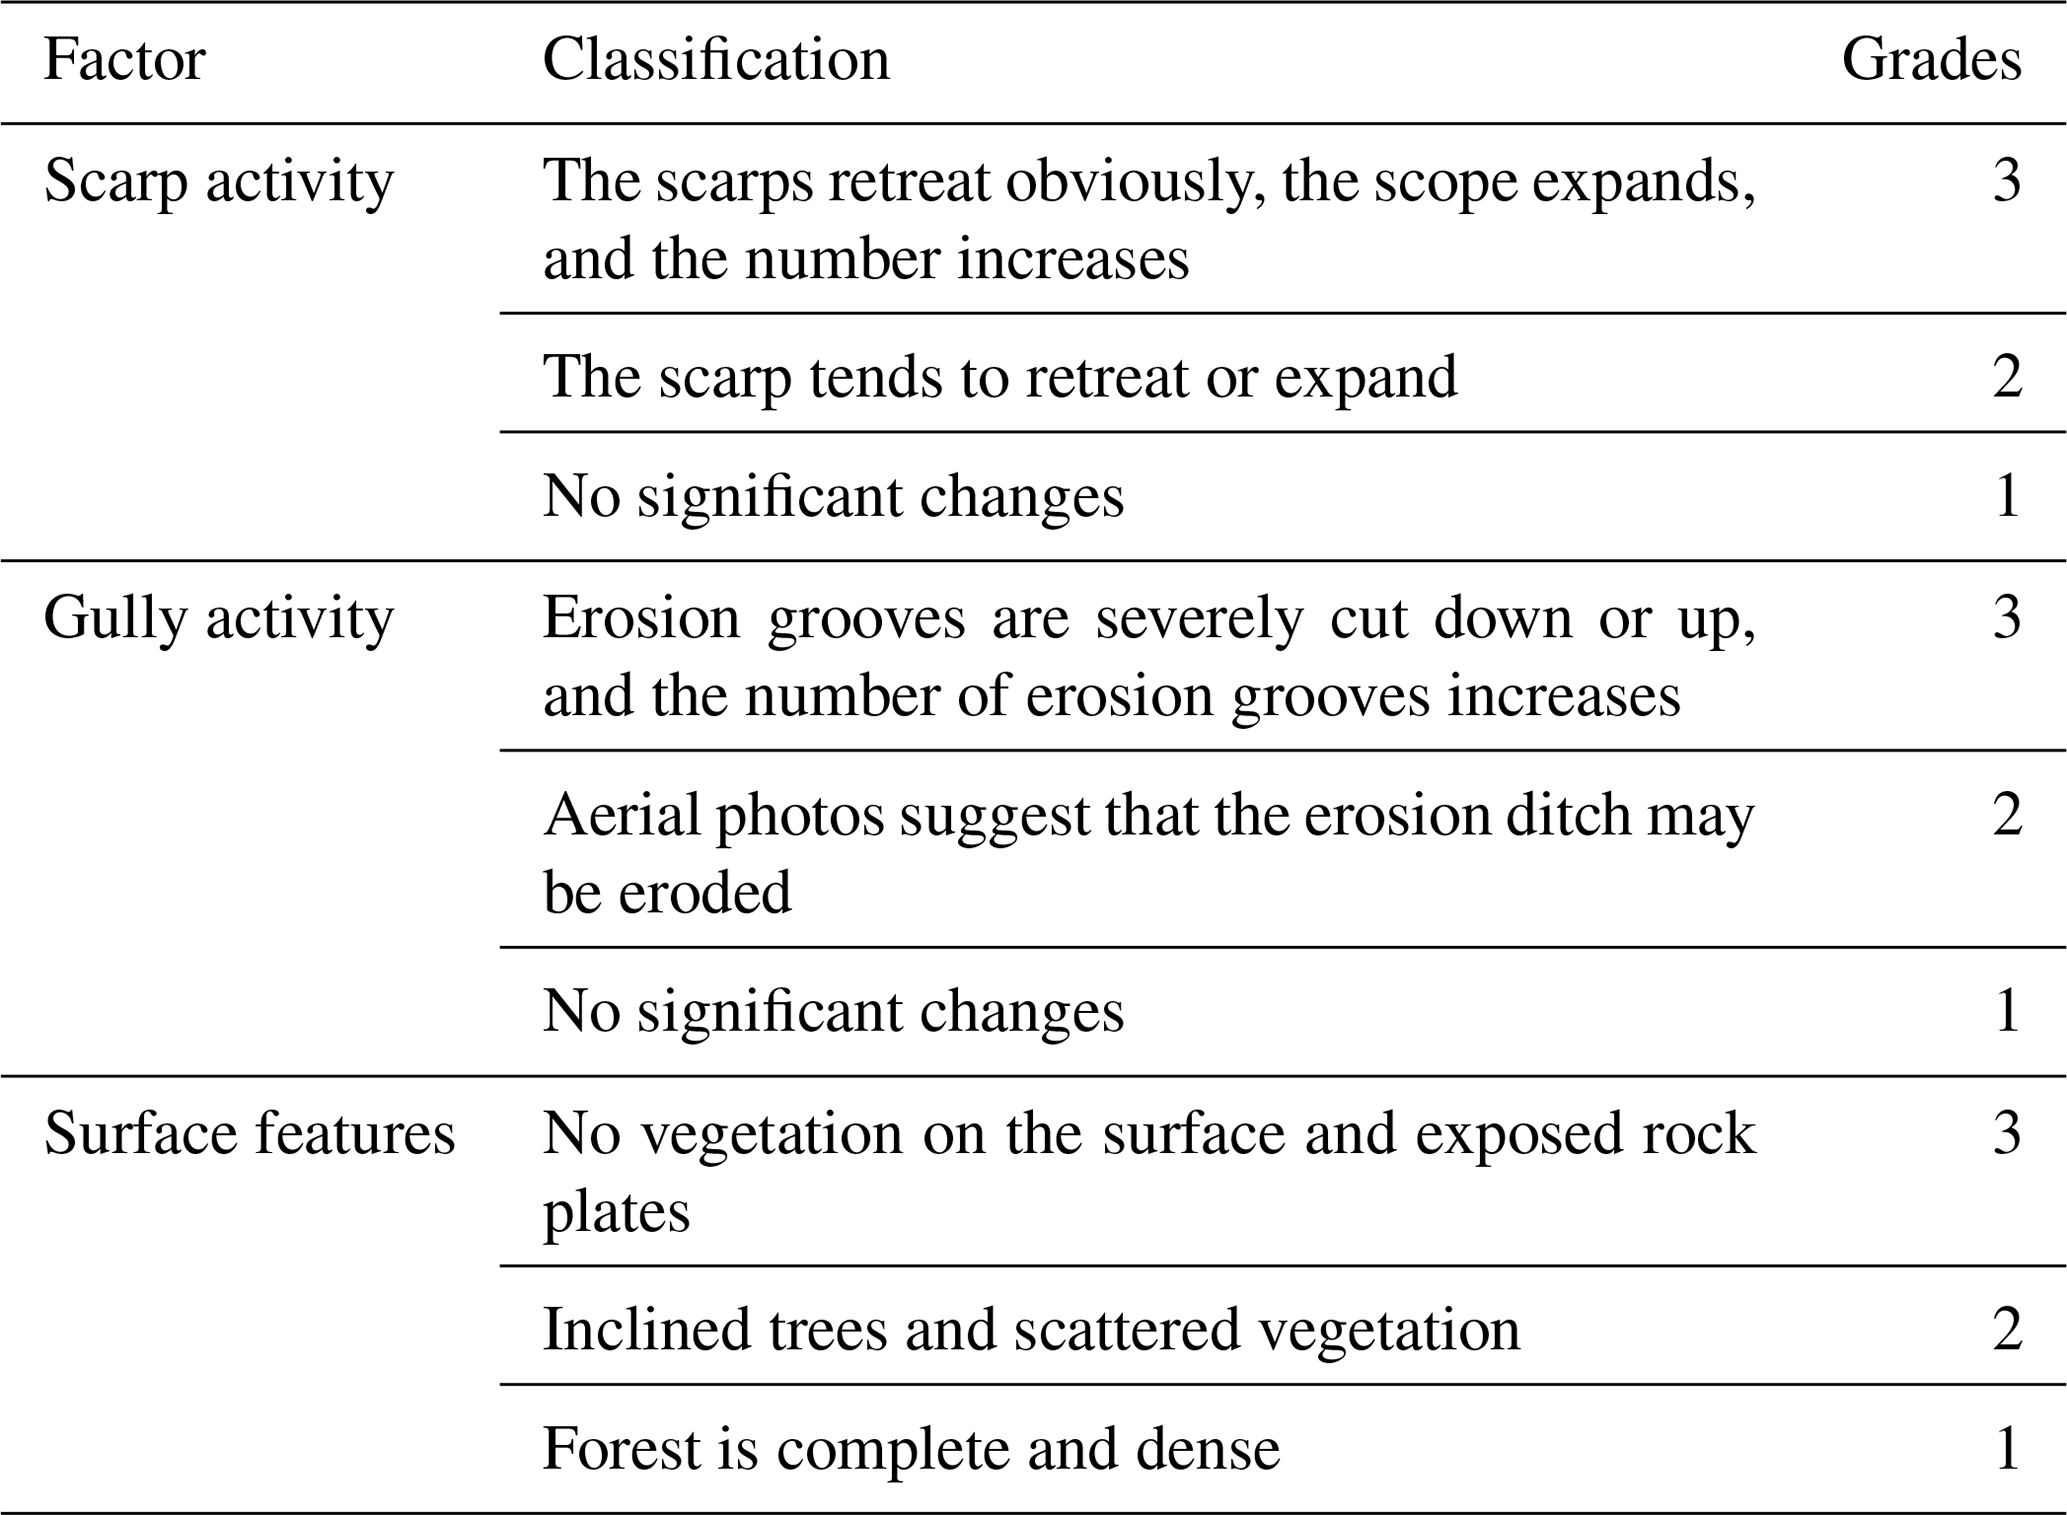
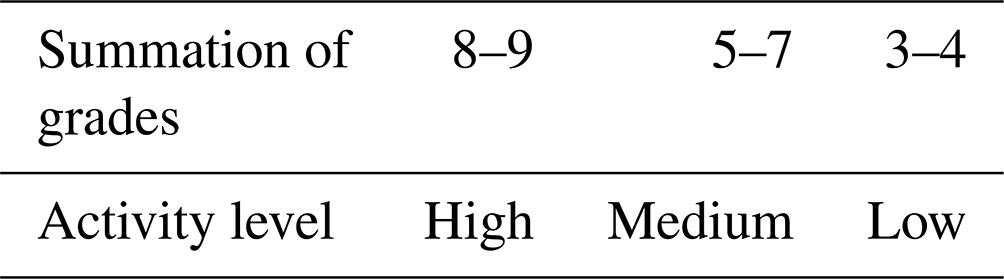
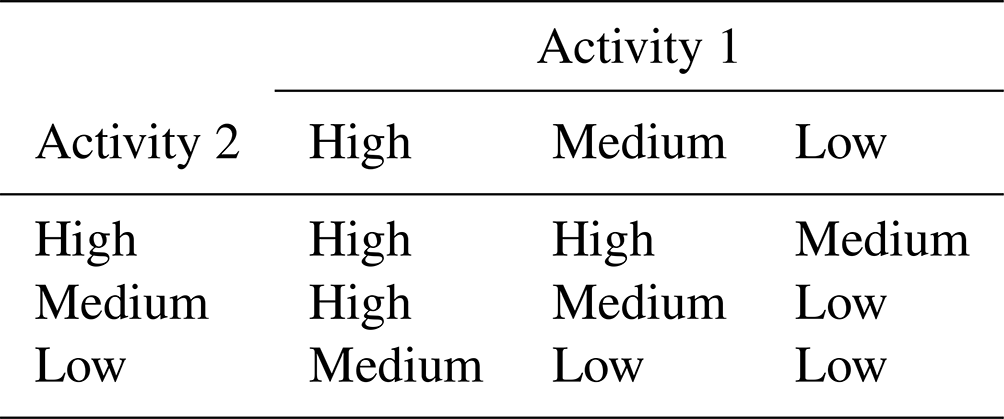
Furthermore, by referring to dip sliding and colluvium indexes proposed by Lin (2017), the dip sliding indexes include scarp, slope toe activity, and the relationship between rock layer orientation and slope aspect/degree. Meanwhile, the colluvium indexes were also proposed, including scarp, eroded gully activity, and surface features. Therefore, Activity 1 is modified to measure the activity level of the dip sliding along a slope unit, while Activity 2 examines the activity level of the colluvium layer on the surface of a slope unit. The criteria of Activity 1 and Activity 2 are qualitatively modified in Tables 3 and 4, respectively. Then, the appraisal of activity level is listed in Table 5. Finally, a comprehensive activity score by integrating the levels of Activity 1 and Activity 2 is proposed in Table 6.
Table 3Activity grades including dip slope features (referred to as Activity 1) (modified from Lin, 2017).
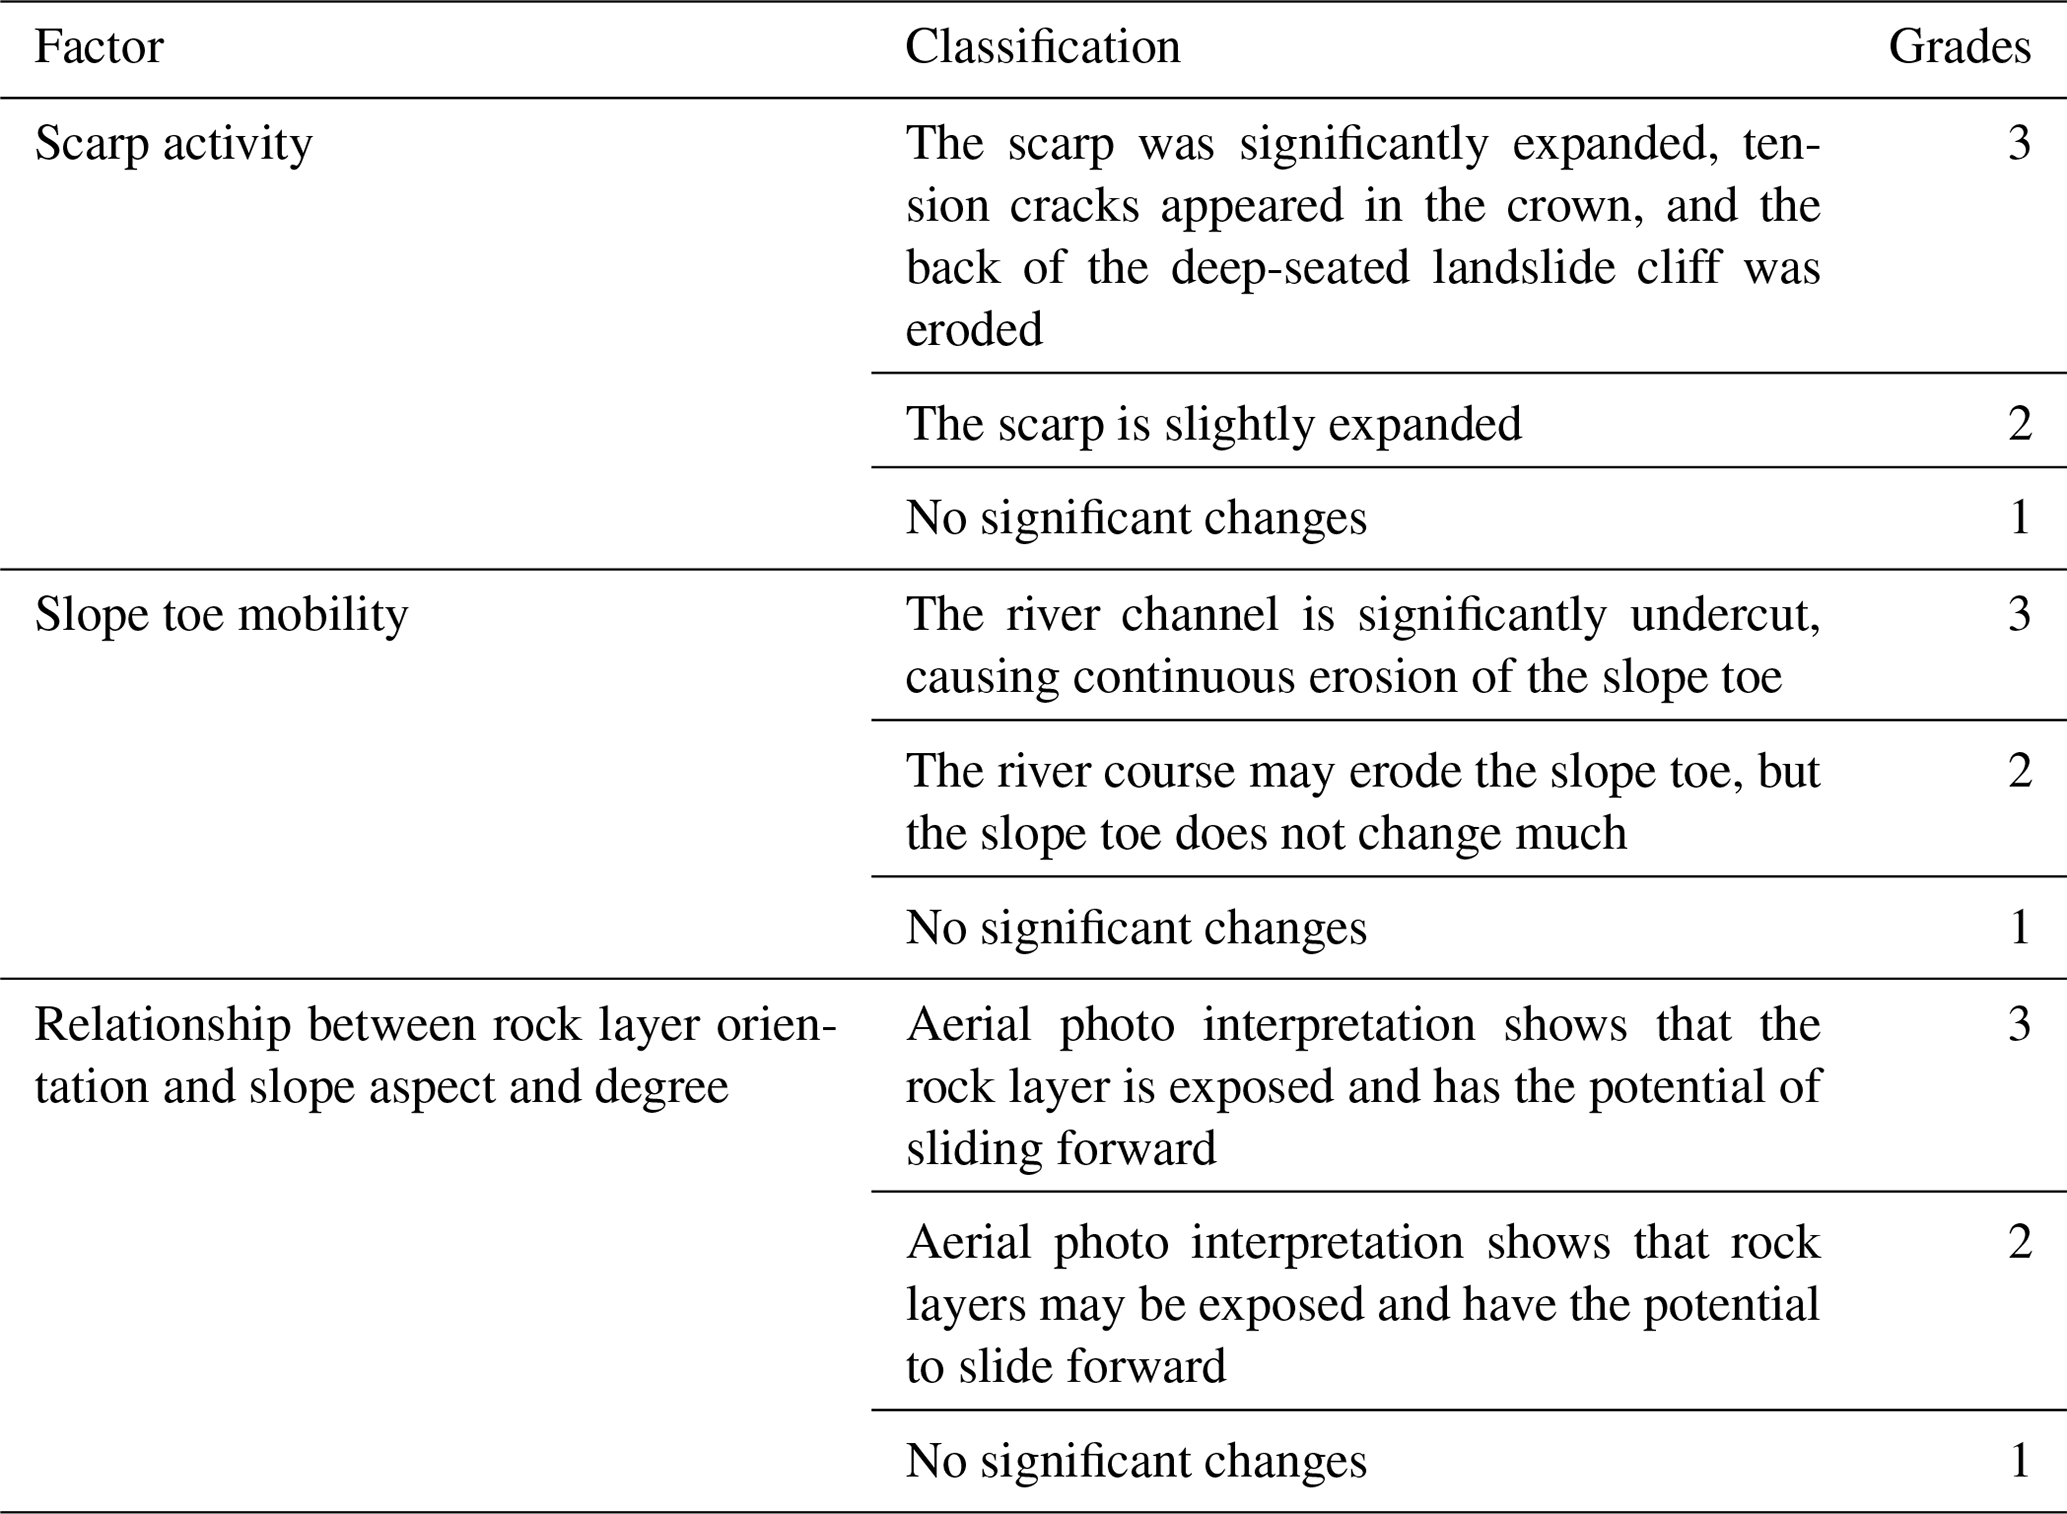
Table 4Activity grades including colluvium features (referred to as Activity 2) (modified from Lin, 2017).
3.2.3 Hazard level analysis
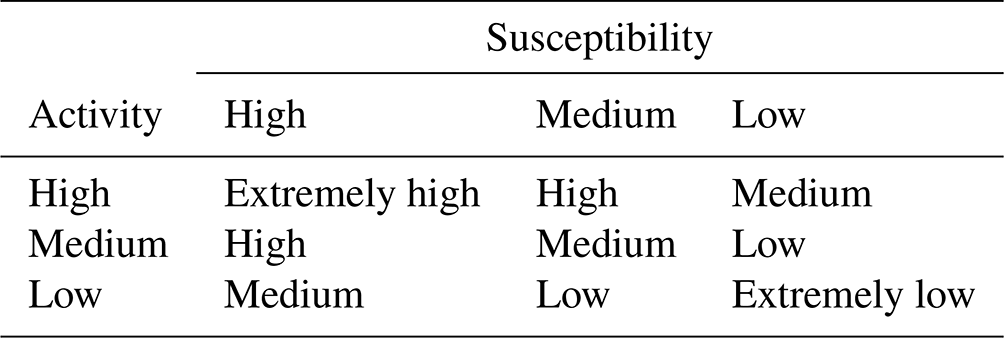
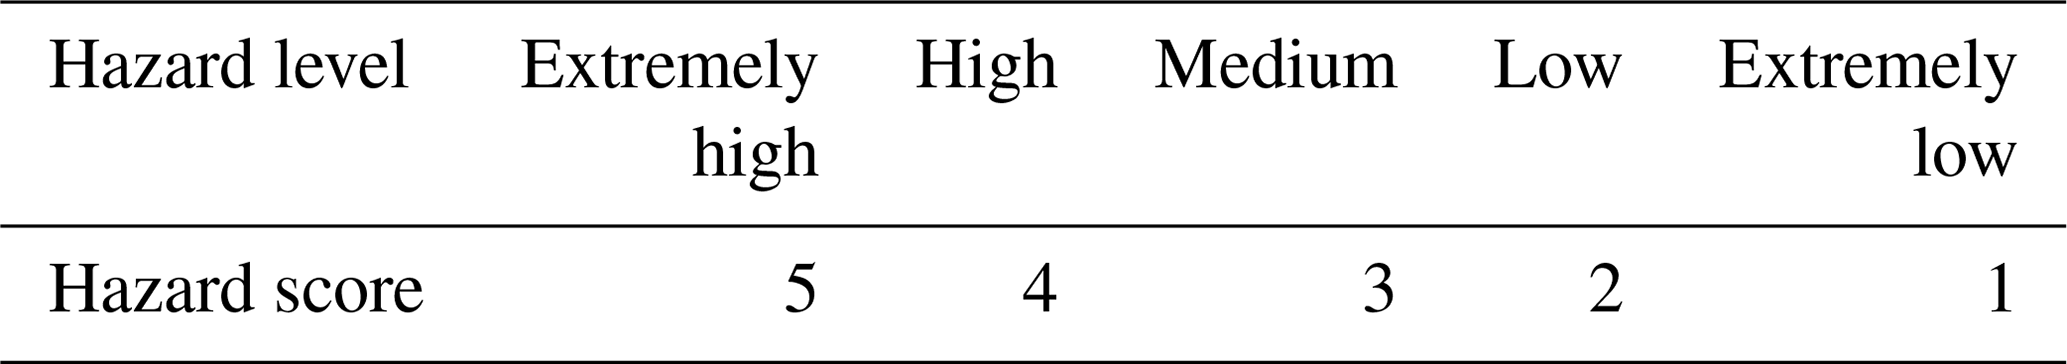
By considering landslide susceptibility and activity levels, the combined evaluation for hazard level is subsequently listed in Table 7. The hazard levels are then divided into five classes for the hazard score as listed in Table 8.
Table 7Hazard level combined by evaluation of landslide susceptibility and activity (Lin, 2017).
3.3 Exposure analysis
It is essential to calculate how many households, traffic, and public utilities are exposed to risk zoning. For example, a slope in the mountains with no roads and no households indicates no damage even if a landslide occurs (Zheng, 2018). Therefore, the degree of exposure can refer to the items suffering the slide slope. Finding out and classifying exposed items within the different slopes around the tribe region is crucial in this study. In other words, the degree of damage caused by the impact of a landslide should be critically quantified. This study referred to the report by Lin (2017) and redefined the exposure degree that can be graded according to the exposed objects' importance. The exposed items include affected households in different quantities, the main roads and bridges crossing the affected joint, critical public facilities, and reservoir areas. To effectively identify the exposure level of the protected objects in the tribe region, the number of households of exposed objects is re-adjusted and enhanced, and squared values of the raw grades are presented in Table 9. It also contains the corresponding exposure score in Table 10.

3.4 Vulnerability analysis
Although several factors do determine physical vulnerability (Papathoma-Köhle et al., 2022), vulnerability analysis in this study initially represents the degree of damage to the exposed object by considering the relative position from the landslide, runout, and deposition area for the rapid risk zoning. The closer the distance is, the greater the damage and the higher the vulnerability will be. Moreover, the weighting sometimes is considered to be added according to the attributes of the exposed items. Therefore, the vulnerability index proposed by Papathoma-Köhle et al. (2017) was adopted in this study to evaluate the vulnerability of the Neikuihui tribe, and the details of the vulnerability index are defined as follows:
where VL is the distance between the household and a susceptible landslide, divided into three levels (low, medium, high) ranging from 1 to 3. The closer the distance is, the higher the VL will be. Similarly, VF is the distance between the public facilities and a susceptibility landslide, divided into three levels (low, medium, high) ranging from 1 to 3. Due to the small area of the tribe slope unit, it is difficult to directly quantify the distance between the susceptible landslides and the households/public facilities. Hence, the study judges the distance by assuming that the scarp is the source of the collapse and that its migration area does not exceed the scope of the slope unit. If the collapsed soil and rock encounter a river, the soil and rock will move to the river. Accordingly, a high level of VL is defined as households/public facilities being buried directly by soil and rock, a medium level is the possibility of being buried, and a low level is no chance of being buried.
WR means the impact of the potential collapse area on residents, and WF means the impact of the potential collapse area on public facilities. Here, WR and WF are set to be 1 as a fixed value for the preliminary evaluation. NR is the number of households, and NF is the number of public facilities. Then the vulnerability score (VS) of a slope unit is the combination of VSR + VSf and total weight Wtotal= NR × WR + NF × WF; then the vulnerability index (VI) can be written as follows:
Consequently, the vulnerability level and score based on the vulnerability index (VI) are revealed in Table 11.

3.5 Risk analysis
As revealed in the “Introduction” section, Varnes et al. (1984) have defined risk = hazard × exposure × vulnerability, where hazard, exposure, and vulnerability are all described in a qualitative way as mentioned above, and the overall structure of risk assessment can achieve the purpose of mutual comparison (Zheng, 2018). The risk index (RI) of each slope unit around the tribe refers to the ratio of the risk score (RS) to the total marks of the score (RSmax) as follows (Pan et al., 2019):
where the RSmax is 75 as the summation of the maximums of previous scores. Then the risk level of a slope can be obtained from Table 11.
4.1 Hazard analysis results
4.1.1 Susceptibility and activity analysis results
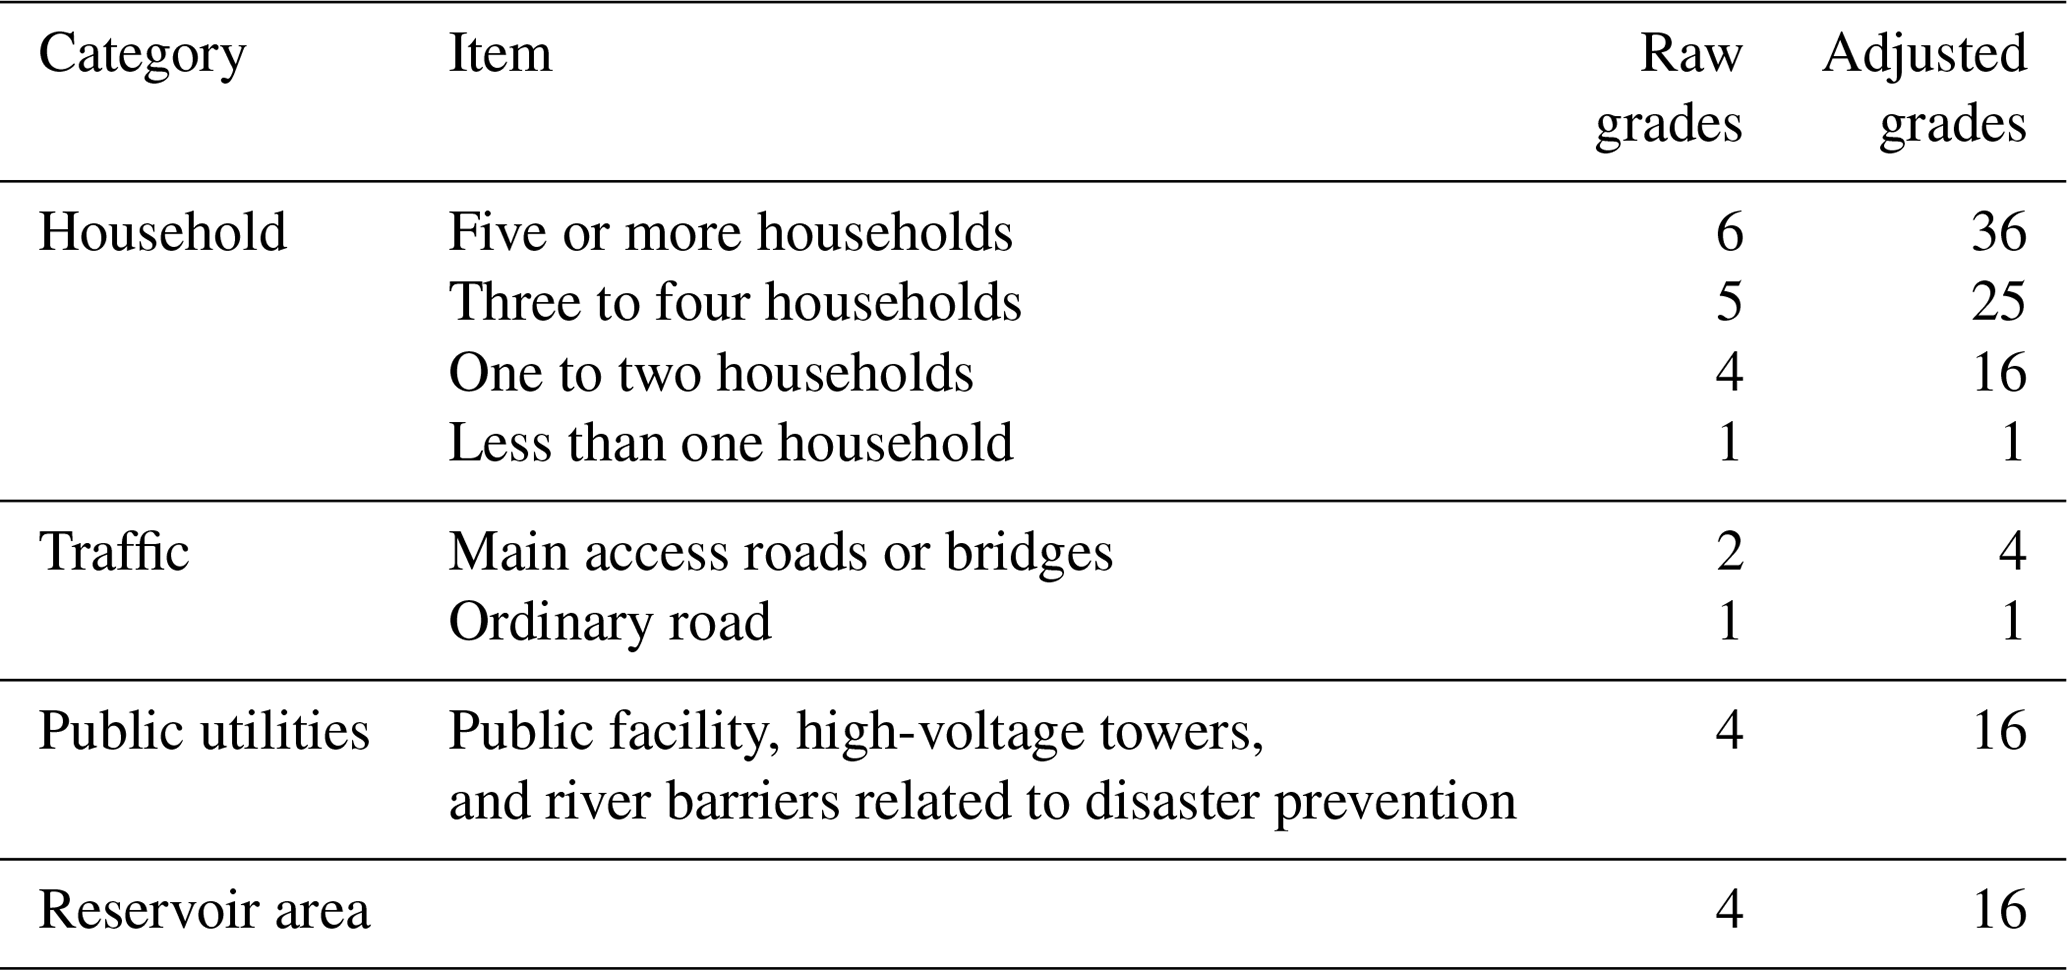
Based on the classification of the slope, river distance, lithology, dip slope, and distance away from the main geological structure in Table 1 and basic information as shown in Fig. 2, susceptibility levels of 14 slope units of the Neikuihui tribe are provided and depicted in Fig. 6, and the corresponding grades are listed in Table 12. Among 14 slope units, Nos. 1, 2, 3, 6, 7, and 9 have high landslide susceptibility levels in which the slope degrees are above 45∘ and are adjacent to or intersecting with the river.
Table 12Grades and levels of landslide susceptibility of slope units around the Neikuihui tribe.

Figure 6Susceptibility level referring to slope units around the Neikuihui tribe (background: modified from 2020 data from the Department of Lands, Ministry of the Interior, for research purposes only; aerial: ESRI ArcGIS 10.4).
Based on the classification of scarps, slope toes, rock formations, erosion gullies, and surface features as mentioned in Table 2, this study gives levels of Activity 1 and Activity 2 of 14 slope units around the Neikuihui tribe as detailed in Tables 13 and 14, respectively, according to the comprehensive activity level as defined in Table 6. Because the scarp is slightly expanded and the river channel is significantly undercut, it leads to continuous erosion of the slope toe. Moreover, aerial photo interpretation shows that rock layers would be exposed and have the susceptibility to slide forward. Based on these observations, Nos. 6, 11, 13, and 14 have high activity levels, as shown in Fig. 7.
Table 13Grades and levels of Activity 1 of slope unit around the Neikuihui tribe.
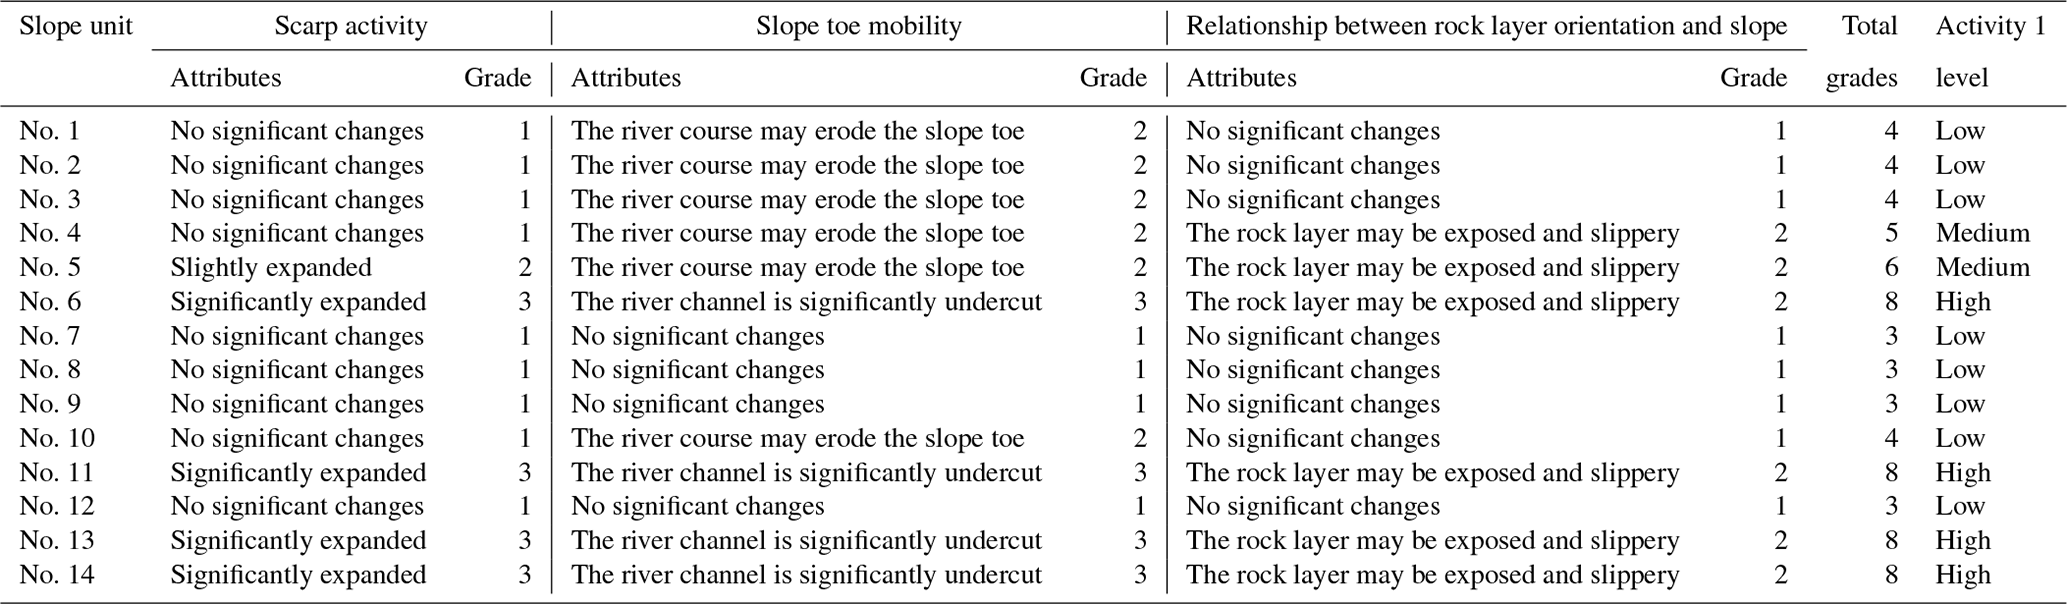
Table 14Corresponding grades and levels of Activity 2 of slope units around the Neikuihui tribe.

This study employs slope unit No. 11 as an example to explain how to judge the degree of change of scarp through orthophoto images of different periods. The brighter and more saturated red in the orthophoto image, as in Fig. 8, means that the planting slope is complete and lush. Then this study examines the orthophoto images of 8 June 2013 and 14 July 2015. Since some vegetation has disappeared and the soil and rocks are exposed on 14 July 2015, the No. 11 example is treated as a basis to give all the slope units in the Neikuihui tribe a score for activity.
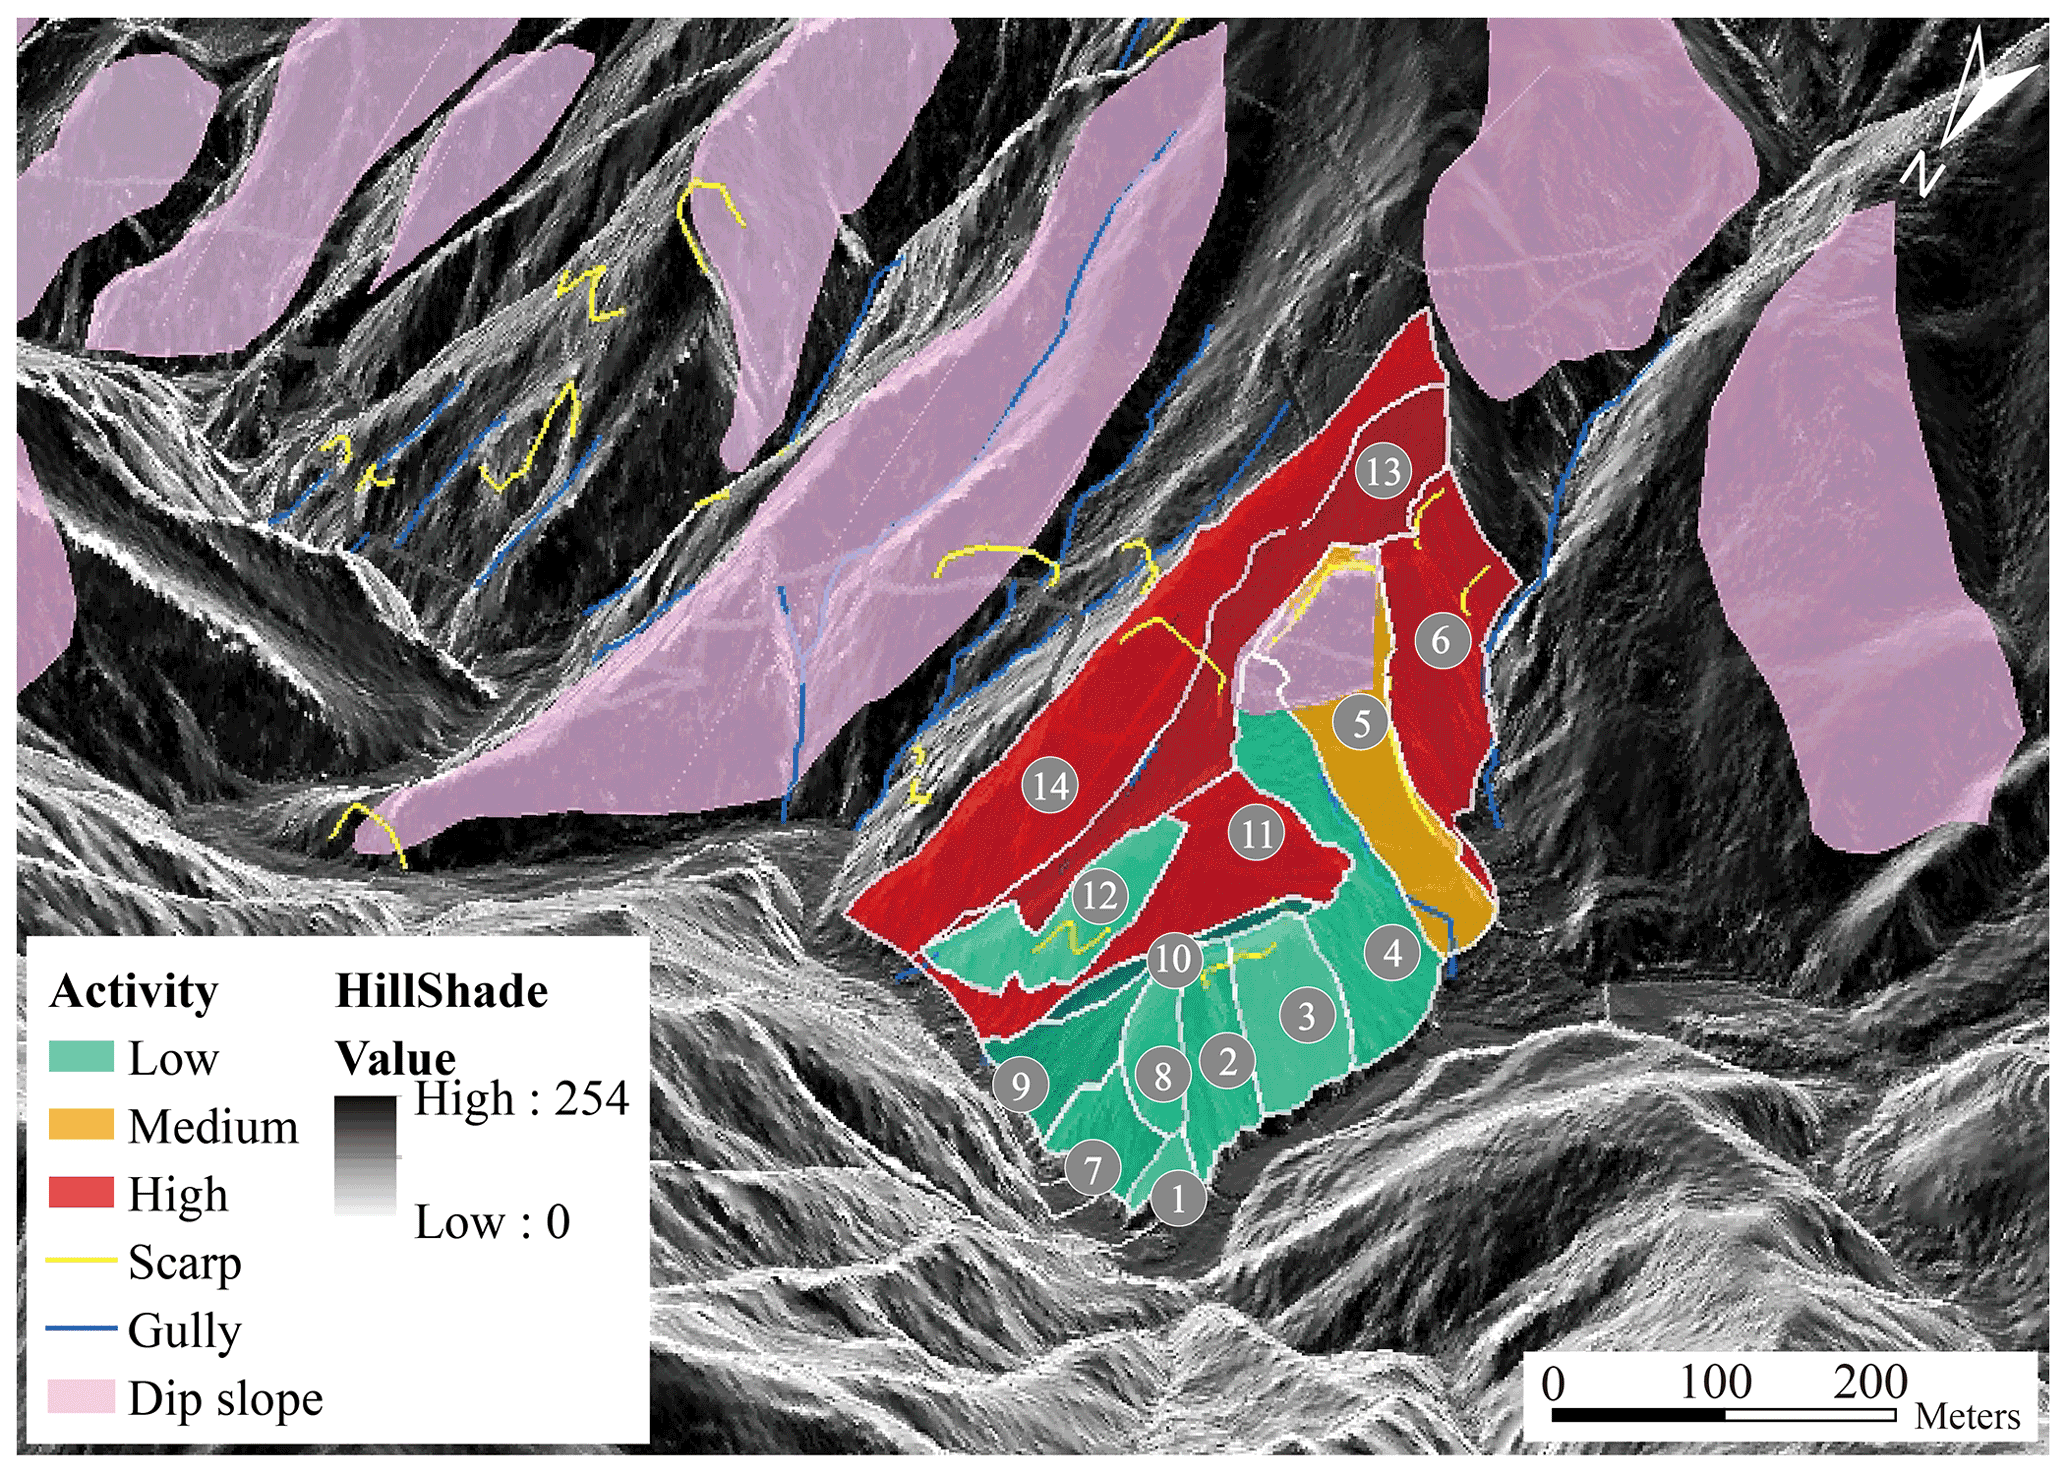
Figure 7Activity level referring to slope units around the Neikuihui tribe (background: modified from 2020 data from the Department of Lands, Ministry of the Interior, for research purposes only; aerial: ESRI ArcGIS 10.4).
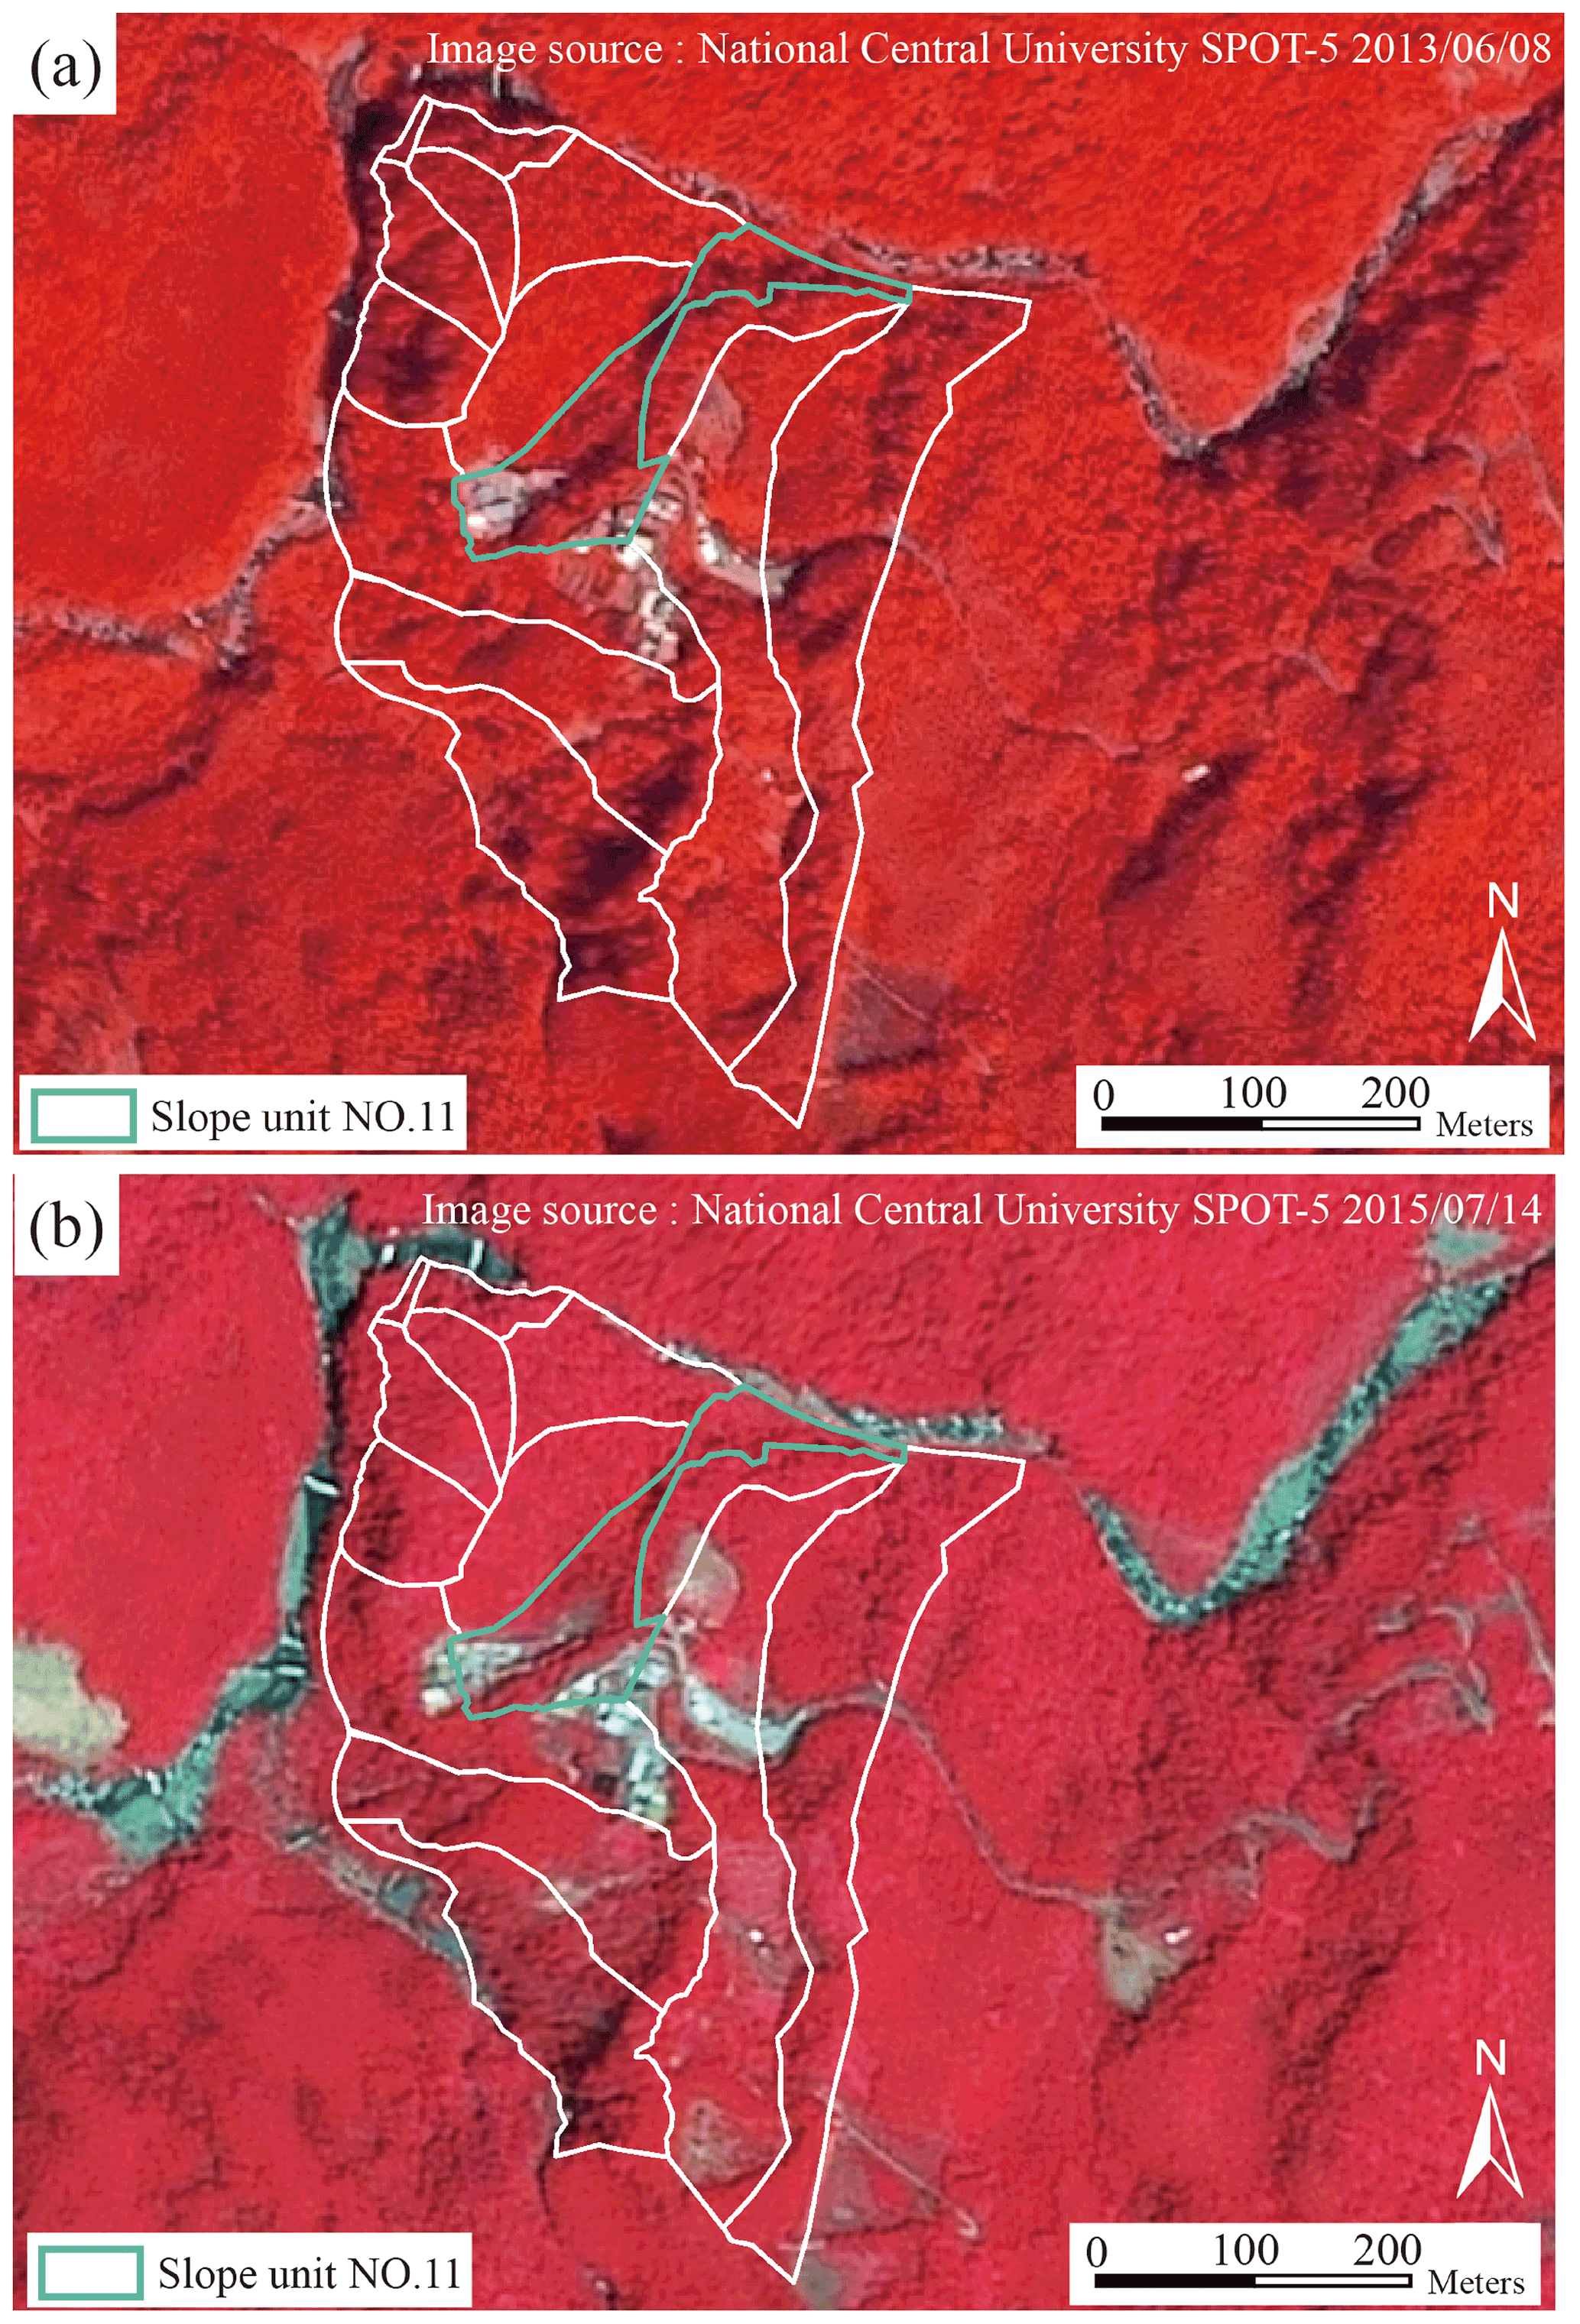
Figure 8Comparison of the terrain features in (a) 2013 and (b) 2015 orthophoto maps at the No. 11 slope unit (modified from National Central University SPOT-5 2015; aerial: ESRI ArcGIS 10.4).
4.1.2 Hazard level and score results
By combining the evaluation results of landslide susceptibility and activity levels as referred to in Tables 12, 13, and 14, the hazard scores of each slope unit can be obtained as listed in Table 15, leading to analyzed results of landslide hazard levels of 14 slope units around the Neikuihui tribe, as well as the corresponding illustration map as depicted in Fig. 9. The No. 6 slope unit has an extremely high level of landslide hazard, and Nos. 11, 13, and 14 have high levels of landslide hazard. It can be reasoned that No. 6 is next to the river channel and significantly undercut, as shown in Fig. 8.
Table 15Hazard levels and scores of slope units around the Neikuihui tribe.
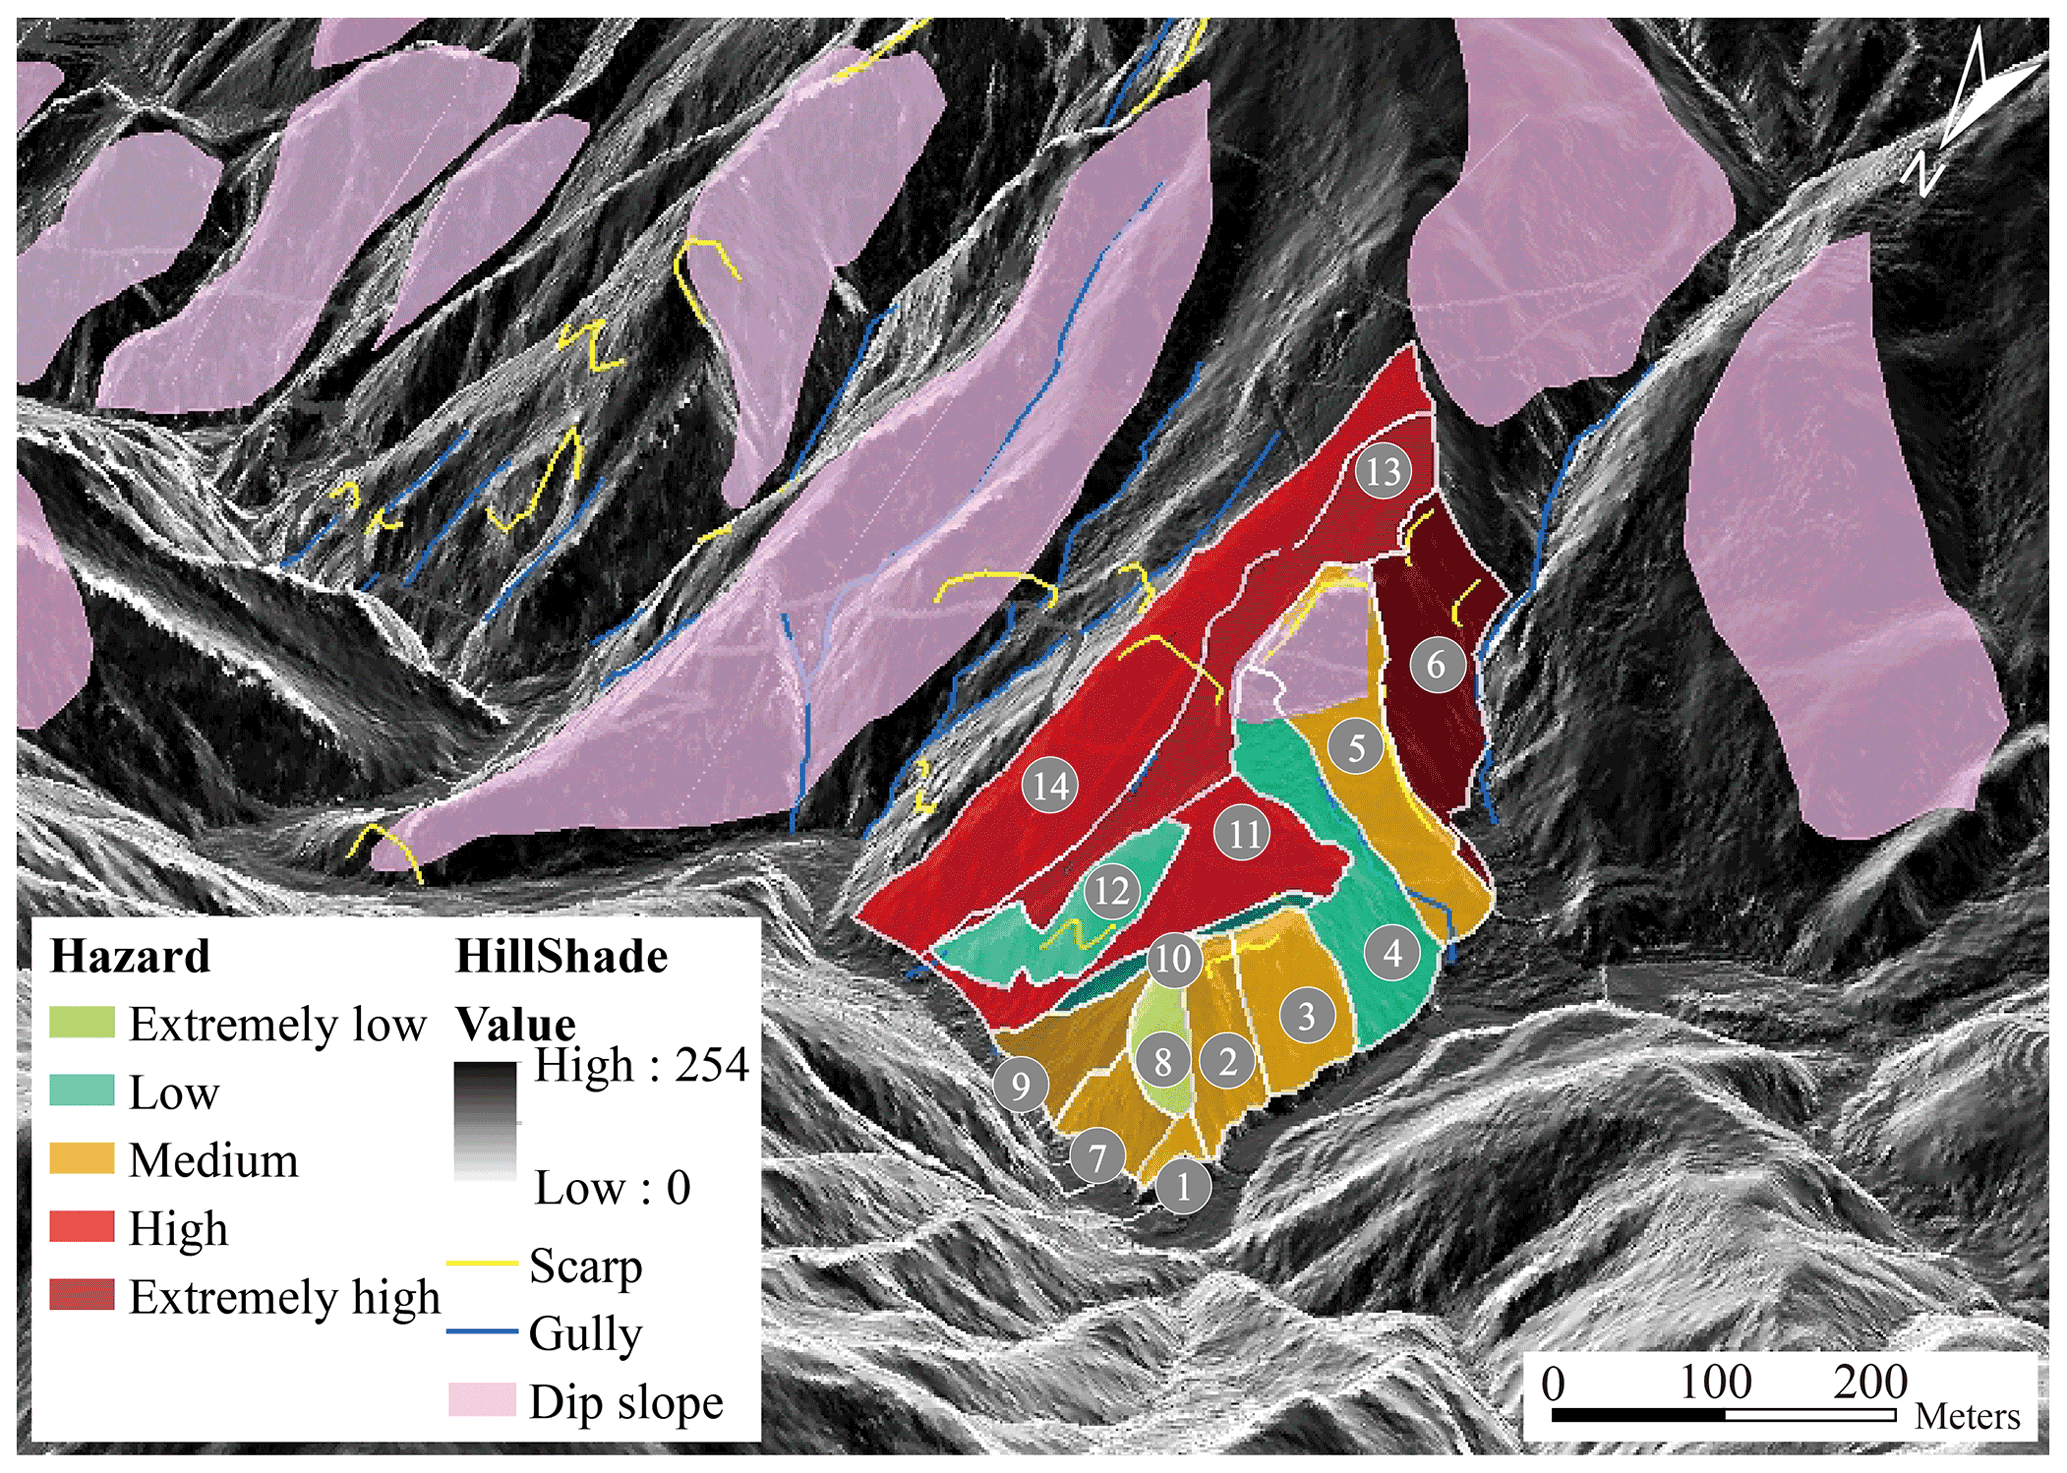
Figure 9Hazard level mapping of landslide referring to slope units around the Neikuihui tribe (background: modified from 2020 data from the Department of Lands, Ministry of the Interior, for research purposes only; aerial: ESRI ArcGIS 10.4).
4.2 Exposure analysis results
Based on the classification of households, transportation, and essential facilities as listed in Table 9, this study determined exposure levels of 14 slope units around the Neikuihui tribe as detailed in Table 16, and the corresponding mapping is shown in Fig. 10, which is based on the aerial photo to visualize the resident locations better. Results indicate that Nos. 4, 5, 11, and 13 have higher exposure levels. Noticeably, the residents of the Neikuihui tribe mainly live in Nos. 4 and 11, as shown in Fig. 4b. Moreover, landslides may block the major external road leading to the outside, causing evacuation and material transportation difficulties. Consequently, these two units have the highest exposure levels.
Table 16Exposure levels and scores of slope units around the Neikuihui tribe.

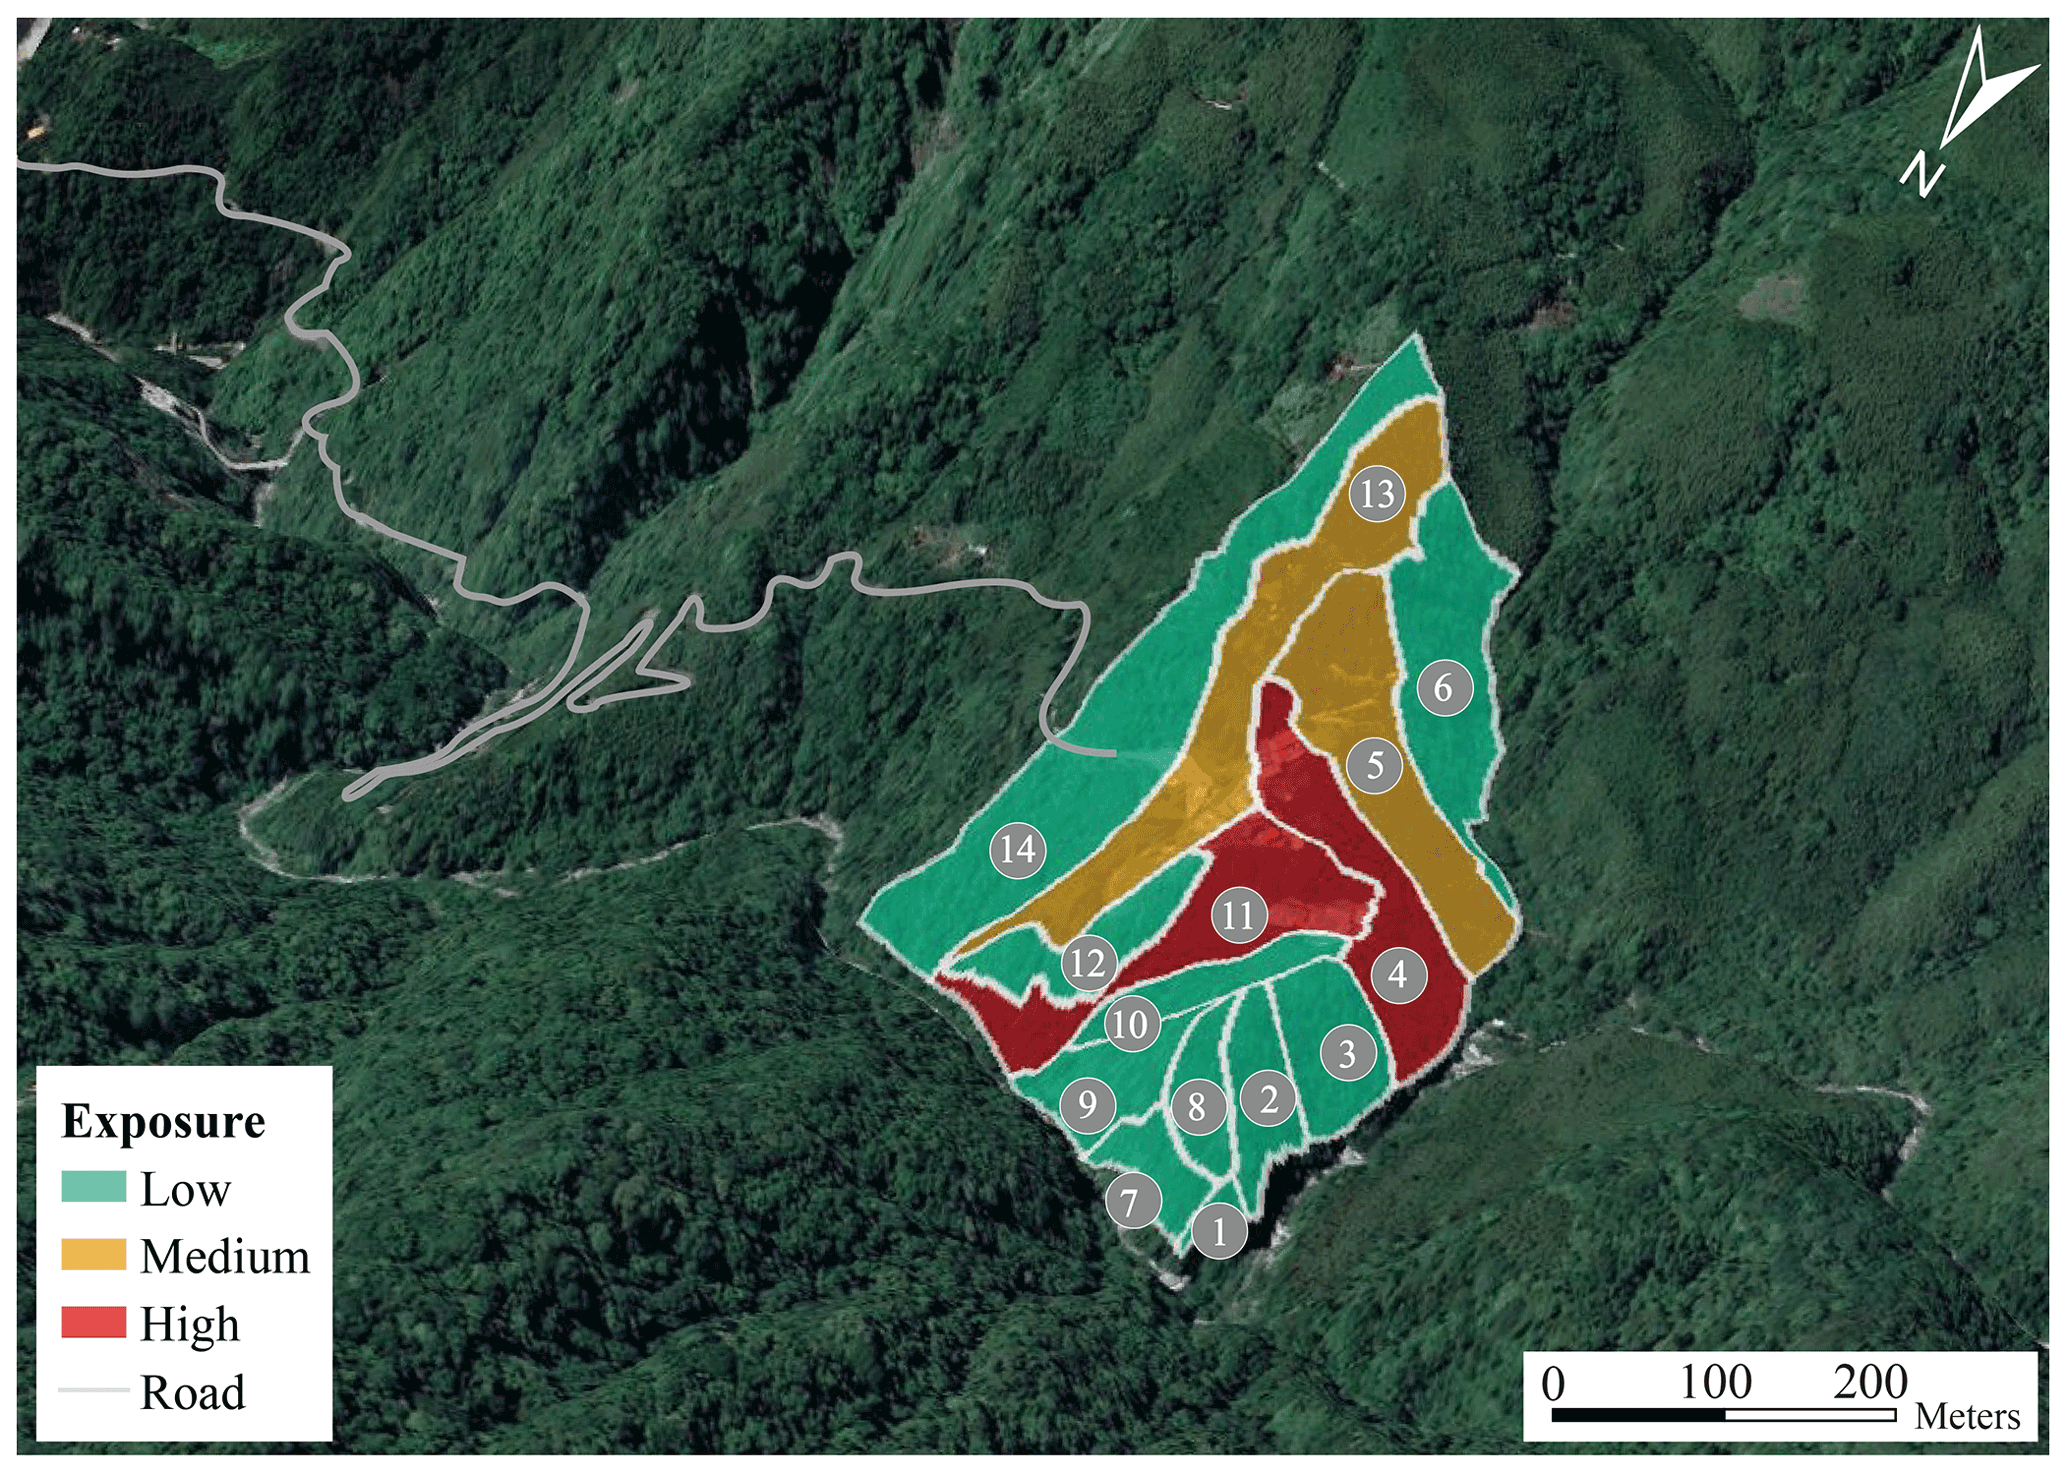
Figure 10Exposure level mapping of landslide referring to units around the Neikuihui tribe (background: modified from © Google Earth 2021; aerial: ESRI ArcGIS 10.4).
4.3 Vulnerability analysis results
With the description of the vulnerability assessment method in the previous section, this study used a 1 m × 1 m DEM to manually interpret the scarps and erosion ditches around the Neikuihui tribe, as shown in Fig. 2f. Zheng (2018) proposed that the possible impact range of the landslide is interpreted based on the principle of the landslide area and the farthest run-out distance, and the transport of landslides will not be blocked by the terrain if there is no high or steep terrain. Moreover, the landslide transport's distance and direction are kept in the original state, indicating that the influence range would cover the source area and landslide path. However, the landslide path should not exceed the ridgeline of the slope. The landslide gradually spreads after entering the flat ground, and deposits accumulate. According to the above principles, this study judges the possible impact range of the soil and rock from the calculation process of the vulnerability index proposed by Papathoma-Köhle et al. (2017). The difference in impact weights in the vulnerability analysis is based on the landslide extent and path to the households and public facilities. This study utilized the 1 m × 1 m DEM map to identify the possible locations of the collapse and then judged the vulnerability by the slope aspect and settlement distribution for the burry effect.
The vulnerability levels of 14 slope units around the Neikuihui tribe are listed in Table 17. For example, Wtotal of the No. 4 slope unit equals 4, and VS = 1 × (3 × 1) + 4 × (1 × 1) = 7 because one household has a high VL level (3) and four households have low VL levels (1). Therefore, the vulnerability index of the No. 4 slope unit is 1.75. Compared to other slope units, the No. 11 slope unit is the most vulnerable because some residents in the No. 11 slope unit are close to the landslide, and some are within the potential coverage of the landslide. If the cliff collapses, the foundations of the four households in the No. 11 slope unit will collapse. Therefore, these four households will be considered for high VL levels when calculating vulnerability. Accordingly, Wtotal of the No. 11 slope unit equals 6, and VS = 4 × (3 × 1) + 2 × (1 × 1) = 14, leading to the vulnerability index of the No. 11 slope unit being 2.3. In summary, Nos. 4, 5, 11, 13, and 14 can be found with apparent vulnerability levels because these slope units have residents, as shown in Fig. 11.
Table 17Vulnerability rating of slope units around the Neikuihui.
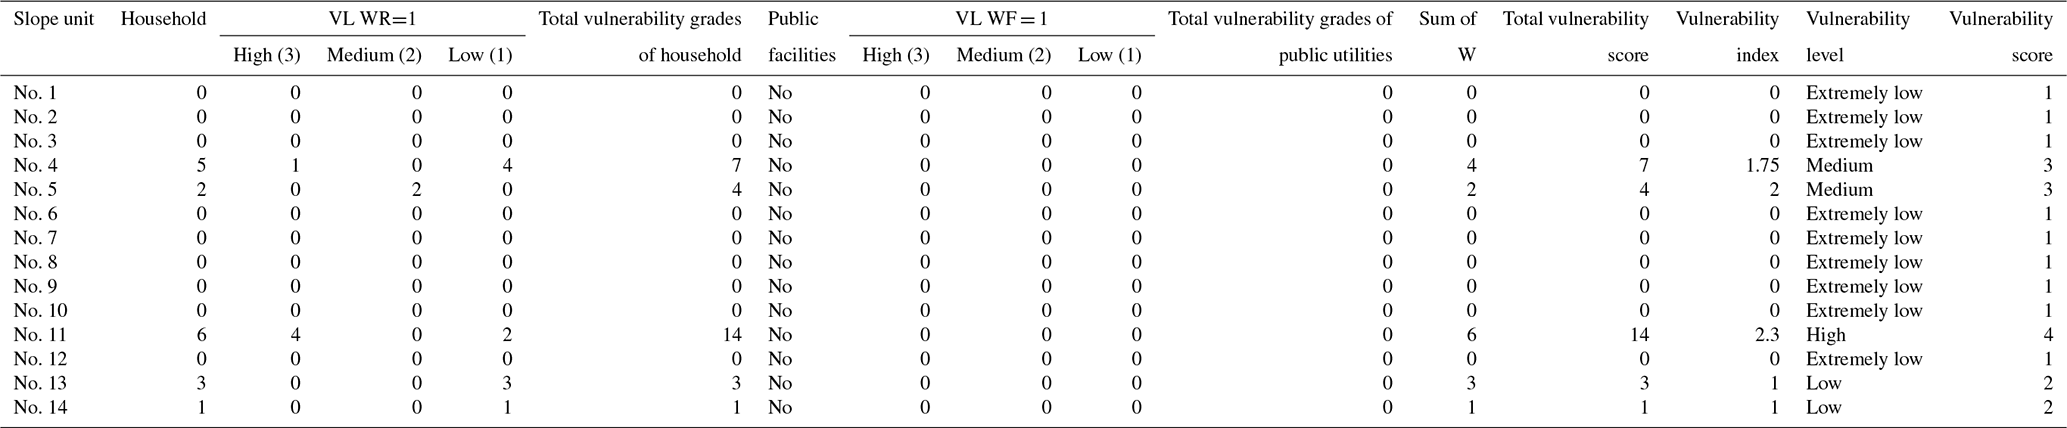
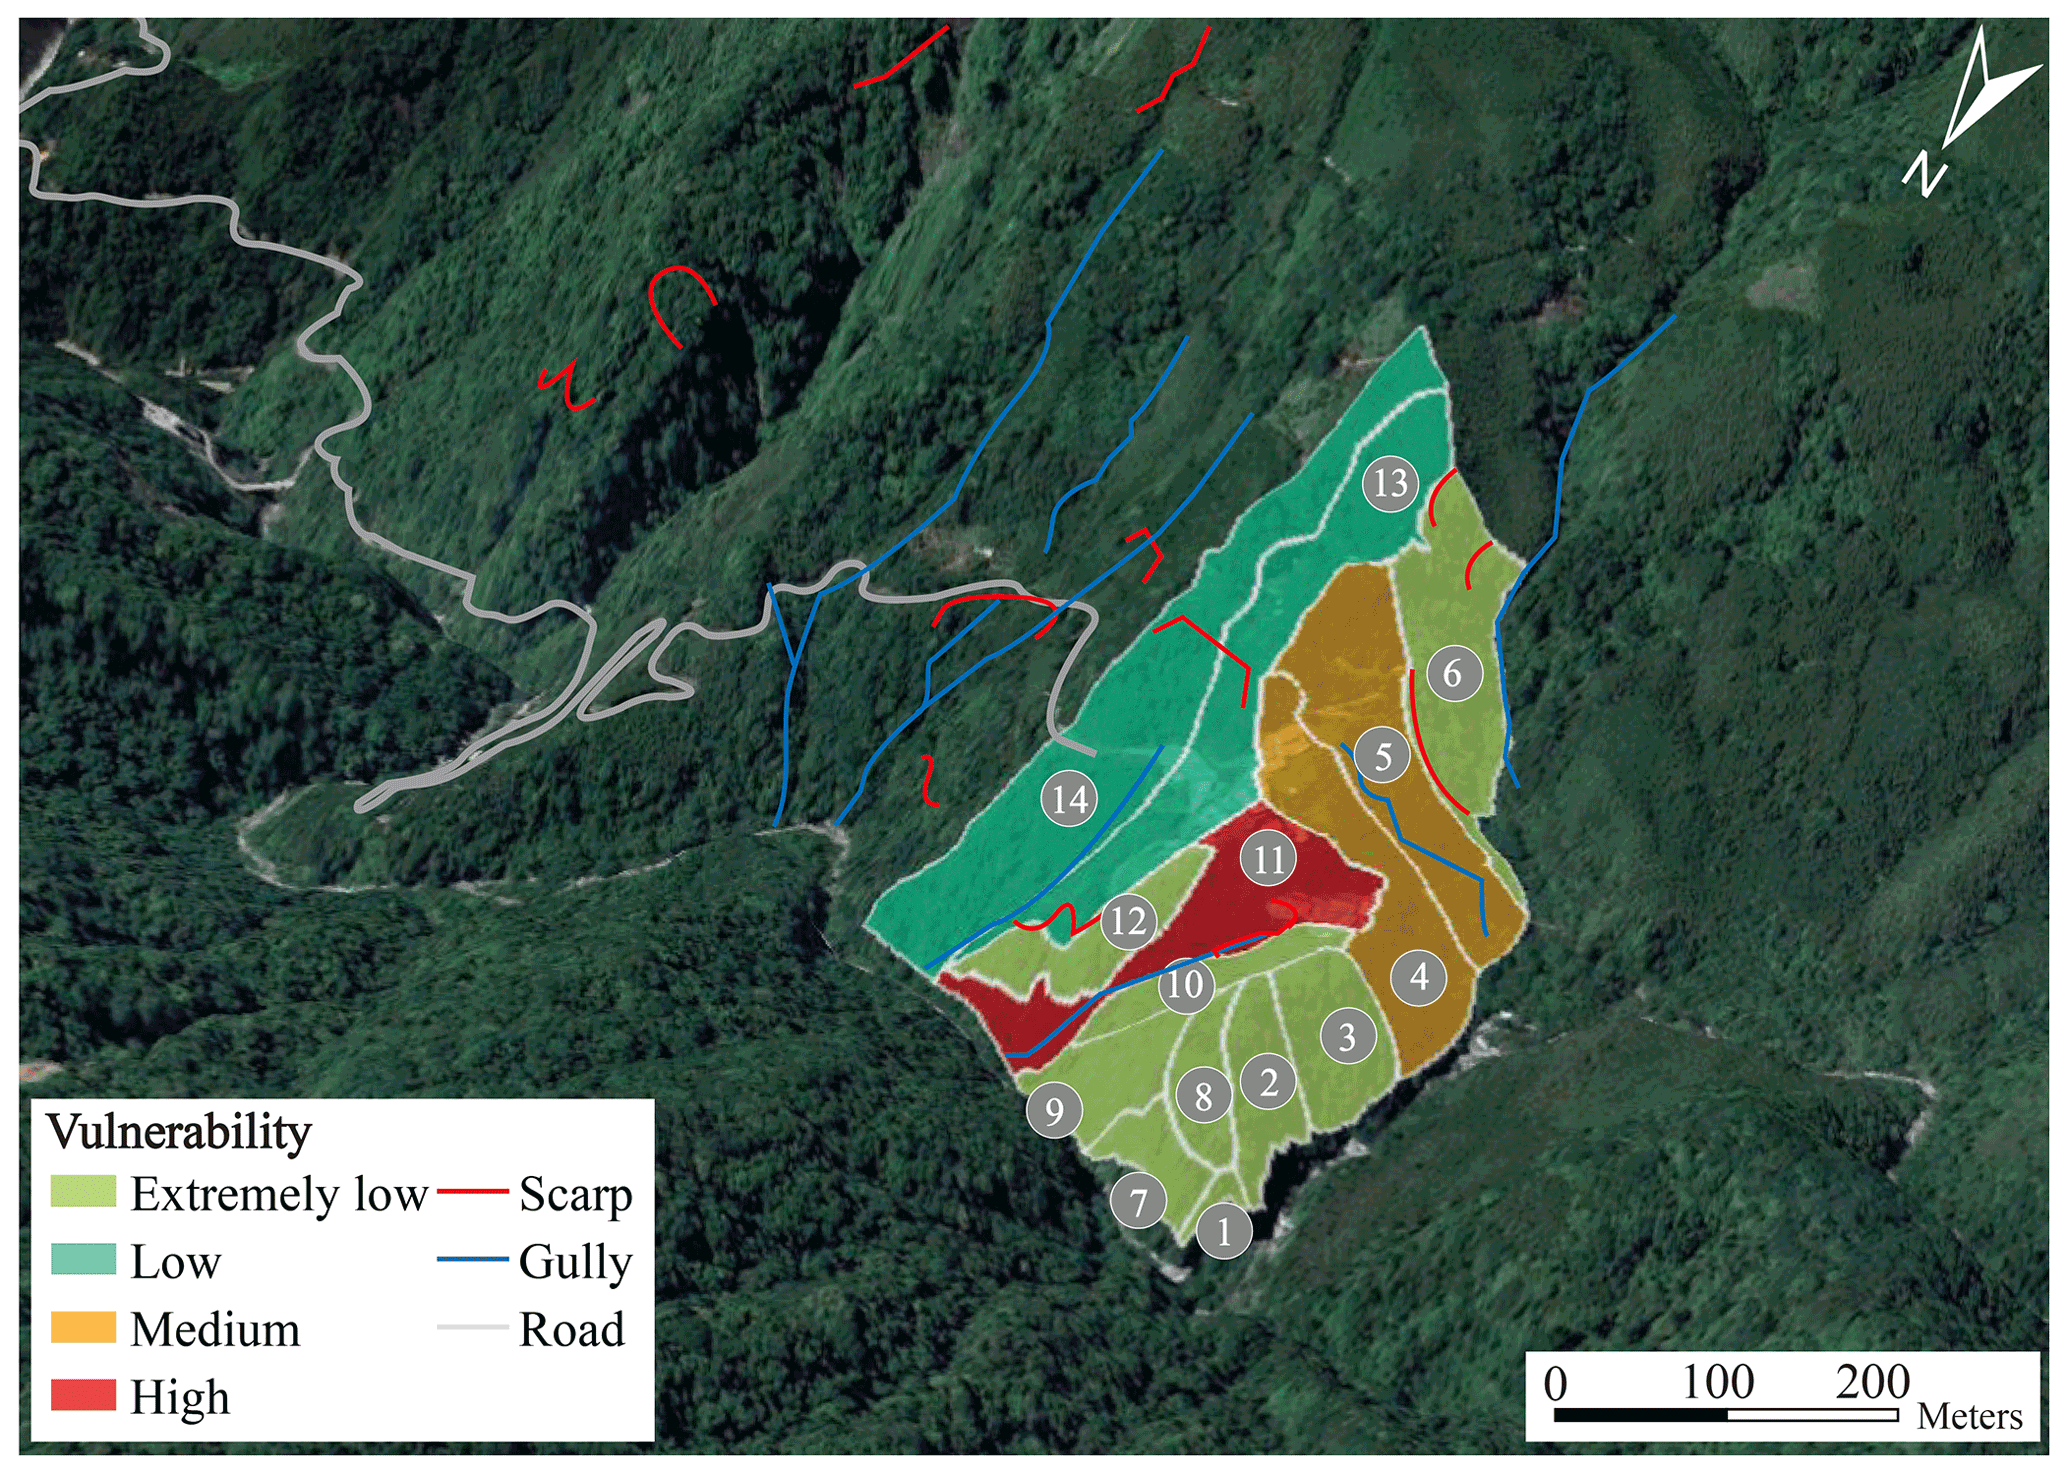
Figure 11Vulnerability level mapping of landslide referring to units around the Neikuihui tribe (background: modified from © Google Earth 2021; aerial: ESRI ArcGIS 10.4).
4.4 Risk analysis results
By combining the scores of hazard, exposure, and vulnerability of each slope unit around the Neikuihui tribe, risk levels were then obtained by score summation as listed in Table 18. The No. 11 slope unit is high risk level, and Nos. 4, 5, and 13 are low risk level. The corresponding mapping result of the landslide risk is shown in Fig. 12. Since slope unit No. 6 is steep and tangent to the river, it is appraised with the highest hazard level at the step of hazard analysis. However, no one lives there, and the landslide has few impacts on human lives and public facilities nearby. Thus, the risk level is not as high as the No. 11 slope unit. Through risk zoning toward slope units, this study can quickly identify which areas need to be prioritized in disaster prevention.
Table 18Risk levels of slope units around the Neikuihui tribe.
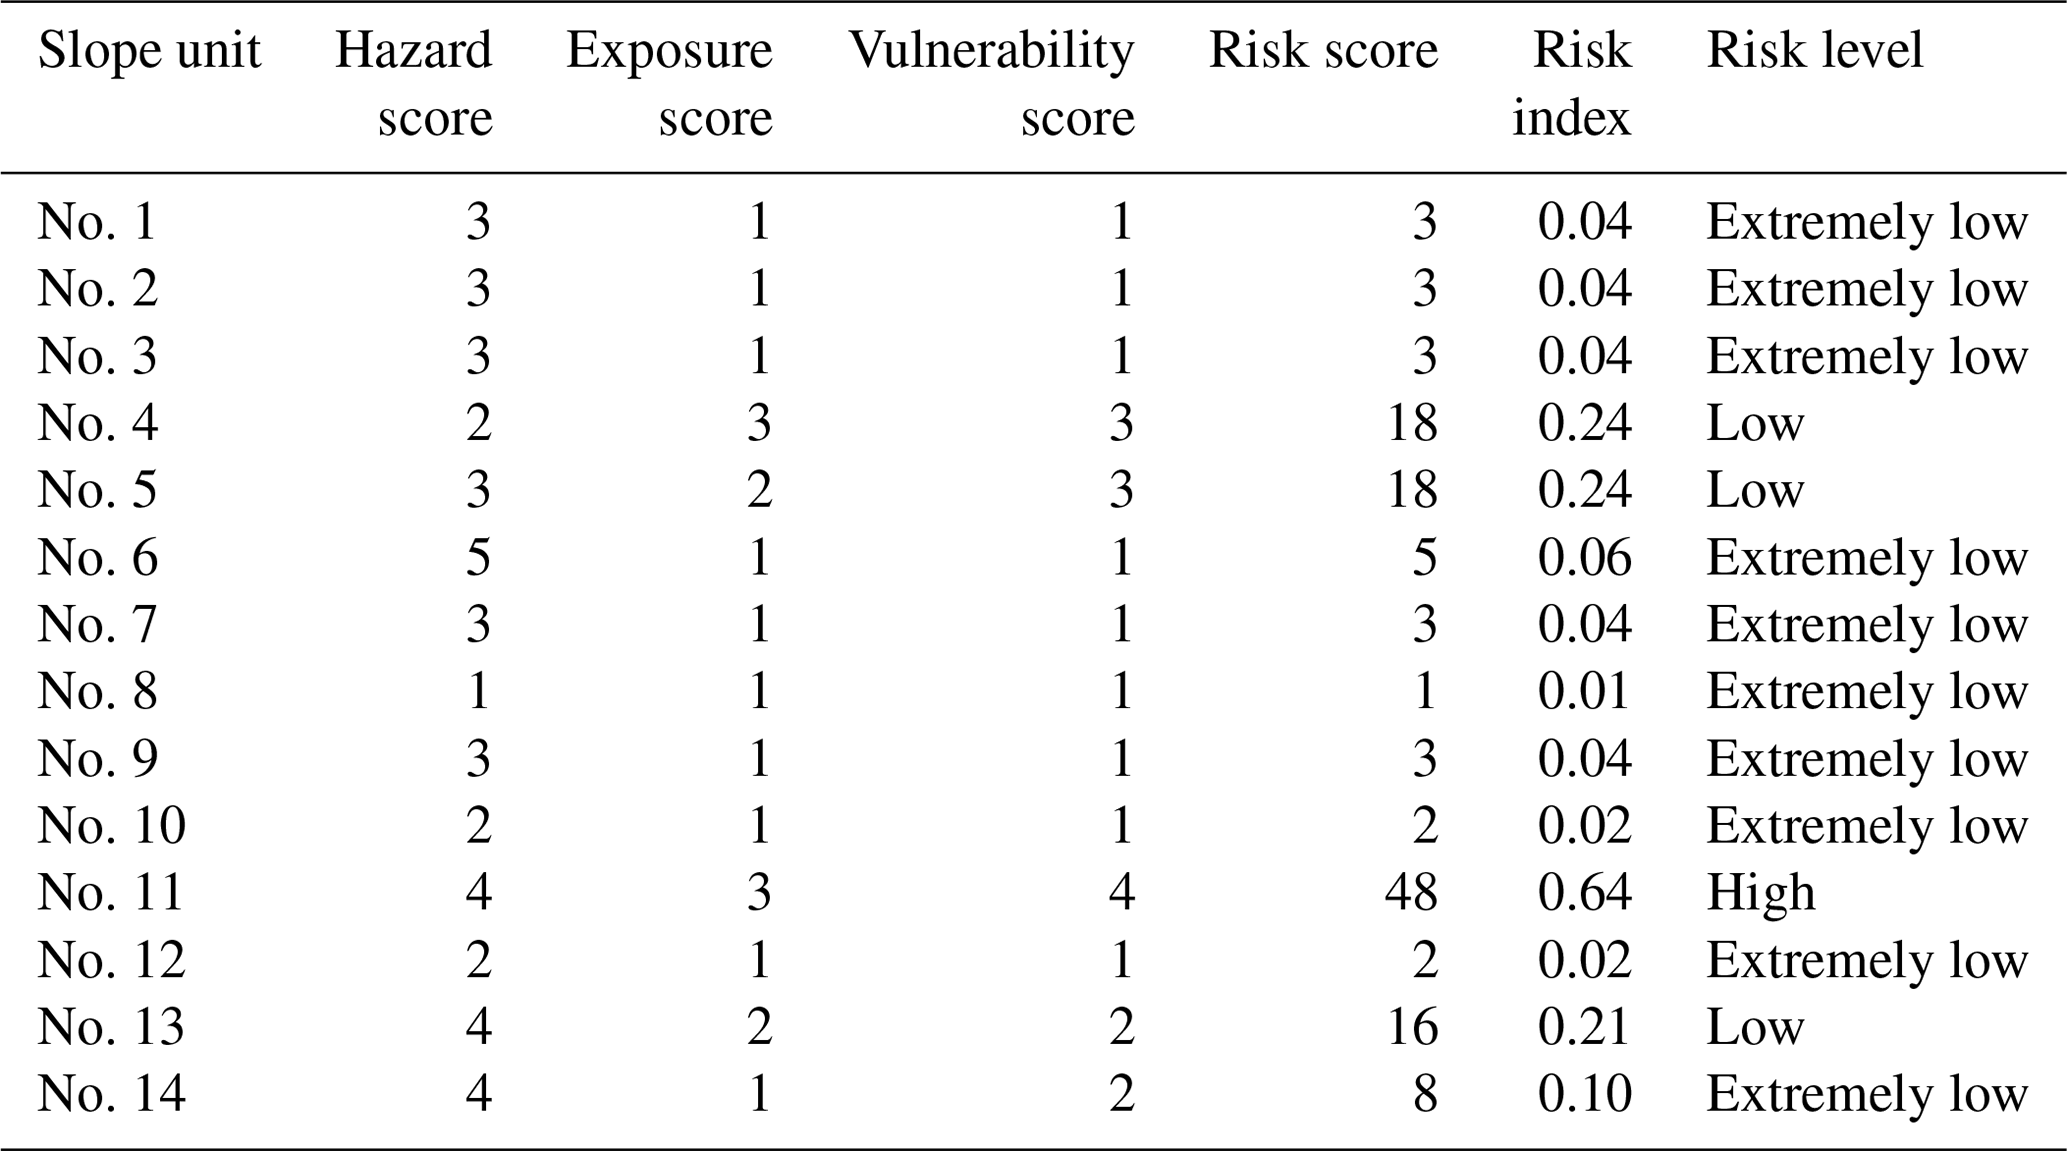
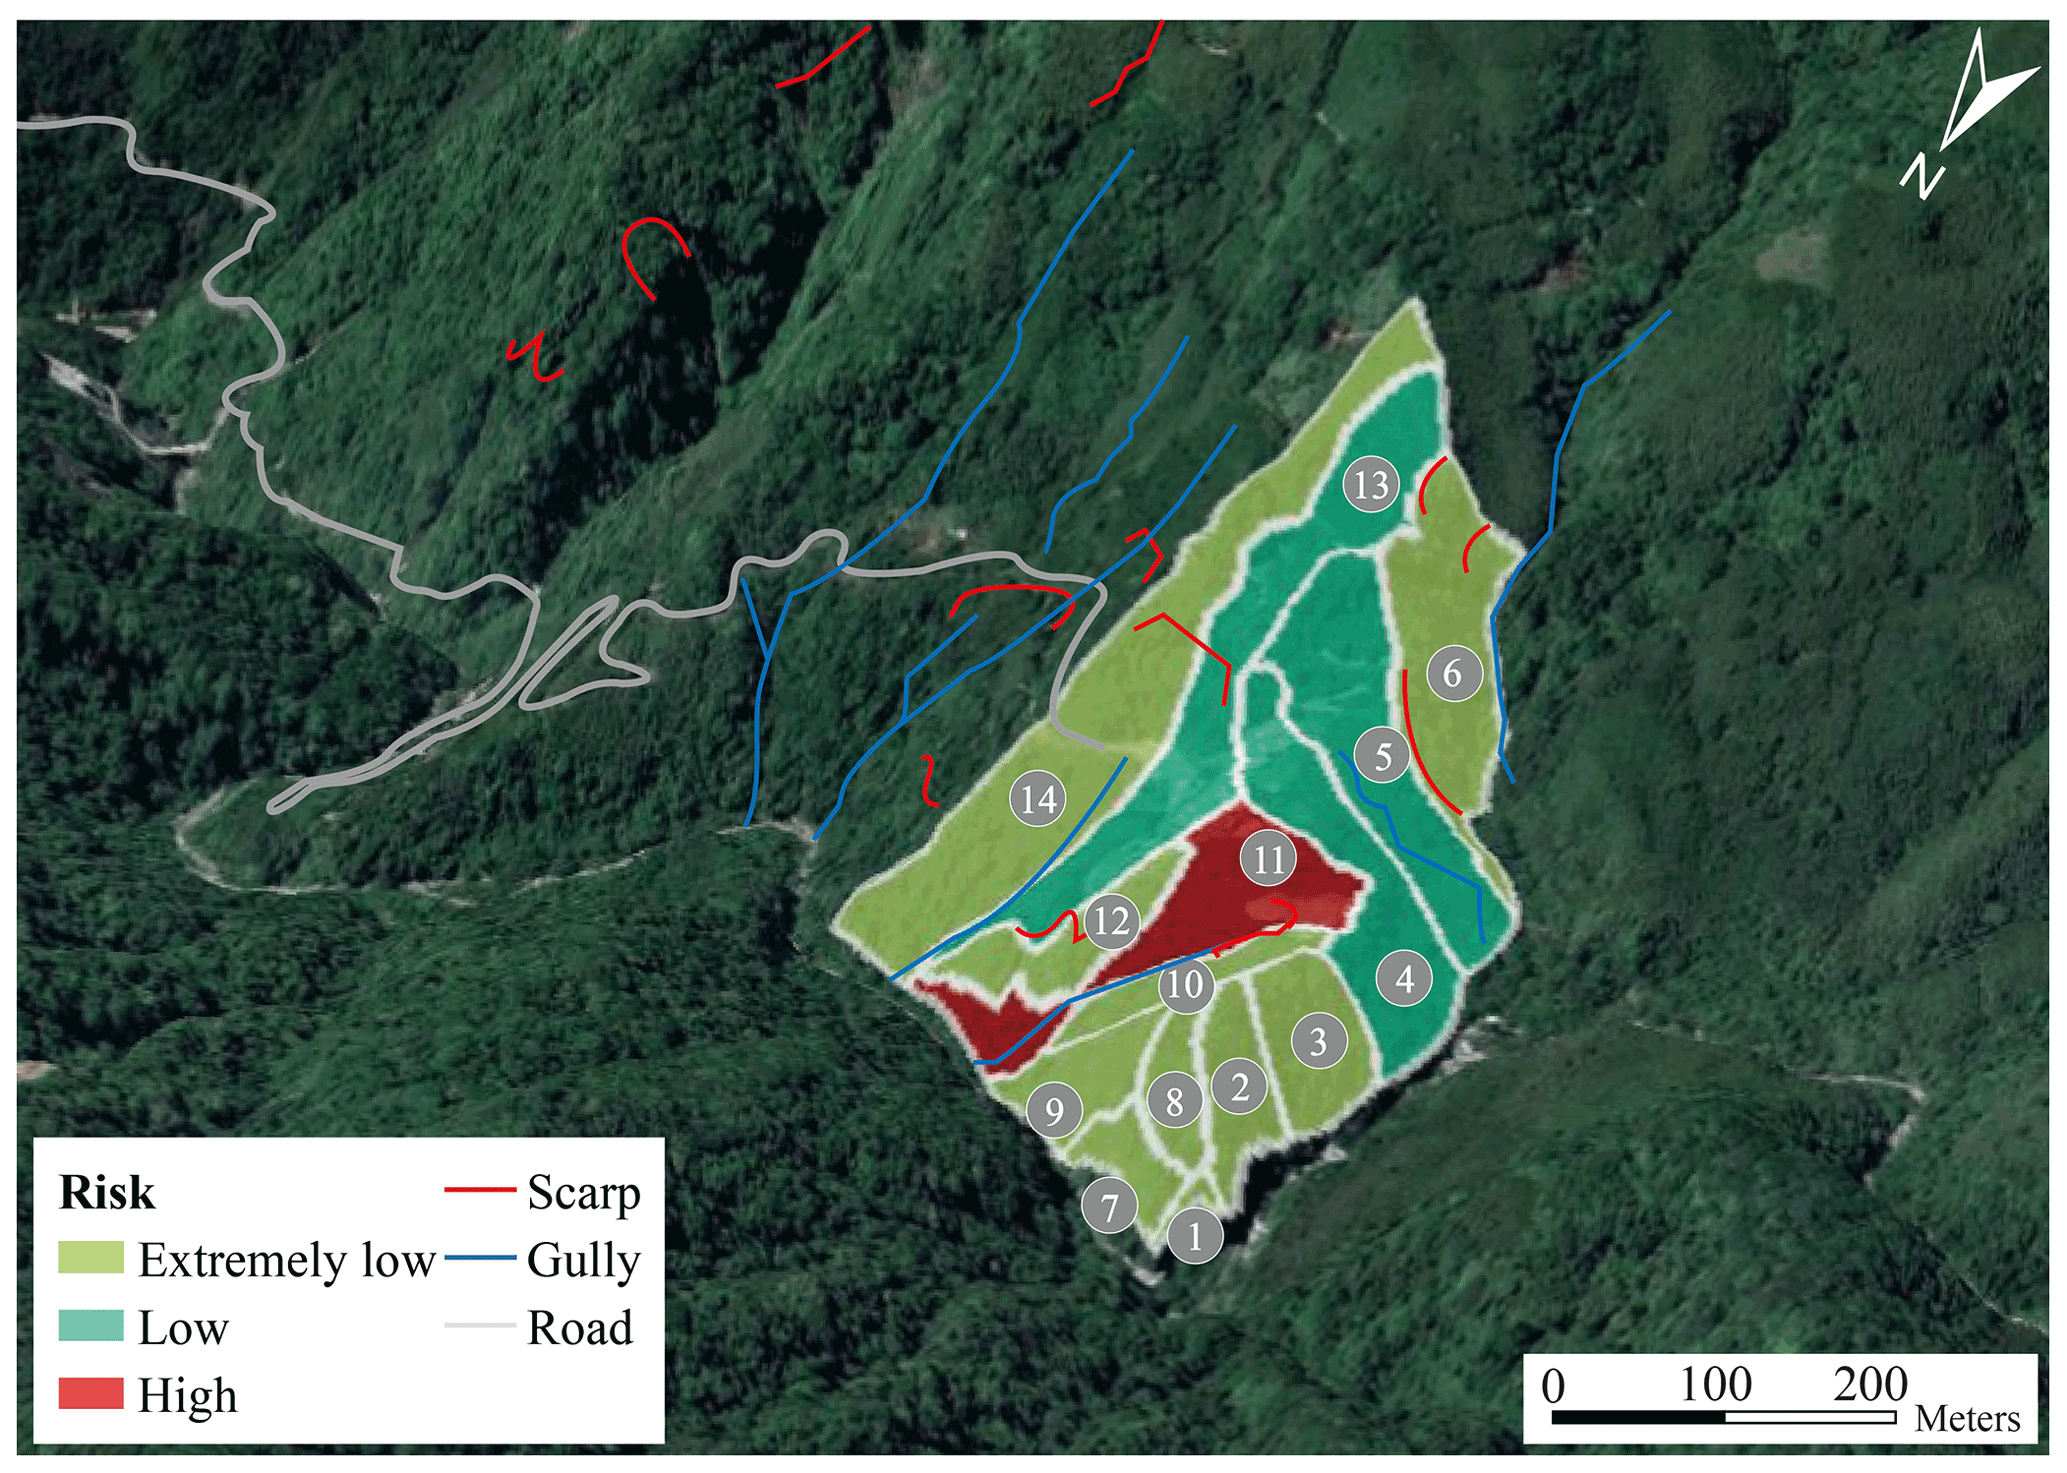
Figure 12Risk level referring to slope units around the Neikuihui tribe (background: modified from © Google Earth 2021; aerial: ESRI ArcGIS 10.4).
Since the risk level of the No.11 slope unit is high, as illustrated in Fig. 13, this study further compared the results with historical disaster events for validation. According to the 2016 report of the Soil and Water Conservation Bureau, Council of Agriculture, the No. 11 slope unit was affected by the torrential rainfall during Typhoon Meiji on 27 September 2016. A landslide disaster occurred at 14:00 (GMT + 8) on the same day. Referring to the historical data of the Fuxing rain gauge station closest to the disaster location, the hourly rainfall record was 45.5 mm, as depicted in Fig. 13. The road's foundation was scoured by rainwater, resulting in a landslide with a length of 8–10 m and a depth of 30–60 cm, as shown in Fig. 14a. The soil yields moved down and rushed into the residential house (Fig. 14b), and trees and telephone poles were seriously inclined at the No. 11 slope unit (Fig. 14c). Through the evidence of landslide disaster at the No. 11 slope unit, the rapid risk zoning method toward multi slope units around the tribal region is confirmed preliminarily.
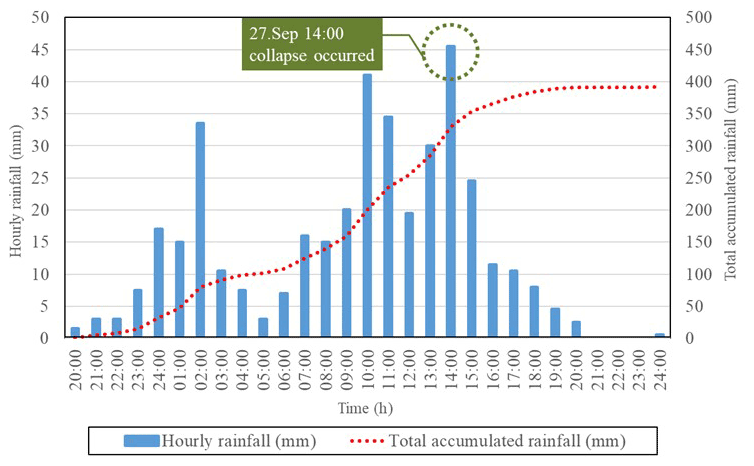
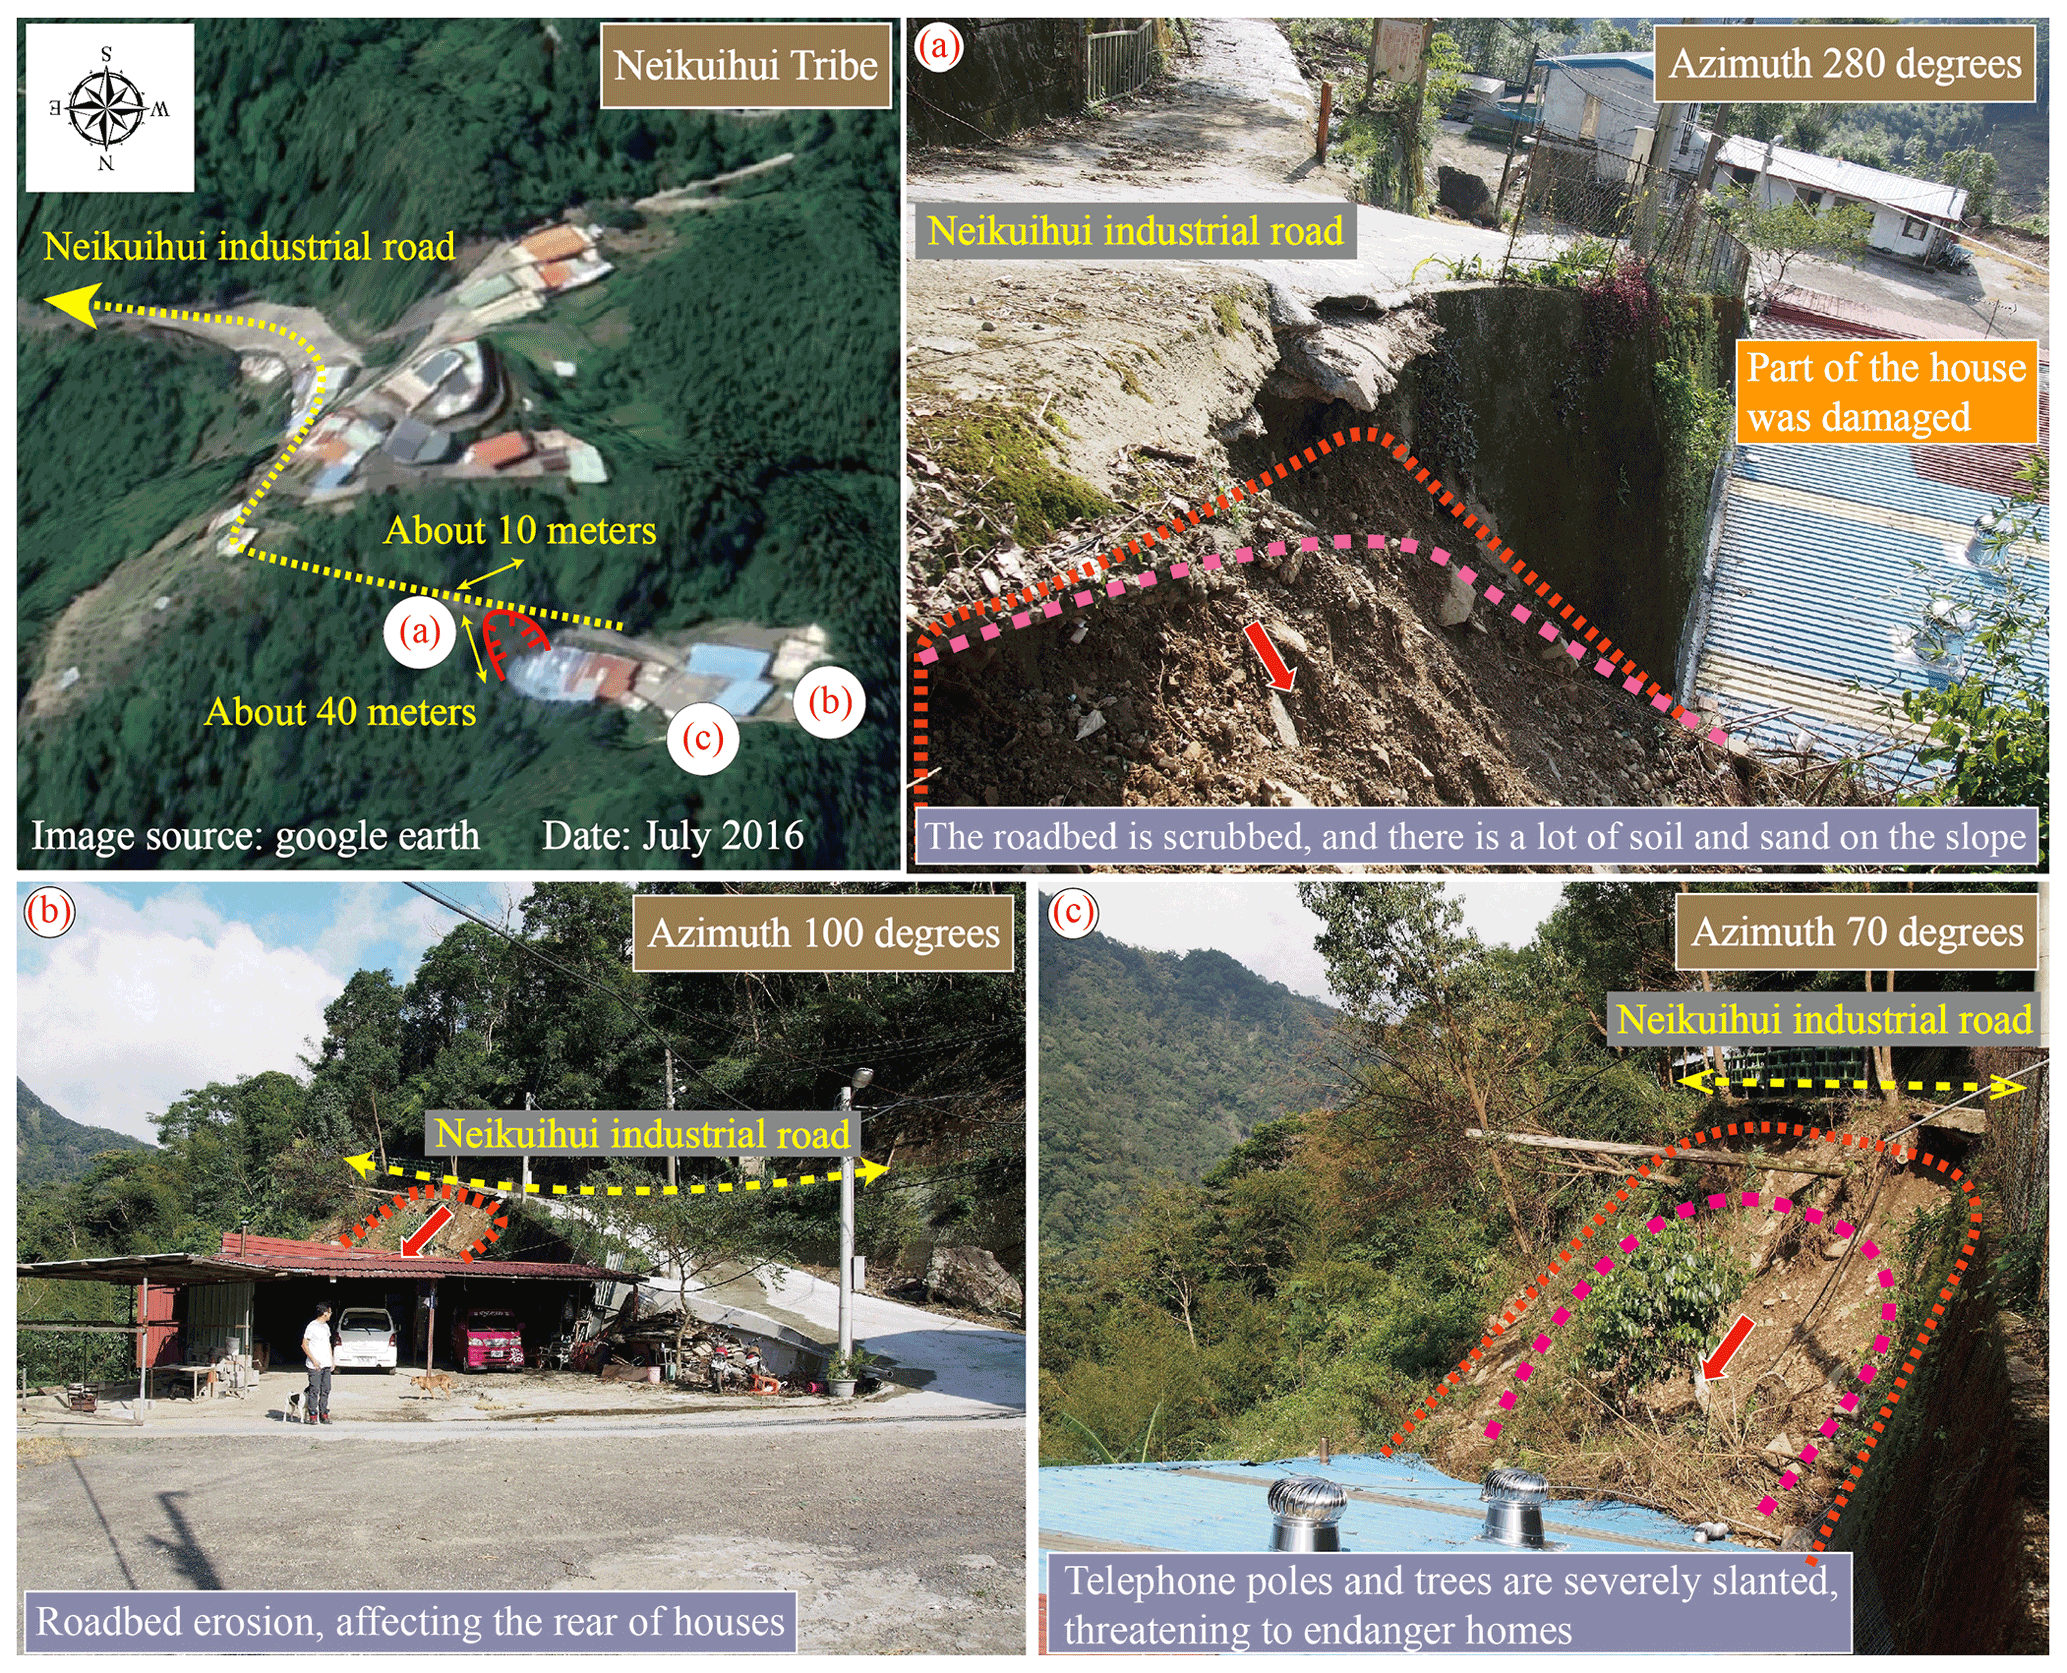
Figure 14Historical disaster event at the No. 11 slope unit during Typhoon Meiji 2016 (picture source: Water and Soil Conservation Bureau, 2016; aerial: ESRI ArcGIS 10.4).
The primary purpose of this research is to establish a simple risk assessment framework for quickly interpreting the collapse of multi-slope units in settlements. The proposed method can quickly assess the risk of slope collapse in various regions through the concepts referred to as previous relevant findings. The advantages and limitations summarized by this research are as follows.
The proposed landslide risk zoning toward small slope units covers the assessments of hazard, exposure, and vulnerability, in which the objects of resident preservation and its value are carefully considered. If the risk zoning is implemented in a large-scale collapse, the above concepts are still necessary and are accompanied by extended methods. For vulnerability assessment, the effect of the more prolonged runout distance of the very large-scale landslide should be re-considered in terms of statistical prediction (Zheng, 2018). This study recommends refining risk zoning with a variety of data integrity and alternative methods based on sufficient materials and process time.
Risk zoning can be expressed in qualitative and quantitative methods. The quantitative method requires very detailed site information and statistics of various parameters, often taking a lot of time and cost. A qualitative description does not need to quantify each factor, which is described hierarchically by assessing hazard (including susceptibility and activity levels), exposure, and vulnerability as proposed in this study. Although the qualitative method is less accurate, it can initially manifest the differences and ranks of the various sites, which is helpful to provide a reference for subsequent risk management quickly. Therefore, the initial risk assessment is easier to accomplish with qualitative descriptions.
The risk zoning framework designed in this study includes the activity assessment when grading the hazard, which examines a possible surface change in a slope at different times to represent the actual site activity. In contrast, the susceptibility assessment considers general environmental factors as revealed in Table 1. However, the activity assessment requires little effort to analyze the ground features visually from the aerial images, but it is still faster than a quantitative method from previous experience.
This research assumes that one-time mass destruction will occur in the susceptible area. However, some susceptibility areas may be damaged by erosion repeatedly. If different types of damage, such as corrosion or falling rocks, can be classified in the future, it will result in complete risk zoning.
In order to quickly assess the vulnerability, it may be simplistic but efficient to judge the vulnerability score by considering the possible impact area of the landslide and the distance from the household/public facilities with the limited geological and geomorphological data. However, there are still households with underprivileged groups and economic weakness in this area. According to the developed methodology in this study, when the survey resources are limited, the administration can easily and quickly remind people in higher-risk areas to relocate to a safe place.
After conducting risk zoning, those slopes with higher risk levels can be subsequently evaluated by straightforward methods, such as on-site surveys, geological drilling, and numerical simulations, and the results can be used as a reference for further governance.
Since this study aims to quickly analyze the slope collapse risk in a region through indicators, it is suggested that after the follow-up assessment of the landslide risk in a specific region, the analysis results and the corresponding disaster event should be verified by interviewing residents, experts, and scholars for plausibility.
Due to Taiwan's steep terrain and fragile geology, coupled with the frequent occurrences of typhoons and earthquakes, tribes in mountainous areas accompanied by rapid economic development and activity might experience landslide disasters. This study draws up a framework of rapid risk zoning toward multi-slope units around the tribal region and integrates qualitative and semi-quantitative concepts to form indicators of landslide susceptibility, activity, exposure, and vulnerability. Then the Neikuihui tribe in northern Taiwan was taken as an example for validation.
Research results indicated that the No. 11 slope unit has a high landslide risk level. At the same time, it is verified by a historical disaster event, indicating that the modified risk zoning is feasible for multi-slope units around the tribal region. The proposed procedure can benefit government agencies because it can be used to rapidly conduct a preliminary analysis of the risk in tribal regions and prioritize the disaster mitigation countermeasures. For example, by revealing the risk zoning for residents as a reference, the government can guide residents to voluntarily inspect the community environment and plan evacuation during the disaster. More importantly, the government can strengthen disaster prevention and relief awareness and promote regular emergency disaster relief drills at the same time. This modified process of risk zoning is further suggested to be validated comprehensively with other cases of tribal regions.
The information referring to risk maps (in shp files) can be obtained from https://doi.org/10.5281/zenodo.6513416 (Chung and Li, 2022). Further information can be made available upon request to the corresponding author.
Both authors contributed to conceptualization, led by CCC, who also conducted the formal analysis and initial draft. CCC had a leading role in risk zoning perspective. ZYL contributed to validation and data visualization. CCC critically reviewed the paper and contributed to the preparation of the final version.
The contact author has declared that neither they nor their co-author has any competing interests.
Publisher's note: Copernicus Publications remains neutral with regard to jurisdictional claims in published maps and institutional affiliations.
This research has been supported by the Ministry of Science and Technology (grant no. MOST 109-2119-M-008-005).
This paper was edited by Yves Bühler and reviewed by two anonymous referees.
Ahmad, F., Ahmad, S., Ali, M. M., and Hairy, H. D.: Qualitative risk assessment schemes using selected parameters for hillslope developments: a case study of Penang Island, Landslides, 9, 63–74, https://doi.org/10.1007/s10346-011-0275-7, 2012.
Alvioli, M., Marchesini, I., Reichenbach, P., Rossi, M., Ardizzone, F., Fiorucci, F., and Guzzetti, F.: Automatic delineation of geomorphological slope units with r.slopeunits v1.0 and their optimization for landslide susceptibility modeling, Geosci. Model Dev., 9, 3975–3991, https://doi.org/10.5194/gmd-9-3975-2016, 2016.
Alvioli, M., Guzzetti, F., and Marchesini, I.: Parameter-free delineation of slope units and terrain subdivision of Italy, Geomorphology, 358, 107124, https://doi.org/10.1016/j.geomorph.2020.107124, 2020.
Cama, M., Lombardo, L., Conoscenti, C., and Rutigliano, E.: Improving transferability strategies for debris flow susceptibility assessment: Application to the Saponara and Itala catchments (Messina, Italy), Eng. Geol., 288, 52–65, https://doi.org/10.1016/j.geomorph.2017.03.025, 2017.
Cantarino, I., Carrion, M. A., Palencia-Jimenez, J. S., and Martínez-Ibáñez, V.: Landslide risk management analysis on expansive residential areas – case study of La Marina (Alicante, Spain), Nat. Hazards Earth Syst. Sci., 21, 1847–1866, https://doi.org/10.5194/nhess-21-1847-2021, 2021.
Carrara, A.: Multivariare models for landslide hazard evaluation, J. Int. Ass. Math. Geol., 15, 403–426, https://doi.org/10.1007/bf01031290, 1983.
Carrara, A. and Guzzetti, F.: Geographical Information Systems., Kluwer Academic Publisher, Dordrecht, the Netherlands, June 1995, 342, ISBN 13 9780792335023, 1995.
Carrara, M., Cardinali, R., Detti, F., Guzzetti, V., and Pasqui, P.: Reichenbach GIS techniques and statistical models in evaluating landslide hazard, Earth Surf. Proc. Land., 16, 427–445, https://doi.org/10.1002/esp.3290160505, 1991.
Central Geological Survey: National Geological Data Warehouse: https://gis3.moeacgs.gov.tw/gwh/gsb97-1/sys8/t3/index1.cfm, last access: 9 November 2020.
Chen, C. Y.: Landslide and debris flow initiated characteristics after typhoon Morakot in Taiwan, Landslides, 13, 153–164, https://doi.org/10.1007/s10346-015-0654-6, 2016.
Chen, S. C. and Huang, B. T.: Non-structural mitigation programs for sediment-related disasters after the Chichi Earthquake in Taiwan, J. Mt. Sci., 7, 291–300, https://doi.org/10.1007/s11629-010-2021-3, 2010.
Chen, S. C., Wu, C. Y., and Huang, B. T.: The efficiency of a risk reduction program for debris-flow disasters – a case study of the Songhe community in Taiwan, Nat. Hazards Earth Syst. Sci., 10, 1591–1603, https://doi.org/10.5194/nhess-10-1591-2010, 2010.
Chung, C.-C. and Li, Z.-Y.: Rapid Landslide Risk Zoning toward Multi-Slope Units of the Neikuihui Tribe for Preliminary Disaster Management repository (Version V1), Zenodo [data set], https://doi.org/10.5281/zenodo.6513416, 2022.
Corominas, J. and Mavrouli, J.: Living with landslide risk in Europe: Assessment, effects of global change, and risk management strategies, Documento tecnico, SafeLand, 7th Framework Programme Cooperation Theme, NGI – Norwegian Geotechnical Institute, Oslo, Norway, 2011.
Dai, F. C., Lee, C. F., and Ngai, Y. Y.: Landslide risk assessment and management: an overview, Eng. Geol., 64, 65–87, https://doi.org/10.1016/S0013-7952(01)00093-X, 2002.
Di, B. F., Chen, N. S., Cui, P., Li, Z. L., He, Y. P., and Gao, Y. C.: GIS-based risk analysis of debris flow: an application in Sichuan, southwest China, Int. J. Sediment Res., 23, 138–148, https://doi.org/10.1016/S1001-6279(08)60013-X, 2008.
Fell, R., Corominas, J., Bonnard, C., Cascini, L., Leroi, E., and Savage, W. Z.: Guidelines for landslide susceptibility, hazard and risk zoning for land use planning, Eng. Geol., 102, 85–98, https://doi.org/10.1016/j.enggeo.2008.03.022, 2008.
Grecu, F.: Risk-prone lands in hilly regions: mapping stages, in: Applied Geomorphology. edited by: Allison, R. J., Wiley Chichester, 49–64, ISBN 0-471-89555-5, 2002.
Guzzetti, A., Carrara, M., and Cardinali, P.: Reichenbach Landslide hazard evaluation: a review of current techniques and their application in a multi-scale study, Central Italy, Geomorphology, 31, 181–216, https://doi.org/10.1016/s0169-555x(99)00078-1, 1999.
Guzzetti, A. C., Mondini, M., Cardinali, F., Fiorucci, M., and Santangelo, K. T.: Chang Landslide inventory maps: new tools for an old problem, Earth-Sci. Rev., 112, 42–66, https://doi.org/10.1016/j.earscirev.2012.02.001, 2012.
Guzzetti, F.: Landslide Hazard and Risk Assessment, PhD Thesis, Mathematics Scientific Faculty, University of Bonn, Bonn, Germany, https://nbn-resolving.org/urn:nbn:de:hbz:5N-08175 (last access: 15 December 2021), 2006.
He, D. J. and Lin, C. W.: Judgment Interpretation and Dangerous Degree Evaluation of the Susceptibility Area of Large-scale Collapse of State-owned Forest estimate, Taiwan Forestry Journal, 43, 13–25, https://www.forest.gov.tw/0000104/0000516 (last access: 10 November 2021), 2007.
Intergovernmental Panel on Climate Change (IPCC): Climate Change 2014: Synthesis Report. Contribution of Working Groups I, II and III to the Fifth Assessment Report of the Intergovernmental Panel on Climate Change, edited by: Core Writing Team, Pachauri, R. K., and Meyer, L. A., IPCC, Geneva, Switzerland, 151, 2014.
Keefer, D. K. and Larsen, M. C.: Assessing landslide hazards, Science, 316, 1136–1138, https://doi.org/10.1126/science.1143308, 2007.
Kokalj, Ž. and Somrak, M.: Why Not a Single Image? Combining Visualizations to Facilitate Fieldwork and On-Screen Mapping, Remote Sens., 11, 747, https://doi.org/10.3390/rs11070747, 2019.
Asahi, K.: Topographic interpretation using 3D projection (CS 3D) based on curvature and inclination, The Japanese Society of Forest Environment, 56, 75–79, https://doi.org/10.18922/jjfe.56.2_75, 2014 (in Japanese).
Lin, C. W., Chang, W. S., Liu, S. H., Tsai, T. T., Lee, S. P., Tsang, Y. C., Shieh, C. L., and Tseng, C. M.: Landslides triggered by the 7 August 2009 Typhoon Morakot in southern Taiwan, Eng. Geol., 123, 3–12, https://doi.org/10.1016/j.enggeo.2011.06.007, 2011.
Lin, C. W.: Disaster mitigation strategy and safety monitoring in susceptibility areas of large-scale collapse of state-owned forests, Forestry bureau, Council of agriculture, Executive Yuan, Taiwan, https://www.forest.gov.tw/report/0003888 (last access: 20 July 2021), 2017 (in Chinese).
Lin, G. W., Chen, H., Chen, Y. H., and Horng, M. J.: Influence of typhoons and earthquakes on rainfall-induced landslides and suspended sediments discharge, Eng. Geol., 97, 32–41, https://doi.org/10.1016/j.enggeo.2007.12.001, 2008.
Lombardo, L., Cama, M., Conoscenti, C., Märker, M., and Rotigliano, E.: Binary logistic regression versus stochastic gradient boosted decision trees in assessing landslide susceptibility for multiple-occurring landslide events: Application to the 2009 storm event in Messina (Sicily, southern Italy), Nat. Hazards, 79, 1621–1648, https://doi.org/10.1007/s11069-015-1915-3, 2015.
Lin, C. W.: Investigation and Evaluation of the Disaster Susceptibility of Deep Collapse of State-owned Forest-Southern Key Watershed, Forestry bureau, Council of agriculture, Executive Yuan, Taiwan, https://www.forest.gov.tw/research/0000802 (last access: 25 July 2021), 2013 (in Chinese).
Maidment, D. R.: Arc Hydro: GIS for water resources, ESRI Inc, 203, ISBN 13:9781589480346, 2002.
Malamud, D. L., Turcotte, F., and Guzzetti, P.: Reichenbach Landslide inventories and their statistical properties, Earth Surf. Proc. Land., 29, 687–711, https://doi.org/10.1002/esp.1064, 2004.
Martinello, C., Cappadonia, C., Conoscenti, C., Agnesi, V., and Rotigliano, E.: Optimal slope units partitioning in landslide susceptibility mapping, J. Maps, 17, 152–162, https://doi.org/10.1080/17445647.2020.1805807, 2020.
Papathoma-Köhle, M., Gems, B., Sturm, M., and Fuchs, S.: Matrices, curves and indicators: a review of approaches to assess physical vulnerability to debris flows, Earth-Sci. Rev., 171, 272–288, https://doi.org/10.1016/j.earscirev.2017.06.007, 2017.
Papathoma-Köhle, M., Schlögl, M., Dosser, L., Roesch, F., Borga, M., Erlicher, M., Keiler, M., and Fuchs, S.: Physical vulnerability to dynamic flooding: Vulnerability curves and vulnerability indices, J. Hydrol., 607, 127501, https://doi.org/10.1016/j.jhydrol.2022.127501, 2022.
Parise, M. and Wasowski, J.: Landslide activity maps for landslide hazard evaluation: three case studies from Southern Italy, Nat. Hazards., 20, 159–183, https://doi.org/10.1023/A:1008045127240, 1999.
Pan, Y. W., Zheng, Y. Y., and Huang, J. H.: Initial risk assessment framework, methods and cases of large-scale collapse susceptibility area, Announcement and seminar of the joint results of the integrated slope prevention plan of the Ministry of Science and Technology, Taiwan, 25 October, 31–57, 2019 (in Chinese).
Remondo, J., Bonachea, J., and Cendrero, A.: A statistical approach to landslide risk modelling at basin scale: from landslide susceptibility to quantitative risk assessment, Landslides, 2, 321–328, https://doi.org/10.1007/s10346-005-0016-x, 2005.
Rotigliano, E., Agnesi, V., Cappadonia, C., and Conoscenti, C.: The role of the diagnostic areas in the assessment of landslide susceptibility models: A test in the Sicilian chain, Nat. Hazards, 58, 981–999, https://doi.org/10.1007/s11069-010-9708-1, 2011.
Reichenbach, P., Rossi, M., Malamud, B. D., Mihir, M., and Guzzetti, F.: A review of statistically-based landslide susceptibility models, Earth Sci. Rev., 180, 60–91, https://doi.org/10.1016/j.earscirev.2018.03.001, 2018.
Van Den Eeckhaut, M., Reichenbach, P., Guzzetti, F., Rossi, M., and Poesen, J.: Combined landslide inventory and susceptibility assessment based on different mapping units: an example from the Flemish Ardennes, Belgium, Nat. Hazards Earth Syst. Sci., 9, 507–521, https://doi.org/10.5194/nhess-9-507-2009, 2009.
Varnes, D. J: Landslide hazard zonation: a review of principles and practice, in: Natural Hazards, The UNESCO Press, Paris, 63, ISBN 10 9231018957, 1984.
van Westen, C. J., Castellanos, E., and Kuriakose, S. L.: Spatial data for landslide susceptibility, hazard, and vulnerability assessment: An overview, Eng. Geol., 102, 112–131, https://doi.org/10.1016/j.enggeo.2008.03.010, 2008.
Wang, Q., Li, W., Wu, Y., Pei, Y., Xing, M., and Yang, D.: A comparative study on the landslide susceptibility mapping using evidential belief function and weights of evidence models, J. Earth Syst. Sci., 125, 645–662, https://doi.org/10.1007/s12040-016-0686-x, 2016.
Water and Soil Conservation Bureau: Summary report on major soil and sand disasters of Typhoon Meji, Taiwan, https://246.swcb.gov.tw/Achievement/DisastersContent?EventID=512 (last access: 25 October 2020), 2016 (in Chinese).
Xie, M., Esaki, T., and Zhou, G.: GIS method for slopeunit- based 3D landslide hazard evaluation, Chin. J. Rock Mech. Eng., 22, 969–976, 2003.
Xie, M., Esaki, T., and Zhou, G.: GIS-based probabilistic mapping of landslide hazard using a three-dimensional deterministic model, Nat. Hazards., 33, 265–282, https://doi.org/10.1023/B:NHAZ.0000037036.01850.0d, 2004.
Zakšek, K., Oštir, K., and Kokalj, Ž.: Sky-view factor as a relief visualization technique, Remote Sens., 3, 398–415, https://doi.org/10.3390/rs3020398, 2011.
Zheng, Y. Y.: Preliminary risk assessment framework and application of large-scale collapse, MS Thesis, Institute of Civil Engineering, National Chiao Tung University, Taiwan, 2018 (in Chinese).