the Creative Commons Attribution 4.0 License.
the Creative Commons Attribution 4.0 License.
 | 10 May 2022
Assessing flooding impact to riverine bridges: an integrated analysis
Maria Pregnolato
Andrew O. Winter
Dakota Mascarenas
Andrew D. Sen
Paul Bates
Michael R. Motley
Flood events are the most frequent cause of damage to infrastructure compared to any other natural hazard, and global changes (climate, socioeconomic, technological) are likely to increase this damage. Transportation infrastructure systems are responsible for moving people, goods and services, and ensuring connection within and among urban areas. A failed link in these systems can impact the community by threatening evacuation capability, recovery operations and the overall economy. Bridges are critical links in the wider urban system since they are associated with little redundancy and a high (re)construction cost. Riverine bridges are particularly prone to failure during flood events; in fact, the risks to bridges from high river flows and erosion have been recognized as crucial at global level. The interaction of flow, structure and network is complex, and not fully understood. This study aims to establish a rigorous, multiphysics modeling approach for the assessment of the hydrodynamic forces impacting inundated bridges, and the subsequent structural response, while understanding the consequences of such impact on the surrounding network. The objectives of this study are to model hydrodynamic forces as demand on the bridge structure, to advance a performance evaluation of the structure under the modeled loading, and to assess the overall impact at systemic level. The flood-prone city of Carlisle (UK) is used as a case study and a proof of concept. Implications of the hydrodynamic impact on the performance and functionality of the surrounding transport network are discussed. This research will help to fill the gap between current guidance for design and assessment of bridges within the overall transport system.
- Article
(5224 KB) - Full-text XML
- BibTeX
- EndNote


Bridges are crucial elements of the transport network given their high construction costs and the lack of alternatives routes. Anthropogenic and natural events are a threat to bridge safety and network serviceability (Yang and Frangopol, 2020). Bridges act as bottlenecks for surrounding roads, and thus any service disruption can knock out communities' access and connections, impair emergency planning and evacuation routes and impact economies and businesses.
Some disruptive events are growing in frequency and severity. In particular, the impacts of flooding have been exacerbated in recent years by urbanization (e.g., increase of impermeable surfaces), inappropriate land use in flood-prone areas and climate change. Rainfall events that lead to flooding are becoming more frequent and intense (Solomon et al., 2007), triggering bridge incidents and failures all over the world (Cumbria, UK, 2009; Drake, Colorado, 2013; Texas, 2018; Greece, 2020). As recent examples, Grinton Bridge in North Yorkshire (UK) and Keritis Bridge in Crete (Greece) were both washed away by floodwaters in 2019.
Riverine bridges are intrinsically vulnerable to flooding, as they are located in the area of the riverbed. In fact, flood and scour represent one of the most frequent causes of bridge failures (Hunt, 2009; Wardhana and Hadipriono, 2003; Khan, 2015; Ahamed et al., 2020). Although, scour is recognized as the biggest threat for bridges over water (and available scour-related literature is much more robust), hydrodynamic forces could be as critical for bridge piers on bedrock (where scour is unlikely) and for the decks of all flooded bridges (Kim et al., 2017; Oudenbroek et al., 2018). In terms of consequences, natural hazards can damage bridges structurally (thus causing direct physical damage), but these events can also result in functional failures that cause travel time delays and rerouting that lead to indirect losses (Alabbad et al., 2021). Any bridge failure, whether structural or functional, has the potential to impose heavy consequences to owners or responsible authorities, as well as dire expenses. Therefore, understanding the potential impact of flooding to bridges is a compelling need of communities in areas of flood risk.
Currently, a limited number of studies investigated the consequences of extreme flooding to bridges and the surrounding network (Yang and Frangopol, 2020). Practical application and case studies of real bridges tend to be focused on other natural hazards (e.g., earthquakes: Kilanitis and Sextos, 2019; Ertugay et al., 2016; Zhou et al., 2010). This study aims to establish a rigorous, multiphysics modeling approach for assessing hydrodynamic forces on inundated bridges, subsequent structural response and consequences of such impact on the surrounding network. The objectives of this study are to model hydrodynamic forces as demand on the bridge structure, to advance a performance evaluation of the structure under the modeled loading and to assess the overall impact at systemic level. Implications of the hydrodynamic impact on the performance and functionality of the surrounding transport network are discussed. This research will help to fill the gap between current guidance for design and assessment of bridges within the overall transport system.
1.1 Background
Transport networks are formed by multiple links (i.e., roads) and their performance relies on a number of parameters, such as availability of alternative routes (redundancy), road capacity or traffic demand, among others. A bridge failure often means a critical link is taken out of service. Bridges are usually costly assets to repair, have little redundancy and are likely to be crossed by a high number of users, especially if they belong to strategic road networks (e.g., highways). Therefore, bridge closure or failure can impact the overall performance of the road network and the failure consequences have to be investigated from a system perspective (Yang and Frangopol, 2020). The assessment of the systemic impact is a complex and multi-disciplinary problem, at the interface of hydrology, fluid dynamics, structural analysis and transport modeling.
Scour damage is a significant concern for many bridge structures and has been extensively studied (e.g., Pregnolato et al., 2021a; Wang et al., 2017; Hung and Yau, 2017; AASHTO, 2002); the more common methods include using the HEC-18 (Arneson et al., 2012; Vardanega et al., 2021) or CIRIA scour equations (Kirby et al., 2015; HE, 2012). However, assessing scour damages is not the main focus of this paper.
On the contrary, literature about modeling the hydrodynamic forces of the fluid on bridges due to riverine floods is limited, especially concerning fragility models or reliability analysis (Pregnolato, 2019; Gidaris et al., 2017). Existing research investigated tsunami impact to bridges (e.g., Motley et al., 2016; Lomonaco et al., 2018; Qin et al., 2018; Winter et al., 2017), where computational fluid dynamics (CFD) techniques are used to compute hydrodynamic forces on bridges and components. Li et al. (2021) advanced a CFD-based numerical study on the tsunami-induced scour around bridge piers. Kerenyi et al. (2009) applied CFD to compute hydrodynamic forces on inundated bridge decks, however the analysis was limited to the evaluation of drag and lift forces, without investigating impact and consequences. Bento et al. (2021) suggested CFD as a more sophisticated technique for modeling flow depth and velocities at sites. Multi-hazard studies have investigated the interaction and implication of multiple hazards acting on a single structure (Gidaris et al., 2017; Carey et al., 2019), especially between earthquake and tsunami. Other studies (Mondoro and Frangopol, 2018; Liu et al., 2018; Yilmaz et al., 2016) that tackled flood impact on bridges generally expressed the hazard through flood hazard curves, generated via flood-frequency analysis; however, a detailed hydraulic analysis was beyond the scope of their work. While tsunami loading of bridges will often result in much higher forces than riverine flows, the prevalence of riverine flooding relative to tsunami events necessitates further study and could have a far-reaching effect.
1.2 Motivation and aim
To the authors' knowledge, no study has comprehensively investigated the impact of high-river flows on bridges accounting for the complexity of the hydrodynamic forces to which the bridge is subjected and the associated structural and functional response. Moreover, the impact of the reduced service on a bridge on the surrounding network is rarely addressed in the literature. Given this limited availability of models, this paper aims at establishing a multilevel modeling framework to address these issues in one combined approach. This aim is achieved by developing an integrated framework to assess the flooding impact on riverine bridges from the structural to the network level (Pregnolato et al., 2021b) and applying it to a real case study in the UK. This research tackles varying flow conditions (velocity and depth) to understand the structural response across given simulated flooding conditions. This work is novel since it represents a first attempt to couple CFD analysis with both finite element (FE) and network analysis for bridges subjected to flooding, in an effort to capture both the cause and effect of flooding. It is expected that this approach will be useful for understanding structural damage and functional loss for a range of bridges, and ultimately for assessing risk for any coastal or riverine structure where large-scale water inundation is expected.
This paper adopts a risk-based framework to assess the impact of high river flows on bridges and surrounding roads (Fig. 1). The framework proposes a comprehensive method that encompasses the traditional four risk modules (hazard, exposure, vulnerability and consequences; Grossi and Kunreuther, 2005) and includes hydrodynamic force modeling, bridge susceptibility to the hazard, performance evaluation and network-level impact assessment. This study adopts specific models/software, but the precise chosen sub-models are not critical. In fact, all models/software are interchangeable, and it is reasonable to expect that the presented approach would be appropriate for software packages that ensure similar configuration.
The first step is to determine the intensity measures of flooding in terms of flow depth and velocity (see Sect. 2.1). For modeling fluvial flooding, most 2D hydrodynamic models can simulate flood depths and flow velocity, e.g., LISFLOOD-FP (https://bit.ly/3lstd4j, last access: 28 April 2022) or TELEMAC (http://www.opentelemac.org/, last access: 28 April 2022). Bridge information, such as geometry and design, can be retrieved through publicly available databases (e.g., the US National Bridge Inventory) or by coordination with local infrastructure managers and authorities; such information includes (but is not limited to) bridge dimensions, number of piers, material, design principle and foundation type. Unsurprisingly, the availability and accuracy of data vary from bridge to bridge and can influence the modeling outputs.
The second step consists of modeling the interaction between the water and the bridge, as well as the subsequent flood-induced loads. A simplified vulnerability and criticality assessment (Johnson and Whittington, 2011) includes the evaluation of the local flow conditions and corresponding hydrodynamic forces that represent the load on the bridge structure using CFD techniques. Here, the C toolbox OpenFOAM is the adopted software, being open source and particularly versatile for the development of customized numerical solvers (https://www.openfoam.org/, last access: 28 April 2022).
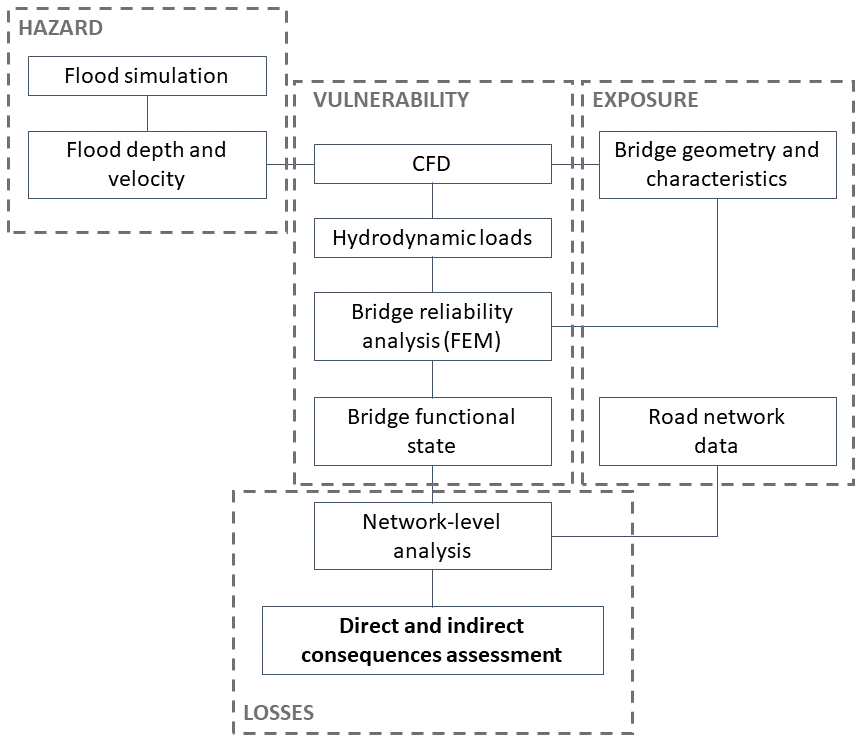
Figure 1The proposed risk-based methodological flowchart to integrate modeling of hydrodynamic forces, performance and network-level analysis. Abbreviations: CFD – computational fluid dynamics; FEM – finite element model.
The third step is to determine the response of the bridge subjected to flood through an advanced structural analysis approach such as FE analysis. There are many available FE models, such as Abaqus FEA (https://www.3ds.com/, last access: 28 April 2022), ANSYS (https://www.ansys.com/en-gb, last access: 28 April 2022), SAP2000 (https://www.csiamerica.com/products/sap2000, last access: 28 April 2022) or the OpenSees software framework (McKenna et al., 2010). Mondoro and Frangopol (2018) described salient limit states for bridges subjected to hydraulic loads, and the subset studied in this paper (shown in Fig. 2) includes yielding of the girders or piers, unseating or uplift of the girders, failure of the bearings and excessive global displacement of the superstructure at which transient fluid–structure interaction is important (i.e., the CFD modeling approach is limited).

The general limit-states philosophy considers that specifications should satisfy “specified limit states to achieve the objectives of constructability, safety and serviceability” (AASHTO, 2017). In this work, the failure of a bridge is seen as twofold: (i) structural (also strength limit state), when the bridge deck, piers or foundation reach the ultimate limit state or permanent deformations; (ii) functional (also service limit state), when the bridge cannot perform its service as usual. A structural failure directly leads to a functional failure, e.g., the bridge collapses; preventive closure could also take place when bridge conditions are considered unsafe. Nevertheless, a bridge could be unserviceable but still structurally sound, e.g., when floodwater or debris cover the deck. Hydraulic pressures (drag, lift and overturning moment) are assessed for potentially dislodging the deck from piers, when submerged or partially submerged, and overtopping of the deck is evaluated qualitatively from the CFD model. Though these limit states have significantly different long-term consequences, both result in potential functional failure. The importance of long-term effects should be defined based on local transportation needs.
The last step is to assess consequences, by including the impact of the bridge failure within the wider transport network. Transport models such as ESRI™ ArcGIS Network Analyst (https://bit.ly/2GPMknl, last access: 28 April 2022), SUMO (http://sumo.sourceforge.net/, last access: 28 April 2022) or MatSIM (https://www.matsim.org/, last access: 28 April 2022) are suitable for computing routing and delays associated with a disrupted network link (such as a closed bridge). Road network data are publicly available from sources such as Digimap® (https://digimap.edina.ac.uk/, last access: 28 April 2022), which provides Ordnance Survey road maps. These contain topographic information of roads including name, location, length, capacity and type. After configuring the transportation network model with the collected data, routing and accessibility can be investigated using network-based spatial analysis and transport appraisal techniques (Arrighi et al., 2019; Pregnolato et al., 2016). This impact analysis links the structural damage of a bridge due to flooding with the reduced performance of the local road network the bridge serves, to approximate the wider consequences.
2.1 Fluvial flooding simulation
Ideally, boundary conditions should be provided by gauging stations; however, no river gauges are present near the bridge of interest, as is often the case in practical scenarios. This study adopted the 2D hydrodynamic model LISFLOOD-FP, which allows the simulation of flood depths and flow velocity to set up CFD boundary conditions for a flood scenario and from available gauge data.
LISFLOOD-FP is a 2D, spatially distributed, grid-based hydrodynamic model for simulating channel and floodplain flows (Neal et al., 2009). The model dynamically simulates flood propagation in each grid cell at each time step, on the basis of the local inertial formulation of the shallow water equations and an explicit finite difference method. Numerically, this process involves calculating the momentum equation (the flow between cells given the mass in each cell) and the continuity equation (the change in mass in each cell given the flows between cells) (Neal et al., 2018). The equations underpinning the model, including their derivation, can be found in Bates et al. (2010) and de Almeida et al. (2012).
As input data, LISFLOOD-FP requires a DEM (Digital Elevation Model) of the area, channel and boundary condition information (e.g., channel friction, width and depth, hydrograph and evaporation). Flow depth and velocity (for each cell) are the output considered, since they represent the intensity measures of the hazard adopted by this study. The impact of bridges on flow is not explicitly represented in this particular application.
2.2 Computational fluid dynamics analysis
Three-dimensional (3D) CFD software is capable of resolving fine details of flood flow around bridges on a local scale such as splashes, eddies or flow separation, which cannot be captured by depth-averaged methods (such as LISFLOOD-LP). Also, bridges present a problem for depth-averaged tools since the computational mesh is 2D and cannot be discretized vertically, which does not allow for a gap underneath a bridge superstructure. Accurately modeling such behaviors is crucial when estimating flow-induced force demands; this requires the use of a fine, 3D mesh. Additionally, using higher fidelity, 3D models allows for localized loads to be measured on individual faces of a structure, which may be used to determine whether or not individual components fail versus entire structures (Winter et al., 2017).
For this study, the 3D CFD code OpenFOAM was selected. Flood flows were modeled using the interFoam solver, which is a two-phase solver that relies upon the volume of fluid (VoF) method (Tryggvason et al., 2011) to track the interface between water and air phases. The underlying governing equations that are implemented in interFoam are the Reynolds-averaged Navier–Stokes (RANS) equations, which are solved using a predictor-corrector or projection type of method to solve for velocity and pressure fields, and advection equations for the volume fraction introduced by the VoF method. More specifically, pressure–velocity coupling was achieved using the PIMPLE algorithm, which is a combination of the pressure-implicit split-operator (PISO) and semi-implicit method for pressure-linked equations (SIMPLE). Since the RANS system of equations does not constitute a well-posed system due to the so-called Reynolds stress tensor that arises from the Reynolds-averaging process, a suitable turbulence model that introduces additional equations must be chosen to close the system. For this study, the k−ω shear stress transport (SST) model was used due to its ability to handle severely separated flows near sharp corners better than other similar models such as the standard, renormalization group (RNG) or realizable k−ε models.
2.3 Structural analysis
A structural analysis approach is functional for: (i) simulating relevant structural response mechanisms, which differ based on bridge type, and (ii) characterizing loading derived from the associated CFD model. FE analysis is commonly employed in structural engineering to simulate the response of bridges to natural hazards for the purpose of design and performance evaluation. Modern reinforced concrete and steel bridge structures are commonly formed of girders, cap beams and pier walls or columns which can be modeled as assemblages of line and spring elements; this approach is common in practice and can be implemented in a wide variety of structural analysis programs. To model nonlinear response, which is especially important when considering extreme loads associated with natural hazards, line elements may employ concentrated or distributed plasticity formulations that make use of nonlinear hinges or fiber sections. Rotational, shear and/or axial spring elements can be used to simulate the response of discrete components such as connections and bearings. Alternatively, continuum finite-element analysis can be employed for members if complex local response of components (e.g., local buckling and/or deformation) is of interest; however, this approach is significantly more computationally expensive. Other approaches, such as the discrete-element method, may be well suited for masonry bridges.
In this work, modeling with line and spring elements is performed, so this approach will be discussed in greater detail. The considered bridge consists of a girder superstructure supported on reinforced concrete piers. OpenSees (McKenna et al., 2010) was selected as the analysis software due to its robust nonlinear modeling and scripting capabilities. This latter capability is beneficial for performance evaluation using a suite of input parameters (in this case, a parameter sweep characterizing different flood conditions). Moreover, the software is open source and therefore suitable for adaptation in envisioned future work to enhance interactivity with OpenFOAM.
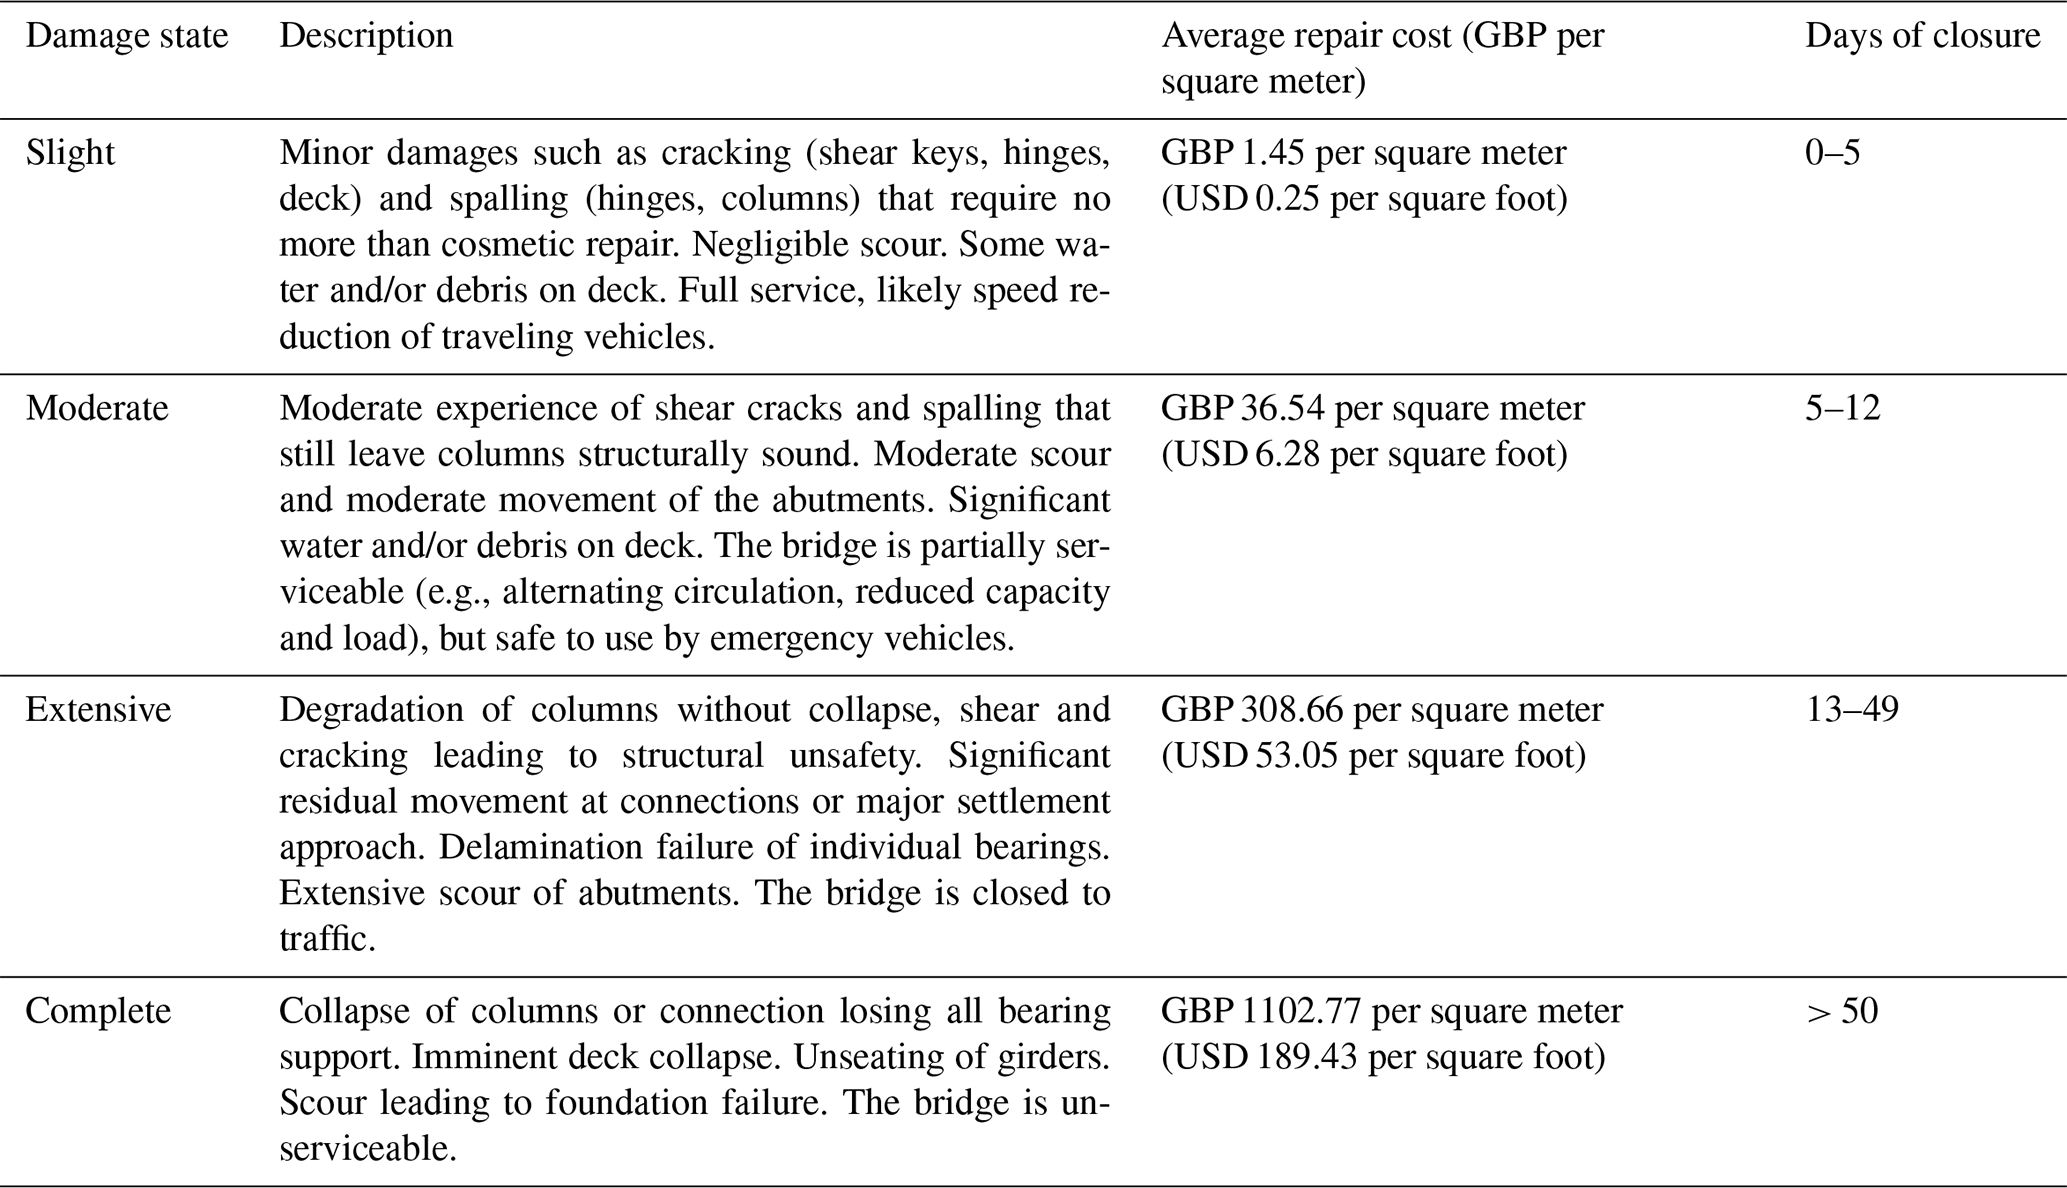
Component response and demands based on the structural analysis can be used to assign a damage state for the bridge. Here, the structural damage is evaluated as slight, moderate, extensive, or complete damage based on the Federal Emergency Management Agency (FEMA) Hazus manual (FEMA, 2003). Each of these damage states is associated with level of functionality and repair effort. The qualitative description of damage states and average repair cost per square meter (square foot) is available in literature for hurricanes (Padgett et al., 2008) and earthquakes (Hazus manual – FEMA, 2003); Gehl and D'Ayala (2018) offered a qualitative damage scale of potential damage state and failure modes for the bridge components, which could be associated with functionality losses and remedial actions. Table 1 adapts such literature to riverine flooding using additional works and expert opinion: it lists four identified damage states (from slight to complete), and associated average repair cost and days of closure due to remedial works (Porter et al., 2011; Gardoni, 2018; Lam and Adey, 2016).
Table 1Bridge damage states (Gehl and D'Ayala, 2018) associated with average repair cost per square meter (Padgett et al., 2008; FEMA, 2003) and average days of closure due to repair (Porter et al., 2011; Gardoni, 2018; Lam and Adey, 2016).
2.4 Fluid–structure coupling
The relationship between the CFD and structural analysis is critical to the implementation of the proposed framework as outlined in the vulnerability analysis block in Fig. 1. Both analyses must adequately represent the bridge geometry, and the CFD output and structural analysis input loading must be compatible. Here, the coupling approach between OpenFOAM and OpenSees is discussed, but the methodology is applicable to other software. It is noted that OpenSees alone is seldom used to model structural response to fluids because of the complexity of the fluid loading and the required coupling mechanism between fluid and solid solvers. As such, the present work is among the first of its kind using OpenSees. Other recent research has sought to implement coupling between these multi-physics models. For example, Stephens et al. (2017) demonstrated how OpenSees can be “loosely coupled” (i.e., with no interaction between CFD and FE models) with OpenFOAM to characterize structural response due to sequential earthquake and tsunami loading. A similar loosely coupled scheme is used here, where:
- i.
the bridge superstructure (deck and girders) is modeled as a rigid, 2D cross section with a unit length out of plane and subjected to steady-state flow at different water depths and velocities in OpenFOAM;
- ii.
the steady-state reactions (output from OpenFOAM) on the cross section are recorded; and
- iii.
the gravity loads and the steady-state reactions from OpenFOAM are applied as distributed, external loads on girder line elements in a 3D OpenSees model of the full bridge.
It is noted that the bridge superstructure is rigid in the computational fluid dynamics model (an important simplification to facilitate the analysis) but not in the finite-element model.
2.5 Impact assessment
The impact of a bridge failure in terms of consequences (C) includes direct consequences (Cdir) and indirect consequences (Cind), which relate the surrounding transport network (Argyroudis et al., 2019; Kim et al., 2018). The total costs C is computed as (Eq. 1):
where Crepair is the cost associated with repair or replacement of the bridge, Cclean is the cost associated with the debris removal (due to flooding), Cdetour is the additional vehicle operating due to the detour and Cdelay is the cost associated with trip delays of normal traffic. Indirect costs may also include a fee for closing the bridge that the bridge owner has to pay to transport operators/agencies (e.g., for railways, highways).
Table 1 (Sect. 2.3) was functional to compute Crepair. Average days of closure due to repairs are obtained via discussion with national operators and existing literature (Porter et al., 2011; Gardoni, 2018; Lam and Adey, 2016). Values for Cclean can be researched among historic data of bridge owners, e.g., records from bridge inspection reports. Cdetour and Cdelay depend on the network, type of vehicle and traffic flow; this study is limited to consider private cars and HGVs (heavy goods vehicles, i.e., over 3.5 tonnes gross vehicle weight, including both articulated and rigid body types), for the sake of a contained demonstration. According to standard transport appraisal procedures (e.g., DfT, 2009), the parameters are computed with Eqs. (2) and (3), respectively. Considering an origin i, a destination j and a vehicle type z:
where q is the volume of traffic, l is the incurred additional length, d is the incurred additional time (delay), VOC is the extra vehicle operating cost (including fuel, maintenance and wearing) and VTT is the value of travel time, i.e., the non-monetary costs incurred along the journey as time spent on transport. The additional length and travel time due to the detour are computed using ESRI™ ArcGIS Network Analyst, setting the origin and the destination of the trip in opposite sides of the river as demonstration (Pregnolato et al., 2016).
The city of Carlisle is a flood-prone city (area: 1040 km2; 2018 population: 108 387) located in the northwest of England (UK) (Fig. 3). Three road bridges connect the two parts of the town over the River Eden from north to south (the A689, A7 and M6 bridges) and a fourth one from west to east (Warwick Bridge). The 2D hydrodynamic model LISFLOOD-LP was set up to simulate a 1-in-500-year flooding scenario (Fig. 3b) for a domain covering 14.75 km2 of Carlisle, at 5 m of resolution. This simulation provided flow velocity and inundation height data.
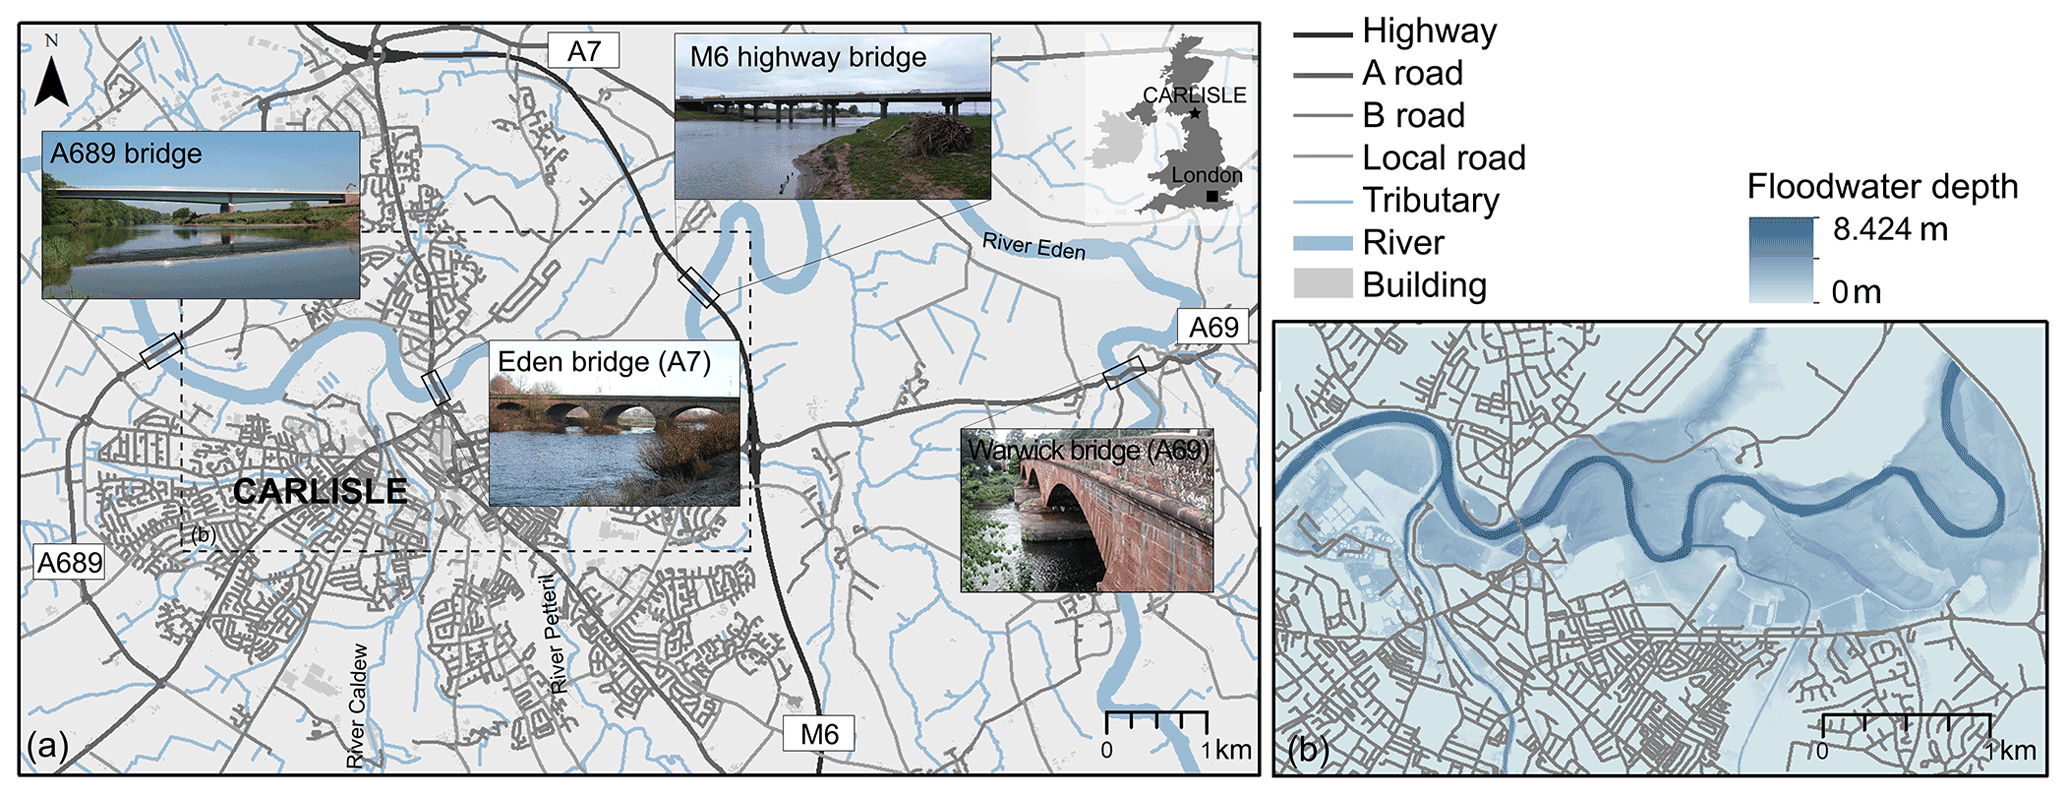
Figure 3The case study is the city of Carlisle, UK: (a) general overview of Carlisle upon the River Eden, connected north–south by three road bridges (the A689, A7 and M6 bridges) and west–east by the Warwick Bridge (A69); (b) flood hazard map for Carlisle, as simulated with LISFLOOD-LP for a 1-in-500-year flood event (null floodwater depth implies dry areas).
As a proof of concept, the M6 highway bridge over the River Eden was considered. The bridge is comprised of a girder superstructure supported by hammerhead piers. A schematic model of this bridge is shown in Fig. 4 with approximate pier column (reinforced concrete), girder (concrete-encased steel) and bearing pad dimensions.
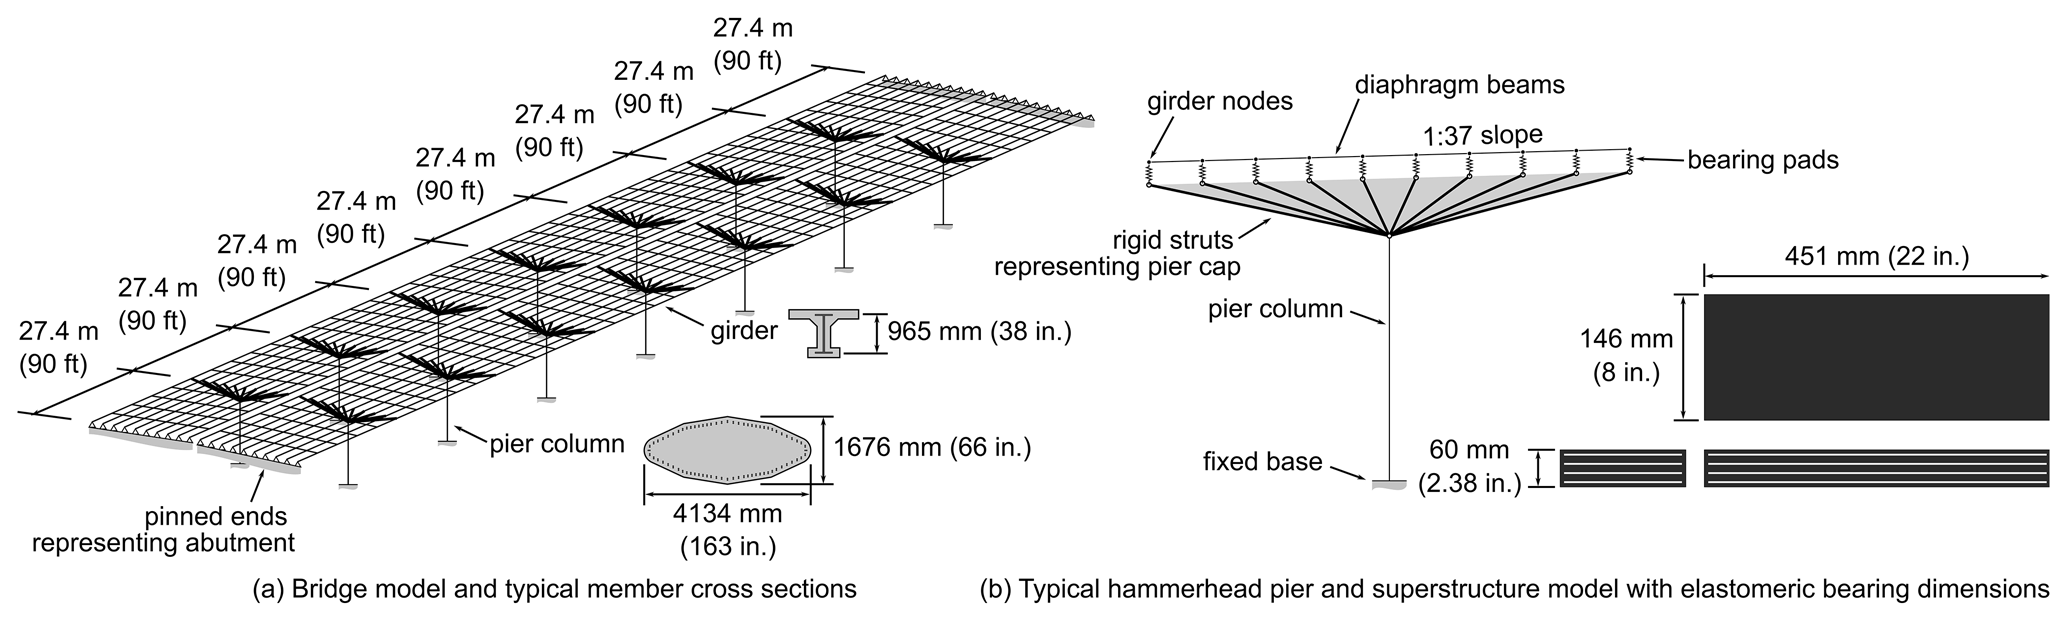
Figure 4Approximate geometry of M6 bridge as modeled in OpenSees including pier column, girder and bearing dimensions shown (not to scale).
The pier columns are elliptically shaped and oriented to reduce hydraulic drag. The columns taper to a width of 4134 mm and depth of 1676 mm at the base. The girders are supported on fixed, laminated elastomeric bearing pads with dowels at the southern end of each span and free spherical bearings at the northern end. Salient bridge and flow input data are summarized in Table 2.
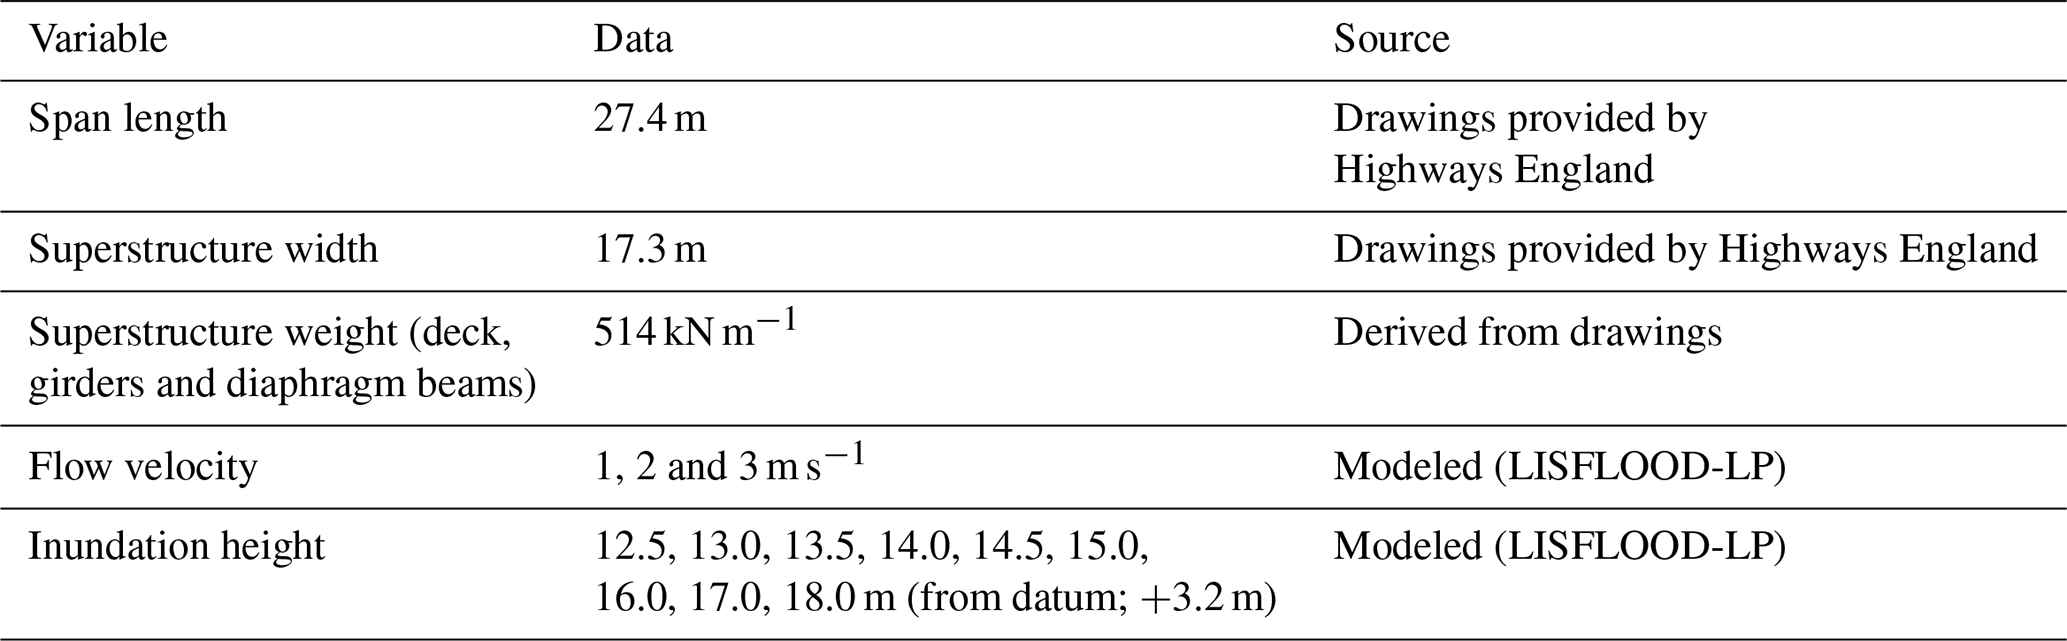
Table 2Input data of this study for the exemplary CFD analysis of the M6 bridge (Carlisle, UK).
3.1 CFD simulation and analysis
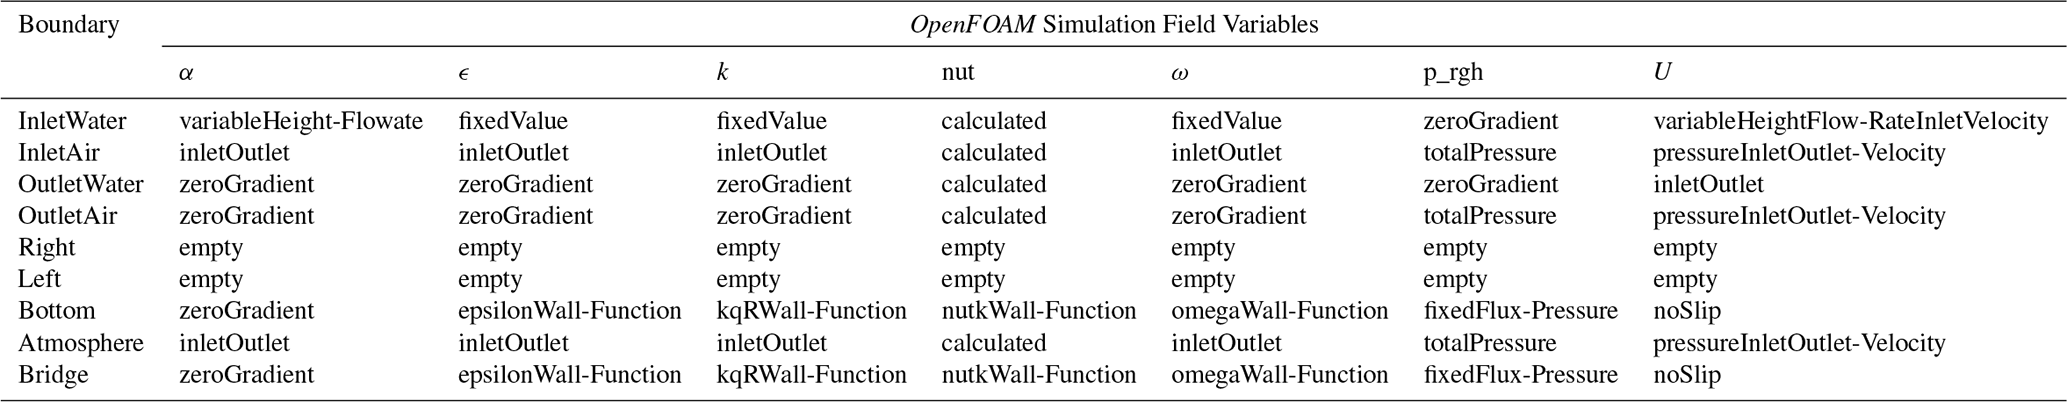
The CFD simulation was initiated at given inundation heights and flow velocity, as modeled by the LISFLOOD-LP model for a 1-in-a-500-year flood event at the site. The OpenFOAM model was set to simulate a range of flow velocity and depth values above and below the calculated 500-year flood results in order to assess how varying the depth and velocity affected the resulting bridge performance. Flow velocities and depths were extracted from LISFLOOD-LP in proximity of the bridge, and also compared with historical data (e.g., the peak flow recorded at Sheepmount, UK in December 2015 was equal to 1680.0 m3 s−1; EA, 2016) and inspection reports. The statistics for the velocity (both in its actual flood flow direction and also normal to the bridge) were computed from the LISFLOOD-LP velocity vector (Vx, Vy) and maximum water depth data, considering maximum values for both quantities over the whole flood simulation. The 500-year return period flood showed velocity values up to roughly 3.5 m s−1 and max flood depth up to 17 m near the M6 bridge. These statistics motivated using a range of steady-state velocities of 1–3 m s−1 and inundation elevations of 12.5–18 m above datum in the OpenFOAM simulations. The bridge superstructure was positioned such that the bottom of the bridge's lowest girders and the highest point of the top of the bridge deck were at elevations of 12.375 and 14.425 m, respectively, relative to the datum, which was 3.2 m below the riverbed's lowest point. Flow rates corresponding to the range of selected flow velocities and depths were specified at the inlet boundary of the OpenFOAM model, using the variableHeightFlowrate boundary condition. To model the free-surface flow of the Eden River interacting with the M6 bridge in OpenFOAM, the interFoam multiphase fluid flow solver which utilizes the VoF method for interface tracking was used along with the k−ω SST turbulence model to resolve turbulent flow behaviors. Default OpenFOAM values for air–water physical fluid properties (densities: ρair= 1 kg m−3, ρwater= 1000 kg m−3; kinematic viscosities: νair= 1.48(10−5) m2 s−1, νwater= 1.0(10−6) m2 s−1; surface tension: σ= 0.07 N m−1) and turbulence model coefficients were used for all simulations. A full summary of all OpenFOAM boundary conditions is provided in Table 3.
To reduce computation time and provide conservative results, a unit width segment of the bridge superstructure located above the deepest point of the Eden River beneath the M6 Bridge was analyzed in OpenFOAM, which resulted in a 2D simulation that drastically reduced the mesh cell count compared to a full 3D simulation of the entire bridge. Additionally, the out-of-plane direction components of the flow were neglected in all simulations by using the empty type of OpenFOAM boundary condition, ensuring the simulations were truly 2D. This setting allowed for more simulations to be run using a wider range of flooding conditions in less time while conducting the parametric study. As shown in Fig. 5, the model measured forces on 20 individual components along the cross-section of the bridge superstructure segment corresponding to each girder and its tributary width of the bridge deck.
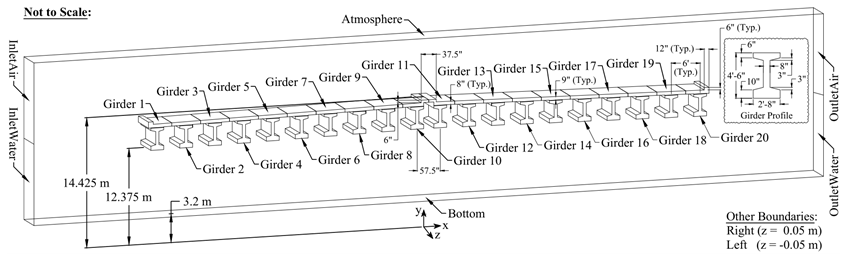
Figure 6 shows converged OpenFOAM fluid load outputs for each bridge component at all inundation levels, providing an example for an initial flow velocity of 3 m s−1, which corresponds to the worst-case scenario simulated in this study. Since the simulations were 2D, load values are expressed in units of force or moment per meter of bridge deck width.
The horizontal forces presented in Fig. 6a show significant peaks at the bridge deck edges for components 1 and 20, due to the asymmetric pressure distributions that these components experienced when comparing their upstream and downstream faces than the interior components (which were shielded from higher velocity flows by the exterior components). Additionally, the exterior components included the traffic barriers, which significantly increased their surface area on which fluid pressure acted compared to the interior components.
At the upstream edge of the deck, component 1 absorbed the primary impact of the incoming flood flow at its peak velocity since it was on the upstream side of the deck, resulting in it carrying the largest positive horizontal forces. At the downstream edge of the deck, component 20 was initially subjected to positive horizontal forces due to the flow impacting its bottom flange and the lower portion of its web, but for flow heights greater than 14.0 m, its horizontal force decreased until it became negative by a flow height of 16.0 m. The gradual decrease in component 20's horizontal force may be attributed to differences in the vertical surface areas of and the flow velocities near its upstream and downstream sides that resulted in larger fluid pressures acting on the downstream faces than the upstream faces. The total vertical surface area of the downstream faces was larger than that of the upstream faces by an amount equivalent to the deck section, which provided additional area on which fluid pressure acted in the upstream direction. Complex flow characteristics that contributed to the velocity differences include: (1) the recirculatory flow patterns between the girders of components 19 and 20 and in the corner between the deck top and traffic barrier that led to reduced pressures on upstream faces of component 20; (2) the turbulent eddies that were shed off of the leading edge of component 20's girder bottom flange that redirected the flow toward the downstream faces of component 20; and (3) the flow over the top of the bridge deck rejoining the flow beneath the bridge at the downstream edge of the deck, which contributed to the formation of turbulent eddies in the bridge deck wake. Also, if any air was trapped between girders, a lesser water level between the girders would further decrease component 20's horizontal force.
The vertical forces shown in Fig. 6b are of similar magnitude to the horizontal force values in Fig. 6a. When the flow height was small prior to the flood overtopping the bridge (i.e., 12.5 to 13.0 m), the vertical forces on both halves of the bridge were roughly uniform except for the components nearest to the upstream edge of the bridge. In these cases, the vertical forces on components 1–3 decreased due to fluid pressure acting downward on the top of the girder bottom flanges. For flow heights of 13.5 to 16.0 m, the vertical forces on the upstream half of the bridge initially increased due to buoyancy forces increasing (due to increasing flow depth), but it started to decrease at a flow height of 14.0 m as the flood began to overtop the bridge. By a flow height of 17.0 m, the bridge was submerged enough that buoyancy caused the vertical forces on the upstream half of the bridge to increase again.
For the downstream half of the bridge, uplift due to buoyancy increased until a flow height of 15.0 m. At this point, the flow overtopped the superstructure crest at the midpoint of the bridge. This change in flow behavior caused the vertical forces on the downstream half of the bridge to decrease until the bridge was sufficiently submerged at a flow height of 18.0 m.
Overturning moment results acting about the z-axis of each bridge component are shown in Fig. 6c. Similar to the horizontal forces shown in Fig. 6a, the extreme overturning moment values occurred at the edge components of the bridge deck, whereas the interior components experienced much smaller overturning moments since they are shielded by the edge components. At flow depths less than 14.0 m prior to the flood overtopping the barriers, increasing positive moment values for the component 1 at the upstream edge indicate that a counter-clockwise rotation would occur, which would cause the upstream side of the bridge component to move downwards, whereas downstream side would move upwards. This process is due to the lesser depth flows only impacting the bottom flanges and lower parts of the webs of the girders. As the flow depth increased, the position of the resultant horizontal force gradually increased until it moved above the centroid of the component 1 girder, about which moments were summed. This effect resulted in a trend reversal such that the moment decreased with increasing flood depth until for depths of 16.0 m or more clockwise rotations of component1 occurred due to flow overtopping and eventual full submersion the bridge. At the opposite deck edge, component 20 experienced a similar trend switch, where its overturning moment initially decreased for flow depths less than 14.0 m, but increased for 14.0 m or more, changing from counter-clockwise to clockwise rotation beginning with the 16.0 m flow height case.

Figure 6Converged simulated component loads for flow velocity equals 3 m s−1 per girder component; (a) shows horizontal (x-direction) loads applied in kN per meter bridge width; (b) shows vertical (y-direction) loads applied in kN per meter bridge width; (c) shows moment for the z-axis (i.e., roll moment) in kN per meter bridge width.
3.2 Structural analysis and damage assessment
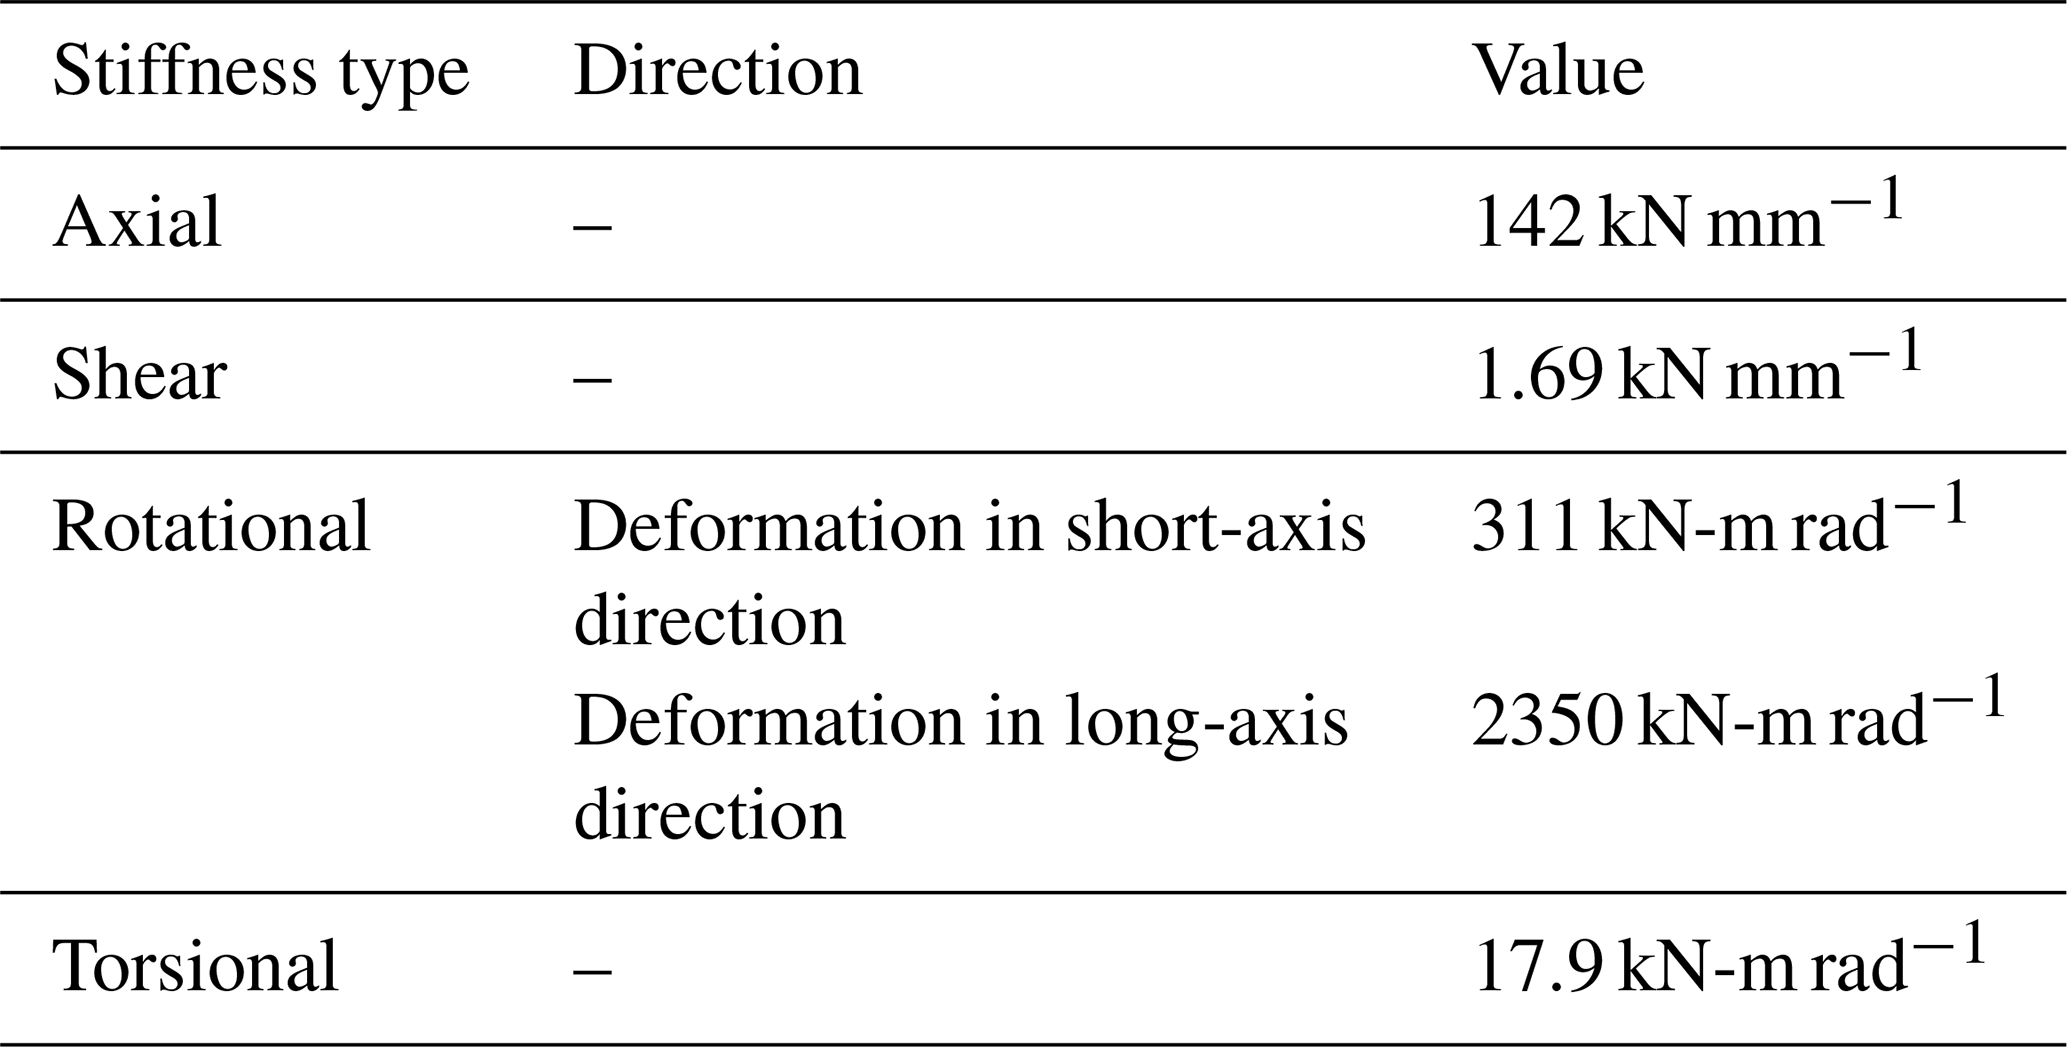
The OpenSees model was developed using fiber-based line elements for the reinforced-concrete pier columns and preflex girders (a form of prestressed, concrete-encased steel beams). Nonlinear concrete (Concrete02) and steel (Steel02) constitutive models were employed to simulate uniaxial material response in the fibers. All concrete was assumed to have a compressive strength of 34.5 MPa. The steel reinforcement and encased structural steel was assumed to have yield stresses of 276 and 379 MPa, respectively. The girders ends were connected to pier caps (modeled as rigid) via linear-elastic springs to represent bearings. The free spherical bearings were modeled as roller boundary conditions. The steel-laminated elastomeric bearing pads were modeled with lateral, vertical, rotational, and torsional stiffnesses based on linear theory of bearings as described by Stanton et al. (2008). The elastomeric bearing dimensions are shown in Fig. 4; each had two, 13 mm-thick layers of elastomer reinforced with 3 mm steel plates. The elastomer was assumed to have a bulk modulus of 3100 MPa and a shear modulus of 0.76 MPa; the bearing dimensions and material properties led to the stiffness parameters defined in Table 4. The bearing spring elements were connected to rigid links which simulated pier cap beams, providing a load path between the girders and pier columns. The bridge abutments were founded on rock on the north side and piles on the south side; both abutments were modeled as rigid. The piers were founded on rock and pier columns were modeled as fixed. It is noted that many bridge foundations are vulnerable to scour, especially under flood conditions; however, the piers and abutments of the considered bridge are founded on rock, thus scour is not a concern for this structure (and in general scour and soil-structure interaction effects are beyond the scope of the present work).
To analyze the bridge, gravity loads were first applied based on the self-weight of the structural components; no live loads were considered. The lateral forces, vertical forces, and roll moments determined from OpenFOAM were then applied as distributed loads in OpenSees on each bridge girder (i.e., over all eight spans with 20 girders per span); this step is the key link between the CFD and structural models.
Under the range of investigated loading, yielding or cracking was not detected in the girders or columns, and the simulated hydraulic forces were not large enough to overcome the self-weight of the structure, which would result in uplift of the superstructure. However, the elastomeric bearing pads sustained large shear demands near the design limits specified by Sect. 14.7.5 of the AASHTO LRFD Bridge Specification (2017). Specifically, the elastomeric bearings were evaluated for:
- i.
loss of frictional resistance between the bearing and girder based on the ratio of shear and normal forces on the bearings,
- ii.
excessive shear deformation, and
- iii.
excessive shear strain due to combined axial load, rotation and shear deformation.
The solid lines in Fig. 7 compare maximum shear forces, deformations, and strains in any of the elastomeric bearings for each of the loading scenarios investigated; Fig. 7a, c and e show these engineering demand parameters versus flow velocity and Fig. 7b, d and f show corresponding values with respect to flow height. The data suggest that peak steady-state demands on any of the elastomeric bearings in the bridge occur around a flow height 15 m, at which point the bridge has just reached full inundation. In addition, below a flow height of 15 m, demands consistently increase with velocity; such an increase in demand after full inundation is not consistently observed, which suggests that the loading is primarily associated with hydrodynamic effects that are a function of the effective area of the cross section, and may also be affected by the fact that the flow around the superstructure is less turbulent. To expand the data set, linear extrapolation to flow velocities of up to 6 m s−1 are shown in Fig. 7a, c and e as dotted lines with open markers. It is noted that the plots in Fig. 7 show peak demands across all elastomeric bearings in the bridge, and the actual extent of damage depends on the progression of failure in multiple bearings.
The Commentary to the AASHTO LRFD Bridge Specification (2017) states a coefficient of friction of 0.2 between elastomeric bearings and concrete is appropriate for design, and this limit is used here to evaluate potential girder unseating due to loss of frictional resistance. For the purpose of this evaluation, dowel resistance is neglected, though this effect could prevent unseating in practice. Figures 7a and b plot the peak ratios of shear-to-normal forces across all bearings on the bridge, and it can be observed that the bearings are well below the limit suggested in the AASHTO Commentary (which is labeled as μmax and shown as the gray line). However, it must be noted that the coefficient of friction may be lower than expected under wet conditions and that the lateral hydrodynamic loading can be significant, increasing vulnerability of unseating due to debris impact. To illustrate how the sequential fluid–structure modeling results may be applied, a highly conservative, reduced coefficient friction of 0.1 is considered. Using this threshold, the results indicate flow conditions for which the given frictional resistance is approached or exceeded: 13.5 m flow depth with velocity of at least 6 m s−1, 15 m flow depth with velocity of at least 5 m s−1, 18 m flow depth with velocity of at least 6 m s−1.
Figure 7c and d show peak shear strains due to loading perpendicular to the short edge of the bearing pad (see Fig. 4b) due to combined axial load (γa), rotation (γr), and shear (γs). The shear strains are computed based on Eqs. (4)–(6) based on the AASHTO LRFD Bridge Specification (2017).
In Eqs. (4)–(6) equations, Da and Dr are empirical coefficients, σs is the average compressive stress, G is the shear modulus, Si is the shape factor of the ith internal layer, L is the bearing length perpendicular to the axis of rotation, hri is the thickness of the ith internal elastomeric layer, hrt is the total thickness of the elastomer, θs is the rotation demand, n is the number of interior elastomeric layers, and Δs is the shear deformation. Note that σs, θs, and Δs are outputs from the structural analysis; the rotation demand, θs, includes 0.005 rad of rotation due to misalignment. For design per the AASHTO LRFD Bridge Specification (2017), the combined shear strain due to these actions should not exceed 5.0, and this criterion is satisfied in the analyses (all values, including extrapolated values, are below the gray line in Fig. 7c and d).
The shear deformation demand on the bearing Δs is shown to be more critical than the combined shear strains: Fig. 7e and f show these data with the annotated shear strain limit of in gray; this limit is also based on the AASHTO Specification (2017). The demand is clearly largest for a flow height of 15 m, and it increases linearly with the flow velocity.
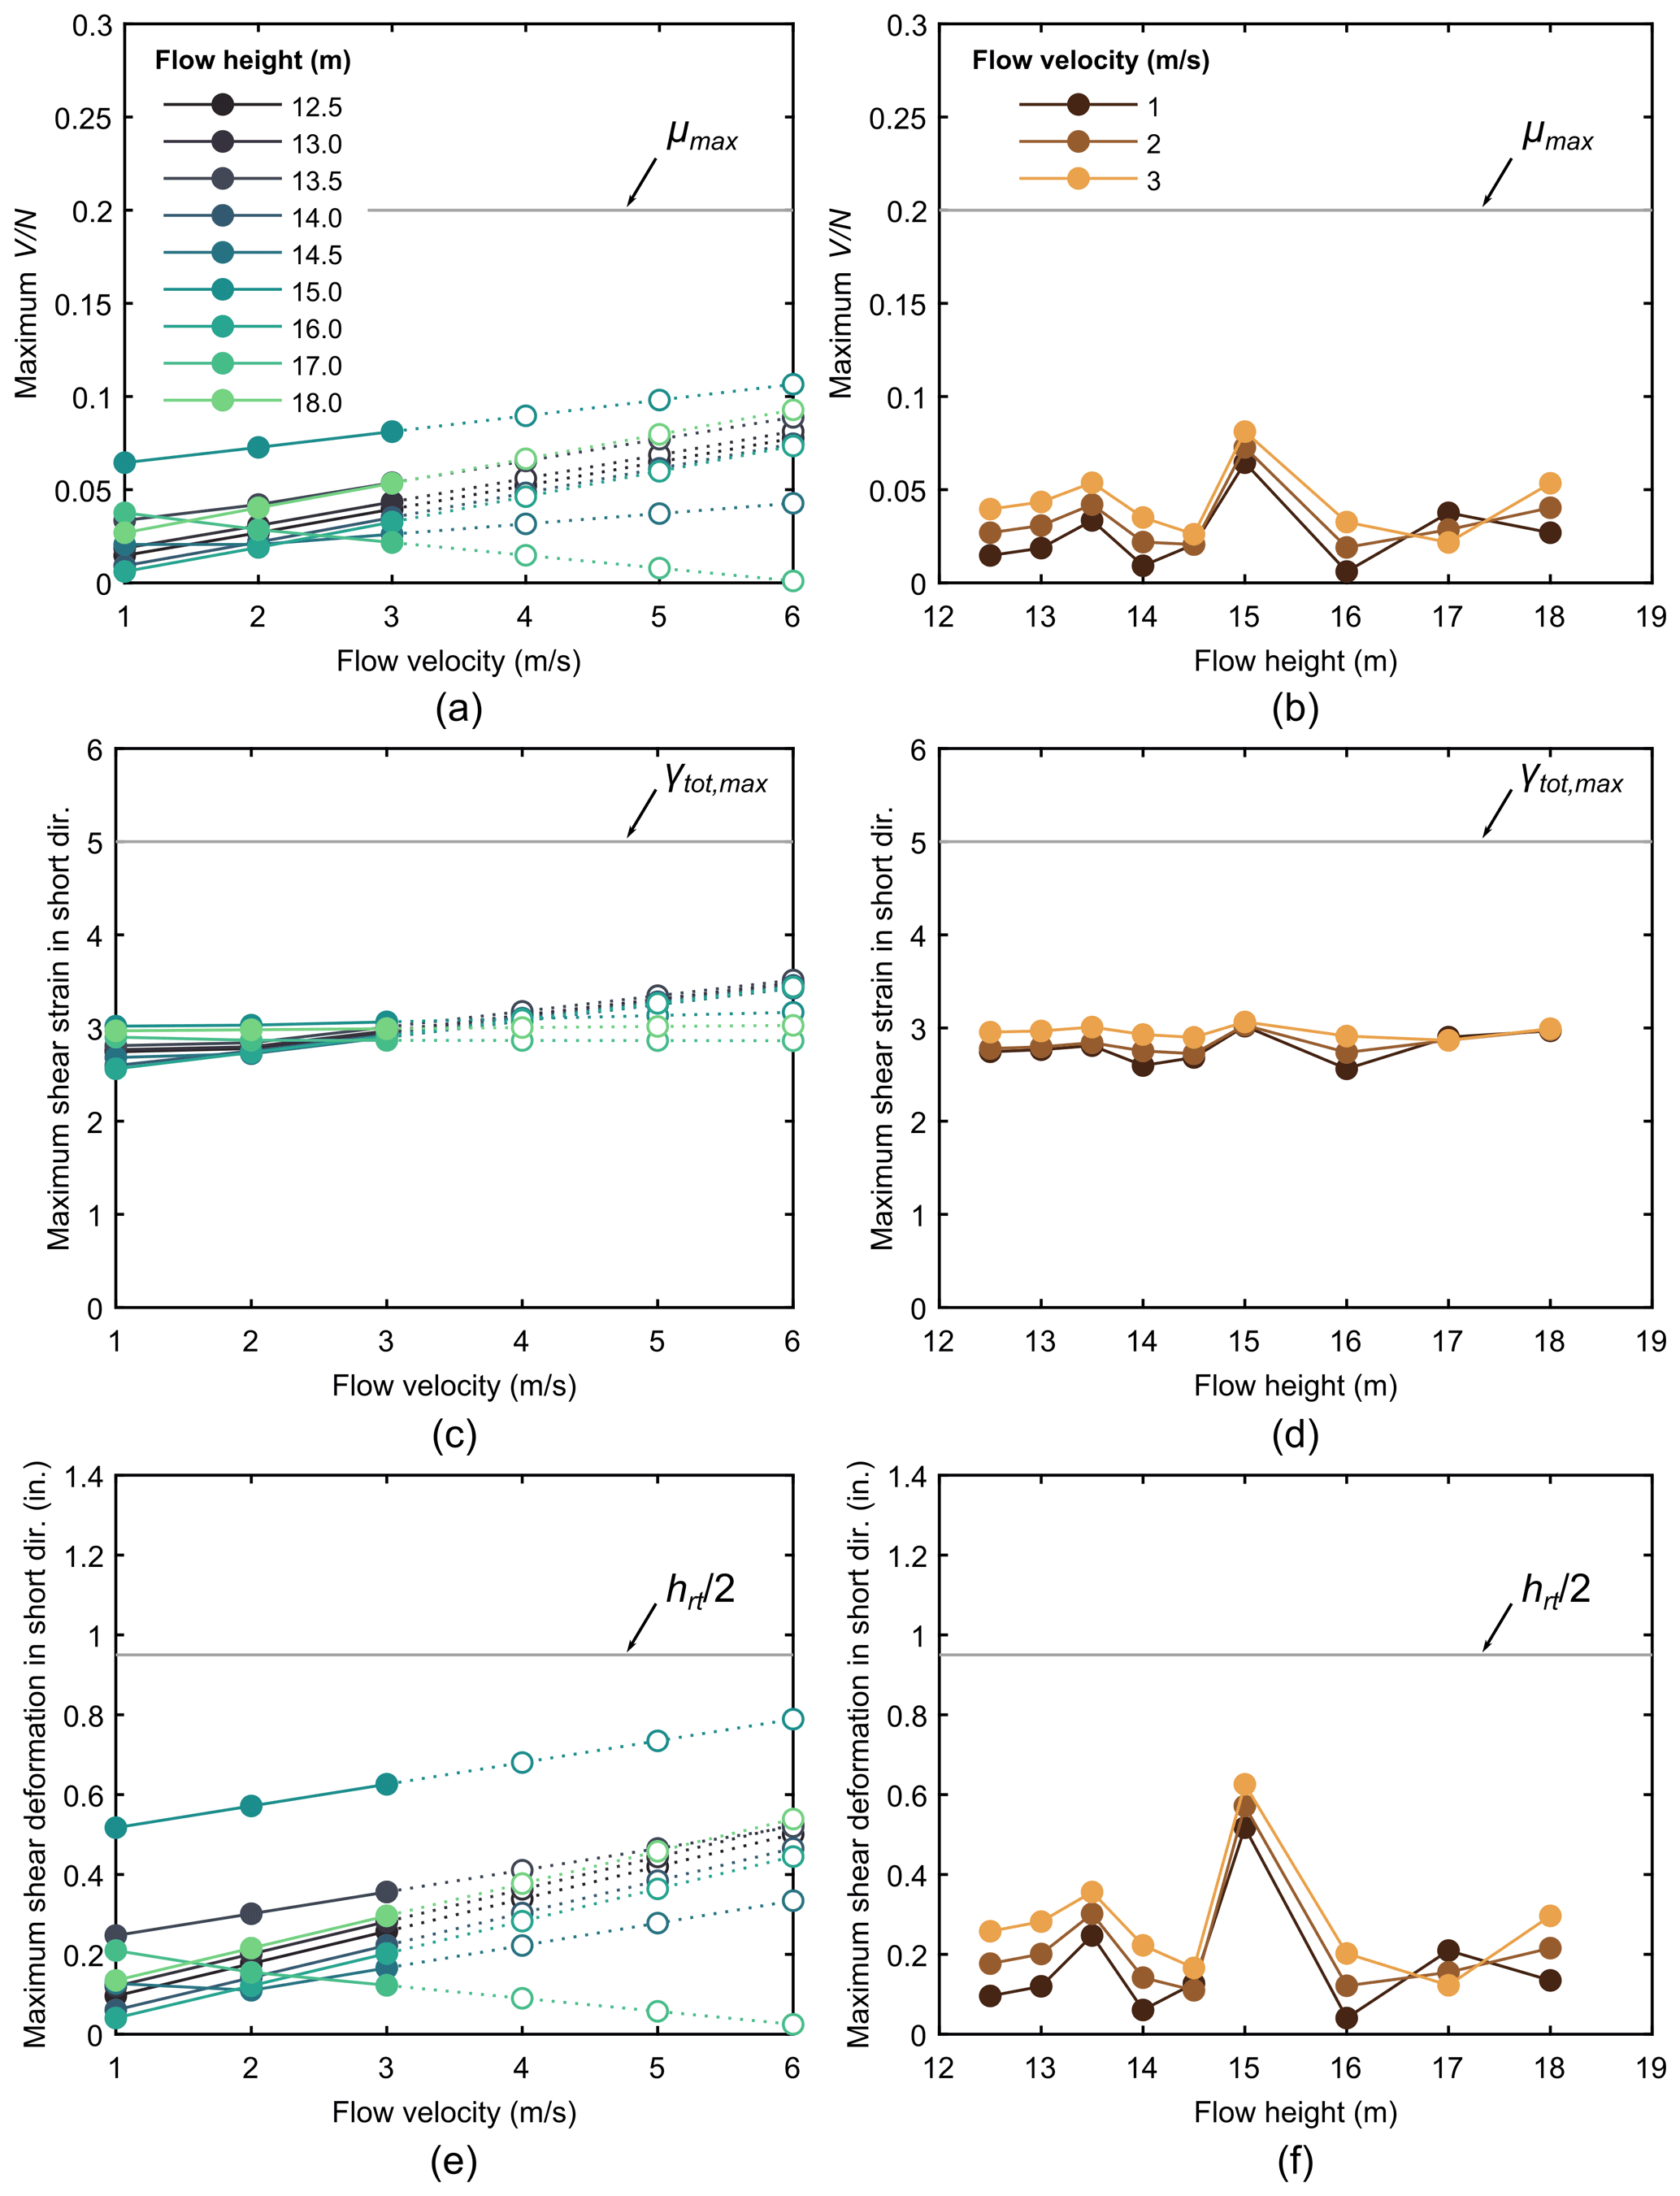
Figure 7Maximum simulated demand on elastomeric bearings in M6 bridge, including (a, b) shear force, (c, d) total shear strain due to combined axial, moment and shear demands, and (e, f) shear deformation; plots on left show demand versus flow velocity and plots on right show demand versus flow height.
3.3 Network impact and consequence assessment
The results of the loosely coupled CFD and structural analyses described in Sect. 3.2 suggest a potential for either girder unseating due to loss of frictional resistance or excessive shear deformation, which may lead to debonding and delamination for this particular bridge. In addition, damage associated with these limit states is most expected at a flow height of 15 m and flow velocity of at least 5 m s−1. The impact of damage in this flood scenario is therefore considered in this section. Based on Table 1, the damage state is estimated as moderate because: (i) the bearings approach but do not exceed limit states, (ii) scour is assumed to be insignificant compared to damage to the superstructure and bearings and (iii) water overtops the bridge deck. A moderate damage state implies the bridge closure for 5–12 d (see Table 1). In the case of the M6 bridge, its closure causes disruptions to all southbound and northbound users that are traveling along the M6 (Fig. 8). Compared to the baseline journey, results show that private cars are delayed by 12 min and have additional ca. 9 km due to rerouting. HGVs cannot travel via the historic Eden Bridge (city center) and are subject to a longer rerouting, which leads to 19 min and ca. 20 km of delay and additional traveling, respectively (considering free flow conditions).
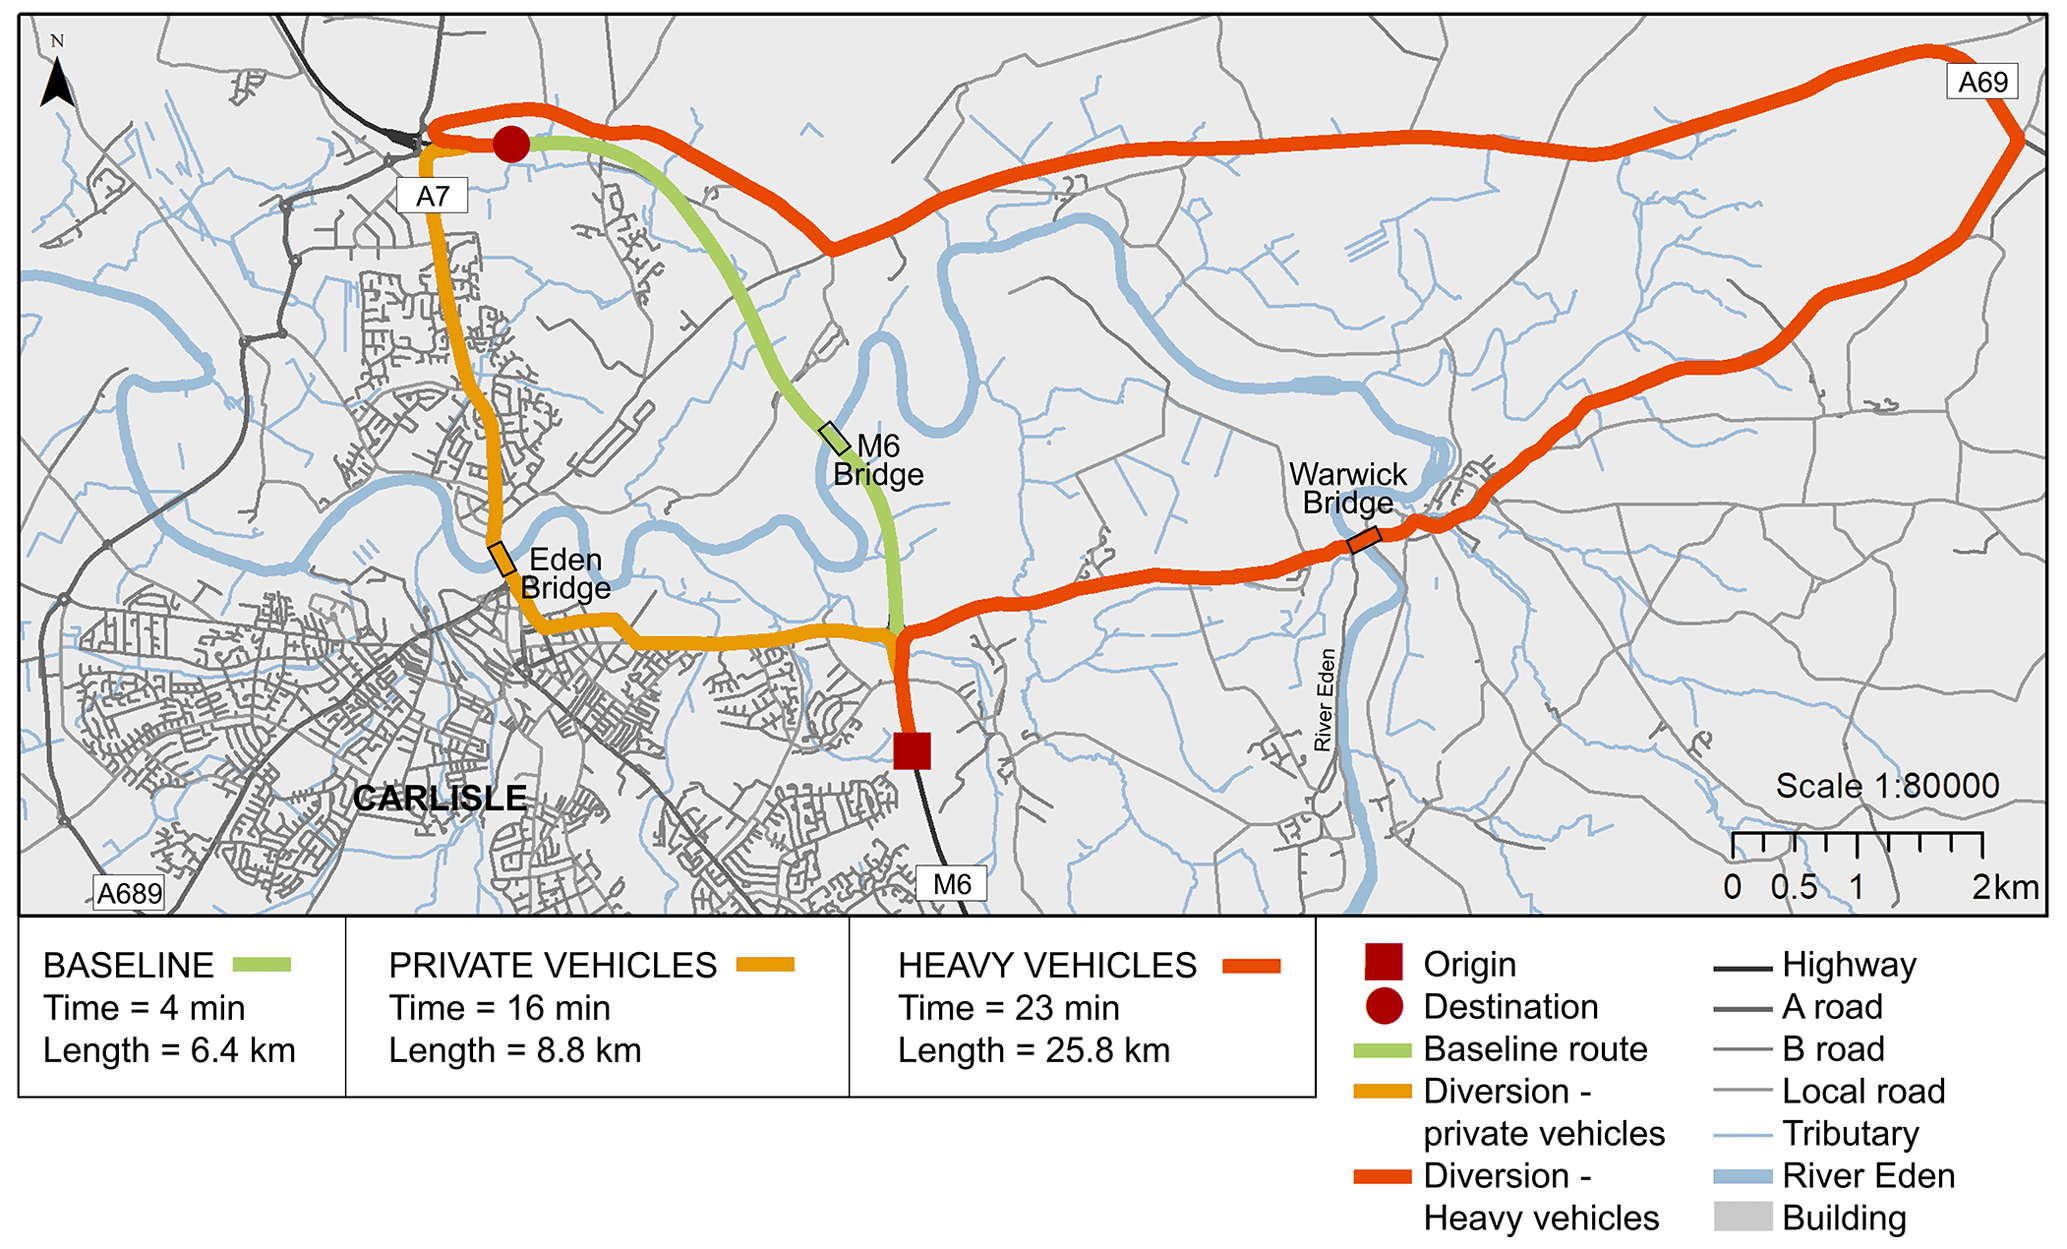
Figure 8Routes for crossing the river Eden along the highway in baseline and disrupted conditions; private and heavy vehicles are rerouted on different journeys when the M6 bridge is disrupted.
The cost of the impact due to the M6 bridge disruption is computed in terms of direct and indirect consequences using Eq. (1); output and input values are specified in Table 5.
Table 5Output and input data for the impact cost calculation considering disruption due to an extreme flood event on the M6 bridge in Carlisle. Abbreviations: VTT – value of travel time; HGV – heavy good vehicle; VOC – vehicle operating cost; ADT – average daily traffic.
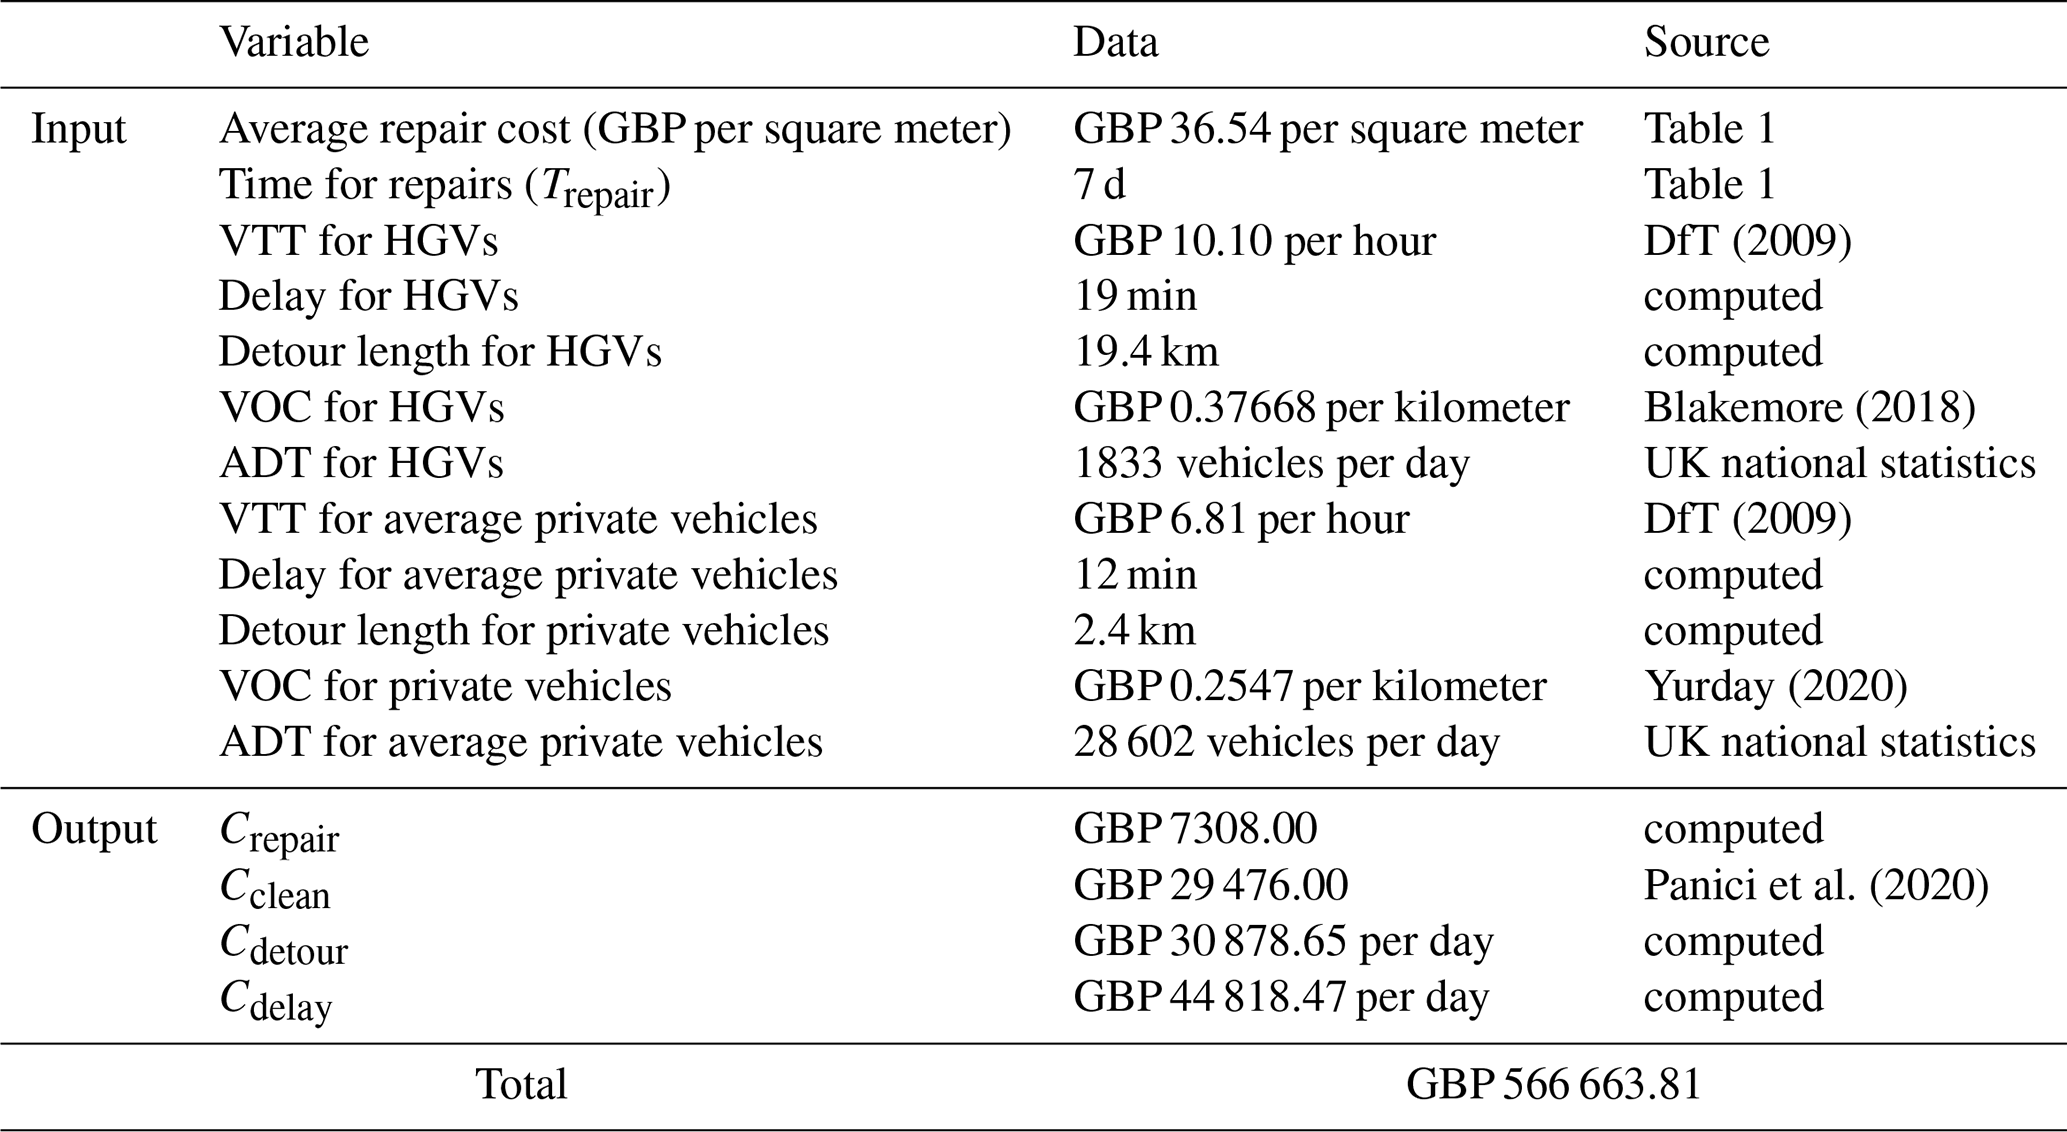
The values of Value of Travel Time (VTT) of HGVs (Heavy Good Vehicles, working condition) and average private cars (unspecified conditions) can be found in the UK Department for Transport (DfT) appraisal methods, illustrated in the Cost Benefit Analysis (COBA) manual (DfT, 2009). Data regarding the additional travel time for rerouting has been computing via transport modeling (Sect. 2.5) and verified with Google Maps (Fig. 8); for the UK, topological road network links are freely available nationwide. Data regarding Average Daily Traffic (ADT) flow are freely available (http://webtris.highwaysengland.co.uk/, last access: 28 April 2022) and were obtained by considering the annual northbound and southbound flows for the relevant sites (36 670 vehicles per day: Site 9538/2 on link M6 southbound and Site 9540/2 on link M6 northbound; 2019 data), considering the traffic composition at 78 % for private cars and 5 % for HGVs (DfT, 2019).
The repair cost (Crepair) was computed using Table 1 and assuming 7 d (average) of bridge closure; the cost of debris removal was obtained by looking at the highest cost for a single event in the UK (Panici et al., 2020), since the simulated flooding is an extreme and rare event. The additional vehicle operating due to the detour per day (Cdetour) was calculated using Eq. (2); the cost associated with trip delays (Cdelay) was calculated using Eq. (3).
For the case study undertaken (Carlisle, UK; 1-in-a-500-years event), the total cost of the flood impact to the bridge is GBP 566 663.81, considering 7 d of bridge closure. The largest proportion (93.5 %) of this cost is due to the indirect cost of rerouting traffic (GBP 75 697.12 per day of closure, i.e., GBP 529 879.81); the 6.5 % of the total cost is due to direct damages only (GBP 36 784.00).
This study developed an integrated method that uses a multiphysics, multilevel approach for assessing the effect of flooding hazards on a local transportation network. For the city of Carlisle (UK), a 1-in-500-years flooding event was simulated and the resulting hydrodynamic forces on the highway bridge (M6) modeled. While simulated hydrodynamic forces and finite element (FE) analysis did not show uplift failure, overtopping of the bridge is shown to occur at inundation heights of 14 m and above. Given the potential for flood-related disruption of traffic, overtopping should be considered temporary network failure in its own right. The elastomeric bearings supporting the bridge girders approached shear deformations near design limits at a flow height of 15 m, and a potential loss of frictional resistance between the elastomer and concrete is also observed. While these limit states were not exceeded for flow velocities up to 3 m s−1, extrapolation to faster flow rates suggests higher potential for damage. Under this hypothesis, the bridge would lose immediate functionality at a flow height of between 13.5 and 14.0 m due to inundation of the deck even if the structure sustains no damage. The impact analysis showed that indirect damages covered the 93.5 % of the total cost of damages to the bridge, proving that limiting the assessment to repairs and debris cleaning would greatly underestimate the impact of flooding to bridges.
The produced outputs are conceptual results and thus approximate and indicative for multiple reasons. First, there is a dearth of UK-specific data regarding bridge repairs, duration time of repair, etc.; research or survey to solicit post-flood data are highly recommended to improve impact estimates. For example, a bridge could be partially closed during repairs (according to its damage state) and allow traffic in one direction. Second, the modeling approach presented herein used several intentional simplifications for demonstration purposes, including reducing the CFD domain, neglecting soil-foundation effects and scour modeling, and assumed rigidity of the structural system among others. In scenarios where these issues (or others) may be of more concern for a particular bridge, the fidelity of the modeling approach could be improved. Additionally, the failure states presented here may not translate broadly to the general bridge inventory, but additional or alternative structural/functional failure states could be applied. Third, the impact analysis was limited to private cars and HGVs for demonstration purposed; however, advanced transport appraisal could better capture users' choices and the engineering response of lifelines by including a wider range of vehicles categories and traffic scenarios. In terms of impact, the presence of floodwater on the roads is not simulated for limiting the focus of this work on riverine flooding and the bridge impact consequences; for properly analyzing the flooding impact to road networks, simulation of surface water flooding should be undertaken; this analysis would be a study on its own, and currently out of the scope of this piece of research. Flood impact on other parts of the network would limit the capacity of the alternative routes, causing additional delays to the traffic; thus, obtained results represent an underestimation of the overall systemic cost. Nevertheless, the proposed approach of impact analysis can give modelers and analysts a comprehensive method for assessing susceptibility to flooding and relative consequences at systemic level and the case study presented here represents an archetype for this approach.
Thus, the importance of this study consists in the proof of concept of a new holistic methodology which uses a multilevel approach to improve the fidelity of network failure predictions, taking advantage of seemingly disparate physical models. The computed hydrodynamic forces were applied directly into a traditional FE model to predict the global structural response to identify critical structural components and damage states. Notably, the hydrodynamic forces induced large demands on bearings that are often not considered in design. Because of the critical nature of bridges to a transportation network, the impact analysis revealed that indirect cost cover almost all the total cost due to flooding; this consideration is fundamental for infrastructure owners and managers when managing assets and budgets.
Next steps of this study will analyze the impact of the closure for a second bridge (e.g., the masonry arch Eden Bridge – data permitting), in isolation first and then in combination with the M6 bridge. Future work should investigate the impacts of other limit states which could result in total or partial bridge closure; a wider range of bridge types should be investigated too. Such analyses would benefit from 3D CFD and FE models to help refining demands on the structure and reducing uncertainty in the predicted bridge performance. Ultimately, this approach can be applied to any coastal or riverine structure where large-scale water inundation is expected.
This paper focused on riverine bridges prone to failures during flood events. This study established rigorous practices of Computational Fluid Dynamics (CFD) for modeling hydrodynamic forces on inundated bridges, and understanding the consequences of such impact on the surrounding network. The hydrodynamic forces were modeled as demand on the bridge structure and inputted into a vulnerability analysis of the structure; the performance evaluation showed a moderate damage state of the bridge which was used to approximate the overall direct and indirect consequences. For the city of Carlisle (UK) and a 1-in-500-years flooding, results showed that the flood impact to the M6 bridge (highway bridge) caused more than GBP 500 000 of damages of which 93.5 % indirect damages (rerouting and delays). The relevance of this work resides in the integrated method that couple practices of CFD with performance and network analysis, which allows to estimate the cost due to flooding impact to a bridge considering the surrounding transport system. Infrastructure owners and managers, as well as modelers and researchers, should build on this work to better predict local fluid pressures that may lead to bridge structural failure and related network-wide consequences.
Bridge data were shared from Highways England (now National Highways) via a data transfer agreement. Publicly available data sources used for this study include: OpenStreetMap (https://www.openstreetmap.org/, OpenStreetMap, 2022), Google Maps (https://www.google.com/maps, Google Maps, 2022) and ArcGIS Online for Cumbria river sections (https://www.arcgis.com/apps/Elevations/index.html?appid=d807529a81f4441b96c780ac7a430164, Eden Rivers Trust, 2022). Flood data are available upon request for research purposes and on: https://www.fathom.global/ (Fathom, 2022).
MP and MRM conceived the research work; PB developed the flood hazard; AOW and DM developed the CFD analysis; ADS developed the structural; MP developed the network analysis; MRM supervised the work. All authors contributed to the writing and review of the paper.
The contact author has declared that neither they nor their co-authors have any competing interests.
Publisher’s note: Copernicus Publications remains neutral with regard to jurisdictional claims in published maps and institutional affiliations.
The authors also gratefully acknowledge the following people for their support: Mark Pooley at Highways England; John L. Kelsall at Phoenix Architecture & Planning; and Mohammad Fereshtehpour at Ferdowsi University of Mashhad.
Maria Pregnolato has been supported by the Engineering and Physical Sciences Research Council (ESPRC) LWEC (Living With Environmental Change) Fellowship (grant nos. EP/R00742X/1 and 2). Paul Bates has been supported by a Royal Society Wolfson Research Merit award.
This paper was edited by Kai Schröter and reviewed by four anonymous referees.
AASHTO (American Association of State Highway and Transportation Officials): Standard specifications for highway bridges, 7th Edition, American Association of State Highway Officials and Transportation Officials, Washington, DC, ISBN 156051-171-0, 2002.
AASHTO (American Association of State Highway and Transportation Officials): AASHTO LRFD Bridge Design Specifications, 8th Edition, American Association of State Highway Officials and Transportation Officials, Washington, DC, ISBN 978-1-56051-654-5, 2017.
Ahamed, T., Duan, J. G., and Jo, H.: Flood-fragility analysis of instream bridges–consideration of flow hydraulics, geotechnical uncertainties, and variable scour depth, Struct. Infrastruct. E., 17, 1–14, https://doi.org/10.1080/15732479.2020.1815226, 2020.
Alabbad, Y., Mount, J., Campbell, A. M., and Demir, I.: Assessment of transportation system disruption and accessibility to critical amenities during flooding: Iowa case study, Sci. Total Environ., 793, 148476, https://doi.org/10.1016/j.scitotenv.2021.148476, 2021.
Argyroudis, S. A., Mitoulis, S. A., Winter, M. G., and Kaynia, A. M.: Fragility of transport assets exposed to multiple hazards: State-of-the-art review toward infrastructural resilience, Reliab. Eng. Syst. Safe., 191, 106567, https://doi.org/10.1016/j.ress.2019.106567, 2019.
Arneson, L. A., Zevenbergen, L. W., Lagasse, P. F., and Clopper, P. E.: Evaluating scour at bridges, 5th Edition, Publication no. FHWA-HIF-12-003, Hydraulic Engineering Circular No. 18, U.S. Department of Transportation, Federal Highway Administration, https://www.fhwa.dot.gov/engineering/hydraulics/pubs/hif12003.pdf (last access: 2 May 2022), 2012.
Arrighi, C., Pregnolato, M., Dawson, R., and Castelli, F.: Preparedness against mobility disruption by floods, Sci. Total Environ., 654, 1010–1022, https://doi.org/10.1016/j.scitotenv.2018.11.191, 2019.
Bates, P. D., Horritt, M. S., and Fewtrell, T. J.: A simple inertial formulation of the shallow water equations for efficient two-dimensional flood inundation modelling, J. Hydrol., 387, 33–45, https://doi.org/10.1016/j.jhydrol.2010.03.027, 2010.
Bento, A. M., Viseu, T., Pêgo, J. P., and Couto, L.: Experimental Characterization of the Flow Field around Oblong Bridge Piers, Fluids, 6, 370, https://doi.org/10.3390/fluids6110370, 2021.
Blakemore, T.: Truck operating costs report for 2018, https://thetruckexpert.co.uk/truck-operating-costs-report-for-2018/ (last access: 12 May 2020), 2018.
Carey, T. J., Mason, H. B., Barbosa, A. R., and Michael, H. S.: Multihazard Earthquake and Tsunami Effects on Soil–Foundation–Bridge Systems, J. Bridge Eng., 24, 04019004, https://doi.org/10.1061/(ASCE)BE.1943-5592.0001353, 2019.
de Almeida, G. A. M., Bates, P. D., Freer, J. E., and Souvignet, M.: Improving the stability of a simple formulation of the shallow water equations for 2-D flood modelling, Water Resour. Res., 48, W05528, https://doi.org/10.1029/2011wr011570, 2012.
Department for Transport (DfT): COBA Manual, https://www.gov.uk/government/publications/cobalt-software-and-user-manuals (last access: 12 May 2020), 2009.
Department for Transport (DfT): Road Traffic Estimates: Great Britain 2018: https://assets.publishing.service.gov.uk/government/uploads/system/uploads/attachment_data/file/808555/road-traffic-estimates-in-great-britain-2018.pdf (last access: 12 May 2020), 2019.
EA: Carlisle Flood Investigation Report 2016, Environment Agency (EA), Cumbria County Council: https://www.cumbria.gov.uk/planning-environment/flooding/flood_investigation_reports_carlisle.asp (last access: 12 November 2020), 2016.
Eden Rivers Trust: Topography of the River Eden. Learn about river Long Profiles and Valley Cross Sections, https://www.arcgis.com/apps/Elevations/index.html?appid=d807529a81f4441b96c780ac7a430164, last access: 9 May 2022.
Ertugay, K., Argyroudis, S., and Düzgün, H. Ş.: Accessibility modeling in earthquake case considering road closure probabilities: a case study of health and shelter service accessibility in Thessaloniki, Greece, Int. J. Disast. Risk Re., 17, 49–66, https://doi.org/10.1016/j.ijdrr.2016.03.005, 2016.
Fathom: https://www.fathom.global/, last access: 9 May 2022.
Gardoni, P.: Routledge Handbook of Sustainable and Resilient Infrastructure, London, Routledge, https://doi.org/10.4324/9781315142074, 2018.
Gidaris, I., Padgett, J. E., Barbosa, A. R., Chen, S., Cox, D. T., Webb, B., and Cerato, A.: Multiple-hazard fragility and restoration models of highway bridges for regional risk and resilience assessment in the United States: State-of-the-art review, J. Struct. Eng., 143, 04016188, https://doi.org/10.1061/(ASCE)ST.1943-541X.0001672, 2017.
Gehl, P. and D'Ayala, D.: System loss assessment of bridge networks accounting for multi-hazard interactions, Struct. Infrastruct. E., 14, 1355–1371, 2018.
Google Maps: https://www.google.com/maps/@51.5276879,9.9211719,14z, last access: 9 May 2022.
Grossi, P. and Kunreuther, H.: Catastrophe Modeling: A New Approach to Managing Risk, New York, Springer-Verlag, 2005.
FEMA: HAZUS-MH MR1: Technical manual, Earthquake Model, Federal Emergency Management Agency, Washington, D.C., https://www.fema.gov/sites/default/files/2020-09/fema_hazus_earthquake-model_technical-manual_2.1.pdf (last access: 2 May 2022), 2003.
Highways England (HE): Design Manual for Roads and Bridges BD 97/12 The assessment of scour and other hydraulic actions at highway structures, http://www.standardsforhighways.co.uk/ha/standards/dmrb/vol3/section4/bd9712.pdf (last access: 12 May 2020), 2012.
Hung, C. C. and Yau, W. G.: Vulnerability evaluation of scoured bridges under floods, Eng. Struct., 132, 288–299, 2017.
Hunt, B.: Monitoring scour critical bridges, Vol. 396, Washington, DC, Transportation Research Board, https://nap.nationalacademies.org/catalog/22979/monitoring-scour-critical-bridges (last access: 2 May 2022), 2009.
Johnson, P. A. and Whittington, R. M.: Vulnerability-based risk assessment for stream instability at bridges, J. Hydraul. Eng., 137, 1248–1256, https://doi.org/10.1061/(ASCE)HY.1943-7900.0000443, 2011.
Kerenyi, K., Sofu, T., and Guo, J.: Hydrodynamic forces on inundated bridge decks, Federal Highway Administration, FHWA-HRT-09-028, https://www.fhwa.dot.gov/publications/research/infrastructure/hydraulics/09028/002.cfm (last access: 2 May 2022), 2009.
Khan, M. A.: Rapid Bridge Insertions Following Failures, chap. 6, Accelerated Bridge Construction, Butterworth-Heinemann, 257–308, https://doi.org/10.1016/B978-0-12-407224-4.00006-X, 2015.
Kilanitis, I. and Sextos, A.: Integrated seismic risk and resilience assessment of roadway networks in earthquake prone areas, Bulletin of Earthquake, 17, 181–210, https://doi.org/10.1007/s10518-018-0457-y, 2019.
Kim, B., Shin, S. C., and Kim, D. Y.: Scenario-based economic impact analysis for bridge closures due to flooding: A case study of North Gyeongsang Province, South Korea, Water, 10, 981, https://doi.org/10.3390/w10080981, 2018.
Kim, H., Sim, S. H., Lee, J., Lee, Y. J., and Kim, J. M.: Flood fragility analysis for bridges with multiple failure modes, Adv. Mech. Eng., 9, 1–11, https://doi.org/10.1177/1687814017696415, 2017.
Kirby, A. M., Roca, M., Kitchen, A., Escarameia, M., and Chesterton, O. J.: Manual on scour at bridges and other hydraulic structures, 2nd edition, CIRIA C742, RP987, London, CIRIA, ISBN 978-0-86017-747-0, 2015.
Lam, J. C. and Adey, B. T.: Integrating functional loss assessment and restoration analysis in the quantification of indirect consequences of natural hazards, ASCE-ASME J. Risk and Uncertainty in Eng. Systems, Part A: Civil Engineering, 2, 04016008, https://doi.org/10.1061/AJRUA6.0000877, 2016.
Li, J., Kong, X., Yang, Y., Deng, L., and Xiong, W.: CFD investigations of tsunami-induced scour around bridge piers, Ocean Eng., 244, 110373, https://doi.org/10.1016/j.oceaneng.2021.110373, 2021.
Liu, L., Frangopol, D. M., Mondoro, A., and Yang, D. Y.: Sustainability-Informed Bridge Ranking under Scour Based on Transportation Network Performance and Multi-attribute Utility, J. Bridge Eng., 23, 04018082, https://doi.org/10.1061/(ASCE)BE.1943-5592.0001296, 2018.
Lomonaco, P., Alam, M. S., Arduino, P., Barbosa, A., Cox, D. T., Do, T., Eberhard, M., Motley, M. R., Shekhar, K., Tomiczek, T., Park, H., van de Lindt, J. W., and Winter, A.: Experimental modeling of wave forces and hydrodynamics on elevated coastal structures subject to waves, surge or tsunamis: the effect of breaking, shielding and debris, Coastal Eng. Proceedings, 1, 53, https://doi.org/10.9753/icce.v36.waves.53, 2018.
McKenna, F., Scott, M. H., and Fenves, G. L.: Nonlinear finite-element analysis software architecture using object composition, J. Comput. Civ. Eng., 24, 95–107, 2010.
Mondoro, A. and Frangopol, D. M.: Risk-based cost-benefit analysis for the retrofit of bridges exposed to extreme hydrologic events considering multiple failure modes, Eng. Struct., 159, 310–319, https://doi.org/10.1016/j.engstruct.2017.12.029, 2018.
Motley, M. R., Wong, H. K., Qin, X., Winter, A. O., and Eberhard, M. O.: Tsunami-induced forces on skewed bridges, J. Waterway, Port, Coastal, Ocean Eng., 142, 04015025, https://doi.org/10.1061/(ASCE)WW.1943-5460.0000328, 2016.
Neal, J. C., Bates, P. D., Fewtrell, T. J., Hunter, N. M., Wilson, M. D., and Horritt, M. S.: Distributed whole city water level measurements from the Carlisle 2005 urban flood event and comparison with hydraulic model simulations, J. Hydrol., 368, 42–55, https://doi.org/10.1016/j.jhydrol.2009.01.026, 2009.
Neal, J. C, Dunne, T., Sampson, C., Smith, A., and Bates, P.D.: Optimisation of the two-dimensional hydraulic model LISFLOOD-LP for CPU architecture, Environ. Model. Softw., 107, 148–157, https://doi.org/10.1016/j.envsoft.2018.05.011, 2018.
OpenStreetMap: https://www.openstreetmap.org/#map=12/52.3561/9.7871, last access: 9 May 2022.
Oudenbroek, K., Naderi, N., Bricker, J. D., Yang, Y., Van der Veen, C., Uijttewaal, W., Moriguchi, S., and Jonkman, S.N.: Hydrodynamic and Debris-Damming Failure of Bridge Decks and Piers in Steady Flow, Geosciences, 8, 409, https://doi.org/10.3390/geosciences8110409, 2018.
Padgett, J. E., DesRoches, R., Nielson, B., Yashinsky, M., Kwon, O.-S., Burdette, M., and Tavera E.: Bridge damage and repair costs from hurricane Katrina, J. Bridge Eng., 13, 6–14, https://doi.org/10.1061/(ASCE)1084-0702(2008)13:1(6), 2008.
Panici, D., Kripakaran, P., Djordjević, S., and Dentith, K.: A practical method to assess risks from large wood debris accumulations at bridge piers, Sci. Total Environ., 728, 138575, https://doi.org/10.1016/j.scitotenv.2020.138575, 2020.
Porter, K., Jones, L., Cox, D., Goltz, J., Hudnut, K., Mileti, D., Perry, S., Ponti, D., Reichle, M., Rose, A. Z., Scawthorn, C. R., Seligson, H. A., Shoaf, K. I., Treiman, J., and Wein, A.: The ShakeOut Scenario: A Hypothetical Mw7.8 Earthquake on the Southern San Andreas Fault, Earthq. Spectra, 27, 239–261, https://doi.org/10.1193/1.3563624, 2011.
Pregnolato, M.: Bridge safety is not for granted – A novel approach for bridge management, Eng. Struct., 196, 109193, https://doi.org/10.1016/j.engstruct.2019.05.035, 2019.
Pregnolato, M., Ford, A., Robson, C., Glenis, V., Barr, S., and Dawson, R. J.: Assessing Urban Strategies for Reducing the Impacts of extreme Weather on Infrastructure Networks, Roy. Soc. Open Sci., 3, 1–15, https://doi.org/10.1098/rsos.160023, 2016.
Pregnolato, M., Vardanega, P. J., Limongelli, M. P., Giordano, P. F., and Prendergast, L. J.: Risk-based scour management: a survey, in: Bridge Maintenance, Safety, Management, Life-Cycle Sustainability and Innovations: Proceedings of the 10th International Conference on Bridge Maintenance, Safety and Management (IABMAS 2020), Sapporo, Japan, 11–15 April 2021, edited by: Yokota, H. and Frangopol, D. M., CRC Press/Balkema Taylor & Francis Group, the Netherlands, 1258–1264, https://doi.org/10.1201/9780429279119-170, 2021a.
Pregnolato, M., Winter, A. O., Mascarenas, D., Sen, A. D., Bates, P., and Motley, M. R.: An integrated impact analysis for riverine bridges subjected to high river flows, in: Bridge Maintenance, Safety, Management, Life-Cycle Sustainability and Innovations: Proceedings of the 10th International Conference on Bridge Maintenance, Safety and Management (IABMAS 2020), Sapporo, Japan, 11–15 April 2021, edited by: Yokota, H. and Frangopol, D. M., CRC Press/Balkema Taylor & Francis Group, the Netherlands, 693–701, https://doi.org/10.1201/9780429279119-91, 2021b.
Qin, X., Motley, M. R., and Marafi, N.: Three-dimensional modeling of tsunami forces on coastal communities, Coast. Eng., 140, 43–59, https://doi.org/10.1016/j.coastaleng.2018.06.008, 2018.
Solomon, S., Manning, M., Marquis, M., and Qin, D.: Climate change 2007 – the physical science basis: Working group I contribution to the 4th assessment report of the IPCC, Cambridge University Press, Cambridge, https://www.ipcc.ch/report/ar4/wg1/ (last access: 2 May 2022), 2007.
Stanton, J. F., Roeder, C. W., Mackenzie-Helnwein, P., White, C., Kuester, C., and Craig, B.: Rotation Limits for Elastomeric Bearings, NCHRP Report 596, The National Academies Press, Washington D.C., https://doi.org/10.17226/23131, 2008.
Stephens, M. T., Winter, A., Motley, M. R., and Lehman, D. E.: Comparing seismic and tsunami load de-mands on reinforced concrete and concrete filled steel tube bridges, Proceedings of the 39th IABSE Symposium, IABSE Symposium Report Volume 109, Vancouver, Canada, 21–23 September 2017, http://toc.proceedings.com/39814webtoc.pdf (last access: 2 May 2022), ISBN 978-1-5108-6424-5, 2017.
Tryggvason, G., Scardovelli, R., and Zaleski, S.: Direct numerical simulations of gas–liquid multiphase flows, Cambridge University Press, Cambridge, https://doi.org/10.1017/CBO9780511975264, 2011.
Vardanega, P. J., Gavriel, G., and Pregnolato, M.: Assessing the Suitability of Bridge Scour Monitoring Devices, Proceedings of the Institution of Civil Engineers – Forensic Engineering, 174, 105–117, https://doi.org/10.1680/jfoen.20.00022, 2021.
Wang, C., Yu, X., and Liang, F.: A review of bridge scour: mechanism, estimation, monitoring and countermeasures, Nat. Hazards, 87, 1881–1906, https://doi.org/10.1007/s11069-017-2842-2, 2017.
Wardhana, K. and Hadipriono, F. C.: Analysis of Recent Bridge Failures in the United States, J. Perform. Constr. Fac., 17, 144–150, https://doi.org/10.1061/(ASCE)0887-3828(2003)17:3(144), 2003.
Winter, A. O., Motley, M. R., and Eberhard, M. O.: Tsunami-like wave loading of individual bridge components, J. Bridge Eng., 23, 04017137, https://doi.org/10.1061/(ASCE)BE.1943-5592.0001177, 2017.
Yang, D. Y. and Frangopol, D.: Life-cycle management of deteriorating bridge networks with network-level risk bounds and system reliability analysis, Struct. Saf., 83, 101911, https://doi.org/10.1016/j.strusafe.2019.101911, 2020.
Yilmaz, T., Banerjee, S., and Johnson, P. A.: Performance of two real-life California bridges under regional natural hazards, J. Bridge. Eng., 21, 1–15, https://doi.org/10.1061/(ASCE)BE.1943-5592.0000827, 2016.
Yurday, E.: Average Cost to Run a Car UK 2020, https://www.nimblefins.co.uk/average-cost-run-car-uk, last access: 12 May 2020.
Zhou, Y., Banerjee, S., and Shinozuka, M.: Socio-economic effect of seismic retrofit of bridges for highway transportation networks: a pilot study, Struct. Infrastruct. Eng., 6, 145–157, https://doi.org/10.1080/15732470802663862, 2010.