the Creative Commons Attribution 4.0 License.
the Creative Commons Attribution 4.0 License.
 | 14 Apr 2022
Hotspots for warm and dry summers in Romania
Viorica Nagavciuc
Patrick Scholz
The combined effect of hot and dry extremes can have disastrous consequences for society, the economy, and the environment. While a significant number of studies have been conducted regarding the variability of the individual hot or dry extremes in Romania, the evaluation of the combined effect of these extremes (e.g., compound effect) is still lacking for this region. Thus, in this study, we have assessed the spatiotemporal variability and trends of hot and dry summers in Romania, between 1950 and 2020, and we have analyzed the relationship between the frequency of hot summers and the prevailing large-scale atmospheric circulation. The length, spatial extent, and frequency of heat waves (HWs) in Romania present decadal variations, with the rate of increase being accelerated after the 1990s. The smallest number of HWs was observed between 1970 and 1985, while the highest number of HWs has been recorded over the last 2 decades (i.e., 2001–2020). The hottest years, in terms of heat wave duration and frequency, were 2007, 2012, 2015, and 2019. One of the key drivers of hot summers, over our analyzed region, is the prevailing large-scale circulation, featuring an anticyclonic circulation over the central and eastern parts of Europe and enhanced atmospheric blocking activity associated with positive temperature anomalies underneath. The results from this study can help improve our understanding of the spatiotemporal variability of hot and dry summers over Romania, as well as their driving mechanisms, which might lead to a better predictability of these extreme events in the region.
- Article
(26947 KB) - Full-text XML
-
Supplement
(4000 KB) - BibTeX
- EndNote


According to the recently published AR6 report (IPCC, 2021) “It is virtually certain that there has been increases in the intensity and duration of heat waves and the number of heat wave days at the global scale”. This tendency has been clearly observed, especially over the last 2 decades, when a significant increase in the frequency of hot summers has been observed (Feng et al., 2020; Raymond et al., 2020; Seneviratne et al., 2012; Zscheischler et al., 2018). Moreover, one of the main conclusions of the recently published IPCC AR6 report (IPCC, 2021) was that “future heatwaves will last longer and have higher temperatures”. In this report (and the references therein) it has been shown that on a global scale there is clear evidence of an increase in the number of warm nights and days and a decrease in the number of cold nights and days (IPCC, 2021). Overall, the frequency of warm days (TX90p) has increased globally with small exceptions in the southern part of South America (IPCC, 2021; Rusticucci et al., 2017). Over Europe, an increase in the magnitude and frequency of high maximum temperatures has been observed over the central (Lorenz et al., 2019; Tomczyk and Bednorz, 2016; Twardosz and Kossowska-Cezak, 2013) and the southeastern parts of Europe (Christidis et al., 2015; Croitoru et al., 2016; Croitoru and Piticar, 2013; Fioravanti et al., 2016; Malinovic-Milicevic et al., 2016).
Over different regions of the world, hot summers are usually accompanied by extremely dry conditions, leading to the development of the so-called “compound events” (Feng et al., 2020; Geirinhas et al., 2021; Leonard et al., 2014; Ridder et al., 2020; Russo et al., 2019). These compound events have the tendency to occur at the same time or in sequence, leading to devastating consequences for society, the economy, and the environment (Raymond et al., 2020; Zscheischler and Seneviratne, 2017). Heat waves and droughts fall into the category of climate-related hazards which more and more frequently affect socio-economic activity, often having serious repercussions on humans and the environment (IPCC, 2021). Thus, in the context of ongoing climate change, the analysis of heat waves and droughts, in terms of changes in their frequency and magnitude as well as the analysis of the large-scale circulation patterns which favor their occurrence, is of increasing interest (Balting et al., 2021; Feng et al., 2020; Geirinhas et al., 2021; Ionita et al., 2021a; Kong et al., 2020; Russo et al., 2019).
Several studies have suggested that due to global warming the large-scale atmospheric circulation has been altered both regionally and globally (Horton et al., 2015; Vaideanu et al., 2020). Any perturbance in the large-scale atmospheric circulation will also lead to changes in the hydroclimate, due to the fact that the atmospheric circulation plays a crucial role in the global and regional hydroclimatic variability (Ionita et al., 2020; Kingston et al., 2006, 2015; Schubert et al., 2016). Changes in temperature and precipitation have been found to be a direct response to changes in the large-scale atmospheric circulation patterns (e.g., an increase in the frequency of blocking conditions or an intensification of the westerlies) (Horton et al., 2015; Rimbu et al., 2014; Swain et al., 2016). For example, one key driver of the European hydroclimate variability is the prevalence of long-lasting high-pressure systems (also known as atmospheric blocking) (Bakke et al., 2020; Barriopedro et al., 2011; Ionita et al., 2021b; Kautz et al., 2022; Rimbu et al., 2014; Schubert et al., 2014). These long-lasting high-pressure systems have a significant impact on different types of extreme events such as heat waves (Barriopedro et al., 2011; Della-Marta et al., 2007; Laaha et al., 2017), cold spells (Jeong et al., 2021; Rimbu et al., 2014), droughts (Ionita et al., 2012; Kingston et al., 2015; Schubert et al., 2016), and floods (Grams et al., 2014; Najibi et al., 2019). Thus, it is essential to study the relationship between the changes in the magnitude and frequency of extreme events and their large-scale drivers, in order to have a better overview of the physical mechanisms leading to the occurrence of these extreme events.
In terms of exposure and vulnerability to such climate-related risks (e.g., heat waves and droughts), Romania is particularly prone to them, due to both its geographical position and the topographic features, which give it a very special status in relation to the manifestations of the weather (Croitoru and Piticar, 2013; Micu et al., 2021; Sfîcă et al., 2017). The existence of the Black Sea and, especially, the concentric distribution (i.e., “in the amphitheater”) of the Carpathian Mountains (Fig. 1) induce a series of peculiarities in the prevailing climatic conditions that are also reflected in the thermal regime mediated at the scale of different regions of the country. Moreover, the evolution of the weather in Romania depends strongly on the degree of exposure to alternating, often rapid, types of air masses passing the country (e.g., continental, tropical, maritime, or polar) (Bădăluță et al., 2019; Busuioc et al., 2010, 2015; Tomozeiu et al., 2005).
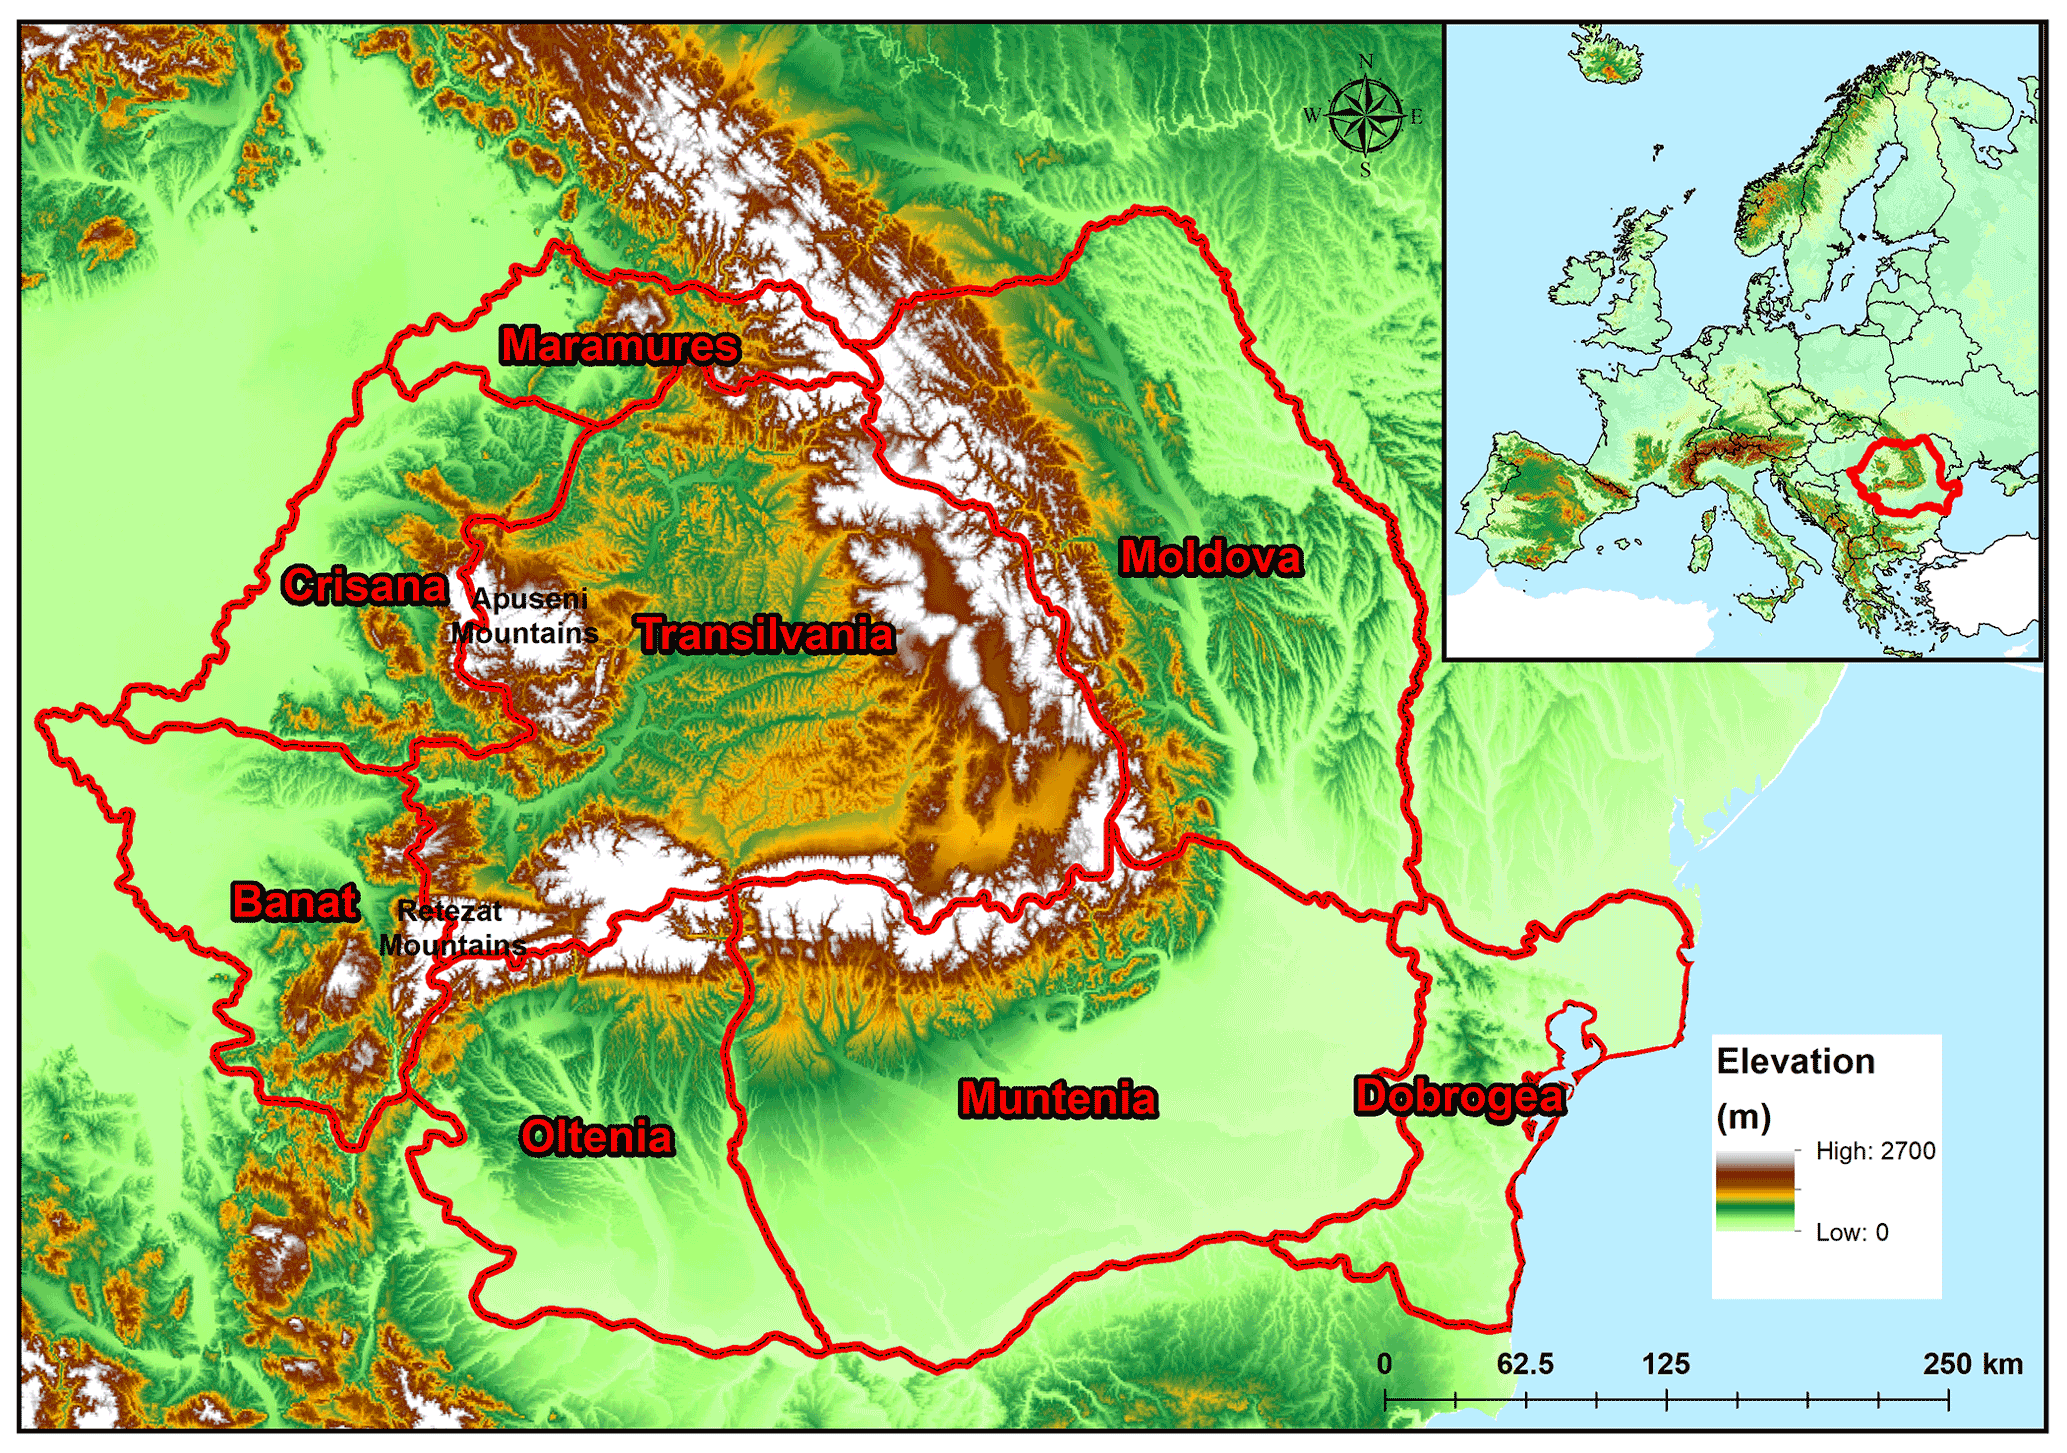
Figure 1Topographic map of Romania and the location of the country at the European level.
At country scale, different studies have analyzed the potential changes in the frequency of HWs, either by using observational records (e.g., station data) or gridded datasets (Croitoru et al., 2016; Croitoru and Piticar, 2013; Hustiu, 2016; Micu et al., 2021; Sfîcă et al., 2017). In their paper, Sfîcă et al. (2017) have analyzed the synoptic conditions which lead to the occurrence of heat waves in Romania, over the period 1961–2015. By analyzing 111 HW events they found that there are two major types of weather patterns associated with HW occurrence, namely positive or neutral sea level pressure anomalies and persistent ridges, over the analyzed region. Over the same period (i.e., 1961–2015), Croitoru et al. (2016) found that the frequency of heat waves, defined based on the daily maximum temperature, shows a significant increasing trend, throughout the country. Looking at a more regional scale, Croitoru and Piticar (2013) have shown that there is an increasing trend in the frequency of heat wave events over the extra-Carpathian regions of Romania (i.e., the eastern and southern part of the country) and that the daily maximum temperature is getting more extreme compared to the daily minimum temperature. Over the eastern part of the country, Hustiu (2016) has shown that the annual frequency of heat wave events features an increasing trend over the period 1961–2013, while in a more recent study, Micu et al. (2021) have shown that the southern part of the Carpathian Mountains is facing a significant warming trend. All the aforementioned studies are either limited in time or are very regional (Croitoru and Piticar, 2013; Hustiu, 2016; Sfîcă et al., 2017; Spinoni et al., 2015), and they were mainly focused on the analysis of trends in the heat wave frequency. To our knowledge no in-depth analysis, for this region, has been made regarding the variability and trend for compound events (e.g., hot and dry summers). Moreover, taking into account that the frequency of extreme events (e.g., heat waves, cold spells, drought, and floods) is projected to increase in the future (IPCC, 2021) it is imperative to also understand the physical process forcing the increase in the frequency and magnitude of these events in order to improve their predictability. Taking into account the aforementioned limitations, the current paper is focused on two main objectives: (i) to analyze the trends and the spatiotemporal variability of both hot and dry summers in Romania, as well as their combined effect (e.g., compound events), and (ii) to determine the large-scale circulation patterns which trigger the occurrence of hot summers over the analyzed region, by analyzing the geopotential height conditions and the frequency of atmospheric blocking during the periods characterized by a high frequency of hot days. Our study extends over the period 1951–2020, making it the most extensive study, from a temporal point of view, over Romania. The paper is structured as follows: in Sect. 2 we give a detailed description of the data and methods used in this study, in Sect. 3 we show the main results of our analysis, and in Sect. 4 the main conclusions are presented.
Globally, heat waves are recognized either by utilizing a threshold-based methodology (Perkins and Alexander, 2013) or by using the exceedance of a fixed absolute value (e.g., daily maximum temperature > 30 ∘C) (Robinson, 2001). In general, the method based on fixed thresholds takes into account periods of consecutive days when the daily maximum temperature (Tx) is above a certain percentile for a particular calendar day. In this study, we have used the 90th percentile, based on a 15 d window centered on each calendar day (Perkins and Alexander, 2013). For the duration, we have tested different lengths of 3, 4, 5, and 6 consecutive days (not shown), and for the current analysis we have chosen a period of 5 d. This threshold has been chosen in such a way to ensure enough heat wave events to be considered but also to remove small events. This is also a threshold which is recommended by the Expert Team on Climate Change Detection and Indices (ETCCDI). The mean daily 90th percentile was calculated over the baseline period 1971–2000. The daily maximum temperature used in this study was extracted from the E-OBSv23.1e dataset (Cornes et al., 2018). Here, the heat wave duration index (HWDI) is defined as the number of days per month and per season when the aforementioned criteria were satisfied, while the number of heat waves (HWs) is defined as the number of heat waves per month and per season. The temporal evolution of the HWDI for each summer month (i.e., June, July, and August) as well as for the whole summer season (JJA), for all considered lengths (i.e., 3, 4, 5 and 6 d, not shown), indicates a strong interannual variability and relatively significant decadal differences. As expected, the smaller the length of the threshold, the longer the heat wave. Globally, different duration thresholds have been employed, depending on the analyzed regions. For example, in Canada, a duration threshold ≥ 2 d has been used (Smoyer-Tomic et al., 2003), in Hungary and France a duration threshold ≥ 3 d has been considered (Rey et al., 2007), and in China and Ukraine a duration threshold ≥ 5 d has been used (Chen and Li, 2017; Shevchenko et al., 2014). In the eastern part of Europe (e.g., Bulgaria), a duration threshold ≥ 3 d has been found useful (Gocheva et al., 2006). Since Romania is situated in the eastern part of Europe, where a threshold ≥ 5 or 6 d has been tested and because we want to analyze only extreme heat waves in this study, the rest of the analysis is focused on a threshold ≥ 5 d.
The hydroclimatic conditions are defined by considering the 1-, 3-, and 6-month standardized precipitation evapotranspiration index (SPEI) (Vicente-Serrano et al., 2010). For this analysis, we used the June, July, and August SPEI1 and the August SPEI3, which integrates the drought conditions over the summer months (i.e., June–July–August). The SPEI was computed based on the precipitation (PP) and the potential evapotranspiration (PET) data extracted from the E-OBS v23.0e dataset, with a spatial resolution of 0.1∘ × 0.1∘ and a temporal resolution covering the period 1950–2020. The computation of SPEI is based on the probability distribution of the difference between PP and PET (PP–PET), and the data are normalized into a log-logistic probability distribution. The potential evapotranspiration data were computed by employing the Penman–Monteith equation (Vanderlinden et al., 2008). The advantage of using SPEI is that it is standardized on a given period and a predefined distribution. Therefore, each SPEI value corresponds to a predefined probability. Here, we choose the threshold of −1, meaning that all occurrences of SPEI below the threshold would be considered drought. This threshold generally corresponds to a moderate to extreme drought event. Taking into account our definition of HW and drought, a compound hot and dry (CHD) event is defined as a combined index when a heat wave episode occurs during a period of drought conditions (e.g., August SPEI3 ). This definition has also been used successfully for other regions (Geirinhas et al., 2021; Ionita et al., 2021a; Russo et al., 2019).
To analyze the large-scale driving mechanism of heat waves, we use the daily temperature at 850 mb (TT850), the daily geopotential height at 500 mb (Z500), the vertical integral of eastward and northward water vapor flux, and the daily zonal and meridional wind at 500 mb. These datasets have been extracted from the ERA5 reanalysis project (Hersbach et al., 2020) and have a spatial resolution of 0.25∘ × 0.25∘, covering the 1950–2020 period. We also used a two-dimensional (2D) atmospheric blocking index defined by Scherrer et al. (2006). To compute the 2D blocking index, we have used the daily geopotential height at 500 mb (Z500) obtained from the ERA5 reanalysis project for the period 1950–2020. The 2D blocking index is an extension of the one-dimensional (1D) Tibaldi–Molteni (TM) index (Tibaldi and Molteni, 1990) to a two-dimensional map of blocking frequencies at every grid point. The southern geopotential height gradient (GHGS) and the northern geopotential height gradient (GHGN) for each grid point are evaluated as follows:
where ϕ0 is the latitude of the considered grid point varying from 35 to 75∘ N. For each month we have calculated the ratio between the number of days when a certain grid point was blocked; i.e., the conditions GHGS > 0 and GHGN < (−10 m per degree latitude) are simultaneously satisfied for at least 5 consecutive days.
The extremeness of the July 2012, August 2015, and June 2019 heat waves was analyzed by employing the ranking map methodology (Bakke et al., 2020; Ionita et al., 2017). In this respect, we have computed the TX90 for the 70-year period (1951–2020), and for each analyzed month (i.e., June, July, and August), and the years were ordered from the most extreme (highest temperature) to the least extreme value. A rank of 1 implies record-breaking high temperature (in the case of TX90), a rank of 2 indicates that the respective month had the second most extreme value, etc.
The physical mechanism behind the occurrence of heat waves was identified by computing composite maps instead of the correlation maps, in order to avoid nonlinearities in the analyzed data. The composite maps were constructed for years when the total area affected by a HW was higher than 20 % at the country level. We selected this threshold to capture the strength of the climate anomalies associated with monthly HW conditions and the number of maps satisfying this criterion. The performed analysis has shown that the results are not sensitive to the exact threshold value used for our composite analysis (not shown). The significance of the composite maps is based on a standard t test (confidence level 95 %). To test the spatial–temporal stability of the relationship between the HWDI and the large-scale atmospheric circulation, we also make use of stability maps, a methodology successfully applied in the seasonal forecast of European rivers and Arctic sea ice (Ionita et al., 2008, 2019). In order to detect stable predictors, the variability of the correlation between the HWDI time series and the gridded data is investigated within a 31-year moving window over the period 1950–2020. The correlation is considered stable for those regions where the HWDI index and the gridded data (i.e., Z500) are significantly correlated at the 95 %, 90 %, 85 %, or 80 % level for more than 80 % of the 31-year moving windows. A detailed description of this methodology is given in the aforementioned papers.
The trend analysis was performed by using the Mann–Kendall test (Mann, 1945). The Mann–Kendall test has been intensively used to identify the trend in the hydrometeorological time series (Adamowski et al., 2009; Dang et al., 2020, and the references therein). In order to identify trends of auto-correlated climatic time series, we used a modified version of the Mann–Kendall test performed (Hamed and Ramachandra Rao, 1998). In the new version of the test, the significance of a trend is determined by the Z statistic that has a normal distribution with a mean of 0 and variance of 1. A positive Z value indicates an increasing trend, whereas a negative Z value shows a decreasing trend in the time series. The non-parametric Sen slope method (Sen, 1968) was used to evaluate the magnitude of the trends.
3.1 Summer heat waves in Romania: variability and trends
The heat wave duration index (HWDI) averaged at the country level and the fraction of the country affected by a heat wave (AREA) are shown in Fig. 2. This figure reveals that there is strong interannual and decadal variability throughout all summer months (Fig. 2 – left column). For June, there is a statistically significant increase in both HWDI (Fig. 2a and Table S1) and AREA (Fig. 2b), with a much higher frequency of both after the beginning of the 1990s. The longest heat wave was recorded in June 2019 and lasted 10 d, and more than 90 % of the country was affected. Until the beginning of the 1990s there were relatively few HWs, most of them observed between 1960 and 1970, but their duration was much shorter compared to the events recorded from 2000 onwards. Also, in terms of the affected area, after the 1990s most of the heat waves had a larger spatial extent, with an area covered by a HW of more than 80 % in 1996, 2002, 2003, 2010, 2012, and 2019, respectively.
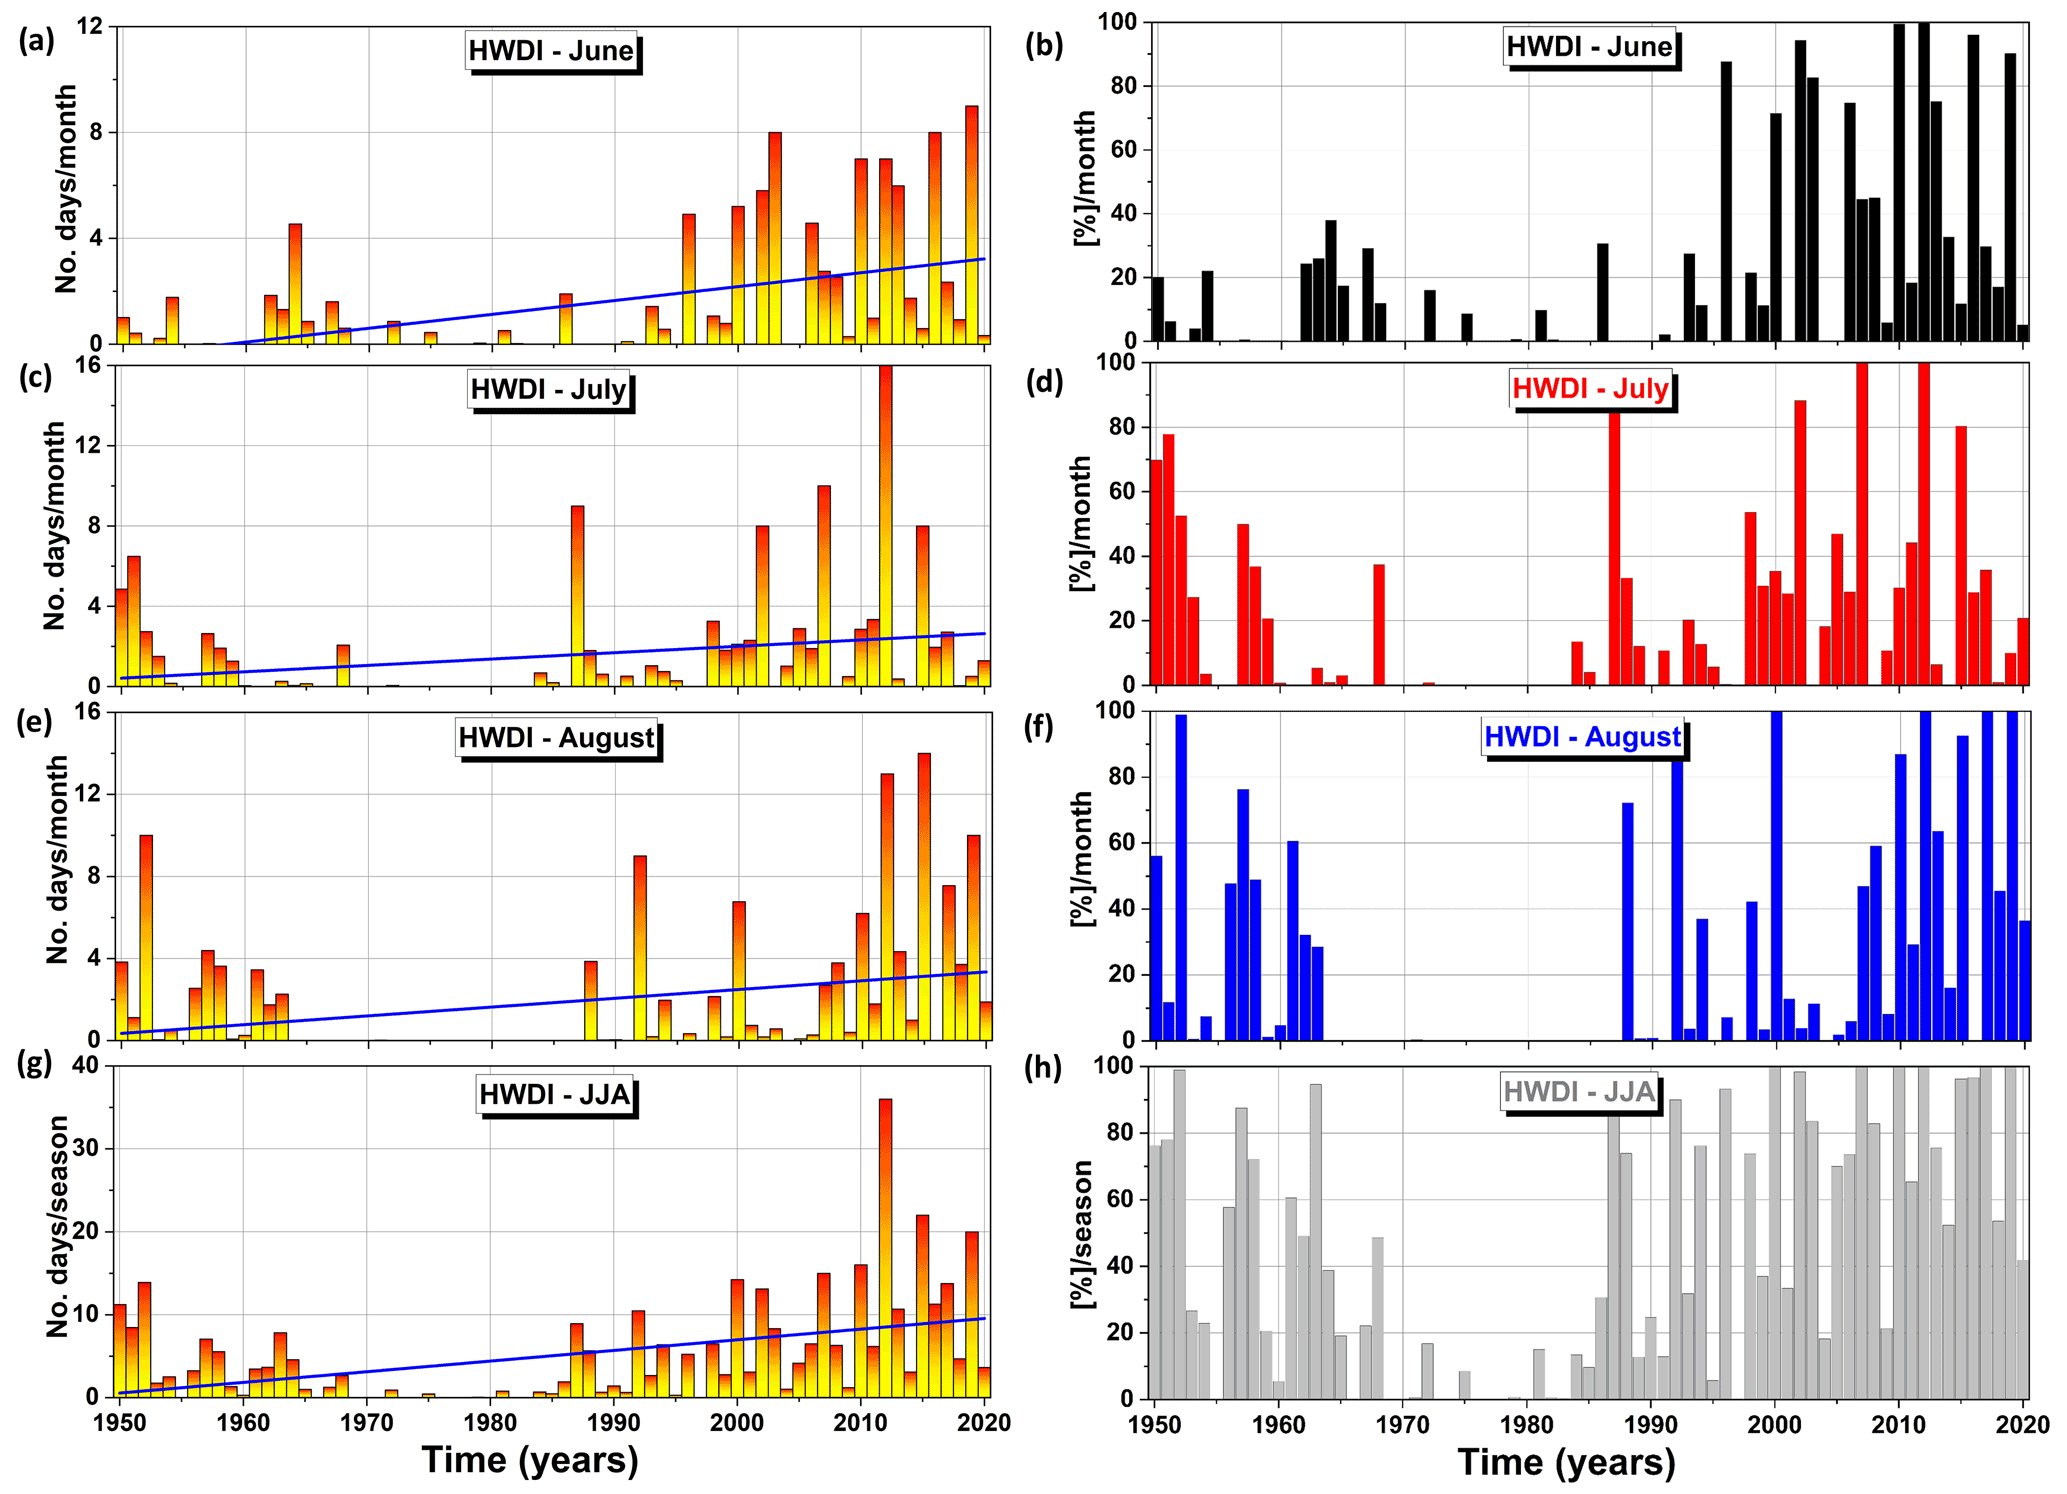
Figure 2Monthly and seasonal temporal evolution of the summer heat wave duration (HWDI) averaged at the country level (left column) and the temporal evolution of the percentage area (AREA) affected by heat waves (right column) over the period 1950–2020: (a) June HWDI, (b) June AREA, (c) July HWDI, (d) July AREA, (e) August HWDI, (f) August AREA, (g) summer (JJA) HWDI, and (h) summer (JJA) AREA. The blue line indicates the linear trend.
As in the case of June, for July we also observe a statistically significant increase in both the HWDI (Fig. 2c and Table S1) and the AREA (Fig. 2d). At the beginning of the analyzed period (i.e., 1950–1960), there were heat wave events lasting on average 4–5 d (when averaged at the country level) and covering an area up to 80 %. Between 1970 and 1985 no HWs were recorded throughout the country. After 1985 there is a steep increase in the duration of the HWs, with the longest HWs in July 2007 and 2012, when the whole country was affected (i.e., AREA = 100 %). The years 1987, 2002, 2007, 2012, and 2015 have been characterized by HWs with a spatial coverage of more than 80 % (Fig. 2d). For August, the temporal evolution of HWDI (Fig. 2e) and AREA (Fig. 2f) follows the same path as June and July, meaning a significantly increasing trend in both the duration and AREA (Table S1). Over the period 1964–1988 no HWs were recorded in August, while most of the longest and extended HWs were recorded in the last 2 decades of the analyzed period. The longest HW recorded in August was in 2015, followed by 2012, 1992, and 1952. In 1992, 2012, and 2015 the area covered by HWs was higher than 90 % (Fig. 2f). For all analyzed months, the HWs recorded in the last 2 decades were both longer and had a higher spatial extent. If we analyzed all the summer months taken together (JJA), we have a very clear picture (Fig. 2g and h): the period 1950–1970 was characterized by the occurrence of HWs with a duration varying between 3 and 10 d, averaged at the country level, and a spatial extent between 20 % and 80 %, followed by a relatively HW-free period between 1971 and 1985. After this period there was a significant increase in the duration of the HWs, and most of them reached a spatial extent of more than 50 %, especially over the last 2 decades (i.e., 2001–2020).
Since the number of HWs per year is small, especially in the first half of the analyzed period (i.e., 1951–1985), we have aggregated the number of heat waves in decades, to be able to analyze the spatiotemporal changes in their occurrence. We have performed the decadal analysis for each summer month separately (Figs. S1, S2, and S3) and for the whole summer season (JJA) as a whole (Fig. 3). We focused our analysis in this way, to have an equal number of months per decade and also to provide decadal evolution of HW hotspots at the country level. The first analyzed decade is 1951–1960, followed by 1961–1970, and so on until 2011–2020. Figure 3 shows the geographical distribution of the number of HWs per decade summed over the summer months. Overall, there is an increased variability among different regions of the country depending on the analyzed decades. Over the decade 1951–1960 up to 24 HWs per decade were recorded in the southeastern part of the country (i.e., the Dobruja region), while in the northwest part of the country up to 10 HWs per decade were recorded (Fig. 3a). Over the decade 1961–1970, up to eight HWs per decade were recorded mainly in the intra-Carpathian region (i.e., the northwest part of the country) (Fig. 3b). The decade 1971–1980 was almost HW free (Fig. 3c), while for the decade 1981–1990 there were fewer than two HWs per decade at the country level (Fig. 3d). Starting with the decade 1991–2000, the number of summer HWs started to increase all over the country (Fig. 3e). During the 2001–2010 decade, the HW hotspots developed in the western part of the country and the Dobruja region (i.e., southeastern part of the country) (Fig. 3f). Over the decade 2011–2020, there were up to 24 HWs per decade, the most affected areas being the northwest, inside the Carpathian Mountains, and the southeastern part of the country (Fig. 3g). Overall, there were up to 6 times more HWs in the last decade compared to the HWs at the beginning of the analyzed period.
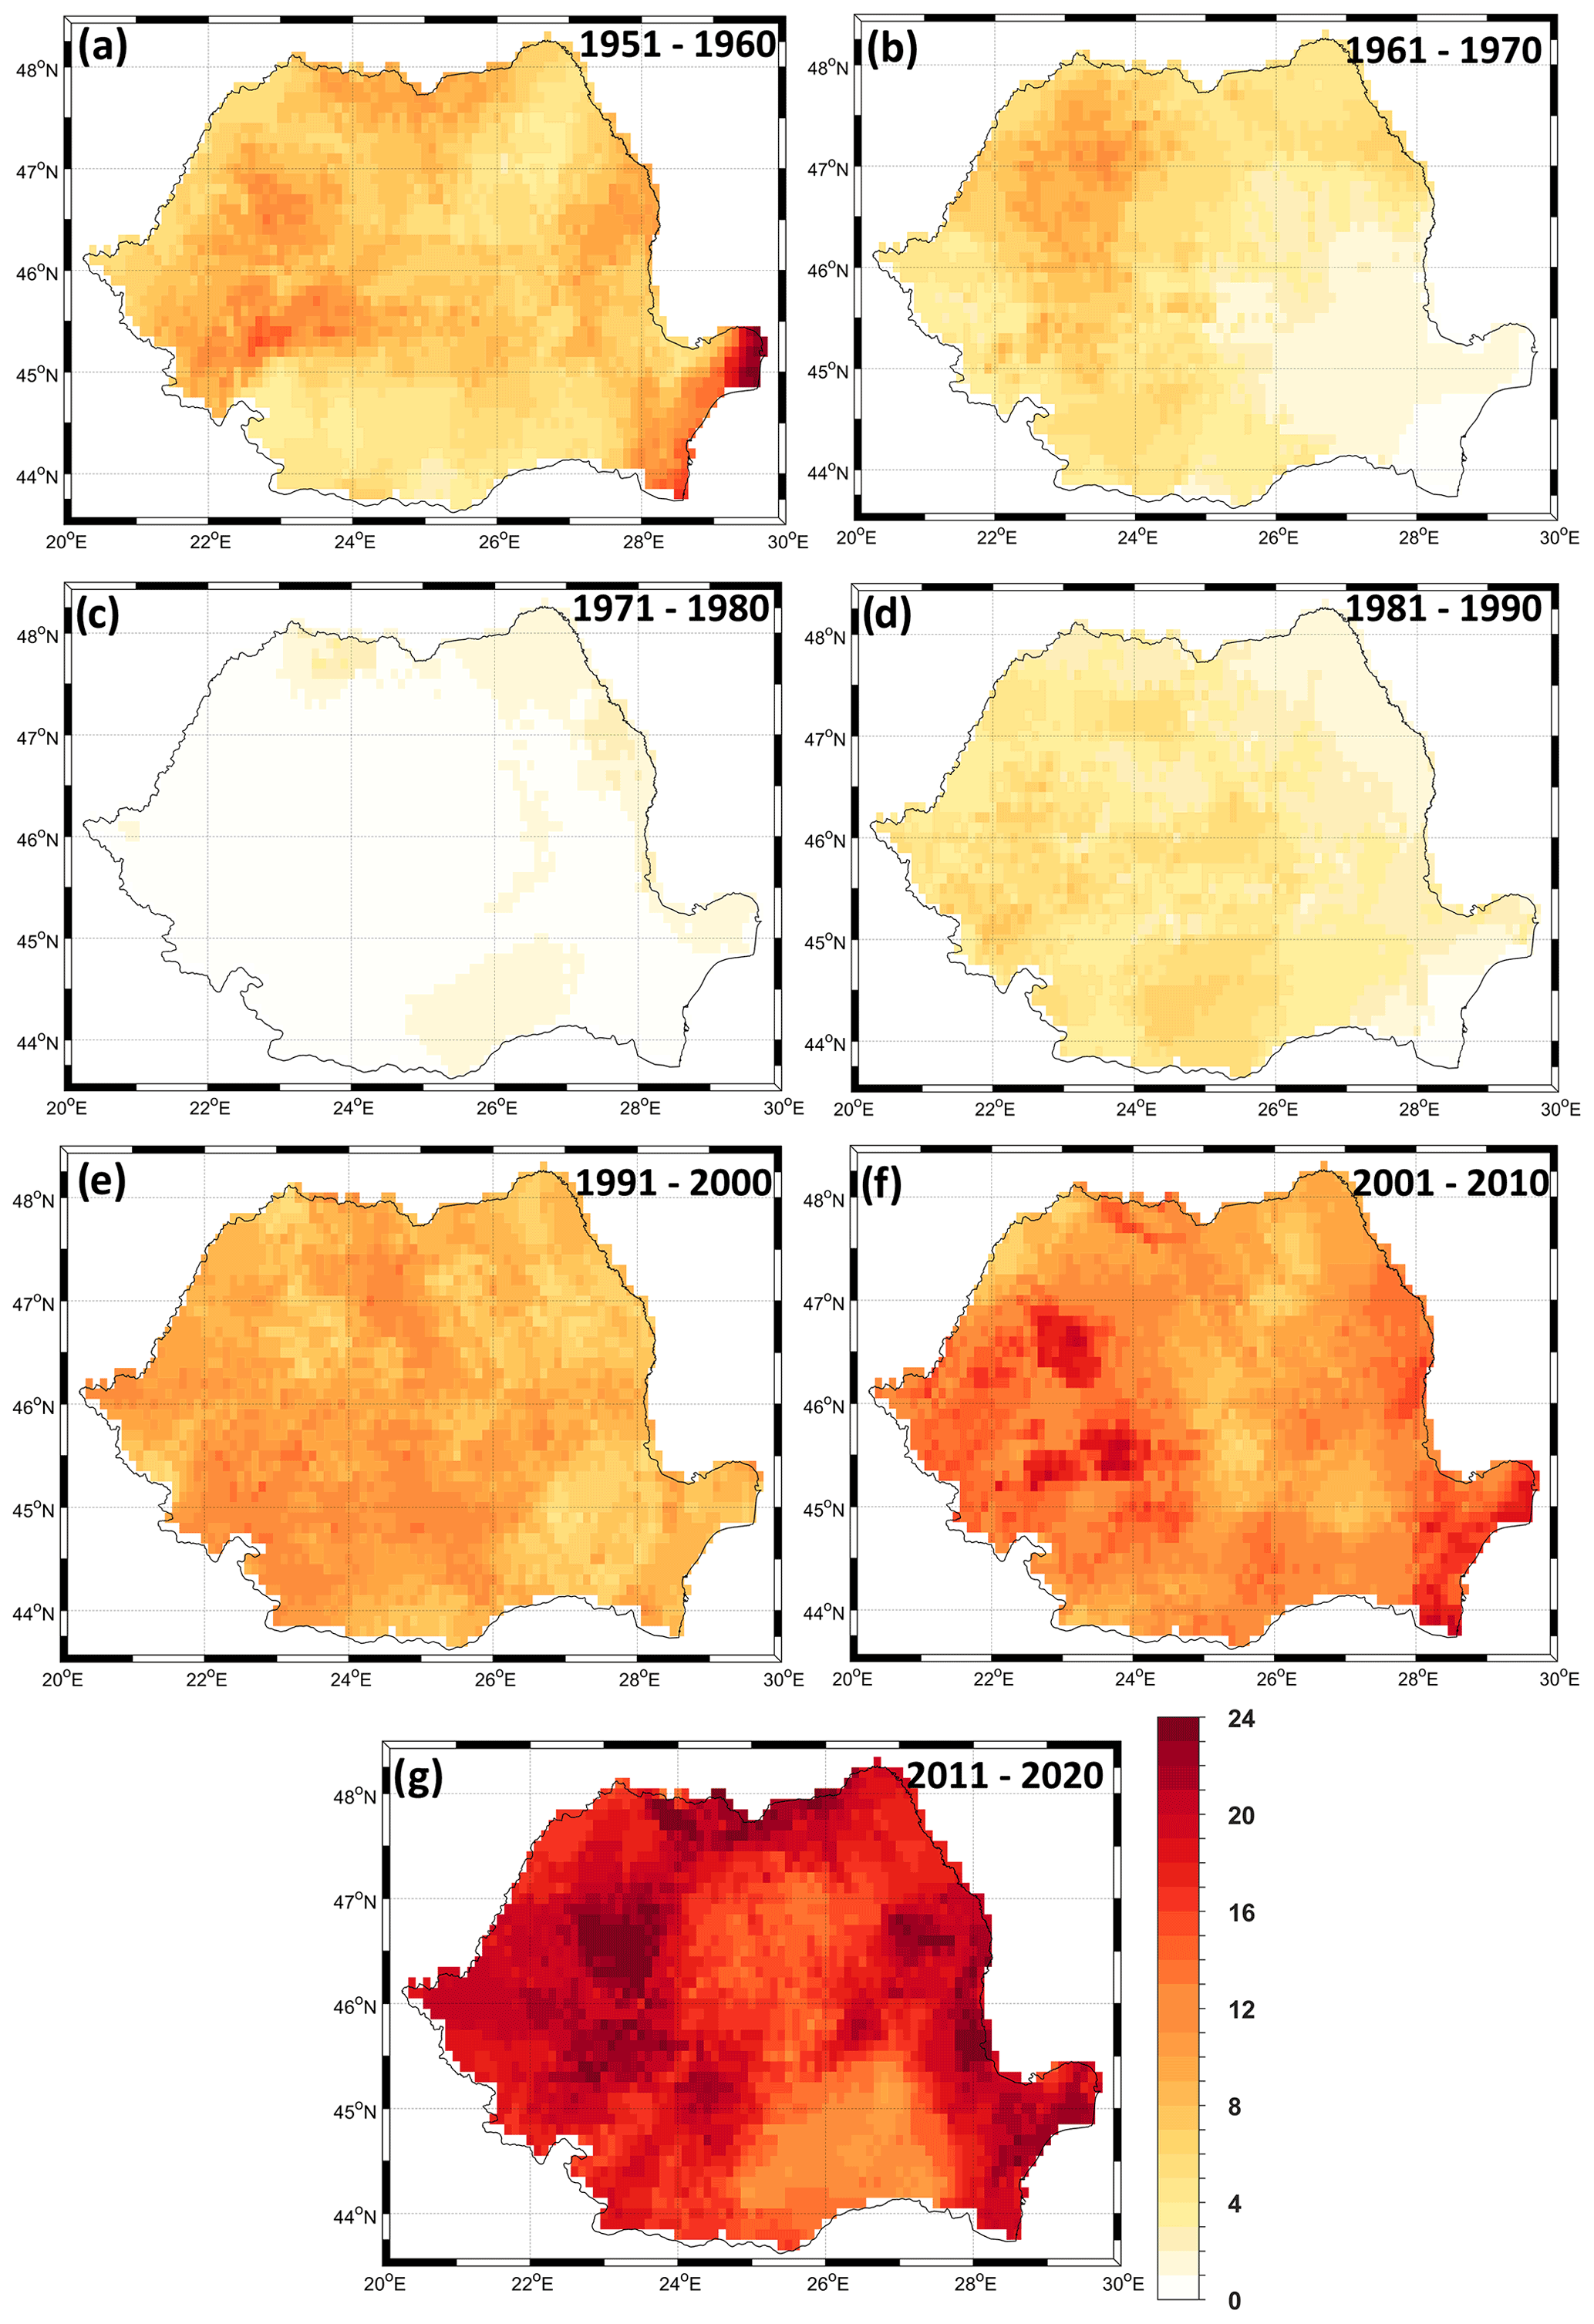
Figure 3Decadal frequency of the number of summer heat waves (HWs) per decade over the last 70 years: (a) 1951–1960, (b) 1961–1970, (c) 1971–1980, (d) 1981–1990, (e) 1991–2000, (f) 2001–2010, and (g) 2011–2020. Number of HWs per decade is given.
When looking at the decadal distribution of HWs hotspots for each summer month separately, there are some clear differences, especially at the beginning of the analyzed period (Figs. S1, S2, and S3). Over the decade 1951–1960, there were up to five HWs per decade in July (Fig. S2a) and August (Fig. S3a), focused in the northwestern part of the country and the most southeastern corner of the country. In June, a limited number of HWs have been recorded in this decade (about two HWs per decade) over the eastern part of the country (Fig. S1a). The decade 1961–1970 was characterized by up to four HWs per decade in June, over the north and northwestern part of the country (Fig. S1b), while in July (Fig. S2b) and August (Fig. S3b) one HW per decade was recorded in the western part of the country. The decade 1971–1980 was HW free in July (Fig. S2c) and August (Fig. S3c), while in June there was about one HW per decade over a small part of the country (Fig. S1c). The decade 1981–1990 was characterized by up to two HWs per decade, at the country level, in July (Fig. S2d) and August (Fig. S3d). Starting with the 1991–2000 decade, the number of HWs per decade starts to increase at the country level, the most affected months being June (Fig. S1e–g) and August (Fig. S3e–g). Over the decade 2001–2010 there were up to seven HWs per decade recorded in the south and southeastern part of the country in June (Fig. S1f), up to six HWs per decade in the western part of the country and the Dobruja region in July (Fig. S2f), and up to 10 HWs per decade in August, with a focus on the Dobruja region (Fig. S3f). For the last decade (i.e., 2011–2020) the number of HWs per decade increased in all months, but their spatial distribution differs. In June (Fig. S1g), the highest number of HWs per decade was recorded over the northwestern part of the country (up to 10 HWs per decade) and over the Dobruja region. In July, the HW hotspots are over the northern and eastern parts of the country (Fig. S2g), while in August there is a homogenous distribution of up to 10 HWs per decade, throughout the country (Fig. S3g).
From the decadal analysis of the number of HWs, we can clearly state that the decade 2011–2020 was characterized by a significant increase in the number of HWs compared to the previous decade, this increase being the strongest in August. There are preferred hotspots for the HW occurrence, depending on the analyzed decade and month, with] these hotspots being strongly influenced by the geographical distribution of the Carpathian Mountains. The most affected regions by the HW occurrence are the north and northwestern part of the country and the Dobruja region. Dobruja is a region which has been subjected to a significant increase in the mean air temperature and a significant decrease in the summer precipitation (Chelcea et al., 2015; Prăvălie et al., 2017). Overall, there is a significant increase, of ∼ 0.2 HWs per decade in June, over most parts of the country, except some small regions in the northeastern part (Fig. 4a). In July a significant increase of ∼ 0.1 HWs per decade can be observed in the northern part of the country, while for the rest of the country no significant changes have been recorded (Fig. 4b). In August, there is a significant increase in the number of HWs over Romania, especially over the eastern part of the country (∼ 0.2 HWs per decade) (Fig. 4c). When we consider all summer months together, the increase in the number of HWs is significant at the country level, with an increase of up to 0.4 HWs per decade in the eastern part of the country (Fig. 4d).
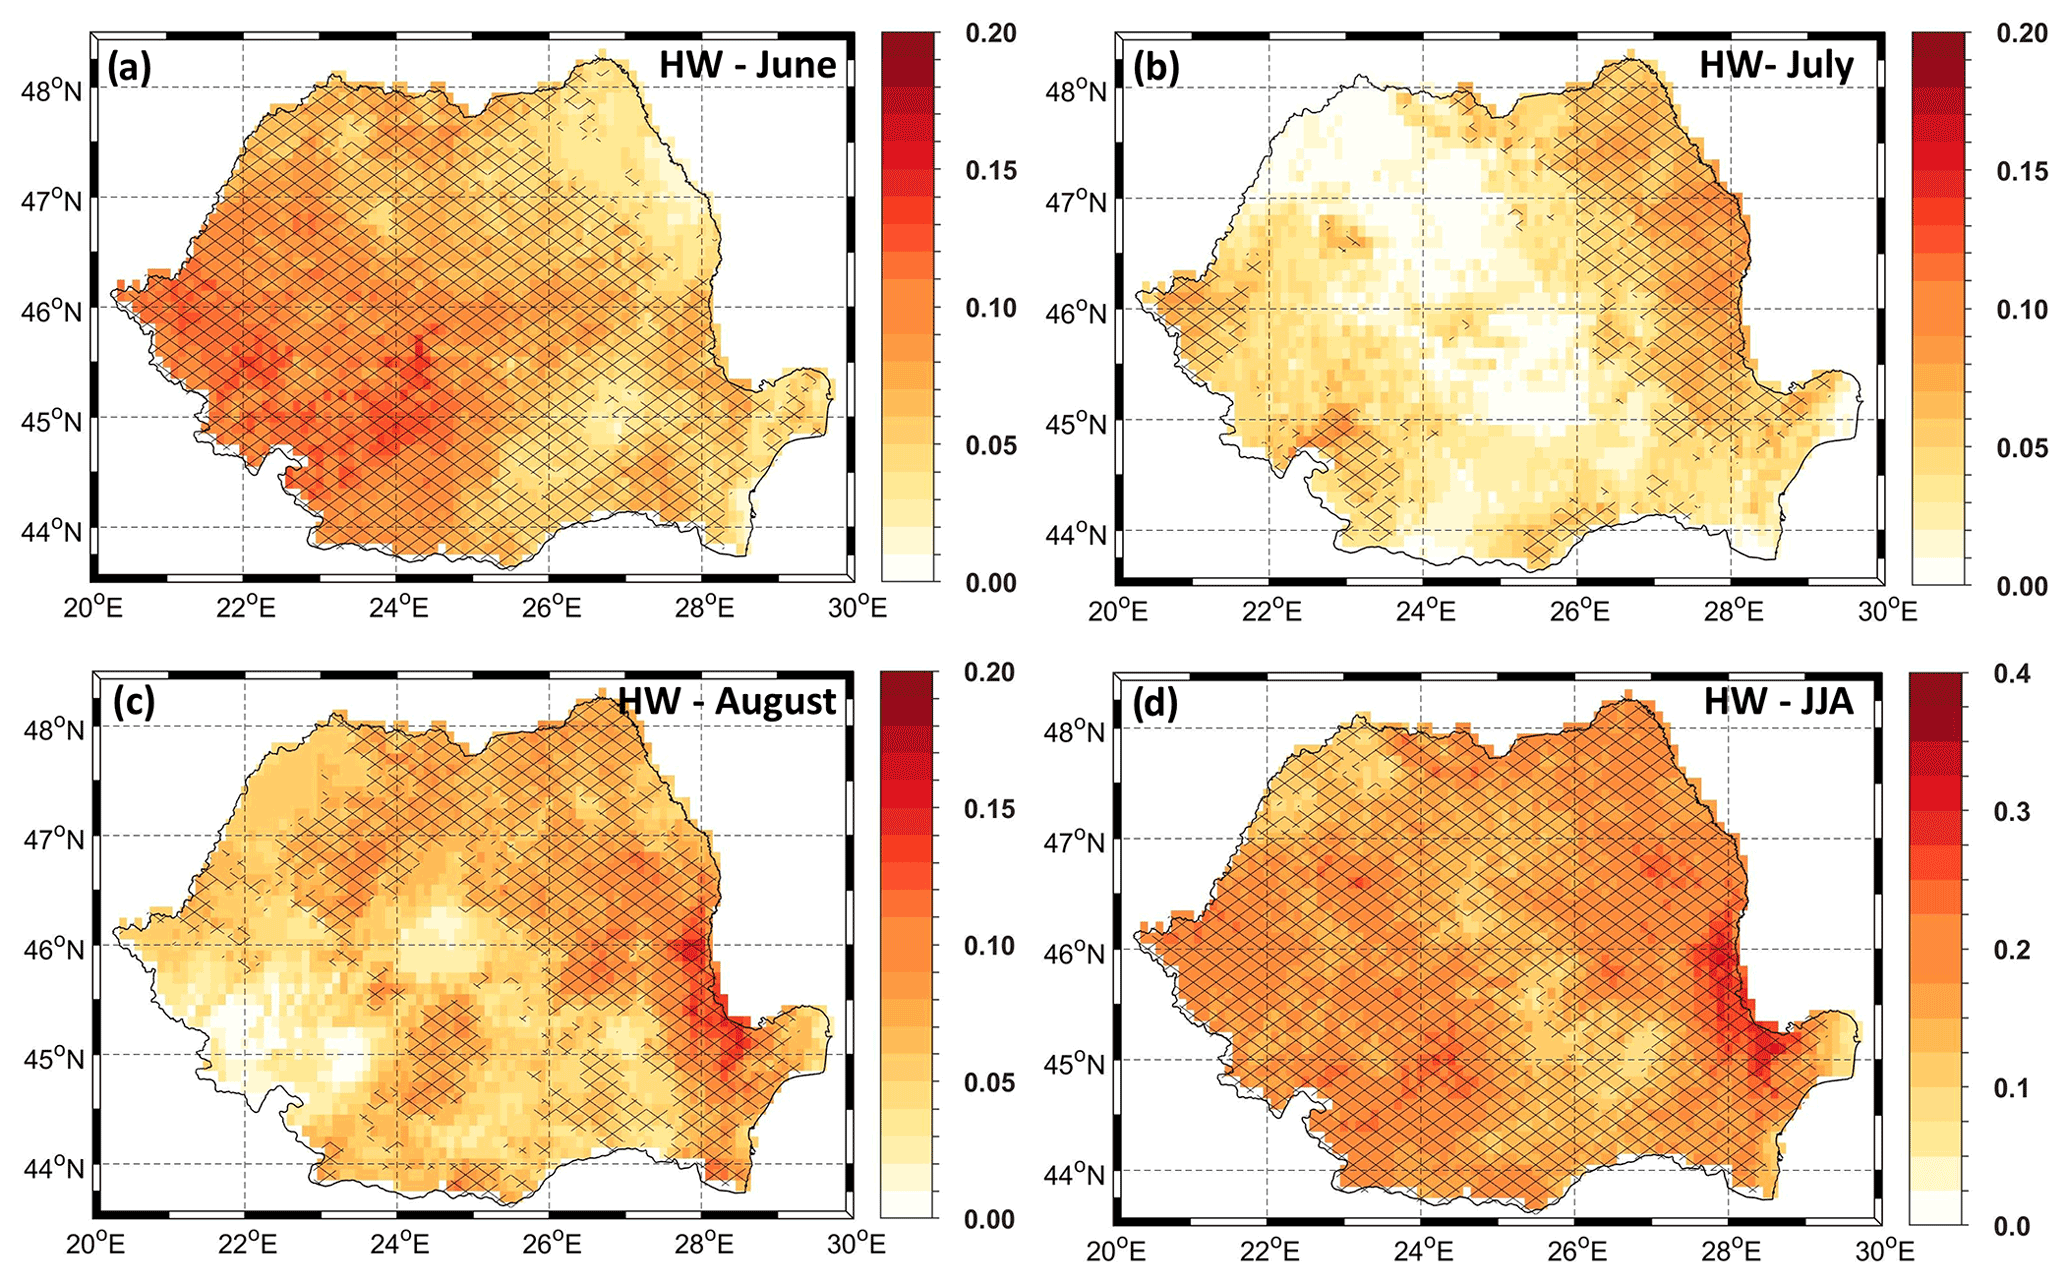
Figure 4Linear trend of the number of heat waves for (a) June, (b) July, (c) August, and (d) JJA. Stippling indicates statistically significant trends. Number of HWs per decade is shown. Analyzed period 1950–2020.
3.2 Summer droughts in Romania: variability and trends
To analyze the variability and trends of drought conditions, at the country level, we performed a similar analysis like in the previous section: we averaged the SPEI at the country level (Fig. 5), we performed the decadal analysis (Fig. 6), and we performed the trend analysis (Fig. 7). The temporal evolution of June SPEI1 (Fig. 5a), July SPEI1 (Fig. 5c), August SPEI1 (Fig. 5e), and August SPEI3 (Fig. 5g) indicates a strong interannual variability of the drought conditions, at the country level and a statistically significant drying trend for August SPEI1. For June, the driest years, in terms of both amplitude (Fig. 5a) and spatial coverage (AREA, Fig. 5b), were 1950, 1968, 2003, 2006, and 2012. For July, the driest years were 1952, 2007, 2012, and 2015 (Fig. 5c). For these years, the drought conditions extended to more than 60 % of the country (Fig. 5d). In August, the driest years, at the country level were recorded in 1952, 1992, 2000, 2003, and 2018 (Fig. 5e), with the drought conditions covering more than 60 % of the country (Fig. 5f). Moreover, in the case of August SPEI1, only negative values were recorded for 13 consecutive years, from 2008 until 2020. August SPEI3, which is an indicator of drought conditions over the whole summer, indicates that the driest summers, over Romania, were 1950, 1952, 2000, 2003, 2012, 2015, and 2018 (Fig. 5g). For all these summers, drought affected more than 70 % of the country (Fig. 5h).
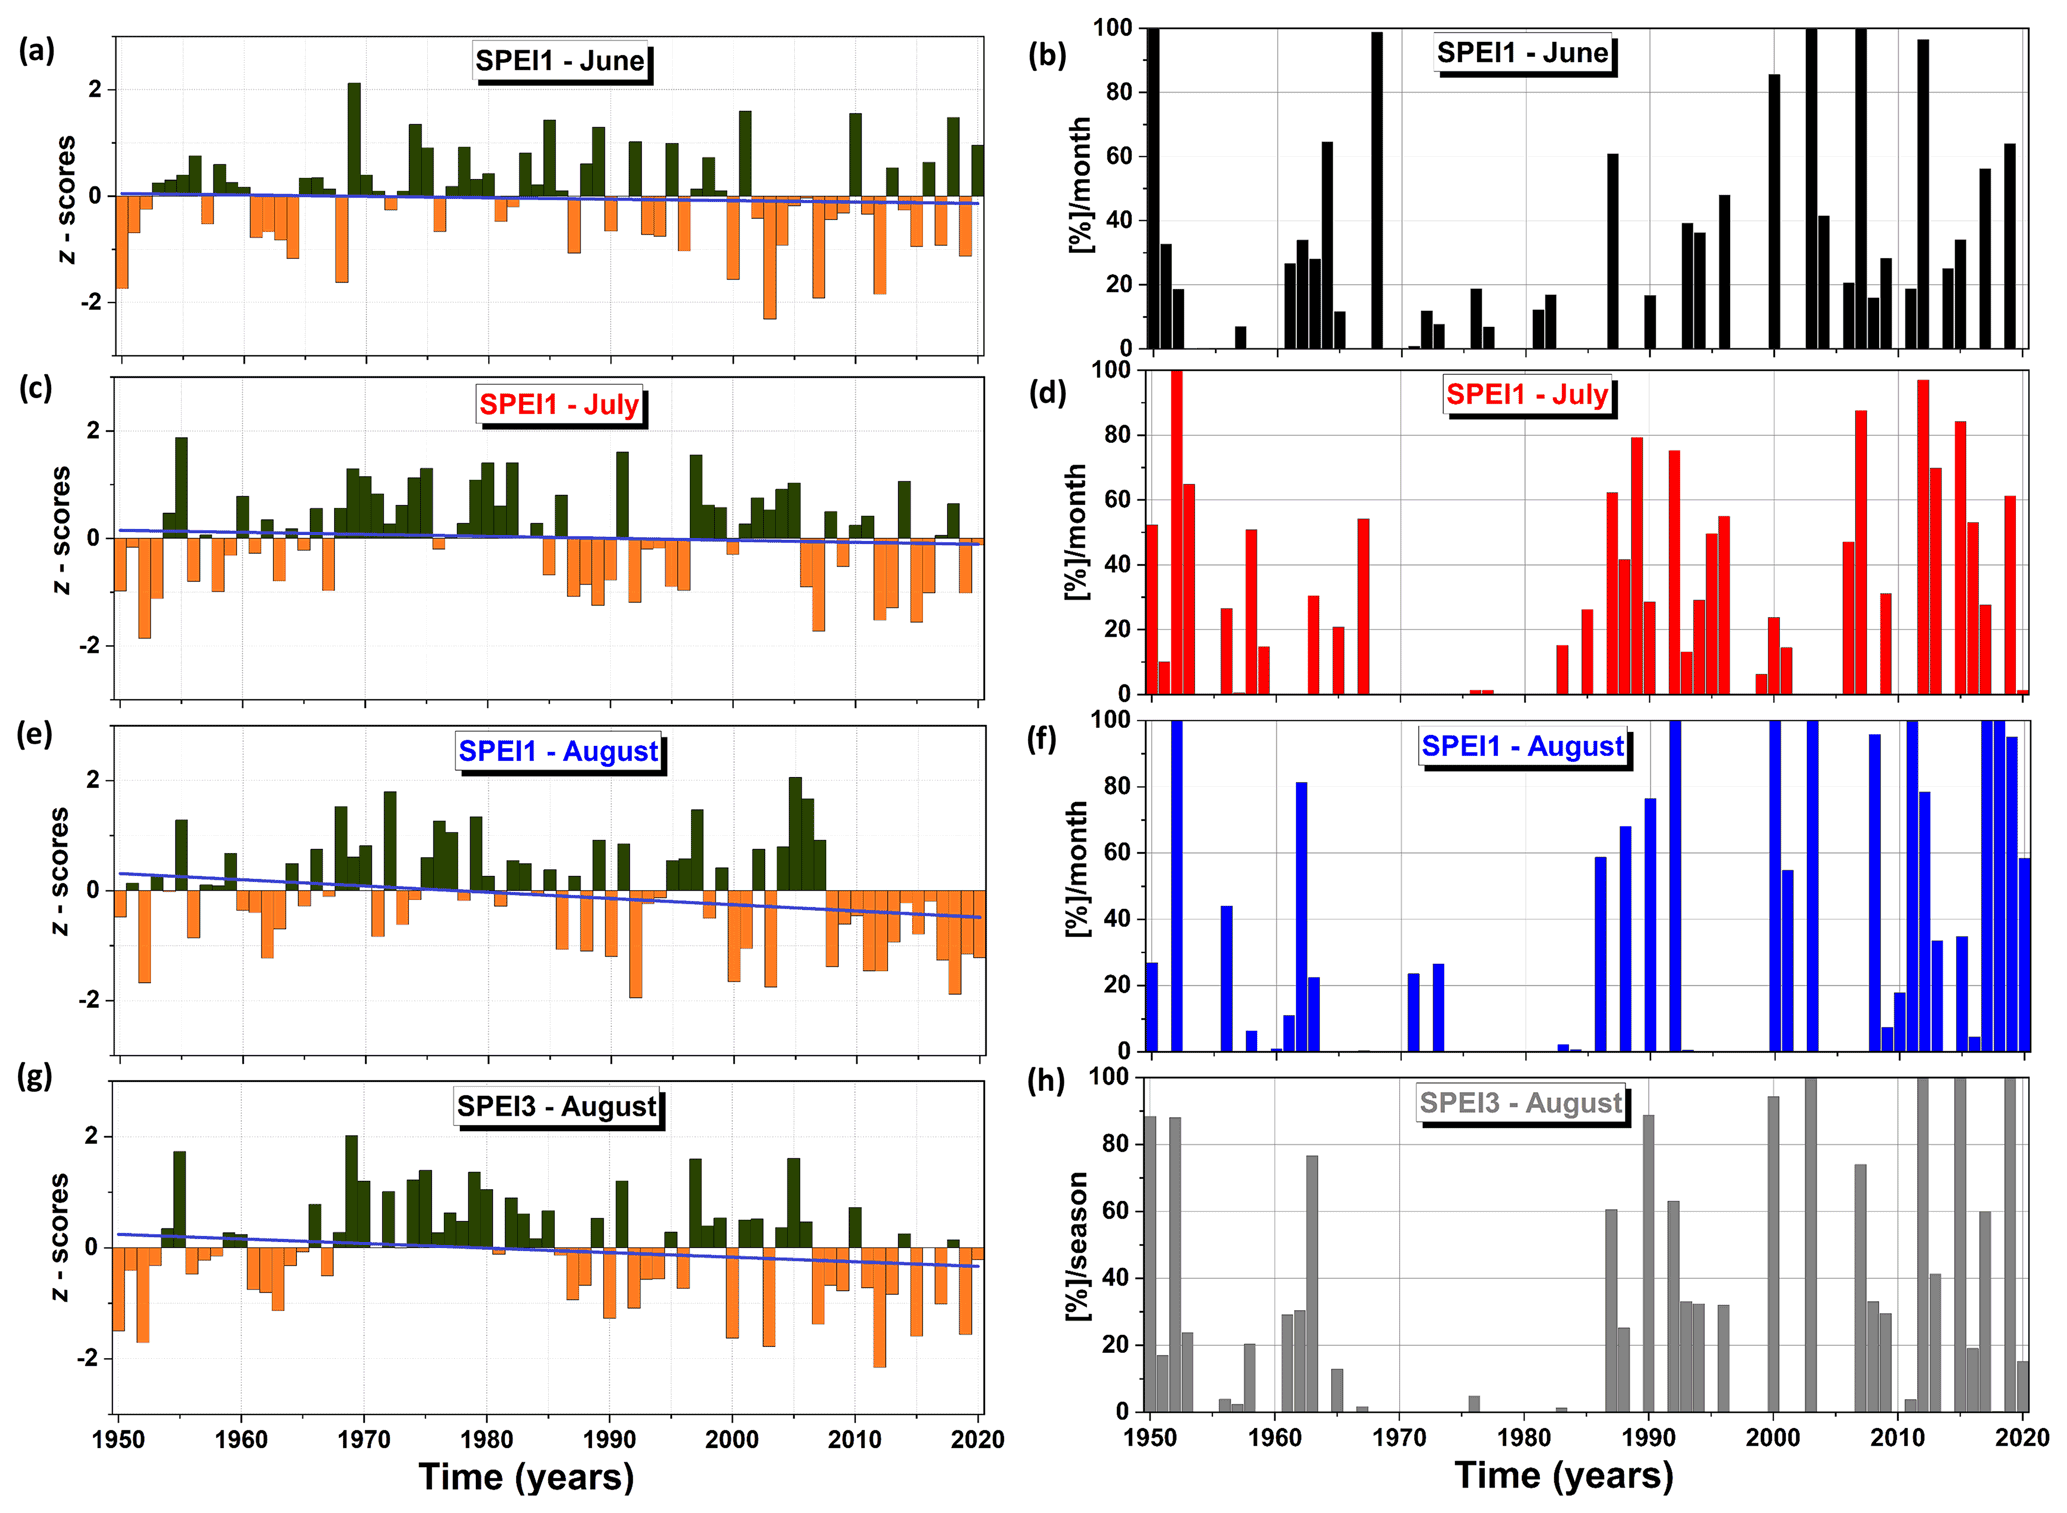
Figure 5Monthly and seasonal temporal evolution of the SPEI averaged at the country level (left column) and the temporal evolution of the percentage area (AREA) affected by drought conditions (SPEI , right column) over the period 1950–2020: (a) June SPEI1, (b) June drought AREA, (c) July SPEI1, (d) July drought AREA, (e) August SPEI1, (f) August drought AREA, (g) August SPEI3 (indicator of dry or wet conditions over the summer seasons), and (h) August SPEI3 drought AREA. The blue line indicates the linear trend.
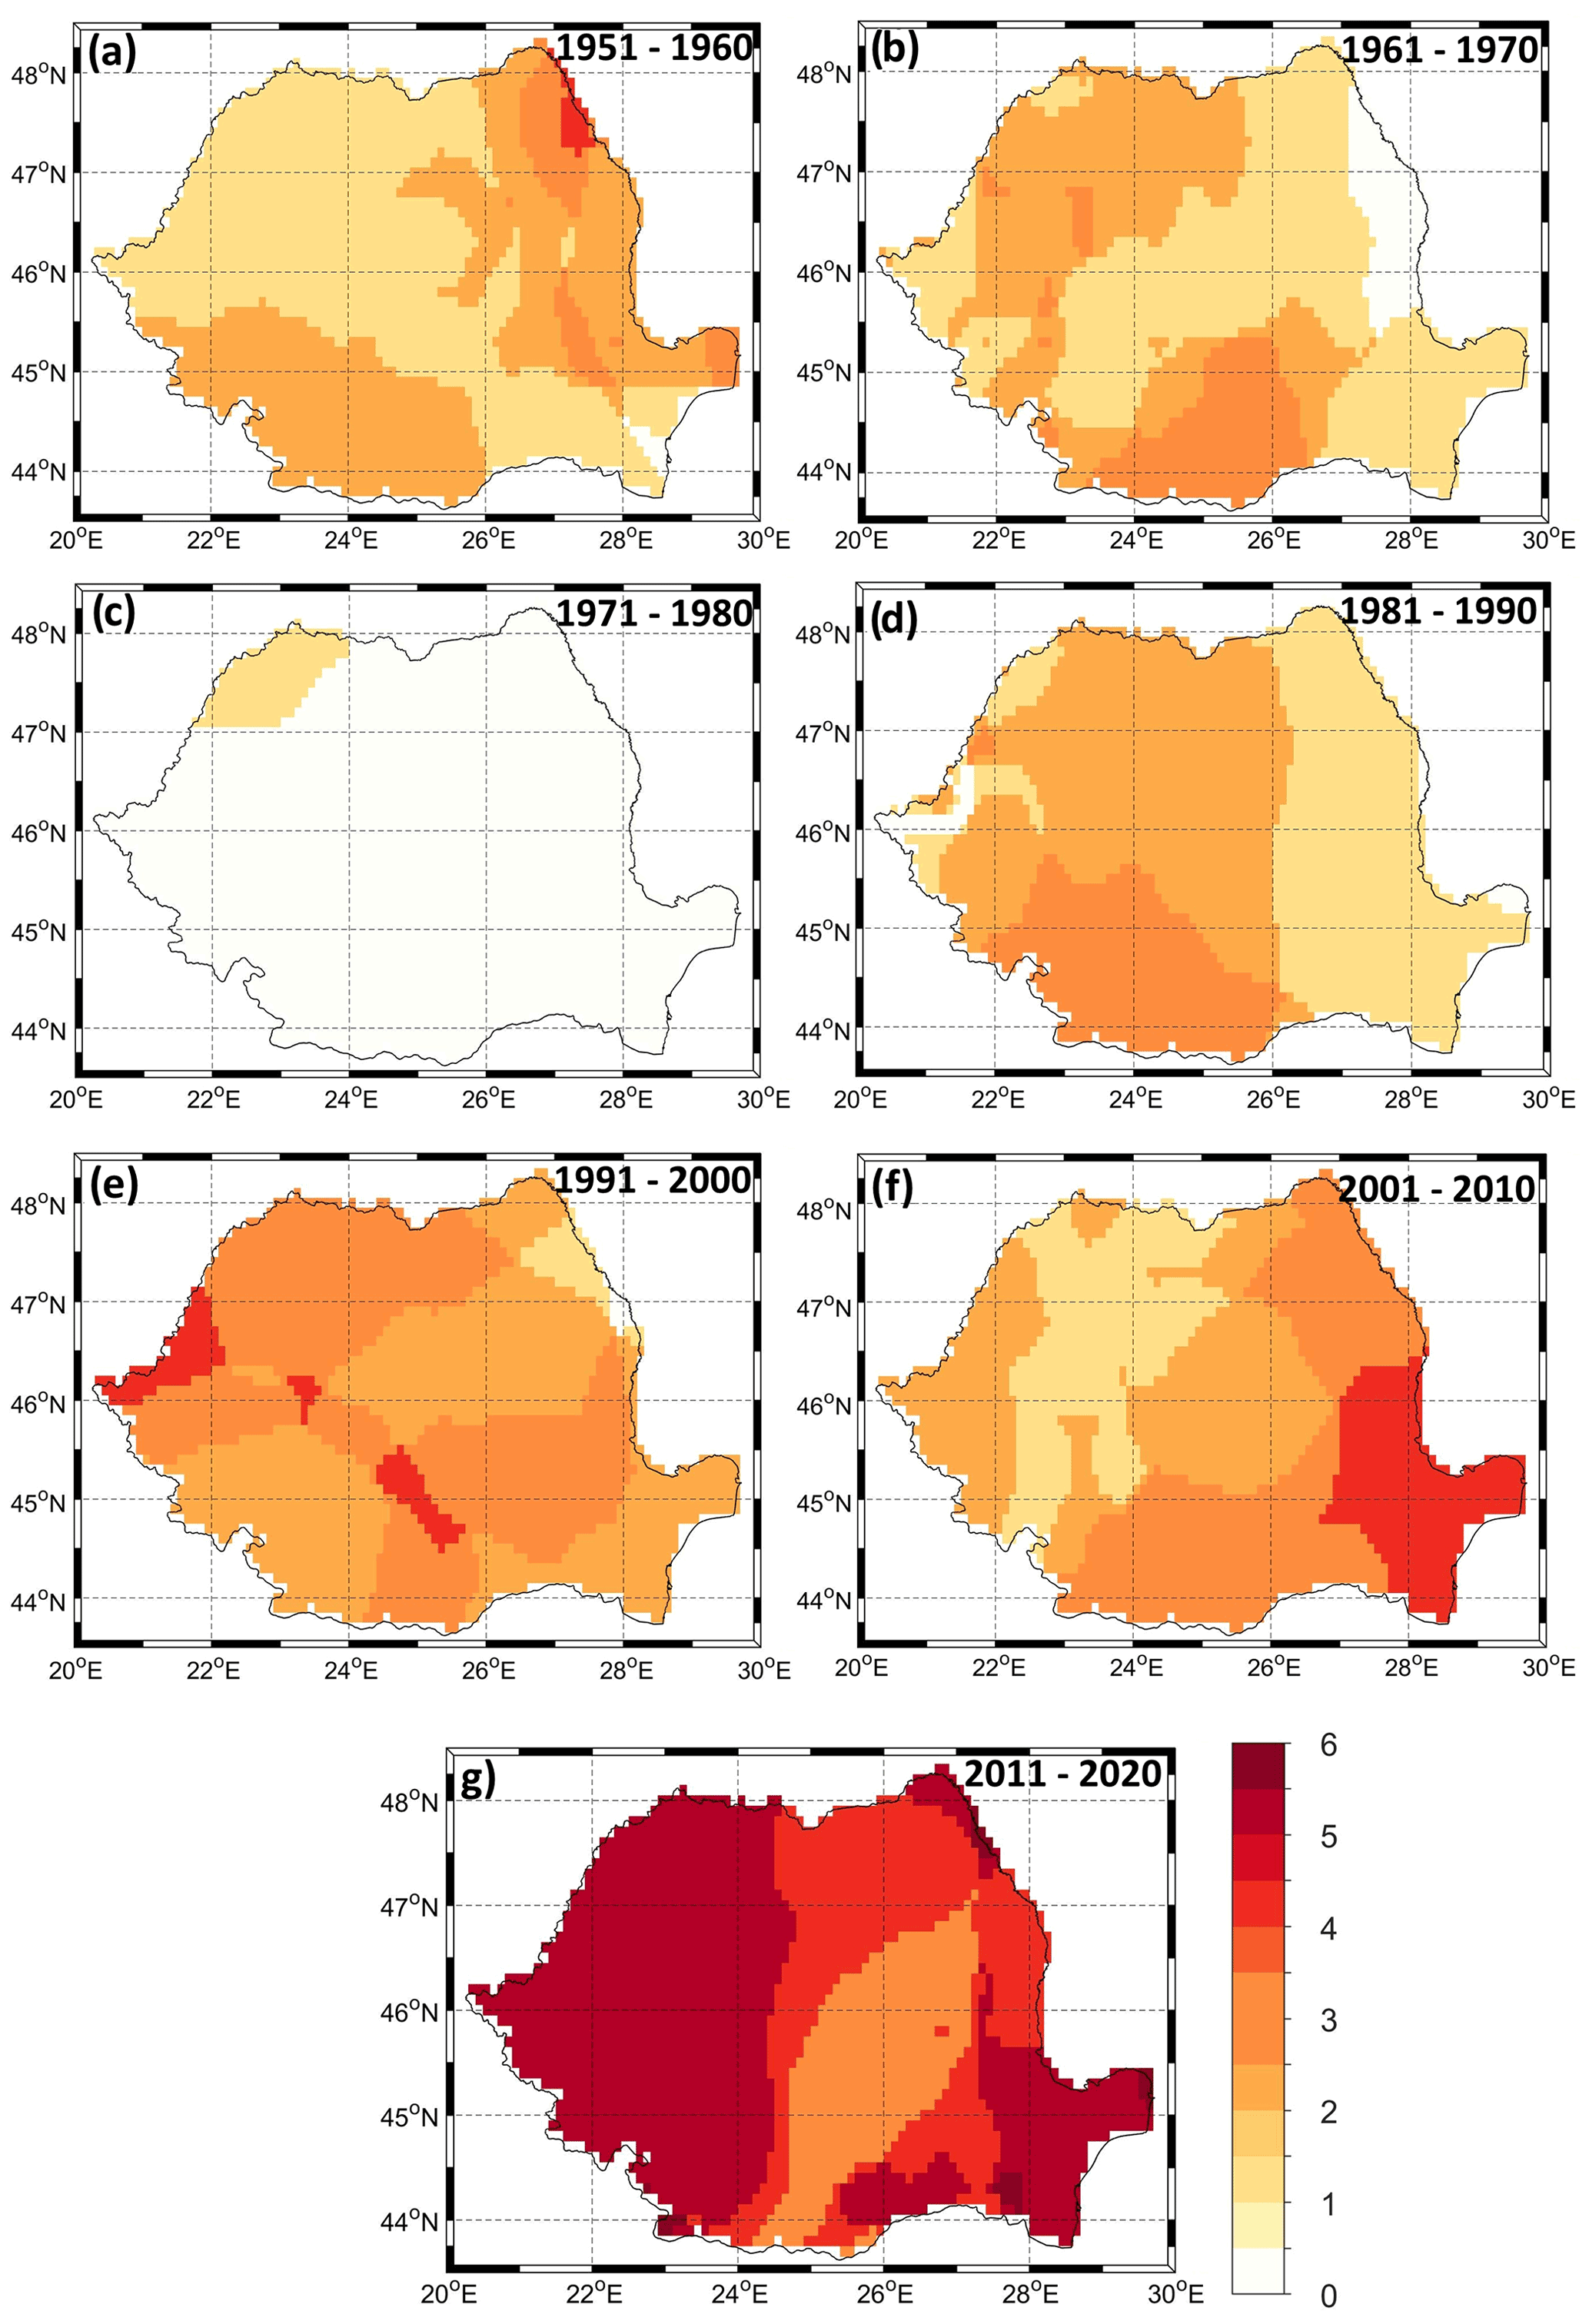
Figure 6Decadal frequency of August SPEI3 over the last 70 years for the cases when August SPEI3 : (a) 1951–1960, (b) 1961–1970, (c) 1971–1980, (d) 1981–1990, (e) 1991–2000, (f) 2001–2010, and (g) 2011–2020. Number of dry summers per decade is shown.
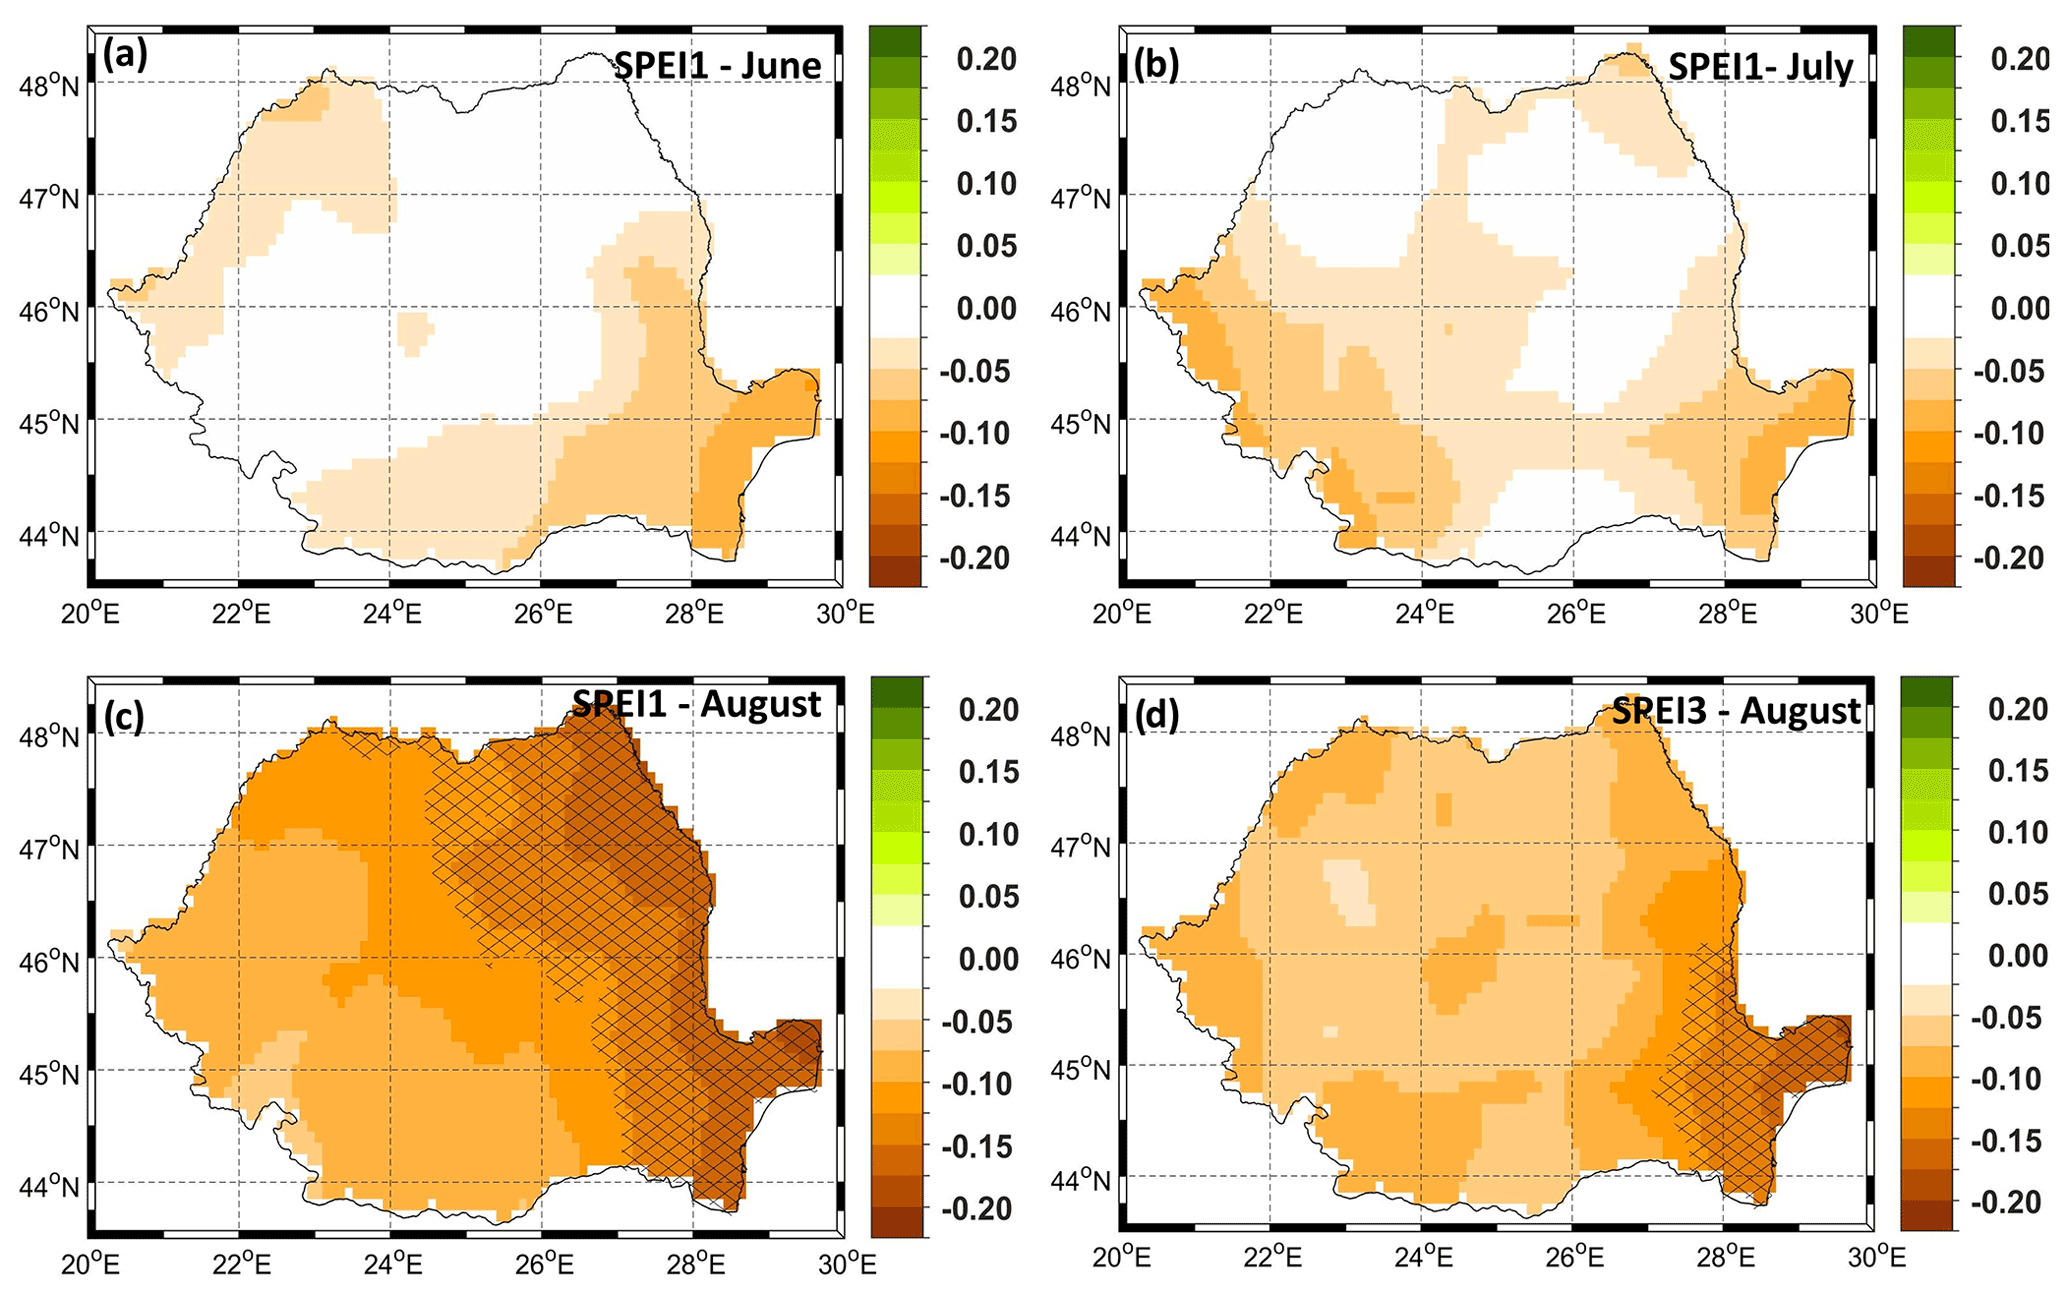
Figure 7Linear trend of (a) June SPEI1, (b) July SPEI1, (c) August SPEI1, and (d) the August SPEI3. Stippling indicates statistically significant trends. Number of z scores per decade is shown. Analyzed period 1950–2020.
The drought hotspots, at a decadal scale (Fig. 6), indicate strong spatiotemporal variability between the different analyzed decades and between different regions of the country. Over the 1951–1960 decade (Fig. 6a), the drought hotspots (defined as the number of months per decade when August SPEI3 for each grid point) was focused in the northeastern part of the country. For this period, there were up to three summers per decade characterized by drought conditions over these regions. For the decade 1961–1970 (Fig. 6b) there was a relatively limited number of dry summers (about two dry summers per decade) throughout the country, mostly focused on the northwestern part and south part of the country, while the decade 1971–1980 (Fig. 6c) was drought free. For the decade 1981–1990 (Fig. 6d), there is a rather homogenous pattern at the country level, with up to two (one) dry summers per decade affecting the western (eastern) part of the country. The decade 1991–2000 (Fig. 6e) also indicates a rather homogenous pattern of the drought conditions at the country level, with up to four dry summers per decade in the western part of the country and three dry summers per decade over the rest of the country. The decade 2001–2010 is characterized by an west–east gradient in the drought conditions, with the highest number of dry years (∼ 4) in the southeastern part of the country (Fig. 6f). Over the 2011–2020 decade, the drought hotspots are located mainly over the western part and the southeastern part of the country (Fig. 6g). The highest number of dry summers per decade were recorded throughout this decade (i.e., 2011–2020), with up to six dry summers per decade over the whole western part of the country and over the southeastern part. Overall, the decadal spatiotemporal evolution of the drought conditions (Fig. 6) indicates that drought events are not homogenous throughout the country and that the decades with the highest number of dry summers were 1991–2000, 2001–2010, and 2011–2020. A similar pattern is observed when looking at the SPEI trends, on both monthly (Fig. 7a–c) and seasonal timescales (Fig. 7d). Overall, in June there is a non-significant drying trend over the northwestern and southeastern parts of the country (Fig. 7a and Table S2). In July there is an overall non-significant drying trend over the southwestern and southeastern parts of the country (Fig. 7b), while in August, the spatial trend pattern is rather distinct compared to June and July, being characterized by a general drying trend at the country level, but significant only over the eastern part of the country (Fig. 7c). August SPEI3 trend, which takes into account all summer months, is a combination of the features identified for each month analyzed separately: a drying trend over the whole country, but statistically significant only over the southeastern part of the country (i.e., Dobruja region) (Fig. 7d).
3.3 Historical evolution of compound events (e.g., warm and dry summers) in Romania
In this sub-section, we analyze the co-variability between hot and dry summers in terms of lagged and in-phase spatial correlation maps between the monthly/seasonal HWDI and monthly SPEI (Fig. 8) and conditional probability maps (Fig. 9). The lagged correlation maps (SPEI leading) have been computed and analyzed in order to test for possible influence of the pre-conditions of dry spring and/or early summer on the occurrence of summer heat waves. To find the best combination, in terms of compatible months for both hot and dry events, we have computed the spatial correlation maps between the monthly SPEI and the monthly HWDI with different time lags (e.g., SPEI leading). For example, June HWDI was correlated with April SPEI1, SPEI3, and SPEI6 (not shown); May SPEI1, SPEI3, and SPEI6 (not shown); and June SPEI1 (Fig. 8a), SPEI3 (not shown), and SPEI6 (not shown). The highest correlations, in terms of both amplitude and spatial extent, have been obtained for the combination of June HWDI and June SPEI1 (Fig. 8a). This finding is also confirmed by looking at the correlation coefficient, both with lag and in phase, between the HWDI index averaged at the country level (i.e., the time series in Fig. 2a) and different combinations of the monthly SPEI averaged at the country level (Fig. S4). Also, for the country-averaged time series, the highest correlation was obtained for June HWDI and June SPEI1. In terms of spatial extent, the highest correlations (e.g., ∼ 0.5) have been obtained for the western and southern parts of the country (Fig. 8a). Nevertheless, a significant correlation between HWDI and SPEI over these regions does not necessarily imply that each drought will always co-occur with a heat wave over that region or vice versa. The conditional probability map for June, which implies the probability of co-occurrence of both a dry (June SPEI ) and a hot (June HW > 1) month, indicates the most prone regions of a combined hot and dry June are the areas located in the eastern part of the country (Fig. 9a). For July, the highest correlation has been found also for the in-phase relationship (i.e., July HW and July SPEI1) (Fig. 8b). Compared to June, in July the spatial correlations between July HW and July SPEI1 are significant all over the country, with the highest amplitudes over the extra-Carpathian regions and over small areas in the northwest. This dipole-like structure clearly emphasizes the influence of the Carpathian Mountains on the climate variability of Romania, which is in agreement with previous studies over this region which have shown that the Carpathian Mountains play a significant role in the hydroclimatic variability of the country (Busuioc et al., 2015; Ionita, 2015). In terms of co-variability, the most prone regions for a combined hot and dry July are, as in the case of June, the areas located in the eastern part of the country (Fig. 9b). In August, the highest correlations, based on both the amplitude and the spatial extent, have been found between August HWs and August SPEI3 (Figs. 8c and S4). The correlations between August HWs and August SPEI3 reached values up to −0.7 for almost the whole country, with small exceptions in the southeastern corner of the country. The occurrence of HWs in August seems to be influenced not only by the hydroclimatic conditions in August, but also by the previous months. The conditional probability map (Fig. 9c) indicates that hot and dry events have a higher probability of occurrence compared to June and July, and the risk of hot and dry events is distributed all over the country, with small exceptions in the mountain areas (i.e., Apuseni Mountains and Retezat Mountains). When we look at all the summer months together, the highest correlations are obtained between JJA HWs and August SPEI3. The spatial correlation map between JJA HWs and August SPEI3 reaches values up to ∼ −0.8 for almost the entire country (Fig. 8d) and a value of −0.71 when we averaged at the country level (Fig. S4). In terms of co-variability, the most prone regions for combined hot and dry summers are the areas located in the eastern part of the country (Fig. 9d). When considering the 1-month lag, there are still some regions showing significant negative correlations between SPEI and HW, mainly for July HW and June SPEI1 over the southern part of the country and August HW and July SPEII1 over the western part of the country (not shown). Although the lagged correlations are smaller in amplitude compared to the in-phase correlations, the lagged relationship indicates that there might be some influence of the drought conditions on the heat waves in the upcoming months, especially in the case of July and August HWs.

Figure 8Spatial correlation between (a) June SPEI1 and June HWDI (b) July SPEI1 and July HWDI, (c) August SPEI3 and HWDI August, and (d) August SPEI3 and JJA HWDI. The regions where the correlations are statistically significant (95 % significance level) are hatched.
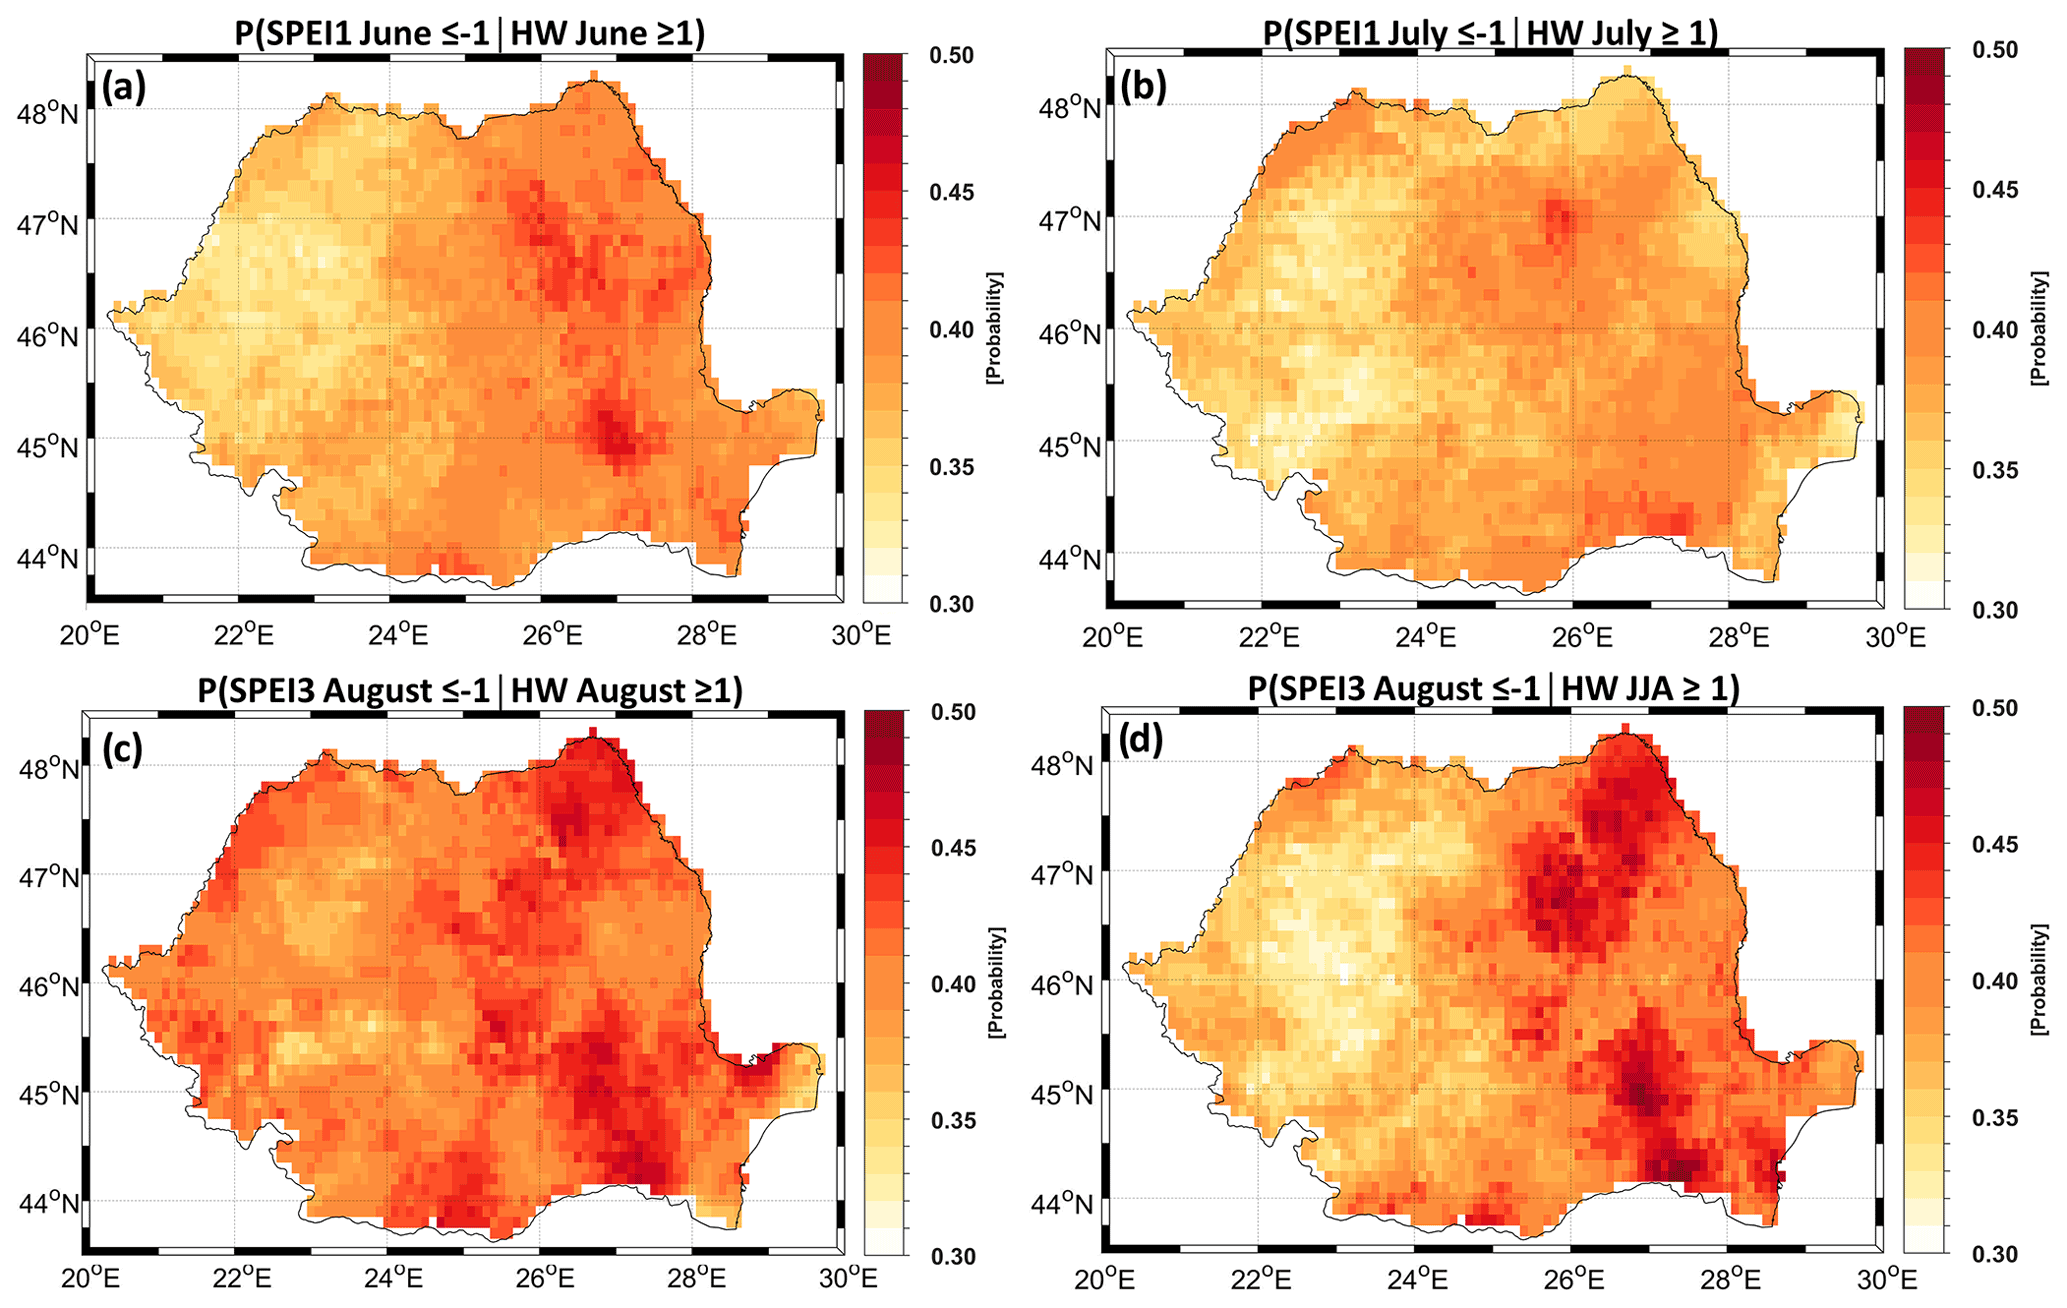
Figure 9Conditional probability of occurrence of hot (HW ≥1) and dry (SPEI ) events: (a) June SPEI1 and June HW, (b) July SPEI 1 and July HW, (c) August SPEI3 and August HW, and (d) August SPEI3 and JJA HW 1981–1990.
3.4 Extreme heat wave events in Romania and their driving factors
The analysis of the temporal variability of the HWDI and AREA (Fig. 2) has emphasized some extreme HWs for each analyzed month, in terms of both duration and spatial coverage. Thus, in this sub-section, we make a detailed analysis of the longest HW for each month, in terms of extremeness (e.g., rank maps) and large-scale driving factors. The analysis is focused on three distinct cases: July 2012, August 2015, and June 2019.
July 2012 was marked by persistent heat waves, which have determined extremely high temperatures at the beginning of the month in the western part of the country, afterwards extending to all regions, but especially in the plain and plateau areas (Fig. 10a). In some regions of the country (e.g., eastern and central part) the duration of the HWs was up to 24 d. In terms of drought, most of the country was affected by moderate to extreme drought in July 2012 (Fig. 10b), with small exceptions in the northwestern part of the country. July 2012 was the hottest month on record (e.g., over the period 1950–2020) over most of the country (Fig. 10c). In July 2012, 114 meteorological stations through the country recorded temperatures above 35 ∘C (Dima et al., 2016). Over the central part of the country, from the south to the north, July 2012 was both hot and dry (Fig. 10d). The peak of the heat waves was recorded in the first week of the month (Fig. S5). Starting with 2 July, the atmospheric circulation was characterized by a northeasterly flow, which led to an advection of warm air masses, generated over Russia (Fig. S6). At the country level, this large-scale atmospheric pattern resulted in the establishment of an excessive thermal regime and an increase in the number of hot days (i.e., daily temperatures > 35 ∘C), especially in the southern and eastern regions (Fig. 10e and S5). Between 7 and 9 July 2012, the daily maximum temperature up to 10 ∘C was higher, compared to climatology, especially in the eastern part of the country (Fig. S5f–h). These excessive temperatures were driven by the persistence of a high-pressure system over the eastern part of Romania and the presence of an atmospheric blocking center over Fennoscandia and the western part of Russia (contour lines in Fig. S6).
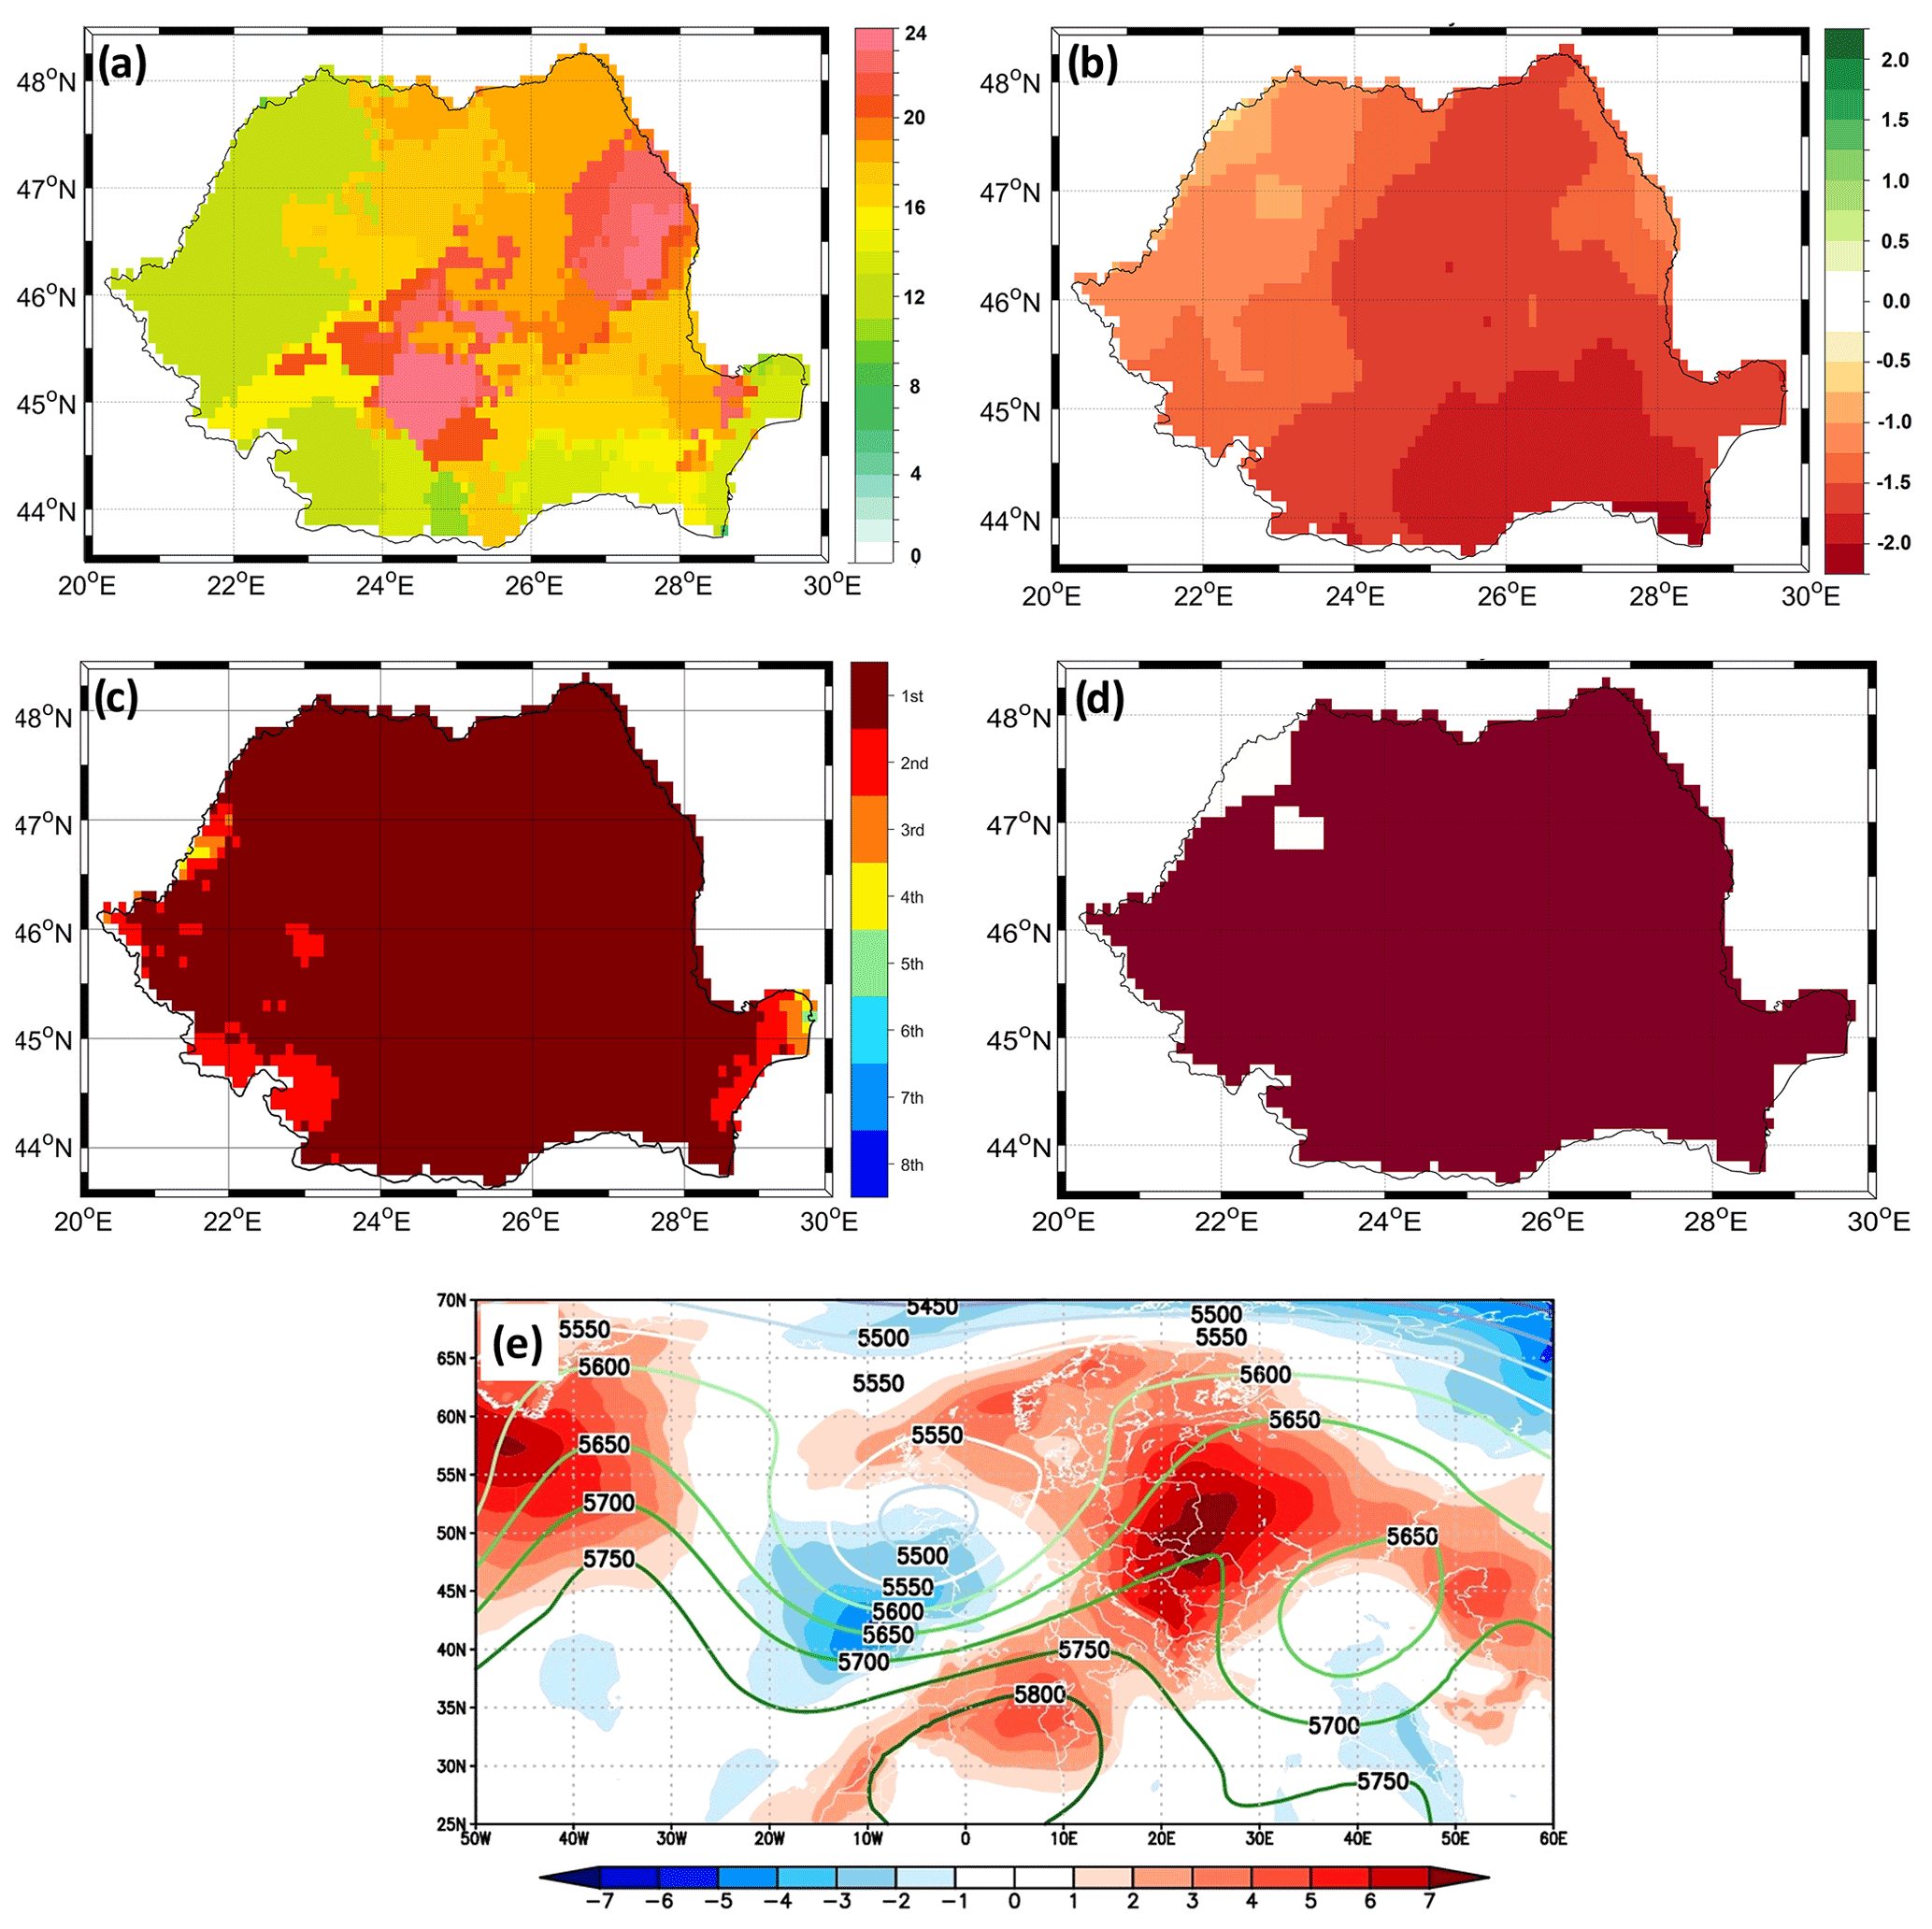
Figure 10(a) HWDI for July 2012; (b) SPEI1 for July 2012. (c) Top eight ranking of TX90p for July 2012 (first means the hottest (Tx90p) since 1950, second signifies the second hottest, etc., and all ranks > 8 are shown in white). (d) CHD for June 2012 (the dark red color indicates the grid points affected by a CHD). (e) Daily Z500 (contour lines) and TT850 anomalies (shaded colors) averaged over the period 25–30 July 2012. Units are as follows: (a) days per month; (e) Z500 (m) and TT850 (∘C). For (c) the analyzed period is 1950–2020.
The heat wave and drought event observed throughout the summer of 2015 affected a large portion of continental Europe and was one of the most severe dry and hot summers over the observational period (Ionita et al., 2017; Laaha et al., 2017; Van Lanen et al., 2016). Record high temperatures were observed throughout the whole summer over different parts of Europe. Extremely high temperatures already started to be recorded in June 2015 over the Iberian Peninsula, central and eastern France, the western Alps, and Ukraine. The heat wave and drought conditions extended towards the central part of Europe in July 2015 (Ionita et al., 2017). By August 2015, the heat wave moved and continued to develop in central and eastern Europe, including Romania. For most of the month of August 2015, Romania was under the influence of extremely high temperatures. The first heat waves occurred between 3 and 16 June (not shown). Between 17 and 23 August, a short relief was observed, with temperatures below the climatological mean (not shown). The second and most intense heat wave (e.g., in terms of the temperature anomalies) started to develop on 24 August, reaching its peak at the end of the month (Fig. S7). The longest heat wave was recorded over the northern and eastern parts of the country (Fig. 11a). In some regions in the eastern part of the country, there were up to 24 d which fulfilled the HW definition. Overall, the drought conditions in August 2015 were not as intense as in July 2012. Only the northern part of the country experienced both heat wave and drought at the same time (Fig. 11b and d). August 2015 was also the hottest month on record (e.g., over the period 1950–2020) in the northern and northeastern parts of the country (Fig. 11c). The extremely high temperatures recorded, especially in the last week of August 2015, were mainly driven by the prevailing large-scale circulation. The two long-lasting heat waves in August 2015 were determined by the extension of the North African ridge over most of the European continent (Figs. 11e and S8). During the peak of the second heat wave (i.e., 28–31 August 2015) the eastern part of Europe was affected by a persistent atmospheric blocking system (contour lines in Fig. S8), which was centered over Romania, and by positive values of the water vapor flux divergence (not shown). The anomalous Z500 center over the eastern part of Europe (Figs. 11e and S8) and the divergent water vapor flux over Romania suggest a dominant subsidence and adiabatic warming, reduced cloudiness, and increased incoming solar radiation, thus leading to excessive temperatures over the affected regions.

Figure 11(a) HWDI for August 2015. (b) SPEI3 for August 2015. (c) Top eight ranking of TX90p for August 2015 (first means the hottest (Tx90p) since 1950, second signifies the second hottest, etc., and all ranks > 8 are shown in white). (d) CHD for August 2015 (the dark red color indicates the grid points affected by a CHD). (e) Daily Z500 (contour lines) and TT850 anomalies (shaded colors) averaged over the period 28–31 August 2015. Units are as follows: (a) days per month; (e) Z500 (m) and TT850 (∘C). For (c) the analyzed period is 1950–2020.
For the month of June, the longest and largest (in terms of spatial extent) HW event was recorded in June 2019 (Fig. 2e–f). According to Copernicus (https://climate.copernicus.eu/surface-air-temperature-june-2019, last access: 17 December 2021) June 2019 was the hottest June on record both globally and for Europe, with central and eastern Europe being particularly warm throughout the whole month. In June 2019, the northwestern and southeastern parts of Romania were regions the most affected by extreme temperatures (Fig. 12a and c). Record-breaking temperatures were recorded in the most northern part of the country as well as in the Dobruja region (Fig. 12c). These record-breaking temperatures were corroborated with drought conditions (Fig. 12b and d). The eastern, central, and southwestern parts of the country were less affected by extreme temperatures (Fig. 12a and c), and these regions were characterized by wet conditions throughout the month (Fig. 12b). The particular spatial pattern was mainly influenced by the spatial pattern of the large-scale atmospheric circulation (Fig. 12e). The atmospheric circulation at the peak of the heat wave event (Figs. S9 and S10) was characterized by a persistent wave-like pattern extending from the North Atlantic Ocean towards Eurasia (Figs. 12e and S10). Positive (negative) geopotential anomalies were observed over eastern Europe (central North Atlantic and central Siberia), corresponding to the local positive (negative) temperature anomalies underneath (Figs. 12e and S9). The spatial structure of the Z500 field resembles the classic omega blocking circulation (Fig. S10 – contour lines). This pattern favors the advection of warm air from the Sahel towards the eastern part of Europe and enhances the incoming solar radiation, leading to extremely high temperature anomalies underneath the high-pressure system.
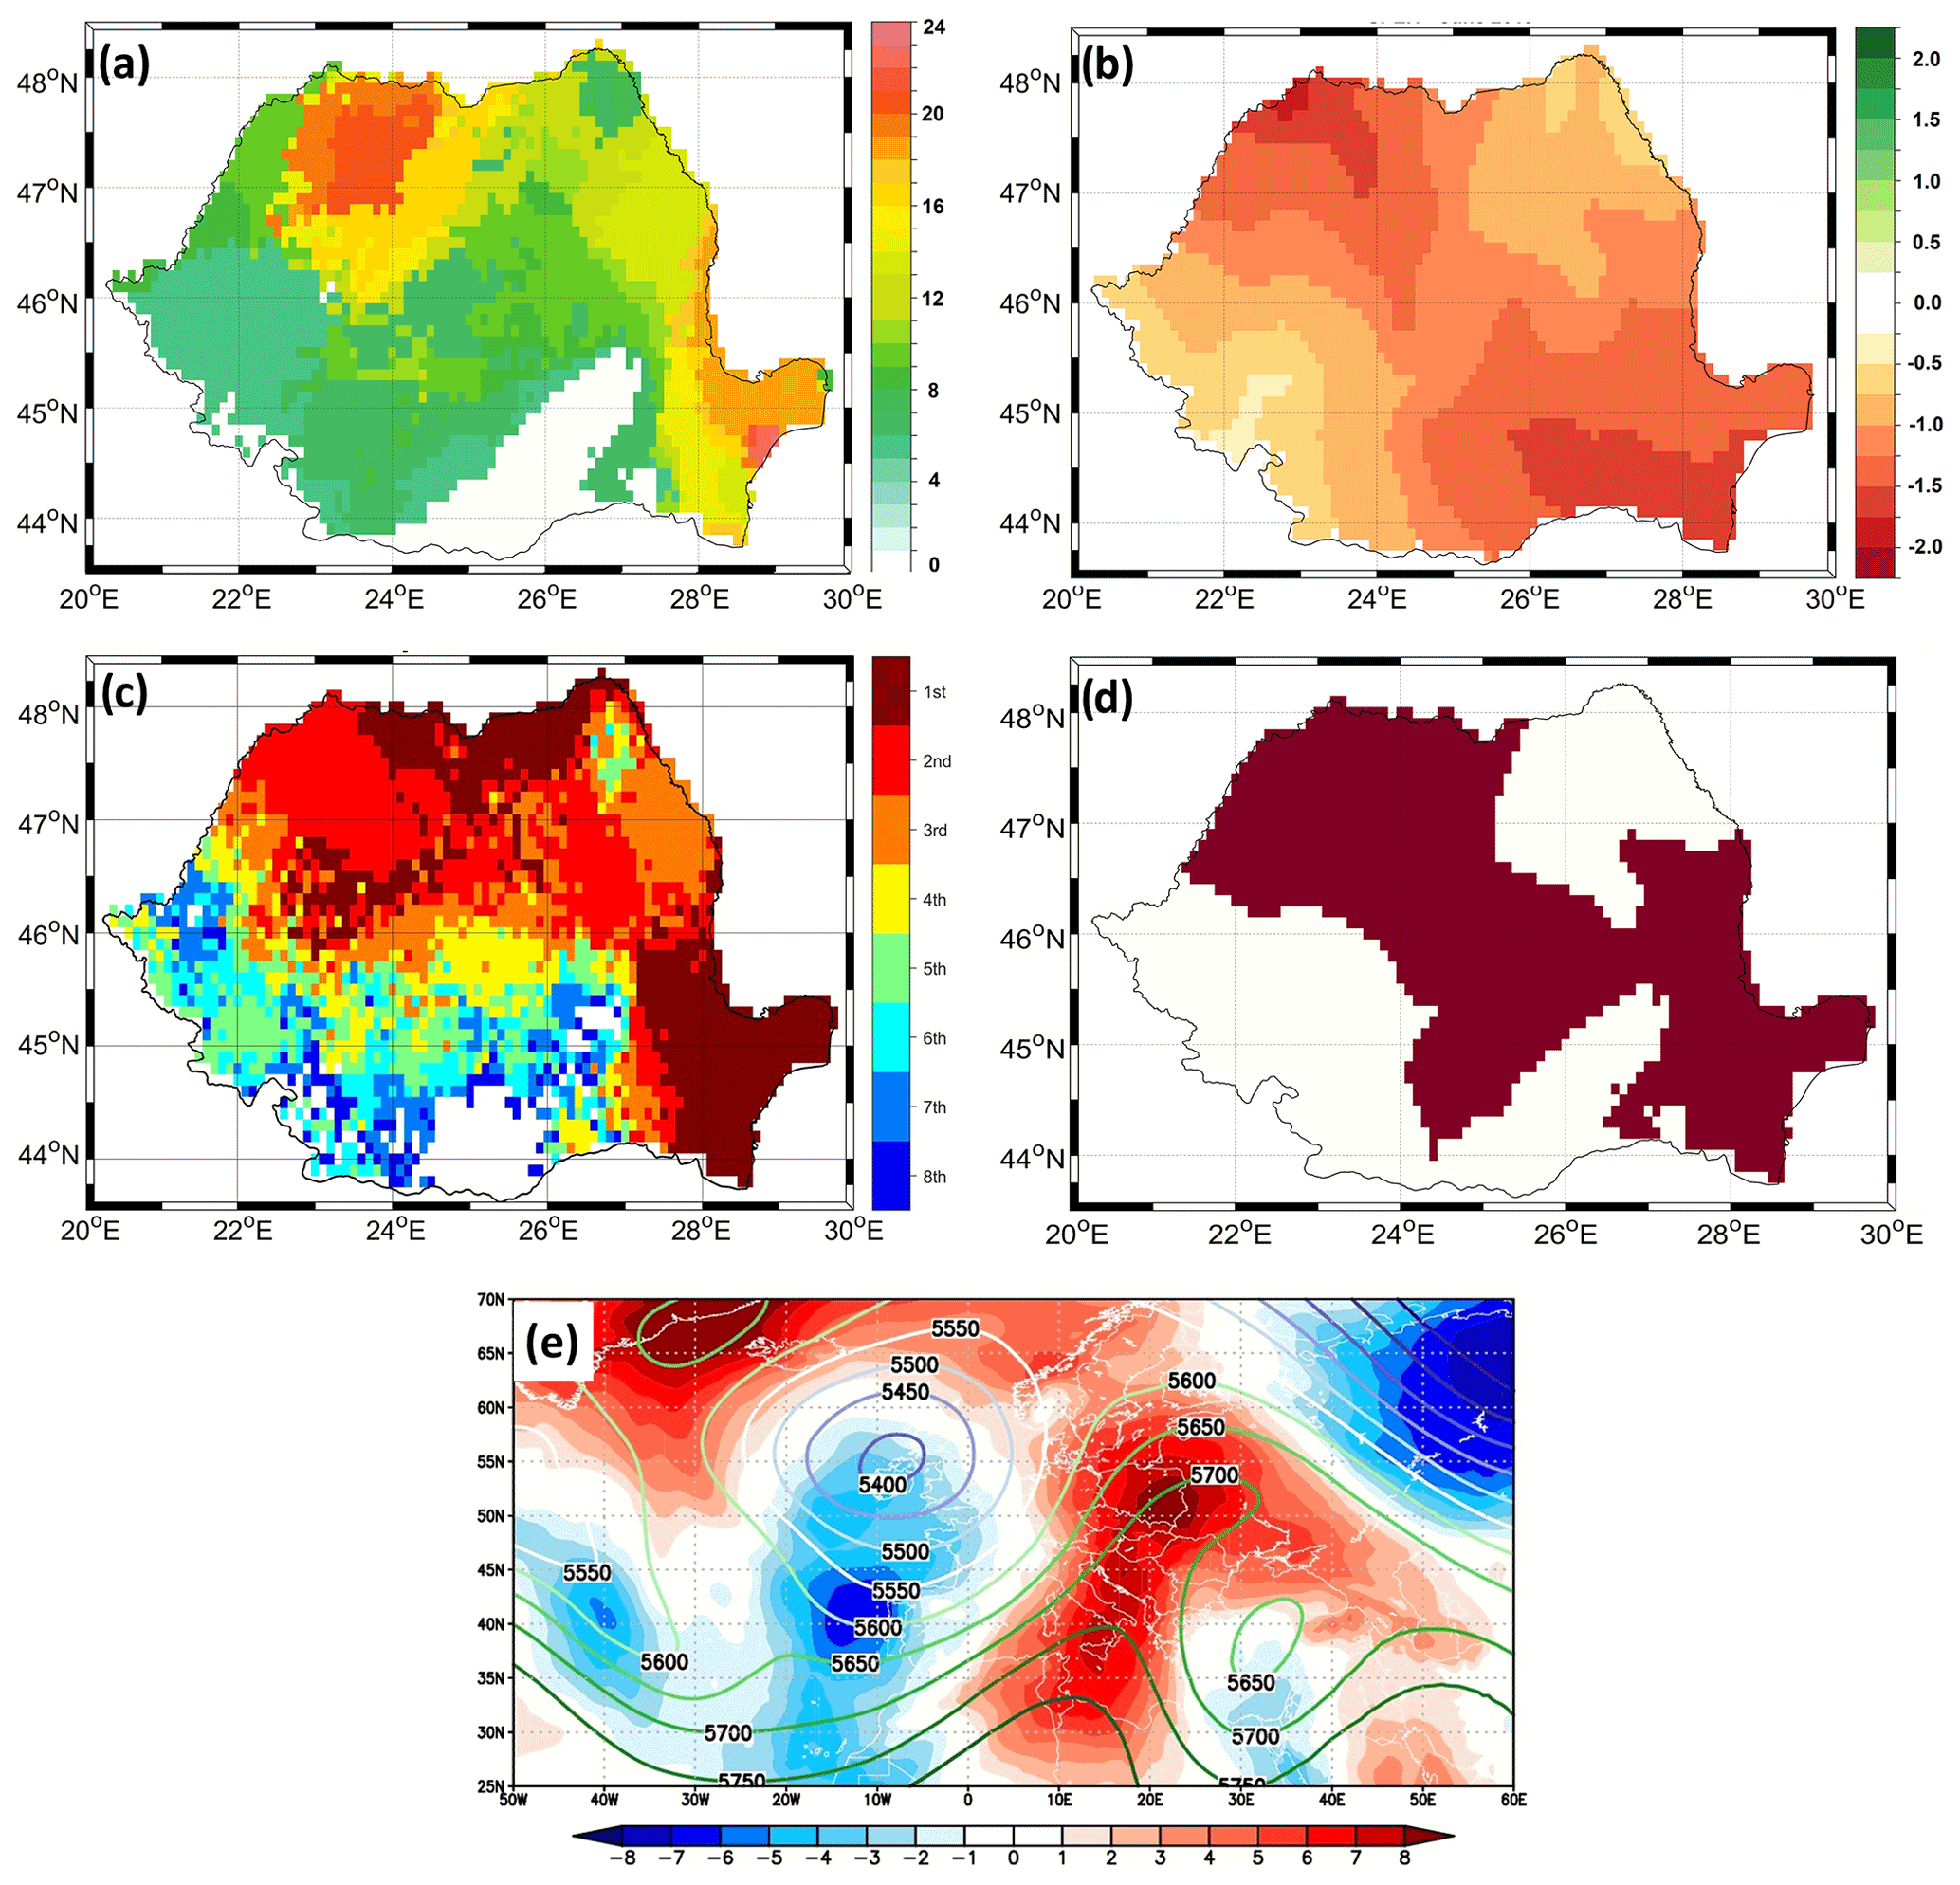
Figure 12(a) HWDI for June 2019. (b) SPEI1 for June 2019. (c) Top eight ranking of TX90p for June 2019 (first means the hottest (Tx90p) since 1950, second signifies the second hottest, etc., and all ranks > 8 are shown in white). (d) CHD for June 2019 (the dark red color indicates the grid points affected by a CHD). (e) Daily Z500 (contour lines) and TT850 anomalies (shaded colors) averaged over the period 10–14 June 2019. Units are as follows: (a) days per month; (e) Z500 (m) and TT850 (∘C). For (c) the analyzed period is 1950–2020.
All analyzed extreme HWs in this section were mainly driven by the presence of a high-pressure system over the analyzed region, during the peak of the HW event. In order to identify if the presence of a persistent high-pressure system is a necessary ingredient for all HWs identified throughout the period 1950–2020, we have computed the composite maps for the years when the HWDI index (Fig. 2 – left column) was > 5 d and the corresponding Z500 anomalies and the corresponding wind vectors. We performed the analysis for each month separately (Fig. 13). Due to the fact that the relationship between the large-scale atmospheric circulation and the European hydroclimate was found to be limited due to non-stationarity issues (Ionita et al., 2020; Rimbu et al., 2004; Vicente-Serrano and López-Moreno, 2008), we have also computed the stability maps between the HWDI and the monthly Z500. The aim of the composite map analysis is to analyze the relationship between the HWDI and the large-scale atmospheric patterns, but this methodology does not consider whether the relationship between the two variables is stationary in time or not. In order to overcome the problem of non-stationarity and to test if the identified relationship between the HWDI and Z500 is stable over time, we employed a methodology, namely the stability maps, used for the monthly to seasonal prediction of the mean runoff of the Elbe River and in dendroclimatological studies (Ionita et al., 2015; Nagavciuc et al., 2019).
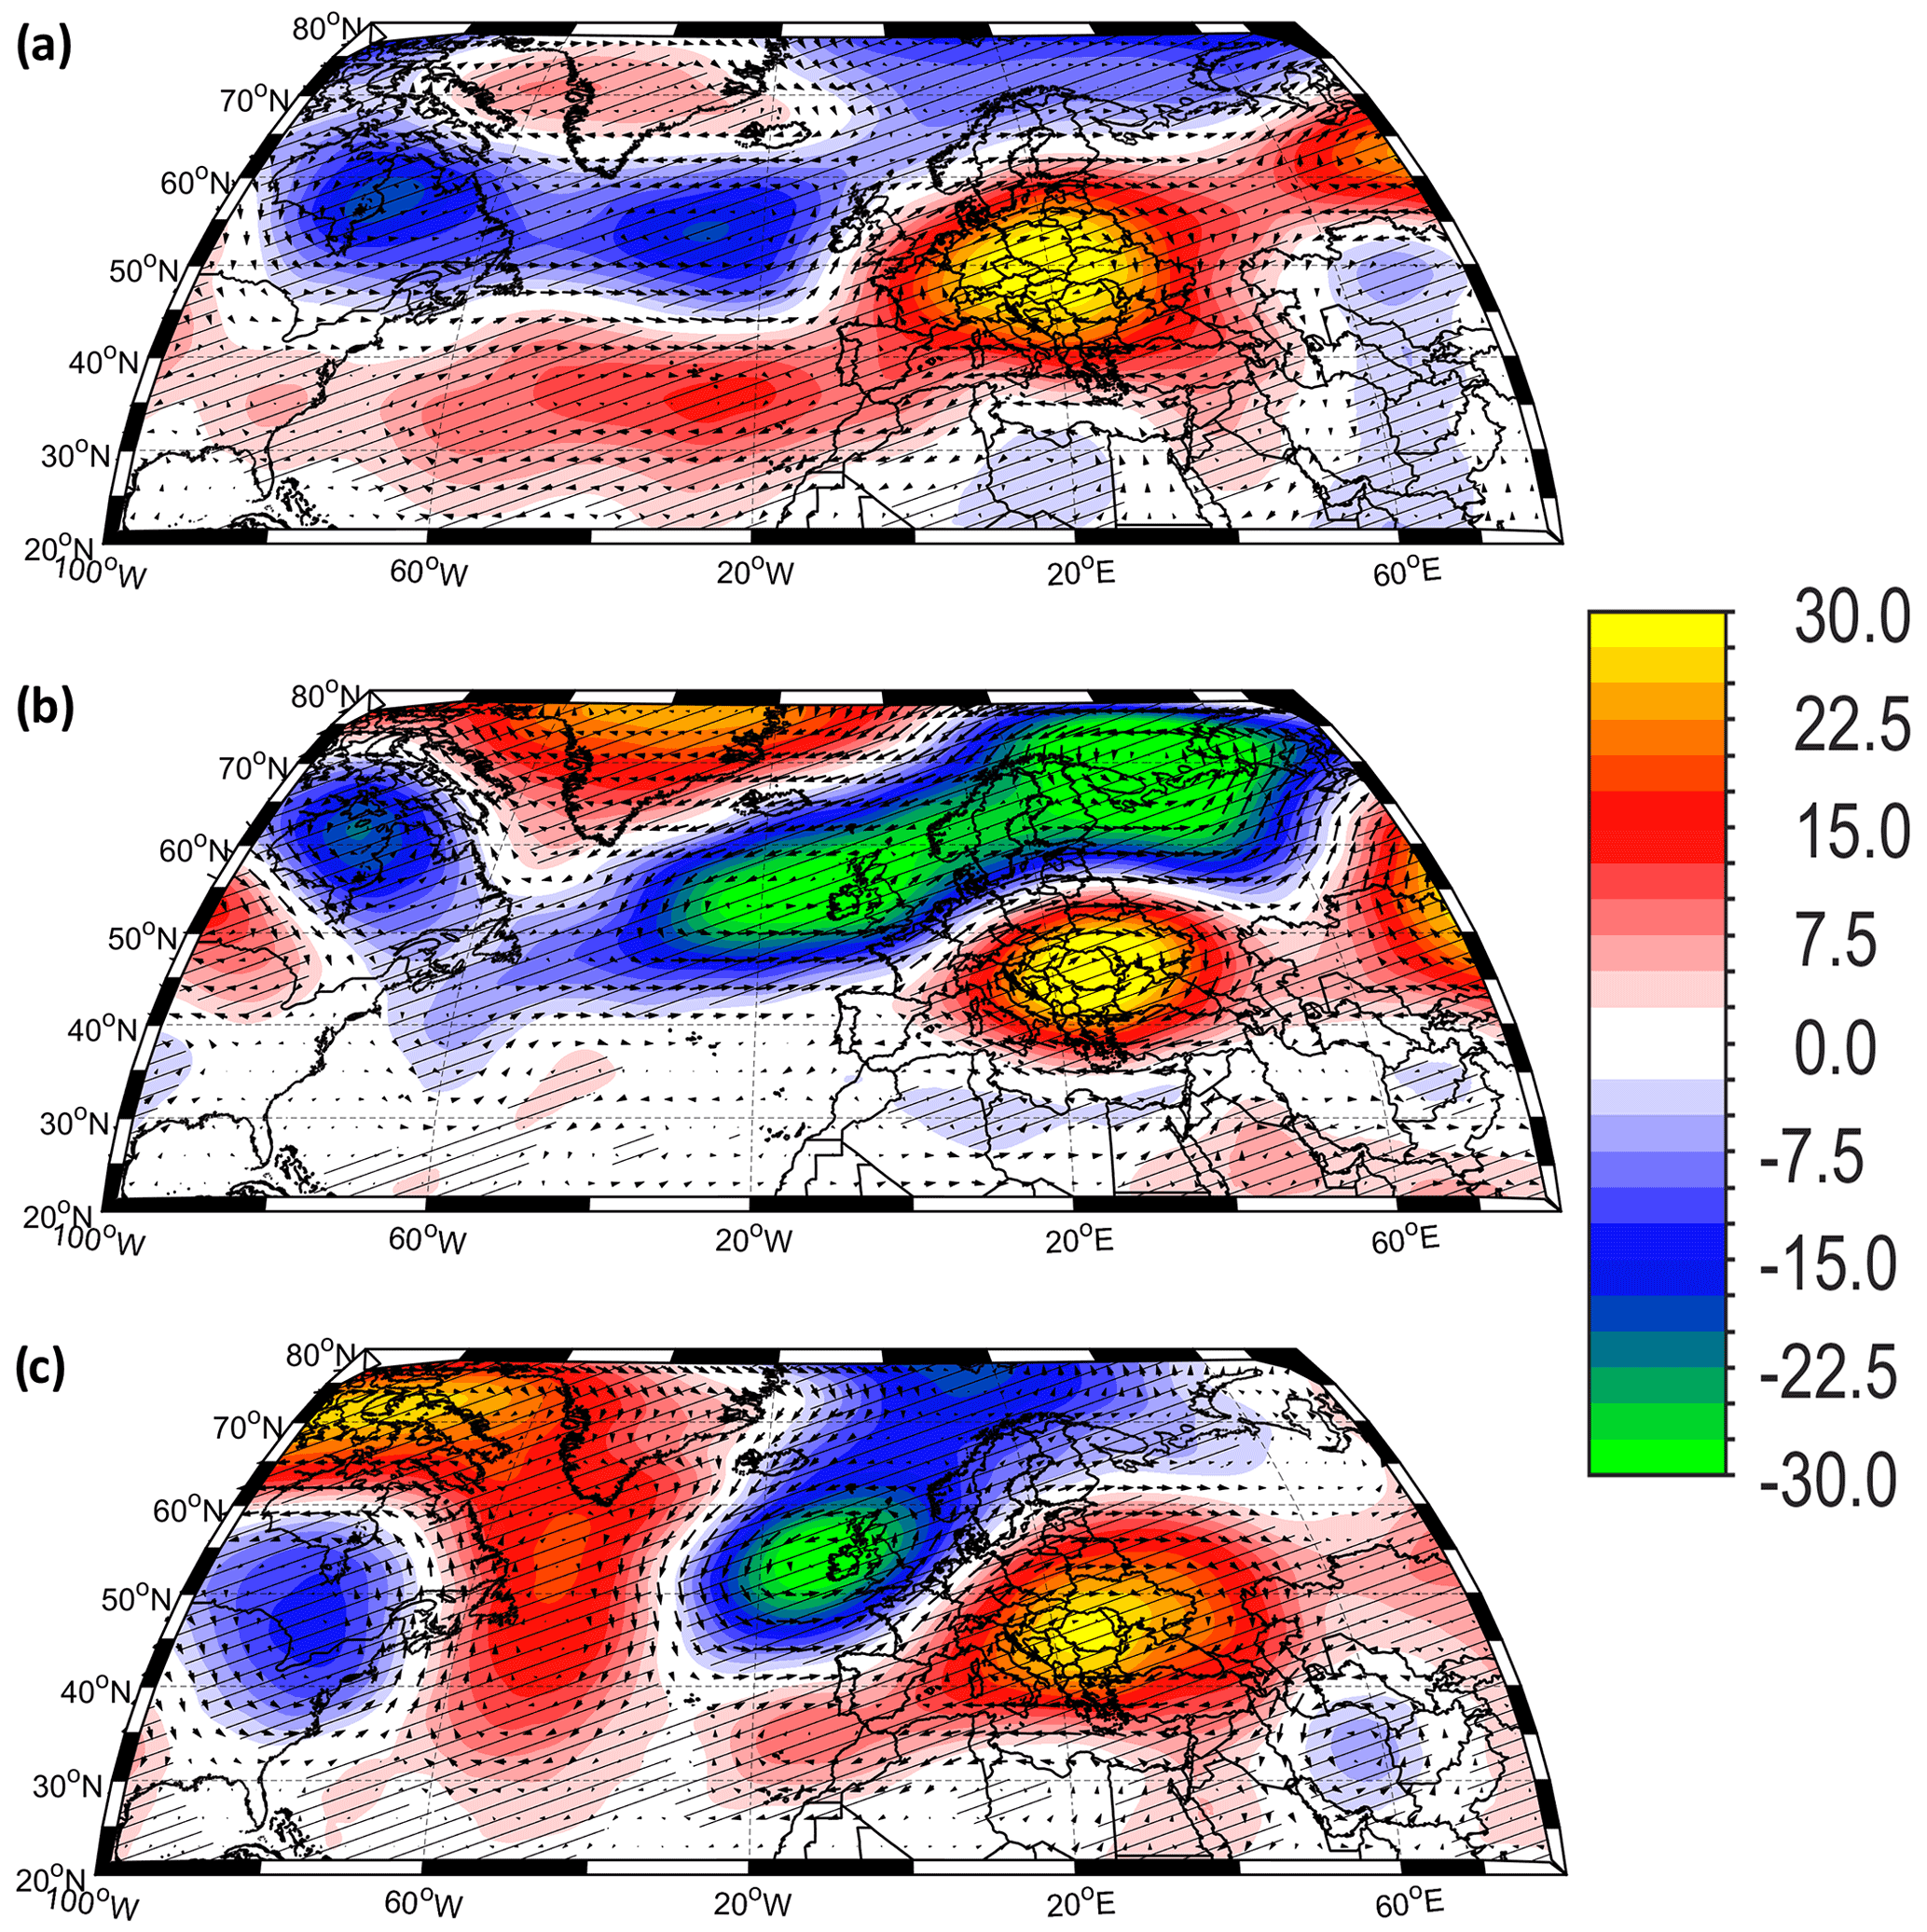
Figure 13Large-scale atmospheric circulation patterns associated with the occurrence of monthly heat waves in Romania. (a) The high-composite map of June geopotential height at 500 mb (Z500) and the wind vectors at 500 mb corresponding to the cases when the area covered by a heat wave was higher than 20 % of the country (June HW AREA > 20 %); (b) as in (a) but for July and (c) as in (a) but for August. The hatched areas indicate anomalies significant at the 95 % significance level based on a two-tailed t test. Units are Z500 [m].
The June composite map of Z500 anomalies and the corresponding wind vectors for years with HWs lasting more than 5 d is characterized by positive Z500 anomalies over the central and eastern parts of Europe and negative Z500 anomalies over the central North Atlantic Ocean (Fig. 13a). Moreover, HWs in June, in Romania, are also associated with an increase in the number of atmospheric blocking days, centered over the southeastern part of Europe (Fig. 14a). The spatial structure of the Z500 anomalies, centered over the eastern part of Europe, leads to the advection of hot and dry air from the northeastern part of Europe. The large-scale atmospheric circulation associated with HWs over Romania, in July, is similar to the spatial structure identified in June, in both the Z500 field (Fig. S13b) and in the case of 2D atmospheric blocking (Fig. 14b). In August, the spatial structure of the Z500 field, associated with the occurrence of HWs over Romania, is characterized by a wave-train like pattern of alternating Z500 anomalies, which extends from the eastern part of the US until Eurasia (Fig. S13c). Extreme HWs, in August, are associated with a low-pressure system over the eastern part of the US, followed by positive Z500 anomalies over the western part of the central North Atlantic Ocean, negative Z500 anomalies centered over the British Isles, and positive Z500 anomalies over the central and eastern parts of Europe. This wave-like pattern suggests a stationary Rossby wave pattern, which is usually associated with heat waves and droughts over the Eurasian continent (Bakke et al., 2020; Barriopedro et al., 2011; Ionita et al., 2012; Schubert et al., 2014). As in the case of June and July, HWs in August are also associated with an increased frequency of atmospheric blocking over the eastern part of Europe (Fig. 14c). The significant relationship between the HWDI and Z500 obtained via the composite map analysis is also confirmed by the stability maps. June HWDI is stably and positively correlated with June Z500 over the eastern part of Europe, centered over Romania (Fig. 15a). The same pattern can also be observed when we compute the stability map between July HWDI and July Z500 (Fig. 15c). In the case of August, the HWDI is stable and positively correlated with Z500 over a region extended from the North Atlantic basin towards the central and eastern parts of Europe and negatively correlated with Z500 centered over the British Isles and North Ocean (Fig. 15e). This dipole structure is reminiscent of the east Atlantic teleconnection pattern, which was found to have a significant influence on the variability of temperature and precipitation over Europe, throughout the whole year (Gao et al., 2017). Based on the monthly stability maps identified in Fig. 15, we defined a Z500 index averaged over the stable regions (black squares in Fig. 15a, c, and e) to analyze the interannual variability of the Z500 over these regions in a long-term context. This analysis was motivated by the fact that it has been suggested that the Z500 over the central and western parts of Europe has increased recently, leading to an increase in the frequency of HWs over these regions (Porebska and Zdunek, 2013; Tomczyk and Bednorz, 2016). The June Z500 index exhibits strong interannual variability over the last 70 years, with the highest amplitudes since the beginning of the 1990s (Fig. 15b). Notably, the highest value of this index was recorded in 2019, which is also the month with the longest June heat wave (Fig. 2a). Over the period 1990–2020 there is a significant increasing trend in the June Z500 averaged over the eastern part of Europe, a trend which closely resembles the one observed for the June HWDI (Fig. 2a). The results of the trend analysis for each month and each analyzed period are given in Table S3. As in the case of June, the July Z500 index also exhibits strong interannual variability over the last 70 years and a significant increasing trend from the 1990s onward (Fig. 15d). The highest values of this index were recorded in 1954, 1987, 1988, 2007, 2012, and 2015. July 2012 is also the month with the longest July heat wave over the analyzed period (Fig. 2c). The time series of the August Z500 index also exhibits strong interannual variability over the last 70 years and a significant increasing trend over the period 1990–2020 (Fig. 15f). The highest value of this index was recorded in 1952, 1962, 1992, 2010, 2015, 2017, and 2019. August 2015 is also the month with the longest August heat wave (Fig. 2c). Overall, the time series of the monthly Z500 presents a strong interannual variability and a significantly increasing trend starting with the beginning of the 1990s, which mirrors the trends observed in the monthly HWDI (Fig. 2). For July and August, the trend of the Z500 indices is significant for both analyzed periods (i.e., 1950–2020 and 1990–2020), while for June the trend is significant only when we consider the 1990–2020 period (Table S3).
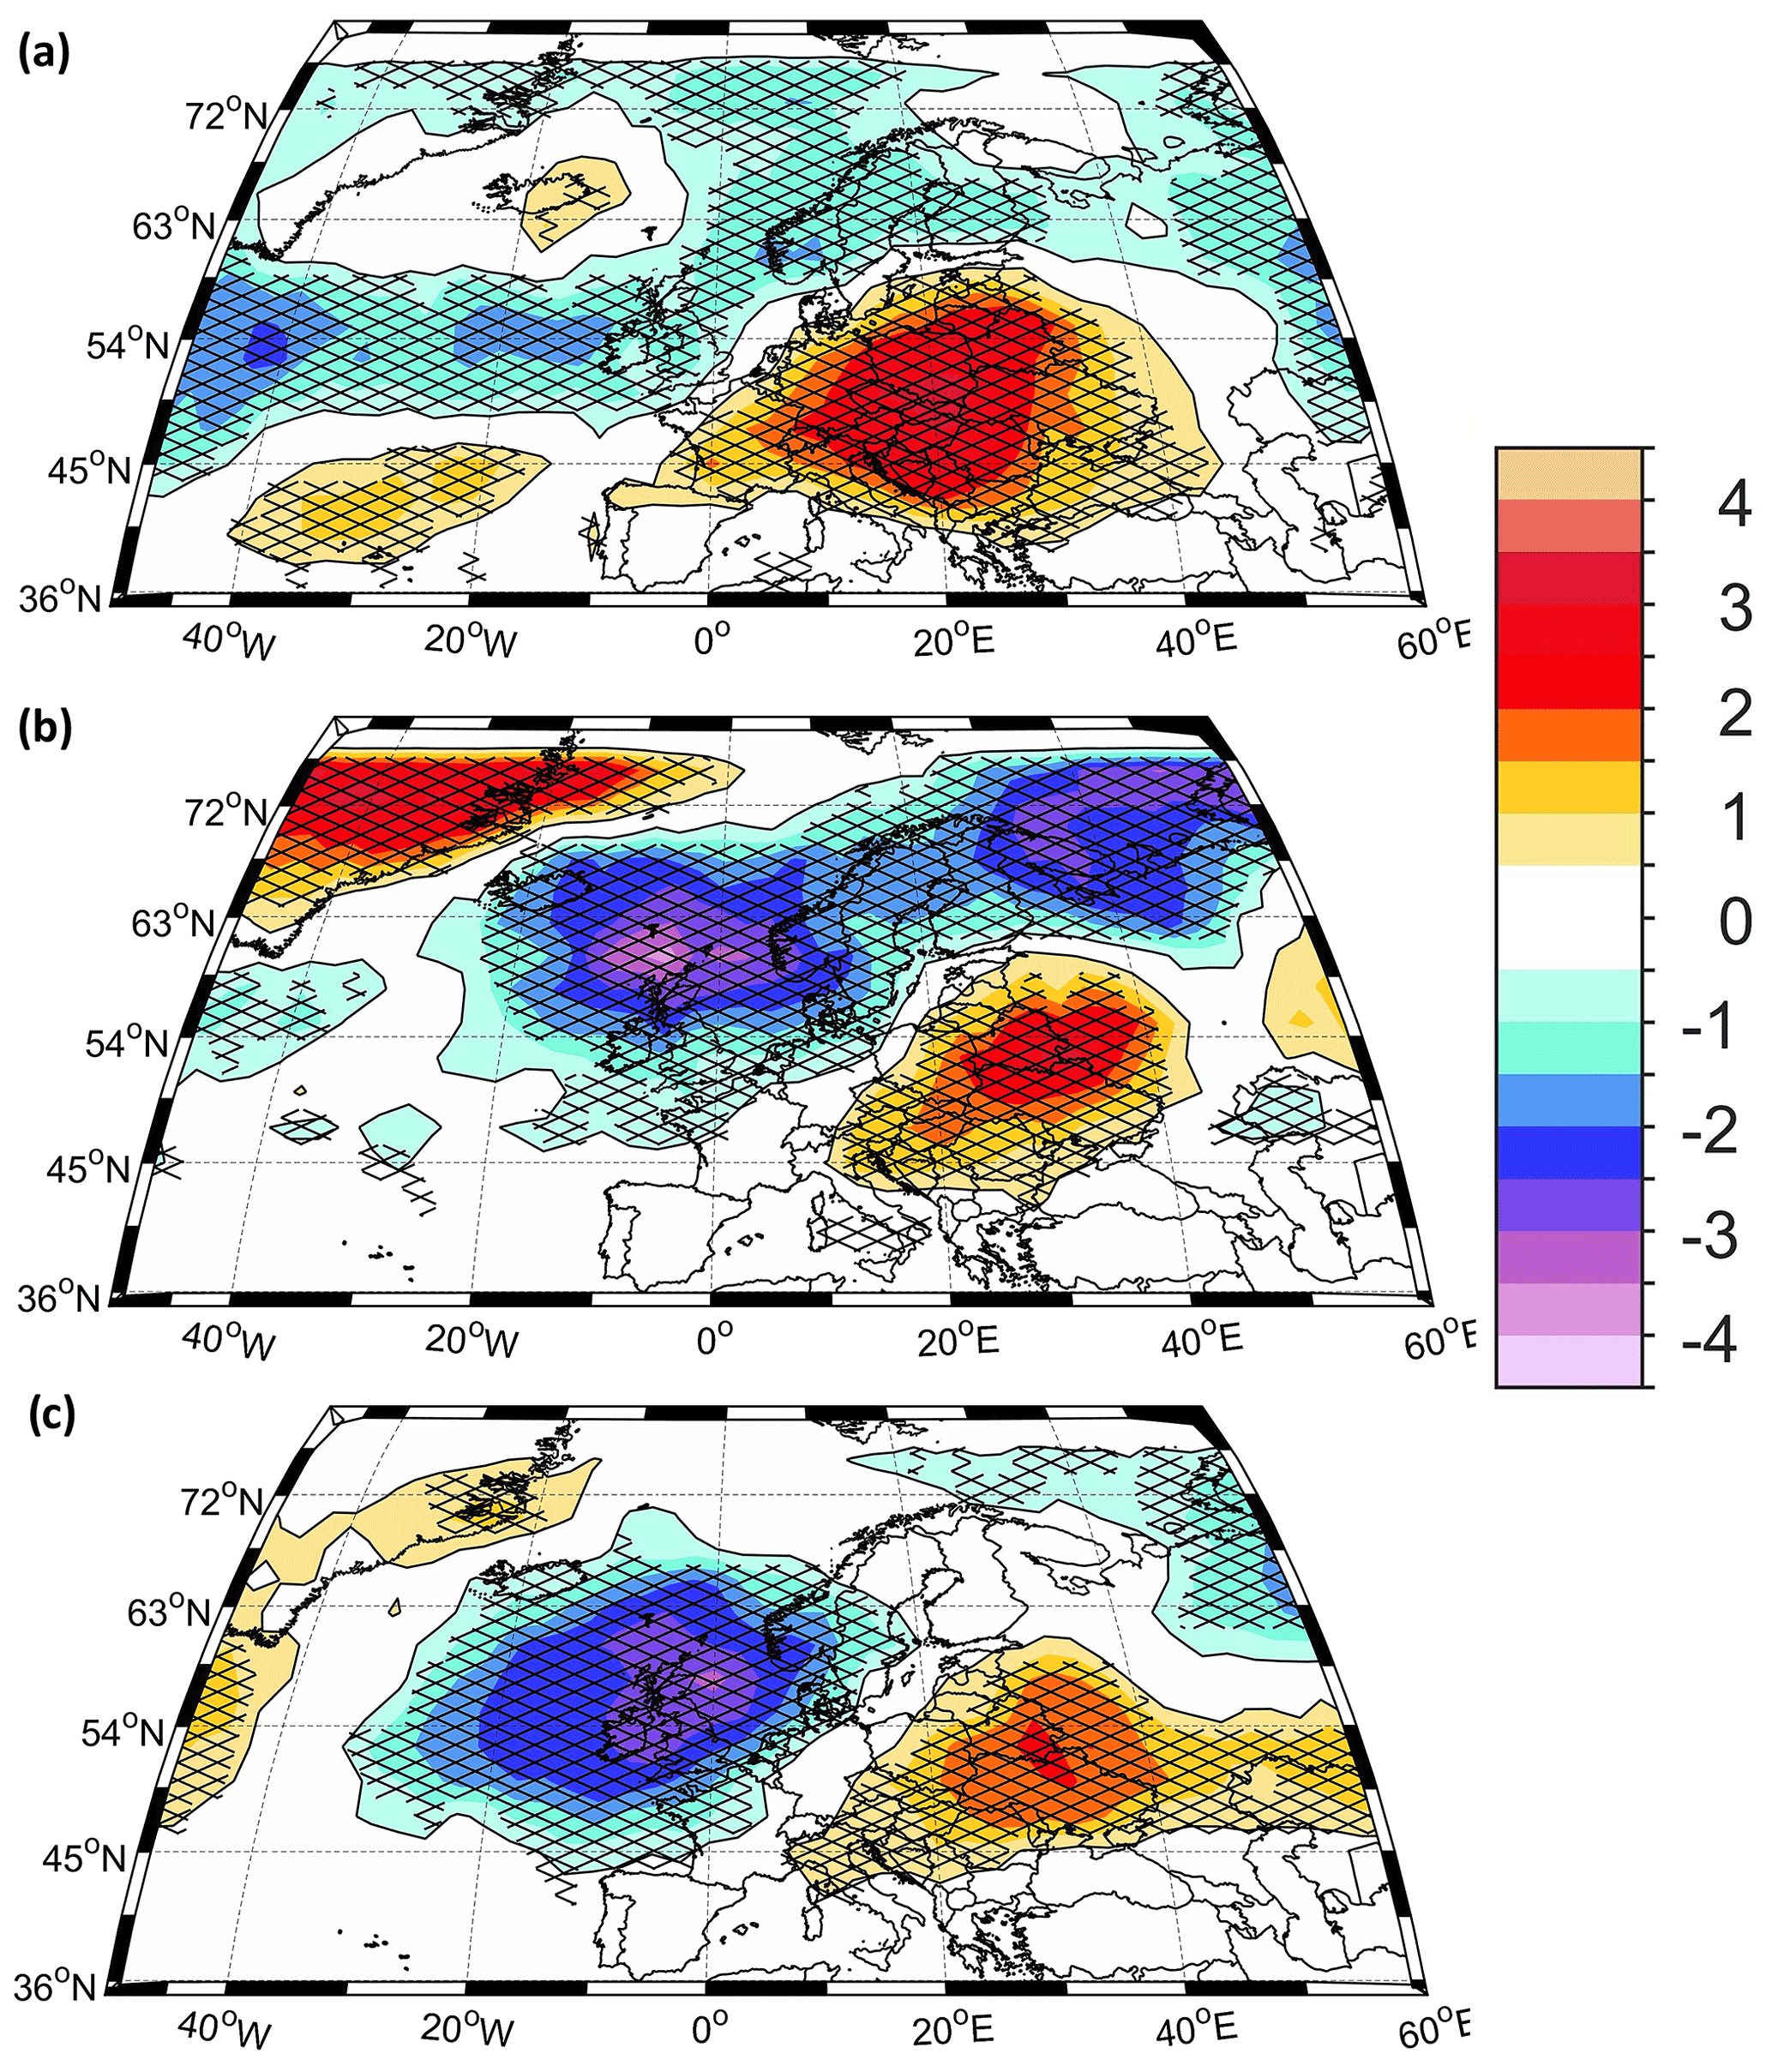
Figure 14Frequency of the 2D atmospheric blocking associated with the occurrence of monthly heat waves in the central part of Europe. (a) The high composite map of June 2D atmospheric blocking corresponding to the cases when the area covered by a heat wave was higher than 20 % of the country (June HW AREA > 20 %); (b) as in (a) but for July and (c) as in (a) but for August. The hatched areas indicate anomalies significant at the 95 % significance level based on a two-tailed t test. The unit is days per month.
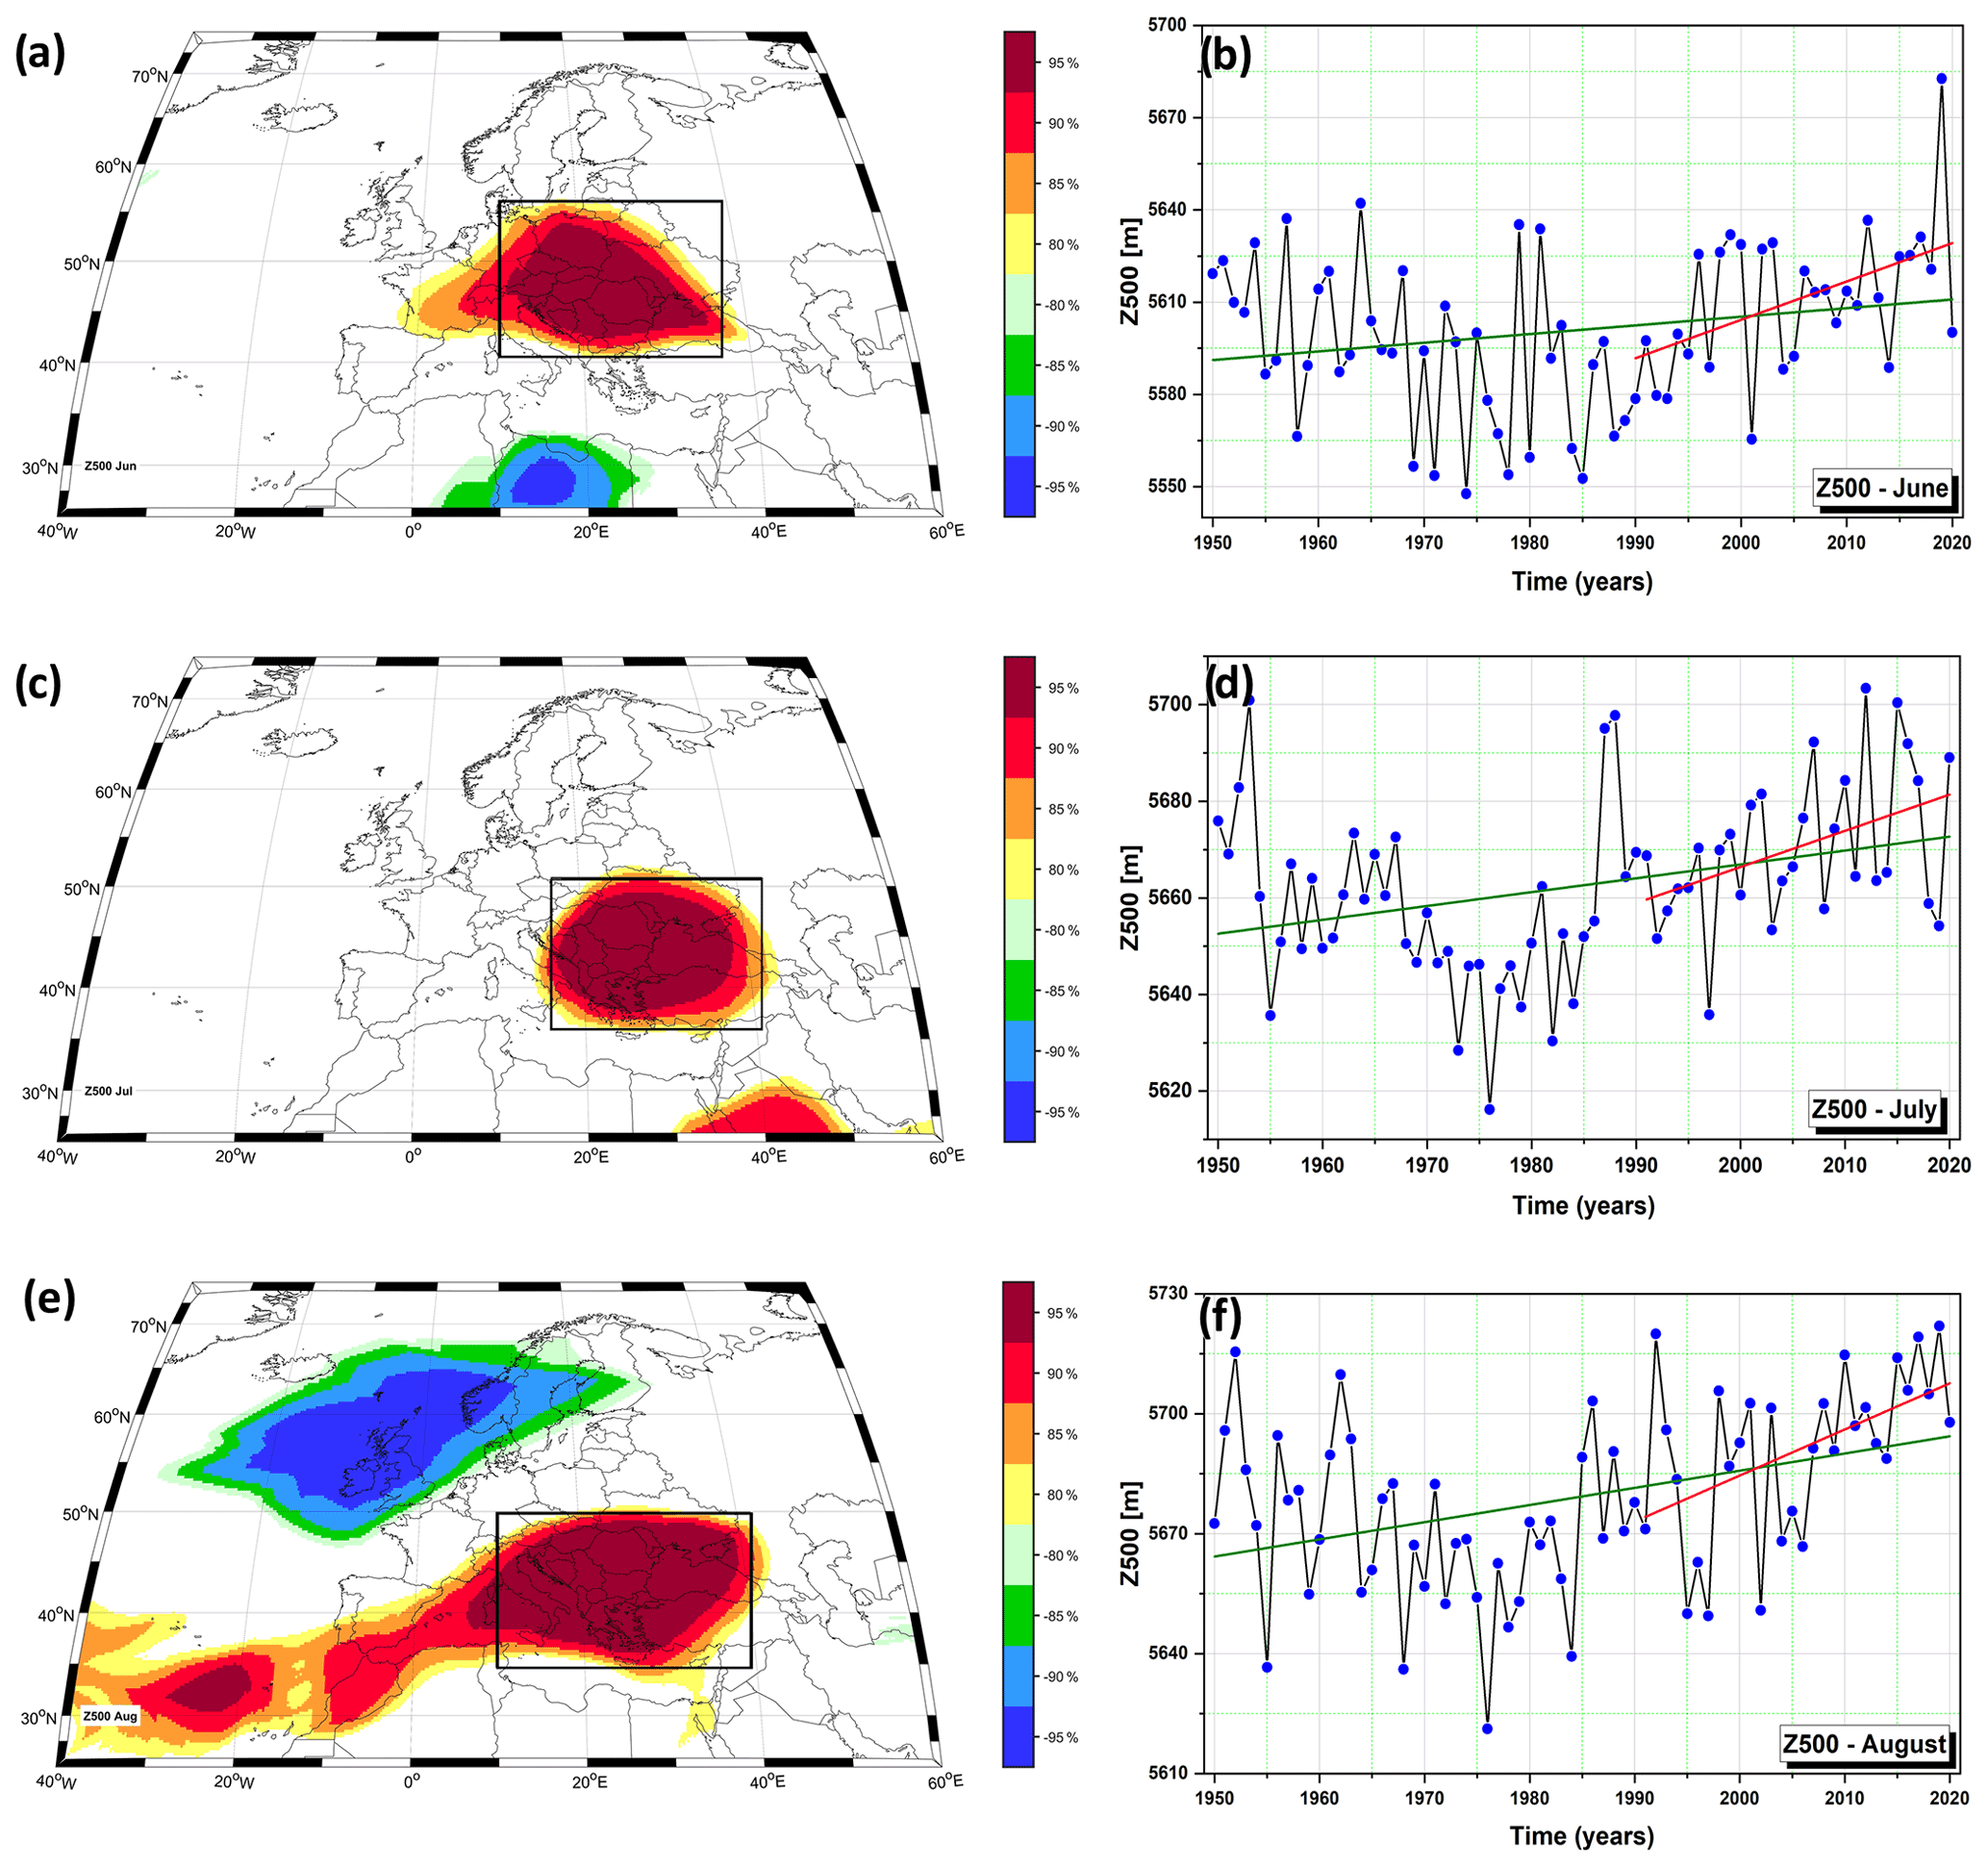
Figure 15Stability maps of the correlation between monthly HWDI and monthly Z500 over the period 1950–2020 (left column) and the time series of monthly Z500 averaged over the black box in (a), (c), and (e). (a) Stability map for June. (b) The time series of June Z500 averaged overt the black box in (a). (b) Stability map for July. (d) The time series of July Z500 averaged overt the black box in (c). (e) Stability map for August and (f) the time series of August Z500 averaged over the black box in (e). In (a), (c), and (e) the regions where the correlation is positive for at least 80 % of the 31-year windows are shaded with dark red (95 %), red (90 %), orange (85 %), and yellow (80 %). The corresponding regions where the correlation is significant, stable, and negative are shaded with dark blue (95 %), blue (90 %), green (85 %), and light green (80 %). The green (red) lines in (b), (d), and (f) indicate the linear trend line of the monthly Z500 over the period 1950–2020 (1990–2020).
The main findings of this study indicate that regional extreme temperatures over Romania follow the same path as the ones observed at continental and global scales, namely the summer temperature extremes have become more frequent and their amplitude has increased, especially over the last 2 decades. The increase in the frequency and magnitude of summer temperature extremes, over Romania, has been occurring at the same time as an overall drying trend, especially over the eastern part of the country. However, the changes in the HWs over Romania also present a decadal/multidecadal component, which is in agreement with previous studies at the European level as well at more regional spatial scales, which have shown that the summer temperature is strongly influenced by the Atlantic Multidecadal Oscillation (Della-Marta et al., 2007; Ionita et al., 2013). The evolution of the HWDI time series can be regarded as a combination between multi-decadal variability and anthropogenic induced climate change.
The length, spatial extent, and frequency of HWs in Romania have increased significantly over the last 70 years, for all summer months, with an increase in the heat wave duration of ∼ 0.52 d per decade (in June), ∼ 0.31 d per decade (in July), and ∼ 0.43 d per decade (in August). After the 1990s the rate of increase in the frequency, length, and spatial extent has significantly accelerated, reaching unprecedented length and spatial extent after 2000 until the end of the analyzed period. Overall, the most active decades, in terms of HWs, were 1951–1960, 2001–2010, and 2011–2020, while the longest and most extensive (in terms of spatial extent) HWs were observed in July 2012, August 2015, and June 2019. Over the decade 2021–2020 there were up to 24 HWs recorded throughout the summer season. In terms of drought variability and trends, significant changes in the drought conditions (i.e., significant drying trend) have been observed over the eastern part of the country in August for SPEI3 and July for SPEI1, and the driest decade has been over the period 2011–2020.
The strongest correlation between hot and dry events has been observed for an “in-phase” relationship, indicating that for our analyzed region the soil-moisture memory does not play a significant role in the occurrence of heat waves throughout the summer months. Overall, there is an increase probability of co-occurrence of hot and dry events in the eastern part of the country, especially in June and July. Although the significant correlation between SPEI and extreme temperatures throughout concurrent months does not provide any information about the effect of antecedent drying on the occurrence of HWs, and thus it does not have a predictive skill, it does indicate a strong land–atmosphere coupling over the analyzed region. A lagged relationship has been observed only for 1-month lag (SPEI leading) over the southern (in July) and western parts of the country (in August). This is in agreement with recent studies (Stegehuis et al., 2021), which have shown that the antecedent soil moisture has a significant influence on the summer HWs, especially over the western part of Europe, whereas over the eastern parts of Europe the large-scale drivers explain the occurrence of extreme temperatures. The strongest changes, in terms of frequency and amplitude of hot and dry summers, were observed in the extra-Carpathian Mountain regions (e.g., south and southeastern part of Romania), mainly because the Carpathian Mountains act as a barrier for the Atlantic air masses, limiting their oceanic influences on the western and central parts of the country, which experience on average milder summers and heavier rainfalls, while the eastern part of the country is prone to rainfall deficit and higher temperatures, due to advection of hot and dry air either from the east or from the south.
The occurrence of HWs in Romania has been related to anticyclonic conditions and a higher frequency of blocking situations corroborated with daily maximum temperature anomalies up to 10 ∘C and with water vapor flux divergence, which showed a positive anomalous signal during hot and dry events. This is in agreement with previous studies for other regions (e.g., western part of Europe), which have shown that HWs tend to occur under the influence of anticyclonic circulation, which is conducive to intensification of the radiation flux and cloudless weather (Porebska and Zdunek, 2013; Tomczyk et al., 2017; Tomczyk and Bednorz, 2016). The occurrence of HWs over the analyzed region is stably correlated with the geopotential height centered over Romania and in the neighboring regions. The geopotential height also shows an increase in amplitude after the beginning of the 1990s, which follows the same temporal variability as the HWDI index and the AREA index, thus supporting the finding that the increase in the number of HWs over the last 2 decades could be explained, at least partially, by the increase in the regional geopotential height. Similar results have also been found for the central and western parts of Europe (Porebska and Zdunek, 2013; Tomczyk and Bednorz, 2016). In their study, Porebska and Zdunek (2013) have shown that heat waves over central Europe were often associated with an increased frequency of blocking situations over the Atlantic Ocean and eastern Europe. Similar results have been found by Tomczyk and Bednorz (2016), which have shown that the occurrence of HWs in the central part of Europe was mainly driven with positive anomalies of the Z500 over the analyzed region. Thus, a possible explanation regarding the increase in the frequency of HWs in Romania, over the past 2 decades, might be related to more frequent blocking situations and an increase in the geopotential height over the analyzed region.
Finally, we conclude that the analysis of both hot and dry events in connection with the large-scale atmospheric drivers provides a useful tool in order to find a plausible physical mechanism which can explain the changes in the frequency and amplitude of these extreme events. Our findings are in line with the recently published IPPC report (IPCC, 2021), which states that there is an overall global increase in the frequency of heat waves. Thus, our analysis of the variability and changes in heat waves and droughts and their combined effect could be used to improve adaptation strategies to extreme events and to improve resilience plans at the country level.
The data that support the findings of this study are available from the corresponding author upon reasonable request.
The supplement related to this article is available online at: https://doi.org/10.5194/nhess-22-1347-2022-supplement.
VN, PS, and MI designed the study, wrote the paper, and interpreted the results. All authors (i.e., VN, PS, and MI) contributed equally to the article.
The contact author has declared that neither they nor their co-authors have any competing interests.
Publisher's note: Copernicus Publications remains neutral with regard to jurisdictional claims in published maps and institutional affiliations.
Viorica Nagavciuc was supported by a grant of the Ministry of Research, Innovation and Digitization, CNCS/CCCDI–UEFISCDI, project number PN-III-P1-1.1-PD-2019-0469, within PNCDI III. Monica Ionita and Patrick Scholz are supported by the Helmholtz Association through the joint “Changing Earth – Sustaining our Future” (PoF IV) program of the AWI. Funding by the Helmholtz Climate Initiative REKLIM, the AWI Strategy Fund Project – PalEX, and the project S2: Improved parameterisations and numerics in climate models, of the collaborative Research Center TRR181 “Energy Transfer in the Atmosphere and Ocean” (DFG) – project number 274762653 is gratefully acknowledged.
The article processing charges for this open-access publication were covered by the Alfred Wegener Institute, Helmholtz Centre for Polar and Marine Research (AWI).
This paper was edited by Joaquim G. Pinto and reviewed by four anonymous referees.
Adamowski, K., Prokoph, A., and Adamowski, J.: Development of a new method of wavelet aided trend detection and estimation, Hydrol. Process., 23, 2686–2696, https://doi.org/10.1002/hyp.7260, 2009.
Bădăluță, C.-A., Perșoiu, A., Ionita, M., Nagavciuc, V., and Bistricean, P.-I.: Stable H and O isotope-based investigation of moisture sources and their role in river and groundwater recharge in the NE Carpathian Mountains, East-Central Europe, Isot. Environ. Healt. S., 55, 1–18, https://doi.org/10.1080/10256016.2019.1588895, 2019.
Bakke, S. J., Ionita, M., and Tallaksen, L. M.: The 2018 northern European hydrological drought and its drivers in a historical perspective, Hydrol. Earth Syst. Sci., 24, 5621–5653, https://doi.org/10.5194/hess-24-5621-2020, 2020.
Balting, D. F., AghaKouchak, A., Lohmann, G., and Ionita, M.: Northern Hemisphere drought risk in a warming climate, npj Clim. Atmos. Sci., 4, 61, https://doi.org/10.1038/s41612-021-00218-2, 2021.
Barriopedro, D., Fiscer, E. M., Luterbacher, J., Trigo, R. M., and García-Herrera, R.: The Hot Summer of 2010: Map of Europe, Science, 332, 220–224, https://doi.org/10.1126/science.1201224, 2011.
Busuioc, A., Caian, M., Cheval, S., Bojariu, R., Boroneant, C., Baciu, M., and Dumitrescu, A.: Variabilitatea și schimbarea climei în România, Pro Universitaria, București, 210 pp., ISBN 978-973-129-549-7, 2010.
Busuioc, A., Dobrinescu, A., Birsan, M. V., Dumitrescu, A., and Orzan, A.: Spatial and temporal variability of climate extremes in Romania and associated large-scale mechanisms, Int. J. Climatol., 35, 1278–1300, https://doi.org/10.1002/joc.4054, 2015.
Chelcea, S., Ionita, M., and Adler, M.-J.: Identification of dry periods in the dobrogea region, in: Civil and Environmental Engineering: Concepts, Methodologies, Tools, and Applications, chap. 12, 3 IRMA, IGI Global, 324–330 https://doi.org/10.4018/978-1-4666-9619-8.ch012, 2015.
Chen, Y. and Li, Y.: An Inter-comparison of Three Heat Wave Types in China during 1961–2010: Observed Basic Features and Linear Trends, Sci. Rep.-UK, 7, 2–11, https://doi.org/10.1038/srep45619, 2017.
Christidis, N., Jones, G. S., and Stott, P. A.: Dramatically increasing chance of extremely hot summers since the 2003 European heatwave, Nat. Clim. Change, 5, 46–50, https://doi.org/10.1038/nclimate2468, 2015.
Cornes, R. C., van der Schrier, G., van den Besselaar, E. J. M., and Jones, P. D.: An Ensemble Version of the E-OBS Temperature and Precipitation Data Sets, J. Geophys. Res.-Atmos., 123, 9391–9409, https://doi.org/10.1029/2017JD028200, 2018.
Croitoru, A. E. and Piticar, A.: Changes in daily extreme temperatures in the extra-Carpathians regions of Romania, Int. J. Climatol., 33, 1987–2001, https://doi.org/10.1002/joc.3567, 2013.
Croitoru, A.-E., Piticar, A., Ciupertea, A.-F., and Roşca, C. F.: Changes in heat waves indices in Romania over the period 1961–2015, Global Planet. Change, 146, 109–121, https://doi.org/10.1016/j.gloplacha.2016.08.016, 2016.
Dang, V. H., Tran, D. D., Cham, D. D., Hang, P. T. T., Nguyen, H. T., Truong, H. Van, Tran, P. H., Duong, M. B., Nguyen, N. T., Le, K. Van, Pham, T. B. T., and Nguyen, A. H.: Assessment of Rainfall Distributions and Characteristics in Coastal Provinces of the Vietnamese Mekong Delta under Climate Change and ENSO Processes, Water, 12, 1555, https://doi.org/10.3390/w12061555, 2020.
Della-Marta, P. M., Luterbacher, J., von Weissenfluh, H., Xoplaki, E., Brunet, M., and Wanner, H.: Summer heat waves over western Europe 1880–2003, their relationship to large-scale forcings and predictability, Clim. Dynam., 29, 251–275, https://doi.org/10.1007/s00382-007-0233-1, 2007.
Dima, V., Georgescu, F., Irimescu, A., and Mihailescu, D.: Valuri de caldura in Romania, PRINTECH, București, 89 pp., ISBN 978-606-23-0666-3, 2016.
Feng, S., Wu, X., Hao, Z., Hao, Y., Zhang, X., and Hao, F.: A database for characteristics and variations of global compound dry and hot events, Weather Clim. Extrem., 30, 100299, https://doi.org/10.1016/j.wace.2020.100299, 2020.
Fioravanti, G., Piervitali, E., and Desiato, F.: Recent changes of temperature extremes over Italy: an index-based analysis, Theor. Appl. Climatol., 123, 473–486, https://doi.org/10.1007/s00704-014-1362-1, 2016.
Gao, T., Yu, J., and Paek, H.: Impacts of four northern-hemisphere teleconnection patterns on atmospheric circulations over Eurasia and the Pacific, Theor. Appl. Climatol., 129, 815–831, https://doi.org/10.1007/s00704-016-1801-2, 2017.
Geirinhas, J. L., Russo, A., Libonati, R., Sousa, P. M., Miralles, D. G., and Trigo, R. M.: Recent increasing frequency of compound summer drought and heatwaves in Southeast Brazil, Environ. Res. Lett., 16, 034036, https://doi.org/10.1088/1748-9326/abe0eb, 2021.
Gocheva, A., Trifonova, L., Marinova, T., and Bocheva, L.: Extreme Hot Spells and Heat Waves on the Territory of Bulgaria, ResearchGate, https://www.researchgate.net/publication/240615319_Extreme_ Hot_Spells_and_Heat_Waves_on_the_Territory_of_Bulgaria (last access: 5 December 2021), 2006.
Grams, C. M., Binder, H., Pfahl, S., Piaget, N., and Wernli, H.: Atmospheric processes triggering the central European floods in June 2013, Nat. Hazards Earth Syst. Sci., 14, 1691–1702, https://doi.org/10.5194/nhess-14-1691-2014, 2014.
Hamed, K. H. and Ramachandra Rao, A.: A modified Mann-Kendall trend test for autocorrelated data, J. Hydrol., 204, 182–196, https://doi.org/10.1016/S0022-1694(97)00125-X, 1998.
Hersbach, H., Bell, B., Berrisford, P., Hirahara, S., Horányi, A., Muñoz-Sabater, J., Nicolas, J., Peubey, C., Radu, R., Schepers, D., Simmons, A., Soci, C., Abdalla, S., Abellan, X., Balsamo, G., Bechtold, P., Biavati, G., Bidlot, J., Bonavita, M., De Chiara, G., Dahlgren, P., Dee, D., Diamantakis, M., Dragani, R., Flemming, J., Forbes, R., Fuentes, M., Geer, A., Haimberger, L., Healy, S., Hogan, R. J., Hólm, E., Janisková, M., Keeley, S., Laloyaux, P., Lopez, P., Lupu, C., Radnoti, G., de Rosnay, P., Rozum, I., Vamborg, F., Villaume, S., and Thépaut, J.-N.: The ERA5 global reanalysis, Q. J. Roy. Meteor. Soc., 146, 1999–2049, https://doi.org/10.1002/qj.3803, 2020.
Horton, D. E., Johnson, N. C., Singh, D., Swain, D. L., Rajaratnam, B., and Diffenbaugh, N. S.: Contribution of changes in atmospheric circulation patterns to extreme temperature trends, Nature, 522, 465–469, https://doi.org/10.1038/nature14550, 2015.
Hustiu, M. C.: Cold and heat waves in the Barlad Plateau between 1961 and 2013, Riscuri si Catastr., 18, 31–42, 2016.
Ionita, M.: Interannual summer streamflow variability over Romania and its connection to large-scale atmospheric circulation, Int. J. Climatol., 35, 4186–4196, https://doi.org/10.1002/joc.4278, 2015.
Ionita, M., Lohmann, G., and Rimbu, N.: Prediction of spring Elbe discharge Based on stable teleconnections with winter global temperature and precipitation, J. Climate, 21, 6215–6226, https://doi.org/10.1175/2008JCLI2248.1, 2008.
Ionita, M., Lohmann, G., Rimbu, N., Chelcea, S., and Dima, M.: Interannual to decadal summer drought variability over Europe and its relationship to global sea surface temperature, Clim. Dynam., 38, 363–377, https://doi.org/10.1007/s00382-011-1028-y, 2012.
Ionita, M., Rimbu, N., Chelcea, S., and Patrut, S.: Multidecadal variability of summer temperature over Romania and its relation with Atlantic Multidecadal Oscillation, Theor. Appl. Climatol., 113, 305–315, https://doi.org/10.1007/s00704-012-0786-8, 2013.
Ionita, M., Dima, M., Lohmann, G., Scholz, P., and Rimbu, N.: Predicting the June 2013 European Flooding Based on Precipitation, Soil Moisture, and Sea Level Pressure, J. Hydrometeorol., 16, 598–614, https://doi.org/10.1175/JHM-D-14-0156.1, 2015.
Ionita, M., Tallaksen, L. M., Kingston, D. G., Stagge, J. H., Laaha, G., Van Lanen, H. A. J., Scholz, P., Chelcea, S. M., and Haslinger, K.: The European 2015 drought from a climatological perspective, Hydrol. Earth Syst. Sci., 21, 1397–1419, https://doi.org/10.5194/hess-21-1397-2017, 2017.
Ionita, M., Grosfeld, K., Scholz, P., Treffeisen, R., and Lohmann, G.: September Arctic sea ice minimum prediction – a skillful new statistical approach, Earth Syst. Dynam., 10, 189–203, https://doi.org/10.5194/esd-10-189-2019, 2019.
Ionita, M., Nagavciuc, V., Kumar, R., and Rakovec, O.: On the curious case of the recent decade, mid-spring precipitation deficit in central Europe, npj Clim. Atmos. Sci., 3, 49, https://doi.org/10.1038/s41612-020-00153-8, 2020.
Ionita, M., Caldarescu, D. E., and Nagavciuc, V.: Compound Hot and Dry Events in Europe: Variability and Large-Scale Drivers, Front. Clim., 3, 58, https://doi.org/10.3389/fclim.2021.688991, 2021a.
Ionita, M., Dima, M., Nagavciuc, V., Scholz, P., and Lohmann, G.: Past megadroughts in central Europe were longer, more severe and less warm than modern droughts, Commun. Earth Environ., 2, 61, https://doi.org/10.1038/s43247-021-00130-w, 2021b.
IPCC: Climate Change 2021: The Physical Science Basis. Contribution of Working Group I to the Sixth Assessment Report of the Intergovernmental Panel on Climate Change, edited by: Masson-Delmotte, V., Zhai, P., Pirani, A., Connors, S. L., Péan, C., Berger, S., Caud, N., Chen, Y., Goldfarb, L., Gomis, M. I., Huang, M., Leitzell, K., Lonnoy, E., Matthews, J. B. R., Maycock, T. K., Waterfield, T., Yelekçi, O., Yu, R., and Zhou, B., Cambridge University Press, https://www.ipcc.ch/report/ar6/wg1/downloads/report/IPCC_AR6_WGI_Citation.pdf (last access: 23 August 2021), in press, 2021.
Jeong, D. I., Yu, B., and Cannon, A. J.: Links between atmospheric blocking and North American winter cold spells in two generations of Canadian Earth System Model large ensembles, Clim. Dynam., 57, 2217–2231, https://doi.org/10.1007/s00382-021-05801-0, 2021.
Kautz, L.-A., Martius, O., Pfahl, S., Pinto, J. G., Ramos, A. M., Sousa, P. M., and Woollings, T.: Atmospheric blocking and weather extremes over the Euro-Atlantic sector – a review, Weather Clim. Dynam., 3, 305–336, https://doi.org/10.5194/wcd-3-305-2022, 2022.
Kingston, D. G., Lawler, D. M., and McGregor, G. R.: Linkages between atmospheric circulation, climate and streamflow in the northern North Atlantic: research prospects, Prog. Phys. Geog., 30, 143–174, https://doi.org/10.1191/0309133306pp471ra, 2006.
Kingston, D. G., Stagge, J. H., Tallaksen, L. M., and Hannah, D. M.: European-Scale Drought: Understanding Connections between Atmospheric Circulation and Meteorological Drought Indices, J. Climate, 28, 505–516, https://doi.org/10.1175/JCLI-D-14-00001.1, 2015.
Kong, Q., Guerreiro, S. B., Blenkinsop, S., Li, X.-F., and Fowler, H. J.: Increases in summertime concurrent drought and heatwave in Eastern China, Weather Clim. Extrem., 28, 100242, https://doi.org/10.1016/j.wace.2019.100242, 2020.
Laaha, G., Gauster, T., Tallaksen, L. M., Vidal, J.-P., Stahl, K., Prudhomme, C., Heudorfer, B., Vlnas, R., Ionita, M., Van Lanen, H. A. J., Adler, M.-J., Caillouet, L., Delus, C., Fendekova, M., Gailliez, S., Hannaford, J., Kingston, D., Van Loon, A. F., Mediero, L., Osuch, M., Romanowicz, R., Sauquet, E., Stagge, J. H., and Wong, W. K.: The European 2015 drought from a hydrological perspective, Hydrol. Earth Syst. Sci., 21, 3001–3024, https://doi.org/10.5194/hess-21-3001-2017, 2017.
Leonard, M., Westra, S., Phatak, A., Lambert, M., van den Hurk, B., McInnes, K., Risbey, J., Schuster, S., Jakob, D., and Stafford-Smith, M.: A compound event framework for understanding extreme impacts, WIREs Clim. Chang., 5, 113–128, https://doi.org/10.1002/wcc.252, 2014.
Lorenz, R., Stalhandske, Z., and Fischer, E. M.: Detection of a Climate Change Signal in Extreme Heat, Heat Stress, and Cold in Europe From Observations, Geophys. Res. Lett., 46, 8363–8374, https://doi.org/10.1029/2019GL082062, 2019.
Malinovic-Milicevic, S., Radovanovic, M. M., Stanojevic, G., and Milovanovic, B.: Recent changes in Serbian climate extreme indices from 1961 to 2010, Theor. Appl. Climatol., 124, 1089–1098, https://doi.org/10.1007/s00704-015-1491-1, 2016.
Mann, H. B.: Nonparametric Tests Against Trend, Econometrica, 13, 245–259, https://doi.org/10.2307/1907187, 1945.
Micu, D. M., Amihaesei, V. A., Milian, N., and Cheval, S.: Recent changes in temperature and precipitation indices in the Southern Carpathians, Romania (1961–2018), Theor. Appl. Climatol., 144, 691–710, https://doi.org/10.1007/s00704-021-03560-w, 2021.
Nagavciuc, V., Ionita, M., Perșoiu, A., Popa, I., Loader, N. J., and McCarroll, D.: Stable oxygen isotopes in Romanian oak tree rings record summer droughts and associated large-scale circulation patterns over Europe, Clim. Dynam., 52, 6557–6568, https://doi.org/10.1007/s00382-018-4530-7, 2019.
Najibi, N., Devineni, N., Lu, M., and Perdigão, R. A. P.: Coupled flow accumulation and atmospheric blocking govern flood duration, npj Clim. Atmos. Sci., 2, 19, https://doi.org/10.1038/s41612-019-0076-6, 2019.
Perkins, S. E. and Alexander, L. V: On the Measurement of Heat Waves, J. Climate, 26, 4500–4517, https://doi.org/10.1175/JCLI-D-12-00383.1, 2013.
Porebska, M. and Zdunek, M.: Analysis of extreme temperature events in Central Europe related to high pressure blocking situations in 2001–2011, Meteorol. Z., 22, 533–540, https://doi.org/10.1127/0941-2948/2013/0455, 2013.
Prăvălie, R., Bandoc, G., Patriche, C., and Tomescu, M.: Spatio-temporal trends of mean air temperature during 1961–2009 and impacts on crop (maize) yields in the most important agricultural region of Romania, Stoch. Env. Res. Risk A., 31, 1923–1939, https://doi.org/10.1007/s00477-016-1278-7, 2017.
Raymond, C., Horton, R. M., Zscheischler, J., Martius, O., AghaKouchak, A., Balch, J., Bowen, S. G., Camargo, S. J., Hess, J., Kornhuber, K., Oppenheimer, M., Ruane, A. C., Wahl, T., and White, K.: Understanding and managing connected extreme events, Nat. Clim. Change, 10, 611–621, https://doi.org/10.1038/s41558-020-0790-4, 2020.
Rey, G., Jougla, E., Fouillet, A., Pavillon, G., Bessemoulin, P., Frayssinet, P., Clavel, J., and Hémon, D.: The impact of major heat waves on all-cause and cause-specific mortality in France from 1971 to 2003, Int. Arch. Occ. Env. Hea., 80, 615–626, https://doi.org/10.1007/s00420-007-0173-4, 2007.
Ridder, N. N., Pitman, A. J., Westra, S., Ukkola, A., Do, H. X., Bador, M., Hirsch, A. L., Evans, J. P., Di Luca, A., and Zscheischler, J.: Global hotspots for the occurrence of compound events, Nat. Commun., 11, 5956, https://doi.org/10.1038/s41467-020-19639-3, 2020.
Rimbu, N., Dima, M., Lohmann, G., and Stefan, S.: Impacts of the North Atlantic Oscillation and the El Niño-Southern Oscillation on Danube river flow variability, Geophys. Res. Lett., 31, L23203, https://doi.org/10.1029/2004GL020559, 2004.
Rimbu, N., Lohmann, G., and Ionita, M.: Interannual to multidecadal Euro-Atlantic blocking variability during winter and its relationship with extreme low temperatures in Europe, J. Geophys. Res.-Atmos., 119, 13621–13636, https://doi.org/10.1002/2014JD021983, 2014.
Robinson, P. J.: On the Definition of a Heat Wave, J. Appl. Meteorol., 40, 762–775, https://doi.org/10.1175/1520-0450(2001)040<0762:OTDOAH>2.0.CO;2, 2001.
Russo, A., Gouveia, C. M., Dutra, E., Soares, P. M. M., and Trigo, R. M.: The synergy between drought and extremely hot summers in the Mediterranean, Environ. Res. Lett., 14, 014011, https://doi.org/10.1088/1748-9326/aaf09e, 2019.
Rusticucci, M., Barrucand, M., and Collazo, S.: Temperature extremes in the Argentina central region and their monthly relationship with the mean circulation and ENSO phases, Int. J. Climatol., 37, 3003–3017, https://doi.org/10.1002/joc.4895, 2017.
Scherrer, S. C., Croci-Maspoli, M., Schwierz, C., and Appenzeller, C.: Two-dimensional indices of atmospheric blocking and their statistical relationship with winter climate patterns in the Euro-Atlantic region, Int. J. Climatol., 26, 233–249, https://doi.org/10.1002/joc.1250, 2006.
Schubert, S. D., Wang, H., Koster, R. D., Suarez, M. J., and Groisman, P. Y.: Northern Eurasian heat waves and droughts, J. Climate, 27, 3169–3207, https://doi.org/10.1175/JCLI-D-13-00360.1, 2014.
Schubert, S. D., Stewart, R. E., Wang, H., Barlow, M., Berbery, E. H., Cai, W., Hoerling, M. P., Kanikicharla, K. K., Koster, R. D., Lyon, B., Mariotti, A., Mechoso, C. R., Müller, O. V., Rodriguez-Fonseca, B., Seager, R., Senevirante, S. I., Zhang, L., and Zhou, T.: Global meteorological drought: A synthesis of current understanding with a focus on sst drivers of precipitation deficits, J. Climate, 29, 3989–4019, https://doi.org/10.1175/JCLI-D-15-0452.1, 2016.
Sen, P. K.: Estimates of the Regression Coefficient Based on Kendall's Tau, J. Am. Stat. Assoc., 63, 1379–1389, https://doi.org/10.1080/01621459.1968.10480934, 1968.
Seneviratne, S. I., Nicholls, N., Easterling, D., Goodess, C. M., Kanae, S., Kossin, J., Luo, Y., Marengo, J., McInnes, K., Rahimi, M., Reichstein, M., Sorteberg, A., Vera, C., Zhang, X., Rusticucci, M., Semenov, V., Alexander, L. V, Allen, S., Benito, G., Cavazos, T., Clague, J., Conway, D., Della-Marta, P. M., Gerber, M., Gong, S., Goswami, B. N., Hemer, M., Huggel, C., van den Hurk, B., Kharin, V. V., Kitoh, A., Tank, A. M. G. K., Li, G., Mason, S., McGuire, W., van Oldenborgh, G. J., Orlowsky, B., Smith, S., Thiaw, W., Velegrakis, A., Yiou, P., Zhang, T., Zhou, T., and Zwiers, F. W.: Changes in Climate Extremes and their Impacts on the Natural Physical Environment, in Managing the Risks of Extreme Events and Disasters to Advance Climate Change Adaptation: Special Report of the Intergovernmental Panel on Climate Change, edited by: Field, C. B., Dahe, Q., Stocker, T. F., and Barros, V., Cambridge University Press, Cambridge, 109–230, https://doi.org/10.1017/CBO9781139177245.006, 2012.
Sfîcă, L., Croitoru, A.-E., Iordache, I., and Ciupertea, A.-F.: Synoptic Conditions Generating Heat Waves and Warm Spells in Romania, Atmosphere-Basel, 8, 50, https://doi.org/10.3390/atmos8030050, 2017.
Shevchenko, O., Lee, H., Snizhko, S., and Mayer, H.: Long-term analysis of heat waves in Ukraine, Int. J. Climatol., 34, 1642–1650, https://doi.org/10.1002/joc.3792, 2014.
Smoyer-Tomic, K. E., Kuhn, R., and Hudson, A.: Heat Wave Hazards: An Overview of Heat Wave Impacts in Canada, Nat. Hazards, 28, 465–486, https://doi.org/10.1023/A:1022946528157, 2003.
Spinoni, J., Naumann, G., Vogt, J. V., and Barbosa, P.: The biggest drought events in Europe from 1950 to 2012, J. Hydrol. Reg. Stud., 3, 509–524, https://doi.org/10.1016/j.ejrh.2015.01.001, 2015.
Stegehuis, A. I., Vogel, M. M., Vautard, R., Ciais, P., Teuling, A. J., and Seneviratne, S. I.: Early Summer Soil Moisture Contribution to Western European Summer Warming, J. Geophys. Res.-Atmos., 126, e2021JD034646, https://doi.org/10.1029/2021JD034646, 2021.
Swain, D. L., Horton, D. E., Singh, D., and Diffenbaugh, N. S.: Trends in atmospheric patterns conducive to seasonal precipitation and temperature extremes in California, Sci. Adv., 2, 1–14, https://doi.org/10.1126/sciadv.1501344, 2016.
Tibaldi, S. and Molteni, F.: On the operational predictability of blocking, Tellus A, 42, 343–365, 1990.
Tomczyk, A. M. and Bednorz, E.: Heat waves in Central Europe and their circulation conditions, Int. J. Climatol., 36, 770–782, https://doi.org/10.1002/joc.4381, 2016.
Tomczyk, A. M., Półrolniczak, M., and Bednorz, E.: Circulation Conditions' Effect on the Occurrence of Heat Waves in Western and Southwestern Europe, Atmosphere-Basel, 8, 31, https://doi.org/10.3390/atmos8020031, 2017.
Tomozeiu, R., Stefan, S., and Busuioc, A.: Winter precipitation variability and large-scale circulation patterns in Romania, Theor. Appl. Climatol., 81, 193–201, https://doi.org/10.1007/s00704-004-0082-3, 2005.
Twardosz, R. and Kossowska-Cezak, U.: Exceptionally hot summers in Central and Eastern Europe (1951-2010), Theor. Appl. Climatol., 112, 617–628, https://doi.org/10.1007/s00704-012-0757-0, 2013.
Vaideanu, P., Dima, M., Pirloaga, R., and Ionita, M.: Disentangling and quantifying contributions of distinct forcing factors to the observed global sea level pressure field, Clim. Dynam., 54, 1453–1467, https://doi.org/10.1007/s00382-019-05067-7, 2020.
Vanderlinden, K., Giráldez, J. V., and van Meirvenne, M.: Spatial estimation of reference evapotranspiration in Andalusia, Spain, J. Hydrometeorol., 9, 242–255, https://doi.org/10.1175/2007JHM880.1, 2008.
Van Lanen, H. A. J. H. A. J., Laaha, G., Kingston, D. G. D. G., Gauster, T., Ionita, M., Vidal, J.-P. J. P., Vlnas, R., Tallaksen, L. M. L. M., Stahl, K., Hannaford, J., Delus, C., Fendekova, M., Mediero, L., Prudhomme, C., Rets, E., Romanowicz, R. J. R. J., Gailliez, S., Wong, W. K. W. K., Adler, M. J. M.-J., Blauhut, V., Caillouet, L., Chelcea, S., Frolova, N., Gudmundsson, L., Hanel, M., Haslinger, K., Kireeva, M., Osuch, M., Sauquet, E., Stagge, J. H. J. H., and Van Loon, A. F. A. F.: Hydrology needed to manage droughts: the 2015 European case, Hydrol. Process., 30, 3097–3104, https://doi.org/10.1002/hyp.10838, 2016.
Vicente-Serrano, S. M., and López-Moreno, J. I.: Nonstationary influence of the North Atlantic Oscillation on European precipitation, J. Geophys. Res.-Atmos., 113, D20120, https://doi.org/10.1029/2008JD010382, 2008.
Vicente-Serrano, S. M., Beguería, S., and López-Moreno, J. I.: A multiscalar drought index sensitive to global warming: The standardized precipitation evapotranspiration index, J. Climate, 23, 1696–1718, https://doi.org/10.1175/2009JCLI2909.1, 2010.
Zscheischler, J. and Seneviratne, S. I.: Dependence of drivers affects risks associated with compound events, Sci. Adv., 3, 1–11, https://doi.org/10.1126/sciadv.1700263, 2017.
Zscheischler, J., Westra, S., Van Den Hurk, B. J. J. M., Seneviratne, S. I., Ward, P. J., Pitman, A., Aghakouchak, A., Bresch, D. N., Leonard, M., Wahl, T., and Zhang, X.: Future climate risk from compound events, Nat. Clim. Change, 8, 469–477, https://doi.org/10.1038/s41558-018-0156-3, 2018.