the Creative Commons Attribution 4.0 License.
the Creative Commons Attribution 4.0 License.
 | 04 Apr 2022
Brief communication: Introducing rainfall thresholds for landslide triggering based on artificial neural networks
Pierpaolo Distefano
Pietro Scandura
Antonino Cancelliere
In this communication we show how the use of artificial neural networks (ANNs) can improve the performance of the rainfall thresholds for landslide early warning. Results for Sicily (Italy) show how performance of a traditional rainfall event duration and depth power law threshold, yielding a true skill statistic (TSS) of 0.50, can be improved by ANNs (TSS = 0.59). Then we show how ANNs allow other variables to be easily added, like peak rainfall intensity, with a further performance improvement (TSS = 0.66). This may stimulate more research on the use of this powerful tool for deriving landslide early warning thresholds.
- Article
(2905 KB) - Full-text XML
- BibTeX
- EndNote


Landslides triggered by rainfall can cause damage to infrastructure and buildings and, in the worst scenario, even lead to human losses (Froude and Petley, 2018). Commonly, rainfall thresholds indicating the conditions under which landslides can potentially occur are a key component of warning systems aimed at protecting the population from a possible landslide event. In most cases, thresholds are determined using empirical methods that link characteristics of precipitation, such as duration D and mean intensity I or rainfall depth , to landslide occurrence (Caine, 1980). Rainfall thresholds are usually determined by assuming a predetermined parametric equation, which in most cases is a power law (Guzzetti et al., 2008). In general, for a given set of predictors, the choice of a predetermined threshold equation form (e.g. power law) can potentially limit its performance because the informative content of the considered predictor variables may not be exploited to the fullest. This holds true all the more so when searching for alterative or additional variables with the aim of improving the performances of the thresholds, such as antecedent rainfall conditions (Glade et al., 2000), water storage, and soil moisture data (Bogaard and Greco, 2018; Marino et al., 2020). For the case of E–D or I–D thresholds the use of a power law is customary, and its rationale has also been verified based on a combined stochastic and physics-based approach (Peres and Cancelliere, 2014). In contrast, in the case of either a different pair of variables or the analysis of more than two variables, there is no analogous prominent parametric form of the threshold equation. For instance, as reported by Conrad et al. (2021), alternative formulas have been considered for hydrometeorological thresholds – i.e. based on rainfall and soil moisture or catchment storage – including linear and bilinear functions, interpolated line segments without a mathematical function, cut-off values for integration of antecedent conditions with traditional rainfall thresholds, and more complex logical operators. The use of predetermined parametric forms can finally jeopardise the scientific soundness of comparisons between thresholds using different sets of predictors (e.g. rainfall thresholds vs. thresholds using soil moisture). Artificial neural networks (ANNs), belonging to artificial intelligence or machine learning techniques, allow the mentioned limitation to potentially be removed as they are universal approximators, i.e. capable of reproducing any continuous function (Haykin, 1999).
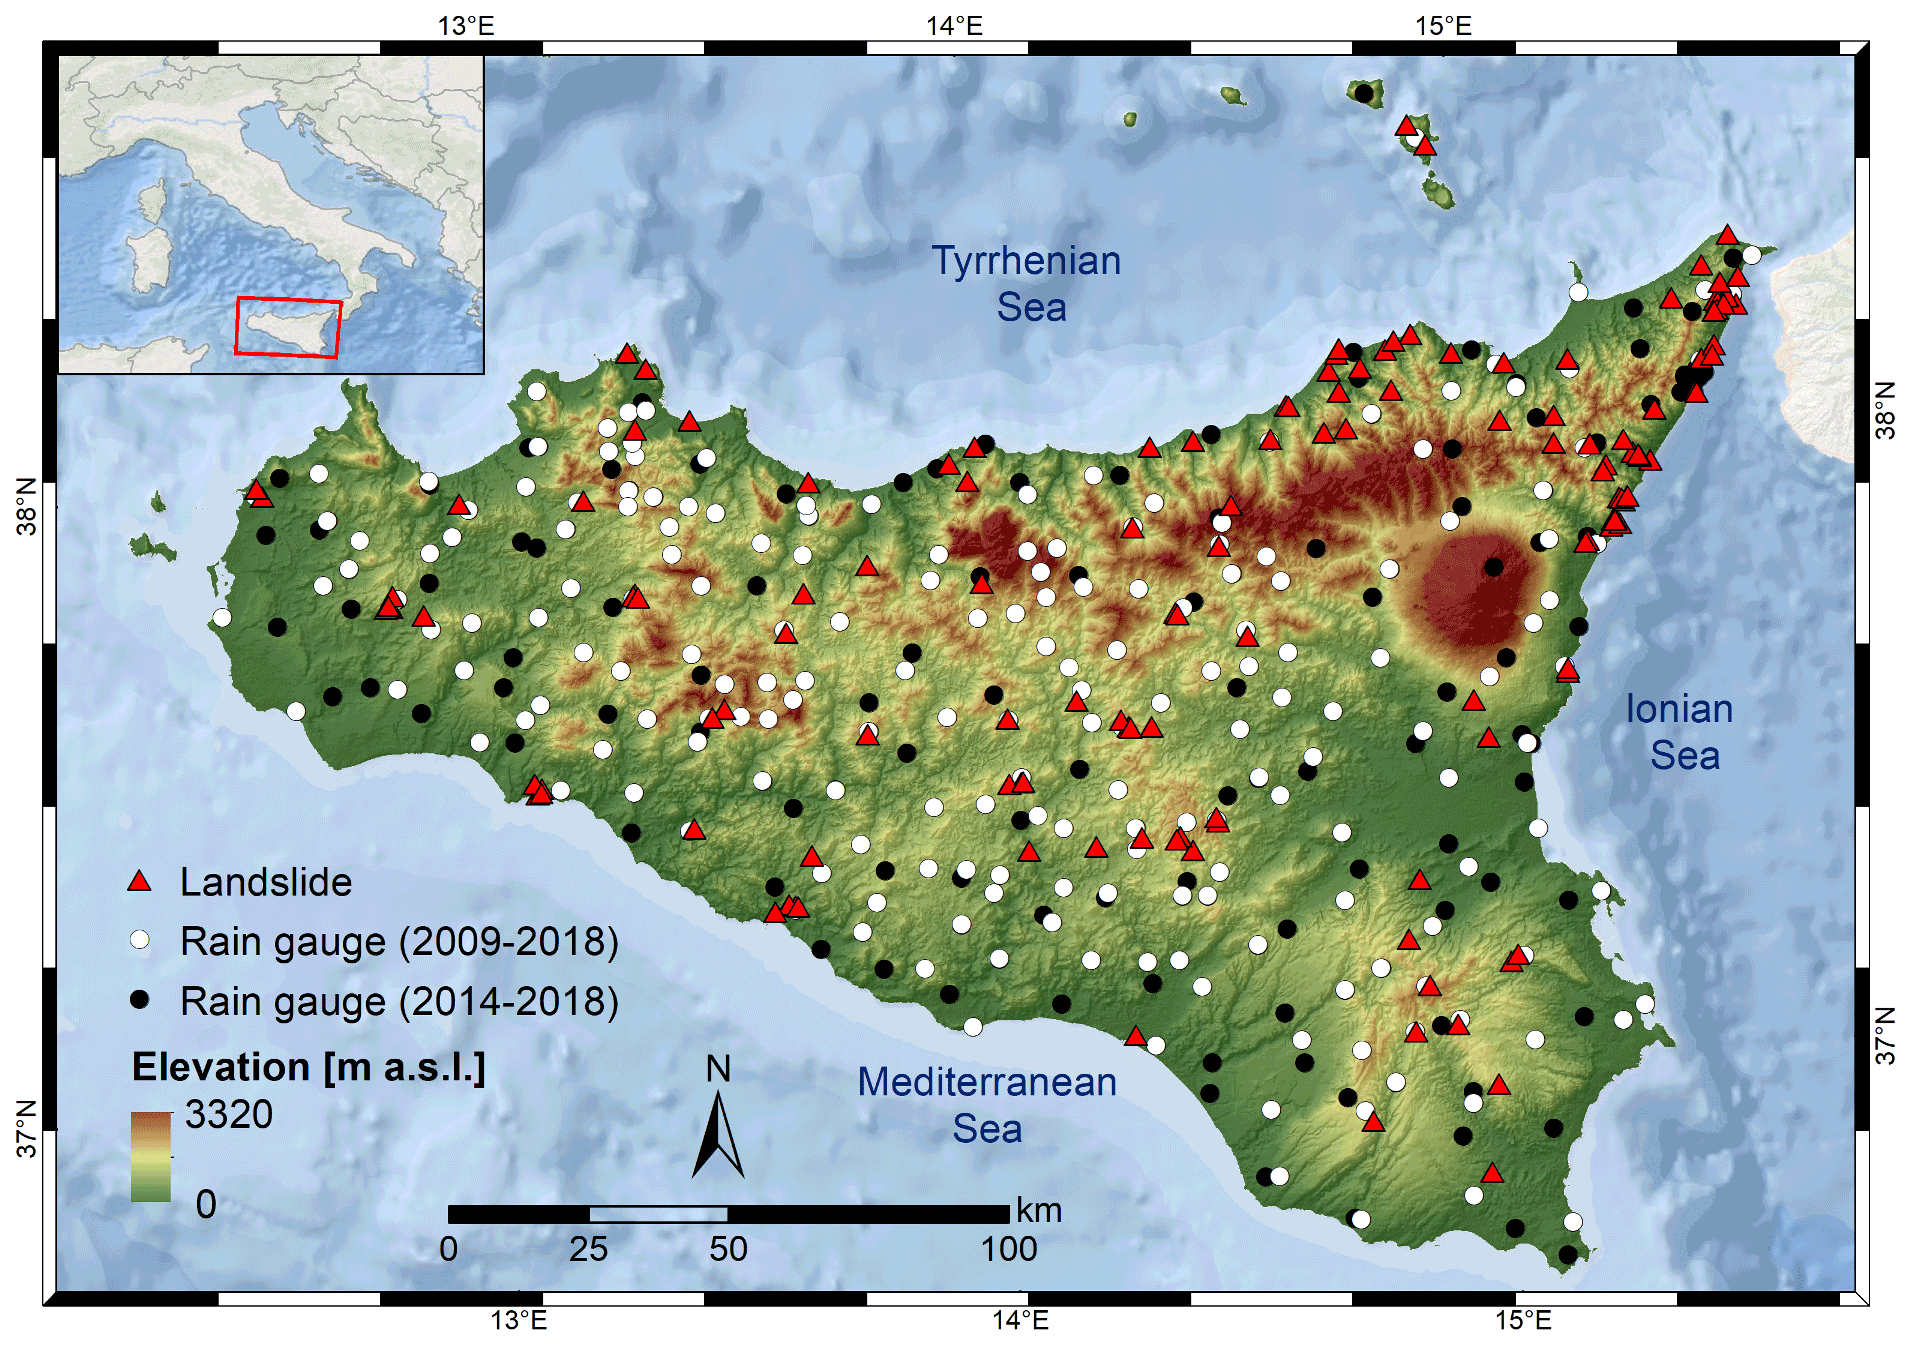
Figure 1Elevation map showing location of landslides and rain gauges in Sicily considered in this study. The rainfall data set was built by joining data sets managed by different authorities and landslides from the FraneItalia inventory (Calvello and Pecoraro, 2018).
Up to now, a number of studies have used the potentiality of ANNs and of other machine learning techniques in landslide analysis. Many studies focused on susceptibility mapping and individual slope instability have exploited the potentialities of ANNs (Reichenbach et al., 2018). In other studies, the focus is on the prediction of individual deep-seated landslide displacements by machine learning algorithms using detailed in situ data (e.g. van Natijne et al., 2020). Based on this briefly outlined state of the art, it appears that ANN skills are mainly used to create susceptibility maps and/or in local early warning systems, while application for territorial landslide early warning (Piciullo et al., 2018) has not been investigated so far. In this communication, we present our preliminary investigations showing how ANNs can allow landslide early warning thresholds to be derived with higher performances than traditional rainfall intensity–duration power law thresholds.
We refer to the case study of Sicily (Fig. 1), one of the 20 regions of Italy. We have retrieved hourly rainfall from 306 rain gauges distributed within the region, managed by the regional water observatory (Osservatorio delle Acque, OdA), the SIAS (Sicilian Agro-meteorological Information Service), and the Regional Civil Protection Department (DRPC). Figure 1 shows the rain gauge locations for the period January 2009–October 2018 (green dots) and those available only for the period January 2014–October 2018 (black dots).
Landslide data are retrieved from the FraneItalia database compiled by Calvello and Pecoraro (2018) (see locations in Fig. 1). This database contains information on landslides that occurred in Italy from January 2010 to December 2019 and is available online (https://franeitalia.wordpress.com/database/, last access: 17 November 2021). Thus, our analysis is based on the period from January 2010 to October 2018, where both rainfall and landslide information is available. Some landslide events have been removed from the analysis. In particular, this was done based on the landslide typology, material, and type of trigger. Only events having a “rainfall” or “rainfall and other” trigger have been considered so as to exclude landslides due to earthquakes and anthropogenic activities. Rockfalls have been removed from the analysis as well as their triggering cannot always be linked to rainfall. Rainfall data have been checked in order to remove suspicious rainfall data. In particular, where hourly rainfall exceeded 250 mm – corresponding to about one-third of mean yearly rainfall for Sicily and to about 2 times the maximum rainfall ever recorded in 1 h – the series has been visually inspected, and in the case of an evident error (rain gauge malfunction) the whole rainfall event surrounding the peak has been removed. In light of the above, a flow chart representing the applied methodology is shown in Fig. 2a.
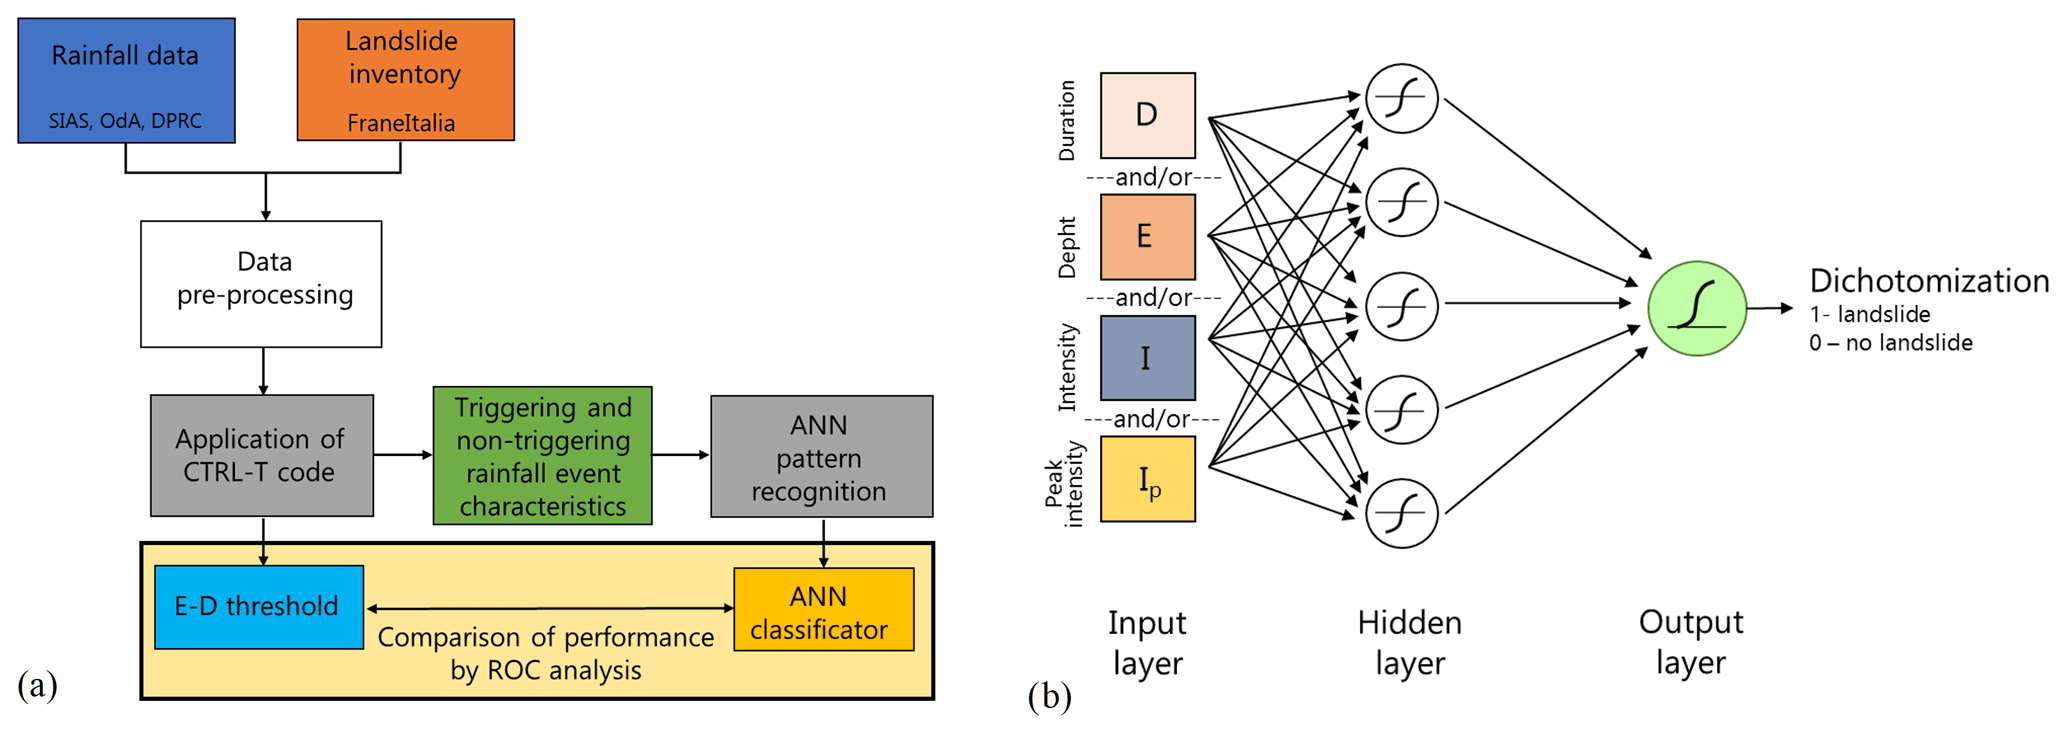
Figure 2Flow chart illustrating the methodology (a) and the artificial neural network architecture considered (b).
First, pre-processed precipitation and landslide data were inputted to the CTRL-T (Calculation of Thresholds for Rainfall-induced Landslides-Tool) code (Melillo et al., 2018). The software consists of a code in the R language and allows rainfall events to be reconstructed and characterised by the following variables: duration D, mean intensity I, total depth , and peak intensity Ip (defined as the maximum hourly intensity occurring during a rainfall event). The most probable rainfall conditions associated with each landslide event (multiple rain gauges available for a given location) are computed by the software based on distance between the rain gauge and the landslide location as well as the characteristics of the reconstructed rainfall event. In particular, for a given landslide, all rain gauges within a circle of radius Rb specified by the user are searched, and, when more than one rain gauge is located within the circle, the rainfall events from each rain gauge are weighted based on the rain gauge–landslide distance and the rainfall event characteristics (cumulated rainfall and duration). The weight is used to estimate the “probability” associated with each rainfall condition potentially attributable to each landslide event. In particular, the probability, in the case of multiple rainfall conditions, is computed by dividing each weight by the sum. CTRL-T then determines the triggering rainfall conditions of each landslide as those corresponding to the highest probability. Finally, the code provides power law E–D thresholds for different levels of non-exceedance frequency of triggering events. The software allows the user to set different values of the parameters to reconstruct rainfall events in order to take into account seasonality, i.e. different average evapotranspiration rates in different periods of the year. Specifically, following the study by Melillo et al. (2016), we assumed that in the warm season CW (April–October) the minimum dry period separating two rainfall events is P4warm=48 h, while in the cold season a longer period is assumed (P4cold=96 h). The rain gauge sensitivity is Gs=0.1 mm. The rain gauge search radius has been fixed to Rb=16 km. A binary coding has been attributed to each rainfall event, flagging triggering events as a target with a value of 1 and a non-triggering event with a null value. Application of the CTRL-T software allowed the rainfall events associated with the 144 landslide events in the inventory (triggering events) and 47 398 non-triggering events to be reconstructed. For 103 events, only the day of triggering was known, while for the remainder a more precise indication of the triggering instant was available. In the first case, the triggering instant was attributed to the end of the day, in the second case to the instant of peak rainfall within the time interval when the triggering occurred. Furthermore, for the 144 landslide events, detailed information on the typology was available only in 18 cases, 10 of which were “fall of more than one material”, 4 were “flow”, and the remaining 4 were “slide”. The average distance between the rain gauge and landslide for the 144 events is about 5 km; thus the maximum value of Rb=16 km was seldom reached.
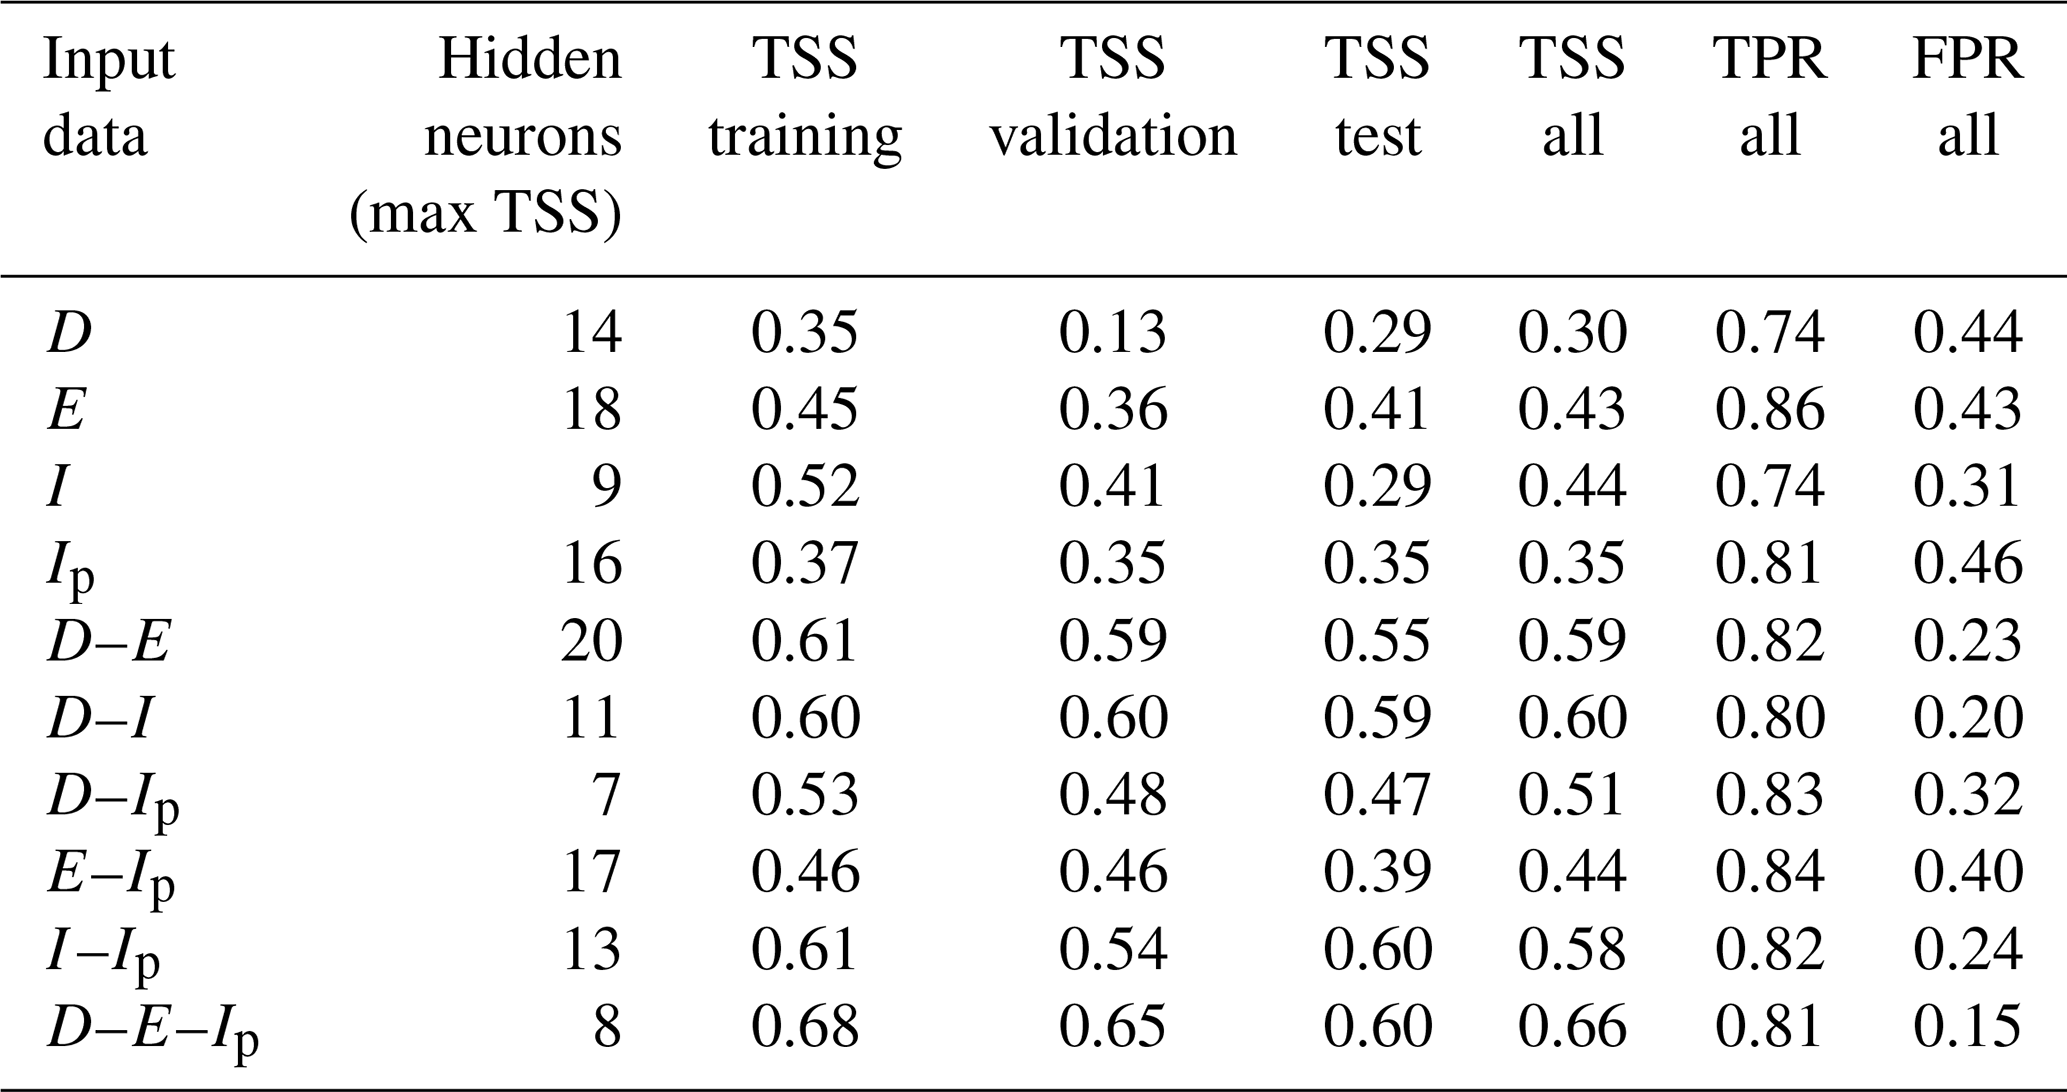
Table 1Results of tests with ANNs, showing the optimal number of hidden neurons (a number from 5 to 20 has been tested) and the true skill statistics (TSSs) for the entire, the training, the validation, and the test data sets. Values in the table are compared to TSS0=0.50, which is the maximum value associated with a D–E power law threshold.
The characteristics of the events were used as input variables to ANNs devised for pattern recognition, as implemented within the neural net pattern recognition tool in MATLAB®. The neural network, characterised by a feed-forward structure, is composed of three layers: input, hidden, and output (Fig. 2b). The input layer takes the series of predictors and sends them to the hidden layer, where the series are combined and transformed though a specific activation function. Two different activation functions have been considered – a tan-sigmoid function f(n) for the hidden layer and a log-sigmoid g(n) for the output layer:
The ANNs have been trained through the scaled conjugate gradient backpropagation algorithm, while cross-entropy was assumed to be the performance function for training. Denoting the generic ANN output with yi (assuming values in the open interval between 0 and 1) and the binary target with ti, i=1, 2, …, N, the cross-entropy function F heavily penalises inaccurate predictions and assigns minimum penalties for correct predictions:
The ability to distinguish triggering events from non-triggering events was measured using the confusion matrix, a double-entry table in which it is possible to identify true positives (TPs; triggering events correctly classified), true negatives (TNs; non-triggering events correctly classified), false negatives (FNs; triggering events classified as non-triggering), and false positives (FPs; non-triggering events classified as triggering). Through the confusion matrix it is possible to determine the true positive rate (TPR) and the false positive rate (FPR) as well as their difference, known as the true skill statistic (TSS), which is widely used for threshold determination (Peres and Cancelliere, 2021):
The output of the ANNs is transformed into a binary code (dichotomisation) by assuming a value of 1 (ANN predicts a landslide) when the output is greater than a threshold value and a value of 0 otherwise. We then identify the mentioned threshold value by maximising the TSS, which has the advantage of not being affected by unbalanced training data set issues with respect to other indices, such as accuracy ACC = (TP + TN)/(TP + TN + FP + FN) – a performance metric used as default by many ANN training software tools. Maximisation of TSS implicitly assumes that all entries of the confusion matrix have the same utility. Quantifying the loss of a false negative with respect to a false positive is a complex task that goes beyond the aim of the present analysis and that has been faced only in very recent studies (cf. Sala et al., 2021). Results from ANNs are compared with rainfall duration–depth power law thresholds derived through the maximisation of TSS, i.e. again, analysing both triggering and non-triggering events.
For our analysis different combinations of input data (duration D, intensity I, total depth E, and peak intensity Ip) and different architectures, changing the number of hidden neurons, were tested. In particular, the following input variable configurations have been investigated: (1) D; (2) E; (3) I; (4) Ip; (5) D and E; (6) D and I; (7) D and Ip; (8) E and Ip; (9) I and Ip; (10) D, E, and Ip. The listed input configurations are indeed all possible ones, except those combining both E and I with duration D. This has been done because the two pairs D–I and D–E have the same informative content by construction, as confirmed by the fact that the performances of the D–I and D–E neural networks do not differ significantly (see Table 1); slight differences may occur as ANNs can be sensitive to how a set of variables with the same information content as another are presented to the network. All the data have been inputted taking their natural logarithms. Different networks have been considered, varying the number of hidden neurons from 5 to 20, in order to search for the best value, i.e. the one yielding the highest TSS.
The entire data set of rainfall events was divided into a training, a validation, and a test data set, selected randomly from the entire data set, in the proportions of 70 %, 15 %, and 15 %. The training data set is data used to fit the model, while the validation provides an unbiased evaluation of a model fit on the training data set while tuning model hyperparameters, such as the number of training iterations. Finally, the test data set provides an unbiased evaluation of a final model fit. This subdivision allowed the early-stopping criterion to be applied to prevent overfitting. According to this criterion, the training of the neural network is stopped when the values of the performance function calculated on the validation data set start to get worse. In order to ensure representativeness of the data randomly assigned to the training, validation, and test data sets, results where the TSS in the test or the validation data set are greater than the TSS in the training data set are removed from the analysis. Once the network is developed considering these three data sets and early stopping, it is “frozen”, and metrics from the confusion matrix (e.g. TSS) can be computed with that network on the entire data set, and the corresponding performances can be considered generalisable. Thus, when comparing our proposed approach with the traditional one, we focus on these last performances (labelled “all”). This seems to be the most appropriate way to proceed as the I–D power law and its performance are determined with respect to the entire data set.
Application of the CTRL-T software has allowed the data set of triggering and non-triggering events to be built and the threshold to be derived according to the so-called frequentist method (based on triggering events only). Considering a non-exceedance frequency for triggering events equal to 5 %, the threshold from the software is as follows:
This threshold is lower than the one obtained for Sicily by Gariano et al. (2015) yet comparable with an updated one derived by Melillo et al. (2016). Specifically, thresholds reported on the two studies cited are respectively the following (non-exceedance frequency is again 5 %):
It should be mentioned that these thresholds were both derived from rainfall data sets covering the period July 2002–December 2012, which is different from the one we have considered in our analysis. The first threshold has been derived with an earlier version of the CTRL-T code, which required manual selection of the most representative rain gauge (Melillo et al., 2015), while the second study derives from the updated algorithm, where this selection is made automatically.
These thresholds however are not comparable with those to derive with the proposed ANN approach because non-triggering events are neglected. We have hence derived the power law threshold corresponding to the maximum TSS – outside of the CTRL-T software, via the MATLAB® global optimisation toolbox – obtaining the following result:
which has a TSS = TSS0 = 0.50, obtained from a TPR = 0.76 and a FPR = 0.26. The threshold has a lower intercept but a higher slope, so, after a duration of about 5 h, it is above the one given in Eq. (7).
Table 1 shows the results obtained from the 160 neural network configurations tested (10 different input layers and 16 different numbers of hidden neurons). In particular, the table shows, for each set of input variables, the optimal number of hidden neurons corresponding to the maximum TSS for the training, the validation, the test, and the entire data set (“all”). For the entire data set also the TPR and the FPR are shown. As can be seen, for most of the input configurations, the TSS for the training and validation data sets is generally quite close. This proves that overfitting has been sufficiently prevented thanks to the early-stopping criterion; otherwise the performance in the training data set would have been significantly higher than those in the validation and the test data set.
As can be seen from Table 1, using only one input variable, the performances are significantly lower than those obtained from the use of the power law threshold of Eq. (10): however, for the variable with the highest informative content, mean rainfall intensity I, the TSS = 0.44 is quite close to TSS0 = 0.50. When using input variables in pairs, performances increase significantly. Notably, in the case of the pairs D–I and D–E – i.e. the same variables used for the power law – the TSS = 0.59 (0.60), which is significantly higher than TSS0. This is obtained by both an increase in the TPR (true positive rate) and a decrease in the FPR (false positive rate). The fact that with same input data the neural network provides significantly better performances than the power law proves that the use of a predetermined parametric form for the threshold equation does not allow the informative content of the input variables to be exploited to the fullest, while the flexibility of ANNs allows a better classification to be achieved. In other words, one of the shortcomings of a power law is that the same equation is usually assumed valid for all the durations, while ANNs are more flexible. Finally, adding a third variable (network input D–E–Ip), a further improvement is obtained (TSS = 0.66), mainly due to a decrease in the FPR. This result demonstrates how neural networks can be an aid in searching additional variables that can provide a more reliable dynamic prediction of landslide-triggering conditions. In particular, in this case, it has been shown that peak intensity may have important informative content, an aspect that has perhaps not been sufficiently investigated in the literature, even though some researchers have found that the addition of a third variable is a possible way to derive thresholds that better adapt to complex case studies (e.g. Rosi et al., 2021).
The identification of rainfall thresholds indicating landslide-triggering conditions is a key step for implementing territorial landslide early warning systems. Commonly, thresholds are searched in a limited space, i.e. constrained to a predetermined parametric form, which is generally a power law linking rainfall event, duration D, and mean intensity I (or total depth ). In this communication we have shown that choosing a predetermined form for the law of the threshold can potentially limit the performance of the empirical model and how artificial neural networks are a valuable tool to overcome this limitation. The analysis, referring to the case study of Sicily, has shown that an E–D power law threshold has a maximum true skill statistic of TSS = TSS0 = 0.50. On the other hand, the classifier based on neural networks, using the same pair of input variables, yielded a significantly greater TSS = 0.60. It has also been shown how neural networks allow the potential information content of other variables to be easily explored and hence provide a way to improve predictive performance. For instance, it has been shown that the inclusion of peak rainfall intensity as an additional variable can lead to an improvement of performance. It is important that when training neural networks, generalisation capabilities are ensured, for instance by the early-stopping technique. Overfitting is not an issue for the traditional approach based on the power law – or any other parametric equation – as in general the number of free parameters is very low (two for a power law). This may be a drawback for neural networks even though it forces one to consider both triggering and non-triggering events, which is fundamental for obtaining thresholds with acceptable statistical characteristics (Peres and Cancelliere, 2021). Another possible disadvantage of neural networks with respect to predetermined-form thresholds is also represented by the fact that it may be difficult to express the neural network classifier as a simple equation. This could limit the practical implementation of triggering thresholds based on neural networks, which could be perceived as impractical by practitioners. However, this limit can for instance be overcome by providing a user-friendly software to the end user.
Landslide data from the FraneItalia database (Calvello and Pecoraro, 2018) are available from https://franeitalia.wordpress.com/database/ (Calvello and Pecoraro, 2021), while some of the rainfall data are available from the websites of the Servizio Informativo Agreometeorologico Siciliano (SIAS) (http://www.sias.regione.sicilia.it/; SIAS, 2022) and the Osservatorio delle Acque – Regione Sicilia (http://www.acq.isprambiente.it/annalipdf/, ISPRA, 2022) for Sicily.
DJP designed the research. PD and DJP conducted the analyses and wrote the paper. AC, PS, and DJP supervised the research and critically revised the manuscript.
At least one of the (co-)authors is a member of the editorial board of Natural Hazards and Earth System Sciences. The peer-review process was guided by an independent editor, and the authors also have no other competing interests to declare.
Publisher's note: Copernicus Publications remains neutral with regard to jurisdictional claims in published maps and institutional affiliations.
The authors acknowledge Paolo Tarolli (handling editor) and the referees, Samuele Segoni, Luca Mauri, and the anonymous one, for their constructive comments.
Pierpaolo Distefano's doctoral programme is funded by the “Notice 2/2019 for financing the PhD regional grant in Sicily” as part of the Operational Programme of European Social Funding 2014–2020 (PO FSE 2014–2020, CUP E65E19000830002). The research has been partially conducted within the following projects: LIFE 17 CCA/IT/000115 SimetoRES, funded by the CINEA of the European Commission, and reCITY – Resilient City – Everyday Revolution, funded by the Programma Operativo Nazionale “Ricerca e Innovazione” 2014–2020 (ARS01_00592, CUP B69C21000390005). APCs were funded by “fondi di ateneo 2020–2022, Università di Catania, linea Open Access”.
This paper was edited by Paolo Tarolli and reviewed by Samuele Segoni, Luca Mauri, and one anonymous referee.
Bogaard, T. and Greco, R.: Invited perspectives: Hydrological perspectives on precipitation intensity-duration thresholds for landslide initiation: proposing hydro-meteorological thresholds, Nat. Hazards Earth Syst. Sci., 18, 31–39, https://doi.org/10.5194/nhess-18-31-2018, 2018.
Caine, N.: The Rainfall Intensity-Duration Control of Shallow Landslides and Debris Flows, Soc. Swedish Ann. Geogr. Geogr. Phys., 62, 23–27, 1980.
Calvello, M. and Pecoraro, G.: FraneItalia: a catalog of recent Italian landslides, Geoenviron. Disast., 5, 13, https://doi.org/10.1186/s40677-018-0105-5, 2018.
Calvello, M. and Pecoraro, G.: The FraneItalia database, FraneItalia [data set], https://franeitalia.wordpress.com/database/, last access: 17 November 2021.
Conrad, J. L., Morphew, M. D., Baum, R. L., and Mirus, B. B.: HydroMet: A New Code for Automated Objective Optimization of Hydrometeorological Thresholds for Landslide Initiation, Water, 13, 1752, https://doi.org/10.3390/W13131752, 2021.
Froude, M. J. and Petley, D. N.: Global fatal landslide occurrence from 2004 to 2016, Nat. Hazards Earth Syst. Sci., 18, 2161–2181, https://doi.org/10.5194/nhess-18-2161-2018, 2018.
Gariano, S. L., Brunetti, M. T., Iovine, G., Melillo, M., Peruccacci, S., Terranova, O., Vennari, C., and Guzzetti, F.: Calibration and validation of rainfall thresholds for shallow landslide forecasting in Sicily, southern Italy, Geomorphology, 228, 653–665, https://doi.org/10.1016/j.geomorph.2014.10.019, 2015.
Glade, T., Crozier, M., and Smith, P.: Applying probability determination to refine landslide-triggering rainfall thresholds using an empirical “Antecedent Daily Rainfall Model”, Pure Appl. Geophys., 157, 1059–1079, https://doi.org/10.1007/s000240050017, 2000.
Guzzetti, F., Peruccacci, S., Rossi, M., and Stark, C. P.: The rainfall intensity-duration control of shallow landslides and debris flows: An update, Landslides, 5, 3–17, https://doi.org/10.1007/s10346-007-0112-1, 2008.
Haykin, S.: Neural Networks- A Comprehensive Foundation, 2nd Edn., Prentice Hall, ISBN 10 8120323734, ISBN 13 978-8120323735, 1999.
ISPRA – Istituto Superiore per la Protezione e la Ricerca Ambientale: Annali idrologici Storici, http://www.acq.isprambiente.it/annalipdf/, last access: 31 March 2022.
Marino, P., Peres, D. J., Cancelliere, A., Greco, R., and Bogaard, T. A.: Soil moisture information can improve shallow landslide forecasting using the hydrometeorological threshold approach, Landslides, 17, 2041–2054, https://doi.org/10.1007/s10346-020-01420-8, 2020.
Melillo, M., Brunetti, M. T., Peruccacci, S., Gariano, S. L., and Guzzetti, F.: An algorithm for the objective reconstruction of rainfall events responsible for landslides, Landslides, 12, 311–320, https://doi.org/10.1007/s10346-014-0471-3, 2015.
Melillo, M., Brunetti, M. T., Peruccacci, S., Gariano, S. L., and Guzzetti, F.: Rainfall thresholds for the possible landslide occurrence in Sicily (Southern Italy) based on the automatic reconstruction of rainfall events, Landslides, 13, 165–172, https://doi.org/10.1007/s10346-015-0630-1, 2016.
Melillo, M., Brunetti, M. T., Peruccacci, S., Gariano, S. L., Roccati, A., and Guzzetti, F.: A tool for the automatic calculation of rainfall thresholds for landslide occurrence, Environ. Model. Softw., 105, 230–243, https://doi.org/10.1016/J.ENVSOFT.2018.03.024, 2018.
Peres, D. J. and Cancelliere, A.: Derivation and evaluation of landslide-triggering thresholds by a Monte Carlo approach, Hydrol. Earth Syst. Sci., 18, 4913–4931, https://doi.org/10.5194/hess-18-4913-2014, 2014.
Peres, D. J. and Cancelliere, A.: Comparing methods for determining landslide early warning thresholds: potential use of non-triggering rainfall for locations with scarce landslide data availability, Landslides, 18, 3135–3147, https://doi.org/10.1007/s10346-021-01704-7, 2021.
Piciullo, L., Calvello, M., and Cepeda, J. M.: Territorial early warning systems for rainfall-induced landslides, Earth-Sci. Rev., 179, 228–247, https://doi.org/10.1016/J.EARSCIREV.2018.02.013, 2018.
Reichenbach, P., Rossi, M., Malamud, B. D., Mihir, M., and Guzzetti, F.: A review of statistically-based landslide susceptibility models, Earth-Sci. Rev., 180, 60–91, https://doi.org/10.1016/j.earscirev.2018.03.001, 2018.
Rosi, A., Segoni, S., Canavesi, V., Monni, A., Gallucci, A., and Casagli, N.: Definition of 3D rainfall thresholds to increase operative landslide early warning system performances, Landslides, 18, 1045–1057, https://doi.org/10.1007/s10346-020-01523-2, 2021.
Sala, G., Lanfranconi, C., Frattini, P., Rusconi, G., and Crosta, G. B.: Cost-sensitive rainfall thresholds for shallow landslides, Landslides, 18, 2979–2992, https://doi.org/10.1007/s10346-021-01707-4, 2021.
SIAS – Servizio Informativo Agrometeorologico Siciliano (Sicilian Agro-meteorological Information Service): Dati meteorologici (Meteorological data), http://www.sias.regione.sicilia.it/, last access: 31 March 2022.
van Natijne, A. L., Lindenbergh, R. C., and Bogaard, T. A.: Machine learning: New potential for local and regional deep-seated landslide nowcasting, Sensors, 20, 1–18, https://doi.org/10.3390/s20051425, 2020.