the Creative Commons Attribution 4.0 License.
the Creative Commons Attribution 4.0 License.
 | 29 Mar 2022
Detrainment and braking of snow avalanches interacting with forests
Louis Védrine
Xingyue Li
Johan Gaume
Mountain forests provide natural protection against avalanches. They can both prevent avalanche formation in release zones and reduce avalanche mobility in runout areas. Although the braking effect of forests has been previously explored through global statistical analyses on documented avalanches, little is known about the mechanism of snow detrainment in forests for small and medium avalanches. In this study, we investigate the detrainment and braking of snow avalanches in forested terrain, by performing three-dimensional simulations using the material point method (MPM) and a large-strain elastoplastic snow constitutive model based on critical state soil mechanics. First, the snow internal friction is evaluated using existing field measurements based on the detrainment mass, showing the feasibility of the numerical framework and offering a reference case for further exploration of different snow types. Then, we systematically investigate the influence of snow properties and forest parameters on avalanche characteristics. Our results suggest that for both the cold and warm snow parameterized in our simulations, the detrainment mass decreases with the square of the avalanche front velocity before it reaches a plateau value. Furthermore, the detrainment mass significantly depends on snow properties. It can be as much as 10 times larger for warm snow compared to cold snow. By examining the effect of forest configurations, it is found that forest density and tree diameter have cubic and square relations with the detrainment mass, respectively. The outcomes of this study may contribute to the development of improved formulations of avalanche–forest interaction models in popular operational simulation tools and thus improve hazard assessment for alpine geophysical mass flows in forested terrain.
- Article
(5121 KB) - Full-text XML
- BibTeX
- EndNote


The expansion of human activity in mountains has increased the risk associated with snow avalanches (De Biagi et al., 2012), which threaten infrastructures and human lives. Forests can mitigate snow avalanche hazards without expensive construction of heavy protective measures like concrete dams. Hence, it is crucial to understand how forests affect the avalanche dynamic behaviour. A forest can have two protective effects against avalanches. It stabilizes the snowpack in the release area (Viglietti et al., 2009) and reduces avalanche mobility in the runout zone. The second aspect has often been neglected because of the field observation that large avalanches can destroy forests with no significant deceleration (Bartelt and Stöckli, 2001). However, it has been shown that for small to medium avalanches (e.g. <10 000 m3), forests are normally not destroyed and can notably reduce the avalanche run-out distance (Teich et al., 2012a; Perzl et al., 2021).
Predominant numerical tools for modelling snow avalanches use two-dimensional approaches, like depth-averaged avalanche dynamics models (Christen et al., 2010). These methods are computationally efficient and a powerful tool for hazard mapping but cannot directly capture the interaction between individual trees and an avalanche. Therefore, many studies have worked on modelling the effect of a forest indirectly. There are mainly two approaches to simulate the protective effect of a forest against avalanches: the frictional approach and the detrainment approach (Feistl et al., 2012). The first accounts for the breakage of trees and debris entrainment by increasing the friction parameters of the Voellmy law (Voellmy, 1955) compared to open unforested terrain (Gruber and Bartelt, 2007; Takeuchi et al., 2018). The second approach is based on field observations and has a more solid physical meaning than the friction model. The mass and momentum of the snow stopped behind the trees are directly removed from the flow, which naturally leads to deceleration and run-out shortening of the avalanche. Assuming that no mass is entrained in the forest area, the detrainment rate is added to the mass balance, with Md the detrainment mass, which corresponds to the mean mass stopped in the forest per unit of area. The rate of detrainment is quantified with a detrainment coefficient K (Feistl et al., 2014), which links the temporal derivative of the detrainment mass with V, the depth-averaged velocity of the avalanche as follows: .
The two methods can both empirically recover the reduction in mass and momentum of an avalanche in an efficient way but may encounter difficulties and give unsatisfactory predictions in practical applications. According to Teich et al. (2012b), the friction approach is not effective for modelling small and medium avalanches in forested terrain, as the run-out distance was overestimated even by using the smallest turbulent friction coefficient. The detrainment approach highly relies on the data from field avalanches, with which the detrainment coefficient K can be determined to apply the detrainment function in numerical modelling (Teich et al., 2014). Based on existing studies, both the forest type and the snow properties have a crucial effect on the detrainment coefficient K (Teich et al., 2012b, 2014; Brožová et al., 2020). However, there is no systematic investigation on the controlling factors of the snow detrainment by forests under well-controlled conditions.
This study aims to quantify the amount of snow caught in forests and explore the mechanism of the detrainment, with comprehensive consideration of different avalanche features and forest configurations. We use a three-dimensional material point method (3D MPM), by which the fractures, collisions, and large deformations involved in snow avalanches can be well captured (Gaume et al., 2018, 2019; Li et al., 2020, 2021). More importantly, individual trees and their interactions with snow avalanches can be explicitly modelled without relying on empirical laws. Compared to the popular two-dimensional tools for modelling snow avalanches, the 3D MPM can fully resolve flow variations in all dimensions. Based on the simulations in this study, we can better understand the forest–avalanche interaction, reveal laws governing the effect of the key influencing factors on snow detrainment, and offer a basis for systematic calibration of the detrainment approach (Feistl et al., 2014) for operational purposes.
2.1 Numerical method
2.1.1 The material point method (MPM)
Our simulations are performed using the material point method (MPM), which is a hybrid Eulerian–Lagrangian method suitable to deal with large strains (Stomakhin et al., 2013). In MPM, Lagrangian particles are used to carry the information of position, velocity, and deformation gradient, while the Eulerian grid is used to compute the equations of motion and for updating the particle states. The governing equations are based on mass and momentum conservation as follows:
where t is time, v is velocity, ρ is density, g is the gravitational acceleration, and σ is the Cauchy stress expressed by the elastoplastic constitutive relation:
where Ψ is the elastoplastic potential energy density, FE is the elastic part of the deformation gradient F, and J=det(F).
In this study, the transfers between particles and grid use the affine particle-in-cell (APIC) method (Jiang et al., 2015). Compared to the particle-in-cell (PIC) and fluid implicit particle (FLIP) techniques, the APIC approach allows both the stable removal of the numerical dissipation and the preservation of angular momentum in addition to linear momentum.
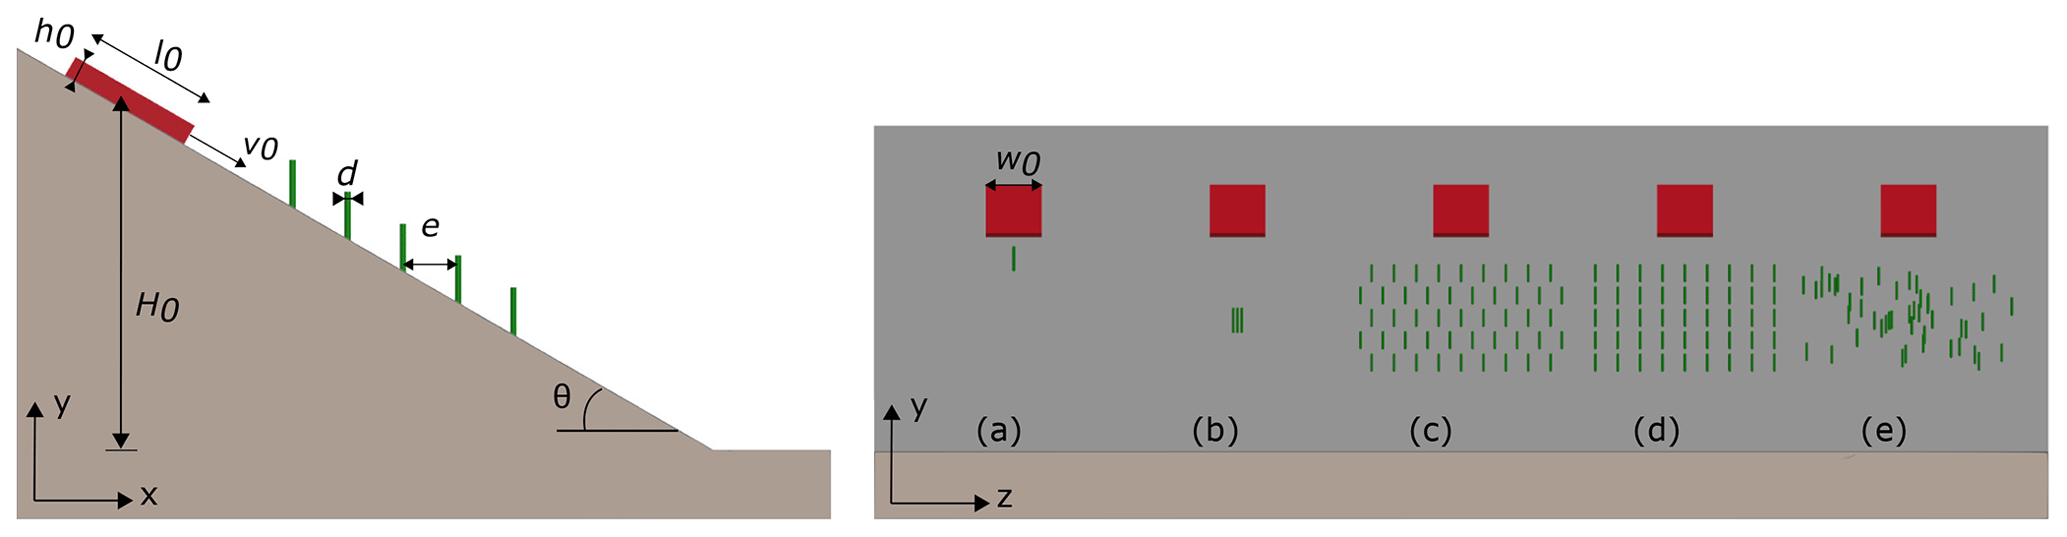
Figure 1Model setup of MPM simulations of snow avalanches impacting trees. The left and right are side and front views respectively. Five arrangements of trees in the right include (a) one tree, (b) three trees, (c) regularly staggered trees, (d) regularly aligned trees, and (e) random trees.
2.1.2 Large-strain elastoplastic model
For modelling snow, we use the modified Cam–Clay model with associative flow rule developed by Gaume et al. (2018). Given a stress τ, a mean effective stress and a deviatoric stress can be respectively obtained as and , where I is the identity matrix. The Mises equivalent stress can then be derived as . The yield surface in the space of the q–p is defined as
where β is the ratio between tensile and compressive strength and represents the cohesion, p0 is the consolidation pressure, and M is the slope of the cohesionless critical state line, which denotes the internal friction of snow. For , the material follows the Hooke law (St Venant–Kirchhoff–Hencky strain), otherwise it behaves plastically. The hardening and softening of the material are modelled by respectively expanding and shrinking the yield surface according to the law
where ζ is the hardening factor, E the Young modulus, ν the Poisson ratio, and the volumetric plastic deformation.
2.2 Model setup
Different simplified setups are designed to test the protective role of different forest structures with various types of snow. As shown in the left of Fig. 1, the terrain is composed of an ideal slope with a constant inclination of and a horizontal deposition zone. The bed friction coefficient of the terrain is assumed to be 0.5. The snow sample is initially placed at the top of the slope at a height of H0=50.6 m with a prescribed initial velocity of v0. We define h0=1 m, l0=20 m, and w0=20 m as respectively the height, length, and width of the released snow. For all the snow types simulated in this study, they share the same Young modulus (E=3 MPa), Poisson ratio (ν=0.3), and initial density (ρ0=200 kg m−3) (Li et al., 2020). As the material point method is a continuous approach, each material point corresponds to a piece of snow; therefore the snow density is the bulk density, including air and snow. Five types of tree arrangement are designed as shown in the right of Fig. 1, including (a) one tree, (b) three trees with an identical diameter and at the same elevation, (c) a regularly staggered forest composed of trees in a staggered arrangement, (d) a regularly aligned forest composed of trees in an aligned arrangement, and (e) a random forest in which trees are randomly located. All the trees are initially at the downstream of the released snow. In the setup of (c), (d), and (e), the width of the forests (along z) is larger than the maximum avalanche width, and the length of the forests along the flow direction is 40 m.
In addition to the different tree arrangements, the forest density ρforest (trees ha−1) and the tree diameter d are also varied to study their effect on snow detrainment. The forest density in this study is defined as the number of trees per hectare. In the case of a regularly staggered forest, the forest density is controlled by the spacing between the trees e (Fig. 1). In this study, we assume that the trees are unbreakable and the trunk surface is rough. Therefore, the trees are modelled as rigid obstacles with a no-slip boundary condition. The height of the trees is set to 10 m so that the avalanches do not overtop the trees.
In order to both model the trees and shorten the computation time well, we use an Eulerian grid size of dx=0.15 m if it is not specified and eight particles per grid. The time step is constrained by the Courant–Friedrichs–Lewy (CFL) condition and the elastic wave speed to guarantee the simulation stability. The simulation data are exported every s.
To calibrate the friction of snow and verify other parameters (e.g. snow density, Young modulus, mesh size) adopted in our numerical modelling, we simulate the snow detrainment due to a group of three trees according to the field observation in Feistl et al. (2014). This case with three trees is selected for the calibration as the setup is simple, and the field measurement data are available for comparison. Based on the real condition (Feistl et al., 2014), the diameter of trees is set to 1 m, and the spacing between trees is 0.33 m in our simulation. The simulation results are quantitatively compared with the field data in terms of the volume and height of the deposited mass (i.e. detrainment) behind the trees.
By assuming the shape of the detrainment mass as a wedge, Feistl et al. (2014) calculated the detrainment volume as
with l the width of the group of trees, hw the wedge height, and θ the slope angle. In our simulations, the detrainment volume is obtained by summarizing the volume of all the particles in the detrainment mass without the assumption of the wedge shape. The height of the detrainment mass is calculated as the vertical distance from its free surface to the tree foot (as illustrated in Fig. 2). As summarized in Table 1, five simulation cases with different snow friction coefficient M were conducted, while all other parameters are fixed (e.g. the tension compression ratio β=0.3, the hardening factor ζ=1, the initial consolidation pressure = 30 kPa). With the reduction of snow friction from 1.5 to 0.8, the volume and height of the detrainment mass decrease, and the case with M=0.8 has a good agreement with the field data. In addition, Fig. 2 shows that the shape of the detrainment mass does not differ much with the change of snow friction. The simulation with M=0.8 gives a similar profile of the detrainment mass as that observed from the field (Fig. 2d and e). This calibration case demonstrates the good feasibility of our numerical tool in capturing the key features of detrainment and serves as a reference case for the study on the effect of snow properties in the following section.
Table 1Deposition height and volume of snow in simulations with different M and in the field observation.
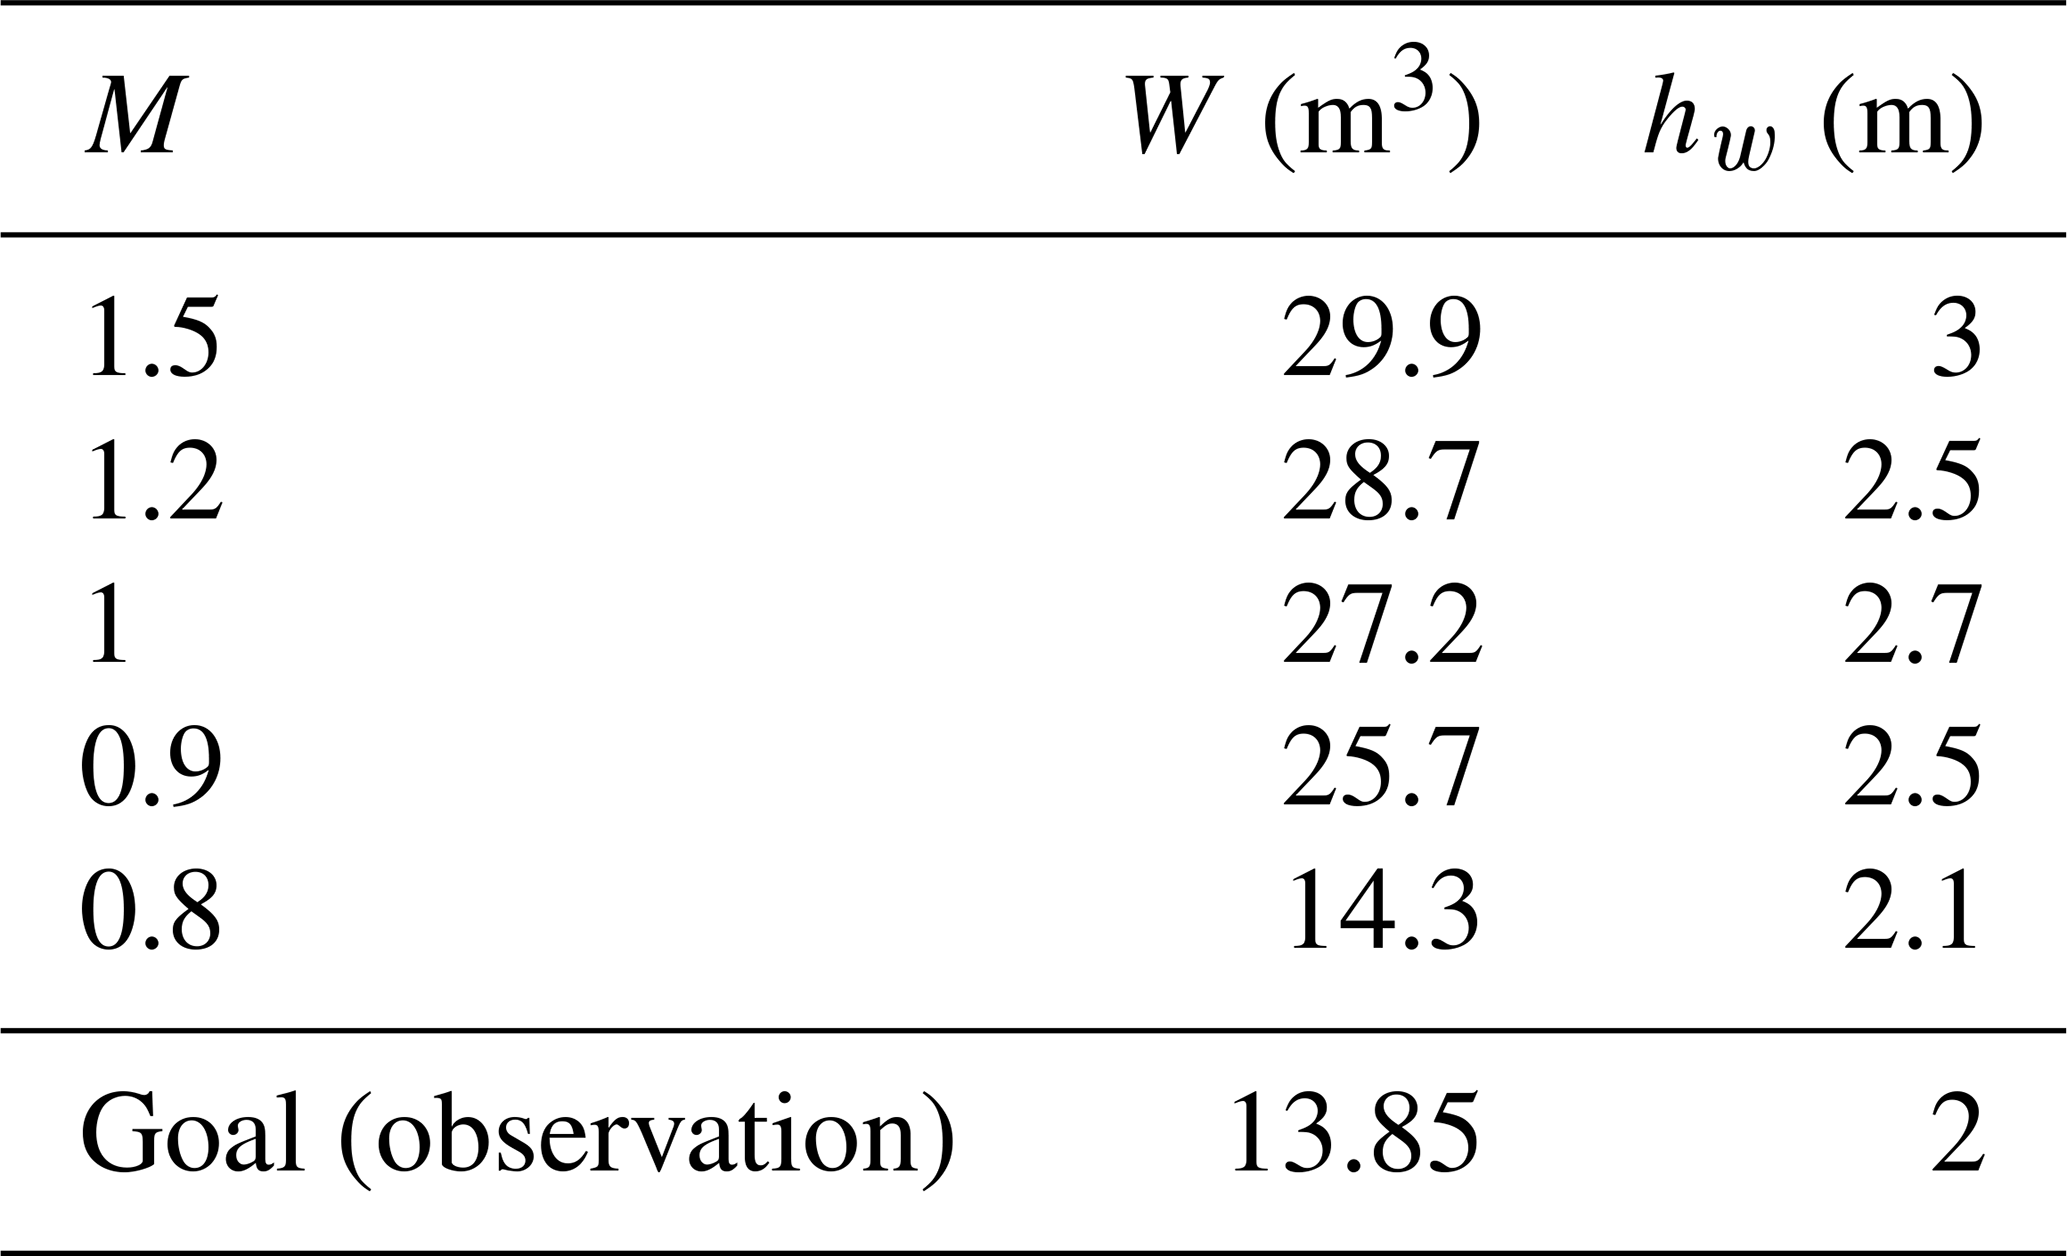
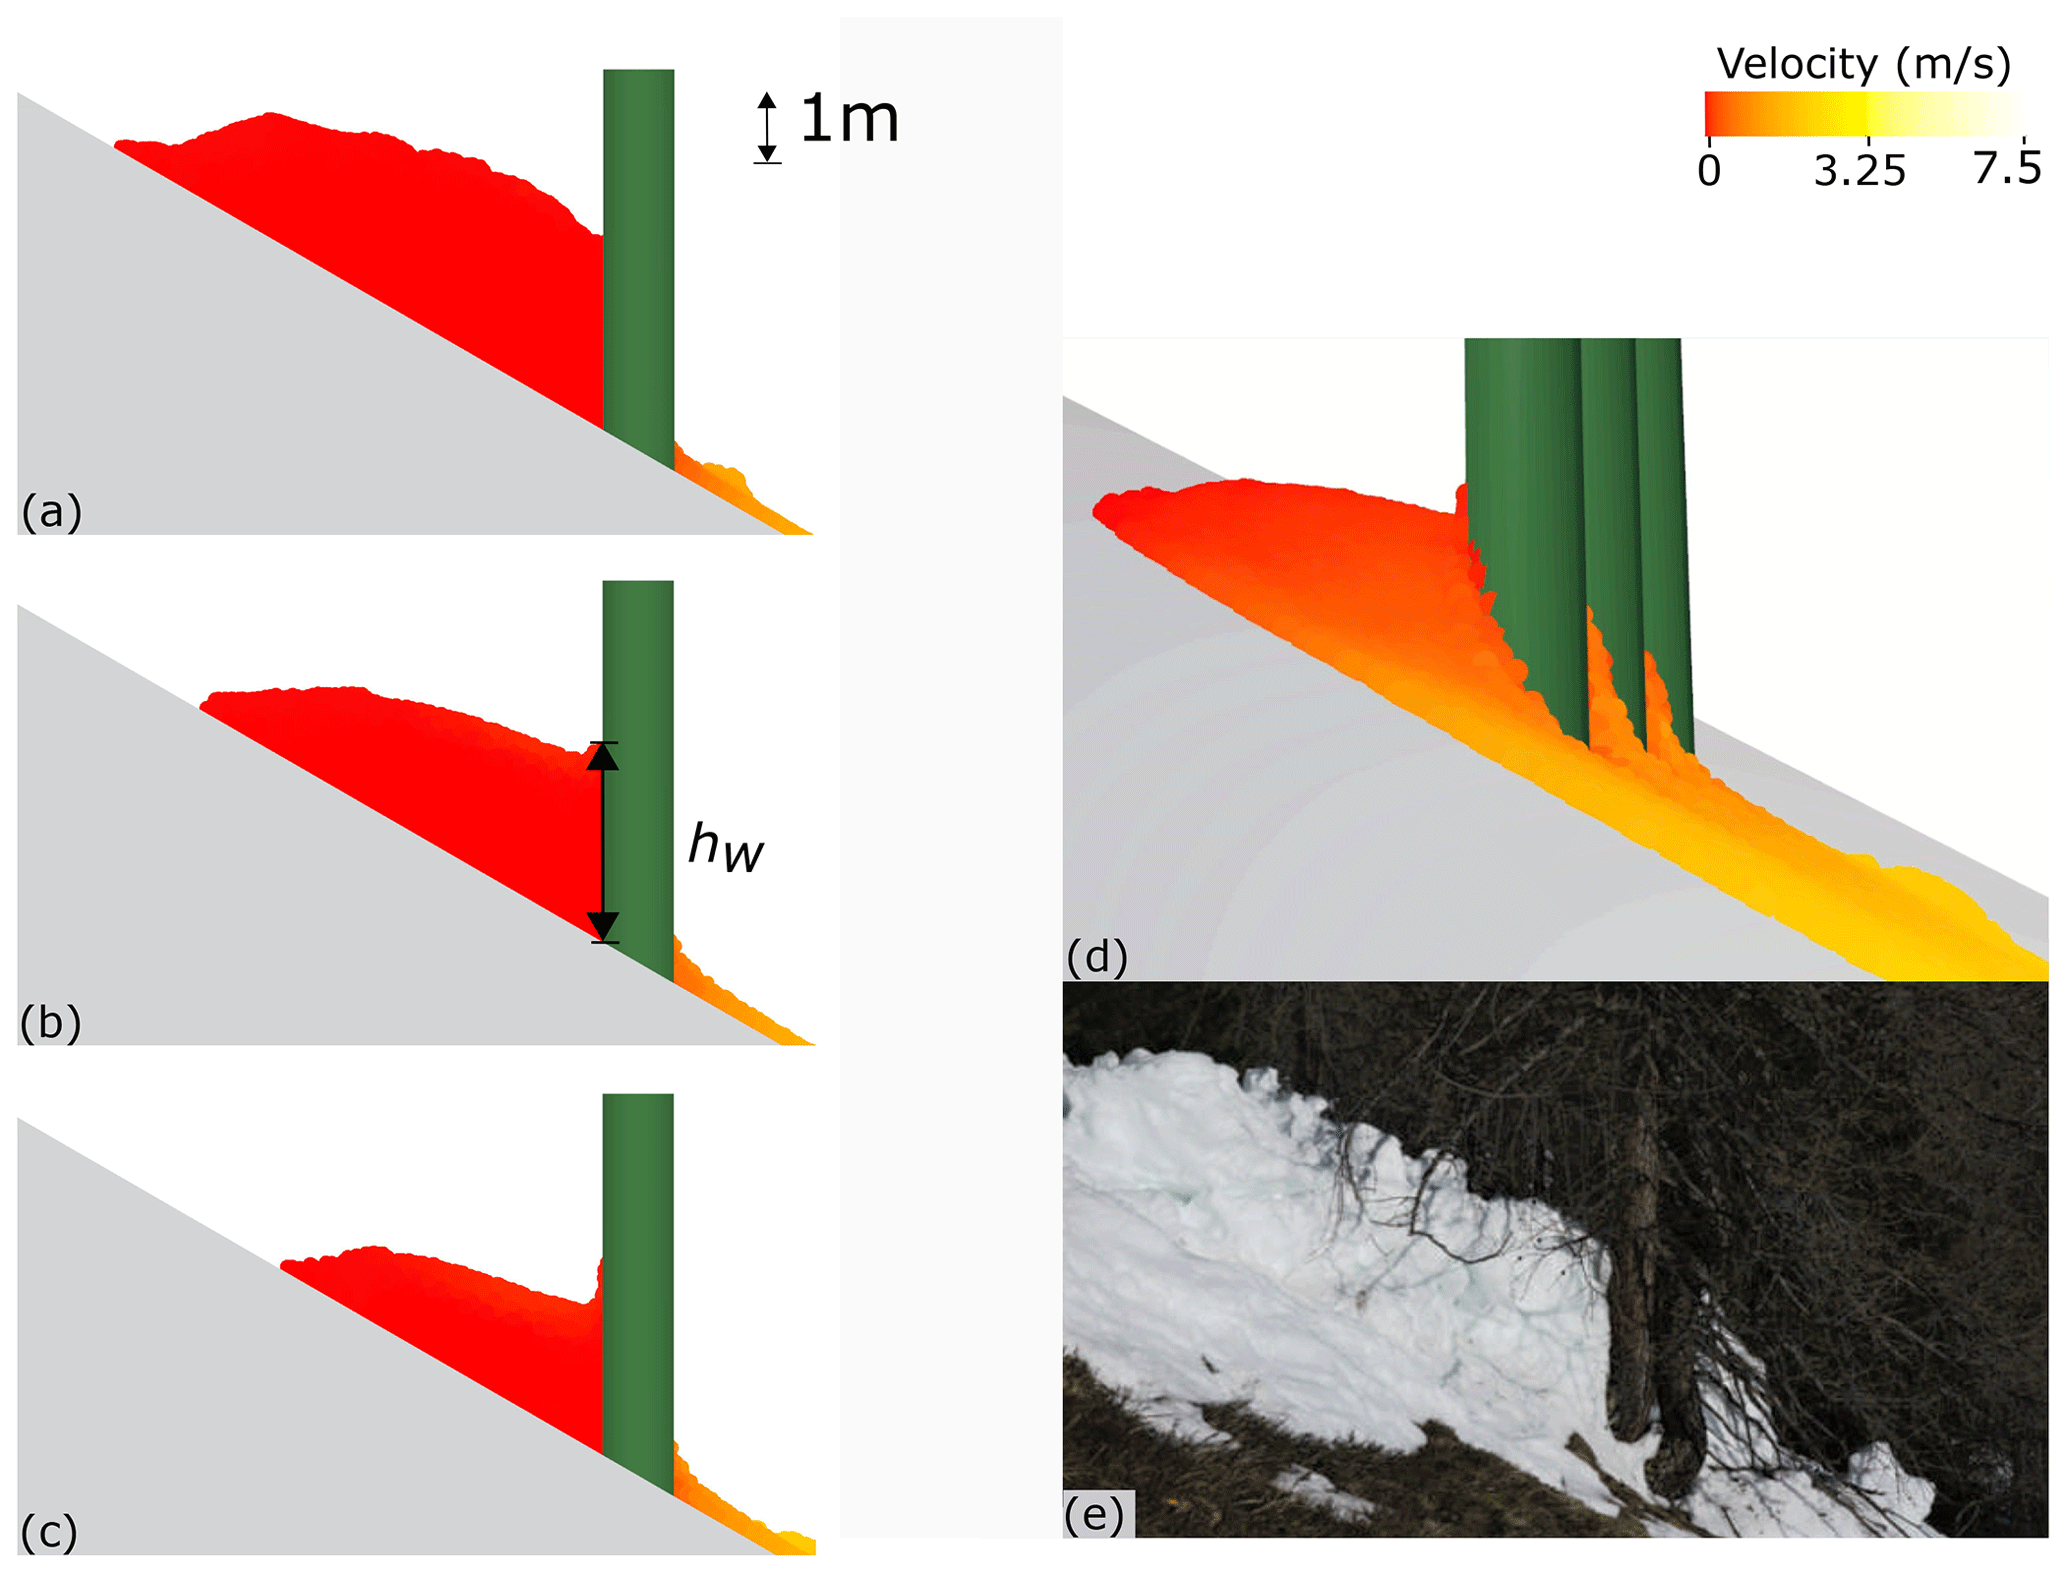
Figure 2Cross-sectional view (passing through the centre of the middle tree) of the snow stopped behind a group of three trees for different values of M: (a) M=1.2, (b) M=1, and (c) M=0.8. Perspective view of the stopped mass (d) in the simulation with M=0.8 and d=1 m and (e) from the field observation (Feistl et al., 2014).
A qualitative study of the forest–avalanche interaction will be first presented where different avalanche characteristics will be introduced (Sect. 4.1). Then, the main forest factors influencing the detrainment mass in the case of a regular staggered forest will be discussed (Sect. 4.2), and a newly proposed unique law for estimation of the detrainment mass will be suggested (Sect. 4.3). Finally, we will show an energy investigation involving the braking process as well as the influence of snow properties and forest structure (Sect. 4.4).
4.1 Influence of avalanche features
4.1.1 Snow properties at the forest scale
In this study, different snow properties are adopted in the MPM modelling, to study their influence on the braking effect of the forest. The snow properties are defined by the parameters of the modified Cam–Clay model (Gaume et al., 2018): the friction coefficient M, the tension compression ratio β, the hardening factor ζ, and the initial consolidation pressure . These parameters have their physical basis and can be determined according to physical properties of snow and/or parametric study (Li et al., 2020). In particular denotes the isotropic tensile strength, M is linked to the internal friction angle of snow ϕ as follows (Sadrekarimi and Olson, 2011), and the hardening factor reflects how fast the load increases with the displacement in the plastic stage. According to our systematic study on the effect of snow properties on the avalanche behaviour (Li et al., 2020), it was found that the tensile strength and βM consistently increase from cold to warm avalanches, which suggests that these two terms control the different snow behaviours.
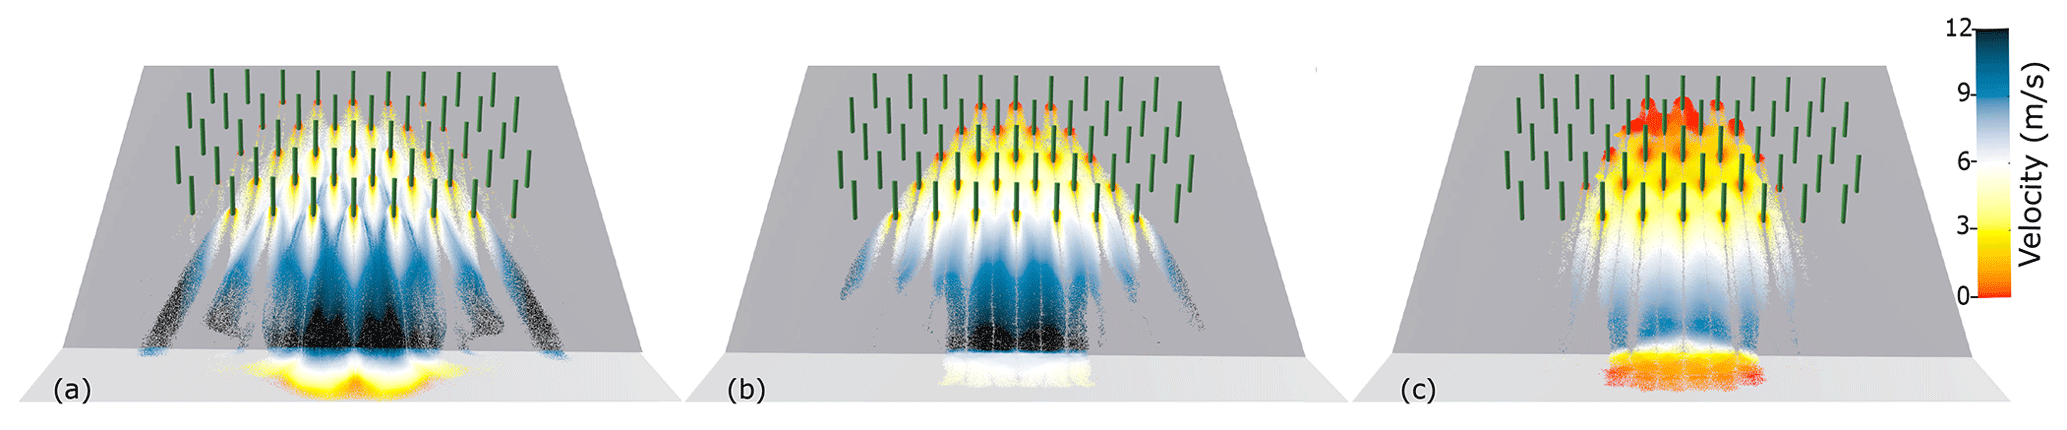
Figure 3Flow profile for three different flow regimes: (a) Case 1, (b) Case 2, and (c) Case 3, for a regular staggered forest at t=10 s, e=8 m, d=1 m, and v0=10 m s−1.
Table 2Snow properties adopted in the MPM modelling of the flows for three typical flow regimes.
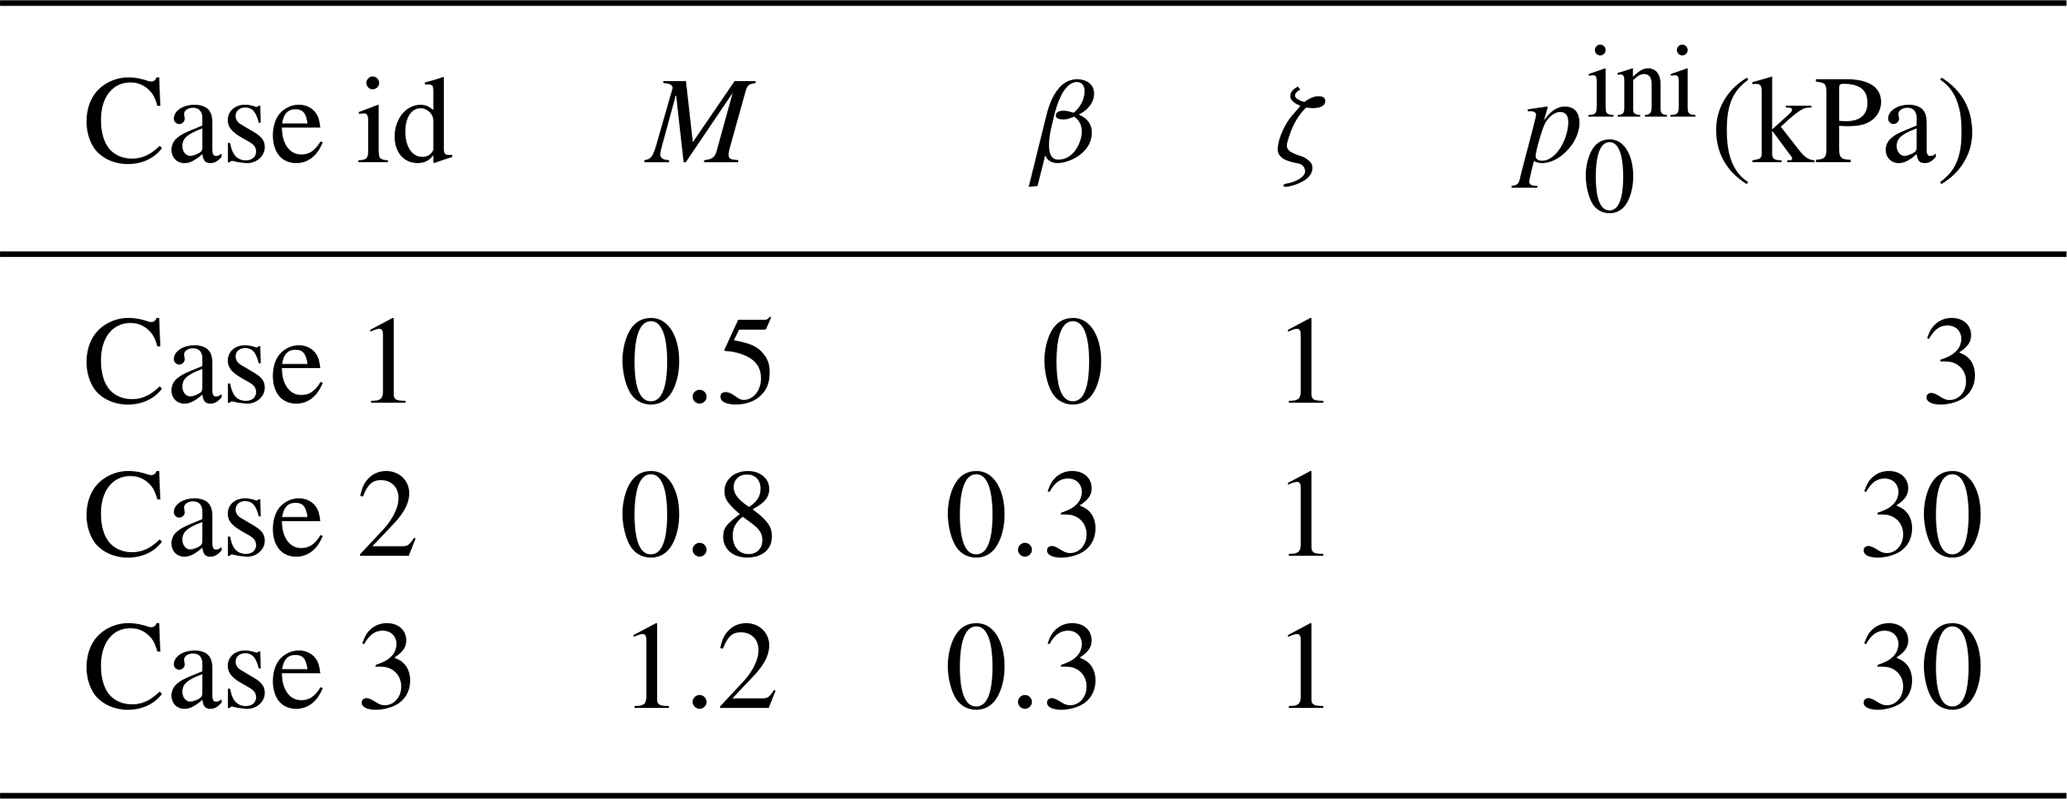
Based on the calibration case reported in Sect. 3, kPa and βM=0.24 (Case 2 in Table 2), we can obtain different snow types by changing and βM. Firstly, to reproduce the behaviour of a cold snow (Case 1 in Table 2), we decrease the tensile strength kPa and βM=0, which leads to a cohesionless and low-friction snow. And to capture the behaviour of a wet and warm snow, kPa and βM=0.36 (Case 3 in Table 2) are adopted, giving a relatively cohesive and frictional snow with granules and blocks.
As illustrated in Fig. 3, a regular staggered forest is used for the three cases in Table 2. It is apparent that the snow properties have a significant effect on the accumulated snow behind the trees. Indeed, the total amount of stopped snow increases with the internal friction and the cohesion of snow. According to our simulations, some arches due to the jamming effect (Feistl et al., 2014) appear in Case 3, especially upstream of the avalanche. This occurrence of the arches promotes the stabilization of snow on the slope and is tightly related to the high internal friction and cohesion of snow. The jamming effect and the formation of the arches observed in the avalanche–forest interaction are similar to the behaviour of a granular flow in a two-dimensional hopper (Lai et al., 2001).
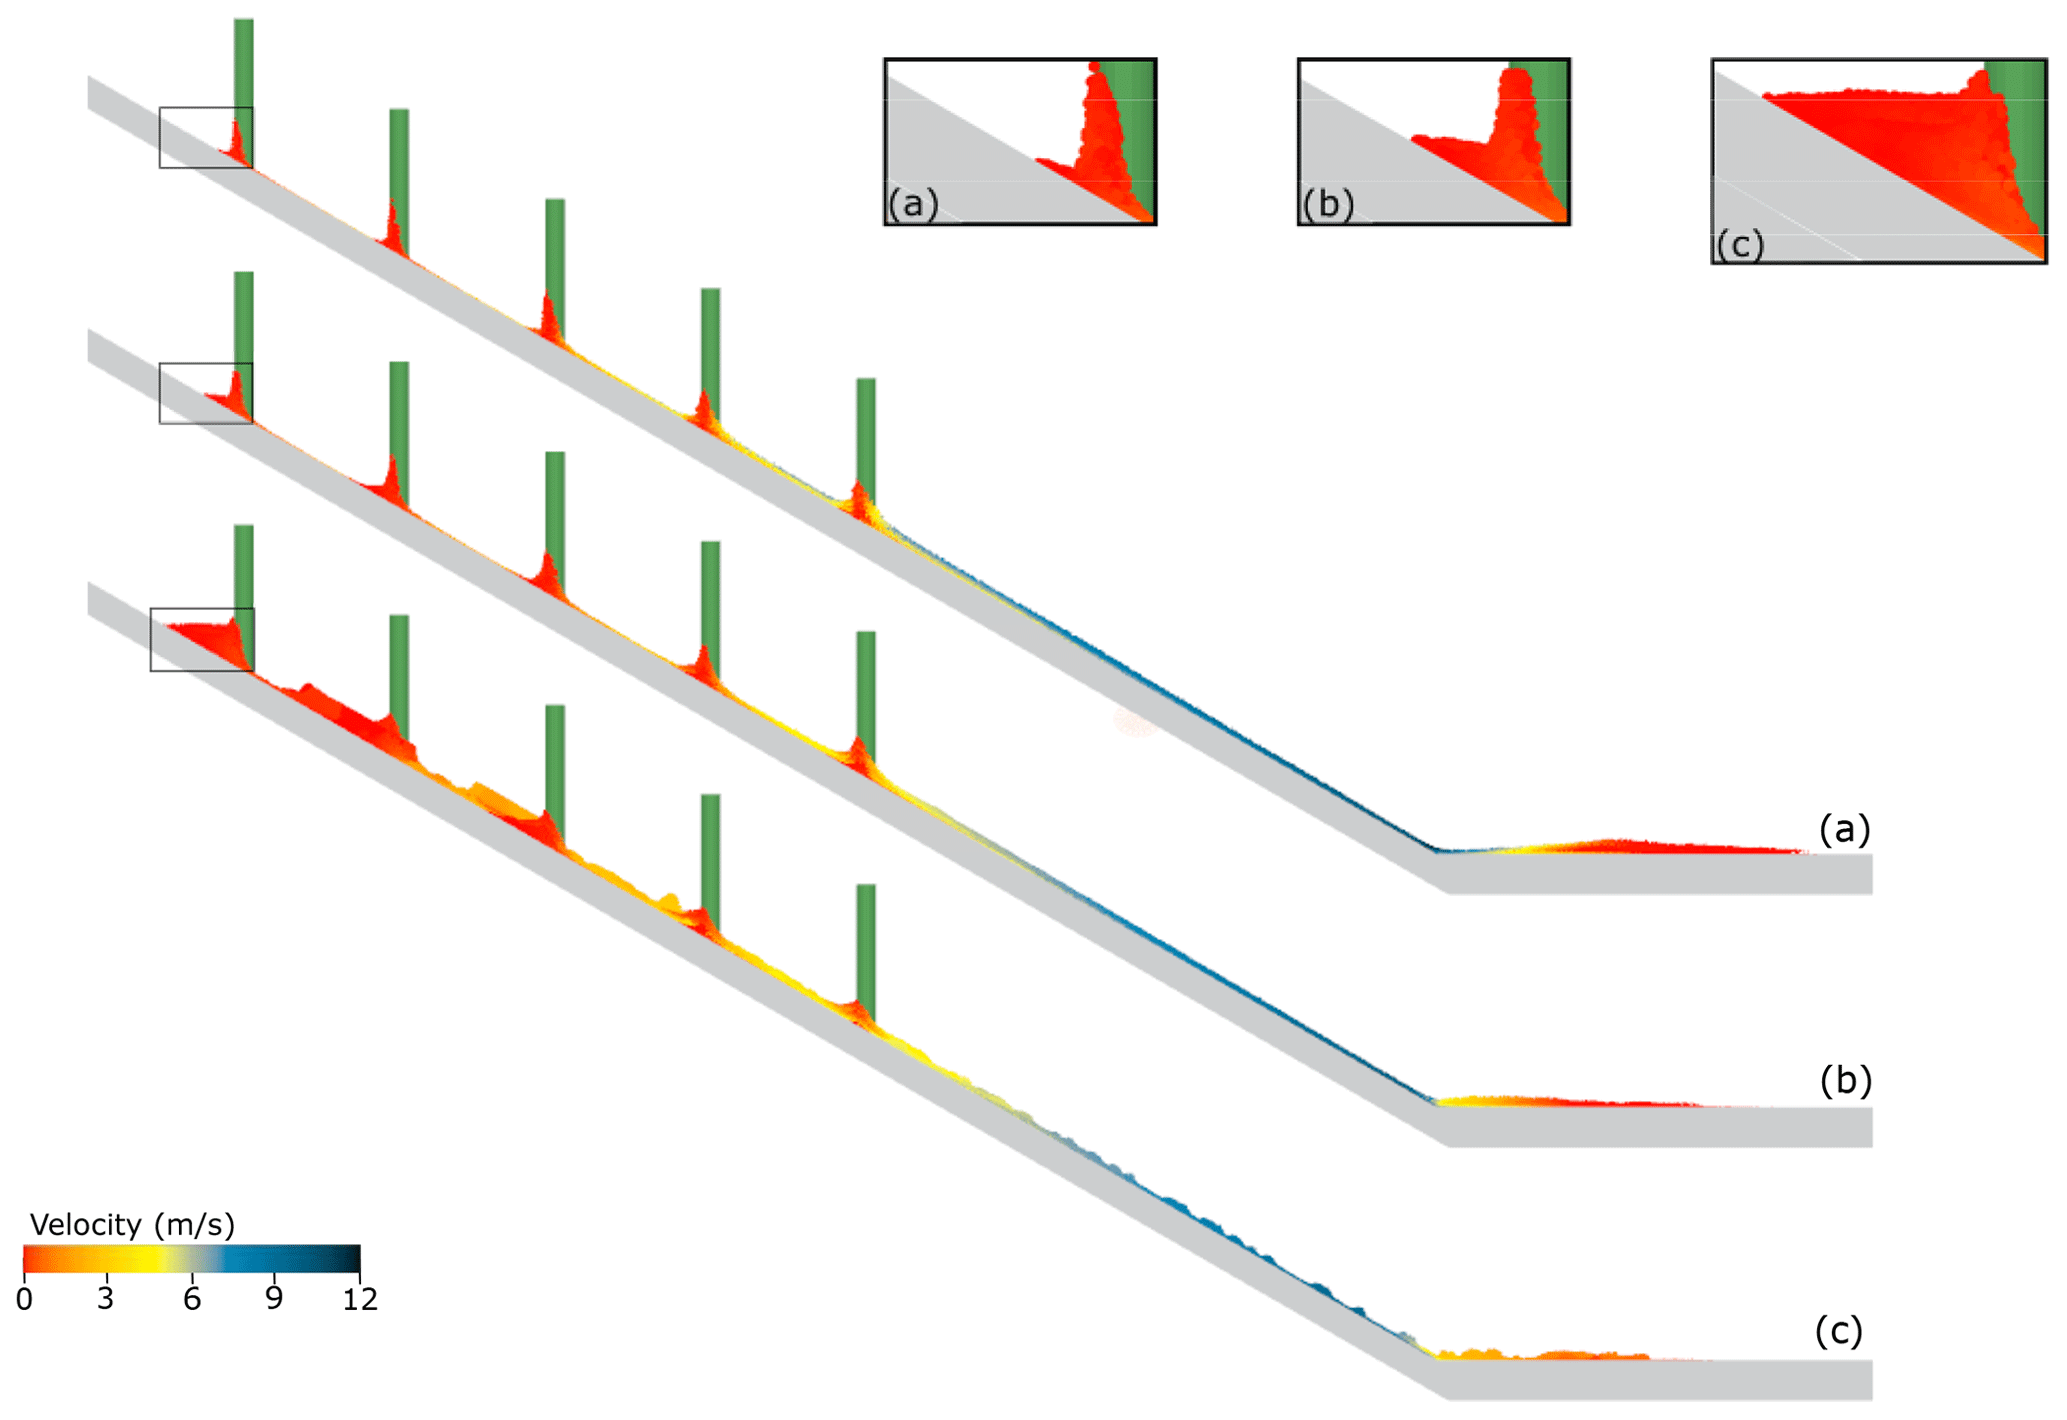
Figure 4Profile of accumulated snow for different flow regimes: (a) Case 1, (b) Case 2, and (c) Case 3, regular staggered forest at t=10 s, e=8 m, d=1 m, and v0=10 m s−1.
Independent of the snow properties, there are a lot of defections as the flow front is split into many branches (Fig. 3), in contrast to the flow without forest obtained from our simulation. Figure 3 demonstrates that the more cohesionless the snow is, the more the snow is laterally spread in the forest and gets around the trees easily. As shown by Luong et al. (2020), for the cohesionless flow regime (Case 1), the snow on the side of the flow moves very fast. After being initially deflected, this lateral snow moves in a diagonal channel without collision, even if a part of this effect is due to the arrangement of trees like a Galton board.
In addition to the lateral motion of the avalanches, the length and height of the stopped snow are further analysed with the side view as illustrated in Fig. 4. The insets at the upper corner of Fig. 4 show the stopped mass (in red) at the uppermost trees. It is interesting to observe that the height of the wedge of stopped mass does not vary much with the different snow properties. Meanwhile, the length of the snow wedge in the flow direction changes notably. With the more cohesive and frictional snow from Case 1 to Case 3, the length of the wedge increases, and its free surface becomes more horizontal (inset c). According to Fig. 4, the snow properties also affect the evolution of stopped mass along the flow direction. While the shapes of the snow wedges appear to be similar along the slope in Cases 1 and 2, the profile of the snow changes significantly in Case 3. As blocks and granules exist in Case 3, there is more snow stopped by the trees upstream. It is noticed that the uppermost trees in Case 3 have less stopped mass than the second uppermost trees, mainly due to the severe initial impact of the avalanche on the uppermost trees.
4.1.2 Avalanche velocity
To define the detrainment mass stopped by the trees, a criteria based on the evolution of particle velocity is used. If a snow particle has a velocity smaller than 0.5 m s−1 throughout the flowing process, it is considered stopped and detrained. This definition borrows the concept by Feistl et al. (2014), where the snow is directly removed from the avalanche mass once it is stopped.
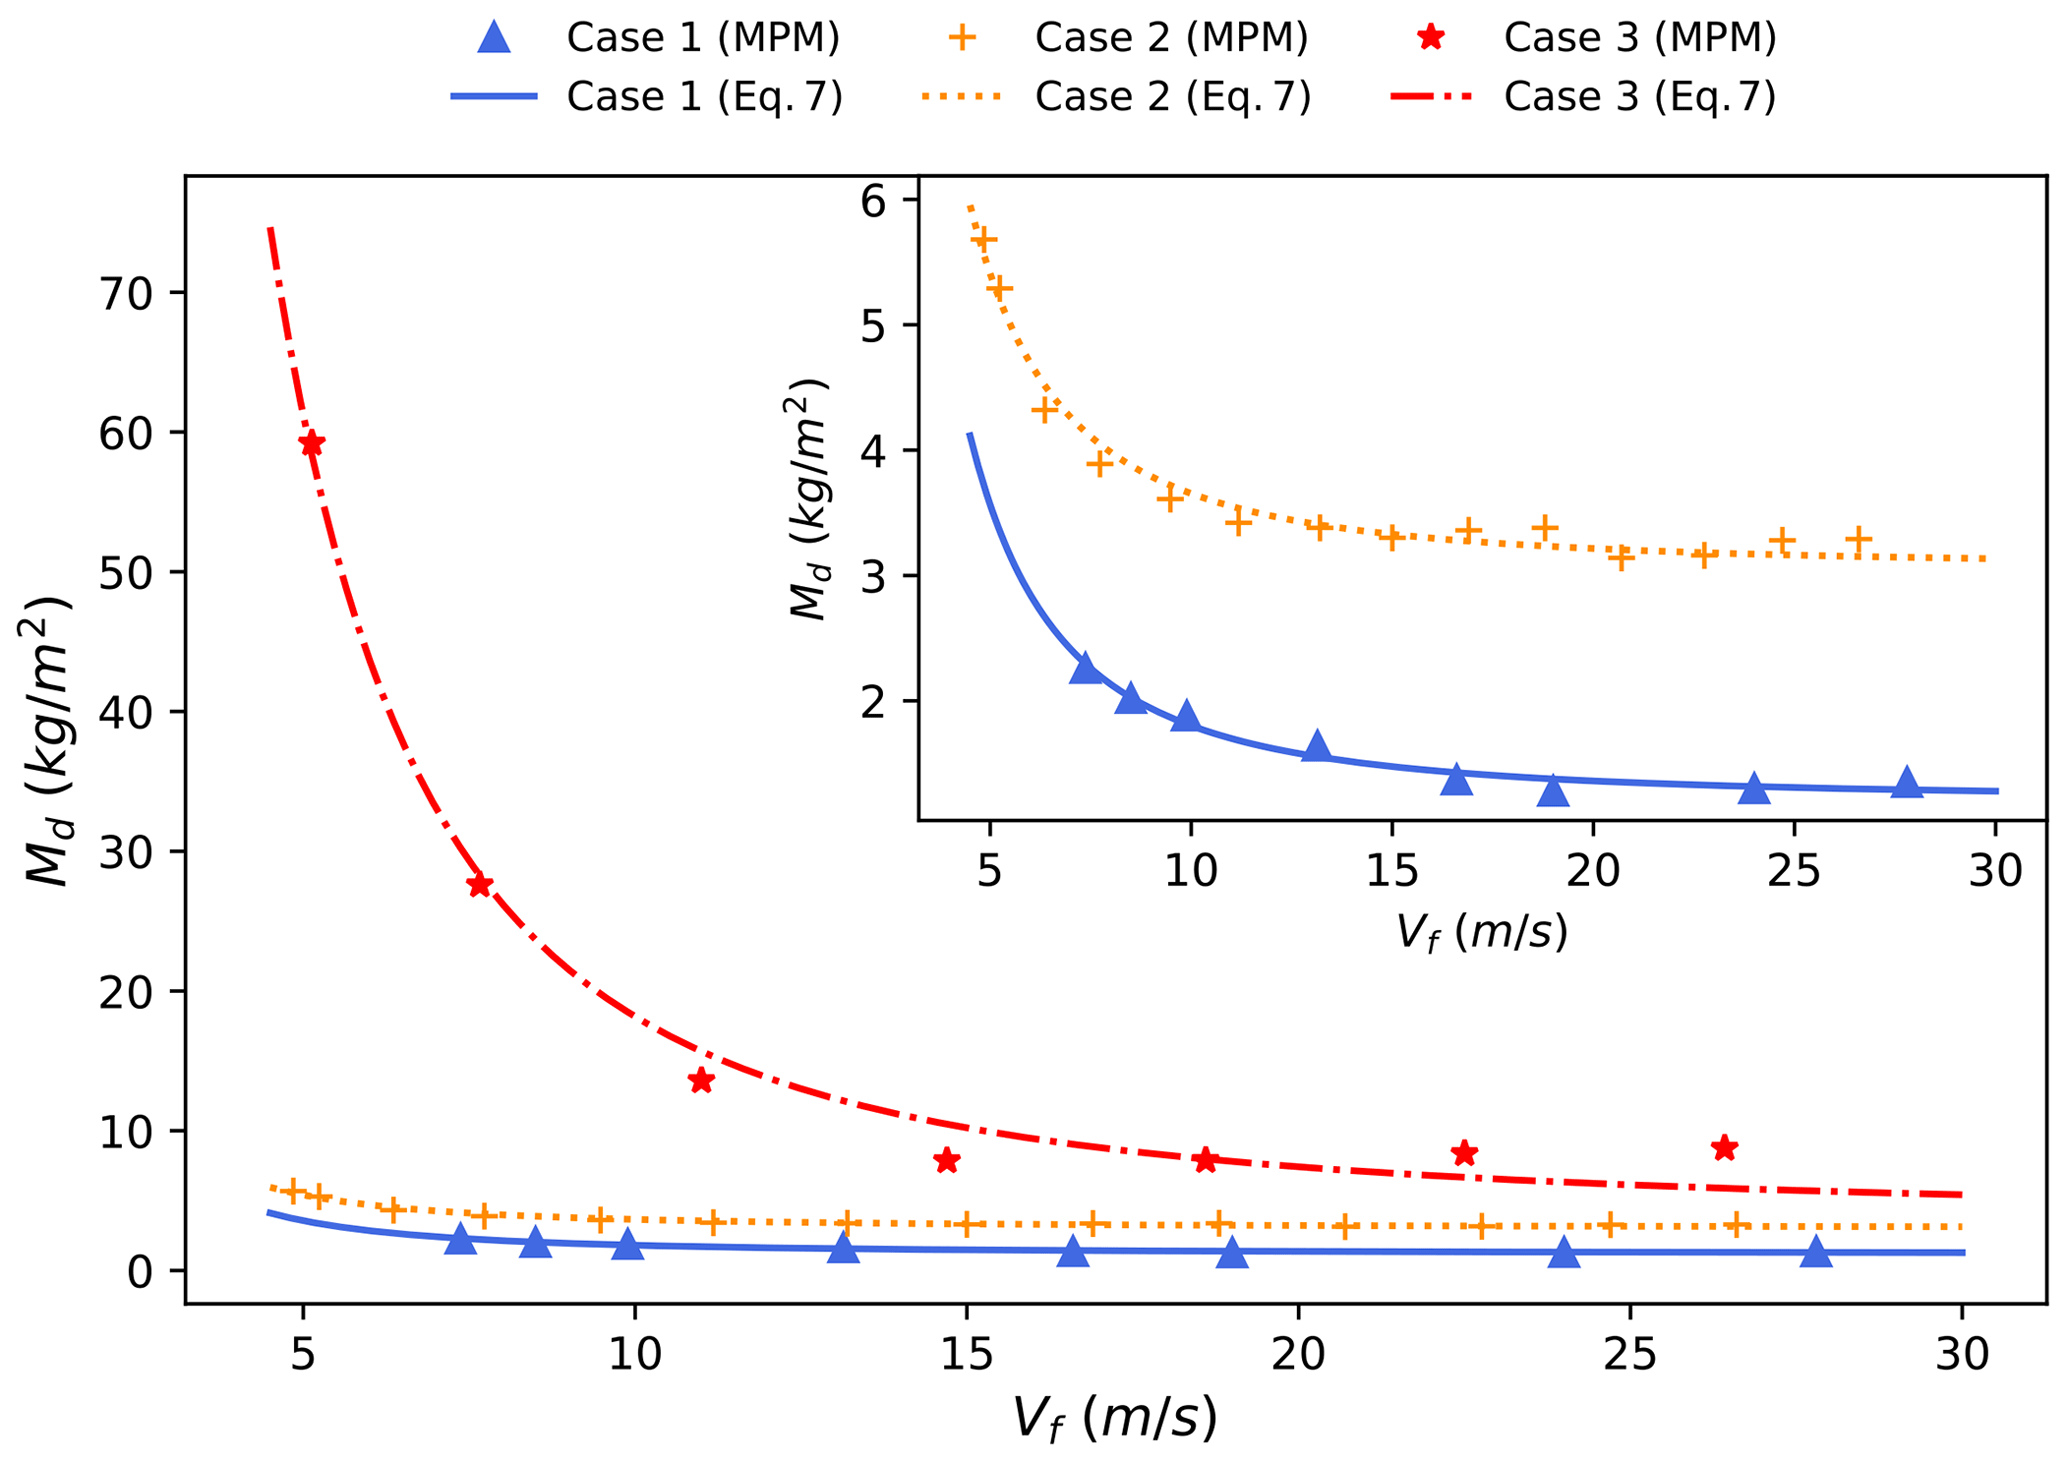
Figure 5Evolution of the detrainment mass per unit of area of snow with the velocity (regular staggered forest, e=8 m).
The effect of avalanche velocity on detrainment snow is studied by imposing an initial velocity v0 ranging from 0 to 24 m s−1. Figure 5 shows the evolution of the detrainment mass with the front velocity at the entrance of the forest for the different snow properties (in Sect. 4.1.1). The detrainment mass per unit area, Md, is calculated by dividing the total detrainment mass by the total area of influence. The latter is obtained by multiplying the number of trees with snow accumulation by the area of influence of each tree (e2).
Firstly, a strong effect of snow properties on the stopped snow is observed from Fig. 5. For instance, the total amount of snow stopped in Case 3 can be 10 times larger than that in Case 1 when the velocity is small. However, for each type of snow the same behaviour is observed, and the detrainment mass decreases when the velocity increases and tends to a constant value for high velocities. The initial negative correlation with the low velocities is in agreement with the field observation that a lower velocity leads to more stopped snow (Feistl et al., 2014). Therefore, we propose that the detrainment mass decreases with velocity square according to
with the front velocity of the avalanche when it enters the forest. The front velocity is calculated based on the velocity of the first 15 % of the particle flow to eliminate the effect of scattering particles at the avalanche front. The parameters of this model (p1(kg s−2), p2(kg m−2)) (Fig. 5) are identified based on least-squares method (Table 3), and both depend on the snow properties. p2 represents the detrainment mass reached for very high velocities (Eq. 7); it is the mass stopped independently of the velocity.
Similar to the effect of velocity on the detrainment mass, Kyburz et al. (2020) showed that the impact pressure increases with the velocity square. This increase in the impact pressure causes the breakage of snow during its collision with the trees, which leads to a lower volume of snow stuck behind the trees. The detrainment mass for the highest velocity is rather due to the type of snow; this part of snow is initially compacted against the trunk at the front of the avalanche and is not impacted by the velocity.
4.2 Influence of forest parameters
4.2.1 Tree diameter
The influence of tree diameter is studied for the one-tree configuration with a mesh size of 0.1 m for a better modelling of thin trees. In the case of a single tree, we use the mass stopped md (kg), not normalized with the area around the tree as the area is difficult to define. For all the snow properties, both the maximum and the final masses stopped md have the same evolution trend with the tree diameter (Fig. 6). Feistl et al. (2014) proposed the following cubic model for the detrainment volume W induced by single-tree interaction:
with d the diameter of the tree, θ the slope angle, and δ the top wedge angle of the pyramid formed by stopped snow.
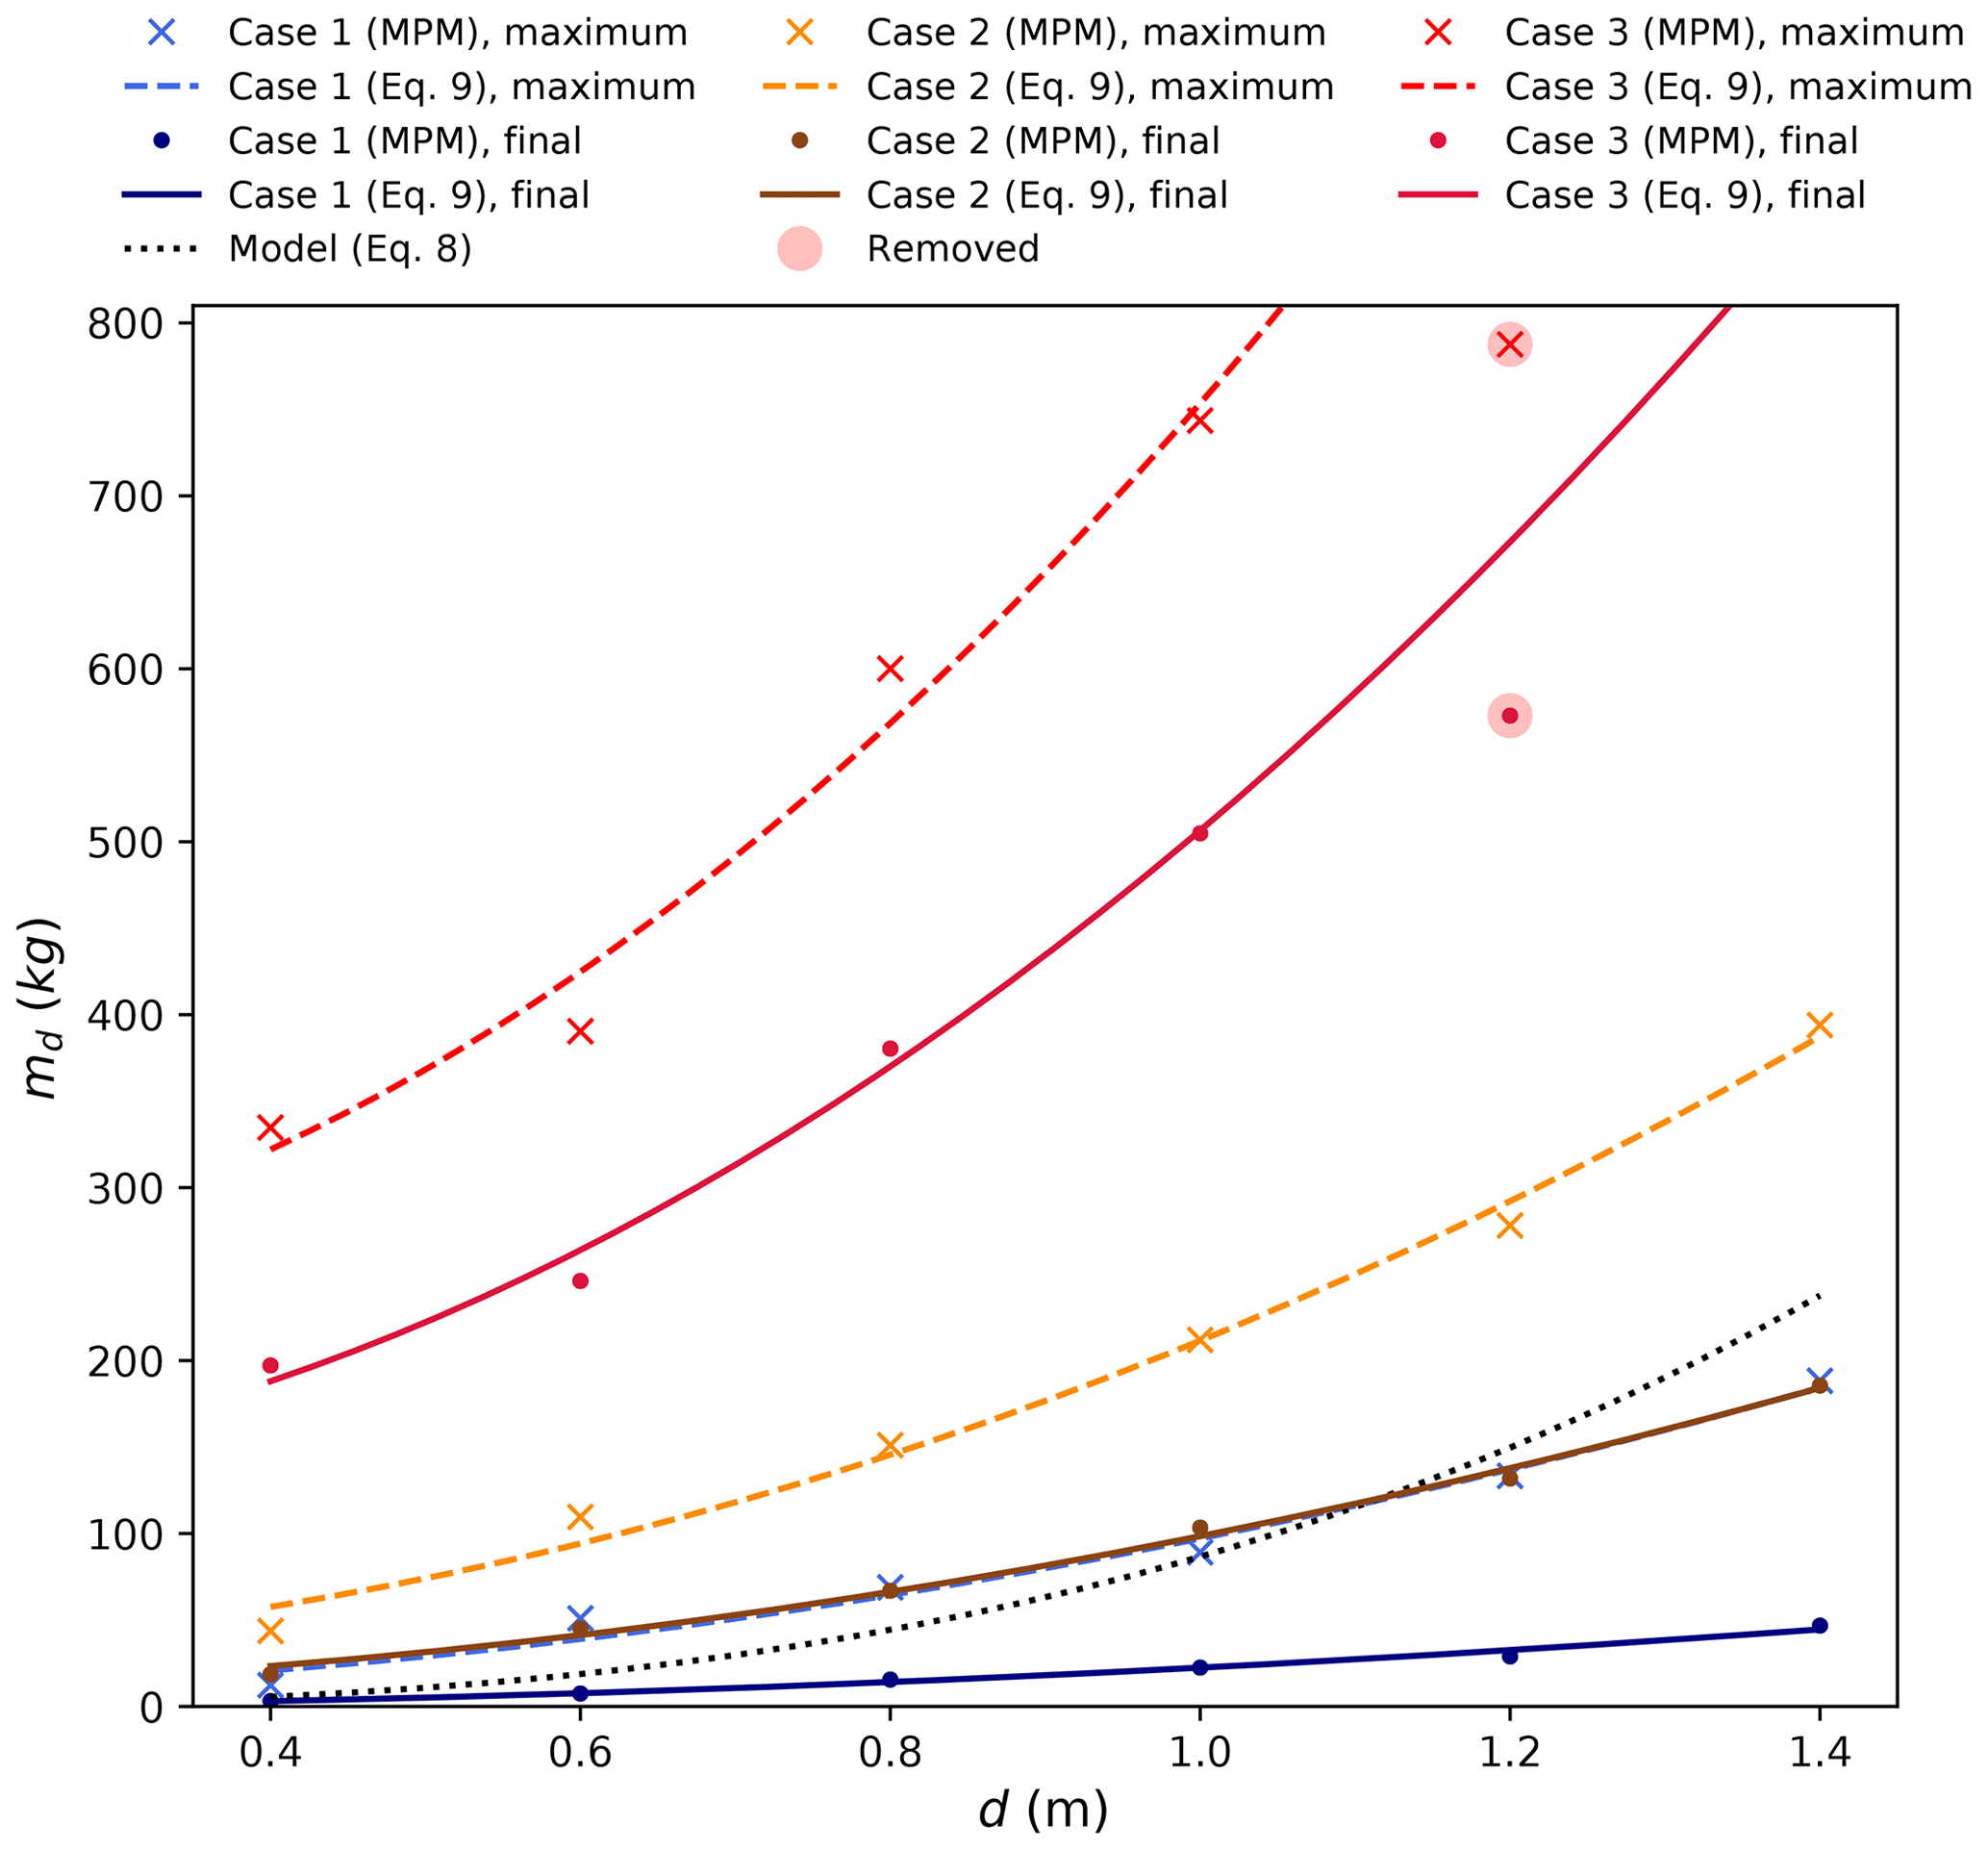
Figure 6Evolution of the detrainment mass observed for the one-tree arrangement and the fits with the tree diameter for three flow regimes: Case 1, Case 2, and Case 3 with a front velocity of respectively 12.5, 10.9, and 10.75 m s−1. “Maximum” refers to the maximum mass stored behind the tree and “final” refers to the final mass stored. A slope of 30∘ and a top wedge angle of 60∘ (from measurements Feistl et al., 2014) are used for the theoretical model (Eq. 8). The removed point denotes a special case not considered in the proposed square relation in Eq. (9) since the entire avalanche in this case is stopped due to the low flow velocity and the high tree diameter. Please note that it is a coincidence that Case 1 maximum and Case 2 final agree well.
Comparing the simulated final mass with the previous analytical proposal of Feistl et al. (2014), we can notice that this model is close to the flow in Case 2 calibrated for a tree diameter of 1 m. It proves that the calibration is consistent. However, the numerical result shows that the cubic model in Eq. (8) is not verified. This observation is in accordance with the analysis of the shape of the snow wedge behind the tree; indeed the height of the wedge is not linearly influenced by the tree diameter, whereas the diameter has a large effect on the length and the width of the wedge. Thus, the evolution of the stopped mass with the tree diameter follows a square law for each type of snow.

Figure 7Distribution of the maximum detrainment mass behind each tree during the avalanche (regular staggered forest, d=1 m, e=5.5 m, snow properties: Case 2): (a) v0=10 m s−1; (b) v0=22 m s−1.
While we dispose of the evolution of the detrainment mass with the tree diameter for the one-tree arrangement, in the case of an arrangement of several trees, the spatial distribution of the detrainment mass shows that trees interact with each other (Fig. 7). Comparing to the one-tree result, more snow is stopped for the first row than for the one-tree case, and for the lower rows the detrainment mass can be either underestimated or overestimated. This is not only a geometric effect, because the pattern of the spatial distribution of detrainment mass behind each tree depends on the velocity (Fig. 7). Thus, it reveals the difficulty to predict the distribution of detrainment mass. For a better understanding of the phenomenon, the study must be carried out at the forest scale, and study of the forest density would help to consider the collective behaviour and interaction of the trees.
Figure 8Evolution of the detrainment mass per unit of area with the tree diameter for different types of snow and front velocity (regular staggered forest, e=8 m).
For the study of a forest, the influence of tree diameter is examined by keeping the same forest density and changing the basal surface area per hectare , where Atrunk is the total area occupied by the trunks and Aforest the total forest area.
Figure 8 depicts that the same behaviour is observed for different velocities and snow properties, and the trend is similar to the case of one tree. These results suggest that the detrainment mass evolves according to a square law with the tree diameter (Eq. 9), with p3 and p4 (1 m−2) evaluated based on the least-squares method (Table 3).
4.2.2 Forest density
The effect of forest density is studied with a constant tree diameter of 0.6 m in Fig. 9a and a fixed stand density index (SDI) (Reineke, 1933) in Fig. 9b. The range of the adopted SDI from 400 to 1347 trees ha−1 in Fig. 9a corresponds to normal to very dense forests (Abegg et al., 2020). Figure 9a shows the evolution of the detrainment mass under the effect of the forest density, for different front velocities. In previous models (Feistl, 2015), it was assumed that the increase in the forest density only increases the number of trees/obstacles and consequently the number of wedges, which led to a linear law between the mass stopped and the forest density. However, our results suggest that the forest density has an influence on the stopped mass behind each individual tree. Indeed, compared to a forest with a lower density, a denser forest leads to more detrainment not only because there are more trees but also due to more stopped mass for each tree as snow jamming occurs. This increased detrainment due to the collective behaviour of the trees is observed for all the different velocities simulated. Based on the obtained simulation data, the cubic law is the best-fitting model; therefore the proposed law in Eq. (9) can be improved with consideration of the effect of forest density according to Eq. (10) below:
with p5 and p6 ((trees ha−1)−3) evaluated based on the least-squares method (Table 3).
Figure 9(a) Evolution of the detrainment mass per unit of area with the forest density for different front velocities (regular staggered forest, snow properties: Case 2, d=0.6 m). (b) Evolution of the detrainment mass per unit of area with the tree diameter for a constant stand density index of 925 trees ha−1 (regular staggered forest, v0=10 m s−1, snow properties: Case 2).
The evolution of the detrainment mass with the tree diameter is shown in Fig. 9b, where the stand density index is fixed at 925 trees ha−1, and the forest density is changing. When the tree diameter is small (d<0.6 m), the detrainment mass decreases with the tree diameter, due to the reduction of the forest density and the number of trees. Indeed, fewer trees give a weaker collective effect of the forest and thus stop less snow. A different trend is observed when the tree diameter becomes larger (d>0.6 m), indicating the competing roles played by the collective effect of the trees and the individual tree effect. The larger the tree diameter, the larger the stopped mass behind each individual tree, which changes the decreasing trend when the tree diameter is small. In addition to the simulation results, the prediction of the detrainment mass with the proposed model in Eq. (10) is shown in Fig. 9b. As observed, the model prediction agrees well with the simulation data, showing the good performance of the model and the possibility to use the stand density index in the model.
4.3 Model for detrainment mass
Based on the systematic study of the influence of the avalanche features and forest parameters, a model for the detrainment mass per unit of area can be proposed for a regular staggered forest (Eq. 11).
with Vf the frontal velocity of the avalanche when it reaches the forest, ρforest (trees ha−1) the number of trees per hectare, d the tree diameter, and the model parameters given in Table 3.
Figure 10 depicts the evolution of the detrainment mass predicted from Eq. (11) and that from MPM simulations, showing that the developed law in Eq. (11) predicts the detrainment mass well. As expected, Case 1 and Case 3 have the smallest and largest detrainment mass respectively.

4.4 Energy analysis of the avalanche–forest interaction
4.4.1 Evolution of energy and energy dissipation
After the evaluation of the detrainment mass, it is needed to quantify the effect of the detrainment process in the braking effect of forest against avalanches. To understand the physical process of the braking effect, the analysis of the evolution of the kinetic and potential energy with and without forest is made (Fig. 11). As expected, we observe when the avalanche enters the forest that the kinetic energy decreases while without forest the kinetic energy continues to increase steadily. An important difference of kinetic energy between the simulation with and without forest when the avalanche front reaches the bottom of the slope is observed, which confirms the significant braking effect of forest. In addition, in terms of potential energy, whereas the potential energy without forest decreases linearly as a function of time, with forest, due to the mass which stays on the slope, the potential energy decreases more slowly with time. Consequently at the end of the simulation, the potential energy does not vanish due to the detrainment mass stopped by the forest.
Figure 11Temporal evolution of the kinetic and potential energy without forest and with a regular staggered forest (Case 2, v0=6 m s−1).
To understand the kinetic energy loss with the forest, two physical processes are considered, namely detrainment and dissipation. First, a detrainment behaviour accounts for the stopped snow mass behind the trees, whose potential energy is not converted to kinetic energy. Considering the avalanche potential energy with and without forest, Epf and Ep0 respectively, the change of the potential energy due to the detrainment with the presence of the forest Epd can be defined as
Secondly, the dissipation process is associated with avalanche–tree interactions including collision and friction, which lead to plastic dissipation and random fluctuation. This dissipation due to the trees is defined as , whose calculation is detailed in Appendix A.
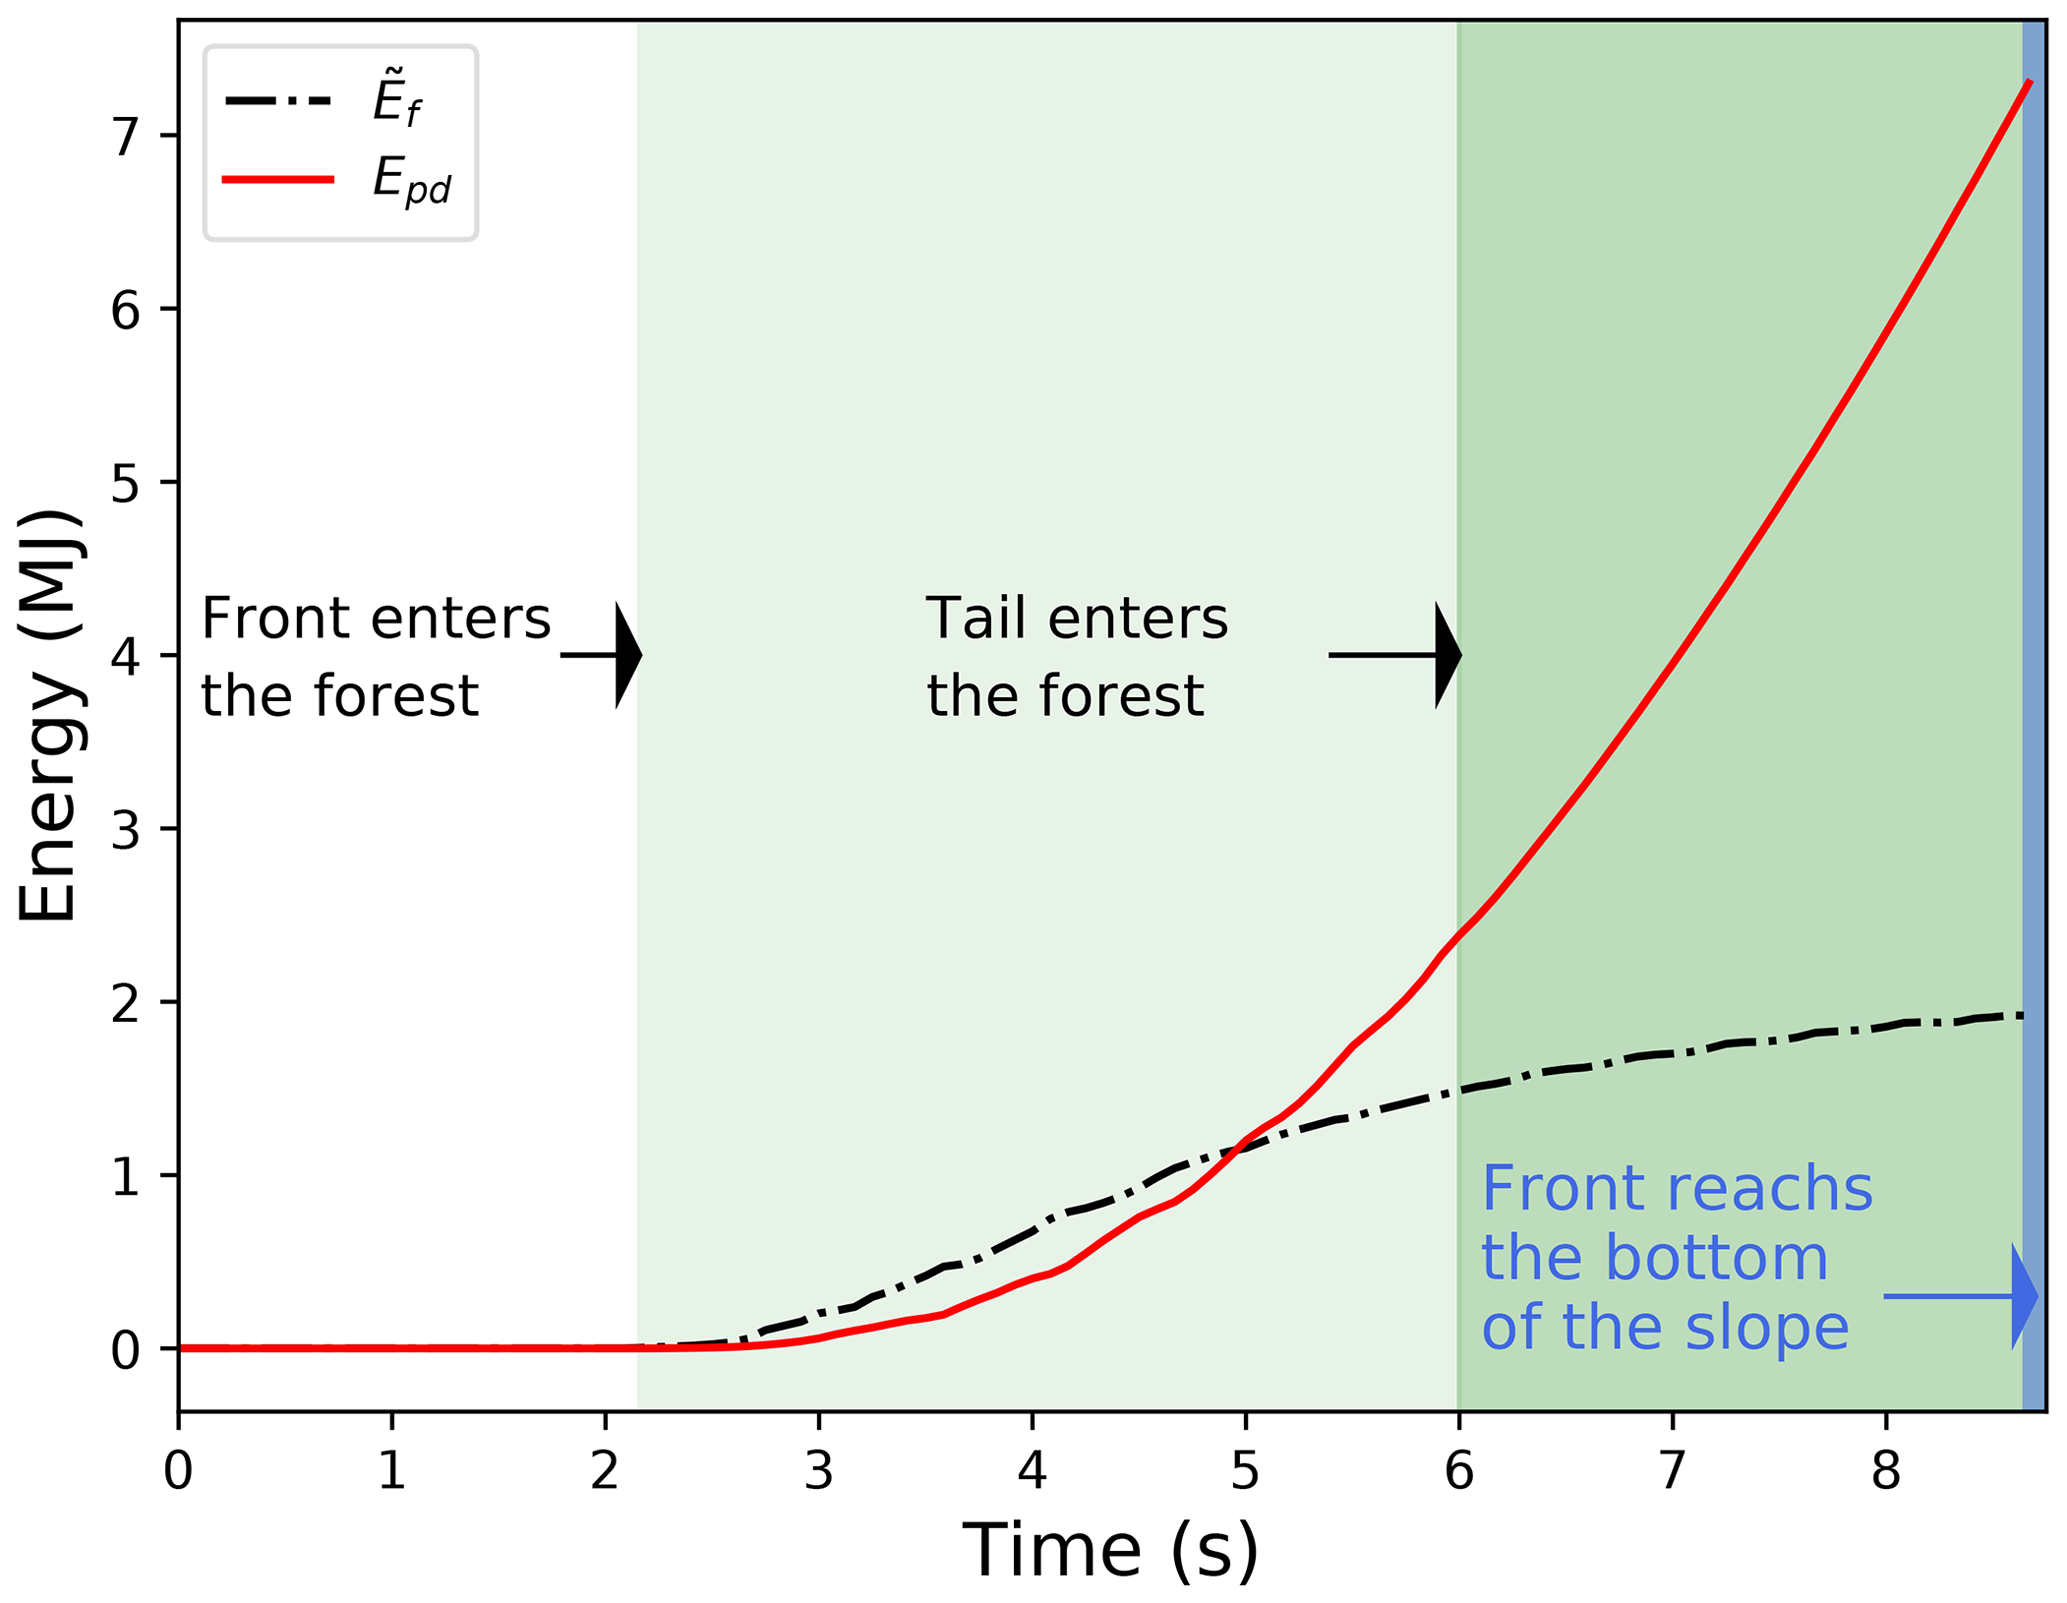
Figure 12Temporal evolution of the detrainment energy and dissipation due to the forest (Case 2, v0=6 m s−1).
Figure 12 shows the energy change due to the detrainment and dissipation processes (i.e. Epd and ), which contribute to the reduction of the avalanche kinetic energy with the forest. Taking the avalanche with forest as a reference, when its front enters the forest, the energy loss due to detrainment and dissipation starts to grow (at around 2.3 s in Fig. 12). The increasing rate of tends to decrease with time, as the velocity of the flow decreases (see the kinetic energy in Fig. 11) and the dissipation by ground friction reduces. In contrast, the growth rate of Epd increases with time. Indeed, after small wedges are formed behind and around the trees, the spacing between trees decreases, which leads to faster blockage of incoming snow particles. It should be noted that the forest enhances energy loss due to detrainment and dissipation but meanwhile reduces the avalanche velocity. Hence, the presence of the forest leads to lower energy dissipation due to ground friction, as it is positively correlated with the avalanche velocity.
4.4.2 Influence of the forest structure and the snow properties on the energy loss
The same experiment is carried out for three types of snow (Table 2) and three types of forest (regular aligned, regular staggered, and random) with the same forest density and tree diameter, in order to analyse the separate processes of detrainment and dissipation. Figure 13 depicts the detrainment and dissipation energies when the front of the avalanche reaches the bottom of the slope, where the front is defined as the first 1 % of the avalanche. It reveals that the detrainment represents a larger part of the energy loss compared to the dissipation. The detrainment increases with the cohesion and the internal friction of snow, whereas the dissipation due to forest changes slightly with the snow properties. For the three types of snow, the dissipation is higher for the regular staggered forest, due to the Galton board arrangement for which collisions and deflections are more frequent. The most notable difference for the different forest arrangements in Fig. 13 is that much lower detrainment is observed for the aligned forest, indicating that much less snow is stopped. Indeed, when trees are regularly aligned, a large part of the flow passes through the space between trees without collisions (Fig. 14). These results suggest that in the case of a regular forest, the staggered arrangement should be privileged for a better protective effect. The detrainment energy when the avalanche reaches the bottom of the slope is similar between the random and the regular staggered arrangements.
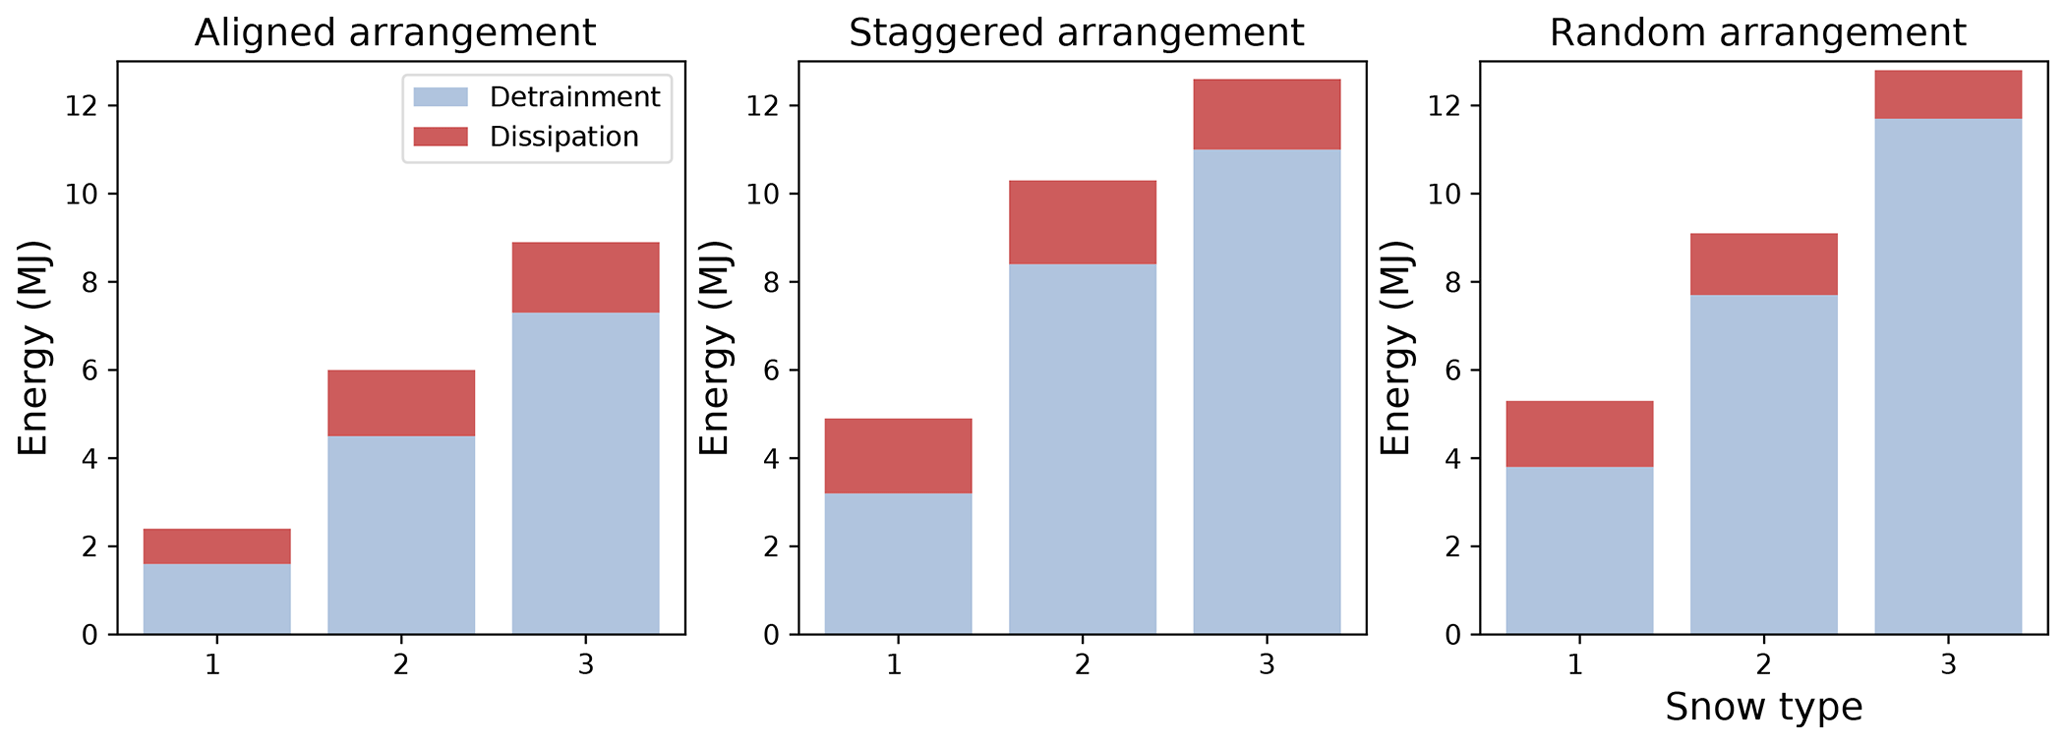
Figure 13Energy detrainment and dissipation for different snow properties (1: Case 1; 2: Case 2; 3: Case 3 with M=1) and for three types of forest structure (regular aligned, regular staggered, and random).
Given the same snow properties (e.g. Case 2), the final stopped mass with the aligned, staggered, and random arrangements is 2147, 3002, and 13061 kg respectively. The same trend is observed for other considered snow properties in this study (Cases 1 and 3). Compared to the regular aligned forest, the regular staggered forest stops more snow due to a smaller spacing (along the diagonal direction) between the trees (Fig. 14a and b). The random arrangement gives the highest stopped mass, as each tree cluster serves as a dam and collectively blocks a large amount of snow (Fig. 14c). Consequently, in terms of the final run-out distance, the avalanche in the random forest travels a shorter distance than that in the regular staggered forest, which suggests that the random one has a higher protective effect.
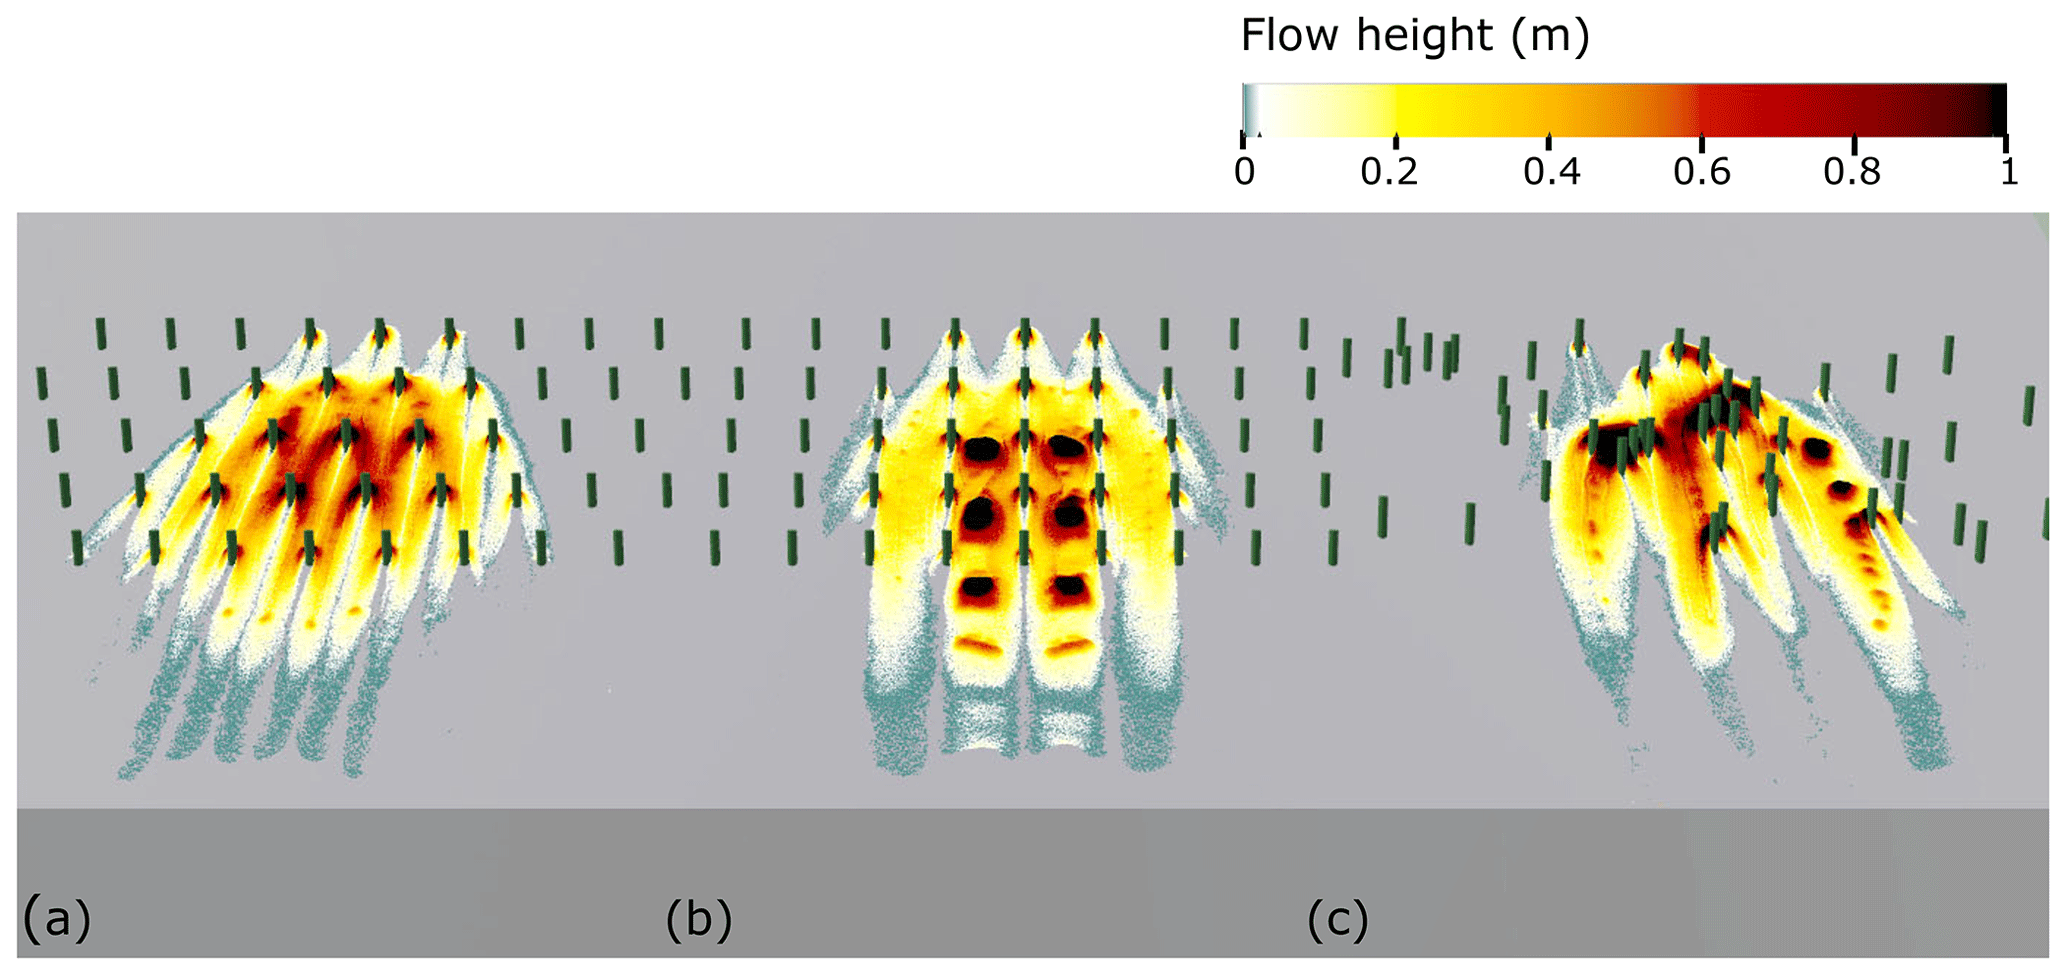
Figure 14Flow height of the avalanche in a forest with (a) staggered arrangement, (b) aligned arrangement, and (c) random arrangement, (Case 2, v0=6 m s−1).
In this study, we have explored the avalanche–forest interactions with the material point method (MPM) and an elastoplastic constitutive model. The aim is to highlight the dependencies of the detrainment mass and understand the physical process of the braking effect of forest with respect to avalanche dynamics. We have systematically examined the effect of snow properties, by studying both cold and warm snow. It is found that snow friction and cohesion have a large effect on detrainment mass behind the trees. Low snow friction and cohesion give fluid-like behaviour and highly sheared flows, and consequently little snow is stopped. When snow becomes more frictional and cohesive, large wedges and arches appear behind the trees, which contribute to the large amount of snow stopped. Due to the scarcity of the snow triaxial test (Scapozza and Bartelt, 2003), the snow parameters in our study are determined and calibrated according to their physical basis and previously conducted parametric study. Nevertheless in the future, these parameters could be evaluated based on extensive triaxial tests for different snow types.
Interestingly, our analysis of the effect of avalanche velocity reveals that the detrainment mass decreases with the velocity and reaches a plateau value for high velocities (typically higher than 15 m s−1). While the detrainment mass linearly decreases with increasing velocity in Feistl et al. (2014), our numerical results suggest a decrease with velocity square. Knowing the relation between the detrainment mass per unit of area Md and the detrainment coefficient (Feistl, 2015), the detrainment rate can be assessed, with Vf the front velocity, θ the slope angle, and lavalanche the avalanche length. For an open forest or old forests, Feistl et al. (2014) proposed a value of K=10 Pa independently of the snow properties and the front velocity. With our simulation results, for Case 1, we obtain a value of K=5.31 for a velocity of 7.4 m s−1 and K=32.4 for a velocity of 24 m s−1, while for Case 2, we obtain K=10.1 for a velocity of 7.7 m s−1 and K=86.6 for a velocity of 24.7 m s−1. This underlines a high dependency of the detrainment coefficient on the snow properties and on the front velocity of the avalanche. The comparison with the previous value (Feistl et al., 2014) of K for an open forest suggests that it is only valid for low velocities. When the avalanche velocity is high, the plateau stage of the detrainment mass obtained from our study is higher than the decreasing stage by Feistl et al. (2014). Consequently, an implementation of our proposed velocity-based model would lead to higher detrainment mass, which results in lower runout distance and smaller velocity.
In addition, we have examined different forest arrangements, by varying the forest density and the tree diameter, which both can easily be identified from a forest inventory or remote sensing (Bebi et al., 2016). It is found that the detrainment mass increases with the cube of forest density and the square of tree diameter. Contrary to the geometric model proposed by Feistl et al. (2014), we found that the height of the wedge does not vary linearly with the tree diameter. This comprehensive numerical investigation allowed us to propose a unified law for the detrainment mass (Eq. 11). Therefore, it enables an estimation of the K value as shown before, which may serve as an input to 2D depth-averaged methods to better predict the detrainment mass.
From an energy point of view, our results suggest that the detrainment has the largest influence on the energy loss, which claims the use of the detrainment approach. However, the additional dissipation due to forest () is not negligible, although the detrainment approach removes not only the potential energy of the removed particles but also their kinetic energy. In view of the kinetic energy levels compared to the dissipation added with forest, the kinetic energy of the particles removed seems too low to represent the dissipation added with forest. This result implies that an increase in the bed friction in combination with the detrainment approach could be justified to take into account the increase in energy dissipation linked to the effect of forest.
The presented research focuses on examining the interaction between forest and avalanches with idealized conditions, which allow new outlooks for further studies. Here, trees are modelled as rigid obstacles and with a no-slip boundary condition. Hence, this study is only valid for small to medium avalanches where the forest is not destroyed, and the trees act as obstacles. Secondly taking into account the true friction coefficient of the tree would allow us, as suggested by Teich et al. (2014), to define a law for different species. In the future, adding a parameter to account for forest type, crown cover and surface roughness based on remote sensing data (Brožová et al., 2020) could help the operation of the proposed model and improve the evaluation of detrainment in Bayesian networks for risk assessment (Stritih, 2021).
Furthermore, slope angle can affect the detrainment mass, as it can significantly vary with the front velocity Vf. However, its effect on the geometry of the wedges is closely related to other factors like avalanche velocity and bed friction and therefore is difficult to be quantified independently. Future studies on the relation between the effect of slope angle and that of other factors will need to be conducted to introduce slope angle in our proposed model for the detrainment mass. In addition, the consideration of a slope with a constant inclination is an ideal condition. This could be further changed to any other shape to be more realistic, and other tree arrangements could be explored as well. It would also be interesting to study longer forest with larger released volumes, to obtain longer permanent regimes; this would however significantly increase the computational time.
Moreover, this study focuses only on the avalanche dynamics and not on the release in forest area; therefore the conclusions on the effect of forest arrangement should be carefully interpreted in practical forest design for avalanche mitigation. As the avalanche release could be greatly affected by the forest as well, it is interesting to investigate the stabilization of snowpack under the effect of trees using MPM simulations in the future.
Despite the assumptions and idealization applied in this study, it highlights the main factors influencing the detrainment mass in a unique law depending on snow mechanical properties, front velocity, and forest parameters. This outcome of this work can be applied not only for calibration of depth-averaged models used operationally (e.g. Christen et al., 2010), but also for forest management. Moreover, according to energy analysis, a good calibration of the detrainment approach seems to be not enough to model all processes driving avalanche–forest interaction. This suggests that an approach combining detrainment and friction increase could be more appropriate. Finally, although this study focused on snow avalanches, the methods used and the general relationships found are also relevant to other geophysical mass flows interacting with forests and can pose strong impacts on hazard assessment and risk management.
By defining Δe the additional dissipation at each time step, it is possible to separate it into two parts (Li et al., 2020): the dissipation inside the flow wint and through the boundary bed wb, and in the case of forest, the dissipation is added. Hence, the total dissipation in the case without forest is , as the internal dissipation can be negligible compared to the bed friction dissipation (Li et al., 2020). Similarly, in the forest case .
As the velocity of the avalanche is reduced with forest, the frictional dissipation with the ground decreases. To evaluate the dissipation added with forest, we can not simply subtract the dissipation obtained with and without forest. Therefore we use Eq. (A1), which allows us to calculate based on our simulations. Indeed, by replacing the expression of Δe0 and Δef (Eq. A2), and by assuming that the bed dissipation wb depends linearly on the velocity (i.e ) (Eq. A2), the definition of the dissipation added due to forest is obtained (Eq. A3). So at the time step n, with Δt the time step, it is possible to obtain the total dissipation added by the forest .
All the data used in the figures in this paper are on Zenodo at https://doi.org/10.5281/zenodo.6121811 (Védrine et al., 2022). A detailed description of the MPM model can be found in a previous publication at https://doi.org/10.1038/s41467-018-05181-w (Gaume et al., 2018).
Videos of the simulations presented in Figs. 2, 3, 4, and 14 are available on Zenodo at https://doi.org/10.5281/zenodo.5547386 (Védrine et al., 2021).
LV performed the simulations, made the figures and videos, analysed the results, and wrote the paper under the supervision of XL and JG. XL prepared the numerical setup of the simulations. JG designed the study and obtained the funding. All authors were involved in the writing of the paper and physical interpretation of the results.
The contact author has declared that neither they nor their co-authors have any competing interests.
Publisher’s note: Copernicus Publications remains neutral with regard to jurisdictional claims in published maps and institutional affiliations.
We acknowledge Perry Bartelt and Peter Bebi from SLF, Davos for insightful discussions on the topic of avalanche–forest interaction and the detrainment approach. We also thank Jean-Louis Gay from the Vaud Canton and Clara Streule and Francesc Molné from EPFL for their preliminary contribution on the topic in the framework of an EPFL Design Project motivated by a forest fire in an avalanche-prone area (Les Diablerets). Finally, we thank Martin Proksch from the Wallis Canton and Andreas Tegethoff from Geoformer for constructive suggestions for the practical application of this work.
This research has been supported by the Swiss National Science Foundation (grant nos. PCEFP2_181227 and CRSK-2_195914).
This paper was edited by Oded Katz and reviewed by three anonymous referees.
Abegg, M., Brändli, U.-B., Cioldi, F., Fischer, C., Herold, A., Meile, R., Rösler, E., Speich, S., and Traub, B.: Swiss national forest inventory – Result table No. 815491: forest area Birmensdorf, Swiss Federal Research Institute WSL, https://doi.org/10.21258/1679353, 2020. a
Bartelt, P. and Stöckli, V.: The influence of tree and branch fracture, overturning and debris entrainment on snow avalanche flow, Ann. Glaciol., 32, 209–216, https://doi.org/10.3189/172756401781819544, 2001. a
Bebi, P., Feistl, T., Teich, M., Margreth, S., and Bartelt, P.: Accounting for forest effects in avalanche models and risk analysis, in: 13th congress INTERPRAEVENT 2016, edited by: Koboltschnig, G., 30 May to 2 June 2016, Lucerne, Switzerland, Extended abstracts “Living with natural risks”, 184–185, International Research Society INTERPRAEVENT, 2016. a
Brozžová, N., Fischer, J.-T., Bühler, Y., Bartelt, P., and Bebi, P.: Determining forest parameters for avalanche simulation using remote sensing data, Cold Reg. Sci. Technol., 172, 102976, https://doi.org/10.1016/j.coldregions.2019.102976, 2020. a, b
Christen, M., Kowalski, J., and Bartelt, P.: RAMMS: Numerical simulation of dense snow avalanches in three-dimensional terrain, Cold Reg. Sci. Technol., 63, 1–14, https://doi.org/10.1016/j.coldregions.2010.04.005, 2010. a, b
De Biagi, V., Chiaia, B., and Frigo, B.: Vulnerability of buildings against avalanche hazard, Snow engineering VII: proceedings of the seventh international conference on snow engineering, 2012. a
Feistl, T.: Vegetation effects on avalanche dynamics, PhD thesis, Technische Universität München, 2015. a, b
Feistl, T., Bebi, P., Bühler, Y., Christen, M., Teich, M., and Bartelt, P.: Stopping behavior of snow avalanches in forests, in: Proceedings of the International Snow Science Workshop ISSW, Anchorage, Alaska, https://arc.lib.montana.edu/snow-science/item/1712, 420–426, 2012. a
Feistl, T., Bebi, P., Teich, M., Bühler, Y., Christen, M., Thuro, K., and Bartelt, P.: Observations and modeling of the braking effect of forests on small and medium avalanches, J. Glaciol., 60, 124–138, https://doi.org/10.3189/2014JoG13J055, 2014. a, b, c, d, e, f, g, h, i, j, k, l, m, n, o, p, q
Gaume, J., Gast, T., Teran, J., van Herwijnen, A., and Jiang, C.: Dynamic anticrack propagation in snow, Nat. Commun., 9, 1–10, https://doi.org/10.1038/s41467-018-05181-w, 2018. a, b, c, d
Gaume, J., van Herwijnen, A., Gast, T., Teran, J., and Jiang, C.: Investigating the release and flow of snow avalanches at the slope-scale using a unified model based on the material point method, Cold Reg. Sci. Technol., 168, 102847, https://doi.org/10.1016/j.coldregions.2019.102847, 2019. a
Gruber, U. and Bartelt, P.: Snow avalanche hazard modelling of large areas using shallow water numerical methods and GIS, in: SI: Modelling, computer-assisted simulations, and mapping of dangerous phenomena for hazard assessment, Environ. Modell. Softw., 22, 1472–1481, https://doi.org/10.1016/j.envsoft.2007.01.001, 2007. a
Jiang, C., Schroeder, C., Selle, A., Teran, J., and Stomakhin, A.: The Affine Particle-in-Cell Method, ACM Trans. Graph., 34, 1–10, https://doi.org/10.1145/2766996, 2015. a
Kyburz, M., Sovilla, B., Gaume, J., and Ancey, C.: Decoupling the Role of Inertia, Friction, and Cohesion in Dense Granular Avalanche Pressure Build‐up on Obstacles, J. Geophys. Res.-Earth, 125, e2019JF005192, https://doi.org/10.1029/2019JF005192, 2020. a
Lai, P.-Y., Pak, H., and To, K.: Jamming of Granular Flow in a Two-Dimensional Hopper, Phys. Rev. Lett., 86, 71–74, https://doi.org/10.1103/PhysRevLett.86.71, 2001. a
Li, X., Sovilla, B., Jiang, C., and Gaume, J.: The mechanical origin of snow avalanche dynamics and flow regime transitions, The Cryosphere, 14, 3381–3398, https://doi.org/10.5194/tc-14-3381-2020, 2020. a, b, c, d, e, f
Li, X., Sovilla, B., Jiang, C., and Gaume, J.: Three-dimensional and real-scale modeling of flow regimes in dense snow avalanches, Landslides, 18, 3393–3406, https://doi.org/10.1007/s10346-021-01692-8, 2021. a
Luong, T. T. H., Baker, J., and Einav, I.: Spread-out and slow-down of granular flows through model forests, Granul. Matter, 22, 1–10, https://doi.org/10.1007/s10035-019-0980-9, 2020. a
Perzl, F., Bono, A., Garbarino, M., and Motta, R.: Protective effects of forests against gravitational natural hazards, in: Protective forests as Ecosystem-based solution for Disaster Risk Reduction (Eco-DRR), edited by: Teich, M., Accastello, C., Perzl, F., and Kleemayr, K., IntechOpen, London, https://www.intechopen.com/online-first/77984 (last access: 21 March 2022), 2021. a
Reineke, L. H.: Perfection a stand-density index for even-aged forest, J. Agric. Res., 46, 627–638, 1933. a
Sadrekarimi, A. and Olson, S.: Critical state friction angle of sands, Géotechnique, 61, 771–783, https://doi.org/10.1680/geot.9.P.090, 2011. a
Scapozza, C. and Bartelt, P.: Triaxial tests on snow at low strain rate. Part II. Constitutive behaviour, J. Glaciol., 49, 91–101, https://doi.org/10.3189/172756503781830890, 2003. a
Stomakhin, A., Schroeder, C., Chai, L., Teran, J., and Selle, A.: A Material Point Method for Snow Simulation, ACM Trans. Graph., 32, 1–10, https://doi.org/10.1145/2461912.2461948, 2013. a
Stritih, A.: Dealing with uncertaintiesin the assessment of the avalancheprotective effects of forests, in: Protective Forests as Ecosystem-Based Solution for Disaster RiskReduction (Eco-DRR), edited by: Teich, M., Accastello, C., Perzl, F., and Kleemayr, K., London, IntechOpen, https://www.intechopen.com/online-first/78297 (last access: 21 March 2022), 2021. a
Takeuchi, Y., Nishimura, K., and Patra, A.: Observations and numerical simulations of the braking effect of forests on large-scale avalanches, Ann. Glaciol., 59, 50–58, https://doi.org/10.1017/aog.2018.22, 2018. a
Teich, M., Bartelt, P., Grêt-Regamey, A., and Bebi, P.: Snow Avalanches in Forested Terrain: Influence of Forest Parameters, Topography, and Avalanche Characteristics on Runout Distance, Arct. Antarct. Alp. Res., 44, 509–519, https://doi.org/10.1657/1938-4246-44.4.509, 2012a. a
Teich, M., Vasella, I., Bartelt, P., Bebi, P., Feistl, T., and Grêt, A.: Avalanche simulations in forested terrain: a framework towards a bayesian probabilistic model calibration, Montana State UniversityLibrary, Bozeman, MT, , in: Proceedings of the International Snow Science Workshop (ISSW), Anchorage, Alaska, 16–21 September 2012, http://arc.lib.montana.edu/snow-science (last access: 21 March 2022), 2012b. a, b
Teich, M., Fischer, J.-T., Feistl, T., Bebi, P., Christen, M., and Grêt-Regamey, A.: Computational snow avalanche simulation in forested terrain, Nat. Hazards Earth Syst. Sci., 14, 2233–2248, https://doi.org/10.5194/nhess-14-2233-2014, 2014. a, b, c
Védrine, L., Li, X., and Gaume, J.: Supplementary videos for “Detrainment and braking of snow avalanches interacting with forests”, Zenodo [video], https://doi.org/10.5281/zenodo.5547386, 2021. a
Védrine, L., Li, X., and Gaume, J.: Supplementary data for “Detrainment and braking of snow avalanches interacting with forests”, Zenodo [data set], https://doi.org/10.5281/zenodo.6121811, 2022. a
Viglietti, D., Letey, S., Motta, R., Maggioni, M., and Freppaz, M.: Snow and avalanche: The influence of forest on snowpack stability, ISSW 09 – International Snow Science Workshop, Proceedings, Davos, Switzerland, 323–327, 2009. a
Voellmy, A.: Uber die Zerstörungskraft von Lawinen, Schweizerische Bauzeitung, 73, 159–162, 1955. a
- Abstract
- Introduction
- Methodology and setup
- Calibration with a documented case
- Results
- Discussion and conclusions
- Appendix A: Calculation of energy dissipation due to forest
- Code and data availability
- Video supplement
- Author contributions
- Competing interests
- Disclaimer
- Acknowledgements
- Financial support
- Review statement
- References