the Creative Commons Attribution 4.0 License.
the Creative Commons Attribution 4.0 License.
 | 15 Mar 2021
Evolution of surface deformation related to salt-extraction-caused sinkholes in Solotvyno (Ukraine) revealed by Sentinel-1 radar interferometry
Sándor Gönczy
István Bozsó
László Bányai
Alexandru Szakacs
Csilla Szárnya
Viktor Wesztergom
Rock salt has remarkable mechanical properties and high economic importance; however, the strength of salt compared to other rocks makes it a rather vulnerable material. Human activities could lead to acceleration of the dissolution of soluble rock salt and collapse of subsurface caverns. Although sinkhole development can be considered a local geological disaster regarding the characteristic size of surface depressions, the deformations can result in catastrophic events. In this study we report the spatiotemporal evolution of surface deformation in the Solotvyno salt mine area in Ukraine based on Sentinel-1 interferometric synthetic aperture radar measurements. Although the mining operations were finished in 2010, several sinkholes have been opened up since then. Our results show that despite the enormous risk management efforts, the sinkholes continue to expand with a maximum line-of-sight deformation rate of 5 cm/yr. The deformation time series show a rather linear feature, and unfortunately no slowdown of the processes can be recognized based on the investigated 4.5-year-long data set. We utilized both ascending and descending satellite passes to discriminate the horizontal and vertical deformations, and our results revealed that vertical deformation is much more pronounced in the area. Analytical source modeling confirmed that the complex deformation pattern observed by Sentinel-1 radar interferometry has a direct connection to the former mining activity and is confined to the mining territory. With the 6 d repetition time of Sentinel-1 observations, the evolution of surface changes can be detected in quasi real time, which can facilitate disaster response and recovery.
- Article
(20928 KB) - Full-text XML
-
Supplement
(315 KB) - BibTeX
- EndNote


Large-volume rock salt deposits formed in the Carpathian–Pannonian region in its both internal (in the Transylvanian Basin) and external (along the outer margins of the Carpathian fold-and-thrust belt) parts during Badenian times, when those areas were communicating with each other. The Transylvanian Basin is a place of unique rock salt storage, where salt layers of a few tens of meters thick were deposited and later deformed by diapirism. Large volumes of salt migrated towards the margins of the basin due to the uneven loading of the overburden, forming two basin margin-parallel belts of large-sized diapirs (Krézsek and Bally, 2006). Likewise, the salt layer deposited at the outer margin of the Carpathians was deformed, generating diapiric bodies known and exploited at many locations along the East Carpathians and South Carpathians in Ukraine and Romania. Solotvyno (Aknaszlatina, according to its local Hungarian name), located at the Ukrainian side of the northern East Carpathians, is one of them.
The western and eastern salt lineaments along the Transylvanian Basin, as well as the salt bodies along the external East and South Carpathians, offered a valuable mineral resource for centuries in the past. Salt is still extracted industrially at some of them. Nowadays, salt mines are again in the spotlight but for a different reason. Many of them, particularly the abandoned ones, pose a threat to populated residential areas, infrastructure and environment because of the uncontrolled processes of suffusion and collapse of the old underground exploitation cavities (Deák et al., 2007; Móga et al., 2015, 2019; Zechner et al., 2019). One of the severely affected localities is Solotvyno, where collapse of subsurface caverns in the past resulted in dolines, temporally filled with brine and with a size of 150–230 m in diameter. Figure 1 illustrates the most recent sinkholes that developed in the area in 2012.
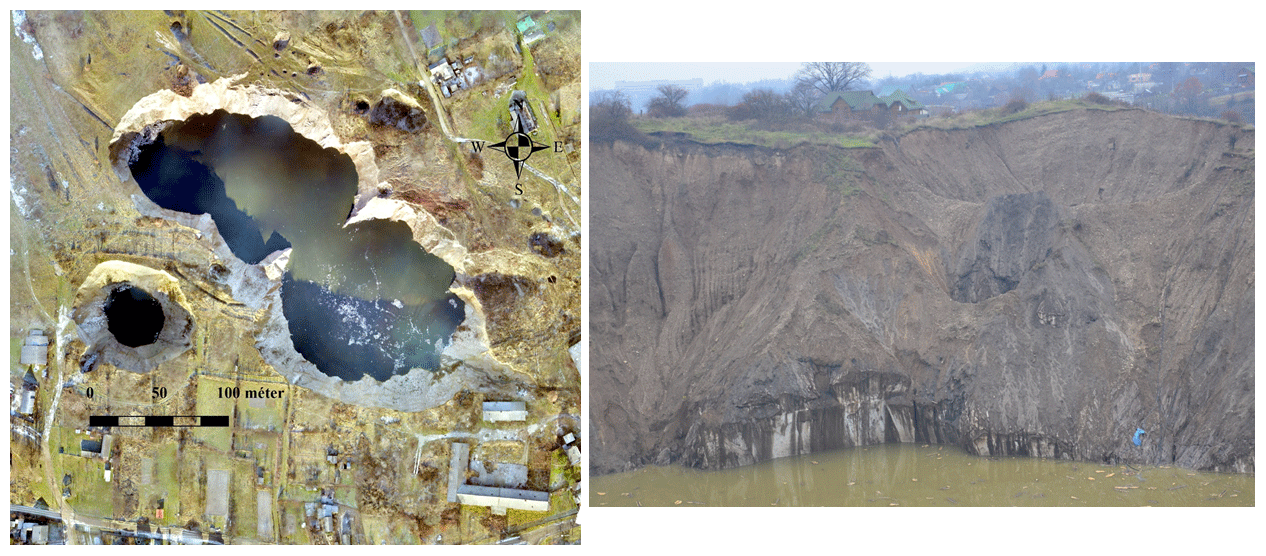
Figure 1Pictures of some sinkholes in the Solotvyno salt mining area (credit: Sándor Gönczy).
Continuous monitoring of the evolution of such depressions and progression of sinkholes that develop on top of old human-made excavations is essential to delineate unstable topographic surfaces and identify risk-prone areas in order to mitigate the threats. This requires high-resolution spatiotemporal observations (e.g., a dense network of measurement points) to follow and map the dynamics of the ongoing processes. Such a goal can be accomplished by using recently developed Earth observation techniques (Elliott et al., 2016; Li et al., 2016).
The objective of this study is to assess the current state of the salt-mine-related deformations in the Solotvyno area caused by ground collapses in the past and to identify potential small-scale and dynamic surface variations related to dissolution cavities, which could result in further ground depressions and collapses of the abandoned salt-exploitation cavities in the future. Although the issue is well-known, no dedicated terrestrial monitoring network has been installed in the area yet. Therefore, Sentinel-1 satellite interferometry can offer a unique opportunity to support the early identification of areas prone to sinkhole occurrence. The impact of salt-dissolution-related cavity collapse is not merely a local problem, but it could be amplified to a regional-scale issue in the future owing to the proximity of the Tisa, one of the main rivers in central and eastern Europe crossing several borders (Ukraine, Slovakia, Hungary, Romania, Serbia). As the water-infiltration-caused sinkhole development propagates beyond the boundary of the mining area, inhabited areas will be endangered. Some parts of the city of Solotvyno have already been evacuated. However, besides the economic loss, the ecological impact of brine migrating into the underground freshwater system and eventually into the Tisa can be catastrophic. Recognizing the environmental threat, the European Commission has devoted considerable funds to support emergency preparedness, environmental protection, safety and security in the area. Pollution of the freshwater river with brine can have unforeseeable consequences similar to the environmental disaster caused by sequences of metal pollution originating from Romanian mining accidents at the beginning of 2000.
Of the Ukrainian Subcarpathian territory, 80 % is a mountainous area; the remaining 20 % comprises a low-lying flat topography including two parts: the Chop–Mukachevo plain and the Marmarosh or Solotvyno basin extending southward in Romania across the state border (Chis and Kosinszki, 2011; Nakapelukh et al., 2017). The Solotvyno basin hosts most of the shallow subsurface salt domes, 16 of 19 in total, known in the Ukrainian Subcarpathians (Bosevs'ka, 2015). Starting from the town of Khust in the west, this 50 km long and 22 km wide elongated basin extends with diminishing width in the ESE direction. Its Ukrainian part is bounded by the Vihorlat–Gutin Neogene volcanic range to the west and south and the Carpathian thrust-and-fold belt to the north and east (Fig. 2).

Figure 2Geological sketch map of the Ukrainian Subcarpathians compiled from © Cis, 1962; © Shakin, 1976; © Tyitov et al., 1979; © Herenchuk, 1981; © Glusko and Kruglov, 1986; © Kyiv State Cartographic Office, 2000; © Kuzovenko, 2001.
The Solotvyno salt diapir has a remarkable size (Bosevs'ka and Khrushchov, 2011). It has an elongated pear shape, oriented in the northwest–southeast direction, with a surface area of approximately 1×10⁶ m2 (Fig. 3a and c). The largest depth of the salt body is ca. 2 km, whereas its width varies between 200 and 800 m in the westernmost and easternmost parts, respectively. The salt diapir lies beneath a thick layer of gravel, embedded in sandstone at an average depth of 25–30 m. The formation is covered with a thin, gray salt layer, the so-called pallag (layers of salt and clay), which functions as a waterproof layer, hindering the formation of natural salt karst. The earliest salt extractions were started by the method of dissolution, where the pallag layer was missing. As a result of the large-volume industrial mining, cutting through the sealing pallag layer was inevitable which raised the possibility of flooding. Another factor, which makes the situation much more severe, is the closeness of the Tisa. The riverbed changed over time as the diapir emerged, and nowadays the river flows around the salt body from a southern direction. The gradient of the riverbed is rather high, about 15 m within a few kilometers (Fig. 3b). During the great floods of the river the water infiltrates towards the salt body and causes serious damage, where the waterproof layers are missing. Such events happened in 1998, 2001 and 2007 (Móga et al., 2015, 2017), contributing to the shutdown of the mines.
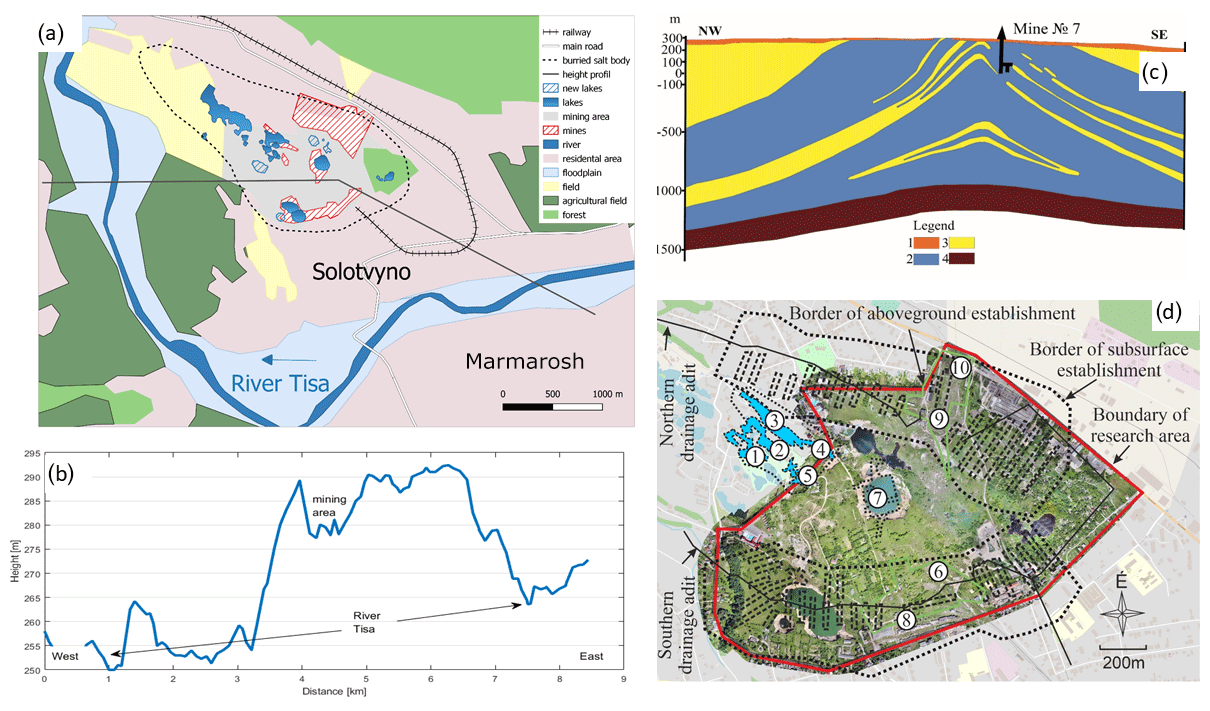
Figure 3The investigated area. (a) Overview map of Solotvyno and its surroundings, showing the approximate location of the salt dome. Lakes with hatch pattern show sinkholes opened after the detailed geomorphological mapping of © Móga et al. (2015). (b) Topographic profile across the section (black line) marked in (a). (c) Geological cross section of the Solotvyno salt dome. Legend: (1) fluvial sediments; (2) Tereblya Formation; (3) Solotvyno Formation; (4) Novoselytsa Formation. (d) Detailed picture of the area with the salt mines shown on a UAV map. (1) Kristina mine; (2) Albert mine; (3) Kunigunda mine; (4) Nicholas mine; (5) Joseph mine; (6) Old Louis mine; (7) Francis mine or mine 7; (8) New Louis mine or mine 8; (9) mine 9; (10) mine 10. Lakes are depicted in blueish shades.
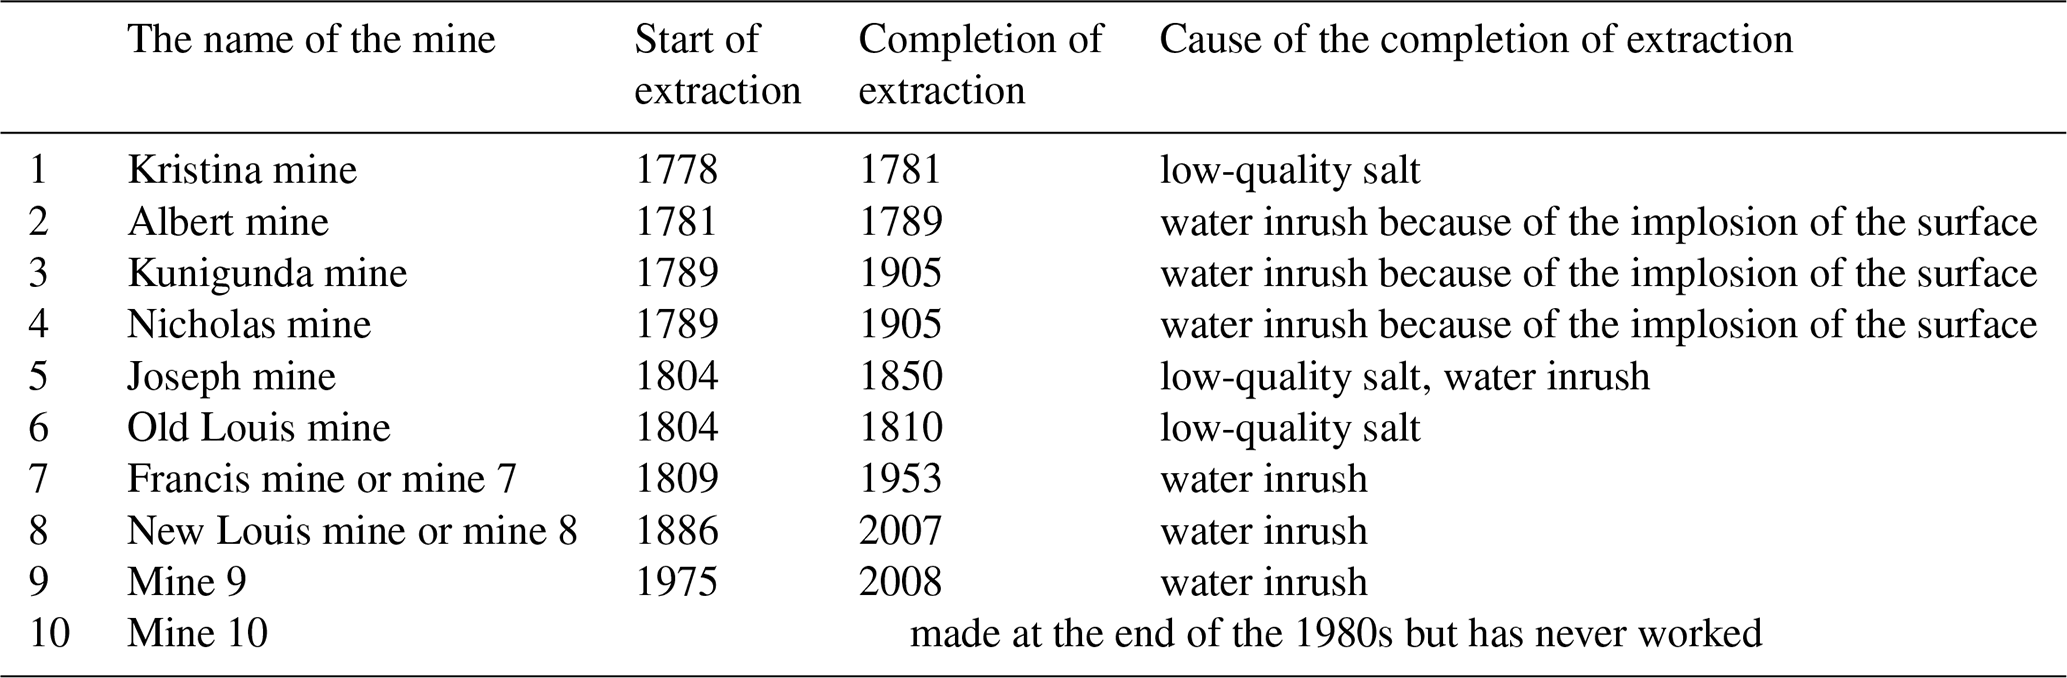
Exploitation of salt in Solotvyno has a long history; however, industrial-scale production only began in the 18th century. Since the opening of the first mine in 1778, a total of 10 mines have operated in the area (Fig. 3d, Table 1). The 8th (Lajos) and the 9th mines were used for the longest time span; the others were operated for a relatively short period of time. At the end of the 1980s and beginning of the 1990s a new so-called 10th mine was developed, but there was no exploitation here at all (Bosevs'ka and Khrushchov, 2011). The available total salt reserves are estimated at about 2×10⁹ t. At the beginning of the 1990s about 10 % of Ukrainian salt production was mined in Solotvyno, with an estimated yearly rate of 5×10⁵ t. Prior to the industrial extraction of rock salt, only small-scale karst formations were observed at the surface of the area affected by mining. The development of salt karst processes accelerated in such a way after the beginning of the large-volume industrial mining operations that nowadays it is almost impossible to mine rock salt at all.
Environmental and economic problems of Solotvyno salt mines gained more and more public attention after 2000, and at the beginning of 2010 the city was categorized by authorities as a disaster-prone area. Several studies have been conducted in the past related to the salt operations, but these were limited to the investigation of the location, geology and formation conditions of the salt diapir and the possibilities of salt exploitation. Gaidin (2008) has drew attention to the problems of salt karst formation processes in 2008. He analyzed karst development thoroughly and presented the dissolution process of the pillars and the resulting change in stability of mine shafts. Diakiv and Bilonizhka (2010) presented an overview of the geological outline of the Solotvyno salt mine, and in addition they described the stage of salt karst formation in 2010 in detail. They also highlighted the poor conditions of the drainage system around the cultivated areas with an emphasis that it could lead to the leakage of an increased amount of freshwater into the karst system. Diakiv (2012) has also investigated the salt karst formation in the area based on the studies of two mines. Bosevs'ka and Khrushchov (2011) discussed the possibilities of disaster response and mitigation. Meanwhile, several research teams have simultaneously started to examine the ongoing surface processes and resulting formations mainly by ground-based geomorphological mapping procedures or participatory GIS analysis, respectively (Móga et al., 2015, 2017; Onencan et al., 2018).
Interferometric synthetic aperture radar (InSAR) is a remote sensing technique which operates with microwaves. The satellite emits electromagnetic radiation and detects the signal reflected from the surface. By exploiting the coherent phase difference in the time-separated synthetic aperture radar (SAR) scenes, information on the possible ground deformation can be retrieved. The great advantage of microwave radar interferometry is that it allows for the monitoring of areas in all-weather conditions and the studying of surface deformations of natural or anthropogenic origin even in areas with difficult access. The ESA Copernicus Sentinel-1 mission is the first of its kind in the sense that it ensures coordinated global observations with unprecedentedly wide spatial coverage and with unrivaled measurement frequency (6 d for Europe and 12 d for other parts of the globe) and is freely accessible for users (European Space Agency, 2013). Therefore, Sentinel-1 radar interferometry enables the detection of surface topographic changes from a small scale to high magnitude with a high density of measurements points, and due to the frequent repetition time of the satellite it allows for the studying of the dynamics of numerous surface processes (Strozzi et al., 2013; Elliott et al., 2016).
Sentinel-1 is a twin constellation (Sentinel-1A was launched in 2014, Sentinel-1B in 2016) of C-band (wavelength ∼ 5.5 cm) satellites separated by 180∘ in orbit. The main acquisition mode of Sentinel-1 over land is TOPS (terrain observation with progressive scans), which employs the generation of the wide-swath so-called IW mode (250 km) SAR products with a medium spatial resolution (ca. 5 m × 20 m in the range and azimuth directions, respectively). The narrow orbital tube of the satellites and the almost-synchronized bursts of SAR scenes makes the IW products suitable for interferometric analysis.
3.1 Data set
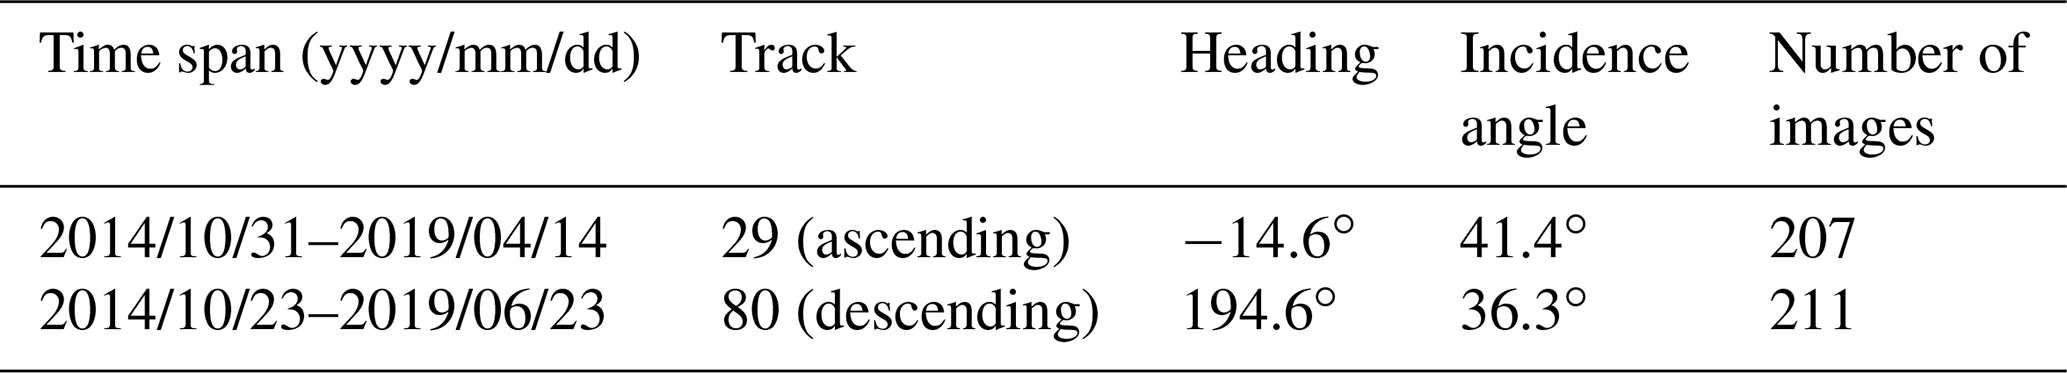
To assess the surface deformation caused by salt dissolution, we used the available Sentinel-1 SAR collection covering the area of interest. The time period covered by Sentinel-1 is more than 4 years, and it is sufficient to investigate the longer-term (i.e., multi-annual) behavior of surface deformation processes and to detect possible new surface developments. Both ascending and descending data sets were utilized to facilitate the separation of total line-of-sight (LOS) deformation into east–west and vertical components which are more easily interpretable as well as to better constrain the analytical modeling with combined data tracks. Details of the Sentinel-1 SAR data set used in this study are summarized in Table 2. Significant change in surface scattering properties (e.g., snow cover) results in low-quality interferograms; therefore winter scenes with snow cover were excluded from the analysis.
3.2 Multi-temporal, multi-baseline InSAR analysis
The interferogram formation of Sentinel-1 IW SLC (Single Look Complex) images requires co-registration in the azimuth direction of extreme accuracy due to the strong Doppler centroid variation within each burst (for more details see, e.g., Yague-Martinez et al., 2016; Fattahi et al., 2017). For the precise co-registration of S1 scenes we followed the strategy described in Wegmüller et al. (2016). We applied S1 precise orbit ephemerides and the 1 arcsec resolution SRTM surface model (Reuter et al., 2007; Shuttle Radar Topography Mission 1 arcsec global digital object identifier – https://doi.org/10.5066/F7PR7TFT) to consider the effect of terrain topography during a matching procedure of SAR images, the results of which were further refined using the enhanced spectral diversity (ESD) method in the burst overlapping regions to reach a co-registration accuracy on the order of 0.001 pixels. The ESD method considers the double-difference interferograms to determine the fine azimuth offset; therefore it is required to have coherent regions in the burst overlapping area. This requirement was met with several difficulties as the investigated area is sparsely populated and lacks phase-stable natural scatterers. Therefore, we applied a cascade co-registration strategy selecting a so-called primary reference scene in the middle of the time series in the early spring period. Two secondary reference scenes were selected for each year, one in spring when the vegetation has not started to thrive and one in late autumn when only light vegetation covers the surface. These S1 scenes were co-registered directly to the primary reference scene, and the rest of the scenes were co-registered to the primary reference using the nearest secondary reference scene in time for ESD estimation. Based on the co-registered stack, the interferograms can be calculated in a standard way (Simons and Rosen, 2007).
Time series analysis of interferograms requires coherent scatterers with quite stable geometric and electromagnetic properties over time. There are various techniques to select pixels, either dominated by a single scatterer or using averaged (multi-looked) noise-reduced distributed scatterers. These measurement points form the base of the time series analysis of differential interferograms computed from either a single-reference or a multi-reference stack (for more details on the comparison of different techniques see, e.g., Crosetto et al., 2016; Osmanoğlu et al., 2016; Manunta et al., 2019). To capture the high deformation rate of sequential depression and to maximize the coherence offered by the short spatial baselines and high revisit time of the Sentinel-1 mission, we used a multi-baseline approach of interferogram formation (usually called small baseline subset – SBAS; Berardino et al., 2002). The interferograms were generated using Gamma software (Wegmüller et al., 2016). We considered pairs of four consecutive SAR scenes to include redundancy in the interferogram network, which facilitates reduction in errors. We utilized both phase-stable single scatterers (PSs) and distributed scatterers (DSs), which ensures long-term coherence. The initial set of PS candidates was selected based on the high temporal stability of the backscattering as well as on the low spectral diversity. For the DSs we used multi-looking with a factor of 5×1 (5 samples in range and 1 in azimuth) to increase the signal-to-noise ratio but keeping in mind the spatial extent of the sinkholes. Distributed targets resulted in a 15 m × 15 m pixel size in the range and azimuth direction, which enables the detection of localized deformation caused by surface depression. The flat-earth phase and topographic phase were removed from the interferograms. In the multi-baseline approach interferograms were unwrapped in space first, finding the unambiguous phase values. The phase unwrapping was accomplished in an iterative way with quality control, keeping PS and DS pixels for the next step, which satisfy the phase model with reasonably small (< 1 rad) residuals. A two-dimensional phase model involving height corrections relative to the reference model (SRTM heights mapped to radar coordinates) and linear deformation rate was chosen. The residual phase consists of the non-linear deformation phase, atmospheric propagation delay, error in the height correction estimates and other noise terms. The spatially correlated, low-frequency part of the residual phase was separated by spatial filtering from the residual phase, since unwrapping the residual phase of point differential interferograms is much simpler than unwrapping the original point differential interferograms. The whole process was iterated starting from dividing the area into patches, where the linear phase model approximation was suitable. Using a multi-reference stack based on consecutive SAR scenes, the deformation phase can be kept as small as possible. With the constant refinement of the phase model, a single regression was applied to the whole area. The main output of the regression analysis was the unwrapped phase. The various phase terms were summed up, and then the unwrapped phases were connected in time and inverted to deformations using a least-squares approach minimizing the sum of the square-weighted residual phases (Berardino et al., 2002; Wegmüller et al., 2016). The atmospheric phase and non-uniform deformation phase are present in the time series of unwrapped phases. To discriminate between the two, we identified areas with a high deformation rate and excluded those phase values to estimate atmospheric propagation delay. Atmospheric phases were determined as a combination of height-dependent atmospheric delay plus the long-wavelength component of the SBAS-inverted residual phase. We used a low-pass filter with a characteristic length of 5 km. Therefore, long-wavelength (> 5 km) non-linear deformation was mapped onto atmospheric correction. However, the area affected by subsidence is rather localized, so we can assume no long-wavelength non-uniform deformation.
3.3 Decomposition of surface deformation
The ascending and descending satellite passes offer the possibility of resolving the observed LOS deformations into vertical and horizontal components (Hanssen, 2001; Pepe and Calò, 2017; Fuhrmann and Garthwaite, 2019). The viewing geometry of the LOS vector is defined by the ϑ incidence angle, measured between the surface normal and look vector and the α satellite heading:
Since the satellite passes pole to pole and illuminates the surface at a right angle to the path, the observed LOS deformation is the least sensitive to movements in the north–south direction. This component is usually neglected, and the horizontal component of the movement is interpreted in terms of deformation only in the east–west direction. Based on the ϑ incidence angle of the reflecting point of the ground (Table 2), the dUP vertical and the dEAST east–west component of the deformation can be resolved (Fig. 4):
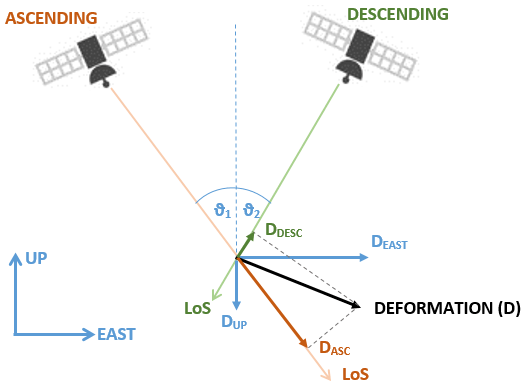
Figure 4Decomposition of the total deformation into ascending and descending LOS components as well as to into vertical and quasi-horizontal (east–west) components.
3.4 Source modeling
We modeled the deformation observed by InSAR in order to better understand the mechanisms responsible for the sinkhole growth and constrain the location and depth of underground cavities which could result in sinkhole collapse in the future. The cavity deflation was modeled using rectangular dislocation sources (Okada, 1992; Segall, 2010) within a homogeneous and isotropic elastic half-space. We used a rectangular pressurized crack model, since deformations are presumably related to the destruction of abandoned mines. Despite their simplicity and the inherited approximations, analytical formulations are convenient to model and explain deformation patterns described by a few model parameters. The elasticity assumption implies that the half-space obeys Hooke's law; therefore displacements are considered infinitely small compared to the characteristic size of source dimensions (Lisowski, 2007). The observed gradual subsidence (see Sect. 4.1) also supports the assumption of pure elastic deformation. We fit simple Okada rectangular dislocation models to the InSAR data using a grid-search method to estimate the initial model parameters. We made an exhaustive search for the best-fitting models using the misfit function:
where N is the total number of measurement points, M is the number of source models, di is the observed cumulative surface deformation and is the modeled deformation from the jth source model projected onto the satellite LOS.
To refine the source parameters and estimate associated uncertainties, we performed a Bayesian probabilistic inversion (Bagnardi and Hooper, 2018). We modified open-source GBIS (Geodetic Bayesian Inversion Software, http://comet.nerc.ac.uk/gbis/, last access: 15 November 2020) code to handle custom source models of multiple rectangular dislocations. We also jointly inverted the cumulative ascending and descending InSAR data to determine deformation source parameters, i.e., horizontal dimensions and horizontal coordinates of rectangular source, depth of dislocation, strike angle of horizontal edge with respect to the north, and opening of the model (related to volume change), for every model in a single run. Within a Bayesian inversion approach the characterization of posterior probability density functions (PDFs) of source model parameters is accomplished by taking into account uncertainties in the data. The optimal set of source parameters can be extracted from the posterior PDF by finding the maximum a posteriori probability solution. The PDFs of source model parameters are determined from the likelihood function of the residuals between the observations and the model prediction weighted with the inverse of the variance–covariance matrix of the observations. The Bayesian inversion approach requires the quantification of errors in the data, which are assumed to be multivariate Gaussian with a zero mean and covariance matrix. For multiple independent data sets, the likelihood function can be formulated as the product of the likelihoods of the individual data sets. To increase numerical efficiency, the GBIS inversion algorithm samples the posterior PDFs through a Markov chain Monte Carlo method, incorporating the Metropolis–Hastings algorithm, with automatic step size selection. For more details, we refer to Bagnardi and Hooper (2018).
4.1 Observations
Time series analysis of Sentinel-1 interferograms reveals surface deformations beneath the city of Solotvyno and its surroundings. Based on the scattering properties of resolution elements, a large number of pixels were identified (> 35 000 on a ca. 9 km × 9 km area (Supplement Figs. S1 and S2) which densely cover the populated areas. Coherent points were also detected in the direct vicinity of the existing sinkholes in low-vegetation fields.
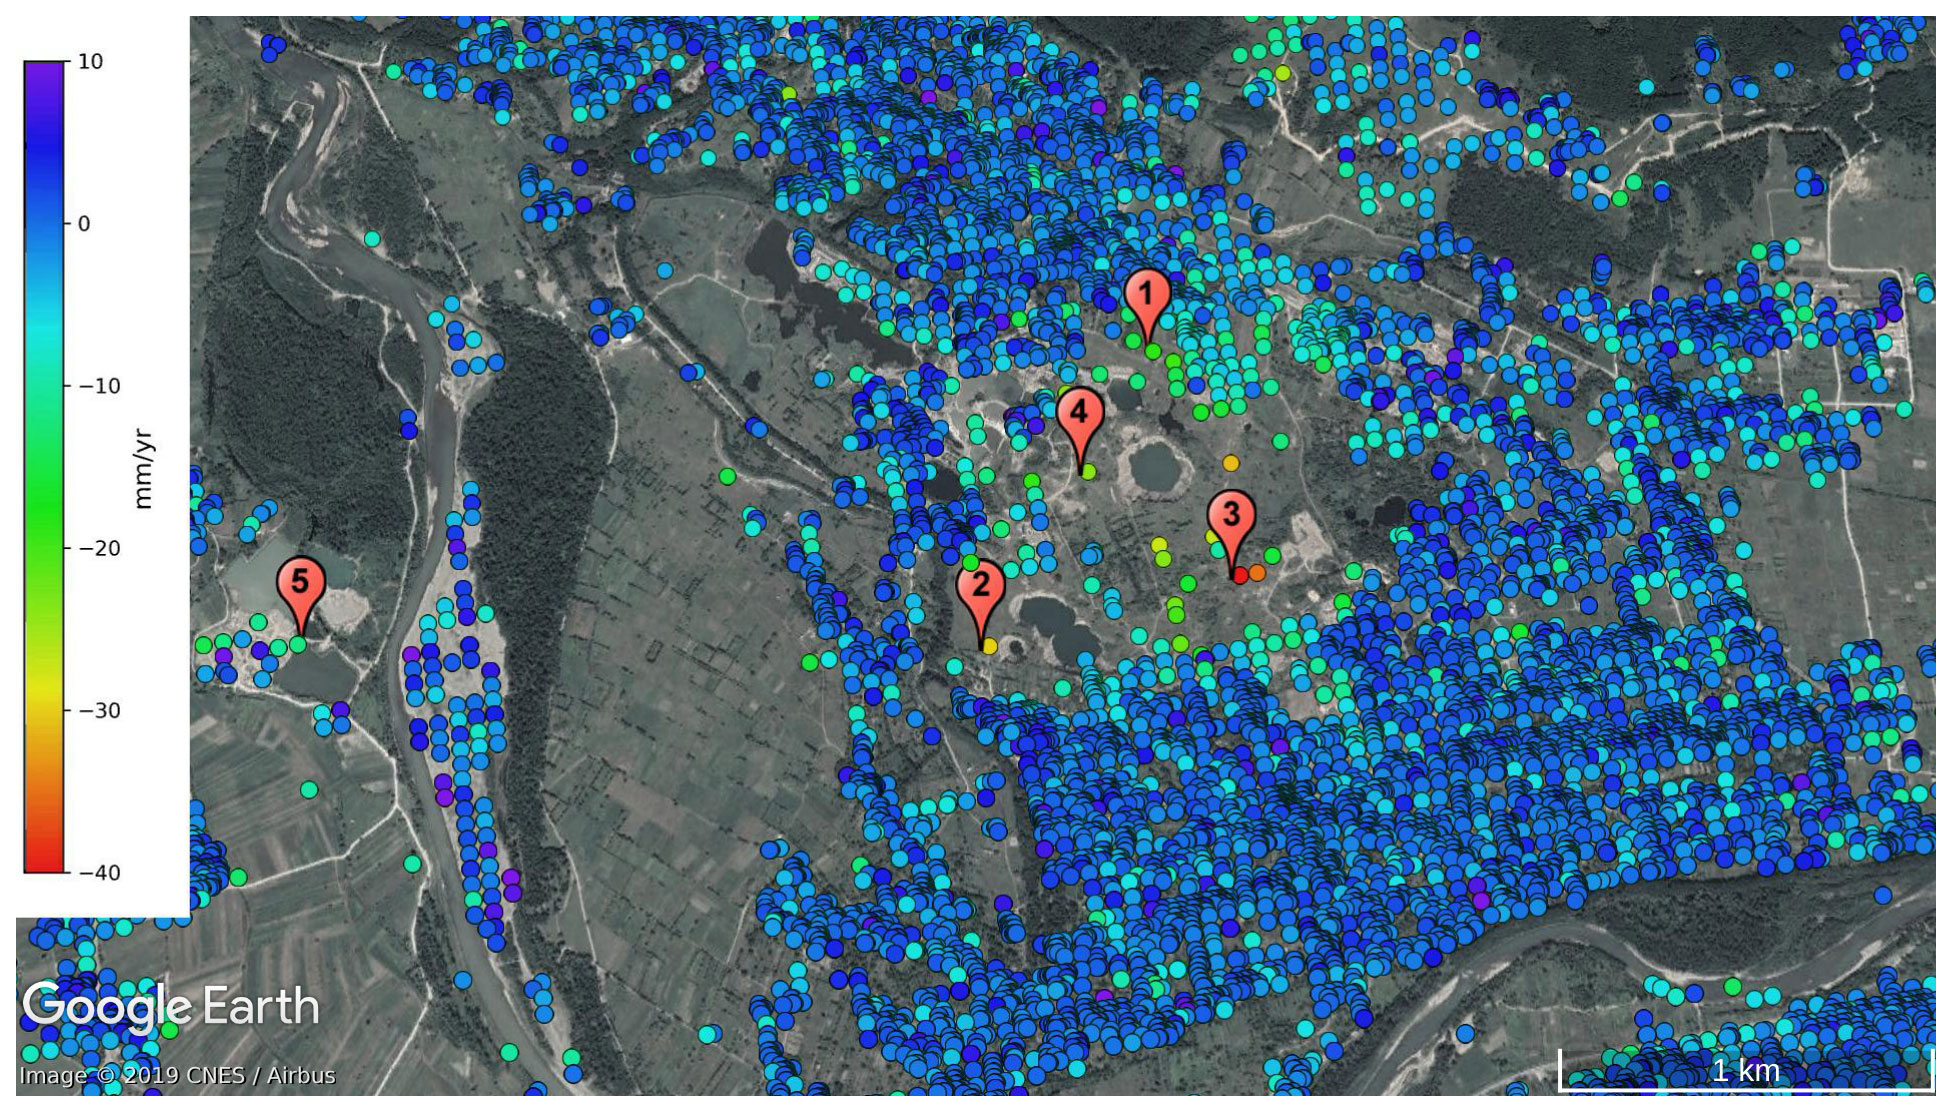
Figure 5Linear rate of line-of-sight deformation from Sentinel-1 ascending pass for the investigated area (see explanation of numbers in the text). Contains modified Copernicus Sentinel data (2014–2019), background © Google.
Figure 5 shows the linear LOS displacement rate determined from Sentinel-1 ascending data. The spatial pattern of the surface deformation computed from the ascending satellite pass data clearly shows the circular outline of the deforming area around the main sinkhole. The maximum deformation rate reaches almost 5 cm/yr (point 3 in Fig. 5) and is located at the south-southeast part of the central sinkhole. The detected surface deformation forms patterns. Moderate, but persistent, surface displacement with a magnitude of up to 2 cm/yr is found north of the central sinkhole in an urbanized area (around point 1). Larger deformation rates occur south of the central sinkhole. Here, we identified two clusters of anomalous points, one patch located south-southeastward from the central sinkhole with deformation rates varying between 4–5 cm/yr (around point 3). The other pattern is concentrated at the southwestern edge of the larger deforming area (point 2) with an average rate of 1–3 cm/yr. A localized deformation zone was found farther away, ca. 2 km from the mining area in the west direction, on the left bank of the Tisa. Its average rate is 1.2 cm/yr, and it is located in the area with some small lakes (point 5).
The deformation rate is almost linear in the whole area; individual deformation time series for some selected points (mentioned in the text above) are given in Fig. 7. No significant sudden movement was detected. The time evolution of the LOS surface deformation is shown in Fig. 9 along a cross section directed almost north–south (cross section A–B). The path was selected to have the highest point density, and a natural-neighbor interpolation method was applied based on the points satisfying a distance criterion (< 50 m) around the location of the profile. The location of cross sections was selected to obtain information in roughly perpendicular directions of the area; it was chosen by visual inspection of point distribution. Figure 9 nicely shows the different magnitudes of the deformation rate between the northern and southern parts of the area, as well as the highly linear characteristics of surface evolution.

Figure 6Linearly estimated LOS deformation rate in millimeters per year calculated from Sentinel-1 descending pass data for the investigated area. Contains modified Copernicus Sentinel data (2014–2019), background © Google.
Regarding the descending Sentinel-1 interferogram time series, the average deformation rate shows a similar pattern compared to the ascending pass. This suggests that the deformation shows primarily vertical behavior. Results from the multi-temporal InSAR analysis are shown in Fig. 6 in terms of the average linear deformation rate. The movement north from the central sinkhole is much more pronounced and affects an extended area (see point 5). Deformation possibly related to landslide activity is captured on the hillside in the upper northern part of the figure, which was previously identified by Velasco et al. (2017). This movement along the gradient of the slope was not pronounced in the ascending satellite geometry. The growth of the disturbed area in time is illustrated in Fig. 10 on an east–west cross section (marked by C–D) in the northern part of the investigated area. The motion is very linear in time but shows an asymmetric shape in the east–west direction. The western part of the cross section (the distance from point C is about 600 m) is much more similar to a classical subsidence bowl, whereas the eastern side (between 600 and 1200 m) shows a sharp step (section from 600 to 800 m). This part of the area, which moves like a solid block, is covered with buildings. Figure 8 shows the individual time series of the points marked in Fig. 6.
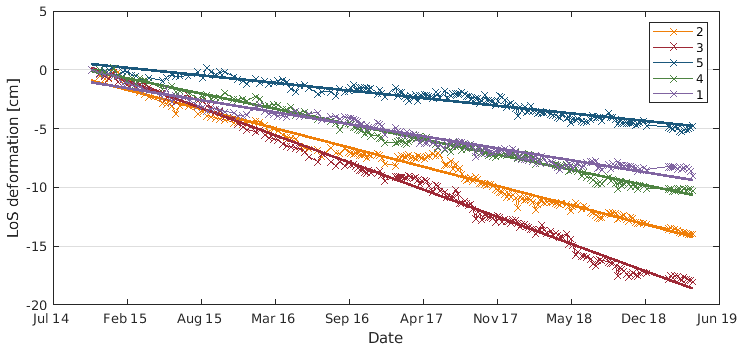
Figure 7LOS deformation of some selected points (see Fig. 5 for location) determined from the ascending scenes.
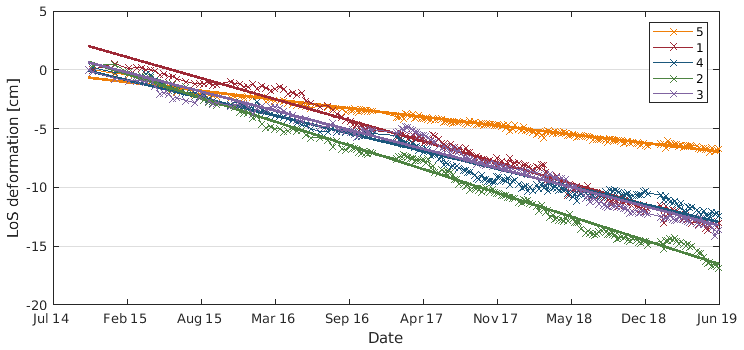
Figure 8Time series of some selected points (see Fig. 6 for location) from the analysis of Sentinel-1 descending scenes.
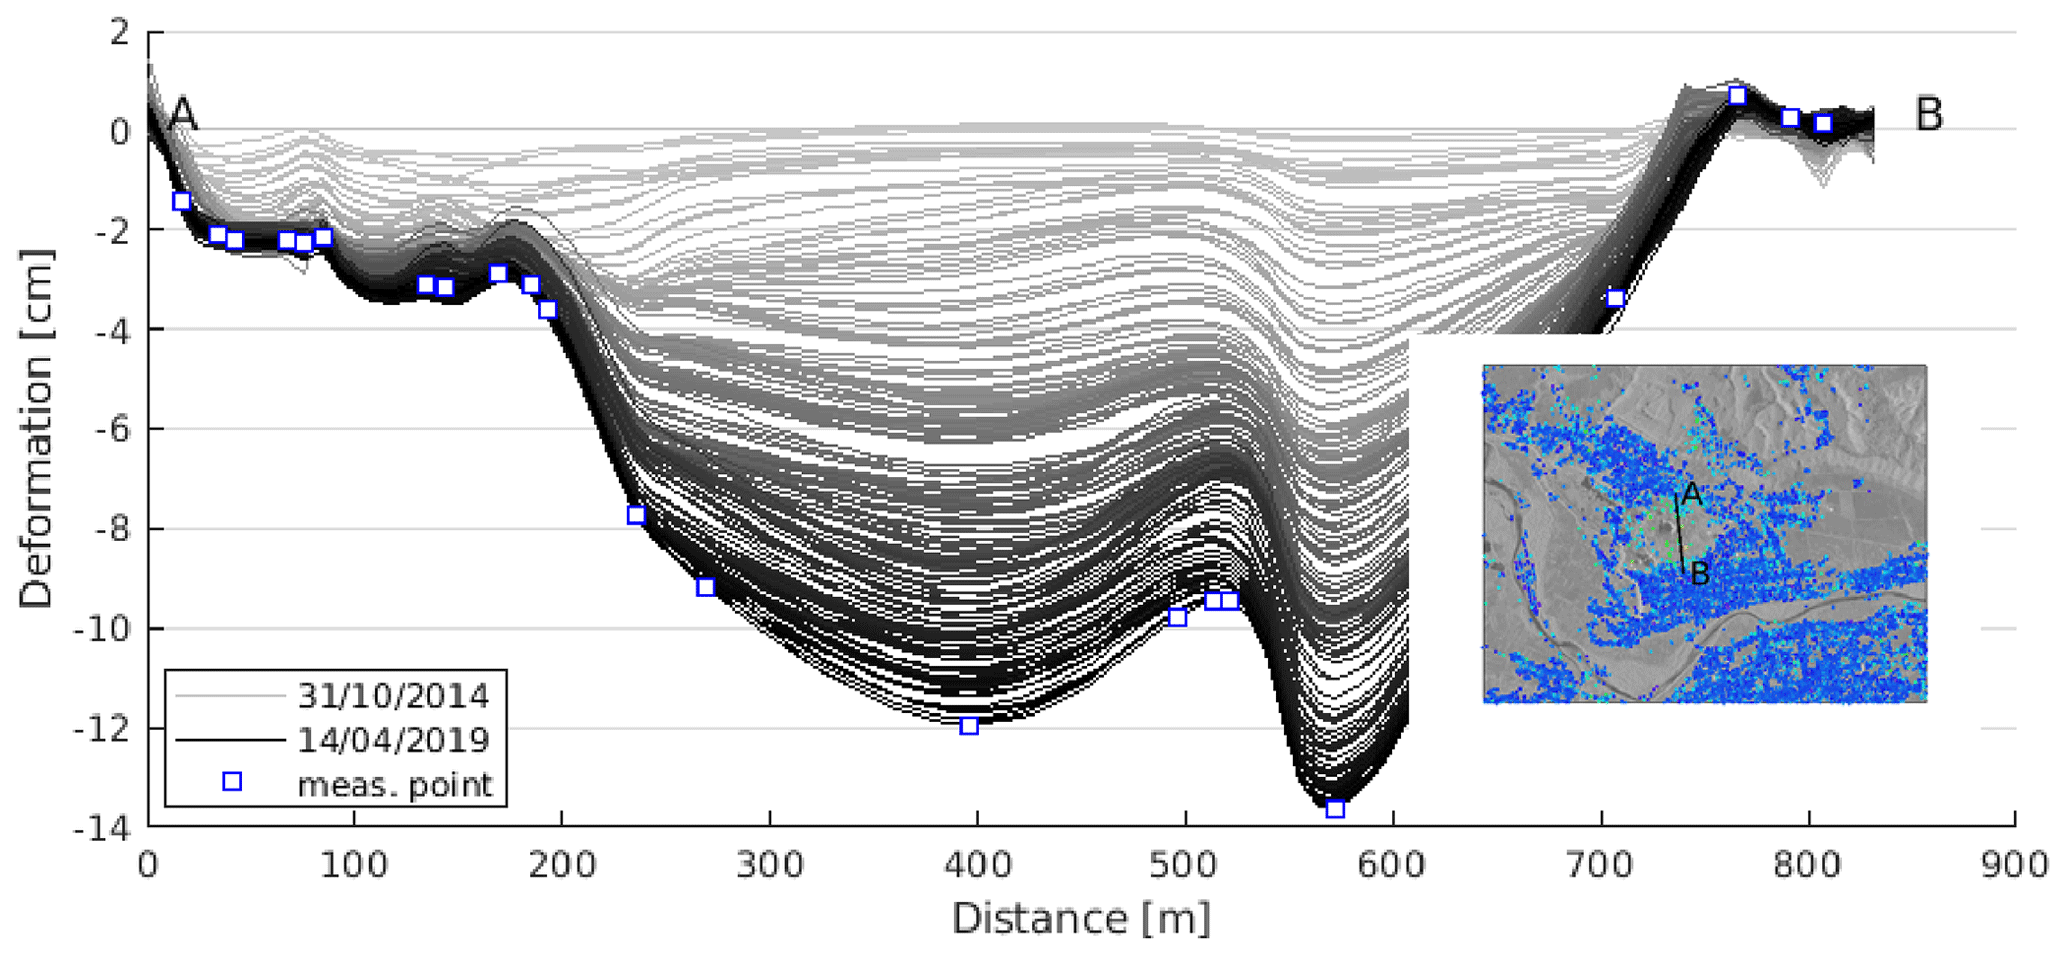
Figure 9Temporal evolution of LOS surface deformation for the A–B cross section from ascending Sentinel-1 data. For the location of the section see the insert. The shade of gray varies from light to dark as time advances (lightest: October 2014, darkest: April 2019); blue squares show location of InSAR observations along the profile.
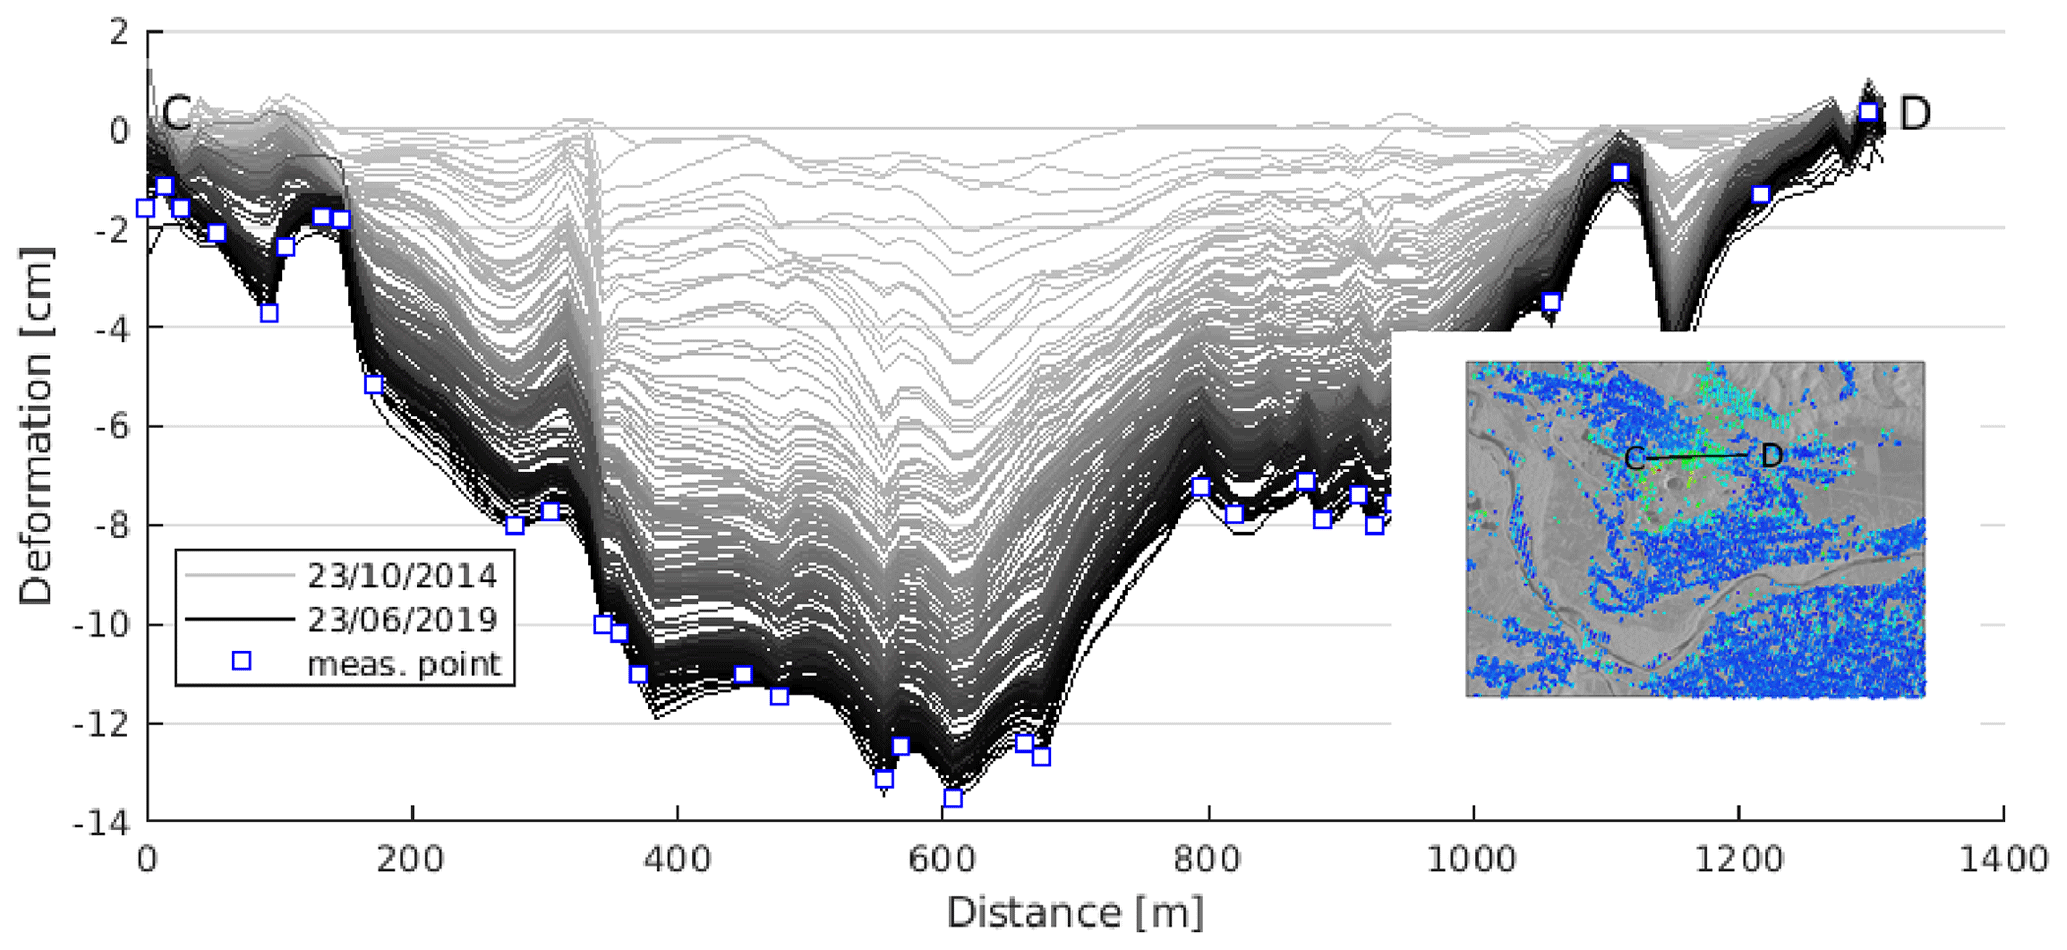
Figure 10Progress of LOS surface deformation from descending pass Sentinel-1 data. Location of cross section is given in the insert. The shade of gray varies from light (October 2014) to dark (June 2016); blue squares show location of InSAR observations along the profile.
4.2 Decomposition of surface deformation
The different acquisition geometry results in dissimilar measurement points for the ascending and descending passes. To overcome this limitation and combine deformation rate results from ascending and descending passes, the data sets are usually interpolated to a common grid, resulting in so-called pseudo measurement points (Ferretti, 2014). Besides the common spatial grid, a common zero reference point is required to make data sets obtained from different acquisition geometries comparable. In our study both data sets were referred to the same reference point, which is located far enough from the deforming area in the east direction (marked with white cross in the Supplement figures). As the time series analysis revealed that the surface deformation is quite linear, we combined the deformation rates and not the deformations directly. Results of LOS decomposition are given in Figs. 11 and 12 for the vertical and east–west (positive towards east) directions, respectively. The interpretation of vertical and horizontal deformations is more straightforward than the explanation of LOS displacements and gives a coarse estimate of the ongoing processes. As Figs. 11 and 12 show, vertical deformation is more pronounced in the area and the vertical velocities are about twice the magnitude compared to the horizontal velocities. Although the most recent cavity collapse related to the abandoned mines occurred in around 2012, in the northern (mine 9) and in the southern (mine 8 with the twin dolinas) parts of the area subsidence is still in progress. The highest rates, ranging from 2.5–4.5 cm/yr, are recorded in the inner zone of the central sinkhole, whereas at the northern and southern edges of the deforming area deformation is still remarkable with a magnitude of 0.5–1.5 cm/yr. Regarding deformations in the east–west direction (Fig. 12), the magnitude of the displacement is much smaller, the maximum rate being about 2 cm/yr. The complex surficial depression pattern suggests that the subsidence presumably originates from several individual sources or from the superposition of subsurface caverns. The northern part of the deforming area clearly shows a westward displacement, whereas its southern part shows displacement towards the east. The lack of InSAR observations impedes the retrieval of the whole deformation signal, i.e., the alternating east–west pattern generated by a single subsidence void; therefore it can be only concluded that the deforming area is still actively growing nowadays.
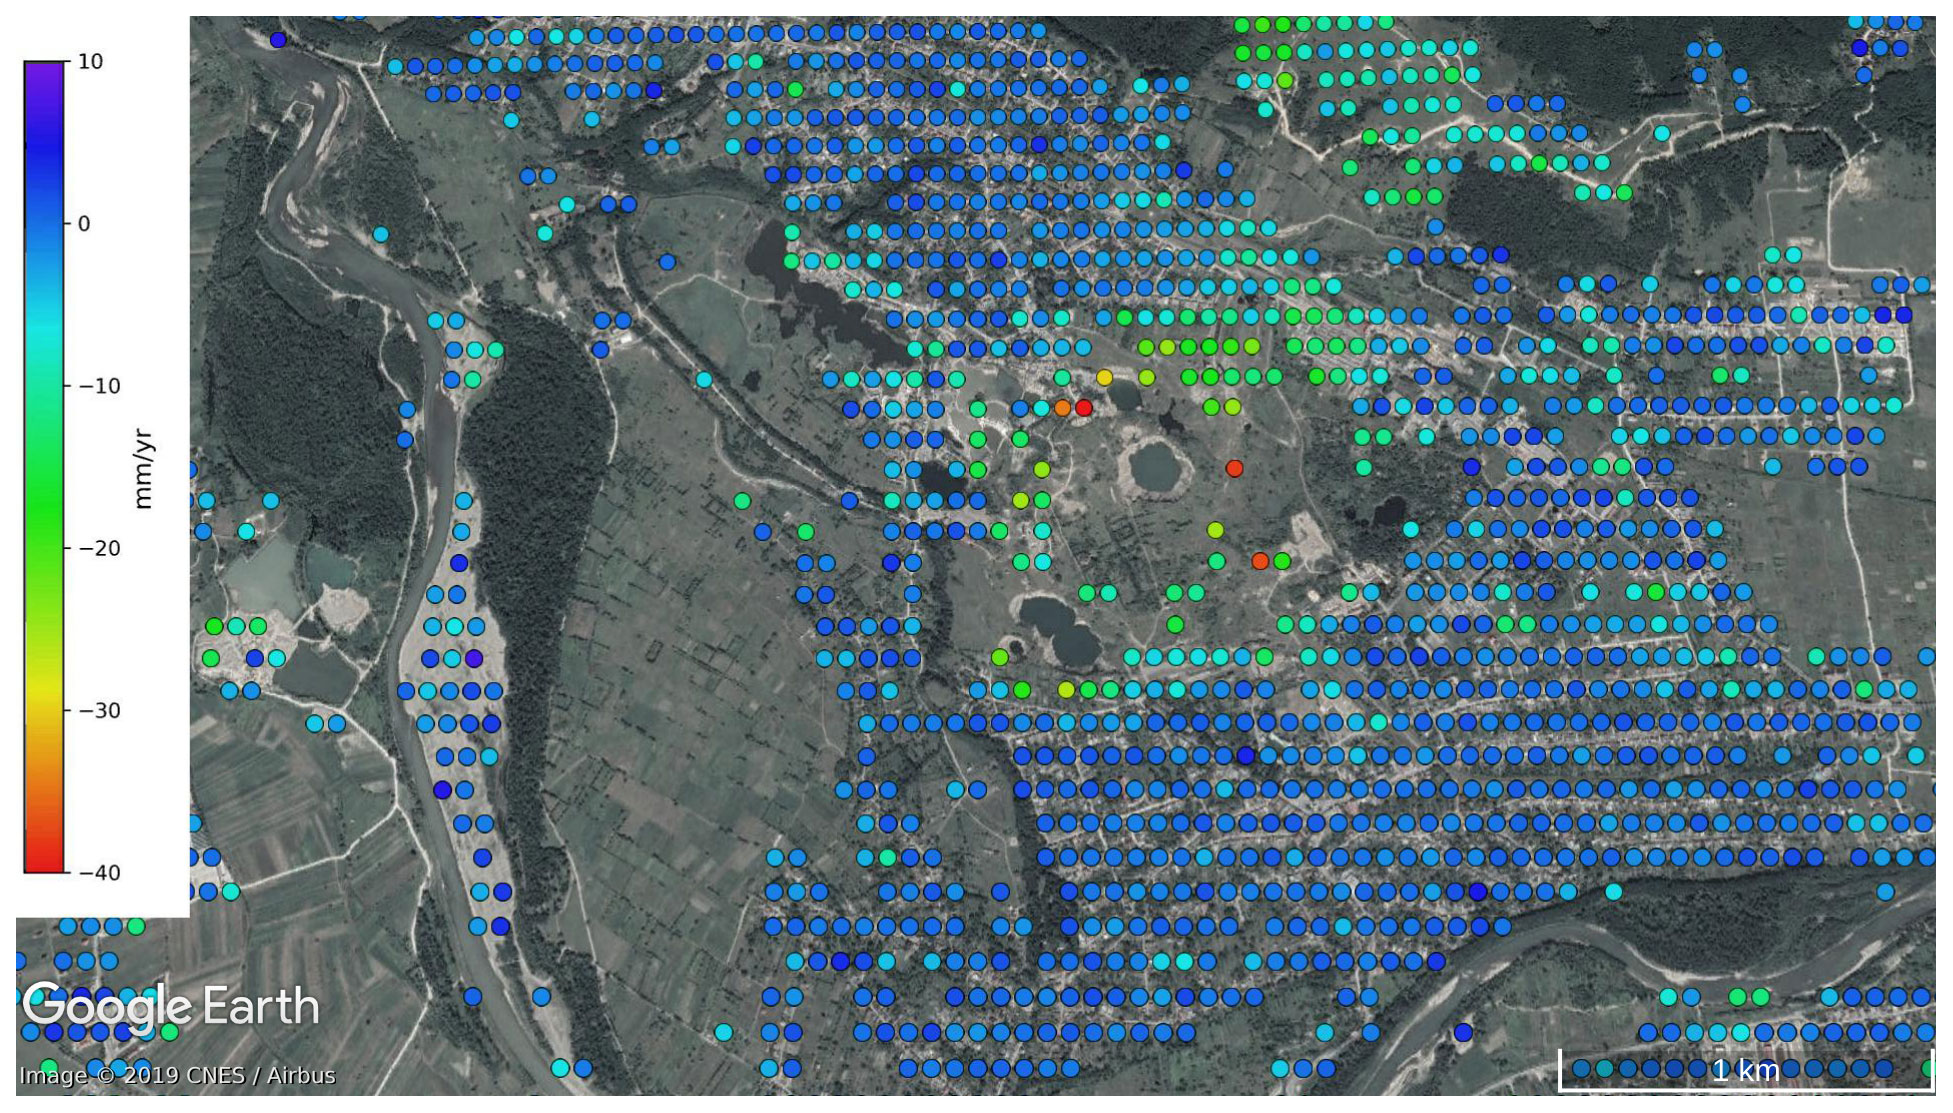
Figure 11Vertical deformation rate determined from Sentinel-1 data from track 29 and track 80. Contains modified Copernicus Sentinel data (2014–2019), background © Google Earth.
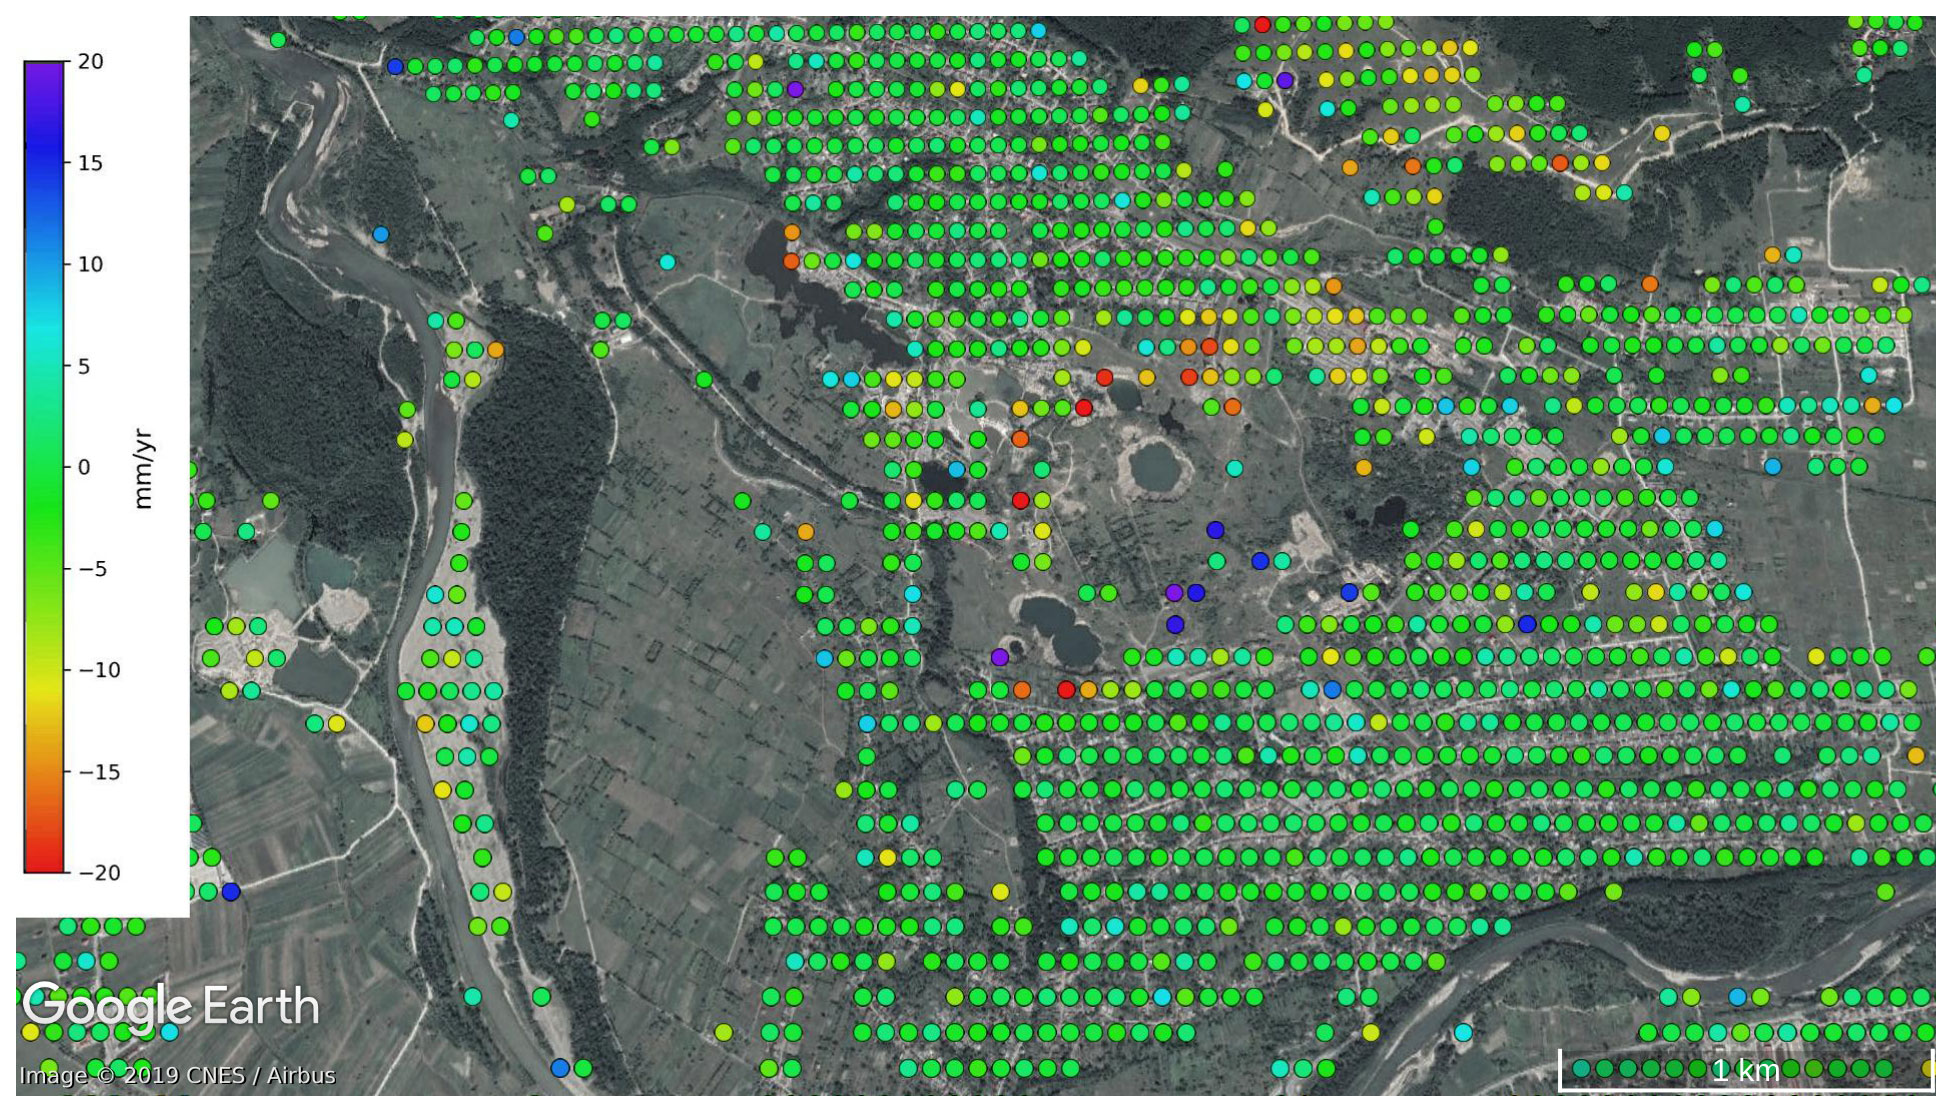
Figure 12East–west (positive in east direction) deformation rate of the area of interest computed from ascending and descending deformation rates. Contains modified Copernicus Sentinel data (2014–2019), background © Google Earth.
4.3 Comparison with previous results
A previous study conducted by TRE Altamira (Velasco et al., 2017) investigated the potential of radar interferometry to monitor surface deformations caused by mining operations in the Solotvyno area in the framework of a contract with the Hungarian National Directorate General for Disaster Management. An exhaustive study was conducted based on archive C-band SAR data sets such as ERS (1997–2001), Envisat (2002–2010) and Sentinel-1 (2014–2016) as well as high-resolution X-band COSMO-SkyMed (2016–2017, 4 months) acquisitions utilizing the SqueeSAR algorithm (Ferretti, 2014) which combines high-resolution PS points with coherent DSs. Although the study covers almost 20 years, the number of images used from former missions is quite low for the archive data set: 29 (ERS) and 30 (Envisat) images were used compared to the contemporary Sentinel-1 mission with 44 SAR scenes. Archive data cover the investigated time period unevenly; therefore the resolution of the deformation time series may be inadequate which inherently raises the question of potential signal aliasing. The large collection of data from ESA's Sentinel-1 mission with frequent acquisitions guarantees the maintenance of the coherence in general and fosters the analysis of the dynamics of surface deformation.
Using the C-band satellites, Velasco et al. (2017) could not really identify phase-stable points in the direct vicinity of the sinkholes. Deformation rates (maximum 25 mm/yr away from the satellite, on average) occur in north and south directions from the main sinkhole mostly in urbanized areas. The three C-band results are very consistent with each other in both magnitude and pattern. Investigations based on the COSMO-SkyMed data identified many more measurement points and gave almost uniform point distribution for the whole area. Several locations were detected in the inner zone around the main sinkhole with a cumulated magnitude of deformation as high as 40 mm for 4 months, which is equivalent to an average deformation rate of more than 10 cm/yr assuming a constant characteristic. It is quite interesting, however, that the pronounced deformation pattern located northeast of the main sinkhole in an industrial area, detected in all C-band data sets, was not identified at all. Although it should have an average value of around 5–7 mm/yr, taking into consideration the short time span of the investigated data set, no measurement points were identified in the area of question. The study by Velasco et al. (2017) utilized satellite data only for the descending pass unlike our investigations. For a meaningful comparison of the two studies we focused only on the data sets from C-band satellites. Velasco et al. (2017) concluded that there was a lack of coherent scatterers over the area around the sinkhole and the deformation rate could be detected for inhabited areas only. These surface changes were concentrated mostly to the north of the deforming area, also identified in this study, but we detected measurement points in thinly vegetated areas too. The longer time span of this study confirmed that in the area of interest deformation is still ongoing. For the displacement history curves (Figs. 7 and 8) it can be concluded that the uniform deformation model is adequate to interpret the results; no acceleration or slowing-down trend can be identified.
4.4 Source modeling
The coarse estimation of model parameters was accomplished by forward modeling varying source model parameters on a predefined interval using the misfit function of Eq. (3). Unfortunately, no reliable information is available on the exact position, extension, orientation and depth of the mining underground. The estimated depth of underground mines varies between 50 and 400 m, from the center to the perimeter of the mining area. The approximate location of the mines was estimated based on the available maps. The parameter space of the dislocation models was constrained based on the rough location, geometry and orientation of underground mines available on maps as well as on the approximate depth of the salt layer. Lack of coherence, due to either change in ground cover or a high rate of deformation, does not allow for the retrieval of the entire deformation pattern associated with sinkhole evolution. Therefore, cumulative deformations from ascending and descending satellite passes covering the same time period were utilized simultaneously to increase the reliability of source model parameter estimation. The lack of deformation signal around the center of the area of interest makes it difficult to identify the number of source models required to explain the subsidence pattern. Our results suggest a quad-source configuration of subsurface cavities. The best-fitting model parameters are summarized in Table 3.
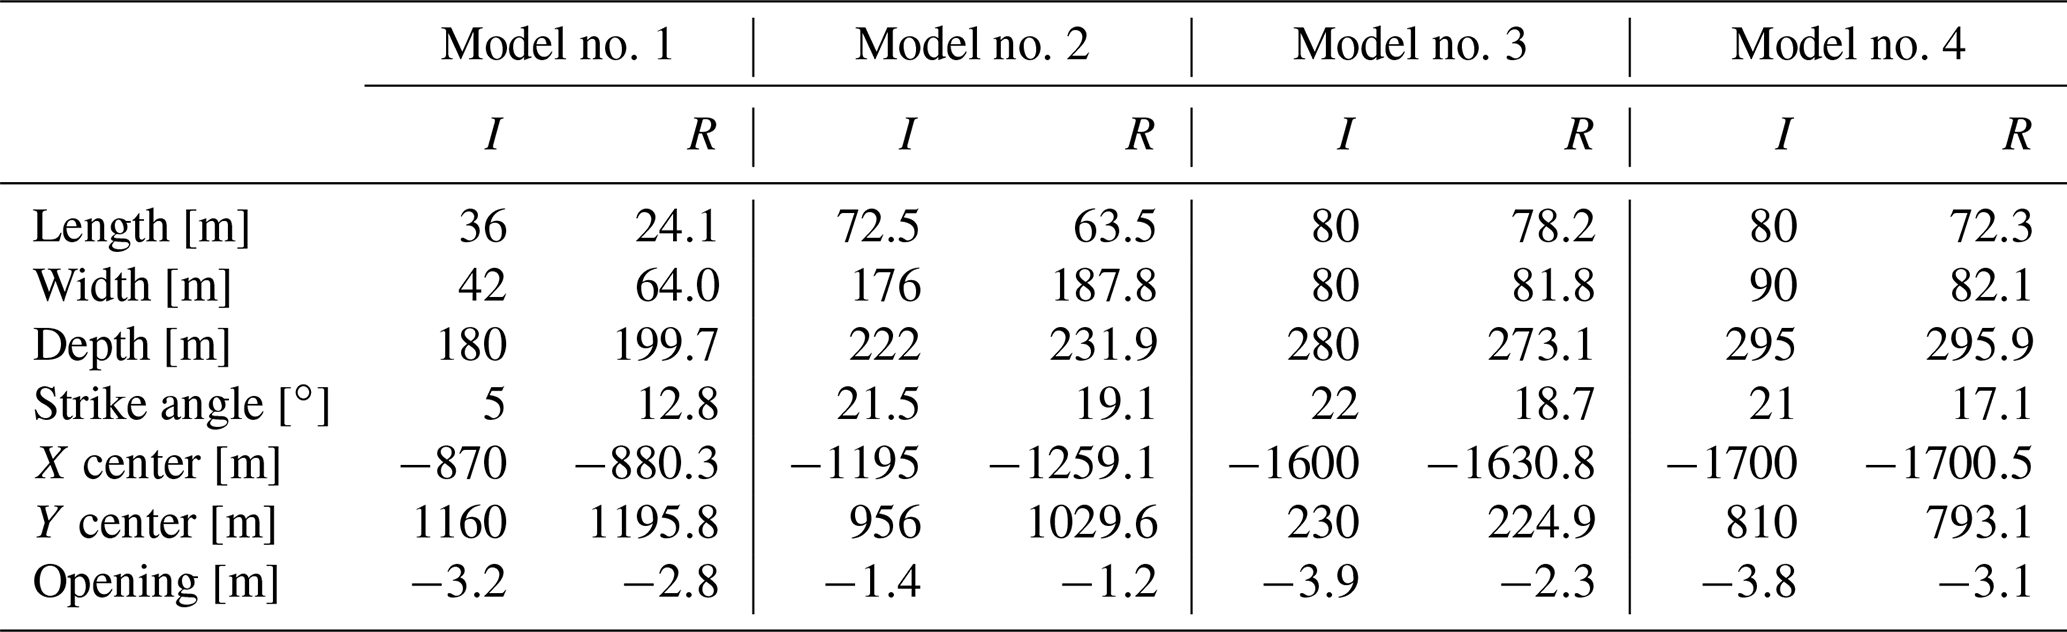
Table 3Analytical model parameters used in the source modeling. I refers to initial values and R to refined values; coordinates are given in a local rectangular system, shown in Fig. 13.
To refine the dislocation model parameters and estimate associated uncertainties, we performed a Bayesian probabilistic inversion (Bagnardi and Hooper, 2018). This requires the error estimation of the data sets. Noise covariance of individual interferograms has been well studied; the main error sources are the noise caused by the temporally correlated phase decorrelation and the spatially correlated atmospheric phase delay. Since InSAR observations are inherently relative, the additive phase delays make the accuracy of measurements strongly dependent on the distance. There have been several endeavors to provide an error analysis of time series InSAR output (see, e.g., Agram and Simons, 2015; Cao et al., 2018, and references therein); however, we followed the method of Parizzi et al. (2020) and estimated the variance–covariance matrix of InSAR data sets experimentally. As Parizzi et al. (2020) point out, short-time-separated interferograms (supported by Sentinel-1 mission with multi-baseline analysis) are much more dominated by atmospheric propagation delay than by phase variation due to deformation. After atmospheric phase correction the interferometric measurement error is practically the residual atmospheric phase delay, as short-time-separated interferograms can be considered deformation-free. The mean variograms of the residual atmospheric phase show a stationary behavior and can be approximated by a covariance function. Since both deformation and average velocity are related to the phase by a scale factor, the error estimates can be simply computed. We used an exponential covariance model fitted to the data to determine the variance–covariance matrix of deformation in the Bayesian inversion. For both the ascending and descending data sets, similar models were obtained with moderate range values of 2.4 and 2.2 km for the ascending and descending data sets, respectively.
Best-fit model parameters obtained from the forward modeling were utilized as starting values for the Bayesian parameter estimation. During the inversion the parameters were allowed to vary within reasonable limits taking into account the geological constraints and information on past mining activity. The optimal model parameters are summarized in Table 3; coordinates are given in a local rectangular coordinate system. Our final model assumes four rectangular-shaped subsurface cavities, developed in the salt layer. One source with a rectangular dislocation (model no. 1) of size 24.1 m × 64 m is located above the eastern edge of working panels of mine 9 at an estimated depth of 199.7 m. This mine was closed in 2008 due to water inrush. The moderate value of volume change suggests that this depression marks an early stage of sinkhole development. The second source model (model no. 2) lies approximately 400 m southwest from the first one and has horizontal dimensions of 63.5 m × 187.8 m; the required height change explaining the deformation pattern is −1.2 m. The elongated shape in a roughly north–south direction of the source model is in agreement with the subsurface mining activity. Between the main corridors of mines 9 and 10, long working panels were cut with varying lengths of between a few tens to a few hundreds of meters. The third dislocation model (model no. 3) is located on the western periphery of the area affected by deformations. The model is roughly symmetric with a horizontal side length of about 80 m and located at a depth of 273.1 m. There are several shallow mines there (numbered 1 to 5 in Fig. 3d), established around the 18th–19th century. These were completely destroyed as the numerous, small-scale dolines filled with brine indicate on the surface. The source model parameters suggest that the inverse modeling tried to find a global solution for the observed subsidence pattern. However, a single source is unable to sufficiently explain the complex deformation pattern; a number of near-surface, small-scale voids, related to salt dissolution, are needed as well. The fourth source model (model no. 4) is located beneath the working panels of mine 8, where heavy subsidence occurred in around 2010, which resulted in the formation of the twin lakes. The depth of the model is about 296 m; the horizontal extension of the model is 72.3 m × 82.1 m. The estimated opening is equal to an approximately 18×103 m3 volume change. Taking into account the horizontal extension of the existing surface depressions of the nearby twin lakes, 15×103 and 17×103 m2, respectively, our modeling results seem reasonable. The questions of whether a new doline will form and will merge with the existing two in the future and whether the boundary of the area affected by subsidence will expand towards the south require further observations with other tools besides radar interferometry.
Although the detection of small-scale, episodic deformation related to sinkhole generation can be challenging, several studies have demonstrated the potential of radar interferometry to characterize the post-collapse deformation of sinkholes (Baer et al., 2002; Galve et al., 2015; Kim et al., 2016; La Rosa et al., 2018), and there have been successful attempts to identify precursory deformations before the catastrophic collapse (Nof et al., 2013; Jones and Blom, 2014; Malinowska et al., 2019). In this study Sentinel-1 radar interferometry was utilized to investigate surface evolution in a salt karst environment, where land cover differs significantly from area to area, and sinkhole detection can be monitored almost semi-automatically. Several factors such as the complex geological conditions (relatively large and shallow salt structure), the specific hydrological setting (wet and warm continental climate with increased precipitation rate in warm season, close proximity of a main river) and the mining conditions (damaged waterproof layer, mining levels at different depth, cracks in the rock masses) increase the susceptibility to sinkhole evolution. In this regard a single case study cannot serve to draw general conclusions on sinkhole generation mechanisms; however, the experiences can be invaluable for making assessments and optimizing future monitoring methodologies.
The Sentinel-1 radar interferometry results show that the detection of sinkhole evolution is feasible in the area, although it should be remarked that the point density of PSs and DSs is not sufficiently homogeneous. The complexity of the mechanism driving surface deformation as well as the inadequate sampling of the deformation pattern was revealed while explaining the subsidence pattern above the mining area by utilizing analytical modeling.
InSAR analysis showed that there is a continuous subsidence with a pronounced linear trend. Therefore, as a first-order approximation, elastic modeling was utilized to explain the sinkhole formation. The quantitative analysis of the source modeling is shown in Figs. 13 and 14 in terms of the LOS deformation determined from the best-fitting quad-configuration source model (top) and the Sentinel-1 cumulative LOS deformations (middle) as well as from the difference between the observed and modeled values (bottom), for both the ascending and descending passes, respectively. It can be asserted that the main features of the subsidence pattern on the northern and southern periphery are reasonably well captured by the source models. However, the modeled deformation in the western part of the area does not fit the observations, especially when compared to the ascending data set, where modeled deformation overestimates the observed one. As it was pointed out earlier, under this area the salt layer upwells close to the surface and many small dropout dolines form, and a single source model cannot adequately explain the surface deformation pattern.
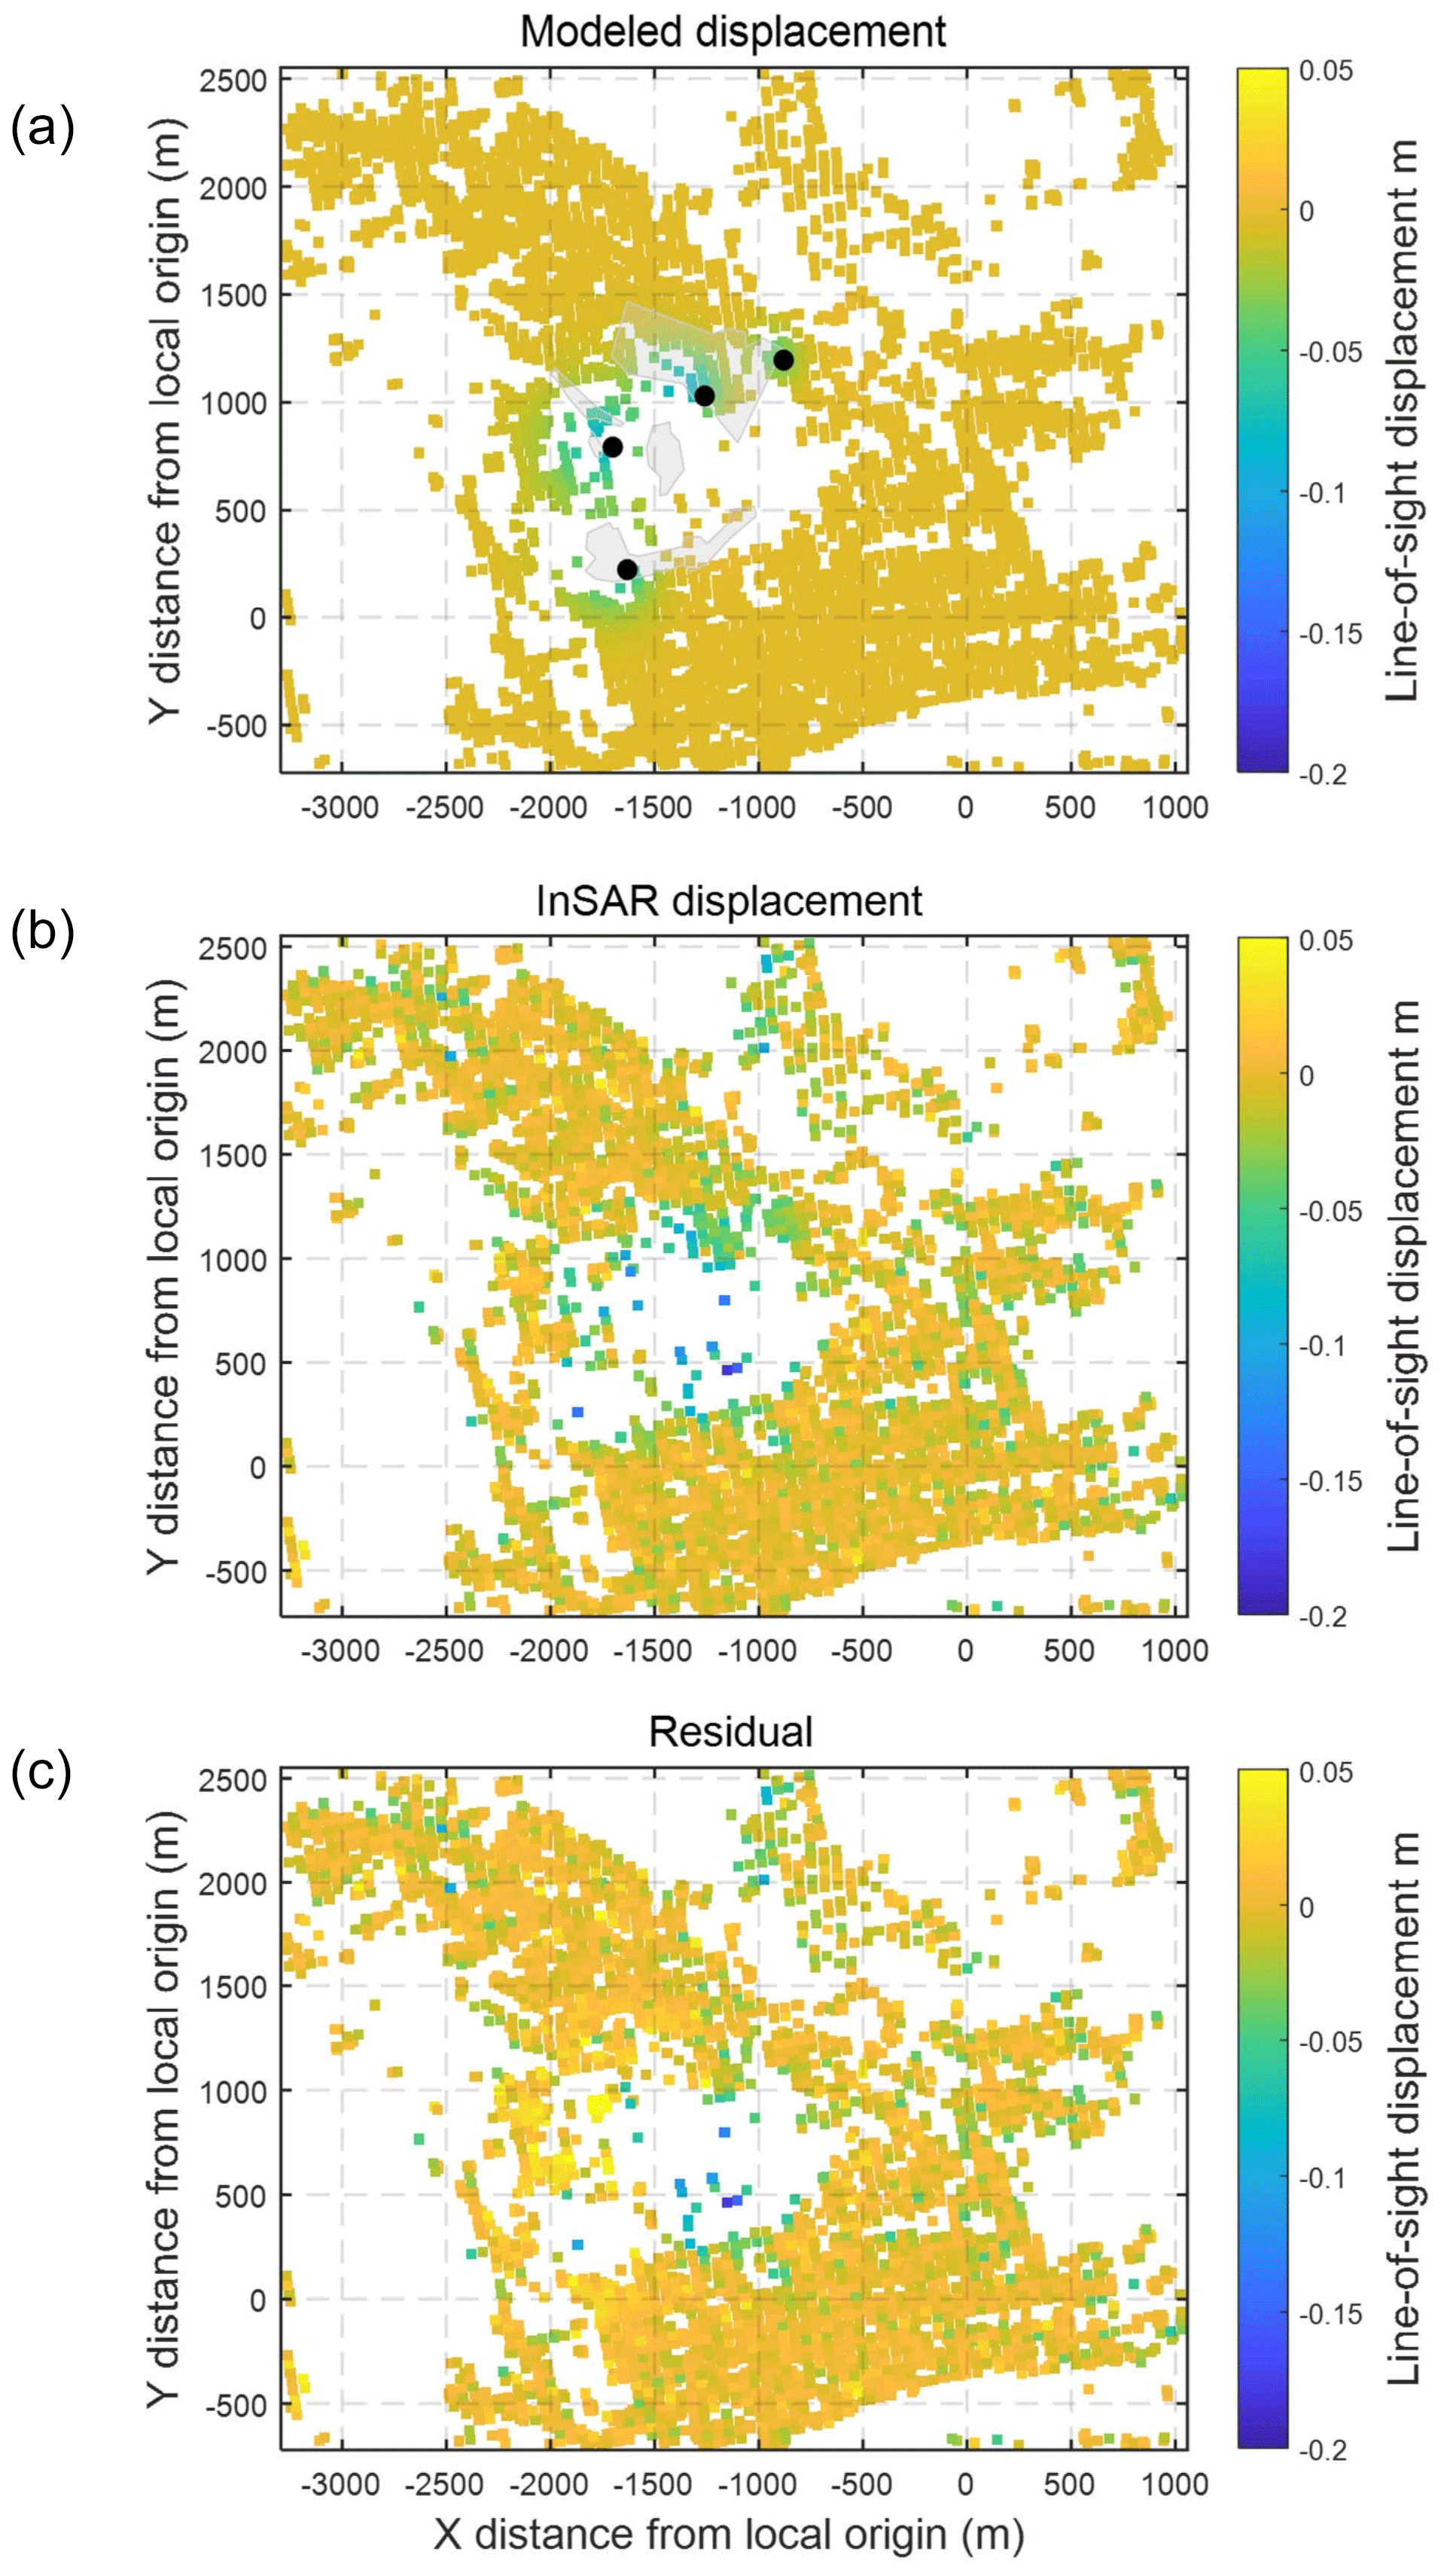
Figure 13Cumulative LOS deformation (a) computed from the quad-configuration source model (black dots denote the location of source models; gray polygons show the boundary of mines), (b) from the ascending Sentinel-1 observation and (c) from residuals after subtracting the best-fitting model.
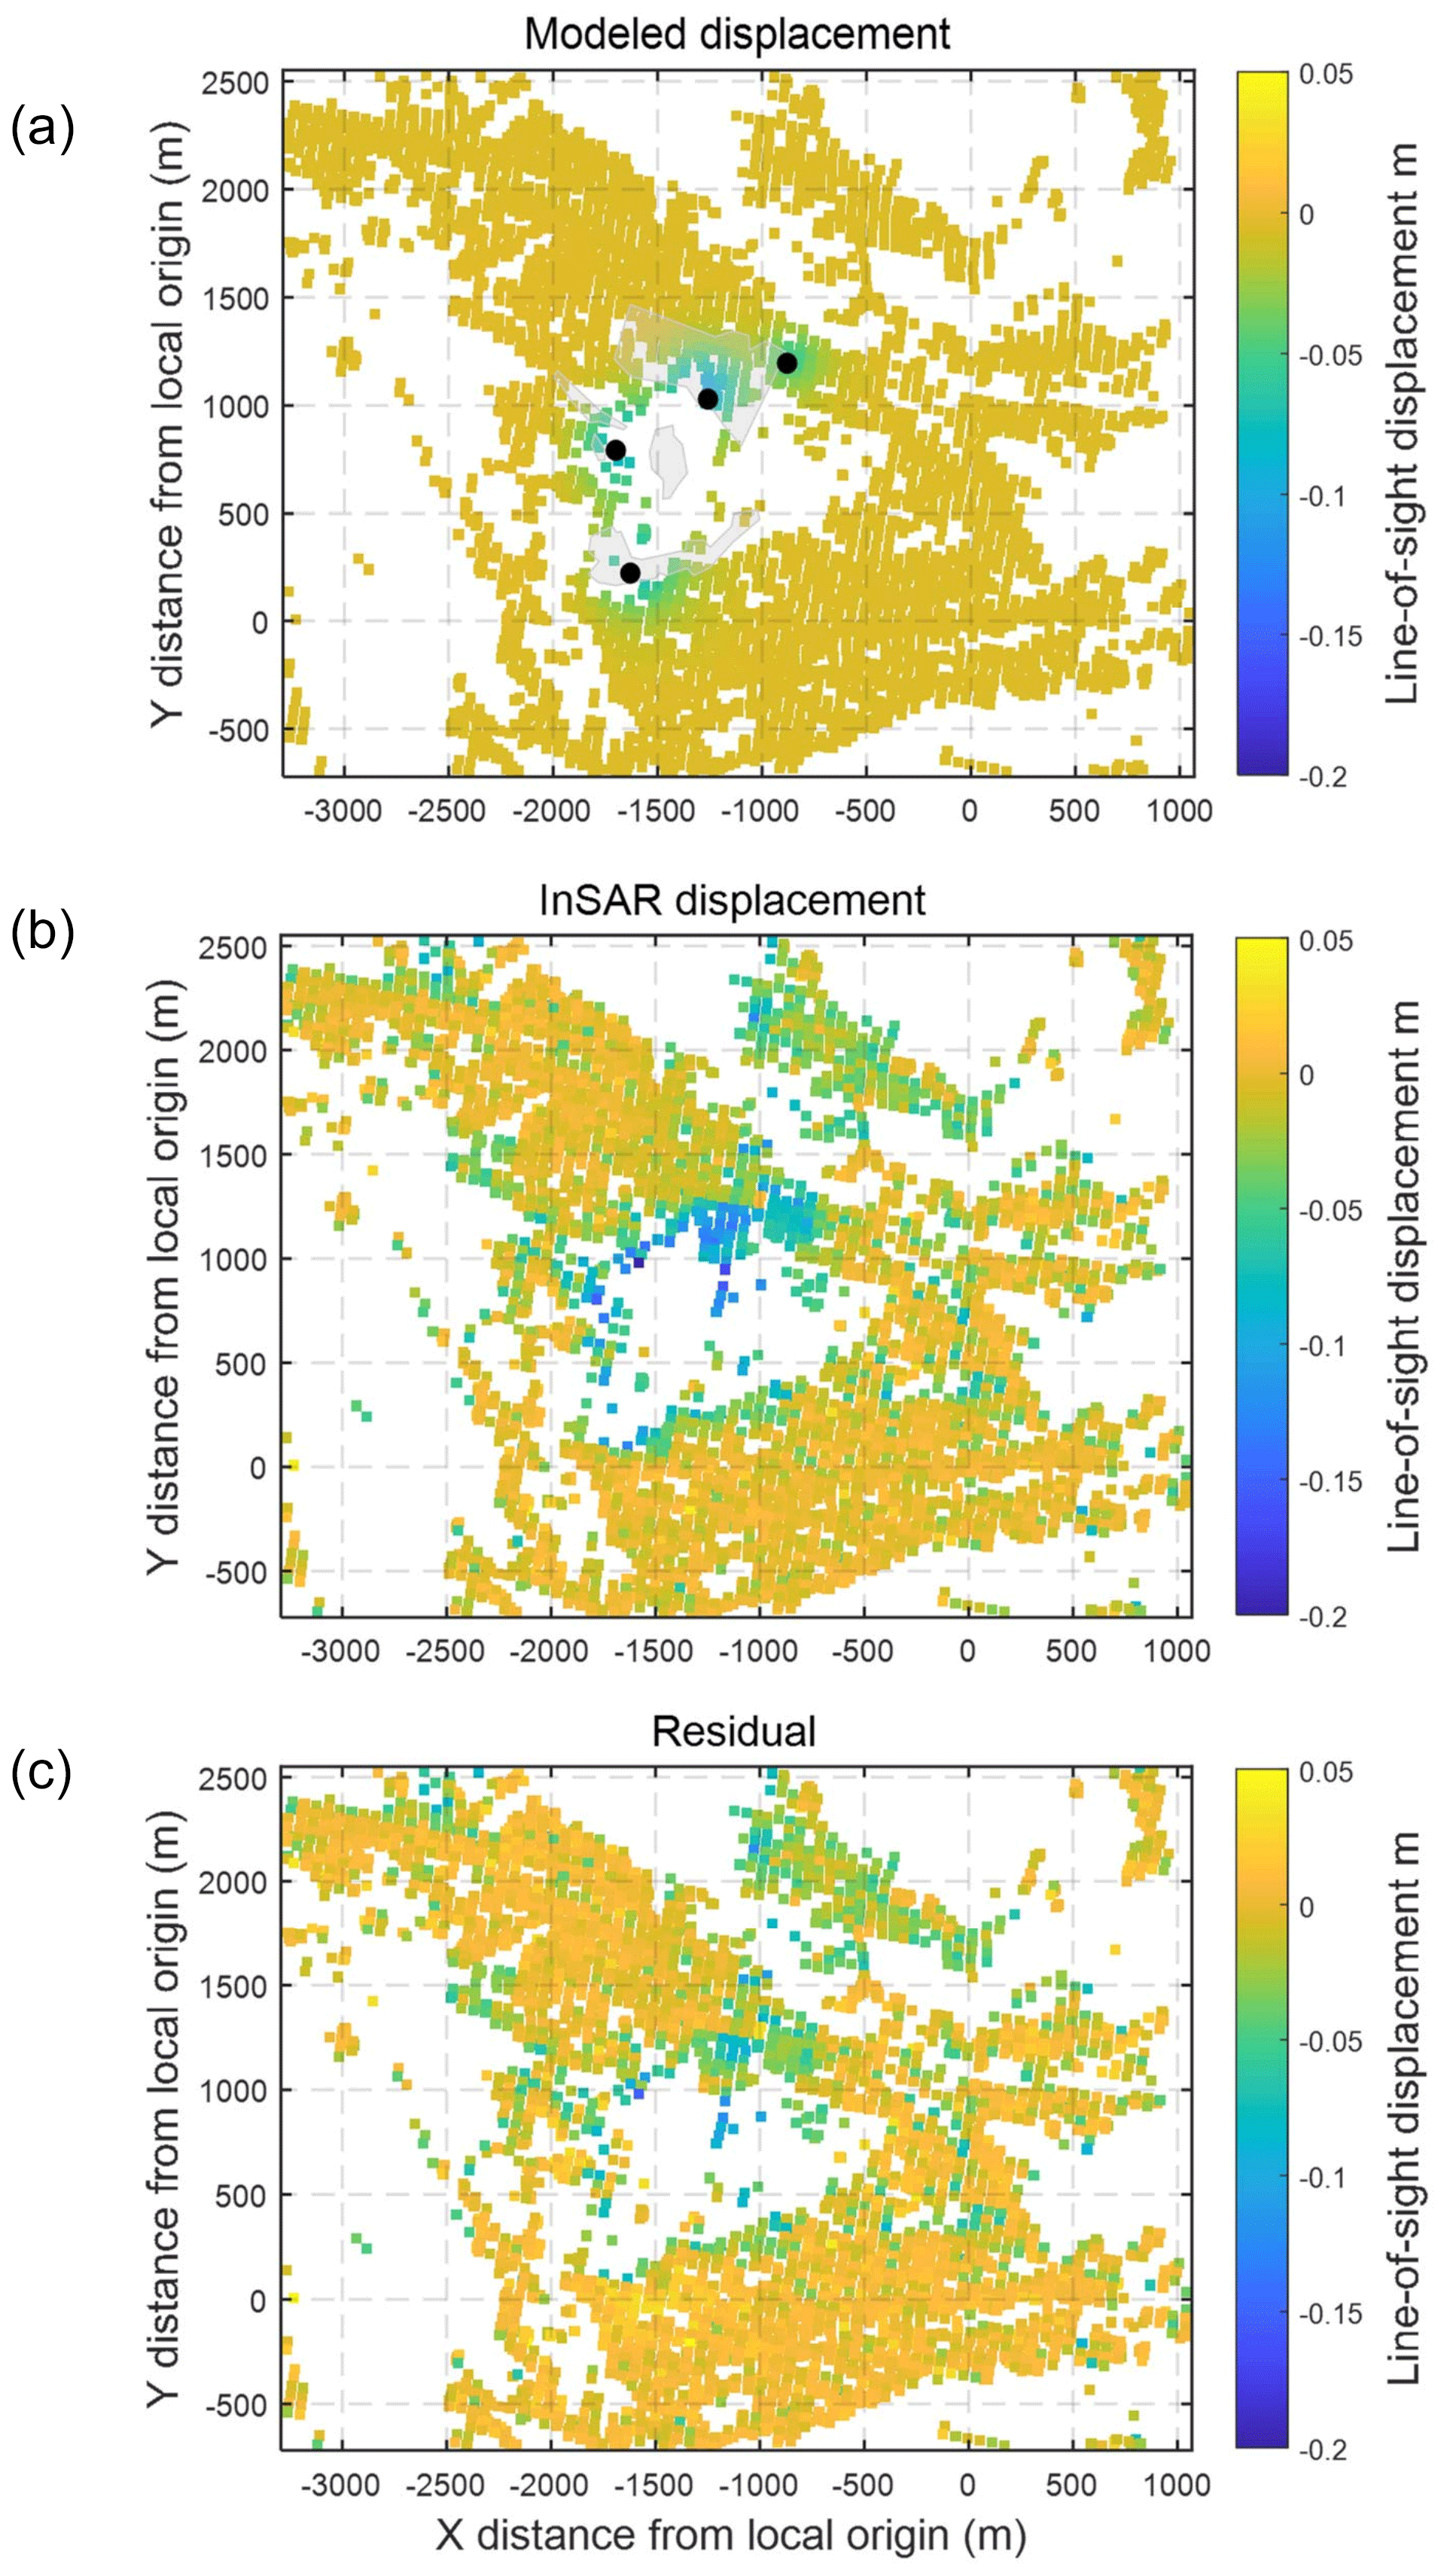
Figure 14Cumulative LOS deformation (a) of the best-fitting model using four dislocation sources (black dots denote the location of source models; gray polygons show the mining area), (b) from the descending Sentinel-1 observation and (c) from residuals after subtracting the modeled displacement from the cumulative deformation.
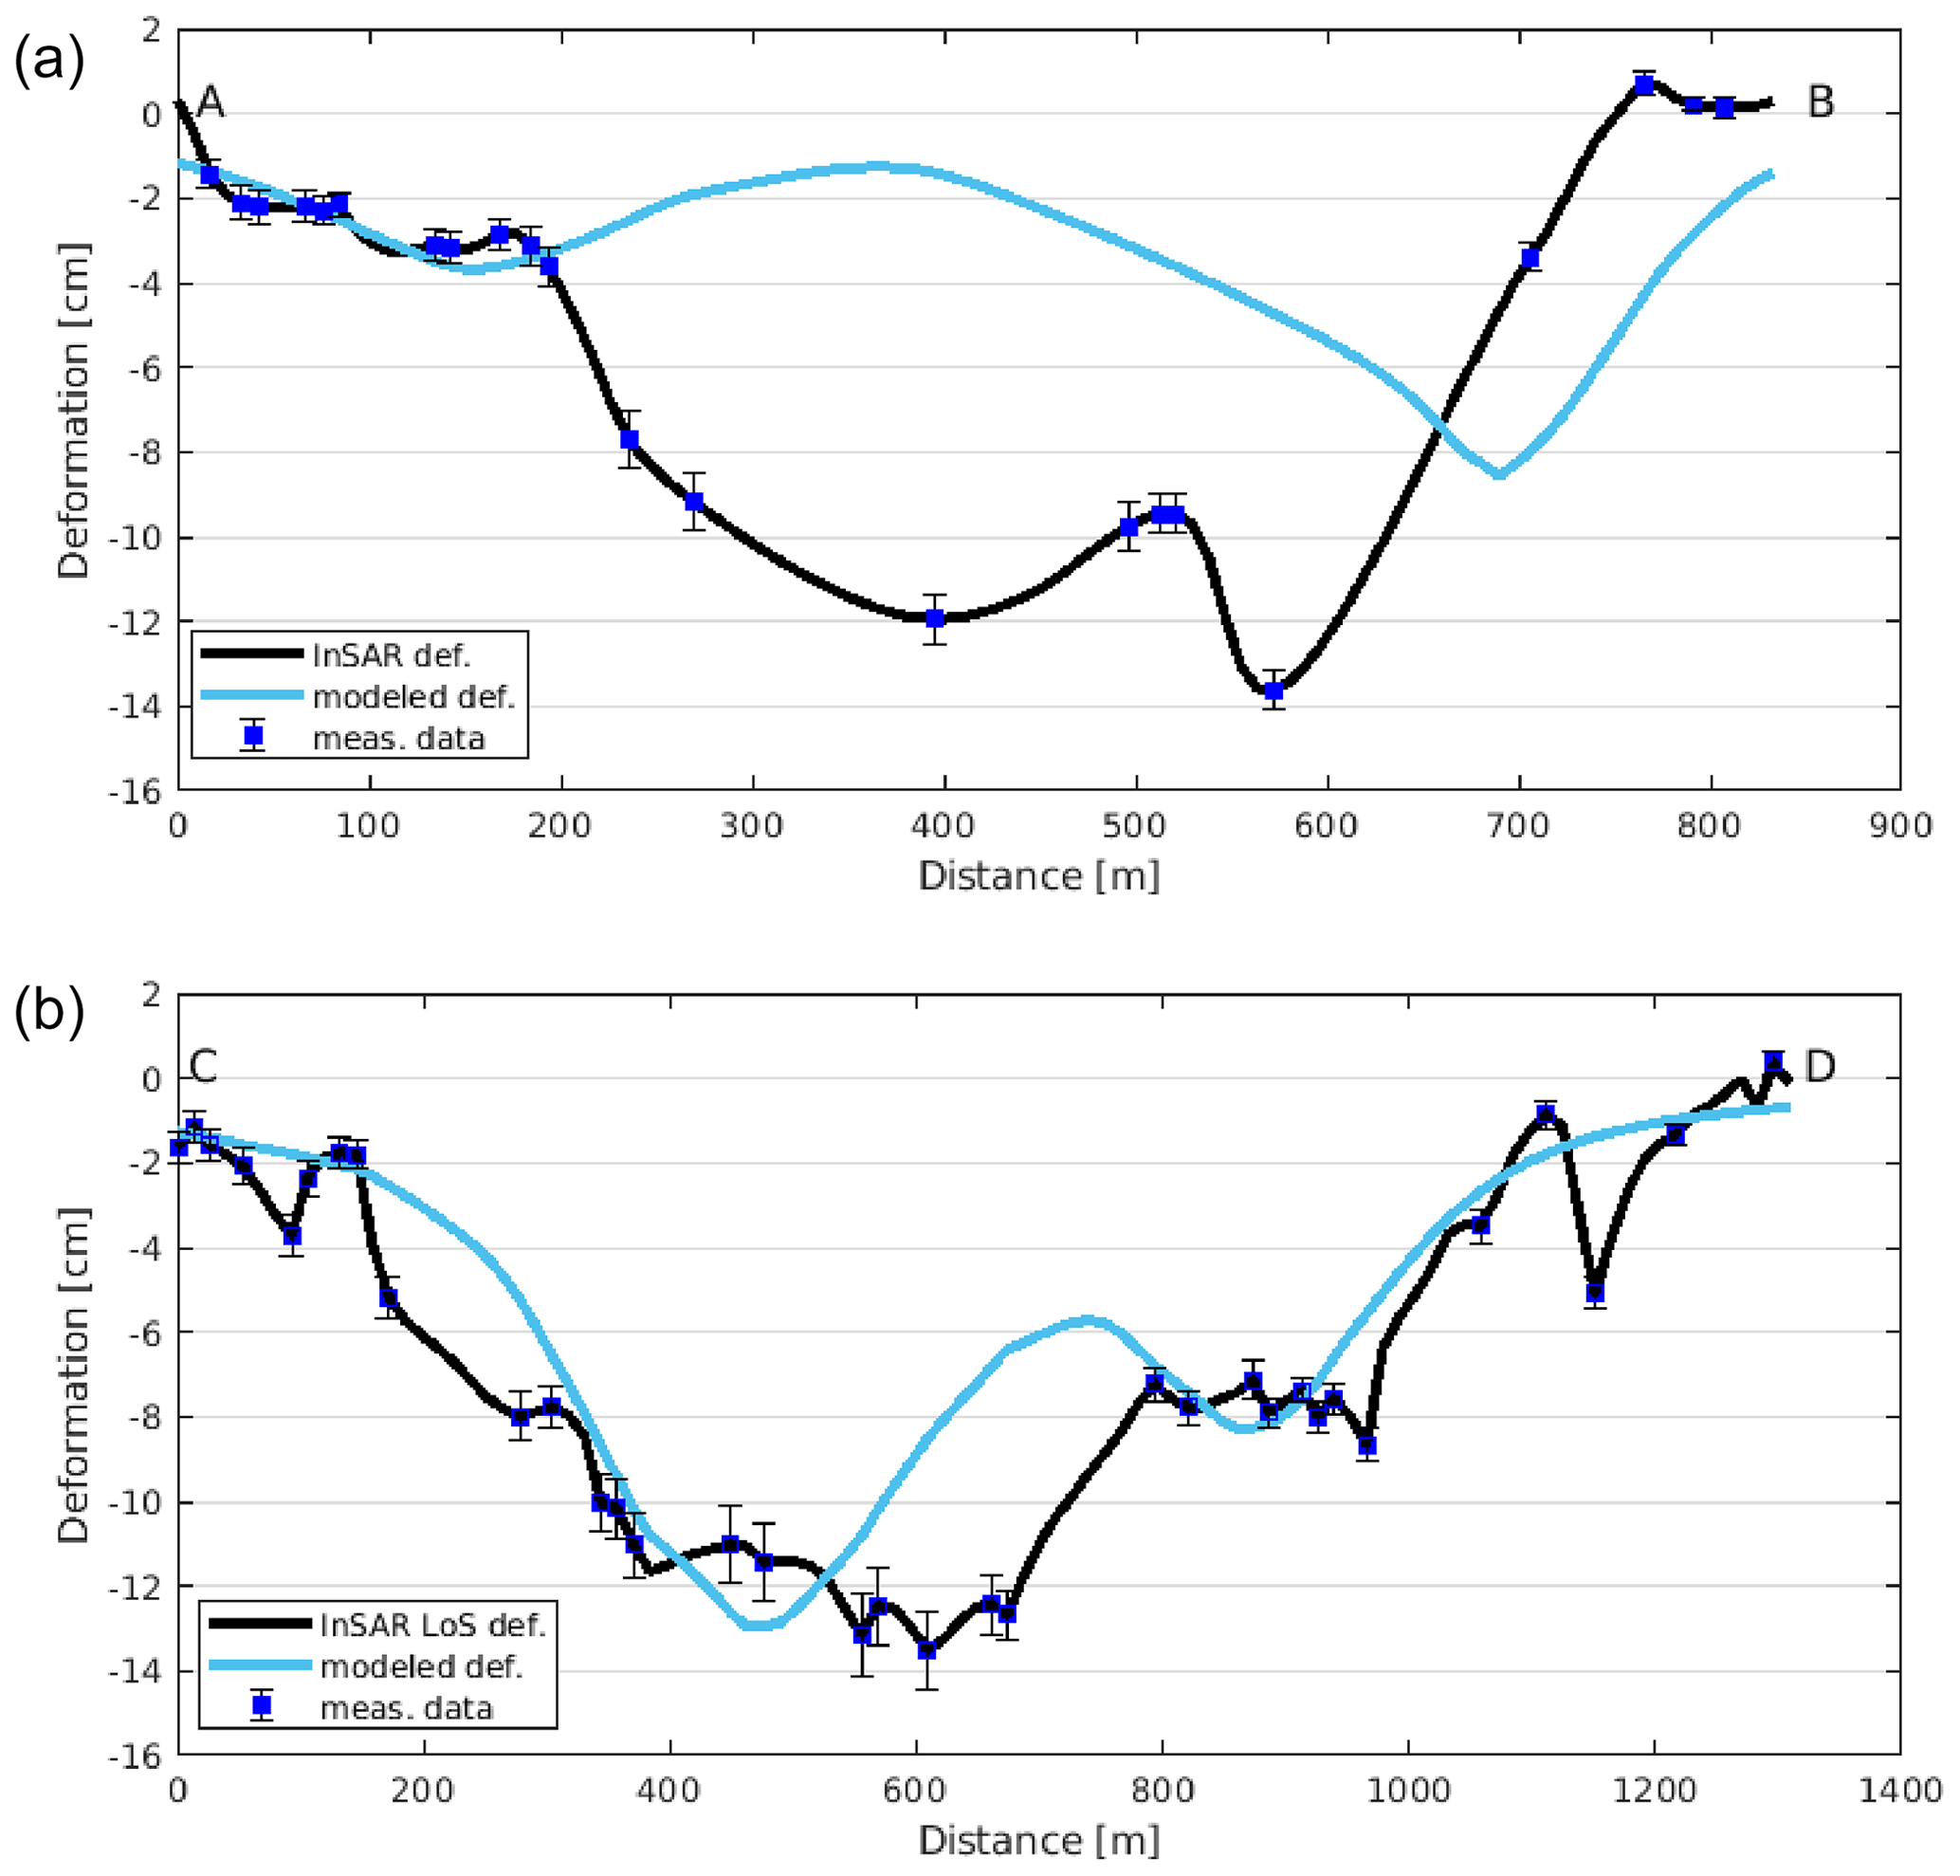
Figure 15Observed cumulative LOS and best-fitting model LOS deformations along selected profiles (given in Figs. 9 and 10) for the ascending (a) and descending (b) passes.
Apart from larger discrepancies at some individual points, the modeled deformation pattern fits well to the observed one. However, one has to keep in mind when evaluating the inversion performance that it was not possible to properly sample the deformation pattern with InSAR, as only the margins of the area were mapped adequately. Due to the sparse InSAR observation distribution in the middle of the area, we could not fit a proper source model there, which can be seen immediately when inspecting the modeled and observed deformations along selected profiles given in Fig. 15 (same profiles as cross sections A–B and C–D). Regarding the ascending data set, the same north–south-oriented profile was used to check the model fit to InSAR observations as shown in Fig. 9 to check the subsidence evolution in time. In the northern part (starting from point A to approx. 200 m) of the cross section the source models are capable of explaining reasonably well the observed deformation. The misfit of the modeled deformation is characterized by a standard deviation (SD) of ±0.49 cm. However, for the second half of the investigated profile, between 200 and 800 m, the modeled deformation differs significantly from the observed one. The reason for the large discrepancies in the middle of the cross section comes from the fact that it was not possible to find a proper source model based on the very scarce InSAR observations in the center of the area. On the southern edge of the cross section (between 700 and 800 m) the applied single source model is not capable of resolving the observed deformation. The InSAR-derived deformations probably reflect the effect of more than one subsurface cavern. Figure 15b shows the observed and modeled deformations in a roughly east–west cross section (C–D; for the location please check Fig. 10). The modeled deformation shows a reasonably sufficient fit to the InSAR deformations. The misfit of the model is characterized by a ±1.87 cm SD. The magnitude of the observed deformation is adequately described by the model; however, the location of extremities is slightly misestimated. The profile crosses the area in the north, where model no. 1 and model no. 2 are located. The effect of the two source models can be separated in the modeled deformations. Of course, the fine details revealed by InSAR observations cannot be reproduced by analytical modeling. Despite the simple formulas, analytical models can produce reasonable first-order results of the subsurface processes. Besides the above limitations, it should be mentioned that the possible interaction between the sources was not considered during the computation. As Pascal et al. (2013) pointed out, superposition of analytical models requires attention for adjacent models.
Despite the limitations of the analytical formulas, the assumed elastic rheology fits well to the temporal behavior of surface deformation, which implies that the cavity evolution is in its early stage. However, it should be mentioned that a more complex rheology can better constrain the precursory subsidence of sinkhole-prone areas as Baer et al. (2018) demonstrated. The gradual surface subsidence suggested by the elastic deformation also agrees with the geological conditions of the area. Geomorphological investigations (Móga et al., 2015) confirmed that the main driving mechanism of sinkhole formation in the area is much more like the mechanism of the perfect suffosion of non-cohesive soils than the sudden dropout of cohesive soils. The spatial distribution of observed surface deformations supports that the subsidence is confined to the territory of the mining area, which implies that natural salt karst processes are initiated and accelerated by the anthropogenic intervention. No deceleration of the ground movement was observed, which suggests that the dissolution of subsurface salt layers has become a self-sustaining geological process.
Salt mining operations in Solotvyno obviously demonstrate the severe and long-term consequences of reckless industrial salt exploitation. In a sense, the mining area has now become a natural laboratory, where salt karst processes evolving much faster than in carbonate rock can be studied in great detail. Based on Sentinel-1 SAR interferometry we have demonstrated that significant surface deformation is still ongoing nowadays related to the former salt mining operations. We revealed a cumulative line-of-sight deformation of up to nearly 15 cm in 4.5 years. It was also shown that the deformation has neither accelerated nor decelerated during the investigated time period. Elastic inverse modeling of the observed deformations was utilized to constrain the geometry of the subsurface cavities. Although Sentinel-1 interferometry was capable of capturing the deformation history of individual points, the modeling failed in some cases due to the insufficient InSAR point density, resulting in significant discrepancies between observed and modeled deformation. Despite the limitations of the study, it was shown that precursory sinkhole formation may be detected by Sentinel-1 interferometry, which is a cost-effective way to obtain an overview of ground movements. Our results suggest that further steps should be taken by local authorities in order to stabilize the mine shafts and improve the drainage system. Although several sinkholes have opened in the last 20 years, the geomorphological processes have not ended yet, and there are hundreds of meters of intact mining holes that could pose a natural geohazard risk in the future.
This paper uses the proprietary Gamma software and the publicly available GBIS code (Bagnardi and Hooper 2018).
Raw Sentinel-1 data is distributed by the European Space Agency. The data that support the findings of this study are available from the corresponding author, Eszter Szűcs, upon reasonable request.
The supplement related to this article is available online at: https://doi.org/10.5194/nhess-21-977-2021-supplement.
Conceptualization was by ES and VW; methodology and SAR data analysis was by IB, LB and CS; SG and AS were responsible for the geological and geographical background; ES and VW were responsible for interpretation. All authors contributed to writing the original draft and making corrections during the review process.
The authors declare that they have no conflict of interest.
This article is part of the special issue “Remote sensing and Earth observation data in natural hazard and risk studies”. It is not associated with a conference.
Sentinel-1 data are copyrighted by the European Space Agency and are additionally distributed by the Alaska Satellite Facility. We thank the editor Mahdi Motagh and the two anonymous reviewers for their careful and thorough reviews.
This research has been supported by the National Research, Development and Innovation Office (National Excellence Program, grant no. 2018-1.2.1-NKP-2018-00007).
This paper was edited by Mahdi Motagh and reviewed by two anonymous referees.
Agram, P. S. and Simons, M.: A noise model for InSAR time series, J. Geophys. Res.-Sol. Ea., 120, 2752–2771, https://doi.org/10.1002/2014JB011271, 2015
Baer, G., Schattner, U., Wachs, D., Sandwell, D., Wdowinski, S., and Frydman, S.: The lowest place on Earth is subsiding – An InSAR (interferometric synthetic aperture radar) perspective, Geol. Soc. Am. Bull., 114, 12–23, https://doi.org/10.1130/0016-7606(2002)114<0012:TLPOEI>2.0.CO;2, 2002.
Baer, G., Magen, Y., Nof, R. N., Raz, E., Lyakhovsky, V., and, Shalev, E.: InSAR measurements and viscoelastic modeling of sinkhole precursory subsidence: Implications for sinkhole formation, early warning, and sediment properties, J. Geophys. Res.-Earth, 123, 678–693, 2018.
Bagnardi, M. and Hooper, A.: Inversion of Surface Deformation Data for Rapid Estimates of Source Parameters and Uncertainties: A Bayesian Approach, Geochem. Geophys. Geosy., 19, 2194–2211, https://doi.org/10.1029/2018GC007585, 2018.
Berardino, P., Fornaro, G., Lanari, R., and Sansosti, E.: A new algorithm for surface deformation monitoring based on small baseline differential SAR interferograms, IEEE T. Geosci. Remote, 40, 2375–2383, https://doi.org/10.1109/TGRS.2002.803792, 2002
Bosevs'ka, L.: Structural and lithological characteristics Salt diapir Transcarpatia, J. Geol. Geogr. Geoecol., 21, 37–46, https://doi.org/10.15421/111307, 2015.
Bosevs'ka, L. and Khrushchov, D.: Environmental emergency in Solotvino: causes and geological problems solution strategy, J. Geol. Geogr. Geoecol., 19, 81–90, https://doi.org/10.15421/111117, 2011.
Cao, Y., Li, Z., Wei, J., Hu, J., Duan, M., and Feng, G.: Stochastic modeling for time series InSAR: with emphasis on atmospheric effects, J. Geodesy, 92, 185–204, https://doi.org/10.1007/s00190-017-1055-5, 2018.
Chis, V. T. and Kosinszki, S.: Geographical introductary characterization of the upper Tisa River basin (Romania-Ukraine), Transylv. Rev. Syst. Ecol. Res., 11, 1–14, 2011.
Cis P. M.: The geomorphology of USSR, Publishing house of Lviv University, 1962 (in Ukrainian).
Crosetto, M., Monserrat, O., Cuevas-González, M., Devanthéry, N., and Crippa, B.: Persistent Scatterer Interferometry: A review, ISPRS J. Photogramm., 115, 78–89, https://doi.org/10.1016/j.isprsjprs.2015.10.011, 2016.
Deák, G., Mihai, S., Deák, Ş. E., and Oancea, I.: Addressing the risk of surface water intrusion in old Romanian salt mines, Mine Water Environ., 26, 251–255, https://doi.org/10.1007/s10230-007-0011-7, 2007.
Diakiv, V.: Conformities to the Law of Development of Tekhnogenic Activated Salt Karst in the Process of Submergence of Mines No. 8 and No. 9 of the “Solotvinsky Saltmine”, in: Collection of scientific studies of Lesya Ukrainka Eastern European National University of Voliny, No. 9, Nature of Western Polesie and surrounding areas, VISNYK LVIV UNIV, Lutsk, 69–79, http://esnuir.eenu.edu.ua/handle/123456789/220 (last access: 15 November 2020), 2012.
Diakiv, V. and Bilonizhka, P.: The characteristics of the geological structure and present day geoecological condition of Solotvyno salt bed, Bulletin of Lviv University, Geology, 24, 62–79, 2010.
Elliott, J. R., Walters, R. J., and Wright, T. J.: The role of space-based observation in understanding and responding to active tectonics and earthquakes, Nat. Commun., 7, 1–16, https://doi.org/10.1038/ncomms13844, 2016.
European Space Agency: Sentinel-1 User Handbook, September 2013: ESA User Guide; GMES-S1OP-EOPG-TN-13-0001; European Space Agency, Paris, France, 80 pp., 2013.
Fattahi, H., Agram, P., and Simons, M.: A Network-Based Enhanced Spectral Diversity Approach for TOPS Time-Series Analysis, IEEE T. Geosci. Remote, 55, 777–786, https://doi.org/10.1109/TGRS.2016.2614925, 2017.
Ferretti, A.: Satellite InSAR Data, EAGE Publications BV, the Netherlands, ISBN 978-9073834712, 2014.
Fuhrmann, T. and Garthwaite, M. C.: Resolving Three-Dimensional Surface Motion with InSAR: Constraints from Multi-Geometry Data Fusion, Remote Sens., 11, 241, https://doi.org/10.3390/rs11030241, 2019.
Gaidin, A.: The effect of technogenic activity on salt karst', Ecol. Nat. Manage., 11, 42–54, available at: http://dspace.nbuv.gov.ua/handle/123456789/14410 (last access: 15 November 2020), 2008.
Galve, J. P., Castañeda, C., and Gutiérrez, F.: Railway deformation detected by DInSAR over active sinkholes in the Ebro Valley evaporite karst, Spain, Nat. Hazards Earth Syst. Sci., 15, 2439–2448, https://doi.org/10.5194/nhess-15-2439-2015, 2015.
Glushko, V. V. and Kruglov, S. S.: Tectonic map of the Ukrainian Carpathians. Scale 1:200 00, Ministry of Geology of the Ukrainian SSR, Ukrainian Geological Prospecting Research Institute, Kyiv, 1986 (in Russian).
Hanssen, R. F.: Radar Interferometry, Springer, Dordrecht, https://doi.org/10.1007/0-306-47633-9, 2001.
Herenchuk K. I.: The nature of the Transcarpathian region, Institution of Higher Education, Lviv, Ukraine, p. 156, 1981 (in Ukrainian).
Jones, C. E. and Blom, R. G.: Bayou Corne, Louisiana, sinkhole: Precursory deformation measured by radar interferometry, Geology, 42, 111–114, https://doi.org/10.1130/G34972.1, 2014.
Kim, J.-W., Lu, Z., Degrandpre, K., Kim, J.-W., Lu, Z., and Degrandpre, K.: Ongoing Deformation of Sinkholes in Wink, Texas, Observed by Time-Series Sentinel-1A SAR Interferometry (Preliminary Results), Remote Sens., 8, 313, https://doi.org/10.3390/rs8040313, 2016.
Krézsek, C. and Bally, A. W.: The Transylvanian Basin (Romania) and its relation to the Carpathian fold and thrust belt: Insights in gravitational salt tectonics, Mar. Petrol. Geol., 23, 405–442, https://doi.org/10.1016/j.marpetgeo.2006.03.003, 2006
Kuzovenko V. V.: Geologic Map of pre-Quaternary formations; Transcarpathian series L-34-XXXV (Uzhhorod), L-34-V (Satu Mare), Scale 1:200 000, Ministry of Ecology and Natural Resources of Ukraine, Department of Geology and subsurface use SGE “ZAKHIDUKRGEOLOGIYA”, 2001 (in Russian).
Kyiv State Cartographic Office: Topographic map of Ukraine Scale 1 : 100 000, maps for Transcarpathia No. 144, 145, 163, 164, 165, 182, 183, 184, 201, 202, 203, Kyiv State Cartographic Office, Kyiv, 2000 (in Russian).
La Rosa, A., Pagli, C., Molli, G., Casu, F., De Luca, C., Pieroni, A., and D'Amato Avanzi, G.: Growth of a sinkhole in a seismic zone of the northern Apennines (Italy), Nat. Hazards Earth Syst. Sci., 18, 2355–2366, https://doi.org/10.5194/nhess-18-2355-2018, 2018.
Li, Z., Wright, T., Hooper, A., Crippa, P., Gonzalez, P., Walters, R., and Parsons, B.: Towards InSAR everywhere, all the time, with Sentinel-1, ISPRS – International Archives of the Photogrammetry, Remote Sens. Spat. Inf. Sci., XLI-B4, 763–766, https://doi.org/10.5194/isprsarchives-XLI-B4-763-2016, 2016.
Lisowski, M.: Analytical volcano deformation source models, in: Volcano Deformation, Springer Praxis Books, Springer, Berlin, Heidelberg, https://doi.org/10.1007/978-3-540-49302-0_8, 2007.
Malinowska, A. A., Witkowski, W. T., Hejmanowski, R., Chang, L., van Leijen, F. J., and Hanssen, R. F.: Sinkhole occurrence monitoring over shallow abandoned coal mines with satellite-based persistent scatterer interferometry, Eng. Geol., 262, 105336, https://doi.org/10.1016/j.enggeo.2019.105336, 2019.
Manunta, M., De Luca, C., Zinno, I., Casu, F., Manzo, M., Bonano, M., and Lanari, R.: The Parallel SBAS Approach for Sentinel-1 Interferometric Wide Swath Deformation Time-Series Generation: Algorithm Description and Products Quality Assessment. IEEE T. Geosci. Remote, 57, 6259–6281, https://doi.org/10.1109/TGRS.2019.2904912, 2019.
Móga, J., Lippman, L., Tombor, E., Fehér, K., Kéri, A., and Borsodi, A.: Geomorphological investigation of the Aknaszlatina saltkarst (Ukraine), Karsztfejlődés, 20, 185–213, 2015.
Móga, J., Szabó, J., Gönczy, S., Lippmann, L., and Bódai, B.: The study of the dynamically changing landforms of Aknaszlatina saltkarst by field and GIS methods, Karsztfejlődés, 22, 139–161, 2017.
Móga, J., Gönczi, S., Berghauer, S., and Móga, K.: Georesource or geohazard? Past, present and future of the salt mines in Solotvyno, GeoMetodika, 3, 5–19, https://doi.org/10.26888/geomet.2019.3.2.1, 2019.
Nakapelukh, M., Bubniak, I., Yegorova, T., Murovskaya, A., Gintov, O., Shlapinskyi, V., and Vikhot, Y.: Balanced geological cross-section of the outer Ukrainian Carpathians along the pancake profile, J. Geodyn., 108, 13–25, https://doi.org/10.1016/j.jog.2017.05.005, 2017.
Nof, R. N., Baer, G., Ziv, A., Raz, E., Atzori, S., and Salvi, S.: Sinkhole precursors along the Dead Sea, Israel, revealed by SAR interferometry, Geology, 41, 1019–1022, https://doi.org/10.1130/G34505.1, 2013.
Onencan, A., Meesters, K., and Van de Walle, B.: Methodology for Participatory GIS Risk Mapping and Citizen Science for Solotvyno Salt Mines, Remote Sens., 10, 1828, https://doi.org/10.3390/rs10111828, 2018.
Osmanoğlu, B., Sunar, F., Wdowinski, S., andCabral-Cano, E.: Time series analysis of InSAR data: Methods and trends, ISPRS J. Photogramm. Remote, 115, 90–102, https://doi.org/10.1016/j.isprsjprs.2015.10.003, 2016.
Okada, Y.: Internal deformation due to shear and tensile faults in a half-space, Bull. Seismol. Soc. Am., 82, 1018–1040, 1992.
Parizzi, A., Gonzalez, F. R., and Brcic, R.: A covariance-based approach to merging InSAR and GNSS displacement rate measurements, Remote Sens., 12, 300, https://doi.org/10.3390/rs12020300, 2020.
Pascal, K., Neuberg, J., and Rivalta, E.: On precisely modelling surface deformation due to interacting magma chambers and dykes, Geophys. J. Int., 196, 253–278, https://doi.org/10.1093/gji/ggt343, 2013.
Pepe, A. and Calò, F.: A review of interferometric synthetic aperture RADAR (InSAR) multi-track approaches for the retrieval of Earth's Surface displacements, Appl. Sci.-Basel, 7, 1264, https://doi.org/10.3390/app7121264, 2017.
Reuter, H. I., Nelson, A. D., and Jarvis, A.: An evaluation of void – filling interpolation methods for SRTM data', I. J. Geogr. Inf. Sci., 21, 983–1008. https://doi.org/10.1080/13658810601169899, 2007.
Segall, P.: Earthquake and Volcano Deformation, Princeton University Press, USA, ISBN 9780691133027, 2010.
Shakin V. A.: Geological map of the Ukrainian Carpathians Scale 1:200 000, Ministry of Geology of the Ukrainian SSR, Ukrainian Geological Survey Research Institute, 1976 (in Russian).
Simons, M. and Rosen, P. A.: 3.12 – Interferometric Synthetic Aperture Radar Geodesy, In: Editor-in-Chief: Gerald Schubert, Editor(s)-in-Chief, Treatise on Geophysics, Elsevier, Amsterdam, 391–446, ISBN 9780444527486, https://doi.org/10.1016/B978-044452748-6.00059-6, 2007.
Strozzi, T., Teatini, P., Tosi, L., Wegmüller, U., and Werner, C.: Land subsidence of natural transitional environments by satellite radar interferometry on artificial reflectors. J. Geophys. Res.-Earth, 118, 1177–1191, https://doi.org/10.1002/jgrf.20082, 2013.
Tyitov, E. M., Mackiv, B. V., Tyitova V. I., and Belik T. I.: Geological map of Transcarpathia Scale 1 : 200 000, Transcarpathian Geological Expedition,, 1979 (in Russian).
Velasco, V., Sanchez, C., Papoutsis, I., Antoniadi, S., Kontoes, C., Aifantopoulou, D., and Paralykidis, S.: Ground deformation mapping and monitoring of salt mines using InSAR technology, SMRI Fall 2017 Technical Conference 25–26 September 2017 Münster, Germany, 1–20, 2017.
Wegmüller, U., Werner, C., Wiesmann, A., Strozzi, T., Kourkouli, P., and Frey, O.: Time-series analysis of Sentinel-1 interferometric wide swath data: Techniques and challenges, 2016 IEEE International Geoscience and Remote Sensing Symposium (IGARSS), 10–15 July 2016, Beijing, 3898–3901, https://doi.org/10.1109/IGARSS.2016.7730012, 2016.
Yague-Martinez, N., Prats-Iraola, P., Rodriguez Gonzalez, F., Brcic, R., Shau, R., Geudtner, D., and Bamler, R.: Interferometric Processing of Sentinel-1 TOPS Data, IEEE T. Geosci. Remote, 54, 2220–2234, https://doi.org/10.1109/TGRS.2015.2497902, 2016.
Zechner, E., Dresmann, H., Mocuţa, M., Danchiv, A., Huggenberger, P., Scheidler, S., and Zlibut, A.: Salt dissolution potential estimated from two-dimensional vertical thermohaline flow and transport modeling along a Transylvanian salt diapir, Romania, Hydrogeol. J., 27, 1245–1256, https://doi.org/10.1007/s10040-018-1912-1, 2019.
- Abstract
- Introduction
- Geological background and salt mining activities in Solotvyno
- Material and methods
- Results
- Discussion
- Conclusions
- Code availability
- Data availability
- Author contributions
- Competing interests
- Special issue statement
- Acknowledgements
- Financial support
- Review statement
- References
- Supplement