the Creative Commons Attribution 4.0 License.
the Creative Commons Attribution 4.0 License.
 | 10 Mar 2021
Hydrometeorological analysis and forecasting of a 3 d flash-flood-triggering desert rainstorm
Yair Rinat
Francesco Marra
Moshe Armon
Asher Metzger
Yoav Levi
Pavel Khain
Elyakom Vadislavsky
Marcelo Rosensaft
Efrat Morin
Flash floods are among the most devastating and lethal natural hazards. In 2018, three flash-flood episodes resulted in 46 casualties in the deserts of Israel and Jordan alone. This paper presents the hydrometeorological analysis and forecasting of a substantial storm (25–27 April 2018) that hit an arid desert basin (Zin, ∼1400 km2, southern Israel) claiming 12 human lives. This paper aims to (a) spatially assess the severity of the storm, (b) quantify the timescale of the hydrological response, and (c) evaluate the available operational precipitation forecasting. Return periods of the storm's maximal rain intensities were derived locally at 1 km2 resolution using weather radar data and a novel statistical methodology. A high-resolution grid-based hydrological model was used to study the intra-basin flash-flood magnitudes which were consistent with direct information from witnesses. The model was further used to examine the hydrological response to different forecast scenarios. A small portion of the basin (1 %–20 %) experienced extreme precipitation intensities (75- to 100-year return period), resulting in a local hydrological response of a high magnitude (10- to 50-year return period). Hillslope runoff, initiated minutes after the intense rainfall occurred, reached the streams and resulted in peak discharge within tens of minutes. Available deterministic operational precipitation forecasts poorly predicted the hydrological response in the studied basins (tens to hundreds of square kilometers) mostly due to location inaccuracy. There was no gain from assimilating radar estimates in the numerical weather prediction model. Therefore, we suggest using deterministic forecasts with caution as it might lead to fatal decision making. To cope with such errors, a novel cost-effective methodology is applied by spatially shifting the forecasted precipitation fields. In this way, flash-flood occurrences were captured in most of the subbasins, resulting in few false alarms.
- Article
(9667 KB) - Full-text XML
- BibTeX
- EndNote


Flash floods are rapidly evolving events characterized by a sudden rise in stream water level and discharge (Sene, 2013). These events often result in casualties and damage (Barredo, 2007; Borga et al., 2019; Doocy et al., 2013; Grodek et al., 2012; Petrucci et al., 2019; Vinet et al., 2019) and are ranked among the most devastating natural hazards worldwide (Barredo, 2007; Borga et al., 2014; Doocy et al., 2013; Gaume et al., 2009; Gruntfest and Handmer, 2001; Marchi et al., 2010; Sene, 2013).
Flash-flood conditions are frequently found in arid and semiarid regions (Nicholson, 2011; Pilgrim et al., 1988; Schick, 1988; Simmers, 2003; Tooth, 2000) as these areas are generally characterized by localized high rainfall intensities (Sharon, 1972), low precipitation interception, and low infiltration rates due to sparse vegetation coverage (Danin, 1983) and exposed bedrock surfaces that are partially covered by shallow, clay-rich, undeveloped soils (Singer, 2007). Although arid and semiarid regions cover more than a third of the world’s land area, knowledge of flash-flood-generating rainfall properties, hydrological response, and flood-forecasting skills in these areas is limited due to poor measurements, sparse documentation, and a relatively small number of studies (Armon et al., 2018; Nicholson, 2011; Simmers, 2003; Yang et al., 2017; Zoccatelli et al., 2019).
Rainstorm patterns in arid regions are characterized by localized structures of high rainfall intensities, termed convective rain cells (e.g., Karklinsky and Morin, 2006; Morin and Yakir, 2014; Nicholson, 2011; Sharon, 1972). During rainstorms, one or more convective rain cells can deliver relatively large rainfall amounts over small areas in a short time, directly contributing to runoff initiation and flash-flood occurrence (Archer et al., 2007; Borga et al., 2007; Chappell, 1986; Delrieu et al., 2005; Doswell et al., 1996; Gaume et al., 2016; Marchi et al., 2010; Yakir and Morin, 2011). Yakir and Morin (2011) found that flash floods in arid regions can occur as a result of a single rain cell and that the flood's magnitude is sensitive to its starting location, direction, and velocity. Belachsen et al. (2017) found that, in arid regions, storms that generate flash floods are characterized by rain cells with larger area, lower advection velocity, and longer lifetime than storms that do not produce flash floods. Furthermore, rain-gauge networks are unable to adequately sample the spotty precipitation patterns (Faurès et al., 1995; Kampf et al., 2018; Michaud and Sorooshian, 1994; Wheater et al., 2008), limiting our knowledge of rainfall climatology and frequency (Marra et al., 2019a; Marra and Morin, 2015).
As a result of the complex rainfall patterns, runoff in arid and semiarid regions is often unexpected, localized, and characterized by high temporal variability (Morin et al., 2009b; Nicholson, 2011). Hillslope runoff does not always reach the stream network (Shmilovitz et al., 2020; Yair et al., 1980; Yair and Kossovsky, 2002; Yair and Raz-Yassif, 2004), and transmission losses can further enhance the intra-basin complexities and runoff localization (Greenbaum et al., 2002a; Morin et al., 2009a; Walters, 1990). Even in the most extreme events, only part of the basin contributes runoff (Nicholson, 2011; Pilgrim et al., 1988; Yang et al., 2017).
The devastating effect of flash floods is attributed not only to the magnitude of the event but also to their fast development and unexpected occurrence. When individuals or communities are not aware of the approaching danger, they are unable to escape or protect themselves (e.g., Borga et al., 2019; Creutin et al., 2013). Thus, effective early warning of flash floods greatly depends on the time between the center of mass of the excess rainfall and the peak discharge (Dingman, 2015; USGS, 2012), termed lag time, and the time available between the issuing of the forecast and the peak discharge (Sene, 2013), termed lead time. The former is dictated by nature, while the latter also depends on the accuracy and effectiveness of the forecasting chain. Creutin et al. (2013) and Marchi et al. (2010) calculated lag times for Europe under various climate regimes and found that it increases with basin area and follows a general power-law behavior, in which basins in areas smaller than 100 km2 often had lag times of less than 1 h. Zoccatelli et al. (2019) found that the mean lag time for 14 arid basins (202–1232 km2) in Israel is on the order of tens of minutes to several hours.
To increase flash-flood predictability and extend the lead time, accurate rainfall forecasting is required (Alfieri et al., 2012; Sene, 2013). Commonly used methods include weather prediction models and nowcasting techniques. Global weather prediction models are routinely used by meteorological agencies worldwide, but their spatiotemporal scales are too coarse for flash-flood applications (Sene, 2013). In recent years, convection-permitting models with a spatial resolution of ≤3 km have enabled explicit representation of the convective process, providing better representation of rainfall and better forecast skills on the flash-flood scale (Armon et al., 2020; Clark et al., 2016; Khain et al., 2019; Prein et al., 2015). However, the finer scale increases the sensitivity of these models to initial conditions, leading to spatial uncertainties in their output (Bartsotas et al., 2016; Ben Bouallègue and Theis, 2014; Collier, 2007; Sivakumar, 2017). To cope with these limitations, radar rainfall estimates are routinely assimilated into the models (Clark et al., 2016; Stephan et al., 2008). Nevertheless, spatial and temporal uncertainties in individual forecasts are still observed, and multiple model runs should therefore be considered in a probabilistic ensemble framework (Ben Bouallègue and Theis, 2014; Dey and Yan, 2016).
In general, flash floods remain a poorly understood and documented process (Borga et al., 2019; Foody et al., 2004; Gaume et al., 2009; Nicholson, 2011; Wheater et al., 2008) despite their devastating potential (Borga et al., 2019; Gaume et al., 2009; Inbar, 2019; Tarolli et al., 2012; Sen, 2008) and increasing impact (Doocy et al., 2013; Wittenberg et al., 2007), especially in arid areas (Zoccatelli et al., 2019, 2020). The present work aims to increase our understanding and knowledge of desert flash floods and to test practical forecasting abilities by presenting a comprehensive study of the rainstorm of 25–27 April 2018 that hit the arid Zin basin in southern Israel (1400 km2; Fig. 1), causing one of the most fatal desert flash floods ever recorded in the region. The storm’s highest impact occurred during the day of 26 April, triggering a flash flood in the small (46 km2) Zafit subbasin (Fig. 1b, c). Rainstorm analysis was applied to all 3 d; however, its results and direct information from eyewitnesses led us to focus the hydrological and forecasting analyses mainly on the second day of the storm, 26 April.
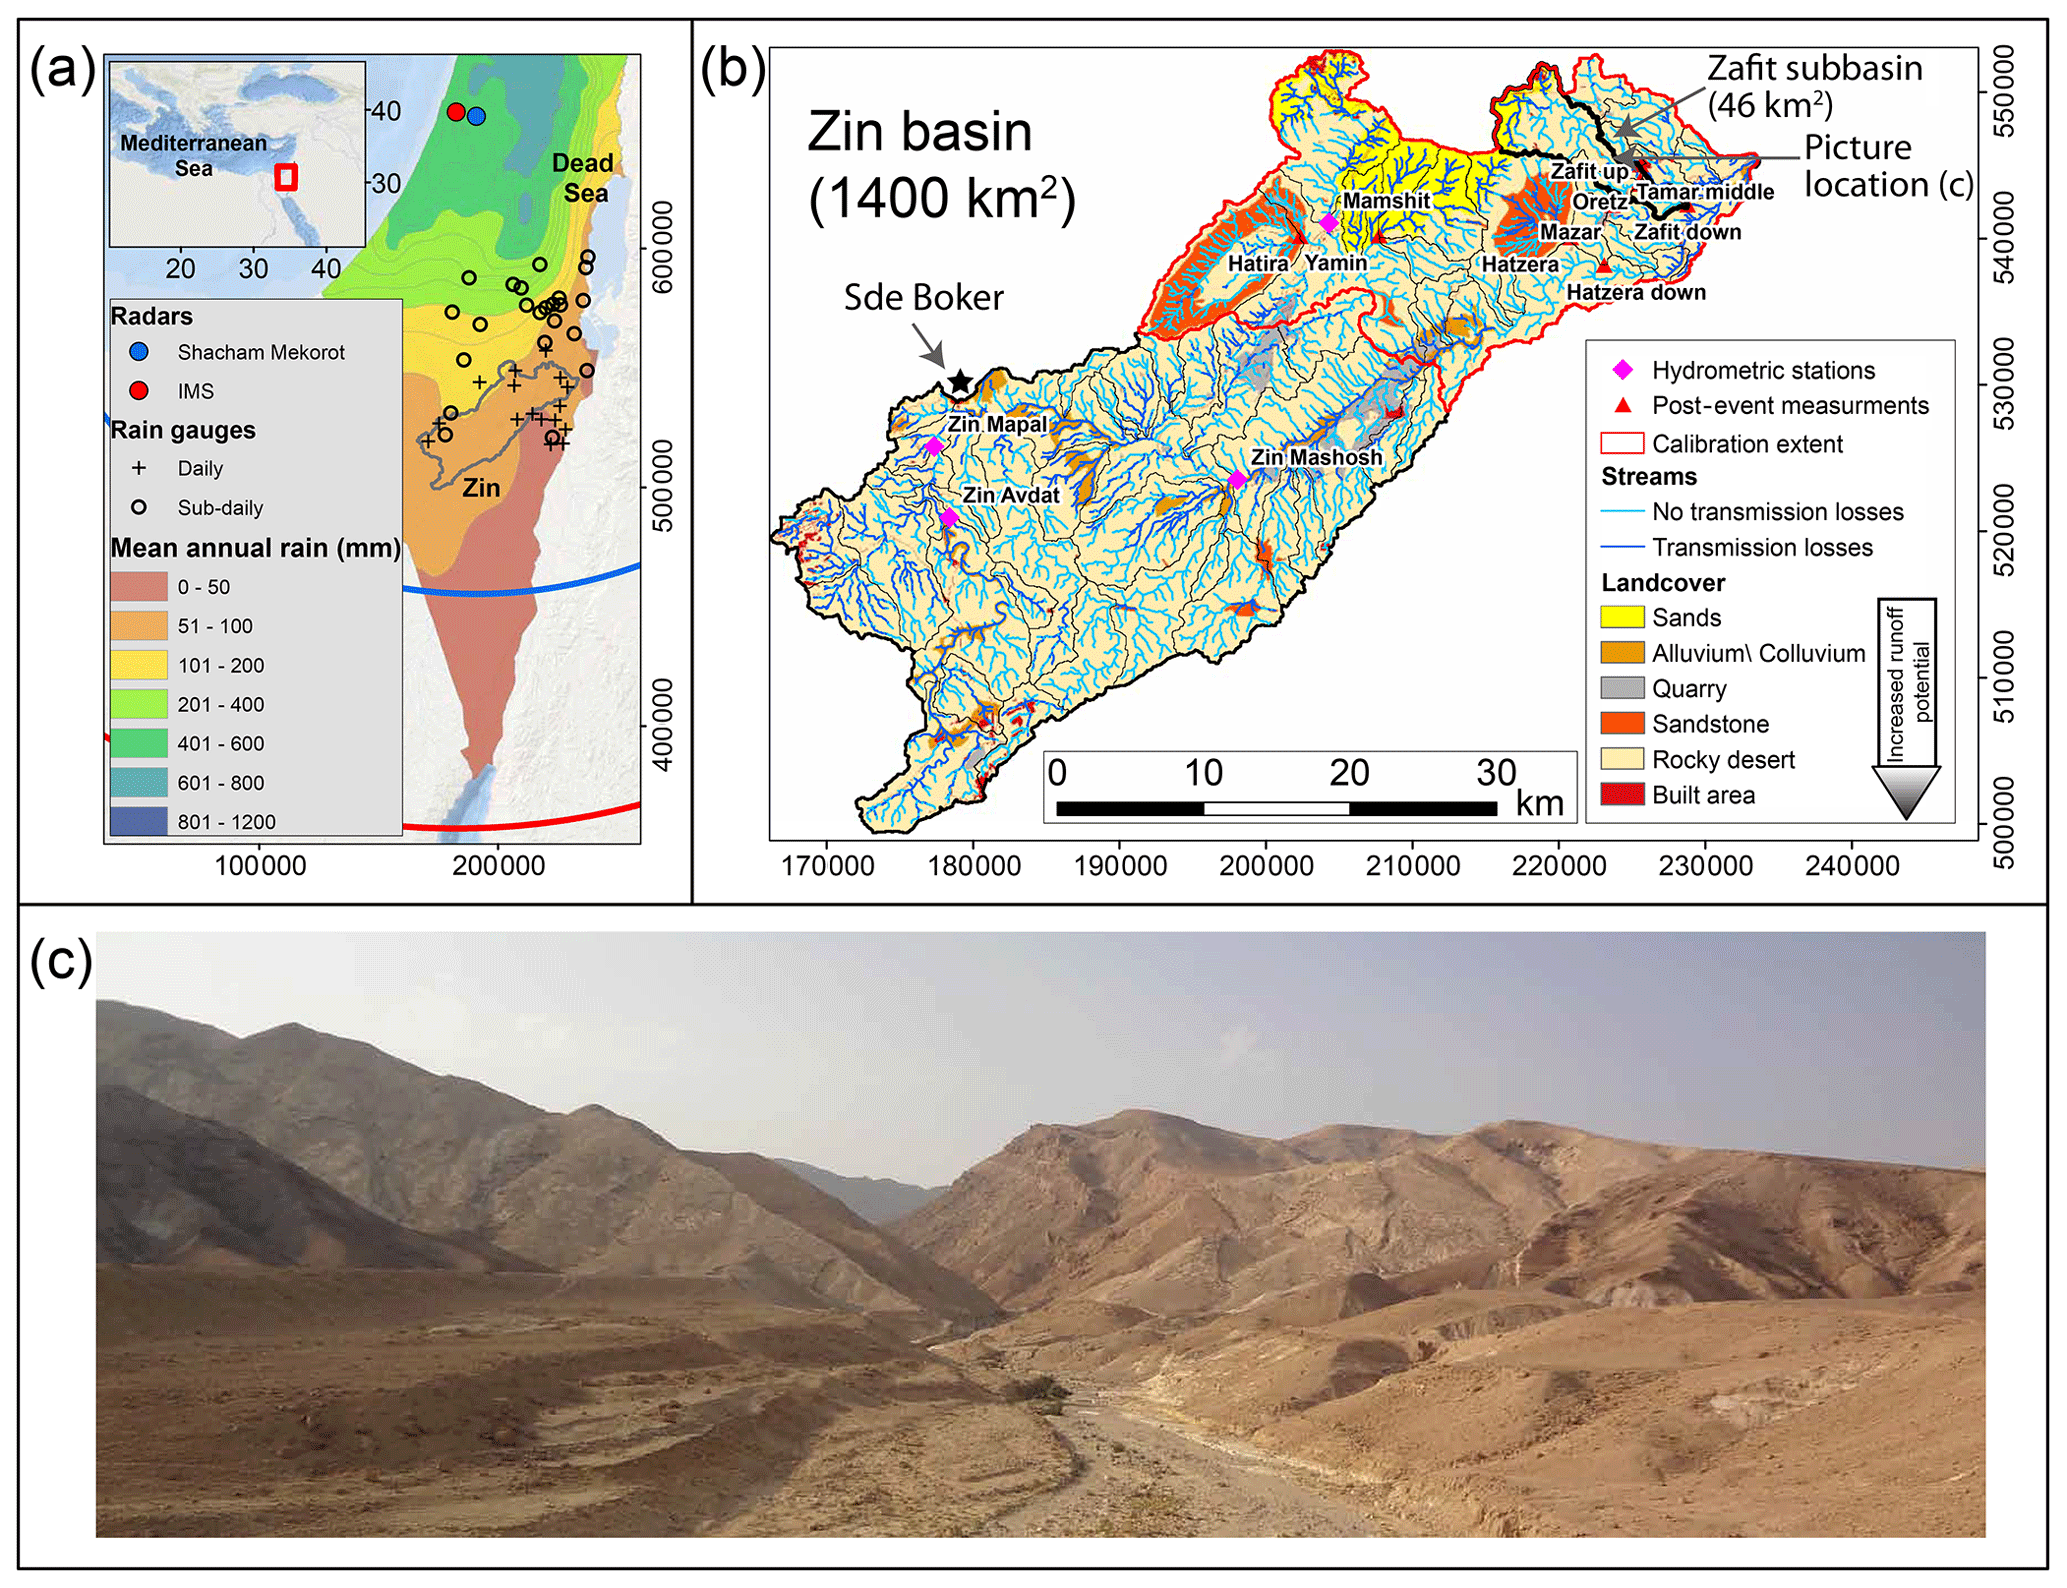
Figure 1(a) Mean annual rain depth map of Israel (1960–1990, Israel Meteorological Service), daily and sub-daily rain gauges, and the Zin basin location. Extents and locations of the Shacham–Mekorot and the Israel Meteorological Service C-band radars are in blue and red, respectively. Inset in (a) is a general location map. Map coordinates (in m) are of the Israeli Transverse Mercator grid, while for the inset, the geographic coordinate system is used. The World Ocean Basemap by Esri is used as the background. (b) The Zin basin and its 57 subbasins (thin brown lines). The Zafit subbasin is outlined in a bold black line. Hydrometric stations are shown as pink diamonds, and locations of post-event estimations are marked by red triangles. (c) Photograph of Zafit basin taken toward the northwest; the location is marked in panel (b).
Specifically, we addressed the following questions. (a) What was the severity of the storm and flood and how did it vary spatially? (b) What was the time scale of the flash-flood response? (c) What was the operational predictability of the rainfall and the resulting flash floods and can it be improved? To answer these questions, we combined datasets and tools, including radar rainfall data, operational rainfall forecasts, rainfall and flood-frequency analyses and their spatial variations, a grid-based hydrological model, and unique direct field observations during the event.
The paper is arranged as follows. The research area and data are presented in Sect. 2. Section 3 describes the rainstorm and presents a spatial rainfall return period analysis. Sections 4 and 5 focus on the hydrological response and operational forecast analysis of the flash flood on 26 April 2018, respectively, Sect. 6 includes a short discussion, and Sect. 7 presents our conclusions.
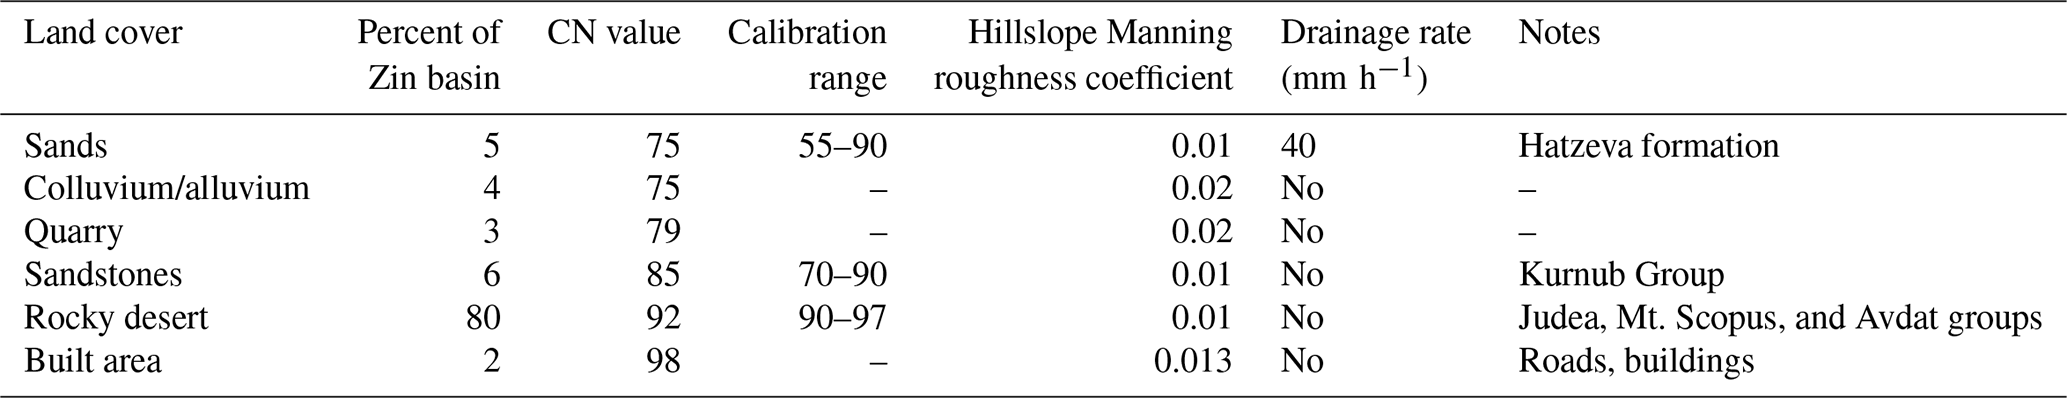
The Zin basin (∼1400 km2) drains the mountains of the Negev desert, southern Israel, to the Dead Sea (Fig. 1). The basin orientation is from southwest to northeast, and elevation drops from 1000 m above sea level to 380 m below sea level. Slopes are low to moderate (0–10∘) in 75 % of the basin but can be as high as 60–80° locally (e.g., Fig. 1c). The main exposed lithology consists of limestone (54 %), chalk and chert (27 %), lithified sandstones (7 %), non-lithified sand (5 %), alluvium (4 %), and marl (3 %) (Sneh et al., 1998). The western part of the basin is covered by thin layers of lithosols that become scarce to the east, exposing the bedrock (Dan et al., 1975; Singer, 2007). Vegetation is extremely sparse, mainly concentrated in stream channels, and its abundance decreases from west to east (Danin, 1983). We classified six hydrological domains in the basin according to the lithology, soil, and land use (Fig. 1b): rocky desert (80 %), sand (6 %), sandstone (5 %), alluvium/colluvium (4 %), quarry (3 %), and built area (2 %). Alluvial and sandy channel sections were identified as areas in which transmission losses occur (Greenbaum et al., 2002a, 2006; Schick, 1988; Schwartz, 2001; Tooth, 2000; Wheater et al., 2008).
2.1 Meteorological and hydrological setting
Mean annual rainfall ranges from 90 mm in the elevated western part of the basin to 60 mm in the lower eastern part. The rainy season spans October to May, with most of the rain (>60 %) falling from December to February. Rainy days (≥1 mm) are rare, and the annual average is 16 d on the western side and 8 d on the eastern side of the basin (IMS, 2020; averaged over 1980–2009). The mean annual potential evaporation is ∼2600 mm; in the winter, it ranges from 2.6 to 4.6 mm d−1 in the western and eastern parts of the basin, respectively. In the autumn and spring, the mean potential evaporation spans 6.0 to 9.3 mm d−1 with an increasing gradient from west to east (Goldreich, 2003).
Most flash floods (58 %) occur during the winter months, from December to February, and 42 % occur in the transition seasons (based on 107 flash-flood events recorded at the Zin Mapal station from 1954 to 2016; Fig. 1). Kahana et al. (2002) reported that most flash floods in the region can be attributed to well-defined synoptic systems. About a third of the events are associated with Mediterranean cyclones, occur mainly during the winter, and include a wide range of magnitudes, and the rest occur during the transition seasons and are associated with flash floods of medium to extreme magnitudes. The maximal specific peak discharge measured at the Zin Mapal hydrometric station was 2.27 (October 1991, 234 km2; Fig. 1b). The maximal specific peak discharge found in post-event surveys was 42 (October 2004, 0.5 km2, with 12 in the Zafit subbasin, 46 km2; Fig. 1b).
2.2 Hydrometeorological data
The Zin basin is monitored by the Israel Meteorological Service (IMS) C-band Doppler radar which provides scans at a temporal resolution of ∼5 min and was used for the studied rainstorm. The area was also covered by the Shacham–Mekorot C-band radar, which has a 24-year-long record (operational up to 2015; see details in Marra and Morin, 2015) and was used for spatial rainfall-frequency analysis (Sect. 3.2). Both radars are located north of the basin (Fig. 1a). Two rain gauges with a temporal resolution of 10 min and eight rain gauges that provide only daily data monitor the basin (Fig. 1a). Radar reflectivity data for the rainstorm were corrected for beam blockage and attenuation due to heavy rainfall. Rain intensity was calculated using a fixed Z–R relation well suited for convective precipitation in the area () and converted to a 500×500 m2 Cartesian grid (see Appendix in Marra and Morin, 2018). Accumulated rain depths measured at 39 rain gauges in the basin’s vicinity (Fig. 1a) were used to correct the residual bias for the analyzed storm using an adaptive multiquadratic surface-fitting algorithm (Amponsah et al., 2016; Martens et al., 2013). An upper cap of 150 mm h−1 was applied on the adjusted estimates to reduce errors caused by the presence of hail (Marra and Morin, 2015). Class A evaporation pan measurements from Sde Boker (Fig. 1b) were used to evaluate daily potential evaporation rates.
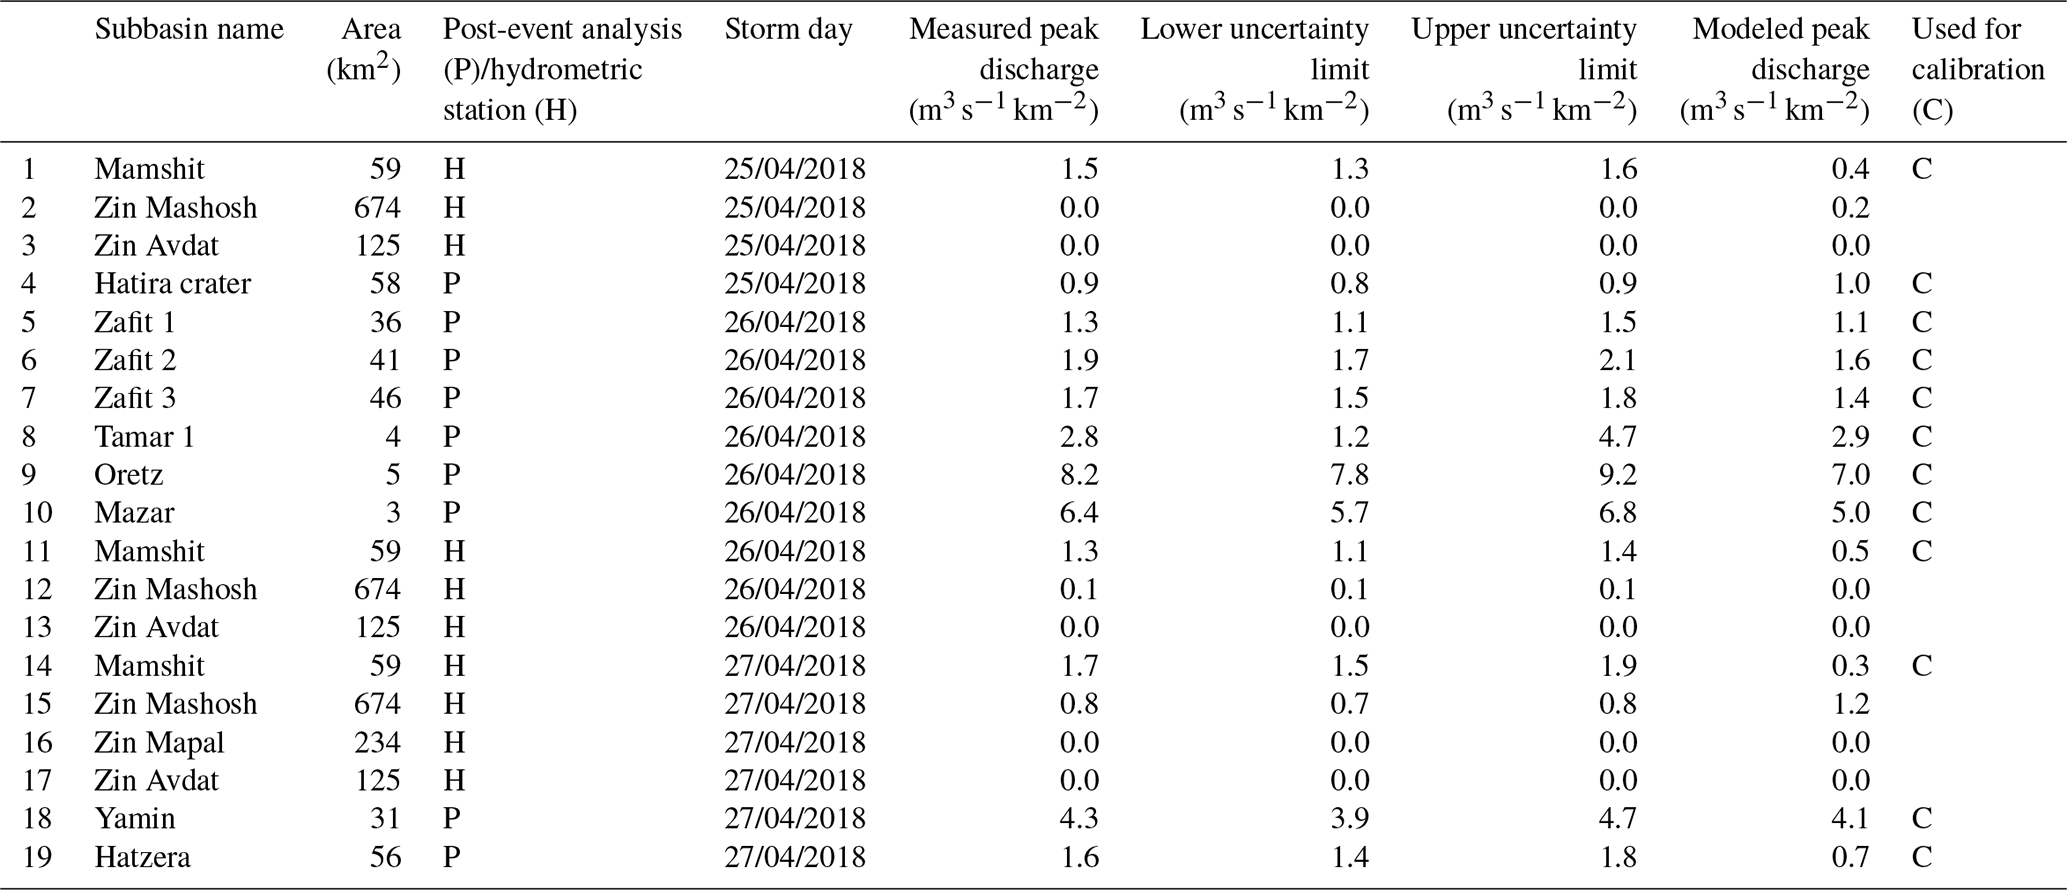
The Zin basin includes four active hydrometric stations; however, only the Mamshit hydrometric station is situated in the area influenced by the storm’s core (Fig. 1b; Table 1). To overcome the poor spatial representation of flood data, post-event surveys and analyses were conducted to estimate the flood's peak discharge in nine ungauged locations (Fig. 1b; Table 1). High water marks were identified, channel cross sections were measured, and Manning roughness coefficients were estimated (Benson and Dalrymple, 1967; Gaume and Borga, 2008; Limerinos, 1970). Lastly, peak discharges were estimated using the HEC-RAS software (Brunner, 2016).
Table 1Measured and modeled peak discharges for the Zin case study. Uncertainly limits refer to error estimations in the measured peak discharge.
3.1 General storm description
The studied rainstorm occurred over 3 consecutive days from 25 to 27 April 2018 and covered most of the southern Israeli desert. It resulted from an upper-troposphere low arriving at the eastern Mediterranean from the west. Moisture was available due to the slow passage of the cyclone over the Mediterranean Sea. This cyclone triggered highly developed convective clouds that roughly followed the upper-level low-pressure center (Dayan et al., 2020). Rainfall dynamics followed a similar pattern during all 3 d, initiating in the late morning (∼ 10:00 all times are in UTC+3) and lasting intermittently until the evening (20:00–23:00) (Fig. 2a). Rainfall over the Zin basin was of a convective nature characterized by 474 rain cells with a mean rain-cell area of 237 km2, mean areal rain intensity of 18 mm h−1, mean maximal rain intensity of 57 mm h−1, and mean rain-cell velocity of 16 m s−1 (Fig. 2b; calculated over the Zin basin using a threshold of 5 mm h−1 to determine rain-cell boundaries, following Belachsen et al., 2017). The mean rain-cell area was similar to that estimated by Belachsen et al. (2017) for 29 flash-flood events in two basins draining into the Dead Sea (Fig. 1a), while mean and maximum rain intensity and cell velocity were, on average, higher in the current analyzed storm (Fig. 2b). This multiday convective rainstorm resulted in an extensive hydrological response, and flash floods were recorded at 27 of the 30 (90 %) active hydrometric stations in the area of Fig. 2c.
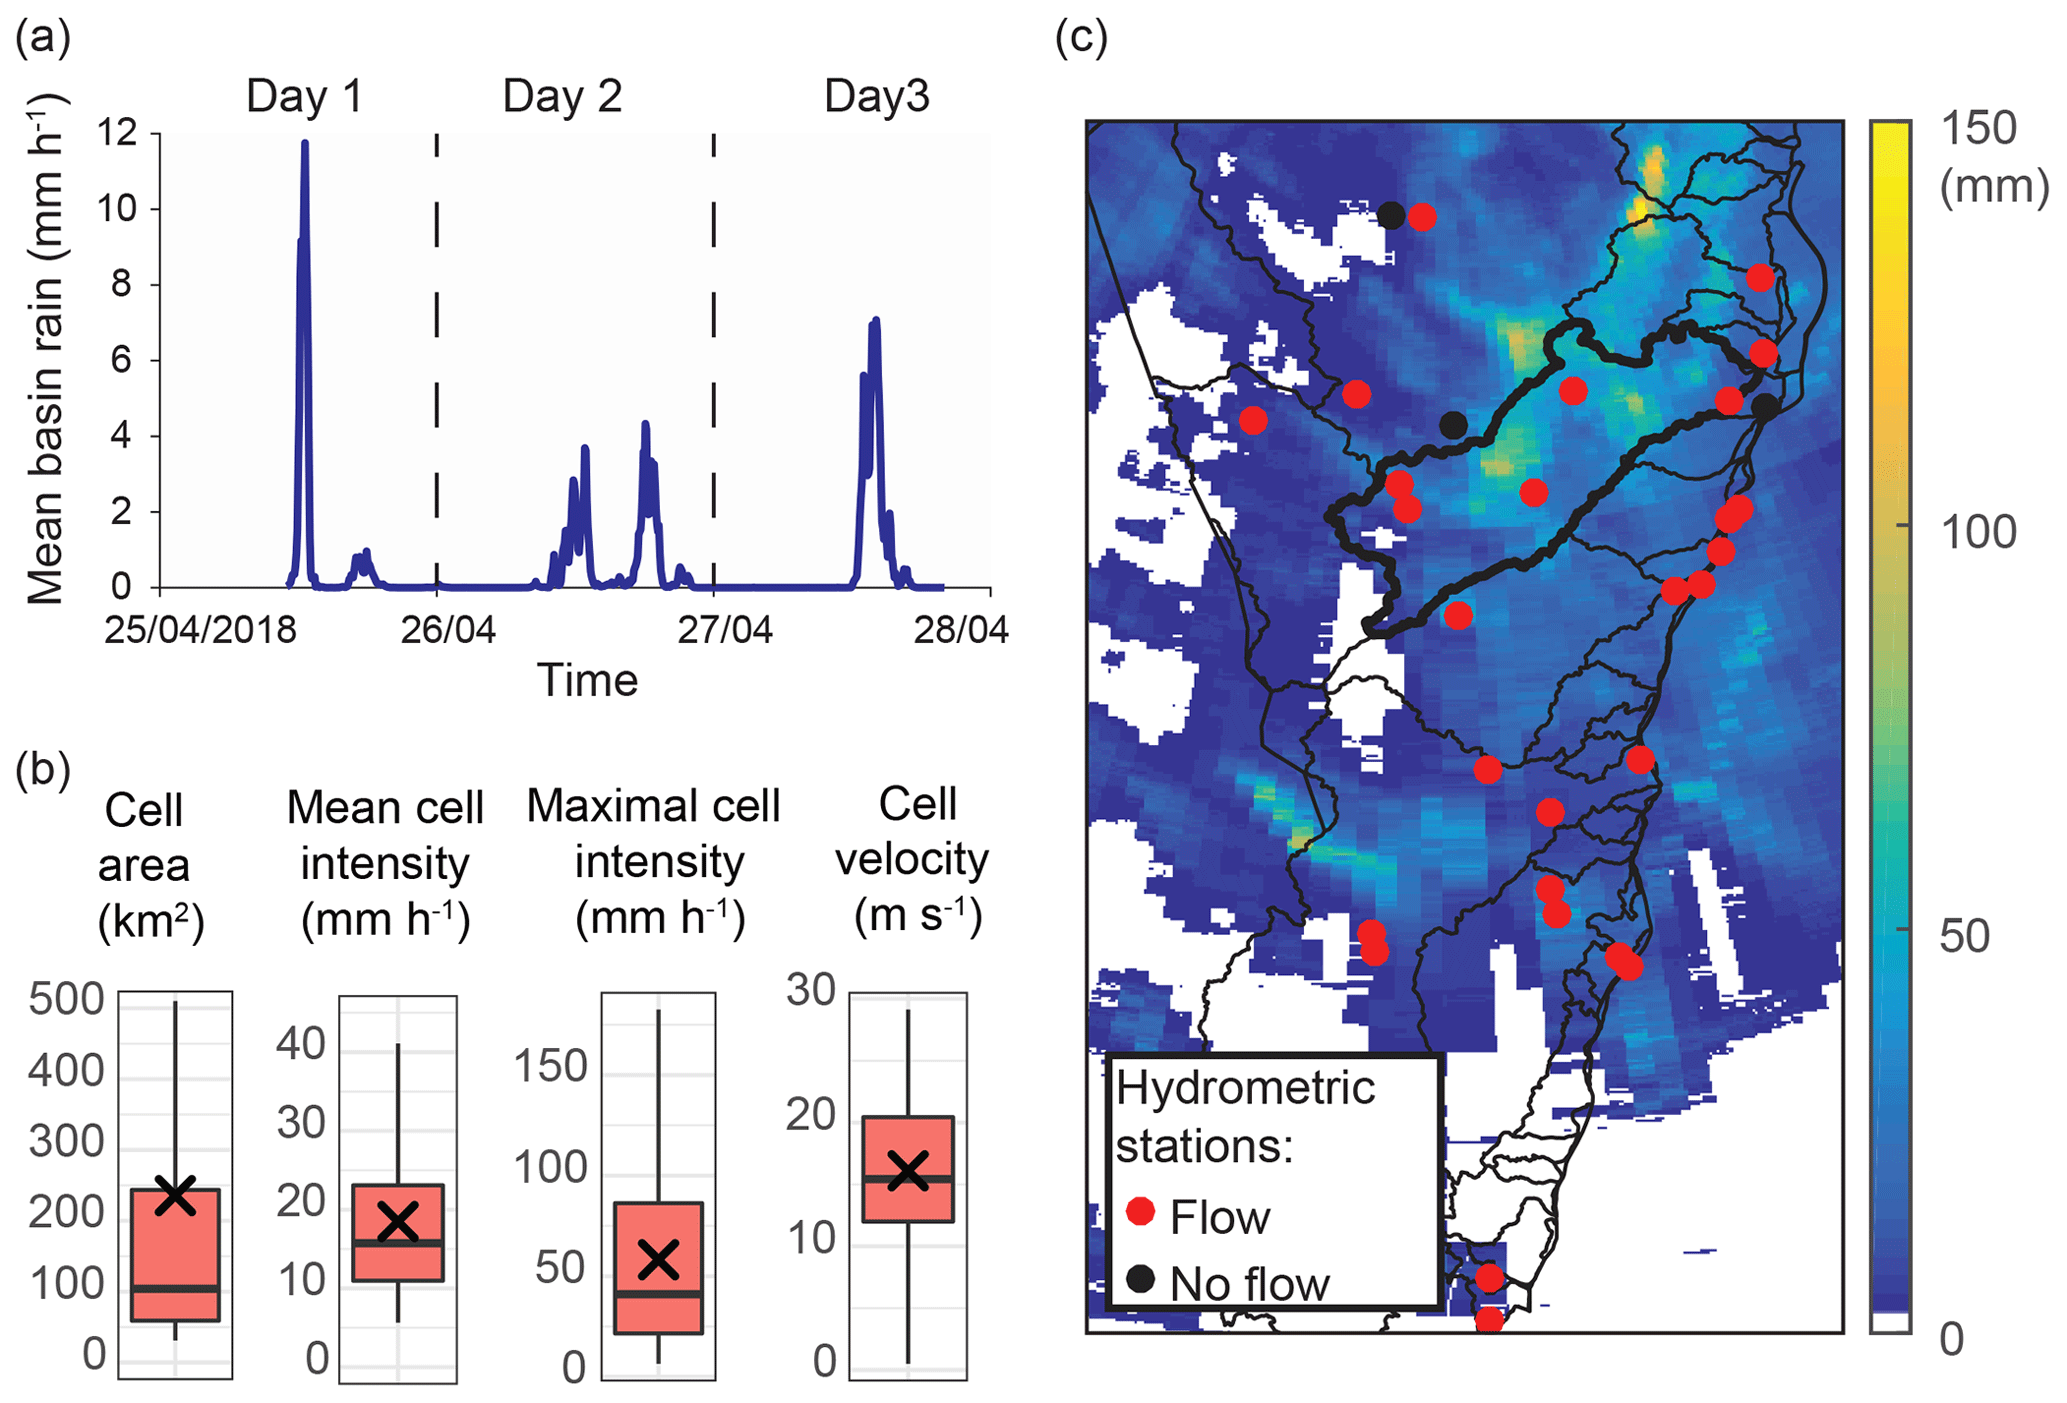
Figure 2Properties of the 25–27 April 2018 rainstorm. Panel (a) shows the 5 min rain intensity spatially averaged over the Zin basin. (b) Rain-cell area, mean and maximal rain-cell intensity, and rain-cell velocity calculated over the Zin basin. Crosses represent the mean, horizontal lines are the median, colored areas represent the narrowest 50 % of the data, and the whisker limits represent the minimal and maximal values except when 150 % of the interquartile range is exceeded. (c) Total storm rain depth from the radar analysis and location of hydrometric stations. Stations that exhibited at least one flash flood during the rainstorm are marked in red. The Zin basin is marked by a bold outline.
3.2 Estimation of rainstorm return period
Estimating the probability of exceedance of the rainfall intensities observed during the storm is important to improve flash-flood warning systems, the design and operation of water resource projects, and risk and damage estimations for insurance policies (Brutsaert, 2005; Chow et al., 1988; Larsen et al., 2001). Traditionally, this information is derived from rain gauges by exploiting their relatively long and homogeneous records (Dey et al., 2016); however, especially in arid areas, rain gauges are generally sparsely distributed, resulting in an insufficient representation of the storm's spatiotemporal heterogeneity (Marra and Morin, 2018) on the one hand and of the climatic gradients of the region on the other (Kidd et al., 2017; Marra and Morin, 2015).
Applying traditional approaches to the studied storm using one of the sub-daily rain gauges around the Zin basin (Sde Boker; Fig. 1a; Marra and Morin, 2015) results in return periods of less than a year for many durations (0.5, 1, 3, 24, and 72 h; not shown). However, this is misleading as intense rainfall did not occur in this particular location during the storm. At the same time, a direct comparison of weather radar estimates to frequency analyses based on this station would be hampered by the strong climatic and topographic gradients characterizing the region (IMS, 2020; Marra et al., 2017): largely different frequency curves are to be expected within the Zin catchment due to gradients in both the intensity and frequency of occurrence of precipitation events (e.g., see Marra et al., 2019a). Therefore, different data sources should be explored.
Remotely sensed datasets, such as weather radar archives, may provide the required distributed information, and their use for precipitation-frequency analyses is becoming more and more quantitatively reliable due to the increasing length of the data records and improvements in the statistical techniques (Marra et al., 2019a). To obtain reasonable estimates of storm frequency for sub-daily durations and throughout the catchment, we took advantage of the 24-year-long Shacham–Mekorot weather radar archive (Marra and Morin, 2015) and of the novel metastatistical extreme value (MEV) framework (Marani and Ignaccolo, 2015). This latter method optimizes the use of short data records (Zorzetto et al., 2016) and is less sensitive to the measurement errors typical of weather radars than classical methods based on extreme value theory (Marra et al., 2018). Independent precipitation events were separated using the methodology detailed in Marra et al. (2018), and a single-event-type simplified MEV approach (Marra et al., 2019b) was used for the analyses due to its robustness for the small number of rain events per year recorded in the area (Miniussi and Marani, 2020).
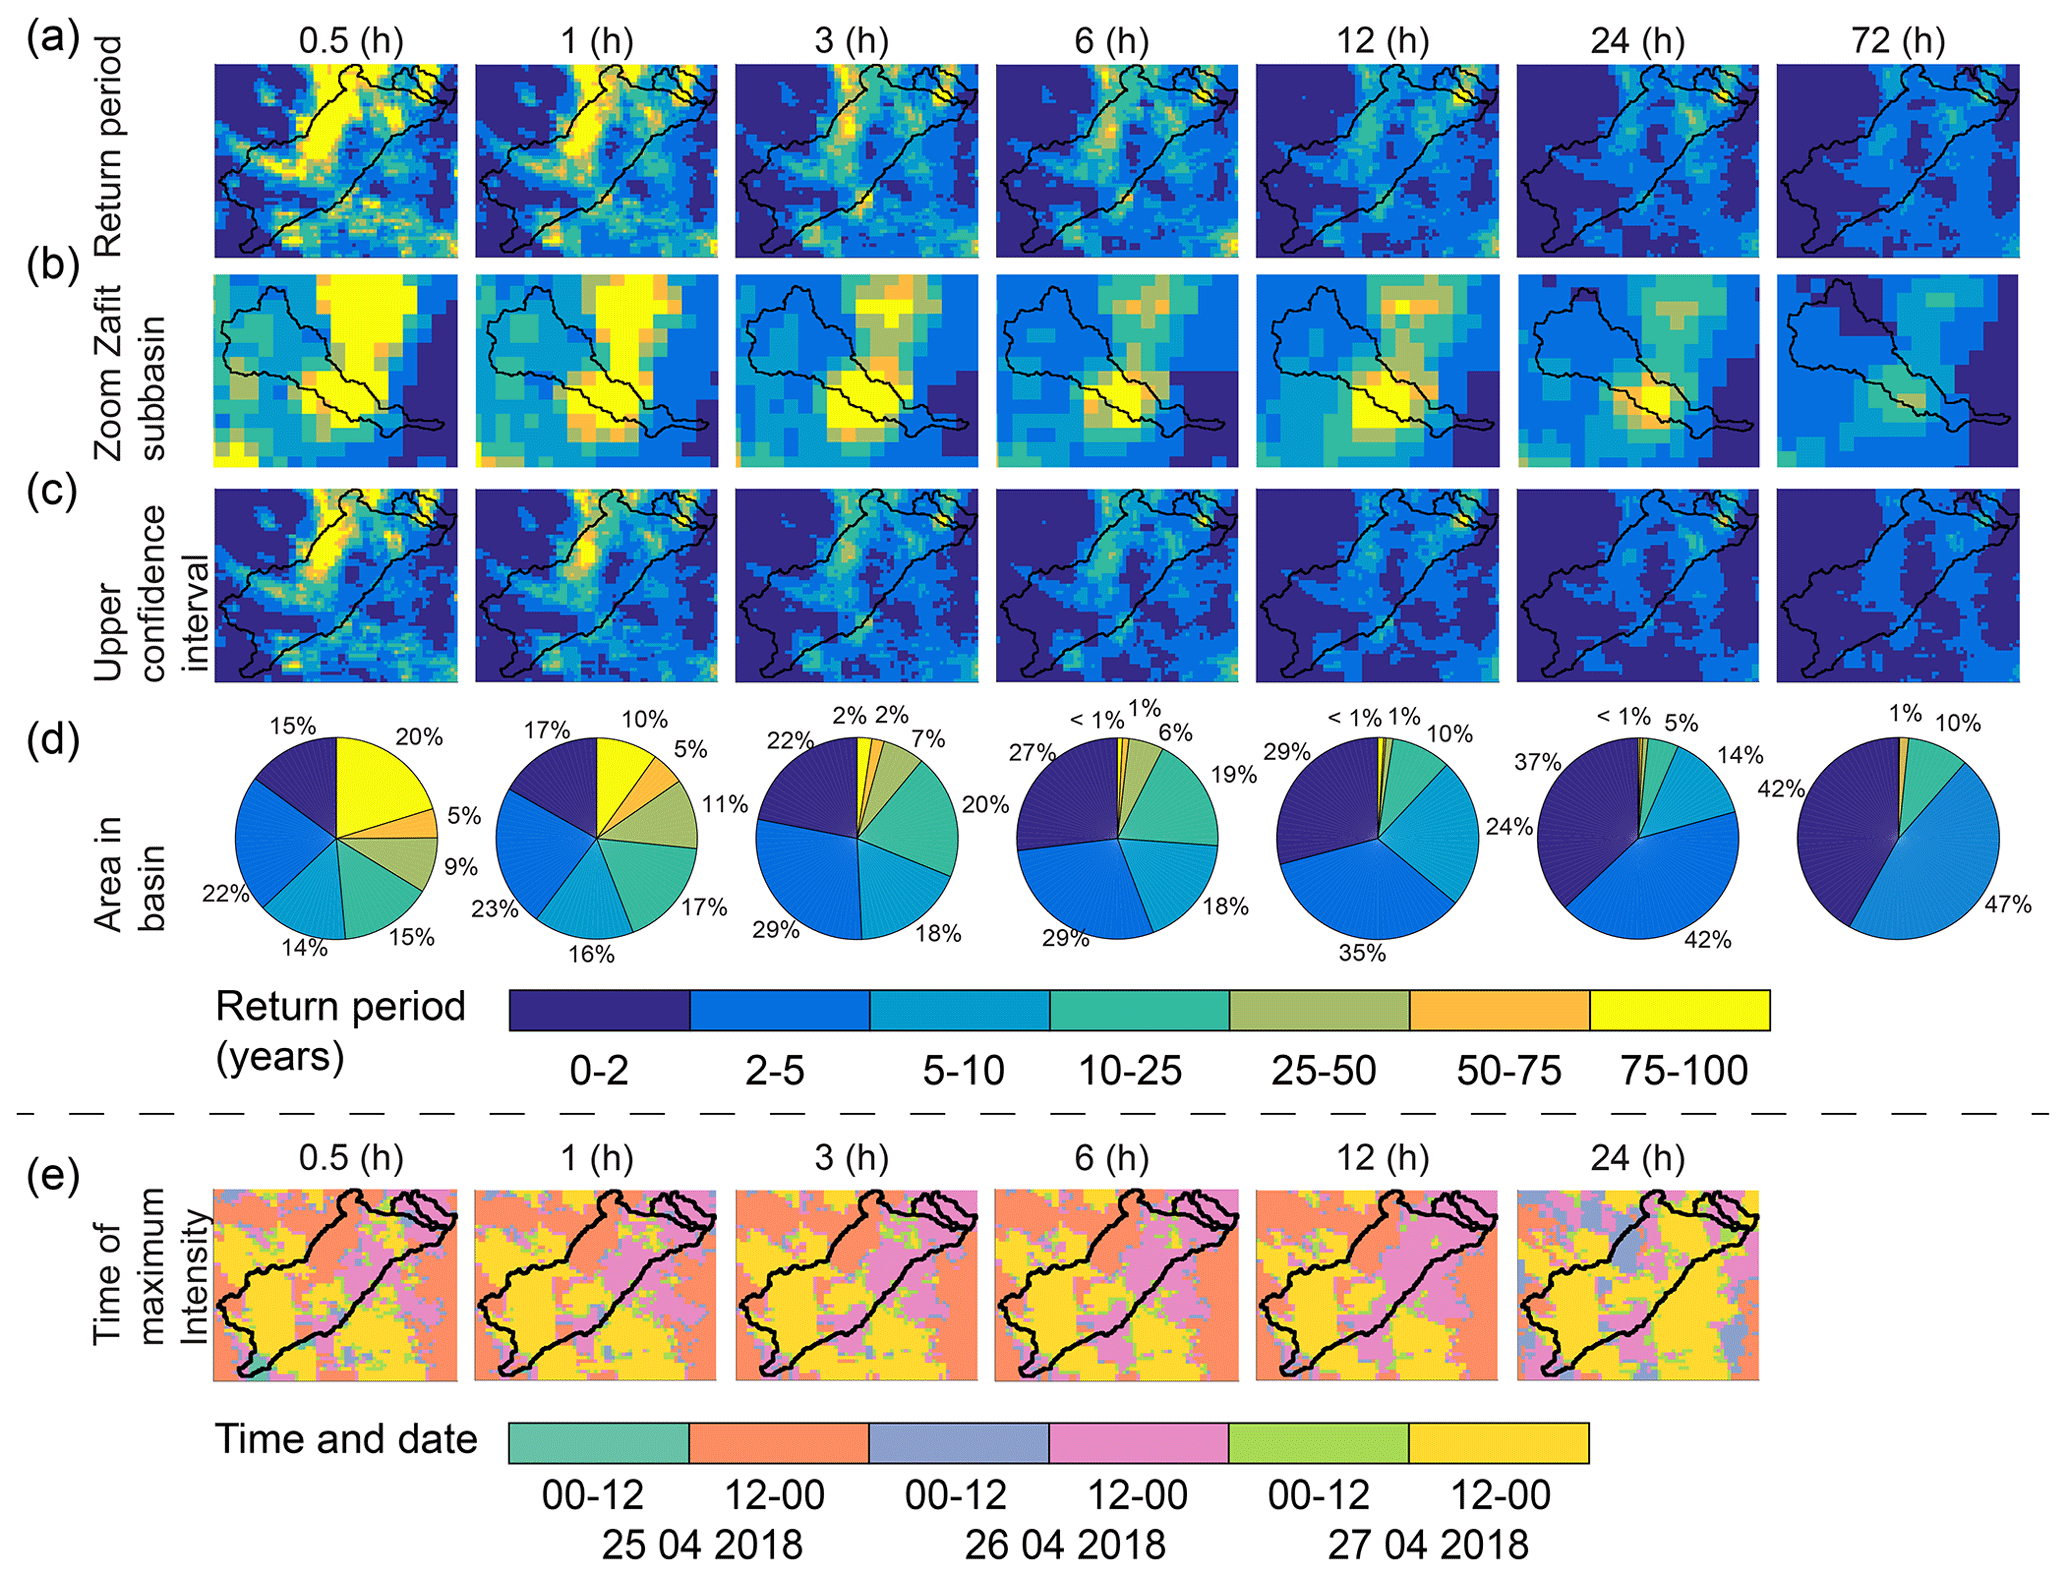
Figure 3(a) Spatial return period maps for the studied storm. (b) Same as panel (a), zoomed in to the Zafit subbasin. (c) Upper confidence interval (95 %) for the spatial return period maps. (d) Distribution of return periods in the Zin basin. (e) Timing of the maximal rainfall intensities which was used to produce panels (a)–(d). All properties are presented for durations of 0.5–72 h. Zin basin and Zafit subbasin are outlined in black.
Maximum precipitation intensities observed during the storm for durations of 0.5, 1, 3, 6, 12, 24, and 72 h were derived for each radar pixel of the IMS radar, and spatial return period maps obtained by comparing these intensities to the above-described frequency curves based on the long radar archive are presented in Fig. 3a and b. Such return periods are to be interpreted as local, meaning that they represent the probability of exceeding the observed intensities in each pixel independently, and the gained output therefore offers a comprehensive spatial picture. Uncertainty related to the available data record was quantified via bootstrapping with replacements (250 repetitions) among the years in the record (Overeem et al., 2008). We prudently estimate the return period of the observed amounts by relying on the 95th quantile of the bootstrap, meaning that the return period we communicate was exceeded with 95 % probability. The spatial distribution of each return period in the Zin basin (Fig. 3d) and the timing of maximal intensity (Fig. 3e) were evaluated.
The spatial return period maps indicated two main areas characterized by extreme (75–100 years and 95 % uncertainty range of 25–100 years) short-duration (0.5–1 h) intensities; one in the north-central part of the Zin basin and the other in the central part of the Zafit subbasin (Fig. 3a, b). Conversely, only the central part of the Zafit subbasin (Fig. 1b) experienced rainfall with long return periods for all durations (75–100 years for durations of 3–24 h and 10–25 years for durations of 72 h). One should consider that rain intensities over short durations might be biased due to the interpretation of hail as intense rainfall, whereas, due to the temporal scale of convective cells, this problem should be negligible for longer durations (>3 h).
This application revealed the high spatiotemporal heterogeneity of the rain intensities during the storm, clearly showing that using a single value for the entire region would lead to an incomplete, if not erroneous, interpretation. Even when observing the short durations (0.5–1 h), only 10 %–20 % of the Zin basin experienced long return period intensities, while ∼40 % of the basin was characterized by return periods of 0–5 years (Fig. 3d). Rain-intensity timing maps (Fig. 3e) revealed that the high rain intensities in the northern part of the Zin basin and in the Zafit subbasin occurred on different days: 25 and 26 April (12:00–24:00), respectively.
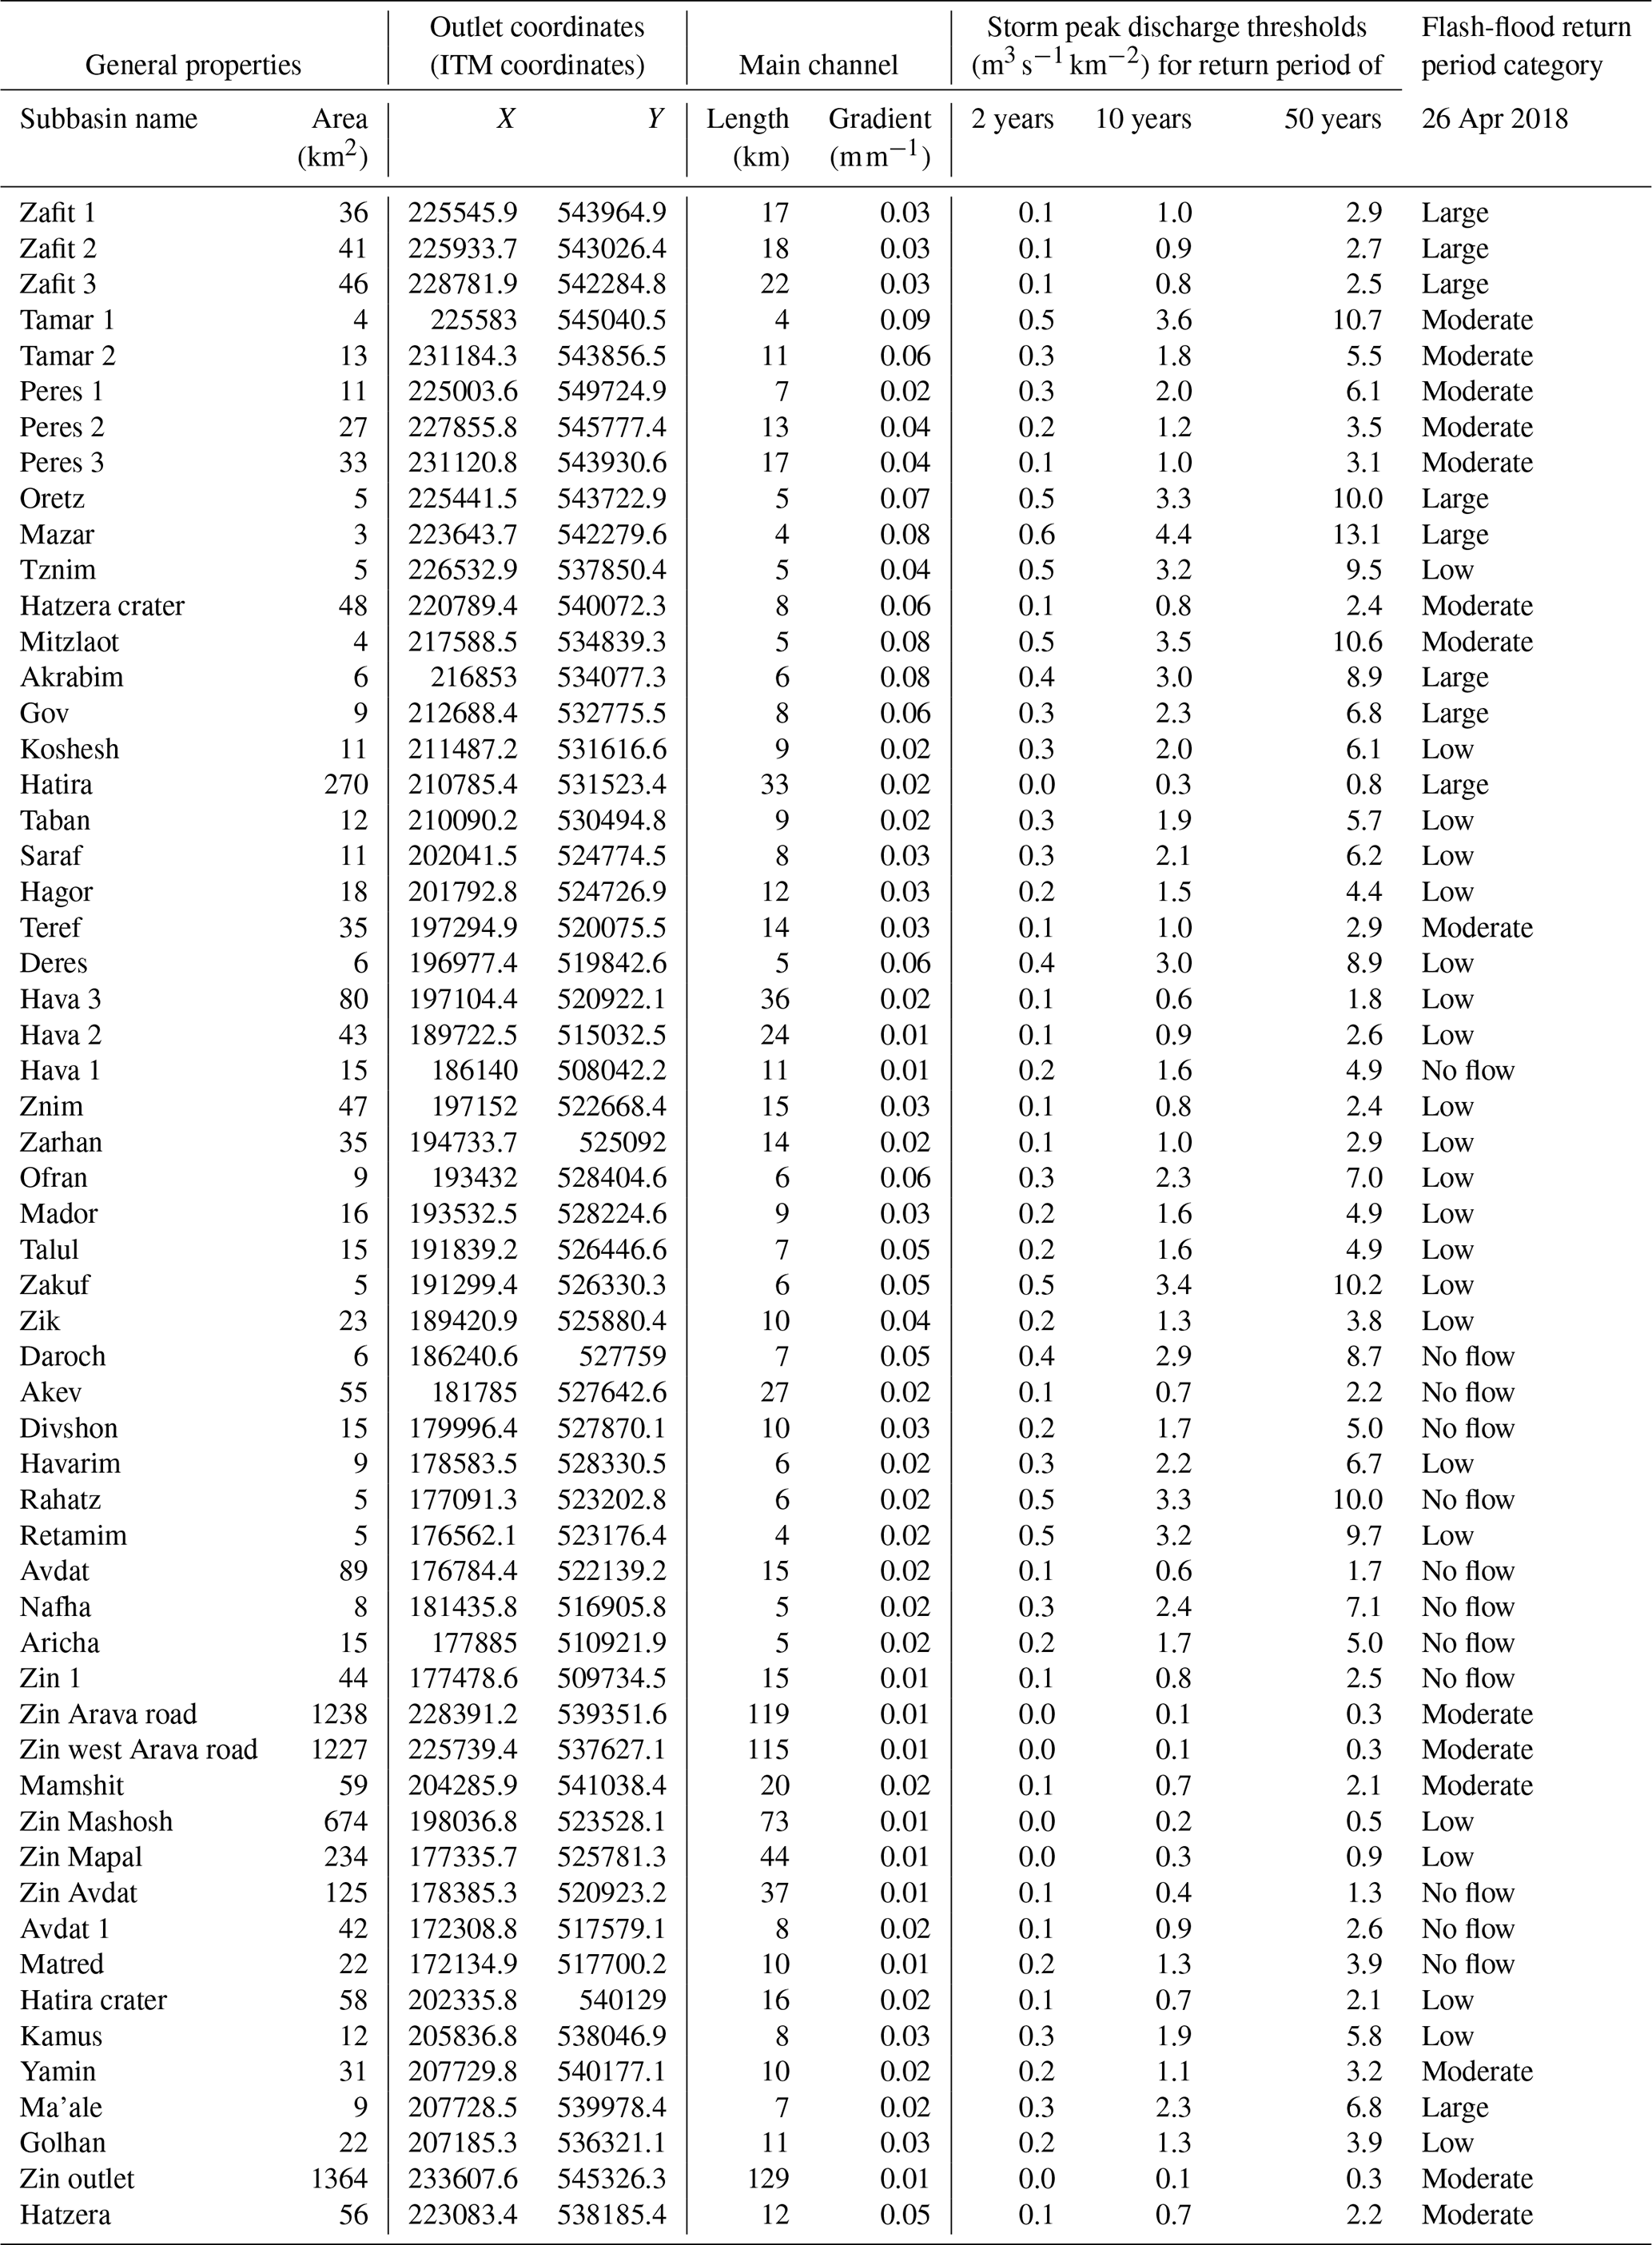
Table 2Zin subbasin properties, peak discharge for return periods using generalized extreme value (GEV) fit, and the estimated flash-flood return period category based on the modeled peak discharge of 26 April. ITM signifies Israeli Transverse Mercator.
4.1 The GB-HYDRA hydrological model application
GB-HYDRA is a high-resolution distributed hydrological model designed to study flash-flood dynamics in medium to small Mediterranean basins (Rinat et al., 2018). For the present study, additional components were included in the model to allow for the description of the arid environment (Fig. 4; Appendix A). The modified model was used at high spatiotemporal resolution (50×50 m2; <60 s) to study the hydrological responses of 57 subbasins (Table 2). Thus, propagation of various hydrological properties can be monitored, including the identification of specific runoff-generating areas that directly contribute to stream discharge (referred to hereafter as runoff-contributing area, RCA; see Rinat et al., 2018, for further details). Calibration results (see Appendix A for further details) pointed to adequate model performance and its use for this specific study (R2=0.94; RMSD =0.65 ; bias =0.35 ; Fig. 5; Table 1).
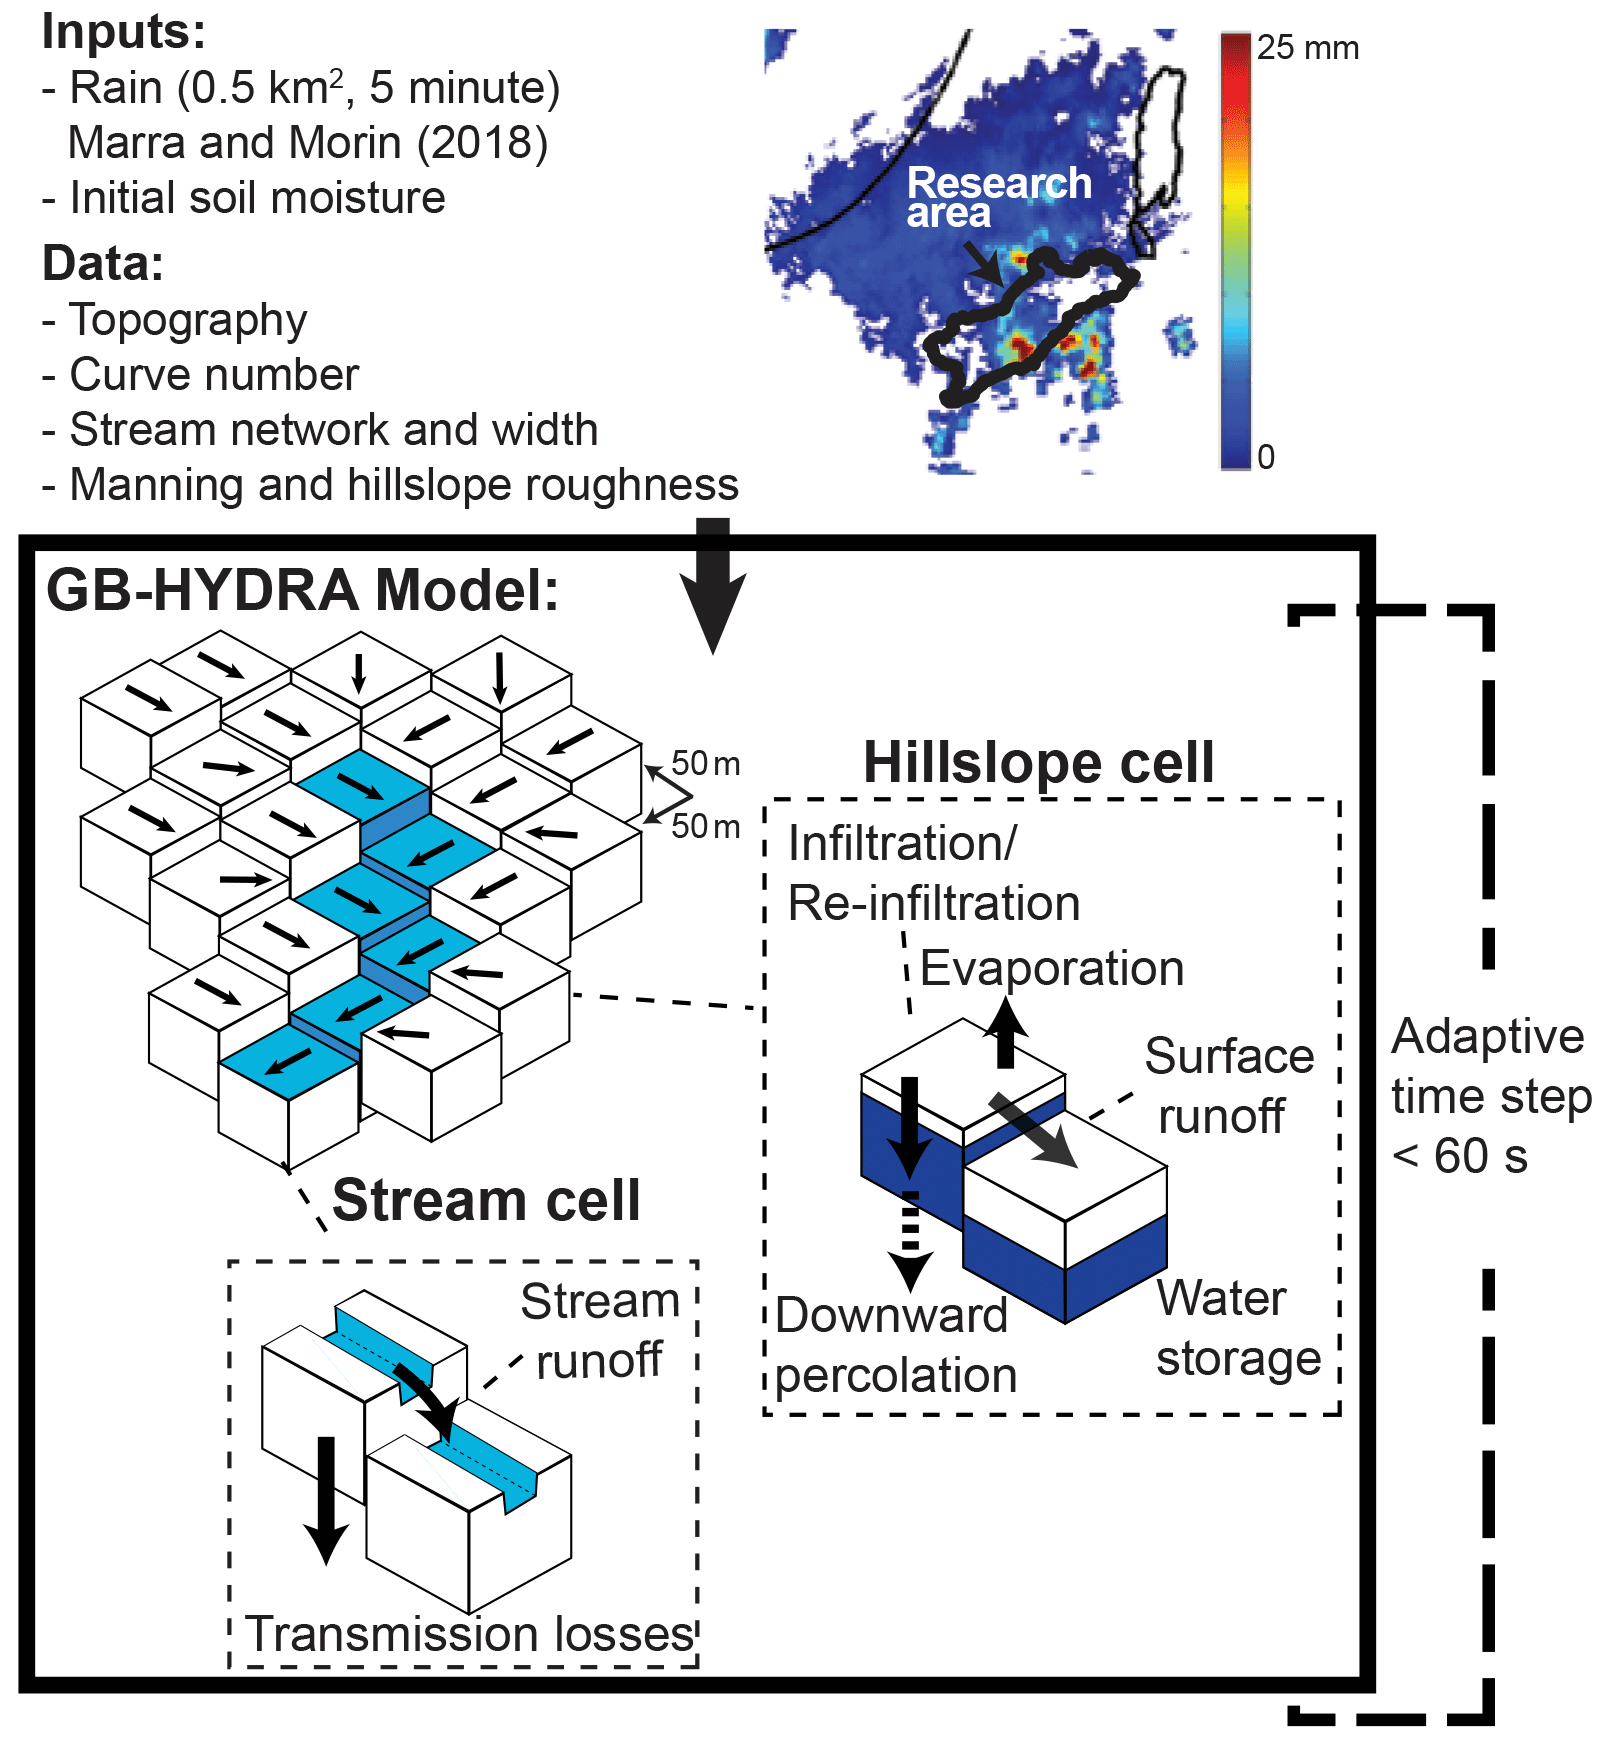
Figure 4The modified GB-HYDRA model scheme, processes, and inputs. Further details are given in Appendix A and in Rinat et al. (2018).
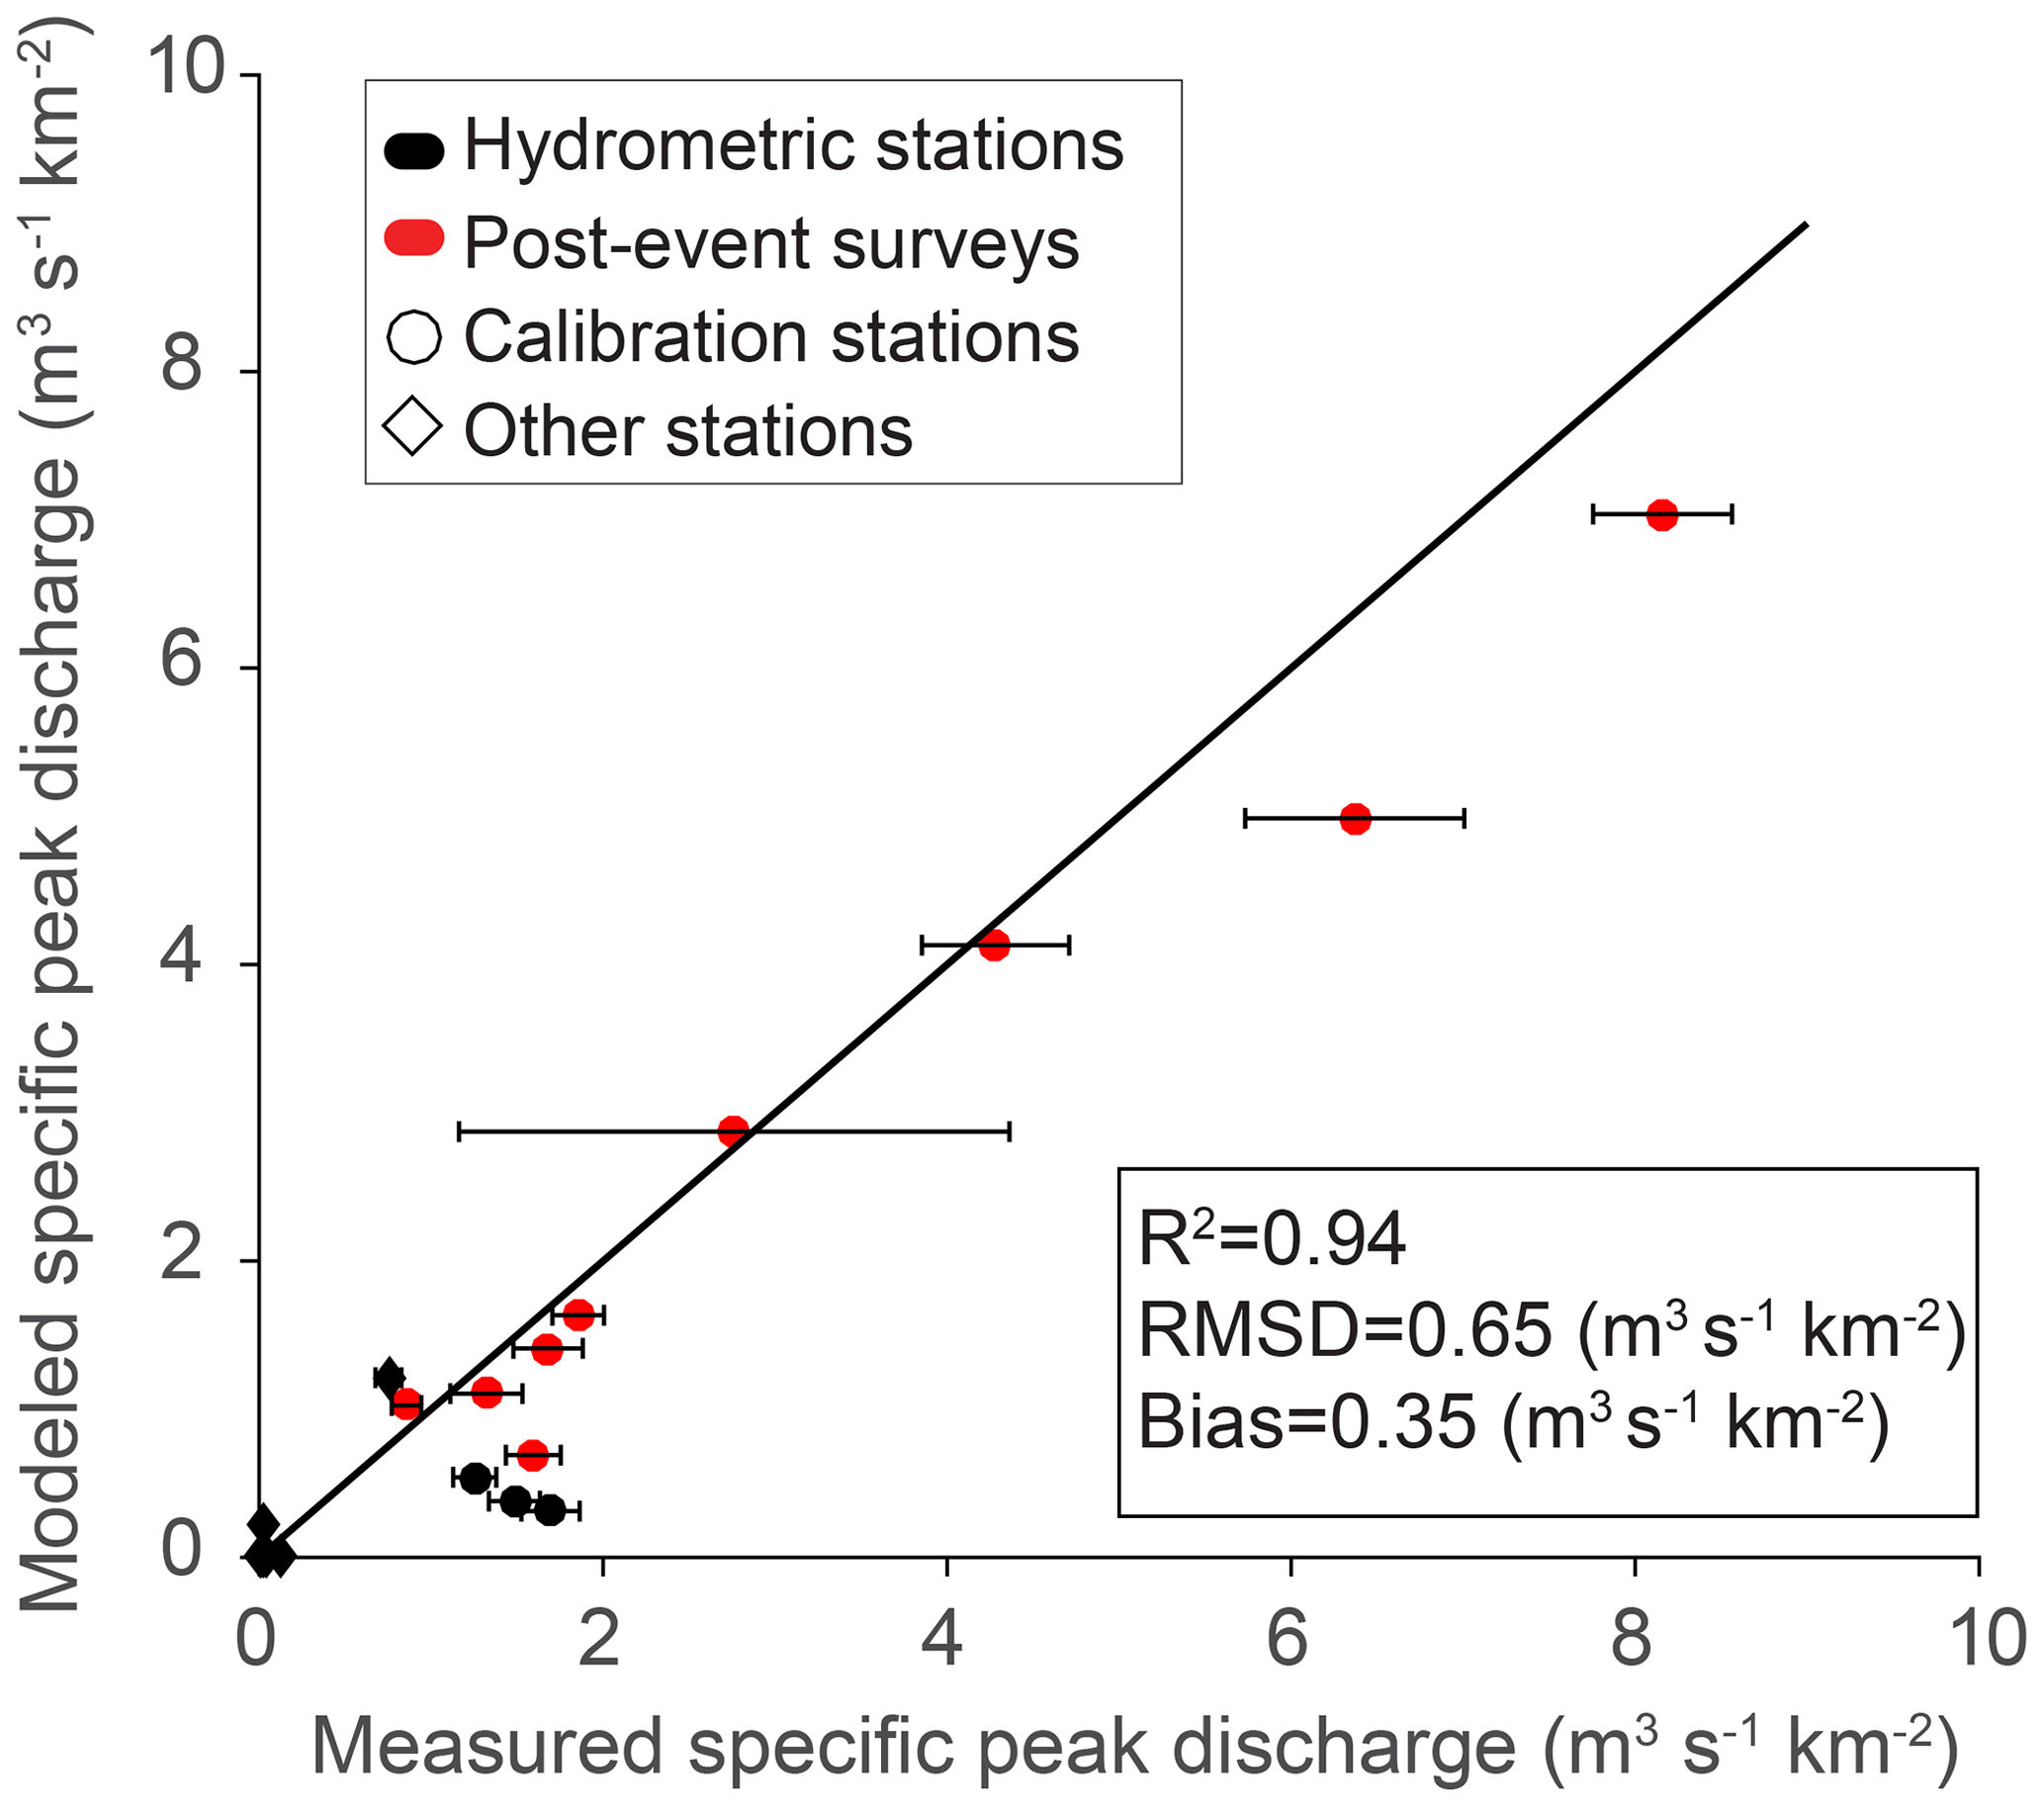
Figure 5Measured vs. modeled specific peak discharge and error metrics for 12 peak discharges during the 3 d period of the storm. Horizontal error bars represent measured peak discharge uncertainty. Subbasins considered in the calibration process are from the eastern side of the catchment (Fig. 1).
4.1.1 Using direct observations for spatial model validation and flash-flood initiation
A unique field observation from the second storm day (26 April) provided a full description of runoff initiation in this arid environment, allowing us to obtain a spatial validation of the model. Two scientists from the Hebrew University of Jerusalem who were, coincidentally, in the Zafit subbasin during the storm (“observation point” in Fig. 6b) fully documented and timed the processes of rainfall, hillslope runoff, and stream-discharge initiation. Their location and timing concurred with the radar-observed extreme rainfall intensities (see Sect. 3.2 for further details). Model simulations were validated against the observations, providing support for their validity. Agreement was found between field observations, weather radar estimates, and model results for the timing of rainfall, RCA, and stream-runoff generation (Fig. 6; Table 3; Video supplement).
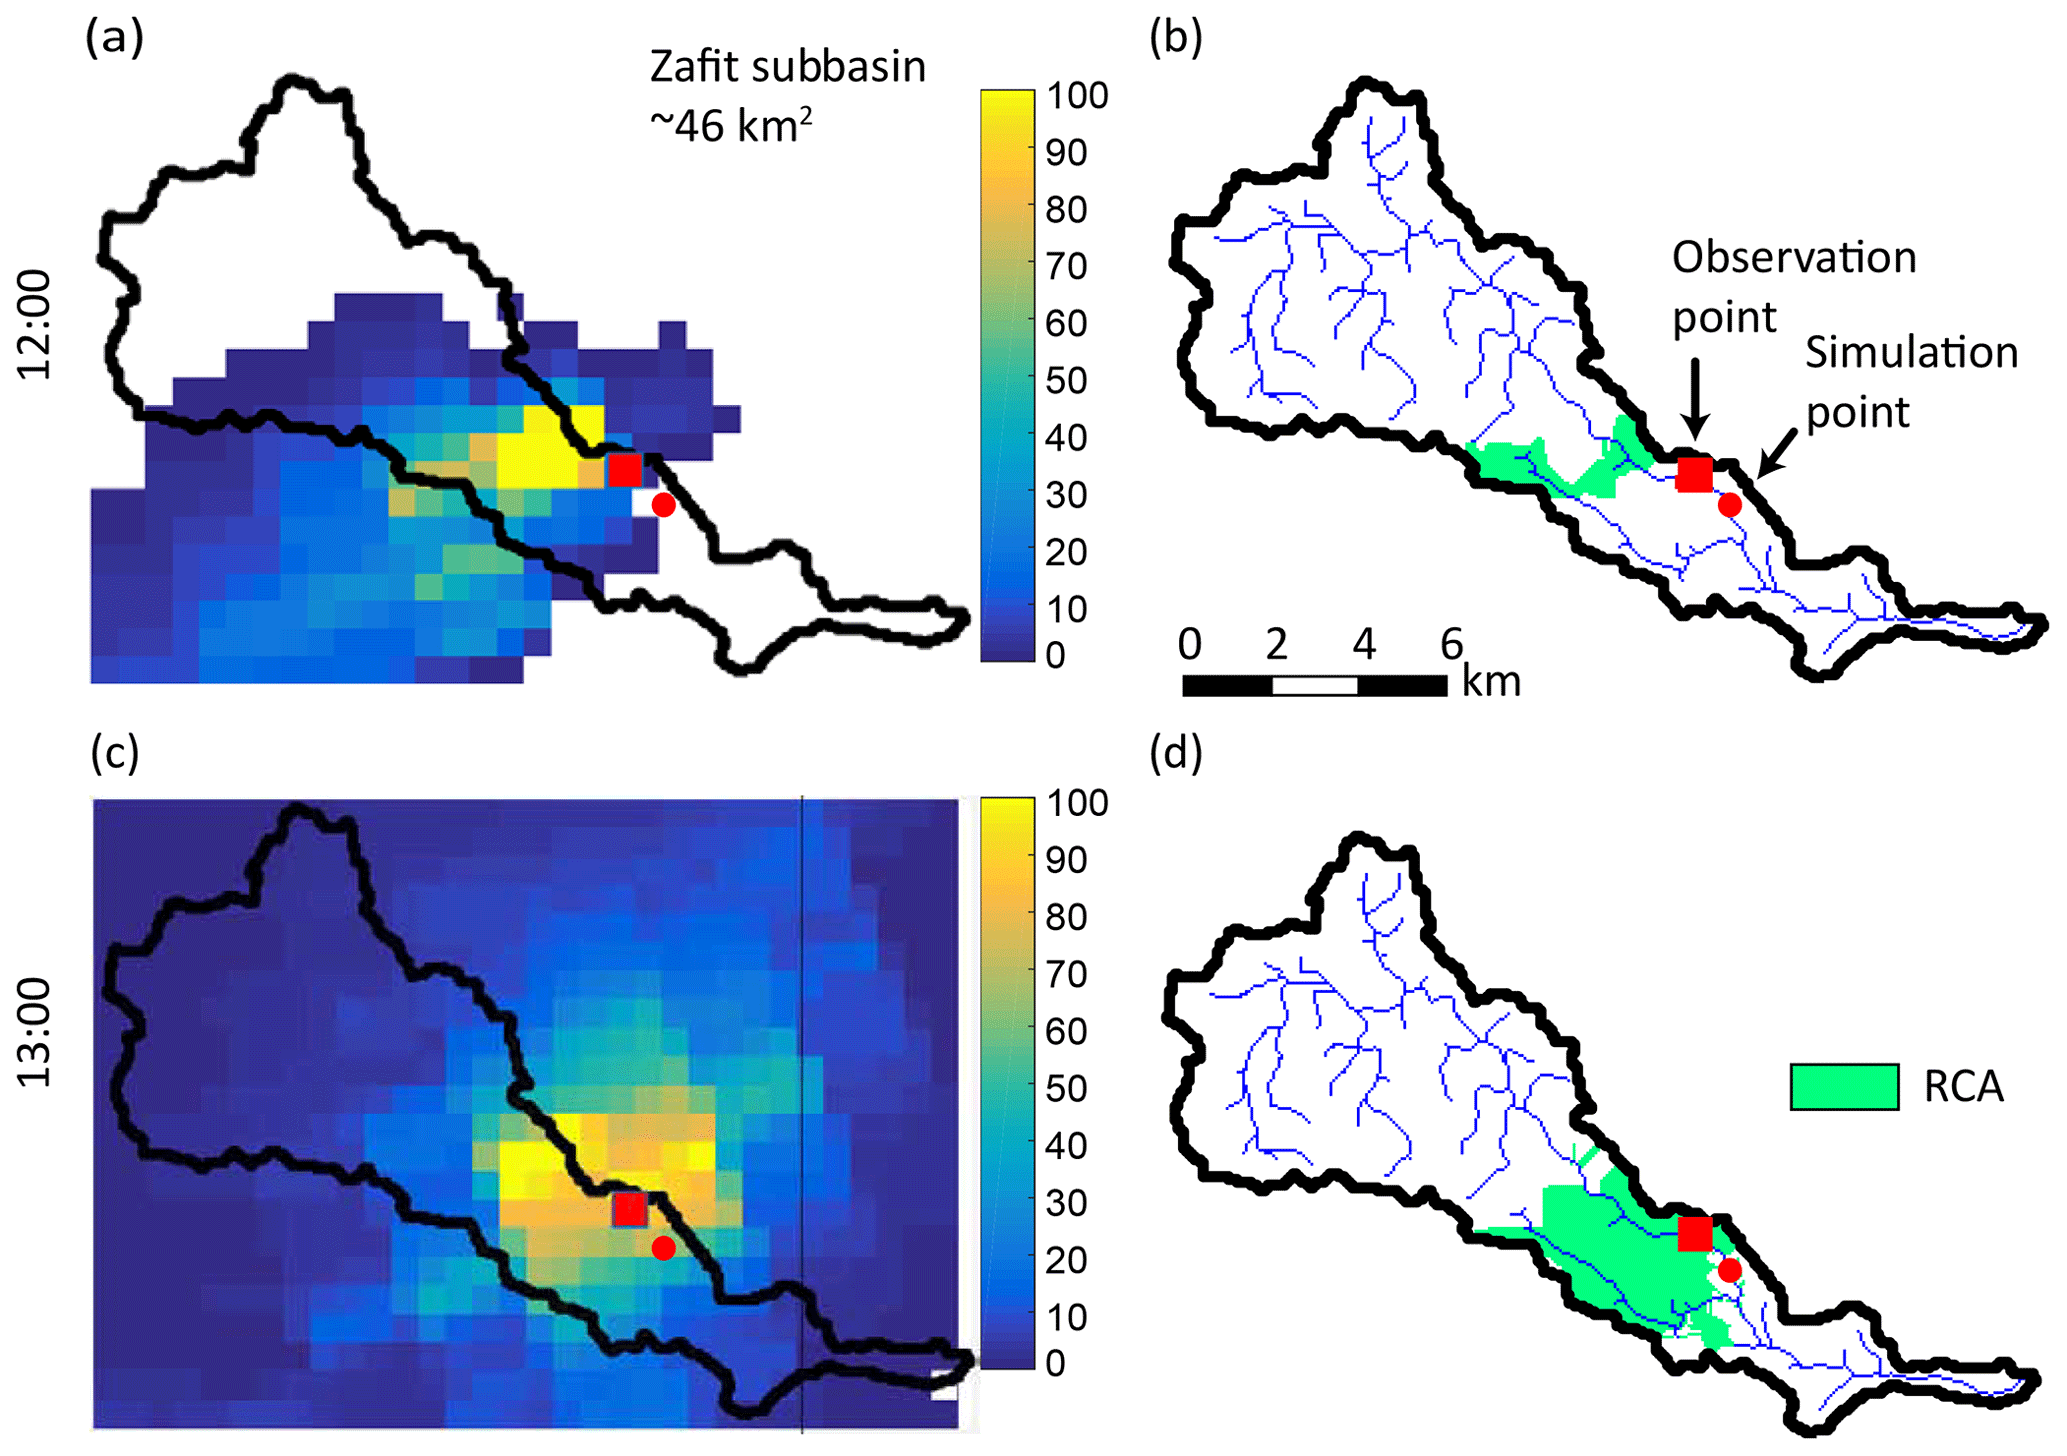
Figure 6(a, c) 10 min rainfall maps and (b, d) RCA extent for the Zafit subbasin at 12:00 and 13:00 (on 26 April). Red rectangles represent the observation points and red circles the simulation points for the spatial validation (Table 3), lag-time calculations, and Video.
Table 3Field observations and model simulation results for the 26 April flash flood in Zafit subbasin.

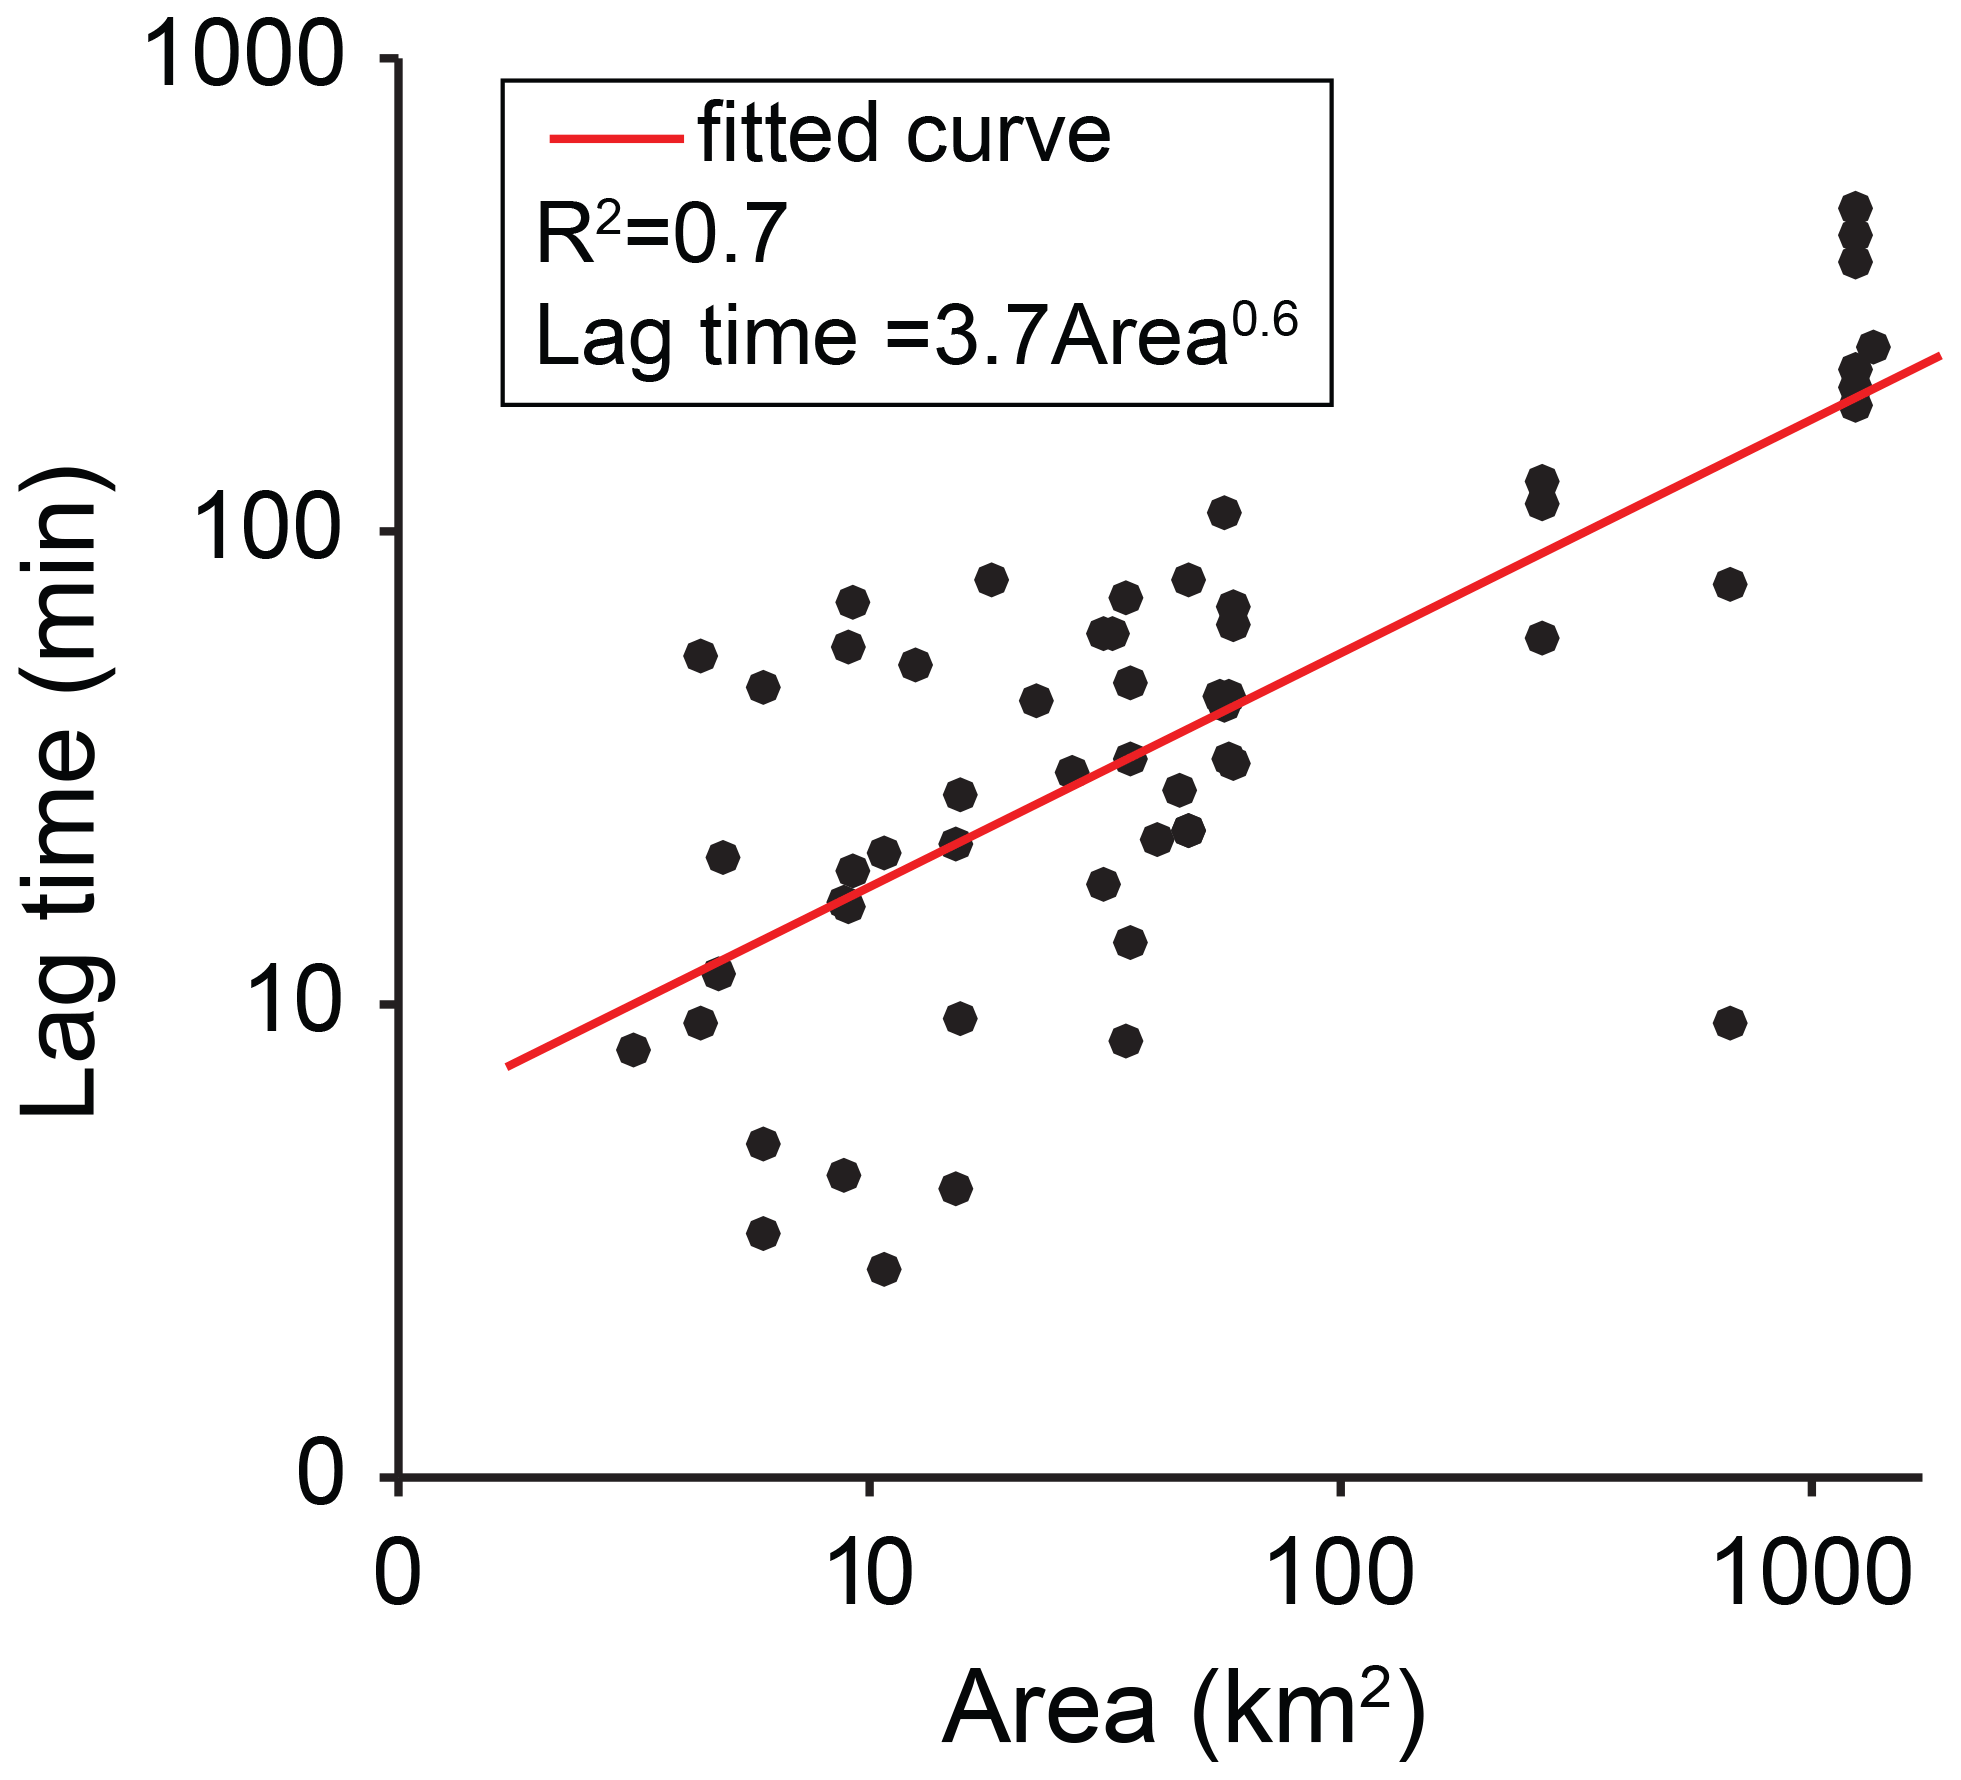
4.2 Lag time
Basin lag time represents a simple, yet effective, way to estimate the basin hydrological response time. Excess rainfall was defined here as the difference between rain amounts and initial abstractions (following Marchi et al., 2010), and rainfall separated by a hiatus greater than 1 h was not taken into account. A positive correlation between calculated lag time and basin area for each of the 3 d and for all subbasins with peak discharge >5 m3 s−1 suggested that most of the calculated lag-time values were on the order of tens of minutes (Fig. 7). Finally, the calculated lag times for the Zafit flash flood on 26 April was 22 and 28 min for the simulation point and subbasin outlet, respectively (Fig. 6). This short time emphasizes the difficulty in taking action after the rainfall starts and the importance of an early warning.
4.3 Return periods of flash floods and their classification
Most subbasins in the Zin catchment are not monitored, and therefore determining their flood return periods is not a trivial task (Haan, 2002). To overcome this, regional relations between specific peak discharges and basin areas were calculated to define categories of return periods. First, five categories of flash-flood return periods were determined: extreme (>50 years), large (10–50 years), moderate (2–10 years), low (<2 years), or no flow. Second, flood return period curves were built using generalized extreme value (GEV) analysis (applying the probability weighted moments method; Hosking et al., 1985) and annual series of measured specific peak discharges for 18 hydrometric stations in the region (21–59 years, draining 60–3350 km2, depending on the basin; data from four of these are shown in Fig. 8a; all stations are in arid environments). Third, the specific peak-discharge thresholds of the different categories (i.e., 2, 10, and 50 years) were computed for each station using the GEV curves (points in Fig. 8b). Fourth, a fit was applied to the calculated thresholds of each category (not shown). Fifth, final categories were determined by using percentiles of the eastern Mediterranean envelope curve (Tarolli et al., 2012) that match the fitted curves and the return periods detailed in stage 1 (schematic colored areas in Fig. 8b).
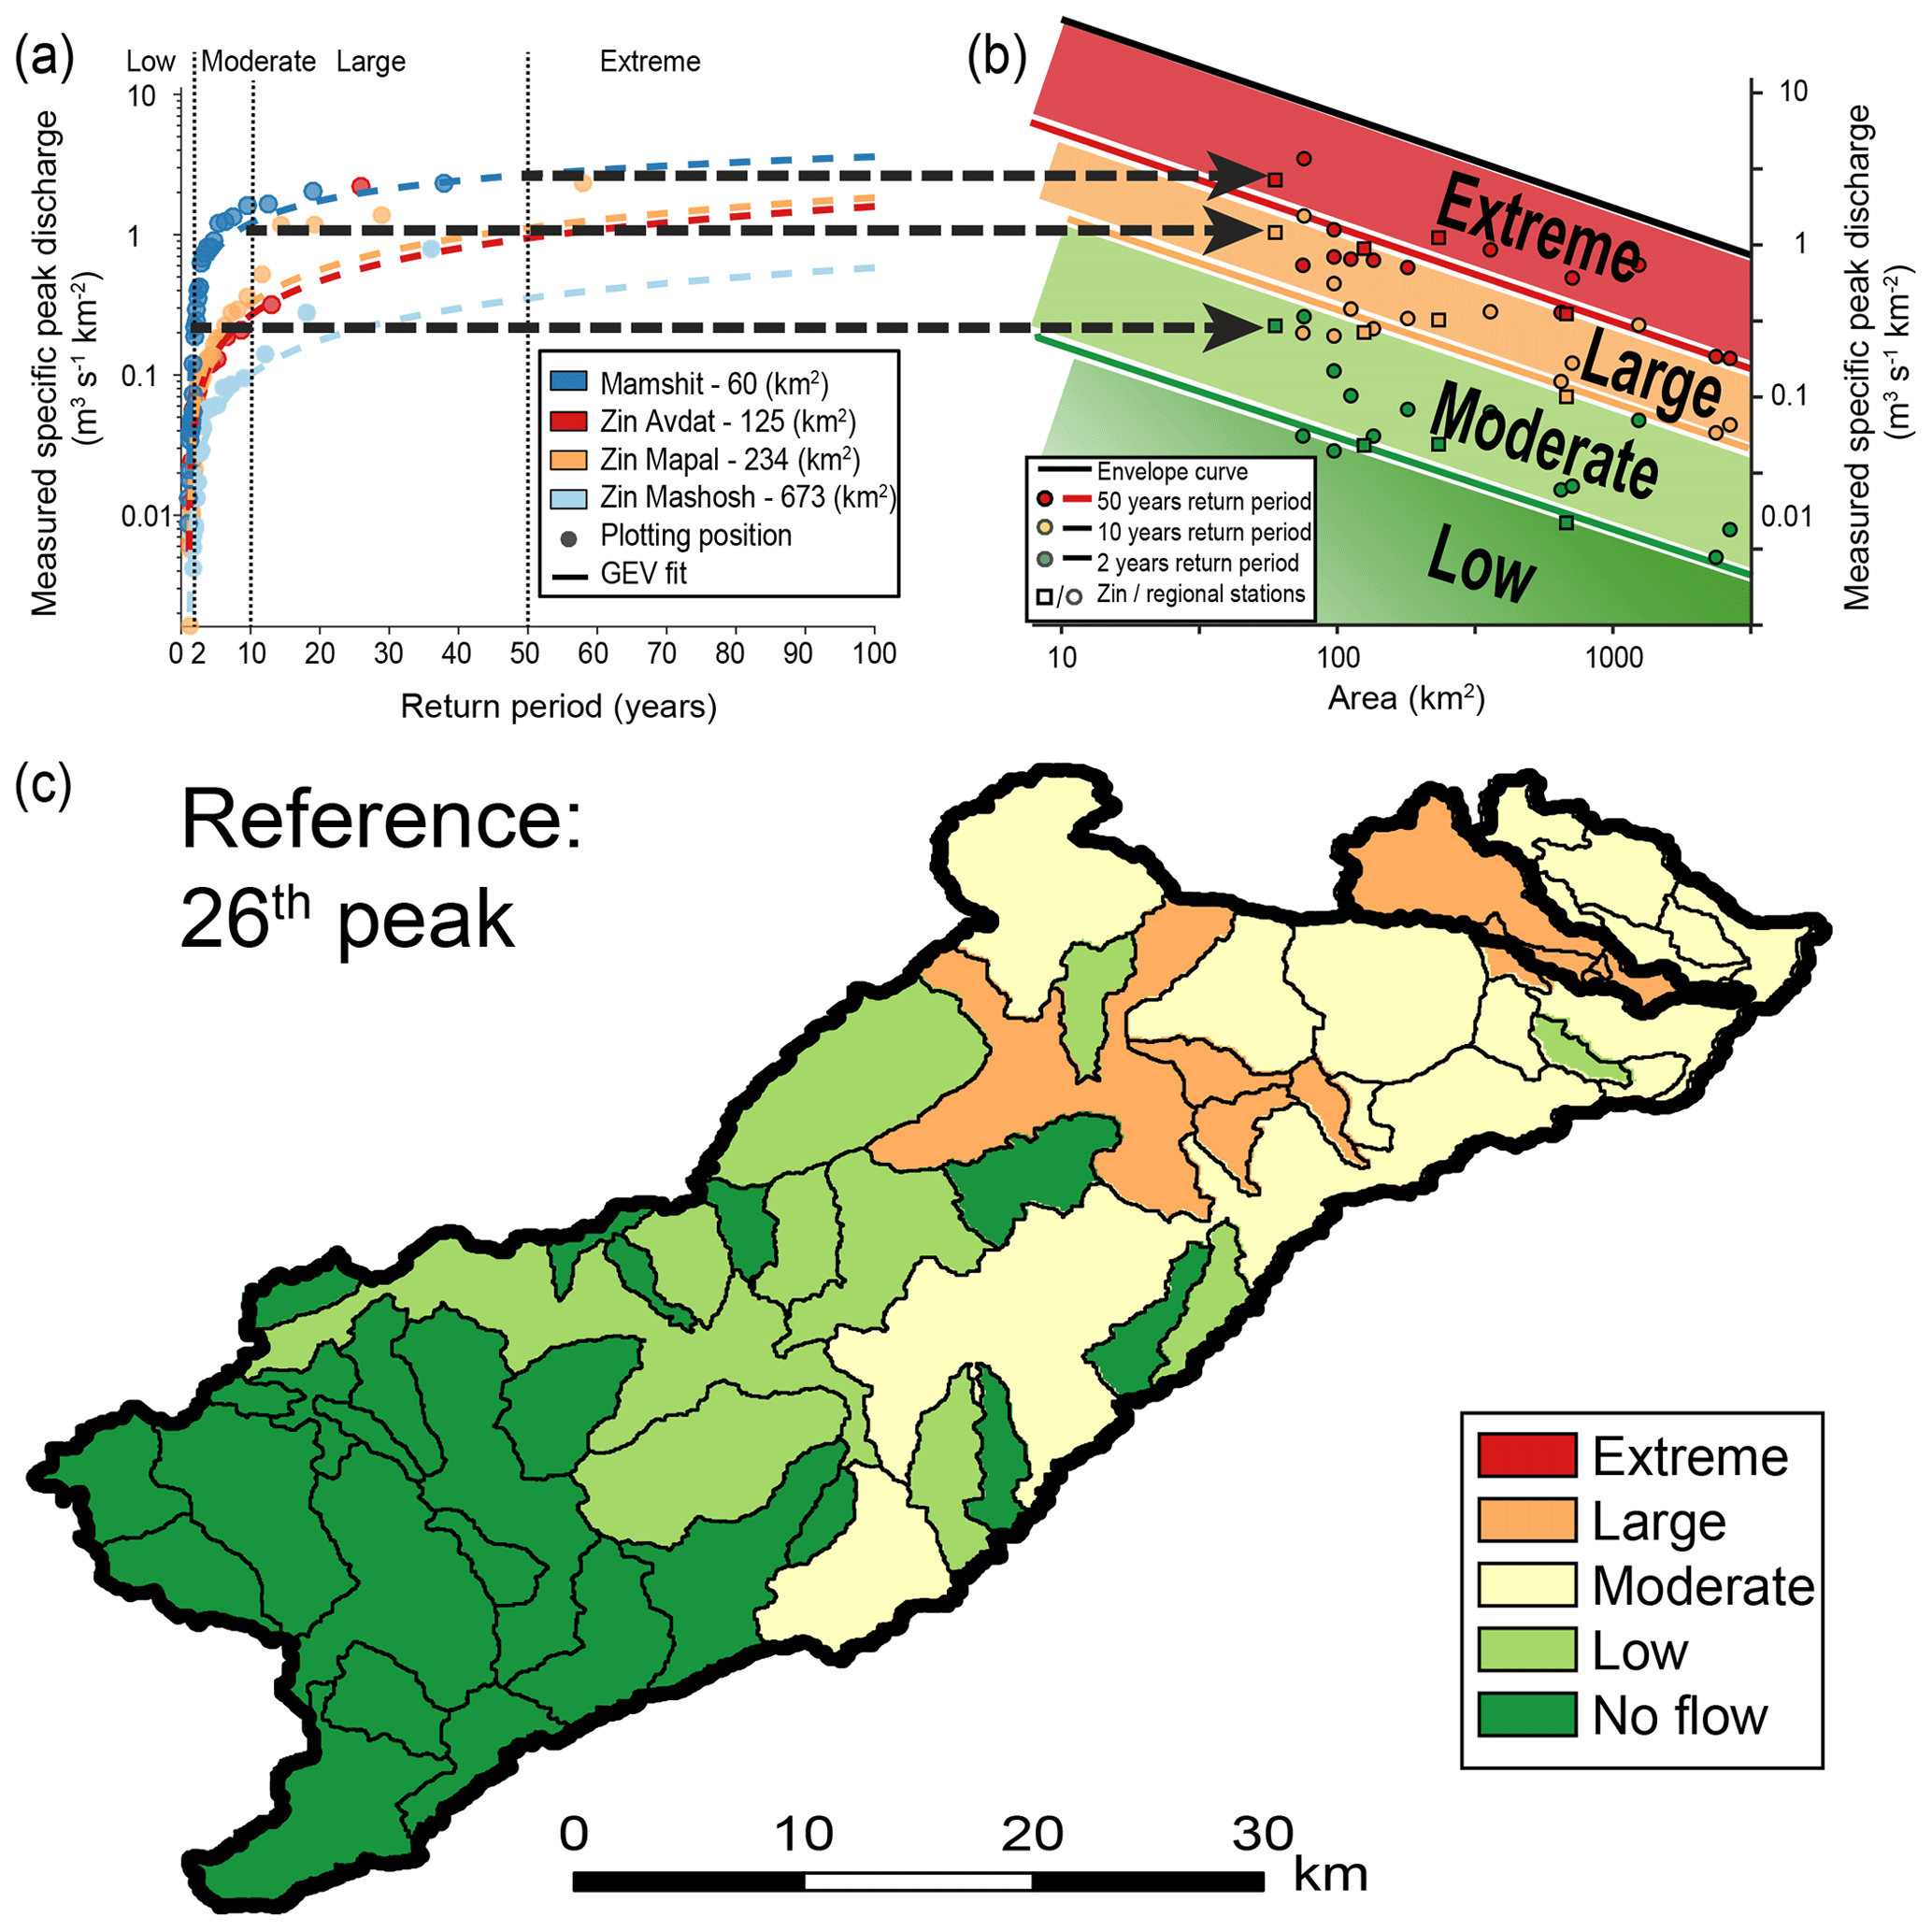
Figure 8Determining flash-flood categories for each subbasin. (a) Thresholds for each return period category were defined by applying GEV analysis on annual series of measured specific peak-discharge values from 18 hydrological stations (only 4 are shown) and projected on an area-specific peak-discharge domain (b). (b) The projected points from all stations and the local envelope curve (Tarolli et al., 2012) were used to define return period categories for each area. (c) the 26 April flash-flood return period categories were calculated for all subbasins (Zafit subbasin is marked by bold outline).
Using this analysis, the return period category of the 26 April (06:00–24:00) modeled peak discharge was defined for each subbasin (Fig. 8c; Table 2). While moderate and large flash floods occurred in the eastern part of the Zin basin, no flash floods occurred in its western part
5.1 The COSMO numerical weather prediction model
COSMO (COnsortium for Small‐scale MOdeling) is a non-hydrostatic regional numerical weather prediction (NWP) model used by the IMS for operational forecasting (Baldauf et al., 2011; Doms et al., 2011). The model spatial resolution is ∼2.5 km, which enables explicitly resolving the convective processes. Initial and boundary conditions are obtained from the integrated forecasting system (IFS) model run by the European Centre for Medium-Range Weather Forecasts (ECMWF). Real-time, 10 min, rain-gauge-corrected, 1×1 km2 resolution IMS radar rainfall data are assimilated into the COSMO model to improve its prediction (Stephan et al., 2008).
To assess and study the rainfall forecast's ability to predict such local events, different COSMO forecast runs were used as input for the GB-HYDRA model, and the forecasted 26 April flash-flood category for each subbasin was calculated. The IMS weather radar measurements, available in real time, were fed into the GB-HYDRA hydrological model, and initial conditions were calculated. The resulting calculated flood categories were compared qualitatively and quantitatively to the flash-flood reference categories (Fig. 8c). For each run, the quantitative evaluation critical success index (CSI), false alarm ratio (FAR), probability of detection (POD), and probability of false detection (POFD) were calculated (Sene, 2013; Wilks, 2006). Flash-flood categories of moderate or above were used as the threshold.
5.2 Forecasted peak discharge
Two sets of COSMO rainfall forecast runs produced using different methodologies of real-time radar measurement assimilation are presented in the following.
5.2.1 Operational COSMO runs
Operational COSMO forecast runs were initiated every 12 h and assimilated with rain-gauge-corrected radar data for the first 5 h, followed by a free run without any constraints. Rainfall data from five operational COSMO forecast runs were used (24 April, 09:30; 24 April, 21:30; 25 April, 09:30; 25 April, 21:30; 26 April, 09:30; timings indicate the approximate time of forecast availability; Fig. 9). Forecasted and measured accumulated rainfall fields for 26 April (06:00 to 24:00; Fig. 9) showed similar general patterns even though location and timing might differ.
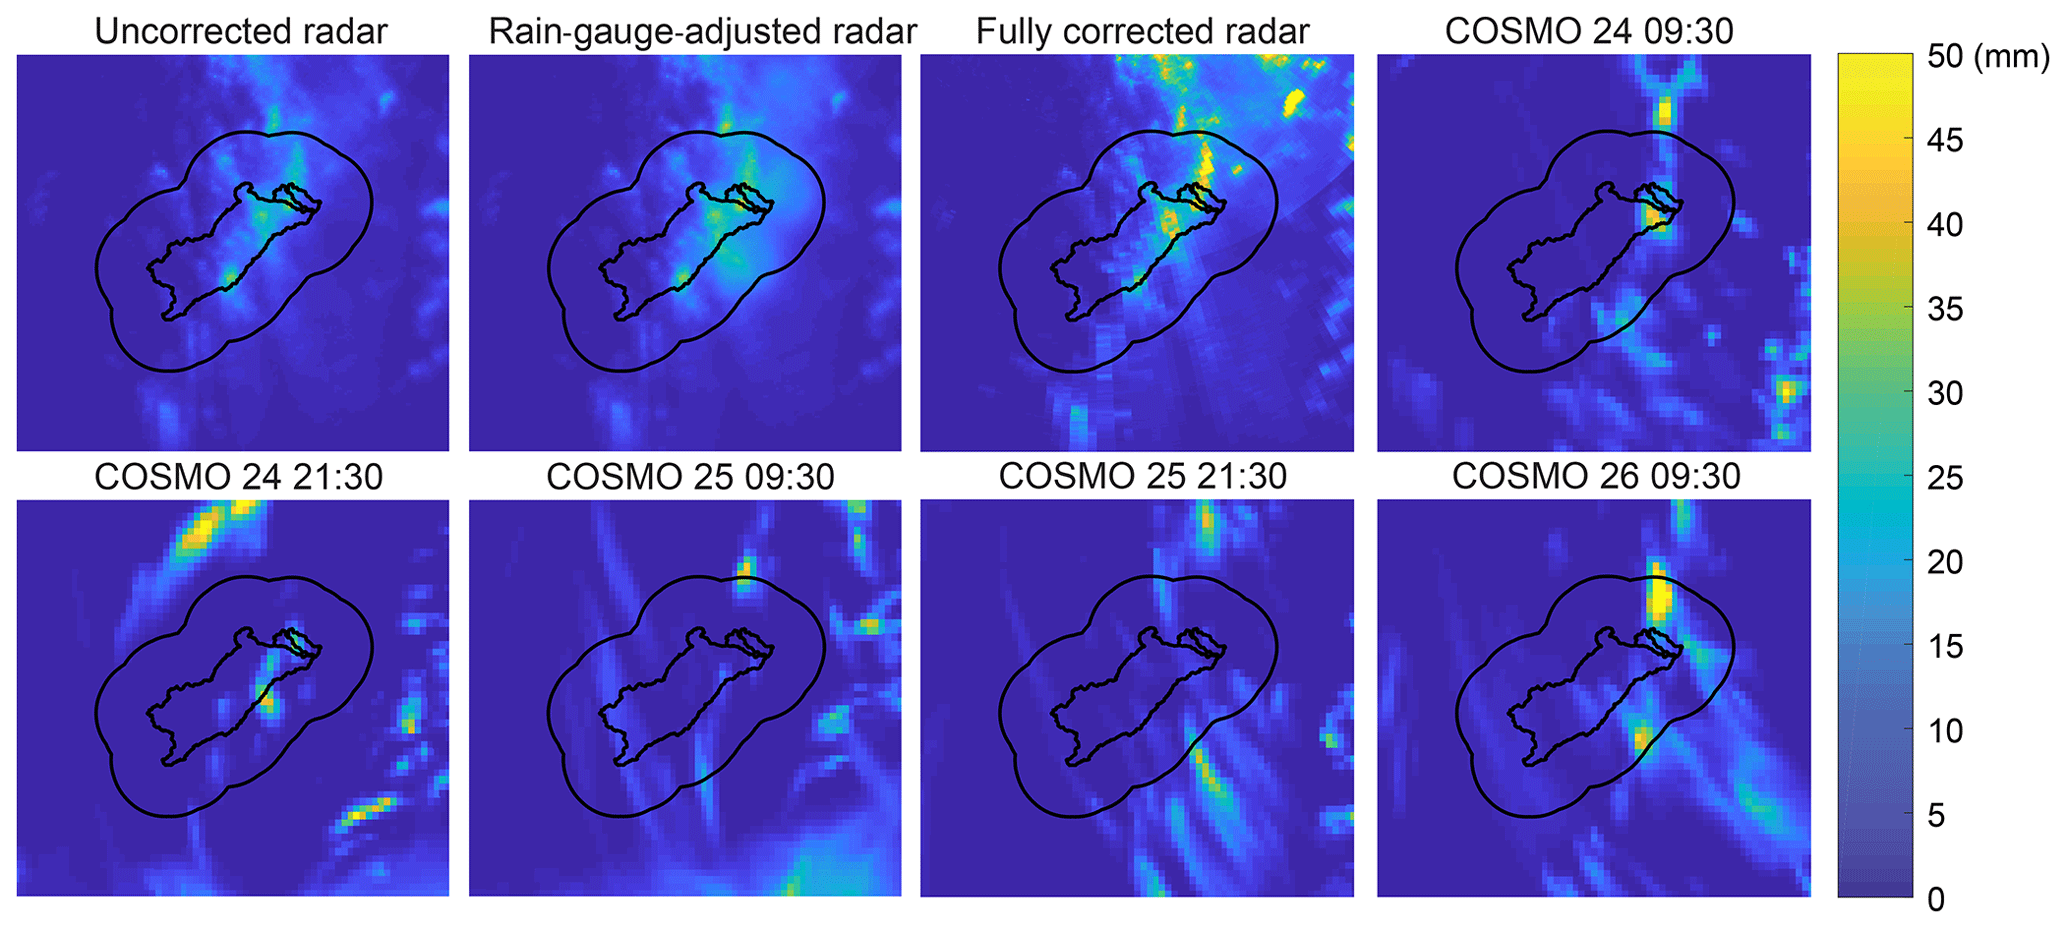
Figure 9Total rain depth for 26 April, 06:00 to 24:00, using different degrees of corrections for the radar data (three upper-left panels) and various COSMO runs (COSMO titles refers to the timing of forecast availability). The outlines of the Zin and Zafit basins are depicted, as well as a 20 km buffer zone around the Zin basin.
Forecasted flash-flood categories calculated for all subbasins based on applying the different rain forecasts to the GB-HYDRA model are shown in Fig. 10. When qualitatively evaluated, all scenarios were found to differ from the reference categories (Fig. 8c). CSI values were poor for all model runs (< 0.25); moreover, in the first two scenarios when the index was relatively high, the FAR index was high as well. It appears that either the forecast does not result in flash-flood occurrence (25 April, 09:30; 26 April, 09:30; Fig. 10) or flash floods are predicted in the wrong locations (24 April, 09:30; 24 April, 21:30; 25 April, 21:30; Fig. 10). In addition, the forecast skill did not improve with decreasing lead times.

Figure 10Flash-flood return period categories, CSI, and FAR calculated using different COSMO forecast runs from the days preceding the 26 April flash flood. Headers state the time of forecast availability.
5.2.2 Ensemble of radar-assimilation scenarios
The benefit of continuous radar assimilation into the COSMO weather prediction model was tested for the two runs of 25 April at 21:30 and 26 April at 09:30. Thus, instead of applying radar assimilation for only the first 5 h, the COSMO model was rerun at hourly intervals, exploiting new radar data.
All runs were used as input for the GB-HYDRA model and the flood category in each subbasin was calculated. No consistent improvement was found in either case with reduced lead time (Fig. 11). Forecasted flash-flood categories seemed to be random in both space and time. In fact, even the flood categories computed from COSMO rainfall for the hour in which the flash flood occurred at each subbasin did not resemble the reference categories (Fig. 8c and right columns in Fig. 11). The forecast evaluation metrics showed poor results in all cases with CSI values lower than 0.3 and high FAR values. For example, the flash floods in the Zafit subbasins (Oretz, Mazar, and Zafit 1–3; Table 2, Fig. 11) were not predicted by most of the simulations.
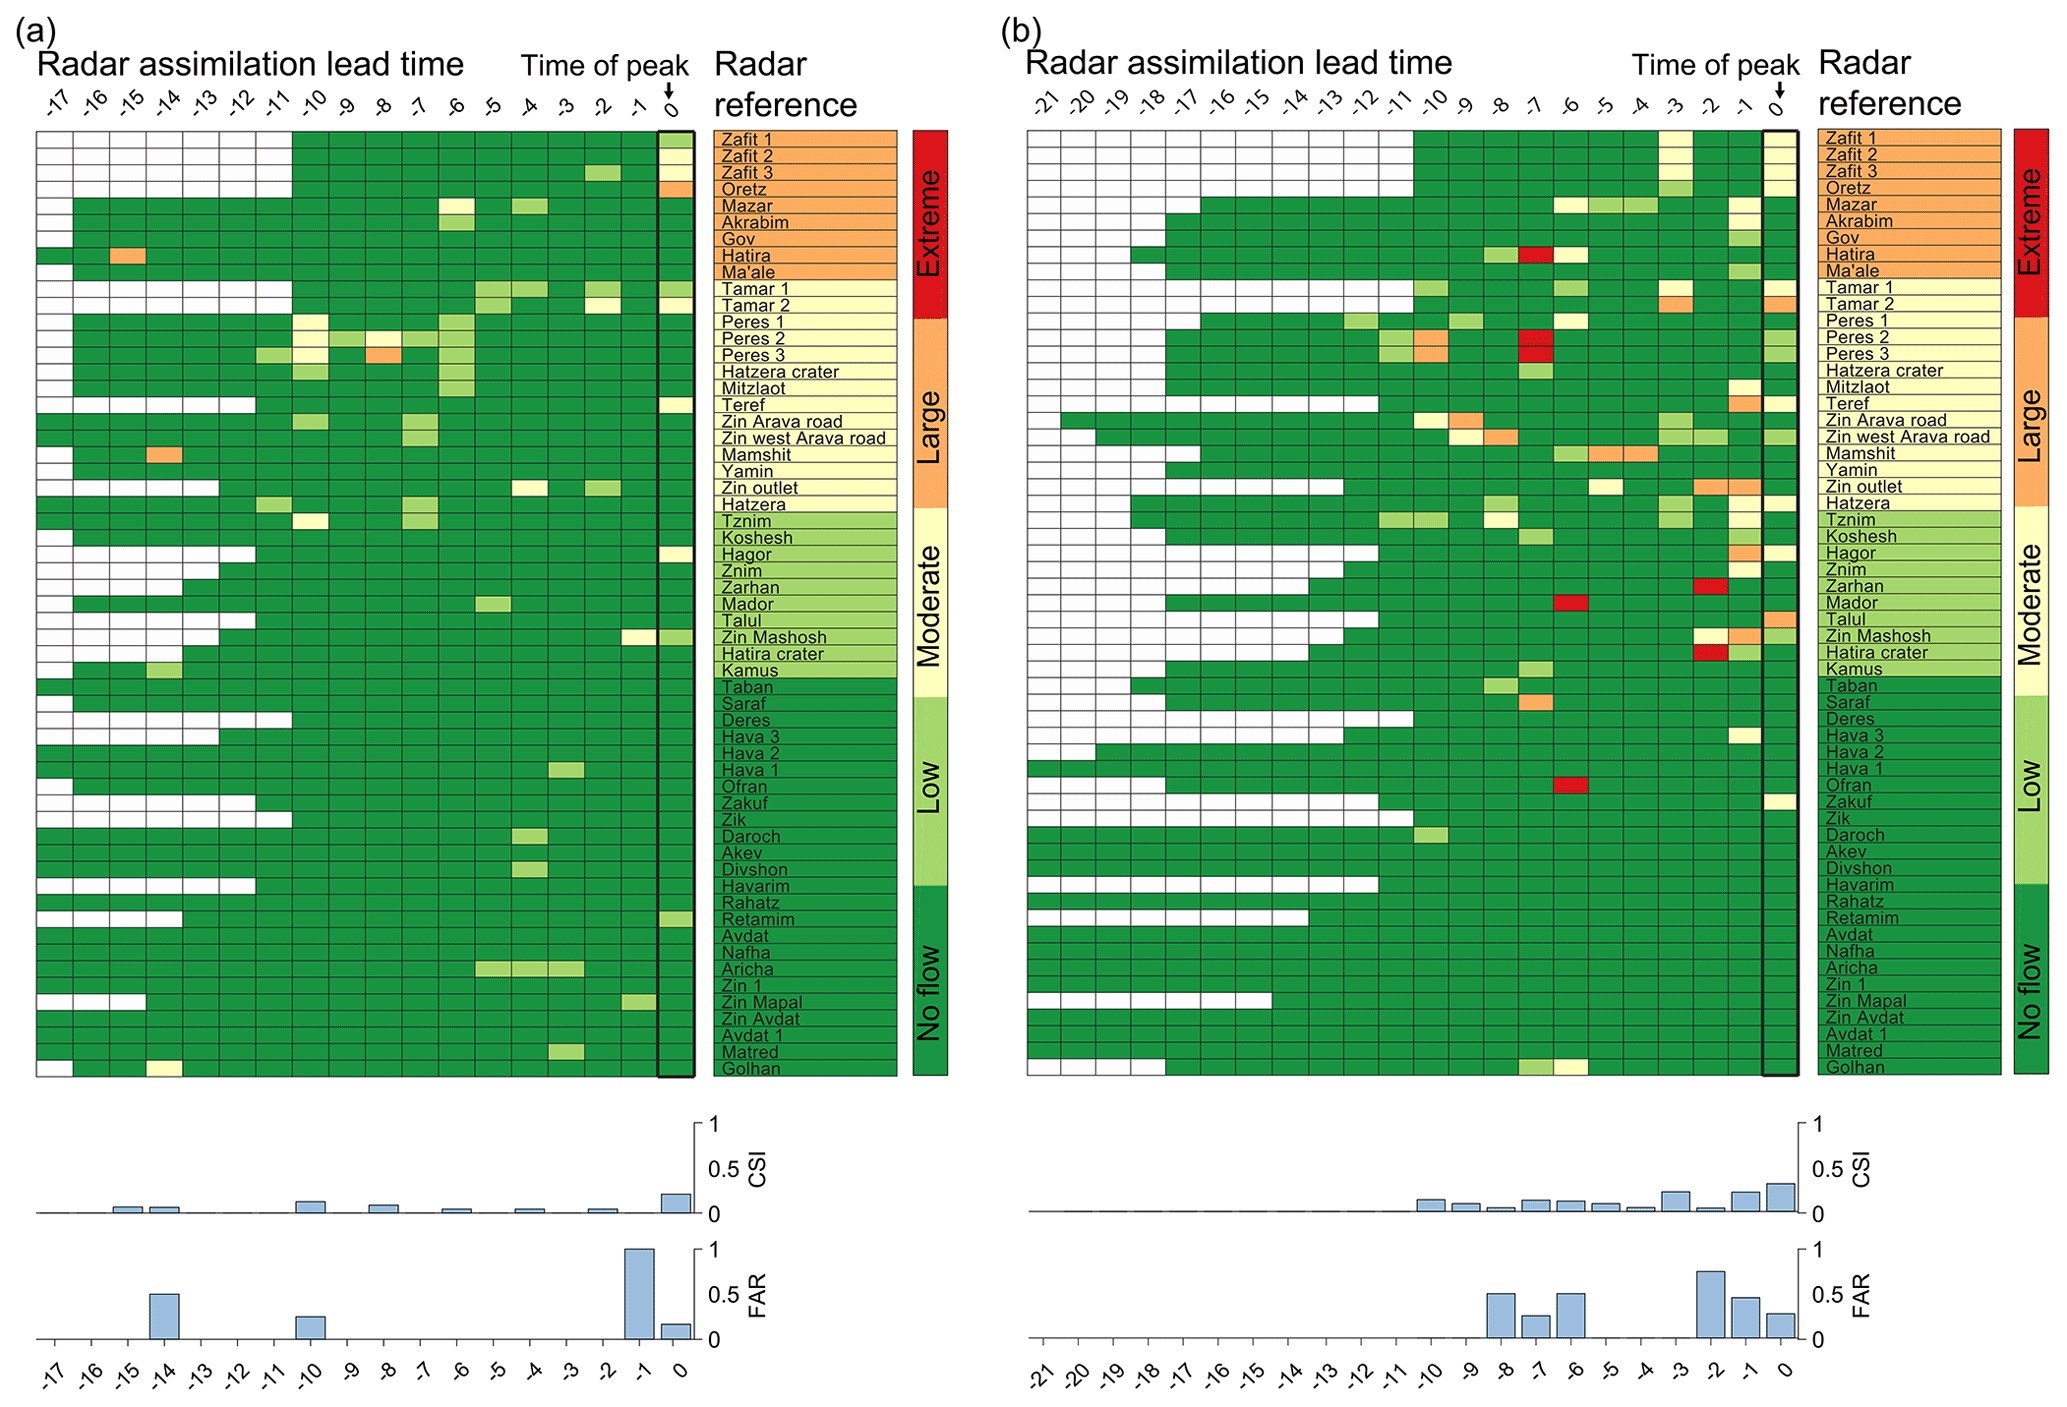
Figure 11Flash-flood return period categories calculated for each subbasin using the 25 April, 19:30 (a), and 26 April, 09:30 (b), COSMO runs with different radar assimilation lead times. Numbers represent the time in hours prior to the 26 April peak discharge at each subbasin, i.e., the lead time (where 0 is the hour of the peak, columns are not synchronal). Radar reference, CSI, and FAR metrics are presented.
5.3 COSMO spatial accuracy
For the studied rainstorm, measured and forecasted rainfall shared a similar spotty pattern caused by convective rain cells of similar shape and size (Fig. 9). However, as already suggested, the forecasted rainfall might be erroneously placed in space and time (Ben Bouallègue and Theis, 2014; Collier, 2007). To account for this source of uncertainty, a simple and cost-effective forecast-shifting approach was applied: shifting the last two available COSMO runs closest to the 26 April flash-flood occurrence (i.e., 25 April, 21:30, and 26 April, 09:30) within a reasonable spatial error range of 20 km (Armon et al., 2020; Khain et al., 2019; Fig. 9) in 1 km intervals. For each shifted forecast, the 1681 resultant rainfall fields were used as input for the GB-HYDRA model. Then, for each subbasin, the POD and POFD indexes were calculated using the modeled peak discharge and flood categories of 26 April. Shifting the COSMO run of 25 April, 21:30, resulted in multiple flash-flood simulations of moderate or higher category in the eastern part of the Zin basin (Fig. 12a) and thus in a high range of POD (0 %–80 %) and low POFD (0 %–21 %) values. The deterministic COSMO run of 26 April, 09:30, did not succeed in forecasting flash floods in any of the Zin subbasins (Fig. 10). However, when shifted in space, it also resulted (Fig. 12b) in multiple flash-flood simulations of moderate or higher category in the eastern Zin basin (POD: 2 %–21 % and POFD: 0.2 %–8 %) and presented a pattern similar to the reference categories (Fig. 8c).
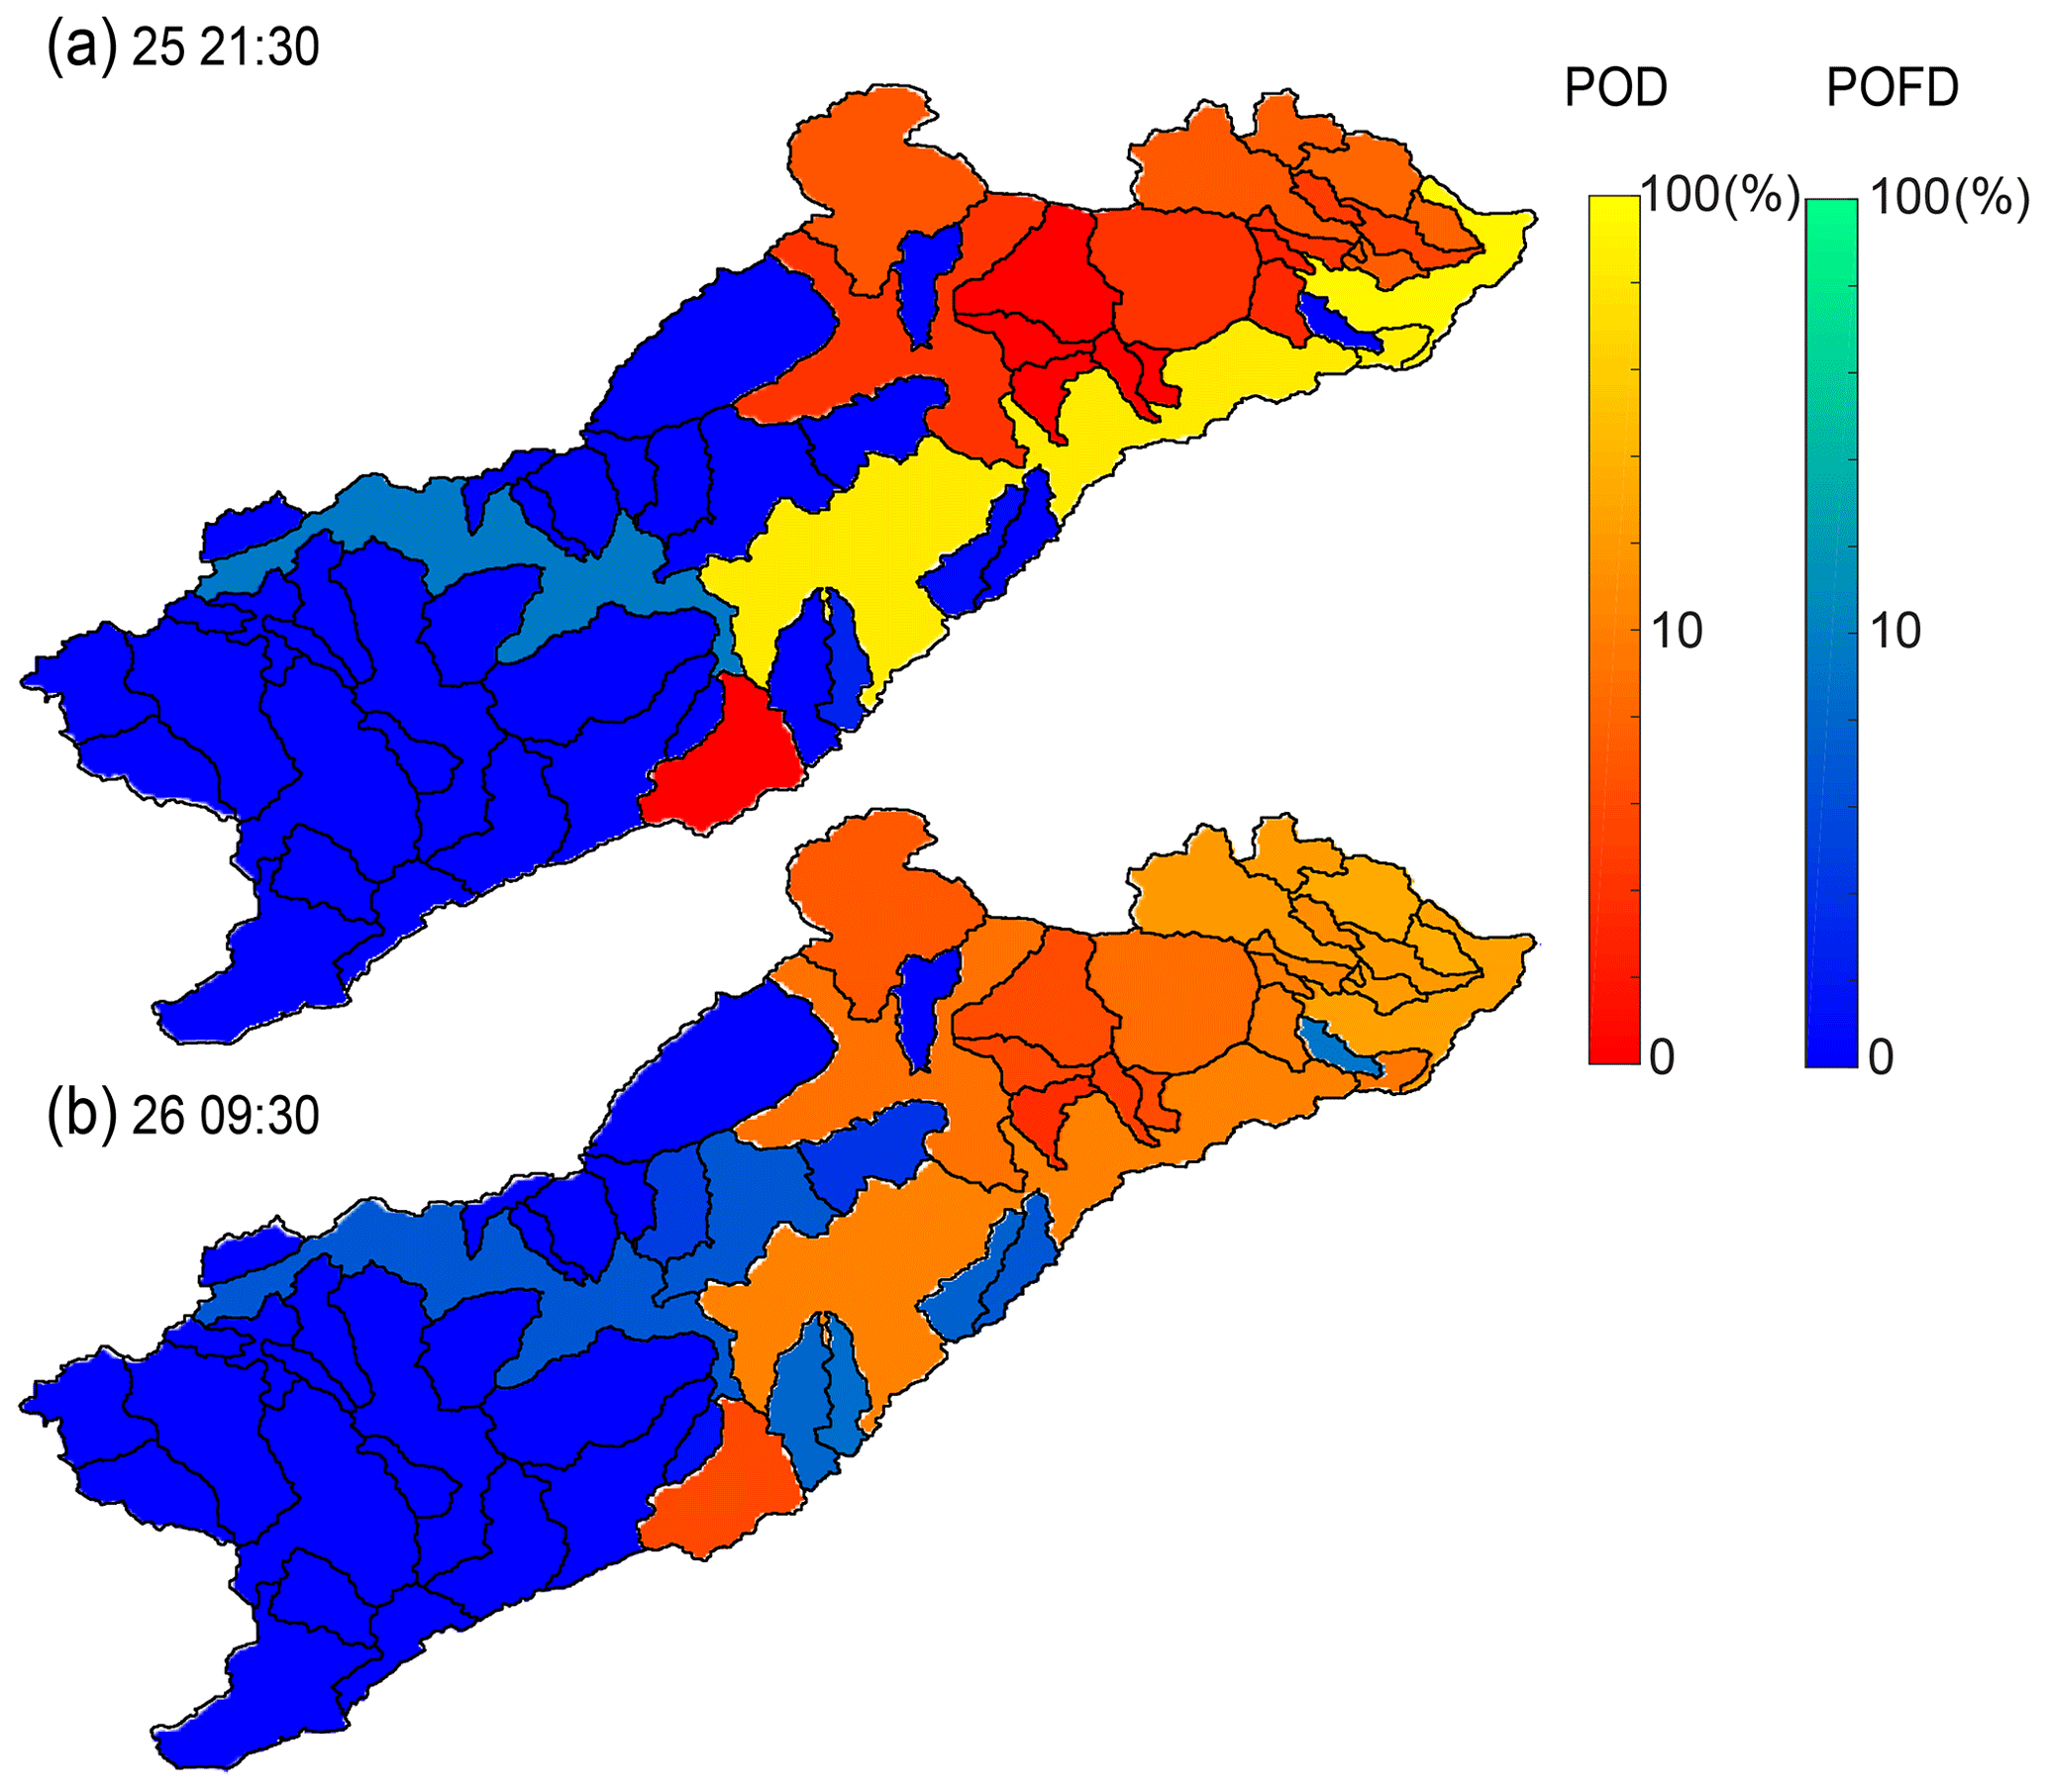
Figure 12POD and POFD calculated for each subbasin between the reference run and the peak discharge on 26 April for the 1681 rainfall fields resulting from the spatial shifting of the forecast COSMO runs of (a) 25 April, 21:30 and (b) 26 April, 09:30. POD was calculated for each subbasin with reference categories of moderate or above, and POFD was calculated for each subbasin with reference categories of low or no flow (Fig. 8).
6.1 Analysis of precipitation severity in arid regions
Estimating the severity of flash-flood-producing storms is crucial to better manage the risks related to these natural hazards. The typical lack of data characterizing arid regions (Morin et al., 2020), together with the small scales of flash-flood-producing events (Borga et al., 2014), make the quantification of precipitation frequency curves at these areas extremely difficult. In this study, we combined weather radar archives and novel statistical techniques, as suggested in Marra et al. (2019a). This enabled us to derive frequency curves for an ungauged area and produce a spatially distributed map of the event’s severity which permitted us to better understand its local impacts. In this way, a relatively short record of remotely sensed precipitation estimates could be fruitfully used to examine the local severity of a particularly hazardous storm. Thanks to the availability of high-resolution estimates from geostationary satellites, it is possible to extend these applications to arid regions of the globe for which no gauge or radar coverage is available, depending on the storms spatial scale.
6.2 Stream flow generation in arid regions
Runoff generation over hillslopes in arid regions is mainly controlled by infiltration excess (Simmers, 2003) which often occurs in response to intense rainfall (Nicholson, 2011). However, not all runoff turns into RCA and stream flow (e.g., Yair and Lavee, 1981) as rainfall duration is also a crucial factor (Vetter et al., 2014; Yair and Raz-Yassif, 2004). As a result, RCAs in arid regions are highly dependent on rainfall properties (Shmilovitz et al., 2020; Vetter et al., 2014) and do not necessarily develop along streams (Bracken and Croke, 2007). Both field observations and model results indicate that in the studied rainstorm, hillslope runoff is generated within minutes in response to intense rainfall. Two intense (>10 mm h−1 in 5 min) rain showers separated by a 50 min dry period occurred at the observation point. The first lasted ∼10 min and initiated local hillslope runoff but not RCA or stream runoff generation. The second lasted ∼35 min and resulted in RCA generation and stream-runoff initiation within 10 min (Fig. 6; Table 3; Video).
Yakir and Morin (2011) and Morin and Yakir (2014) examined the sensitivity of simulated flash-flood peak discharge to rain-cell characteristics. They found that under most scenarios, the maximal flood potential of a single rain cell is not fulfilled even when rainfall intensity is kept constant. Therefore, in most rainstorms, the flash-flood return period is expected to be smaller than that of local rain intensities. In this work, the Zafit subbasin experienced extreme rain intensities characterized by long return periods (75–100 years) on 26 April (Fig. 3b,e). However, the resultant flash flood was of large (10–50 years) but not of extreme magnitude. In fact, extreme rainfall covered only part of the subbasin (Fig. 3b) and resulted in a maximum RCA value of 18 % of the total subbasin area (Fig. 6). This emphasizes the importance of RCA, together with rain intensity, for identifying flash-flood magnitude (Rinat et al., 2018).
6.3 Flash-flood forecasting in arid regions
Flash floods are a major challenge in arid regions due to their fast development (e.g., Marchi et al., 2010; Zoccatelli et al., 2019, 2020, Sect. 4.2) and potentially devastating impact (Gaume et al., 2009; Sene, 2013). Although arid regions are not densely populated, they are crossed by roads and attract tourists and hikers. On top of that, the ability to distribute forecasts and warnings is often limited due to low cellular reception. The current low predictability of flash-flood forecasts is dominated by the skill of the convection-permitting rainfall forecast models (Clark et al., 2016; Khain et al., 2019) and hydrological models (Collier, 2007; Morin et al., 2006; Wagener et al., 2007). In arid regions, the possibility to improve these models using data assimilation and proper calibration is limited as monitoring instruments such as rain radars or rain and stream flow gauges are sparse (Kidd et al., 2017; Morin et al., 2020; Pilgrim et al., 1988). Radar assimilation into the COSMO convection-permitting model did not improve the forecasted hydrological response in the tested case study. This might be due to the rain cells' typically short lifetimes. According to Belachsen et al. (2017), the average lifetime of a convective flash-flood-producing rain cell around the Zin basin is ∼40 min (median ∼17 min). Thus, the hourly radar assimilations applied in this study are not likely to correct for convective rain cells that appear and decay within tens of minutes. Another reason may be that the assimilation algorithm does not effectively correct for cell location (Stephan et al., 2008).
Deterministic convection-permitting models fail to provide reliable forecast predictions at small spatial resolution (Roberts, 2008). Therefore, probabilistic approaches are applied to produce forecast ensembles (Ben Bouallègue and Theis, 2014; Clark et al., 2016). Forecast ensembles have proven to yield better results than deterministic ones (Alfieri et al., 2015; Liechti and Zappa, 2019) and are in operational use in the meteorological offices of several countries (e.g., DWD, 2020; MeteoSwiss, 2020; Met Office, 2020). The ensemble members are created by applying small perturbations to initial conditions or by varying the description of the physical process of the weather model (Hagelin et al., 2017). However, these methods require multiple model runs and intense computational resources (Clark et al., 2016), and therefore less costly methods have been developed. These include smoothing, upscaling, or “neighborhood” methods (Ben Bouallègue and Theis, 2014; Schwartz and Sobash, 2017; Sobash et al., 2011; Theis et al., 2005). Vincendon et al. (2011) developed a simplified method to produce rainfall ensembles from single-value meteorological forecasts and showed that by using it as an input for a hydrological model, the gained flood-forecasting ensemble performs better than the deterministic result. In this work, we present a simple and low-computational-cost ensemble method using forecast-shifting that has the potential to improve flash-flood forecasting; however, to assess its overall benefit, it should be furthered examined for a large variety of conditions.
Finally, as a complementary tool for flash-flood prediction, the testing of nowcasting techniques is recommended. Nowcasting methods apply various algorithms to propagate real-time rain radar observations while maintaining the high spatiotemporal resolution of the original data (Sene, 2013). The extrapolated rain fields are used as input for a hydrological model thus allowing for short term (up to 6 h) hydrological predication (Alfieri et al., 2015; Berenguer et al., 2005; Sempere-Torres et al., 2005). Additional methods assimilate the nowcasting products into convection-permitting models, thus gaining a longer rainfall forecast range (Sokol and Zacharov, 2012). Although, the accuracy of nowcasting is affected by several factors, for example, the short life time of convective rain cells or the effect of orographic enhancement, it was found to significantly improve the flash-flood forecasts in several case studies and to provide extended warnings of 10–80 min (Berenguer et al., 2005). This relatively short contribution is not to be overlooked, especially when summed with the basin lag time, which was found in this work to be on the order of tens of minutes.
Knowledge of desert rainstorms and flash floods is limited despite their devastating potential. To enrich this knowledge, we presented a comprehensive study of rainfall severity, hydrological impact, and forecasting potential for a fatal 3 d desert rainstorm. Special focus was placed on the storm’s highest impact, which occurred on 26 April, in the Zafit subbasin. The main conclusions of this study are as follows.
-
Rainfall intensity return periods calculated at radar pixel resolution were presented. Using a novel method, we identified rain intensities of exceptionally long return periods (75–100 years, for most durations) on 26 April in the Zafit subbasin, whereas for most of the Zin basin (>37 %–89 %), the calculated return periods are 0–5 years.
-
Rainfall and hydrological response in desert areas is local in nature. Despite the extreme (75–100 years) rainfall intensities in the Zafit subbasin, only a small part of it (20 %) contributed runoff to stream discharge, resulting in a large flash-flood estimation (return period of 10–50 years). In addition, around 35 % of the total Zin basin did not experience any flash floods on 26 April.
-
Flash floods in desert areas develop quickly. Hillslope runoff is initiated within minutes and stream discharge within tens of minutes. Calculated lag times for the Zin subbasins are on the order of tens of minutes as well.
-
The use of current deterministic operational forecast models is insufficient for flash-flood forecasting in small to moderate desert basins. None of the five deterministic COSMO forecast runs that were available prior to 26 April managed to capture the flash-flood occurrence or magnitude. Radar assimilation did not improve the forecast results. However, simple spatial shifting of the deterministic forecasted rainfall led to the improved probability of detecting the flash floods.
This single case study demonstrated the high potential for improving lifesaving flash-flood forecasts. Comprehensive work on other events and other locations, together with advanced nowcasting and ensemble prediction methods, may have worldwide benefits.
GB-HYDRA is an event-based, distributed hydrological model developed to study medium to small Mediterranean basins. The formulation presented in Rinat et al. (2018) was slightly altered to fit the studied arid basins and now includes a description of the following hydrological processes: evaporation, infiltration and re-infiltration, hillslope and stream runoff, downward percolation, and transmission losses (Fig. 4). In addition, the model calculates the runoff-contributing area (RCA) at any given time, defined here as hillslope sections from which water flows and reaches the stream network, during a specific duration (defined in this work as 30 min following Morin et al., 2001).
The ArcMap geographic information system (GIS) program was used to prepare the spatial data, including topography, stream network, soil, and land use. A smoothing procedure was applied to correct and eliminate artificial jumps in the stream profiles and reduce numerical instabilities (Peckham, 2009).
High-resolution aerial photography and 1:50 000 scale geological maps (Avni et al., 2016; Avni and Weiler, 2013; Hirsch, 1995; Roded, 1982, 1996; Yechieli et al., 1994; Zilberman and Avni, 2004) were used to identify alluvial stream sections and areas of different runoff potential. Channel widths were measured in the field and estimated using the air photos at different locations along the Zin's main channel and tributaries. These widths were extrapolated by fitting a power-law function (Montgomery and Gran, 2001) between the measured width (dependent variable) and the drainage area (independent variable).
The initial soil water storage was set to zero as no significant amount of rainfall had precipitated in the study area since the end of February 2018 (total rain depth <3.2 mm in 2 months). The daily potential evaporation rate measured at the Sde Boker station (Fig. 1b) was ∼4 mm d−1 during the storm. The Manning coefficient along the stream channels was estimated at 0.03, 0.04, and 0.05 for no, coarse, and very coarse alluvial stream bedding, respectively (Shamir et al., 2013). Hillslope Manning roughness coefficients varied from 0.01 to 0.02 (Table A1) following Downer and Ogden (2002), Engman (1986), Sadeh et al. (2018), and Shmilovitz et al. (2020). Stream sections characterized by alluvial bed were identified as areas prone to transmission losses (Fig. 1b) and assigned a constant infiltration rate of 10 mm h−1 following Greenbaum et al. (2002b), Lange (2005), Lange et al. (1999), and Morin et al. (2009a).
Downward percolation of water from hillslope grid cells to underground storage was set to zero except for grid cells identified as sands (Fig. 1b). These sections are characterized by the thick (up to 40 m) unconsolidated sandstones of the Hatzeva group (Calvo and Bartov, 2001) and cover about 88 km2 (∼6 %) of the Zin basin. A constant drainage rate of 40 mm h−1 was used in these sections (Table A1) following Lange et al. (1999) and Lange and Leibundgut (2003). Infiltration rate was described by the Soil Conservation Service (SCS) conceptual method. Initial abstractions of 20 % of the maximal soil storage were applied to each pixel (Chow et al., 1988; S.C.S, 1972).
In contrast to humid regions (Engman, 1986; Mishra and Singh, 2003), there are a limited number of studies utilizing the SCS method in arid and semiarid environments (Lange et al., 1999; Nouh, 1990; Shammout et al., 2018; Wheater et al., 2008; Sen, 2008). Thus, arid and semiarid curve number (CN) values are still not firmly established. CN parameters of three land-cover types in the studied basin that are poorly represented in the scientific literature (sands, sandstones, and rocky desert; Table A1; Fig. 1b) were found by calibration. To save on computation time, calibration was performed only in the eastern part of the Zin basin. This part of the basin includes the area of the storm’s core and most of the available peak-discharge measurements. Initial CN values were determined from the literature (Moawad, 2013; Moawad et al., 2016; Wheater et al., 2008; Sen, 2008). Root mean square difference (RMSD) of observed and computed specific peak discharges and their bias were used as objective functions, and final parameters were selected from the Pareto solution group (i.e., the group of parameter sets for which none provides better results than the other in terms of both RMSD and bias). Calibration results pointed to adequate model performance and its use for this specific study (R2=0.94; RMSD = 0.65 ; Bias = 0.35 ; Fig. 5; Table 1). Rinat et al. (2018) found that the sensitivity of the GB-HYDRA-modeled peak discharge and RCA to stream Manning roughness, hillslope Manning roughness, and CN values is low. In this work, sensitivity analysis was not applied due to considerably long run times. Further procedures of sensitivity analysis, calibration, and validation are needed if the model or its parameters are to be used in more general studies.
Radar and rain-gauge data were provided and preprocessed by the Israel Meteorological Service (https://ims.data.gov.il/, IMS, 2020; rain-gauge data are freely available in Hebrew only). Discharge gauge data were provided by the Israel Water Authority (https://www.gov.il/he/departments/water_authority, Israel Hydrological service, 2021) and are available upon request. Shacham–Mekorot radar data were provided by EMS-Mekorot projects (https://www.emsmekorotprojects.com/, EMS Mekorot Projects Ltd, 2021). Corrected and gauge-adjusted radar data (Marra and Morin, 2015) are available in the form of images through personal communication with the head of the hydrometeorology lab at the Hebrew University of Jerusalem, Efrat Morin (efrat.morin@mail.huji.ac.il).
The video related to this article can be found at: https://doi.org/10.5446/47152 (Rinat and Armon, 2020).
YR and EM conceptualized the work. The methodology and software were developed by YR and FM. Data curation and formal analysis were performed by YR, FM, AM, MA, YL, PK, and EV. Resources were provided by MR, YL, PK, and EV. Funding was acquired by EM who also supervised the work. YR wrote the original draft of this paper, which was reviewed and edited by all authors.
The authors declare that they have no conflict of interest.
The authors wish to thank the editor, Maria-Carmen Llasat, Lorenzo Marchi, and one anonymous reviewer for their useful comments that helped improve the paper. We wish to thank Tamir Grodek, Alon Ronen, and the Soil Erosion Research Station for their help in post-event analysis peak discharge estimations. This study was funded by the Israel Science Foundation (grant no. 1069/18), a NSF–BSF grant (grant no. BSF 2016953), and a Google gift grant. This study is a contribution to the PALEX project “Paleohydrology and Extreme Floods from the Dead Sea ICDP Core” funded by the DFG (BR2208/13-1/-2) and is a contribution to the HyMeX program. We are also grateful for the detailed direct rainfall and flood observations made by Ari Matmon and Nathalie Neagu, and for sharing the information with us.
This research has been supported by the Israel Science Foundation (grant no. 1069/18), the NSF–BSF grant (grant no. BSF 2016953), and the Paleohydrology and Extreme Floods from the Dead Sea ICDP Core (grant no. DFG BR2208/13-1/-2).
This paper was edited by Maria-Carmen Llasat and reviewed by Lorenzo Marchi and one anonymous referee.
Alfieri, L., Salamon, P., Pappenberger, F., and Wetterhall, F.: Operational early warning systems for water-related hazards in Europe, Environ. Sci. Policy, 21, 35–49, https://doi.org/10.1016/j.envsci.2012.01.008, 2012. a
Alfieri, L., Berenguer, M., Knechtl, V., Liechti, K., Sempere-Torres, D., and Zappa, M.: Flash Flood Forecasting Based on Rainfall Thresholds, in: Handbook of Hydrometeorological Ensemble Forecasting, Springer, Berlin, Heidelberg, 1–38, https://doi.org/10.1007/978-3-642-40457-3_49-1, 2015. a, b
Amponsah, W., Marchi, L., Zoccatelli, D., Boni, G., Cavalli, M., Comiti, F., Crema, S., Lucía, A., Marra, F., and Borga, M.: Hydrometeorological Characterization of a Flash Flood Associated with Major Geomorphic Effects: Assessment of Peak Discharge Uncertainties and Analysis of the Runoff Response, J. Hydrometeorol., 17, 3063–3077, https://doi.org/10.1175/JHM-D-16-0081.1, 2016. a
Archer, D. R., Leesch, F., and Harwood, K.: Learning from the extreme River Tyne flood in January 2005, Water Environ. J., 21, 133–141, https://doi.org/10.1111/j.1747-6593.2006.00058.x, 2007. a
Armon, M., Dente, E., Smith, J. A., Enzel, Y., and Morin, E.: Synoptic-Scale Control over Modern Rainfall and Flood Patterns in the Levant Drylands with Implications for Past Climates, J. Hydrometeorol., 19, 1077–1096, https://doi.org/10.1175/JHM-D-18-0013.1, 2018. a
Armon, M., Marra, F., Enzel, Y., Rostkier-Edelstein, D., and Morin, E.: Radar-based characterisation of heavy precipitation in the eastern Mediterranean and its representation in a convection-permitting model, Hydrol. Earth Syst. Sci., 24, 1227–1249, https://doi.org/10.5194/hess-24-1227-2020, 2020. a, b
Avni, Y. and Wieler, N.: The geological map of Israel, 1:50,000, Sheet 18-IV: SdeBoqer, Isr. Geol. Surv., Jerusalem, 2013. a
Avni, Y., Bartov, Y., and Sneh, A.: The geological map of Israel, 1:50,000. Sheet 22-I: HarArdon, Isr. Geol. Surv., Jerusalem, 2016. a
Baldauf, M., Seifert, A., Förstner, J., Majewski, D., Raschendorfer, M., and Reinhardt, T.: Operational convective-scale numerical weather prediction with the COSMO model: Description and sensitivities, Mon. Weather Rev., 139, 3887–3905, https://doi.org/10.1175/MWR-D-10-05013.1, 2011. a
Barredo, J. I.: Major flood disasters in Europe: 1950–2005, Nat. Hazards, 42, 125–148, https://doi.org/10.1007/s11069-006-9065-2, 2007. a, b
Bartsotas, N. S., Nikolopoulos, E. I., Anagnostou, E. N., Solomos, S., and Kallos, G.: Moving toward Subkilometer Modeling Grid Spacings: Impacts on Atmospheric and Hydrological Simulations of Extreme Flash Flood-Inducing Storms, J. Hydrometeorol., 18, 209–226, https://doi.org/10.1175/JHM-D-16-0092.1, 2016. a
Belachsen, I., Marra, F., Peleg, N., and Morin, E.: Convective rainfall in a dry climate: relations with synoptic systems and flash-flood generation in the Dead Sea region, Hydrol. Earth Syst. Sci., 21, 5165–5180, https://doi.org/10.5194/hess-21-5165-2017, 2017. a, b, c, d
Ben Bouallègue, Z. and Theis, S. E.: Spatial techniques applied to precipitation ensemble forecasts: From verification results to probabilistic products, Meteorol. Appl., 21, 922–929, https://doi.org/10.1002/met.1435, 2014. a, b, c, d, e
Benson, M. A. and Dalrymple, T.: General Field and Office Procedures for Indirect Discharge Measurements, Technical Report, available at: http://pubs.usgs.gov/twri/twri3-a1/html/pdf/twri_3-A1_a.pdf (last access: 10 May 2020), 1967. a
Berenguer, M., Corral, C., Sánchez-Diezma, R., and Sempere-Torres, D.: Hydrological Validation of a Radar-Based Nowcasting Technique, J. Hydrometeorol., 6, 532–549, https://doi.org/10.1175/JHM433.1, 2005. a, b
Borga, M., Boscolo, P., Zanon, F., and Sangati, M.: Hydrometeorological Analysis of the 29 August 2003 Flash Flood in the Eastern Italian Alps, J. Hydrometeorol., 8, 1049–1067, https://doi.org/10.1175/JHM593.1, 2007. a
Borga, M., Stoffel, M., Marchi, L., Marra, F., and Jakob, M.: Hydrogeomorphic response to extreme rainfall in headwater systems: Flash floods and debris flows, J. Hydrol., 518, 194–205, https://doi.org/10.1016/j.jhydrol.2014.05.022, 2014. a, b
Borga, M., Comiti, F., Ruin, I., and Marra, F.: Forensic analysis of flash flood response, Wires, 6, 1–9, https://doi.org/10.1002/wat2.1338, 2019. a, b, c, d
Bracken, L. J. and Croke, J.: The concept of hydrological connectivity and its contribution to understanding runoff-dominated geomorphic systems, Hydrol. Process., 21, 1749–1763, https://doi.org/10.1002/hyp.6313, 2007. a
Brunner, W. G.: HEC-RAS River Analysis System, Hydraulic reference manual, Version 5.0, US Army Crops of Engineers, 2016. a
Brutsaert, W.: Hydrology, An Introducation, Cambridge University Press, New York, USA, 2005. a
Calvo, R. and Bartov, Y.: Hazeva Group, southern Israel: New observations, and their implications for its stratigraphy, paleogeography, and tectono-sedimentary regime, Israel J. Earth Sci., 50, 71–99, https://doi.org/10.1092/B02L-6K04-UFQL-KUE3, 2001. a
Chappell, C. F.: Quasi-Stationary Convective Events, in: Mesoscale Meteorology and Forecasting, edited by: Ray, P. S., American Meteorological Society, Boston, MA, USA, 289–310, https://doi.org/10.1007/978-1-935704-20-1_13, 1986. a
Chow, V. T., Maidment, D. R., and Mays, L. W.: Applied Hydrology, MacGraw-Hill, Singapore, 1988. a, b
Clark, P., Roberts, N., Lean, H., Ballard, P., and Charlton-Perez, C.: Review: Convection-permitting models : a step-change in rainfall, Meteorol. Appl., 181, 165–181, https://doi.org/10.1002/met.1538, 2016. a, b, c, d, e
Collier, C. G.: Flash flood forecasting: What are the limits of predictability?, Q. J. Roy. Meteor. Soc., 133, 3–23, https://doi.org/10.1002/qj.29, 2007. a, b, c
Creutin, J. D., Borga, M., Gruntfest, E., Lutoff, C., Zoccatelli, D., and Ruin, I.: A space and time framework for analyzing human anticipation of flash floods, J. Hydrol., 482, 14–24, https://doi.org/10.1016/j.jhydrol.2012.11.009, 2013. a, b
Dan, Y., Raz, Z., Yaalon, D. H., and Koyumdjisky, H.: Soil Map of Israel, 1:500,000, Jerusalem, 1975. a
Danin, A.: Desert vegetation of Israel and Sinai, Cana Publications, Jerusalem, Israel, p. 148, 1983. a, b
Dayan, U., Lensky, I. M., and Ziv, B.: Atmospheric Conditions Leading to an Exceptional Fatal Flash Flood in the Negev Desert, Israel, Nat. Hazards Earth Syst. Sci. Discuss. [preprint], https://doi.org/10.5194/nhess-2020-94, in review, 2020. a
Delrieu, G., Ducrocq, V., Gaume, E., Nicol, J., Payrastre, O., Yates, E., Kirstetter, P.-E., Andrieu, H., Ayral, P.-A., Bouvier, C., Creutin, J.-D., Livet, M., Anquetin, S., Lang, M., Neppel, L., Obled, C., Parent-Du-Chatelet, J., Saulnier, G.-M., Walpersorf, A., and Wobrock, W.: The catastrophic flash-flood event of 8–9 September 2002 in the Gard region, France: a first case study for the Cévennes-Vivarais Mediterranean Hydrometeorological, J. Hydrometeorol., 6, 34–52, 2005. a
Dey, K. D. and Yan, J.: Extreme Value Modeling and Risk Analysis: Methods and Applications, CRC Press, Taylor and Francis Group, NY, USA, 2016. a
Dey, S. R., Plant, R. S., Roberts, N. M., and Migliorini, S.: Assessing spatial precipitation uncertainties in a convective-scale ensemble, Q. J. Roy. Meteor. Soc., 142, 2935–2948, https://doi.org/10.1002/qj.2893, 2016. a
Dingman, S. L.: Physical hydrology, Waveland Press, Long Grove, IL, USA, https://doi.org/10.1177/030913337800200111, 2015. a
Doms, G., Förstner, J., Heise, E., Herzog, H.-J., Mironov, D., Raschendorfer, M., Reinhardt, T., Ritter, B., Schrodin, R., Schulz, J.-P., and Vogel, G.: A Description of the Nonhydrostatic Regional COSMO Model Part II: Physical Parameterization, Deutscher Wetterdienst, Offenbach, Germany, Technical Report, p. 139, 2011. a
Doocy, S., Daniels, A., Murray, S., and Kirsch, T. D.: The Human Impact of Floods: a Historical Review of Events and Systematic Literature Review, PLOS Currents Disasters, 1, 1–32, https://doi.org/10.1371/currents.dis.f4deb457904936b07c09daa 98ee8171a, 2013. a, b, c
Doswell, A. C., Brooks, E. H., and Madox, A. R.: Flash flood forecasting: An ingredients-based methodology, Weather Forecast., 11, 560–581, 1996. a
Downer, C. W. and Ogden, F. L.: GSSHA – User's Manual, Version 1.43, p. 190, 2002. a
DWD – Deutscher Wetterdienst: Wetter und Klima – Deutscher Wetterdienst – Startseite, https://www.dwd.de, last access: 10 May 2020. a
EMS Mekorot Projects Ltd: https://www.emsmekorotprojects.com/, last access: 24 January 2021. a
Engman, E. T.: Roughness Coefficients for Routing Surface Runoff, J. Irrig. Drainage Eng., https://doi.org/10.1061/(ASCE)0733-9437(1986)112:1(39), 1986. a, b
Faurès, J. M., Goodrich, D. C., Woolhiser, D. A., and Sorooshian, S.: Impact of small-scale spatial rainfall variability on runoff modeling, J. Hydrol., 173, 309–326, https://doi.org/10.1016/0022-1694(95)02704-S, 1995. a
Foody, G. M., Ghoneim, E. M., and Arnell, N. W.: Predicting locations sensitive to flash flooding in an arid environment, J. Hydrol., 292, 48–58, https://doi.org/10.1016/j.jhydrol.2003.12.045, 2004. a
Gaume, E. and Borga, M.: Post-flood field investigations in upland catchments after major flash floods: proposal of a methodology and illustrations, J. Flood Risk Manag., 1, 175–189, https://doi.org/10.1111/j.1753-318x.2008.00023.x, 2008. a
Gaume, E., Bain, V., Bernardara, P., Newinger, O., Barbuc, M., Bateman, A., Blaškovičová, L., Blöschl, G., Borga, M., Dumitrescu, A., Daliakopoulos, I., Garcia, J., Irimescu, A., Kohnova, S., Koutroulis, A., Marchi, L., Matreata, S., Medina, V., Preciso, E., Sempere-Torres, D., Stancalie, G., Szolgay, J., Tsanis, I., Velasco, D., and Viglione, A.: A compilation of data on European flash floods, J. Hydrol., 367, 70–78, https://doi.org/10.1016/j.jhydrol.2008.12.028, 2009. a, b, c, d
Gaume, E., Borga, M., Llasat, M., Maouche, S., Lang, M., and Diakakis, M.: Mediterranean extreme floods and flash floods. Into Hydro-meteorological extremes, The Mediterranean Region under Climate Change, A Scientific Update, edited by: Thiébault, S. and Moatti, J.-P., IRD Éditions, Marseille, France, 133–144, 2016. a
Goldreich, Y.: The Climate of Israel, Observations, Research and Imlementation, Springer, New York, USA, 2003. a
Greenbaum, N., Schwartz, U., Schick, A., and Enzel, Y.: Paleofloods and the Estimation of Long Term Transmission Losses and Recharge to the Lower Nahal Zin Alluvial Aquifer, Negev Desert, Israel, in: Ancient floods, modern hazards: principles and applications of paleoflood hydrologydrology, edited by: House, P., Webb, R., Baker, V., and Levish, D., NY, USA, 311–328, 2002a. a, b
Greenbaum, N., Schwartz, U., Schick, P. A., and Enzel, Y.: Paleo floods and the Estimation of Long Term Transmission Losses and Recharge to the Lower Nahal Zin Alluvial Aquifer, Negev Desert, Israel, in: Ancient Floods, Modern Hazards Principles and Applications of Paleoflood Hydrology, Water Science and Application, edited by: House, P. K., Webb, H. R., Baker, R. V., and Levish, R. D., American Geophysical Union, Washington, DC, USA, 311–328, 2002b. a
Greenbaum, N., Ben-Zvi, A., Haviv, I., and Enzel, Y.: The hydrology and paleohydrology of the Dead Sea tributaries, Geol. S. Am. S., 401, 63–93, https://doi.org/10.1130/2006.2401(05), 2006. a
Grodek, T., Jacoby, Y., Morin, E., and Katz, O.: Effectiveness of exceptional rainstorms on a small Mediterranean basin, Geomorphology, 159–160, 156–168, https://doi.org/10.1016/j.geomorph.2012.03.016, 2012. a
Gruntfest, E. and Handmer, J.: Coping With Flash Floods, Springer Science and Business Media, Dordrecht, Netherlands, https://doi.org/10.1016/j.irfa.2004.01.004, 2001. a
Haan, C. T. C. T.: Statistical methods in hydrology, Iowa State Press, Iowa, USA, 2002. a
Hagelin, S., Son, J., Swinbank, R., McCabe, A., Robertsa, N., and Tennanta, W.: The Met Office convective-scale ensemble, MOGREPS-UK, Q. J. Roy. Meteor. Soc., 143, 2846–2861, https://doi.org/10.1002/qj.3135, 2017. a
Hirsch, F.: The geological map of Israel, 1:50,000. Sheet 19-II: HamakhteshHaqatan, Isr. Geol. Surv., Jerusalem, 1995. a
Hosking, J. R., Wallis, J. R., and Wood, E. F.: Estimation of the generalized extreme-value distribution by the method of probability-weighted moments, Technometrics, 27, 251–261, https://doi.org/10.1080/00401706.1985.10488049, 1985. a
IMS – Israel Meteorological Service: availabe at: http://www.ims.gov.il (last access: 1 January 2021), 2020. a, b, c
Inbar, M.: Natural disasters in israel, availabe at: https://geo.hevra.haifa.ac.il/~inh/index.php/en/disasters-en/floods-en (last access: 10 May 2020), 2019. a
Israel Hydrological service: https://www.gov.il/he/departments/water_authority, last access: 24 January 2021 (in Hebrew). a
Kahana, R., Ziv, B., Enzel, Y., and Dayan, U.: Synoptic climatology of major floods in the Negev Desert, Israel, Int. J. Climatol., 22, 867–882, https://doi.org/10.1002/joc.766, 2002. a
Kampf, S. K., Faulconer, J., Shaw, J. R., Lefsky, M., Wagenbrenner, J. W., and Cooper, D. J.: Rainfall Thresholds for Flow Generation in Desert Ephemeral Streams, Water Resour. Res., 54, 9935–9950, https://doi.org/10.1029/2018WR023714, 2018. a
Karklinsky, M. and Morin, E.: Spatial characteristics of radar-derived convective rain cells over southern Israel, Meteorol. Z., 15, 513–520, https://doi.org/10.1127/0941-2948/2006/0153, 2006. a
Khain, P., Levi, Y., Shtivelman, A., and Vadislavsky, E.: Improving the precipitation forecast over the Eastern Mediterranean using a smoothed time-lagged ensemble, Meteorol. Appl., 27, 1–17, https://doi.org/10.1002/met.1840, 2019. a, b, c
Kidd, C., Becker, A., Huffman, G. J., Muller, C. L., Joe, P., Skofronick-Jackson, G., and Kirschbaum, D. B.: So, how much of the Earth's surface is covered by rain gauges?, B. Am. Meteorol. Soc., 98, 69–78, https://doi.org/10.1175/BAMS-D-14-00283.1, 2017. a, b
Lange, J.: Dynamics of transmission losses in large arid stream channel, J. Hydrol., 306, 112–126, https://doi.org/10.1016/j.jhydrol.2004.09.016, 2005. a
Lange, J., and Leibundgut, C: Surface runoff and sediment dynamics in arid and semi‐arid regions, in Understanding Water in a Dry Environment, edited by: Simmers, I., Taylor & Francis, Lisse, the Netherlands, 115–150, 2003. a
Lange, J., Leibundgut, C., Greenbaun, N., and Schick, A.: A noncalibrated model for large, arid catchments, Water Resour. Res., 35, 2161–2172, https://doi.org/10.1029/1999WR900038, 1999. a, b, c
Larsen, M. C., Conde, M. T. V., and Clark, R. A.: Landslide hazards associated with flash-foods, with examples from the December, 1999 disaster in Venezuela, in: Coping with Flash Floods, edited by: Gruntfest, E. and Handmer, J., Springer Science and Business Media, Dordrecht, Netherlands, 259–275, 2001. a
Liechti, K. and Zappa, M.: Verification of Short-Range Hydrological Forecasts, in: Handbook of Hydrometeorological Ensemble Forecasting, edited by: Qingyun, D., Pappenberger, F., Wood, A., Cloke, H. L., and Schaake, J. C., Springer, Berlin and Heidelberg, Germany, 954–974, 2019. a
Limerinos, T. J.: Determination of the Manning Coefficient From Measured Bed Roughness in Natural Channels, Technical Report, Geological Survey, Washington, DC, USA, 47 pp., 1970. a
Marani, M. and Ignaccolo, M.: A metastatistical approach to rainfall extremes, Adv. Water Resour., 79, 121–126, https://doi.org/10.1016/j.advwatres.2015.03.001, 2015. a
Marchi, L., Borga, M., Preciso, E., and Gaume, E.: Characterisation of selected extreme flash floods in Europe and implications for flood risk management, J. Hydrol., 394, 118–133, https://doi.org/10.1016/j.jhydrol.2010.07.017, 2010. a, b, c, d, e
Marra, F. and Morin, E.: Use of radar QPE for the derivation of Intensity-Duration-Frequency curves in a range of climatic regimes, J. Hydrol., 531, 427–440, https://doi.org/10.1016/j.jhydrol.2015.08.064, 2015. a, b, c, d, e, f, g
Marra, F. and Morin, E.: Autocorrelation structure of convective rainfall in semiarid-arid climate derived from high-resolution X-Band radar estimates, Atmos. Res., 200, 126–138, https://doi.org/10.1016/j.atmosres.2017.09.020, 2018. a, b
Marra, F., Morin, E., Peleg, N., Mei, Y., and Anagnostou, E. N.: Intensity–duration–frequency curves from remote sensing rainfall estimates: comparing satellite and weather radar over the eastern Mediterranean, Hydrol. Earth Syst. Sci., 21, 2389–2404, https://doi.org/10.5194/hess-21-2389-2017, 2017. a
Marra, F., Nikolopoulos, E. I., Anagnostou, E. N., and Morin, E.: Metastatistical Extreme Value analysis of hourly rainfall from short records: Estimation of high quantiles and impact of measurement errors, Adv. Water Resour., 117, 27–39, https://doi.org/10.1016/j.advwatres.2018.05.001, 2018. a, b
Marra, F., Nikolopoulos, E. I., Anagnostou, E. N., Bárdossy, A., and Morin, E.: Precipitation frequency analysis from remotely sensed datasets: A focused review, J. Hydrol., 574, 699–705, https://doi.org/10.1016/j.jhydrol.2019.04.081, 2019a. a, b, c, d
Marra, F., Zoccatelli, D., Armon, M., and Morin, E.: A simplified MEV formulation to model extremes emerging from multiple nonstationary underlying processes, Adv. Water Resour., 127, 280–290, https://doi.org/10.1016/j.advwatres.2019.04.002, 2019b. a
Martens, B., Cabus, P., De Jongh, I., and Verhoest, N. E.: Merging weather radar observations with ground-based measurements of rainfall using an adaptive multiquadric surface fitting algorithm, J. Hydrol., 500, 84–96, https://doi.org/10.1016/j.jhydrol.2013.07.011, 2013. a
MeteoSwiss – Federal Office of Meteorological and Climatology MeteoSwiss: availabe at: http://www.meteoswiss.admin.ch, last access: 10 May 2020. a
Met Office: availabe at: https://www.metoffice.gov.uk/, last access: 10 May 2020. a
Michaud, J. D. and Sorooshian, S.: Effect of rainfall‐sampling errors on simulations of desert flash floods, Water Resour. Res., 30, 2765–2775, https://doi.org/10.1029/94WR01273, 1994. a
Miniussi, A., and Marani, M. Estimation of daily rainfall extremes through the metastatistical extreme value distribution: Uncertainty minimization and implications for trend detection, Water Resour. Res., 56, e2019WR026535, https://doi.org/10.1029/2019WR026535, 2020. a
Mishra, S. and Singh, V. P.: Soil Conservation Service Curve Number (SCS-CN) Methodology, Water Science and Technology Library, Springer Science and Business Media, Dordrecht, The Netherlands, 514 pp., https://doi.org/10.1007/978-94-017-0147-1, 2003. a
Moawad, M. B.: Analysis of the flash flood occurred on 18 January 2010 in wadi El Arish, Egypt (a case study), Geomat. Nat. Haz. Risk, 4, 254–274, https://doi.org/10.1080/19475705.2012.731657, 2013. a
Moawad, M. B., Omar Abdel Aziz, A., and Mamtimin, B.: Flash floods in the Sahara: a case study for the 28 January 2013 flood in Qena, Egypt, Geomat. Nat. Haz. Risk, 7, 215–236, https://doi.org/10.1080/19475705.2014.885467, 2016. a
Montgomery, D. R. and Gran, K. B.: Downstream variations in the width of bedrock channels, Water Resour. Res., 37, 1841–1846, https://doi.org/10.1029/2000WR900393, 2001. a
Morin, E. and Yakir, H.: Hydrological impact and potential flooding of convective rain cells in a semi-arid environment, Hydrolog. Sci. J., 57, 1–10, https://doi.org/10.1080/02626667.2013.841315, 2014. a, b
Morin, E., Enzel, Y., Shamir, U., and Garti, R.: The characteristic time scale for basin hydrological response using radar data, J. Hydrol., 252, 85–99, https://doi.org/10.1016/S0022-1694(01)00451-6, 2001. a
Morin, E., Goodrich, D. C., Maddox, R. A., Gao, X., Gupta, H. V., and Sorooshian, S.: Spatial patterns in thunderstorm rainfall events and their coupling with watershed hydrological response, Adv. Water Resour., 29, 843–860, https://doi.org/10.1016/j.advwatres.2005.07.014, 2006. a
Morin, E., Grodek, T., Dahan, O., Benito, G., Kulls, C., Jacoby, Y., Langenhove, G. V., Seely, M., and Enzel, Y.: Flood routing and alluvial aquifer recharge along the ephemeral arid Kuiseb River, Namibia, J. Hydrol., 368, 262–275, https://doi.org/10.1016/j.jhydrol.2009.02.015, 2009a. a, b
Morin, E., Jacoby, Y., Navon, S., and Bet-Halachmi, E.: Towards flash-flood prediction in the dry Dead Sea region utilizing radar rainfall information, Adv. Water Resour., 32, 1066–1076, https://doi.org/10.1016/j.advwatres.2008.11.011, 2009b. a
Morin, E., Marra, F., and Armon, M.: Dryland Precipitation Climatology from Satellite Observations, in: Satellite Precipitation Measurement: Volume 2, edited by: Levizzani, V., Kidd, C., Kirschbaum, D. B., Kummerow, C. D., Nakamura, K., and Turk, F. J., Springer International Publishing, Cham, UK, 843–859, https://doi.org/10.1007/978-3-030-35798-6_19, 2020. a, b
Nicholson, S. E.: Dryland climatology, Cambridge University Press, Cambridge, UK, https://doi.org/10.1017/CBO9780511973840, 2011. a, b, c, d, e, f, g
Nouh, M.: Flood hydrograph estimation from arid catchment morphology, Hydrol. Process., 4, 103–120, https://doi.org/10.1002/hyp.3360040202, 1990. a
Overeem, A., Buishand, A., and Holleman, I.: Rainfall depth-duration-frequency curves and their uncertainties, J. Hydrol., 348, 124–134, https://doi.org/10.1016/j.jhydrol.2007.09.044, 2008. a
Peckham, S. D.: A New Algorithm for Creating DEMs with Smooth Elevation Profiles, Proceedings of Geomorphometry, 2, 34–37, 2009. a
Petrucci, O., Aceto, L., Bianchi, C., Bigot, V., Brázdil, R., Pereira, S., Kahraman, A., Kiliç, Ö., Kotroni, V., Llasat, M. C., Llasat-Botija, M., Papagiannaki, K., Pasqua, A. A., Řehoř, J., Geli, J. R., Salvati, P., Vinet, F., and Zêzere, J. L.: Flood fatalities in Europe, 1980–2018: Variability, features, and lessons to learn, Water 11, 1682, https://doi.org/10.3390/w11081682, 2019. a
Pilgrim, D. H., Chapman, T. G., and Doran, D. G.: Problems of rainfall-runoff modelling in arid and semiarid regions, Hydrolog. Sci. J., 33, 379–400, https://doi.org/10.1080/02626668809491261, 1988. a, b, c
Prein, A. F., Langhans, W., Fosser, G., Ferrone, A., Ban, N., Goergen, K., Keller, M., Tölle, M., Gutjahr, O., Feser, F., Brisson, E., Kollet, S., Schmidli, J., Van Lipzig, N. P., and Leung, R.: A review on regional convection-permitting climate modeling: Demonstrations, prospects, and challenges, Rev. Geophys., 53, 323–361, https://doi.org/10.1002/2014RG000475, 2015. a
Rinat, Y. and Armon, M.: Desert Flash Flood, 26-Apr-2018, TIB-AV-Portal, https://doi.org/10.5446/47152, 2020. a
Rinat, Y., Marra, F., Zoccatelli, D., and Morin, E.: Controls of flash flood peak discharge in Mediterranean basins and the special role of runoff-contributing areas, J. Hydrol., 565, 846–860, https://doi.org/10.1016/j.jhydrol.2018.08.055, 2018. a, b, c, d, e, f
Roberts, N.: Assessing the spatial and temporal variation in the skill of precipitation forecasts from an NWP model, Meteorol. Appl., 15, 163–169, https://doi.org/10.1002/met.57, 2008. a
Roded, R.: The geological map of Israel, 1:50,000, Sheet 19-III: Oron, Isr. Geol. Surv., Jerusalem, 1982. a
Roded, R.: The geological map of Israel, 1:50,000. Sheet 19-I: Dimona, Isr. Geol. Surv., Jerusalem, 1996. a
Sadeh, Y., Cohen, H., Maman, S., and Blumberg, D. G.: Evaluation of manning's n roughness coefficient in arid environments by using SAR backscatter, Remote Sens., 10, 1–14, https://doi.org/10.3390/rs10101505, 2018. a
Schick, A.: Hydrologic Aspects of Floods in Extreme Arid Environments, in: Flood Geomorphology, edited by: Baker, V. R., Kochel, R. C., and Patton, P. C., Wiley-Interscience, NY, USA, 189–203, 1988. a, b
Schwartz, C. S. and Sobash, R. A.: Generating Probabilistic Forecasts from Convection-Allowing Ensembles Using Neighborhood Approaches: A Review and Recommendations, Mon. Weather Rev., 145, 3379–3418, https://doi.org/10.1175/MWR-D-16-0400.1, 2017. a
Schwartz, U.: Surface and near‐surface responses to floods in a large channel (Nahal Zin) in the context of an alluvial aquifer in a hyper‐arid environment, PhD diss., Department of Geography, Hebrew University of Jerusalem, Israel, 2001. a
S.C.S: Soil Conservation Service, National engineering handbook, section 4, Hydrology, Technical Report, US Department of Agriculture, Washington DC, USA, 127 pp., 1972. a
Sempere-Torres, D., Berenguer, M., Corral, C., and Sanchez-Diezma, R.: Improvements on flow forecasting using precipitation nowcasting based in radar advection techniques: assessment of predictability and uncertainty propagation, 32nd Conference on Radar Meteorology, Albuquerque, USA, 2005. a
Sen, Z.: Wadi Hydrology, CRC Press, Boca Raton, USA, 368 pp., 2008. a, b, c
Sene, K.: Flash Floods Forecating and Warning, Springer, Dordrecht, The Netherlands, 2013. a, b, c, d, e, f, g, h
Shamir, E., Ben-Moshe, L., Ronen, A., Grodek, T., Enzel, Y., Georgakakos, K. P., and Morin, E.: Geomorphology-based index for detecting minimal flood stages in arid alluvial streams, Hydrol. Earth Syst. Sci., 17, 1021–1034, https://doi.org/10.5194/hess-17-1021-2013, 2013. a
Shammout, M., Shatanawi, M., and Nelson, J.: Curve Number Applications for Restoration the Zarqa River Basin, Sustainability, 10, 586, https://doi.org/10.3390/su10030586, 2018. a
Sharon, D.: The Spottiness of Rainfall in a Desert Area, J. Hydrol., 17, 161–175, 1972. a, b
Shmilovitz, Y., Morin, E., Rinat, Y., Haviv, I., Carmi, G., Mushkin, A., and Enzel, Y.: Linking frequency of rainstorms, runoff generation and sediment transport across hyperarid talus-pediment slopes, Earth Surf. Proc. Land., 45, 1644–1659, https://doi.org/10.1002/esp.4836, 2020. a, b, c
Simmers, I.: Understanding Water in a Dry Environment: Hydrological Processes in Arid and Semi-arid Zones, A. A. BALKEMA PUBLISHERS, Amsterdam, the Netherlands, 2003. a, b, c
Singer, A.: The soils of Israel, Springer, Berlin, Germany, 2007. a, b
Sivakumar B.: Chaos in hydrology: bridging determinism and stochasticity, Springer, the Netherlands, https://doi.org/10.1007/978-90-481-2552-4, 2017. a
Sneh, A., Bartov, Y., Weissbrod, T., and Rosensaft, M.: Geological Map of Israel, 1:200,000. Isr. Geol. Surv., 4 sheets, 1998. a
Sobash, R. A., Kain, J. S., Bright, D. R., Dean, A. R., Coniglio, M. C., and Weiss, S. J.: Probabilistic forecast guidance for severe thunderstorms based on the identification of extreme phenomena in convection-allowing model forecasts, Weather Forecast., 26, 714–728, https://doi.org/10.1175/WAF-D-10-05046.1, 2011. a
Sokol, Z. and Zacharov, P.: Nowcasting of precipitation by an NWP model using assimilation of extrapolated radar reflectivity, Q. J. Roy. Meteor. Soc., 138, 1072–1082, https://doi.org/10.1002/qj.970, 2012. a
Stephan, K., Klink, S., and Schraff, C.: Assimilation of radar-derived rain rates into the convective-scale model COSMO-DE at DWD, Q. J. Roy. Meteor. Soc., 134, 1315–1326, https://doi.org/10.1002/qj.269, 2008. a, b, c
Tarolli, P., Borga, M., Morin, E., and Delrieu, G.: Analysis of flash flood regimes in the North-Western and South-Eastern Mediterranean regions, Nat. Hazards Earth Syst. Sci., 12, 1255–1265, https://doi.org/10.5194/nhess-12-1255-2012, 2012. a, b, c
Theis, S. E., Hense, A., and Damrath, U.: Probabilistic precipitation forecasts from a deterministic model: a pragmatic approach, Meteorol. Appl., 268, 257–268, https://doi.org/10.1017/S1350482705001763, 2005. a
Tooth, S.: Process, form and change in dryland rivers: A review of recent research, Earth Sci. Rev., 51, 67–107, https://doi.org/10.1016/S0012-8252(00)00014-3, 2000. a, b
USGS: Estimating Basin Lagtime and Hydrograph-Timing Indexes Used to Characterize Stormflows, Technical Report, availabe at: http://pubs.usgs.gov/sir/2012/5110/pdf/sir2012-5110_text.pdf (last access: 10 May 2020), 2012. a
Vetter, T., Rieger, A. K., and Nicolay, A.: Disconnected runoff contributing areas: Evidence provided by ancient watershed management systems in arid north-eastern Marmarica (NW-Egypt), Geomorphology, 212, 41–57, https://doi.org/10.1016/j.geomorph.2013.10.002, 2014. a, b
Vincendon, B., Ducrocq, V., Nuissier, O., and Vié, B.: Perturbation of convection-permitting NWP forecasts for flash-flood ensemble forecasting, Nat. Hazards Earth Syst. Sci., 11, 1529–1544, https://doi.org/10.5194/nhess-11-1529-2011, 2011. a
Vinet, F., Bigot, V., Petrucci, O., Papagiannaki, K., Llasat, M. C., Kotroni, V., Boissier, L., Aceto, L., Grimalt, M., Llasat-Botija, M., Pasqua, A. A., Rossello, J., Kiliç, Ö., Kahraman, A., and Tramblay, Y.: Mapping flood-related mortality in the mediterranean basin. Results from the MEFF v2.0 DB, Water, 11, p. 2196, https://doi.org/10.3390/w11102196, 2019. a
Wagener, T., Gupta, H., Yatheendradas, S., Goodrich, D., Unkrich, C., and Schaffner, M.: Understanding sources of uncertainty in flash-flood forecasting for semi-arid regions, IAHS-AISH, 313, 204–212, 2007. a
Walters, O. M.: Transmission losses in arid region, J. Hydraul. Eng., 116, 129–138, 1990. a
Wheater, H.: Hydrological Modelling in Arid and Semi‐Arid Areas, pp 211, Cambridge Univ. Press, Cambridge, UK, 2008. a, b, c, d, e
Wilks, D. S.: Statistical Methods in the Atmospheric Sciences, J. Am. Stat. Assoc., 102, p. 380, https://doi.org/10.1198/jasa.2007.s163, 2006. a
Wittenberg, L., Kutiel, H., Greenbaum, N., and Inbar, M.: Short-term changes in the magnitude, frequency and temporal distribution of floods in the Eastern Mediterranean region during the last 45 years – Nahal Oren, Mt. Carmel, Israel, Geomorphology, 84, 181–191, https://doi.org/10.1016/j.geomorph.2006.01.046, 2007. a
Yair, A. and Kossovsky, A.: Climate and surface properties: Hydrological response of small arid and semi-arid watersheds, Geomorphology, 42, 43–57, https://doi.org/10.1016/S0169-555X(01)00072-1, 2002. a
Yair, A. and Lavee, H.: Application of the concept of partial area contribution to small arid watersheds, Z. Gemorphologie, 29, 71–82, 1981. a
Yair, A. and Raz-Yassif, N.: Hydrological processes in a small arid catchment: Scale effects of rainfall and slope length, Geomorphology, 61, 155–169, https://doi.org/10.1016/j.geomorph.2003.12.003, 2004. a, b
Yair, A., Sharon, D., and Lavee, H.: Trends in runoff and erosion processes over an arid limestone hillside, northern negev, israel, Hydrol. Sci. Bull., 25, 243–255, https://doi.org/10.1080/02626668009491932, 1980. a
Yakir, H. and Morin, E.: Hydrologic response of a semi-arid watershed to spatial and temporal characteristics of convective rain cells, Hydrol. Earth Syst. Sci., 15, 393–404, https://doi.org/10.5194/hess-15-393-2011, 2011. a, b, c
Yang, L., Smith, J., Baeck, M. L., Morin, E., and Goodrich, D. C.: Flash Flooding in Arid/Semiarid Regions: Dissecting the Hydrometeorology and Hydrology of the 19 August 2014 Storm and Flood Hydroclimatology in Arizona, J. Hydrometeorol., 18, 3103–3123, https://doi.org/10.1175/jhm-d-17-0089.1, 2017. a, b
Yechieli, Y., Elron, E., and Sneh, A.: The geological map of Israel, 1:50,000, Sheet 19-IV,20-III: NeotHakikar, Isr. Geol. Surv., Jerusalem, 1994. a
Zilberman, E. and Avni, Y.,: The geological map of Israel, 1:50,000, Sheet 21-II: MizpeRamon, Isr. Geol. Surv., Jerusalem, 2004. a
Zoccatelli, D., Marra, F., Armon, M., Rinat, Y., Smith, J. A., and Morin, E.: Contrasting rainfall-runoff characteristics of floods in desert and Mediterranean basins, Hydrol. Earth Syst. Sci., 23, 2665–2678, https://doi.org/10.5194/hess-23-2665-2019, 2019. a, b, c, d
Zoccatelli, D., Marra, F., Smith, J., Goodrich, D., Unkrich, C., Rosensaft, M., and Morin, E.: Hydrological modelling in desert areas of the eastern Mediterranean, J. Hydrol., 587, 124879, https://doi.org/10.1016/j.jhydrol.2020.124879, 2020. a, b
Zorzetto, E., Botter, G., and Marani, M.: On the emergence of rainfall extremes from ordinary events, Geophys. Res. Lett., 43, 8076–8082, https://doi.org/10.1002/2016GL069445, 2016. a
- Abstract
- Introduction
- Study area and data
- Rainstorm analysis
- Hydrological analysis
- Evaluation of flash-flood forecast
- Discussion
- Conclusions
- Appendix A: GB-HYDRA application
- Data availability
- Video supplement
- Author contributions
- Competing interests
- Acknowledgements
- Financial support
- Review statement
- References