the Creative Commons Attribution 4.0 License.
the Creative Commons Attribution 4.0 License.
 | 22 Feb 2021
Timescales of emergence of chronic flooding in the major economic center of Guadeloupe
Déborah Idier
Marcello de Michele
Yoann Legendre
Manuel Moisan
Rodrigo Pedreros
Rémi Thiéblemont
Giorgio Spada
Daniel Raucoules
Ywenn de la Torre
Sea-level rise due to anthropogenic climate change is projected not only to exacerbate extreme events such as cyclones and storms but also to cause more frequent chronic flooding occurring at high tides under calm weather conditions. Chronic flooding occasionally takes place today in the low-lying areas of the Petit Cul-de-sac marin (Guadeloupe, West Indies, French Antilles). This area includes critical industrial and harbor and major economic infrastructures for the islands. As sea level rises, concerns are growing regarding the possibility of repeated chronic flooding events, which would alter the operations at these critical coastal infrastructures without appropriate adaptation. Here, we use information on past and future sea levels, vertical ground motion, and tides to assess times of emergence of chronic flooding in the Petit Cul-de-sac marin. For RCP8.5 (Representative Concentration Pathway 8.5; i.e., continued growth of greenhouse gas emissions), the number of flood days is projected to increase rapidly after the emergence of the process so that coastal sites will be flooded 180 d a year within 2 decades of the onset of chronic flooding. For coastal locations with the lowest altitude, we show that the reconstructed number of floods is consistent with observations known from a previous survey. Vertical ground motions are a key source of uncertainty in our projections. Yet, our satellite interferometric synthetic-aperture radar results show that the local variability in this subsidence is smaller than the uncertainties in the technique, which we estimate to be between 1 (standard deviation of measurements) and 5 mm/yr (upper theoretical bound). Despite these uncertainties, our results imply that adaptation pathways considering a rapid increase in recurrent chronic flooding are required for the critical port and industrial and commercial center of Guadeloupe. Similar processes are expected to take place in many low-elevation coastal zones worldwide, including on other tropical islands. The method used in this study can be applied to other locations, provided tide gauge records and local knowledge of vertical ground motions are available. We argue that identifying times of emergence of chronic flooding events is urgently needed in most low-lying coastal areas, because adaptation requires decades to be implemented, whereas chronic flooding hazards can worsen drastically within years of the first event being observed.
- Article
(15423 KB) - Full-text XML
-
Supplement
(61 KB) - BibTeX
- EndNote


Chronic flooding is defined as flooding occurring at high tides under calm weather conditions (Ezer and Atkinson, 2014; Sweet and Park, 2014; Moftakhari et al., 2015; Moftakhari et al., 2017; Dahl et al., 2017). For 30 years, reports from the Intergovernmental Panel on Climate Change (IPCC) have shown that mean sea level is rising due to anthropogenic climate warming and that sea levels will continue rising in the future (Church et al., 2013a; Garner et al., 2018; Oppenheimer et al., 2019). Therefore, risks of chronic flooding are expected to rise in an increasing number of locations in the future, including embankments in harbors, cities and settlements in sheltered areas, and other regions where extreme events are rare enough to justify low protection levels (Stephens et al., 2018). Chronic flooding is already happening now: for example, an acceleration in chronic flooding has already affected coastal communities and transportation systems on the US eastern coast (Sweet and Park, 2014; Jacobs et al., 2018). There, the observed trends and acceleration of chronic flooding events are consistent with observed increases in mean sea levels (Sweet and Park, 2014). Among coastal impacts of sea-level rise, risks of chronic flooding require the most immediate adaptation response, in particular in terms of coastal-defense upgrades and water network management (Le Cozannet et al., 2017). Today, the topic is becoming even more urgent due to the observed acceleration of sea-level rise caused by the onset of Greenland and Antarctica ice-sheet melting (Dangendorf et al., 2017; Dieng et al., 2017; Chen et al., 2017).
Despite the relative urgency of the topic, there is still little awareness regarding chronic flooding and the potential impacts in a number of regions. Global assessments available today tend to focus on extreme events exacerbated by sea-level rise, without evaluating the significance of chronic flooding (Oppenheimer et al., 2019). Studies raising awareness on chronic flooding are mostly local and often focus on temperate areas such as the USA and New Zealand (Sweet and Park, 2014; Moftakhari et al., 2017; Dahl et al., 2017; Stephens et al., 2018). However, chronic flooding is also a significant matter of concern on tropical islands, because their low-lying areas are critical for human activities such as trade, transport and housing (Kumar and Taylor, 2015).
Here we focus on a tropical archipelago, Guadeloupe, located in the Lesser Antilles in the eastern Caribbean. Guadeloupe is among the small-island regions where current flooding risks are primarily associated with the seasonal occurrence of tropical cyclones (Krien et al., 2015; Rueda et al., 2017). Guadeloupe presents a complex and steep topography due to its volcanic origin. Critical infrastructure is located in coastal low-lying areas, in particular in the former mangroves of Petit Cul-de-sac marin, with the cities of Pointe-à-Pitre and Baie-Mahault, which include a power plant, port, and airport facilities and commercial areas (Bourdon and Chiozzotto, 2012). This high exposure to coastal hazards in a low-lying area is typically representative of the current situation on many inhabited high islands in tropical regions (Nurse et al., 2014). Bourdon and Chiozzotto (2012) reported chronic flooding events as well as damage to concrete infrastructures due to salinization of groundwater. Yet, neither the link with climate-induced sea-level changes nor the timescales of emergence of recurrent chronic flooding have been characterized so far, with more attention being given to extreme events such as cyclones and tsunamis (Pedreros et al., 2007; Krien et al., 2015; Jevrejeva et al., 2020). For critical infrastructures, the current frequency of chronic flooding is not yet affecting activities. Yet, this could be different in the future as sea level rises.
In this contribution, we aim to characterize the timescales of emergence of chronic flooding in the area of the Petit Cul-de-sac marin, which is a hotspot for systemic vulnerability in Guadeloupe (Fig. 1, Sect. 2). To do so, we quantify the different phenomena causing present and future relative mean sea-level changes, as well as the high-water levels resulting from tides, surges and mean sea-level fluctuations induced by regional circulations, excluding cyclone events (Sect. 3). In Sect. 4, we present the projected timescales of emergence of recurrent chronic flooding for different scenarios and coastal settings. These results come with residual uncertainties, which are discussed in Sect. 5, together with the significance of our results for the attribution of chronic flooding events and for coastal management. Overall, our results illustrate that the question of chronic flooding should deserve some attention on tropical islands concerned with adapting to the future effects of sea-level rise.
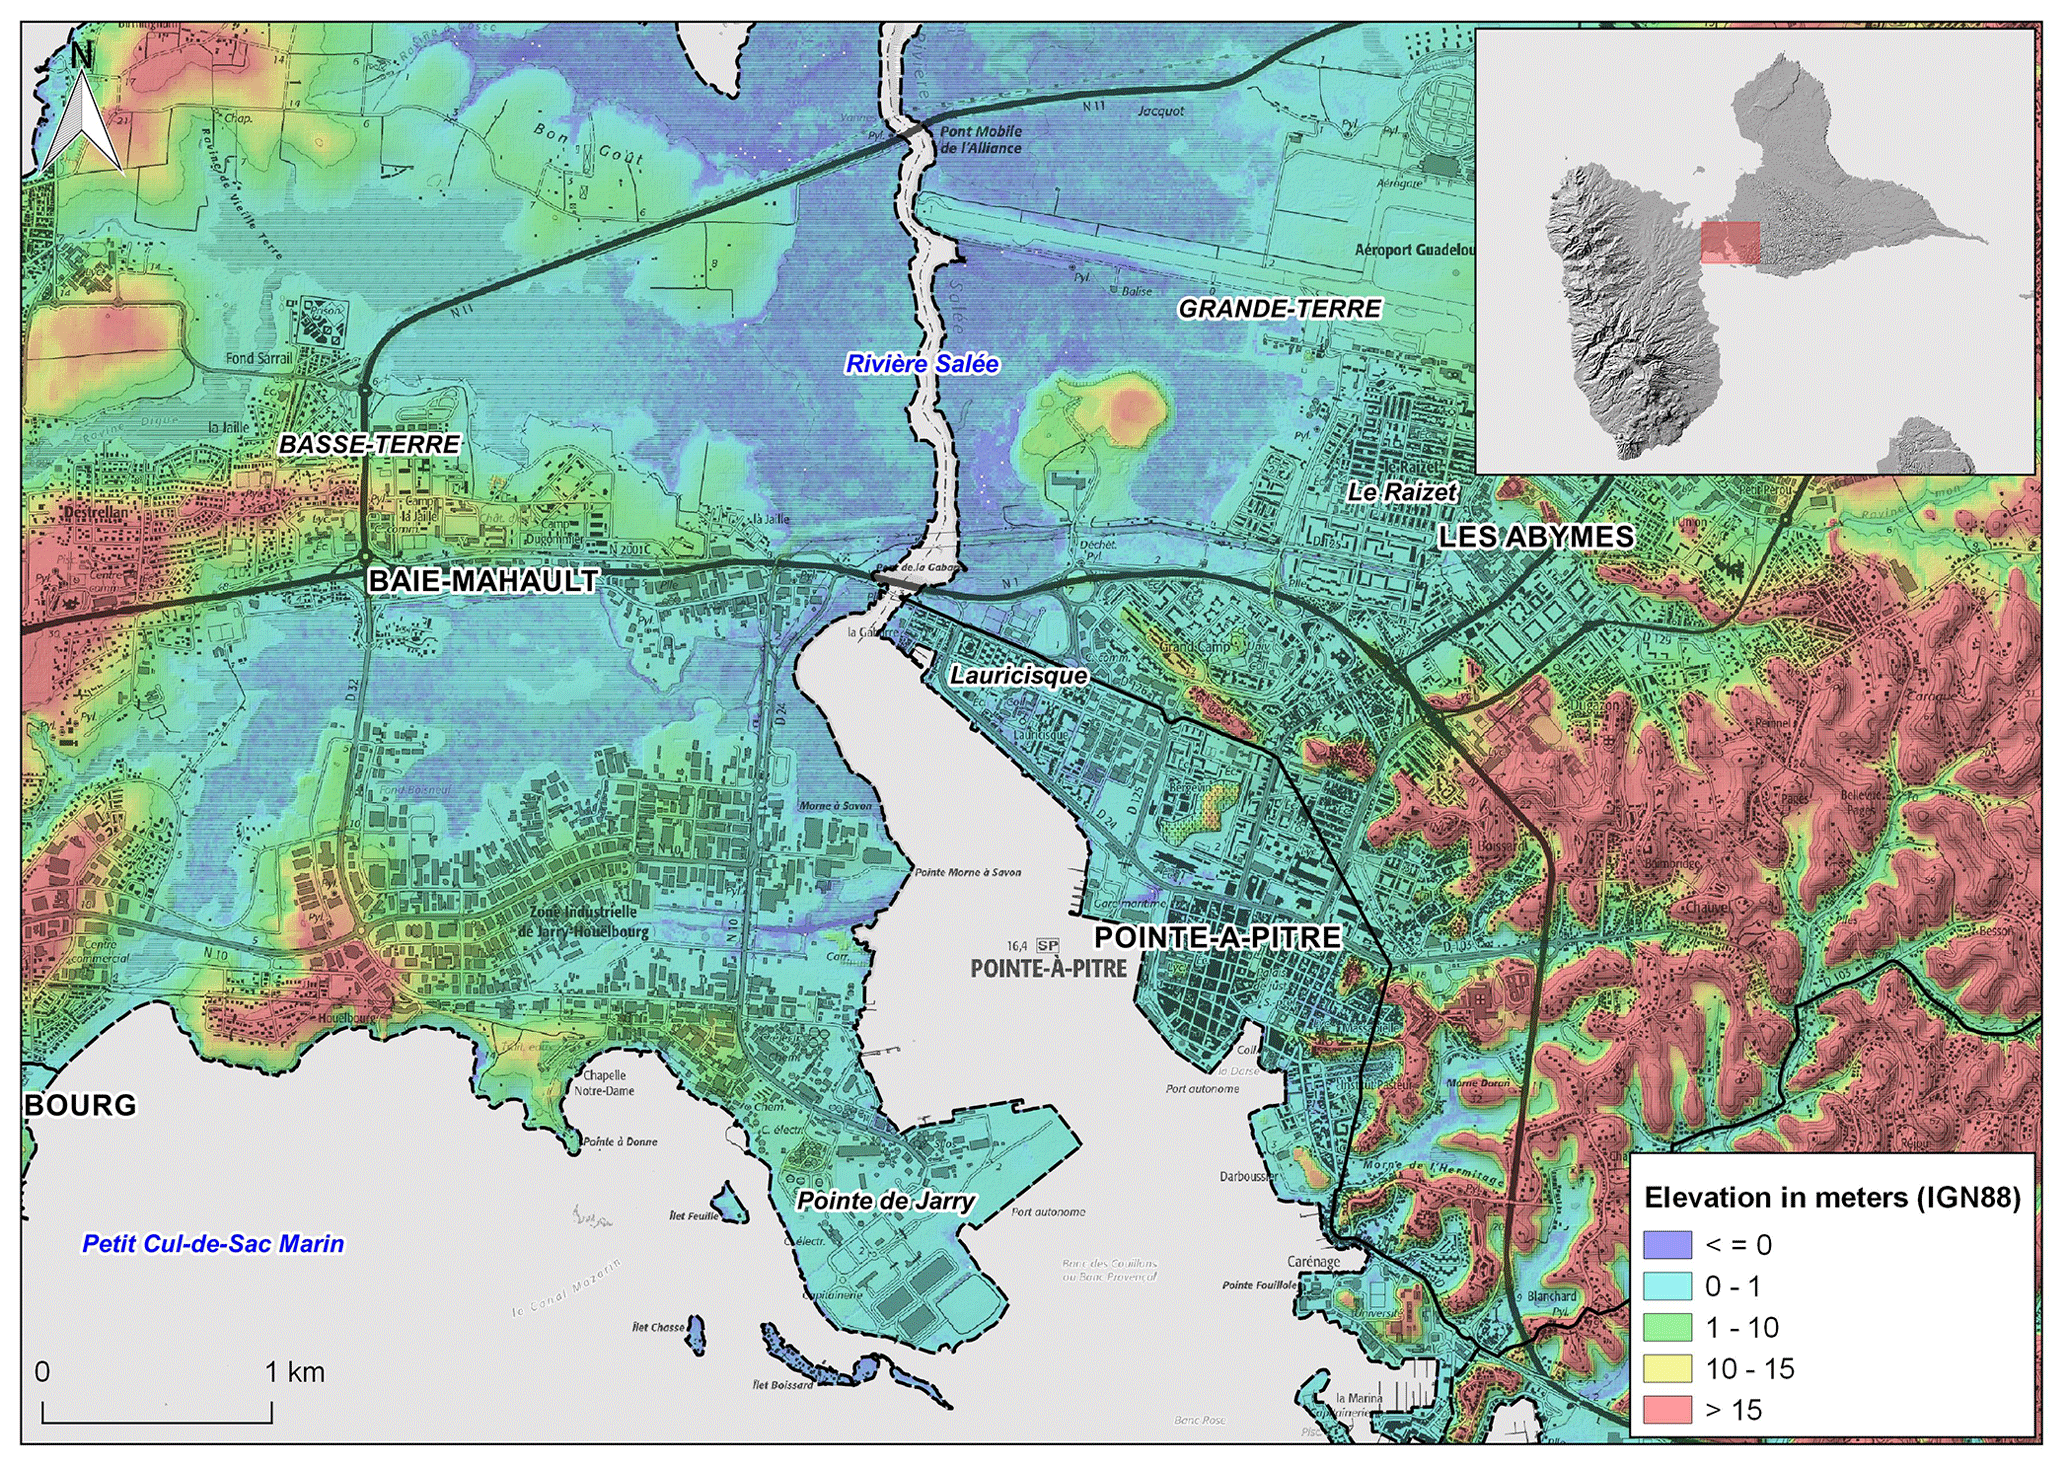
Figure 1The Petit Cul-de-sac marin area in Guadeloupe, showing urbanized areas and altitudes (map created by BRGM; data: IGN, SHOM; © BRGM, IGN, SHOM).
This study focuses on the coasts of the Petit Cul-de-sac marin, a large low-lying area located at the junction of Basse-Terre and Grande-Terre, the two main islands of Guadeloupe, which are separated by a tight channel, the Rivière Salée (Fig. 1). This sheltered coastal area is characterized by large mangrove areas, a reef barrier and active sedimentation processes. The area is recognized as being highly exposed to marine flooding due to cyclones and tsunamis (Pedreros et al., 2007, 2016). Yet, chronic flooding has received less attention so far, despite the fact that previous studies have extensively inventoried the most vulnerable sites with respect to this process.
The low-lying areas of the Petit Cul-de-sac marin have been intensively urbanized over the last century. The major assets at risk include the following:
-
the industrial zone of Jarry (Baie-Mahault), located on the east side of the island of Basse-Terre; this area includes harbor, industrial, energy production, commercial and storage facilities, which collectively constitute the major economic center of Guadeloupe;
-
the landing area of the international airport in Guadeloupe (Les Abymes);
-
the historical center of the city of Pointe-à-Pitre; this area includes residential buildings and the main ferry terminal of Guadeloupe;
-
other residential buildings in the northern districts of the Pointe-à-Pitre area (Lauricisque and Le Raizet, Fig. 1).
Mangrove areas have been largely reduced due to urbanization since the 1950s (Fig. 2). In addition, 85 ha of land have been reclaimed from the sea to facilitate harbor activities (Roques et al., 2010). Land reclamation projects are still being investigated to further support the development of the port of Guadeloupe.
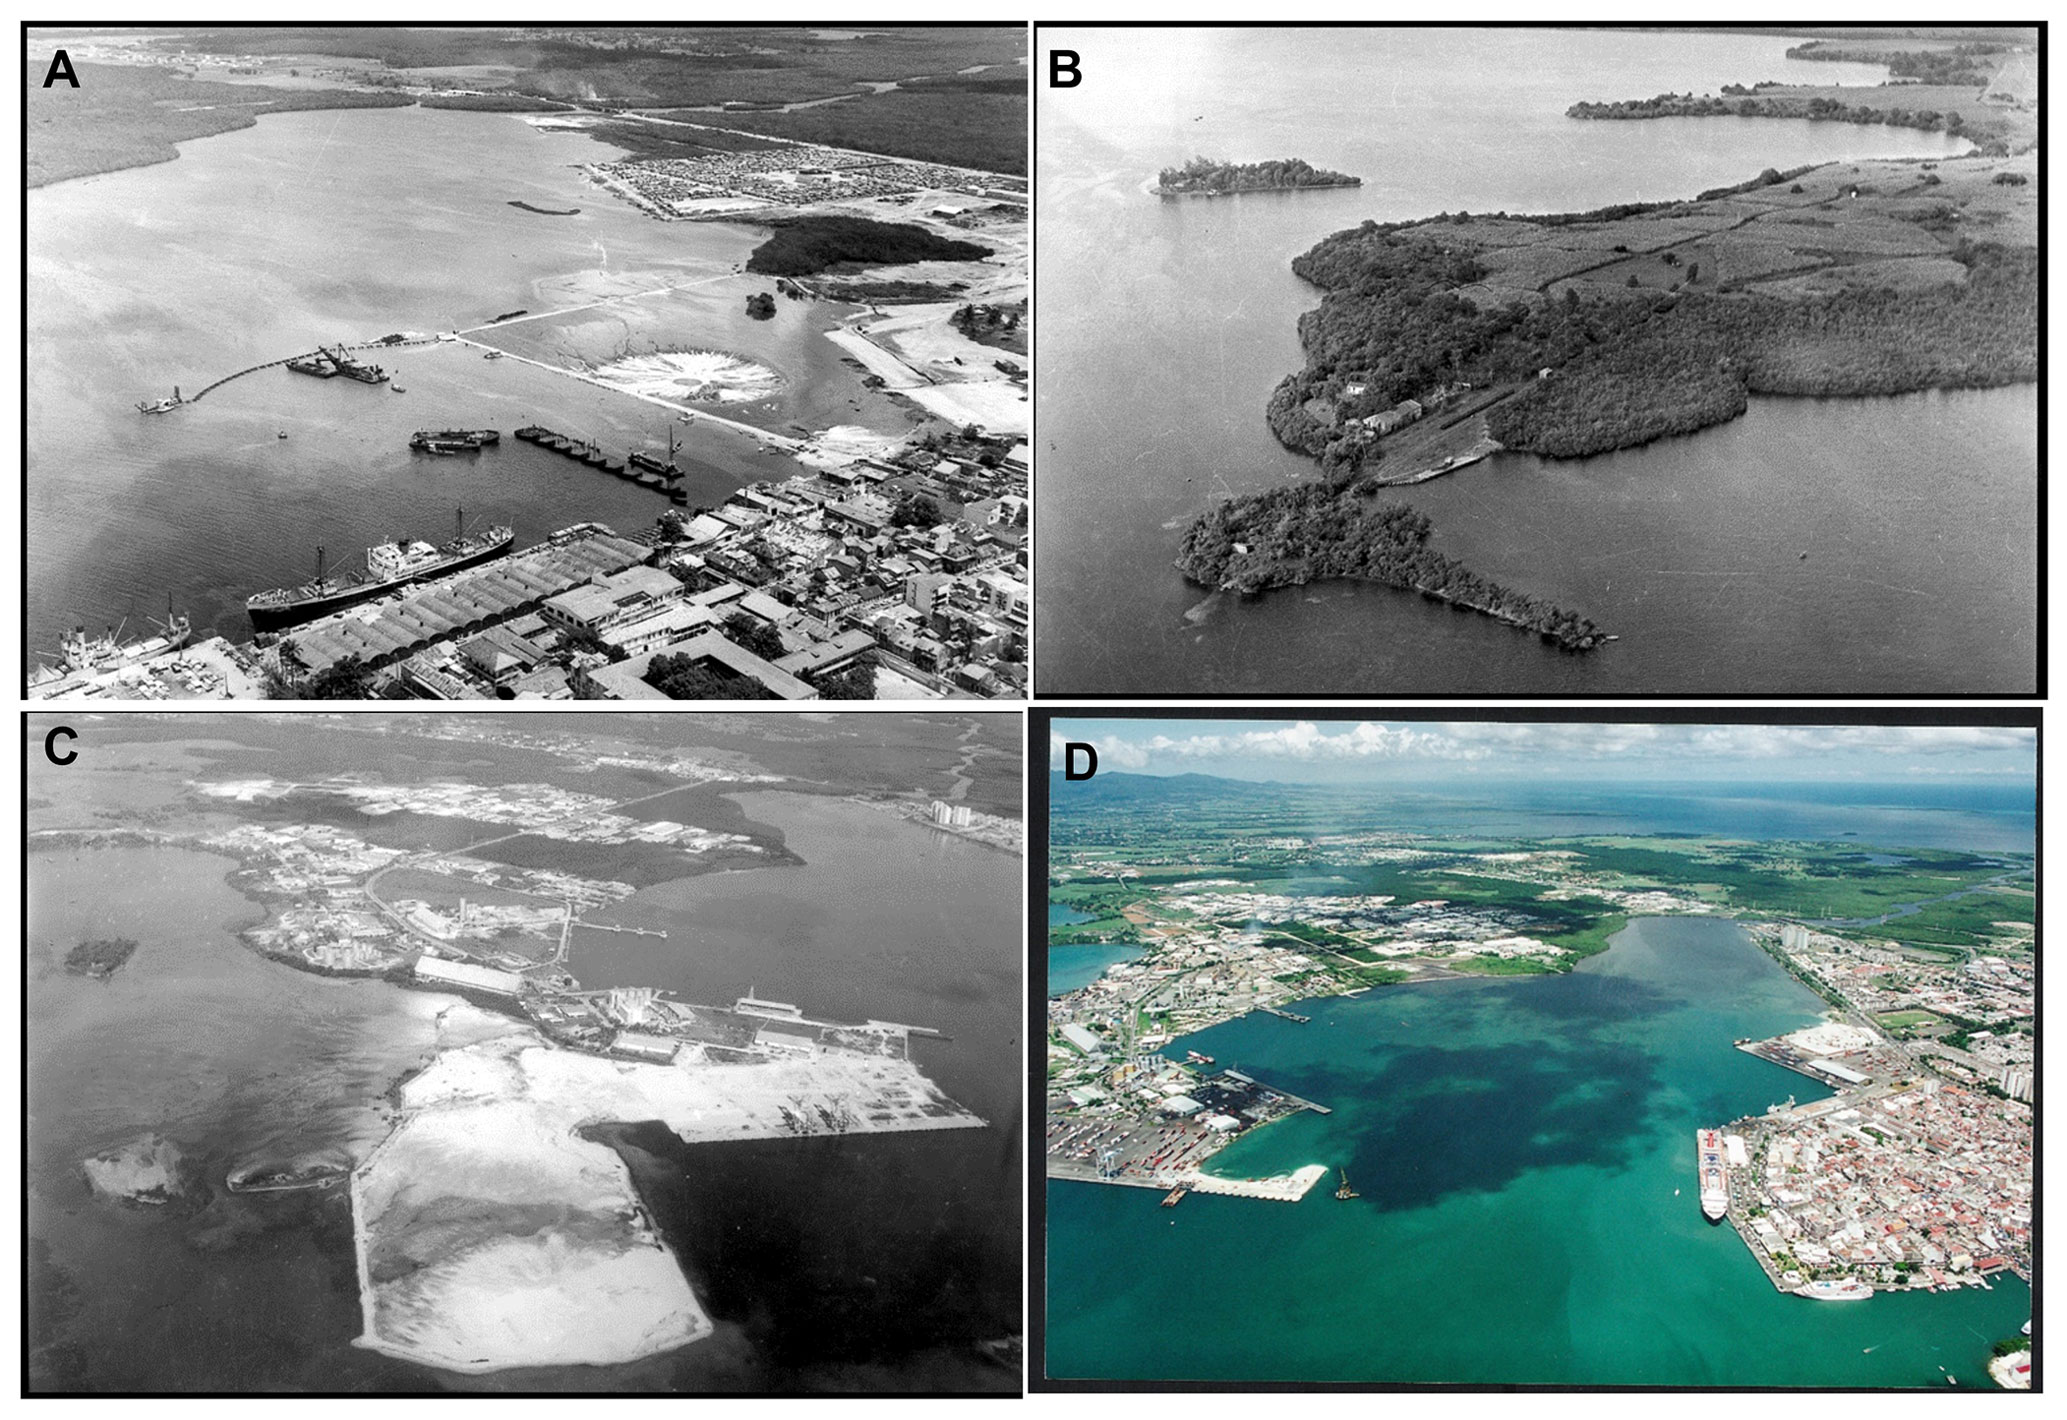
Figure 2Urbanization of the Petit Cul-de-sac marin area since 1960 (source: CPMG). (a) Construction of Bergevin embankments in Pointe-à-Pitre in 1960, involving 20 ha of land reclamation; (b) Jarry before harbor development in 1964; (c) land reclamation in Jarry in 1970; (d) Jarry and Pointe à Pitre in the 1990s.
Surveys have shown that the highest water levels are extending in the area of the Petit Cul-de-sac marin (Bourdon and Chiozzotto, 2012): more frequent chronic flooding is reported by interviewees in some of the reclaimed areas, and some local areas seem more often saturated with water. This perception of rising coastal water levels is confirmed by observations, such as soil compaction affecting roads built on former mangroves, which could be due to higher groundwater levels reducing the load-bearing capacity of the backfill according to Bourdon and Chiozzotto (2012). Other signs of rising coastal water levels include damage to concrete infrastructures due to the salinization of groundwater, the chronic flooding of the lowest zones, the destabilization of some structure foundations and damage to the sewage system. Yet, some of these impacts can also be caused by heavy rain (Pedreros et al., 2016).
Fieldwork undertaken by Bourdon and Chiozzotto (2012) has allowed for mapping the most vulnerable hotspots for chronic flooding in the Petit Cul-de-sac marin area (Fig. 1). These include the following:
-
land area located close to the Rivière Salée, the saltwater channel located between the two islands
-
mangrove areas located between Gabarre and Le Raizet (Pointe-à-Pitre)
-
the international airport landing area (Les Abymes)
-
a large part of the districts of Lauricisque and Bergevin (Pointe-à-Pitre) and some areas at Grand-Camp (Les Abymes)
-
areas bounding Morne à Savon close to Jarry (Baie-Mahault)
-
a large part of the port embankments in Jarry (Baie-Mahault).
Hence, the observations and surveys above suggest that relative sea-level rise is causing chronic flooding and other damage in Petit Cul-de-sac marin and in particular in Jarry (Baie-Mahault) and the Pointe-à-Pitre area. This is of major significance for the region, due to the critical economic role of this area for the entire Guadeloupean archipelago.
3.1 From global to regional sea-level rise
Contemporary global sea-level rise is due to ocean thermal expansion, the melting of mountain glaciers and ice sheets, and contributions from land water (Stammer et al., 2013). Yet, regional sea-level changes in the Caribbean differ from the global mean due to (1) sterodynamic sea-level changes due to changes in the ocean density and circulation and inverse barometer effects and (2) the changes in Earth's gravitation, rotation and elastic response associated with current ice or water mass redistributions, as well as the viscoelastic response of the solid Earth to the last deglaciation (glacial isostatic adjustment, GIA) (Gregory et al., 2019). In this subsection, we detail the data and methods used for evaluating past and future sea-level changes in Guadeloupe.
3.1.1 Past sea-level changes
The longest tidal record in Guadeloupe is short (19 years), which prevents us from making a thorough characterization of past sea-level change in this region. To complete these data, we use sea-level reconstructions from 1950 to 2010 of Meyssignac et al. (2012), which have been extensively analyzed in the Caribbean (Palanisamy et al., 2012). Sea-level reconstructions use long (but pointwise) sea-level change records from tide gauges with information from satellite altimetry or ocean dynamic models to provide spatial maps of sea-level trends and variability (Meyssignac et al., 2012). While sea-level reconstructions have limitations due to the lack of long-term in situ sea-level records for validation in some regions, those from Meyssignac et al. (2012) perform best at representing past sea-level changes and variability and therefore represent the state of the art in this area (Carson et al., 2017). They use the spatial patterns observed in the altimetry era on the one hand and those obtained from two ocean models SODA and DRAKKAR on the other hand, thus resulting in three reconstructions, referred to as “Altimetry”, “Drakkar” and “Soda” hereafter.
3.1.2 Future sea-level changes – likely range
We consider a sea-level scenario based on RCP8.5 (Representative Concentration Pathway 8.5), which assumes either an increase in greenhouse gas emissions over the remaining decades of the 21st century (Riahi et al., 2017) or significant carbon emissions from the permafrost (Meredith et al., 2019). We do not consider other climate change scenarios such as RCP4.5 or RCP2.6, because they imply that all critical infrastructures related to energy and transport will undergo a major transformation over the next decade (Rockström et al., 2017). Yet, there is no strong signal that such a transformation is being initiated (Nachmany and Mangan, 2018). Furthermore, we do not know how future energy and transportation infrastructures will look after such a transformation. This makes any assessment of their vulnerability highly speculative.
Sea-level projections from the fifth report of the International Panel of Climate Change (IPCC AR5) (Church et al., 2013a) are available from the Integrated Climate Data Center of the University of Hamburg (http://icdc.cen.uni-hamburg.de/, last access: 11 February 2021) (Carson et al., 2016). Yet, the Antarctic contribution has been updated in the recent IPCC Special Report on the Ocean and Cryosphere in a Changing Climate (SROCC). These projections superimpose the regional effects of each component of future sea-level rise (Slangen et al., 2012, 2014; Gregory et al., 2019), that is, sterodynamic effects, the melting of mountain glaciers and ice sheets, the contribution of land water, and GIA. These projections do not include potential additional local vertical ground motion (subsidence or uplift) due to regional to local natural or anthropogenic effects, which we evaluate in Sects. 3.2 and 4.2 below. For the sterodynamic effects, we use the same climate models as in the IPCC AR5 and SROCC reports, excluding the MIROC-ESM and MIROC-ESM-CHEM climate models, which are outliers in this region. For all other components, we use the median and likely projections of the latest SROCC report (Oppenheimer et al., 2019) and compute the regional effects in Guadeloupe using the regionalization method of Slangen et al. (2012) using fingerprints for mass contributions.
3.1.3 Future sea-level changes – high-end scenario
According to the SROCC, there remains a probability of 33 % for sea-level rise to lie outside the likely range. As the low bound of the likely range can be considered a minimum sea-level commitment (Le Cozannet et al., 2019), most of the discussion is focused on high-end scenarios, defined as unlikely but possible scenarios above the likely range (Stammer et al., 2019). The largest risks of exceeding the IPCC likely range are related to the melting of ice sheets in Antarctica and Greenland, which involve processes that are not yet fully understood (Furst et al., 2015; DeConto and Pollard, 2016; Hanna et al., 2018; Pattyn, 2018; Edwards et al., 2019; Oppenheimer et al., 2019). Today, high-end scenarios are increasingly considered relevant for the most risk-averse users (Nicholls et al., 2014; Hinkel et al., 2015; Hinkel et al., 2019), such as for the port, industrial and commercial facilities of our case study.
So far, IPCC authors have refused to provide projections beyond the likely range, considering that existing results are not robust enough (Church et al., 2013b). Yet, since the AR5, other studies have proposed high-end scenarios (Jackson and Jevrejeva, 2016; Le Bars et al., 2017; Kopp et al., 2017; Thiéblemont et al., 2019). Here, we use the global assumptions of Thiéblemont et al. (2019) (their “high-end B”), which follow a “worst-model” approach, that is, not necessarily the upper limit to sea-level rise but a set of upper values available from the literature (Table 1). As high-end projections of each sea-level component provided in Thiéblemont et al. (2019) are estimated for the year 2100 only, we produce annual time series over the 21st century by fitting a spline function to interpolate between the recent past (2007–2020 period) and 2100. Then, we regionalize these values following again the well-established approach of Slangen et al. (2012).
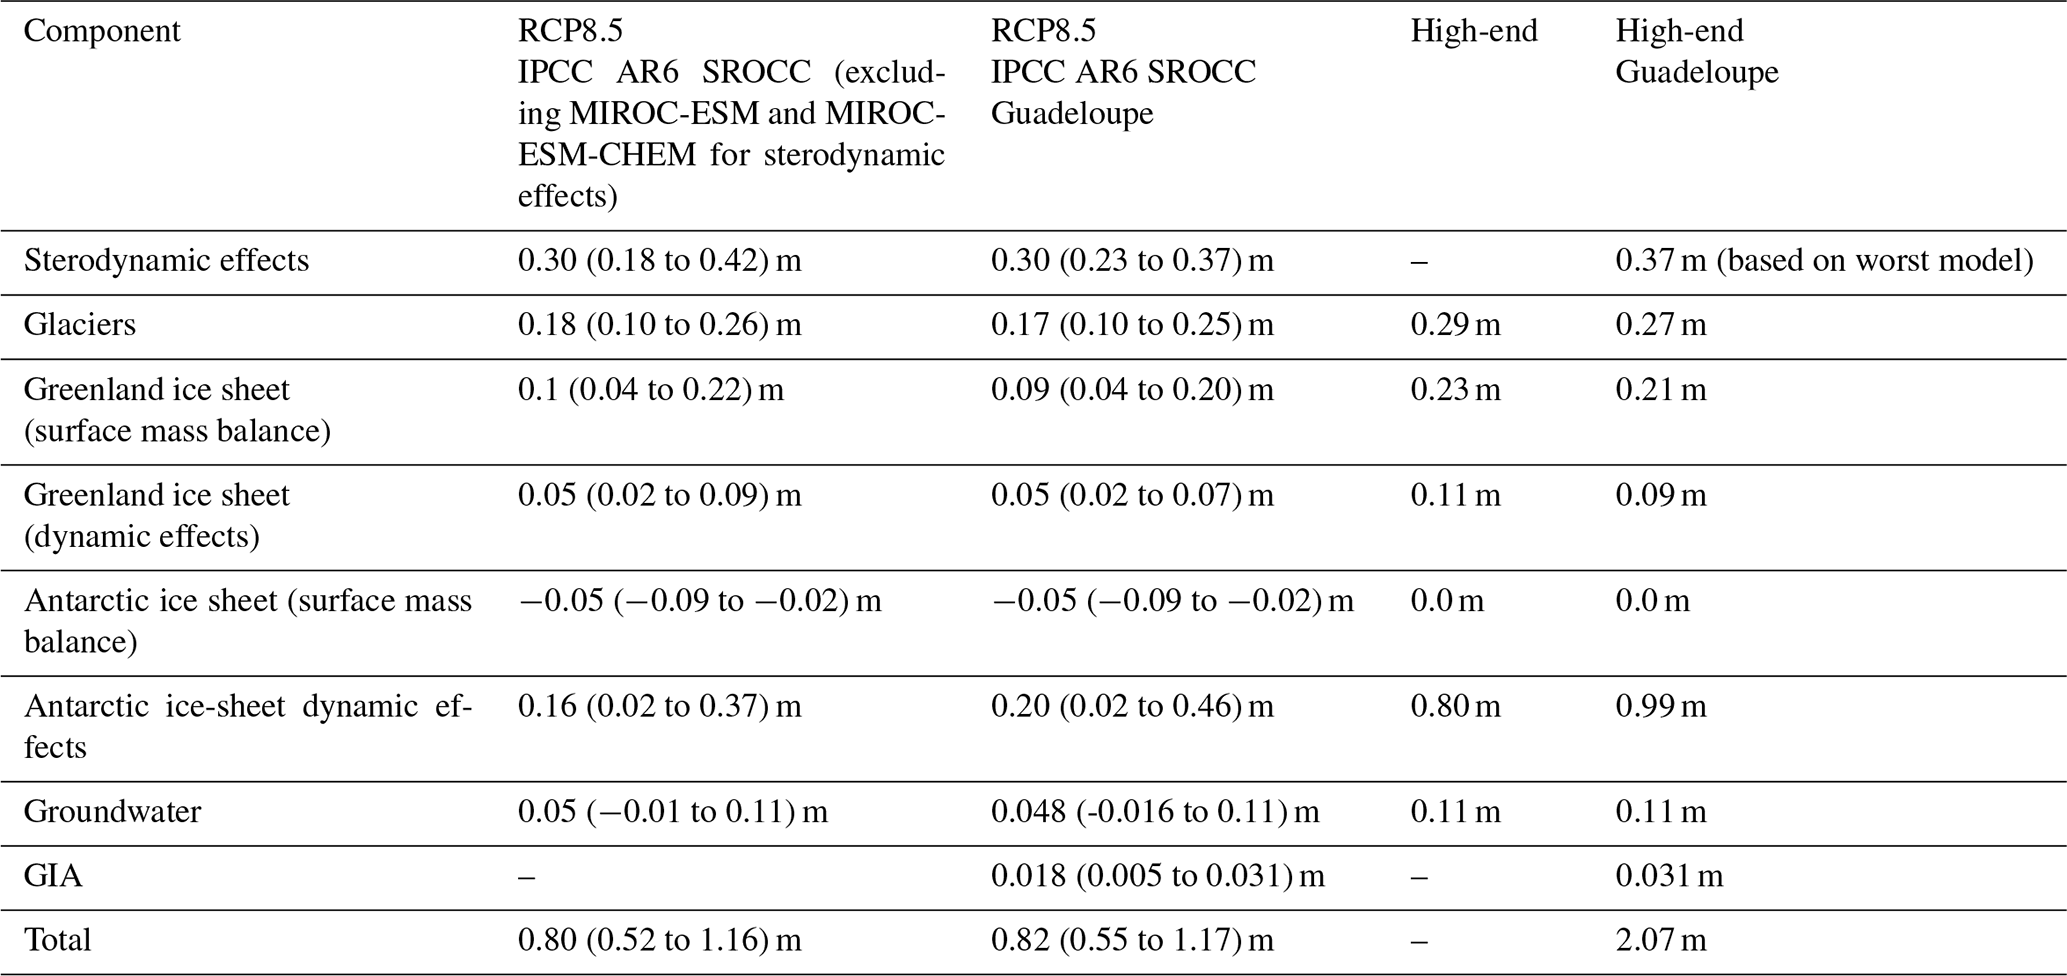
Table 1Assumptions for global mean contributions to sea-level changes by 2100 relative to 1986–2005 for the AR6 SROCC median and likely range (in parentheses) and for our high-end scenario and its implications in Guadeloupe. (See Thiéblemont et al., 2019). Note: the likely range of the sum is not equal to the sum of the likely range due to dependencies between components (Church et al., 2013a; Le Bars, 2018). We extract Guadeloupe data at the following coordinates: 16∘ N, 61∘ W. The computation of the total uses the same dependency schemes as the regional approach of Church et al. (2013a), which, together with the choice to remove MIROC-ESM and MIROC-ESM-CHEM models, accounts for differences with the data published in SROCC (Oppenheimer et al., 2019).
3.2 Regional and local vertical ground motion
Relative sea-level changes at the coast may be affected by regional and local vertical ground motion (Raucoules et al., 2013; Woppelmann and Marcos, 2016; Martinez-Asensio et al., 2019). In the context of this study, regional vertical ground motion may be due to regional tectonic processes, whereas a local subsidence could be caused by changes in the water content of reclaimed ground, causing sediment compaction.
3.2.1 Regional vertical ground motion
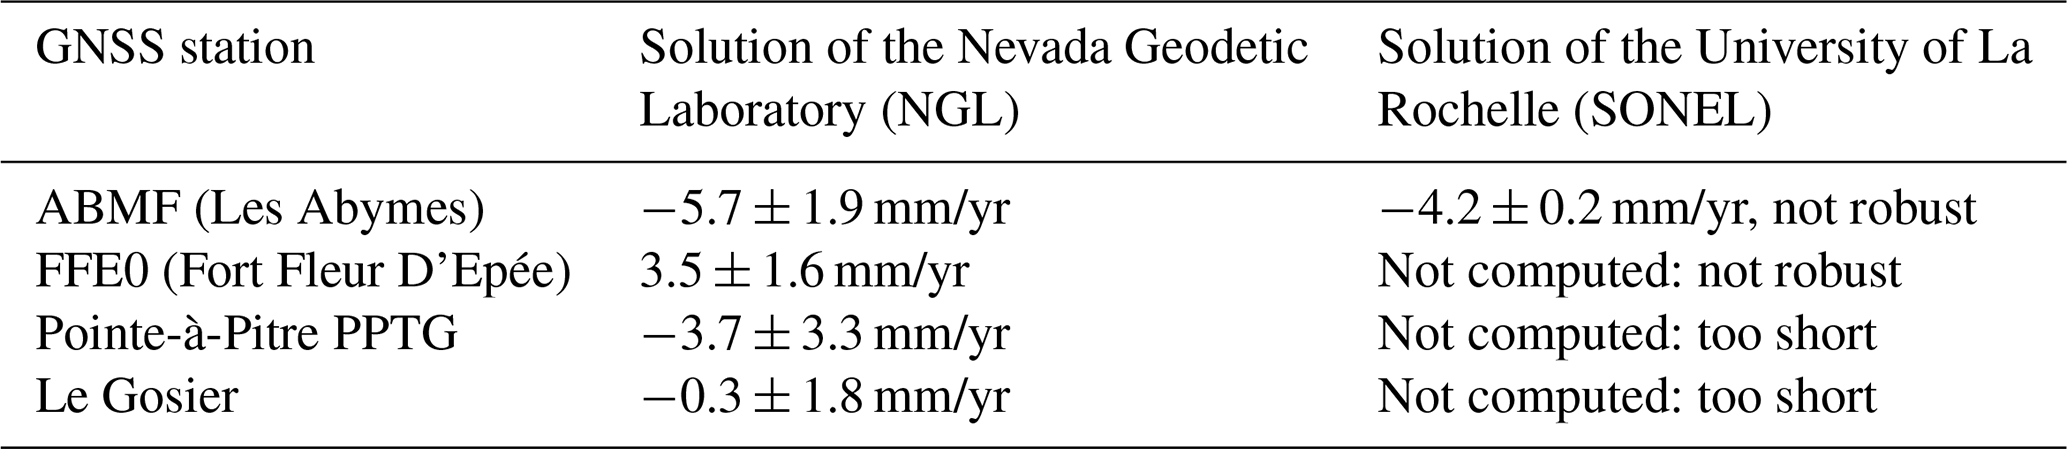
We use different lines of evidence to characterize regional vertical ground motion taking place at the scale of the island. The first sources of information available are measurements from four permanent Global Navigation Satellite System (GNSS) stations located close to Jarry (Baie-Mahault) (Table 2, Fig. 4). For each of these stations, we use two solutions from the Nevada Geodetic Laboratory and from SONEL (https://www.sonel.org/, last access: 11 February 2021) to evaluate potential subsidence or uplift trends at these stations (Santamaria-Gomez et al., 2017; Blewitt et al., 2018). Other GNSS stations are available, but they are not considered here either because their data times series are too short (e.g., north Grande-Terre) or because they are too close to the crater of the active volcano of La Soufrière of Guadeloupe, on the southern part of the western island (Basse-Terre).
Table 2Trends obtained from the two GNSS stations located close to Jarry.
The second source of information is sea-level time series at the tide gauge of Pointe-à-Pitre. This information can be used to further evaluate vertical ground motion, either by combining it with regional sea-level trends from satellite altimetry (Cazenave et al., 1999) or by analyzing the different modes of spatial and temporal variability in sea-level time series (Kopp, 2013). The first technique comes with large uncertainties (Ablain et al., 2015; Le Cozannet et al., 2015; Woppelmann and Marcos, 2016). Yet, it can still be useful to identify or reject very fast coastal vertical ground motion, on the order of centimeters per year, as shown for example in the case of Manila in the Philippines (Santamaria-Gomez et al., 2012; Raucoules et al., 2013).
Observations of vertical ground motion with GNSS stations include the effects of the GIA, which are also included in regional sea-level-rise projections discussed in Sect. 3.1.
Overall, the tide gauge measurements are short-term (19 years; see Sect. 3.3) and the GNSS data include discontinuities, perhaps due to instrumentation changes or earthquakes. Hence, we do not expect to obtain a single reliable assessment, but instead, we use these lines of evidence to design contrasting scenarios for future vertical ground motion.
3.2.2 Local vertical ground motion
To characterize local vertical ground motion, we use synthetic-aperture radar (SAR) interferometry. This technique has increasingly been used in various fields of Earth sciences since the 1990s to measure and detect the deformation of the ground surface (Gabriel et al., 1989; Massonnet et al., 1993). The SAR is an active system, which sends out its own source of illumination, emitting waves in the microwave field of the electromagnetic spectrum. A first antenna emits a signal (wave beam), which is then recorded by another or the same antenna after its backscattering on the Earth's surface. As the atmosphere and the clouds are almost transparent in this range of wavelengths, the SAR instruments can acquire images in the day and at night, regardless of the meteorological conditions. The possibility of a continuous illumination of the radar and the orbital characteristics of the satellites makes it possible to distinguish two geometric configurations for the acquisitions: the so-called “descending” orbits, during which the satellite moves approximately from the northeast to the southwest, and “ascending” orbits, during which the satellite moves from southeast to northwest.
In this study, we used 34 images of the Advanced Synthetic Aperture Radar (ASAR) sensor of the European Envisat satellite acquired between 19 January 2003 and 10 January 2010. The images belong to track/frame in an ascending orbit (de Michele, 2010). All possible interferometric couples are calculated from 34 SAR data. We keep only the differential interferograms characterized by a short perpendicular baseline, which determines the sensitivity of the signal to the topography and impacts the interferograms' quality due to geometric decorrelation. Thus, we will intrinsically use the interferograms that are not (or little) affected by the topography. We set the threshold of perpendicular baselines to 150 m. Thus, 65 differential interferograms with the short baseline are calculated.
To exploit the entire interferometric SAR (InSAR) database, we use a processing method known as the small baseline subset or SBAS (Berardino et al., 2002). This method, developed by Usai et al. (2003), is implemented in the GAMMA tool chain (from Gamma Remote Sensing AG) under the name of multi-baseline (Wegmüller et al., 2009). As a result, we produce a map of linear velocities, measured along the line of sight of the satellite, that is, making an angle of 23∘ on the vertical.
3.3 Total water levels causing chronic flooding
We compute the daily high water levels (one value per day) using the hourly water level measurements of a tide gauge located at Pointe-à-Pitre (tide gauge location is 16.2244∘ N, 61.5315∘ W; https://doi.org/10.17183/REFMAR#125). These measurements are provided by the French Naval Hydrographic and Oceanographic Service (SHOM) and available in the Refmar database (https://data.shom.fr/, last access: 11 February 2021). In June 2017, these data covered about 19 years of useful data, starting on 4 January 1983. The observed tidal signal includes effects of the following phenomena: tides (tidal range up to about 0.40 m); mean sea-level seasonal variations related to oceanic circulations (ranging between about 0.1 and 0.3 m depending on the years); and storm surges, caused by either tropical storms or cyclones. Here we aim to characterize the highest water levels per day, relative to mean sea level and representative of moderate conditions, that is, excluding effects of cyclone events. To do so, we proceed as follows: after a quality check and cleaning of the data, we identify 20 cyclones over the study period, representing 106 d, using IBTrACS data (Knapp et al., 2010), together with Météo-France information. Data from these days are removed from our datasets. Then, we keep only the years with a completeness of 90 %, in order to properly account for mean sea-level seasonal variations. We also keep only days with no gaps in order to properly account for the tide fluctuations in the distribution. The final dataset covers 16 years (1983, 1991 to 1997, 2006, 2007, 2010 to 2014, 2016, each covered at more than 90 %). Then, we detrend the data from observed sea-level rise at the tide gauge, over the period of observations (0.7 mm/yr). Finally, we extract the daily maxima from these datasets and reference them vertically with respect to the terrestrial vertical datum IGN88, for a mean sea level corresponding to the one of 31 December 2016.
3.4 Exposure of coastal sites
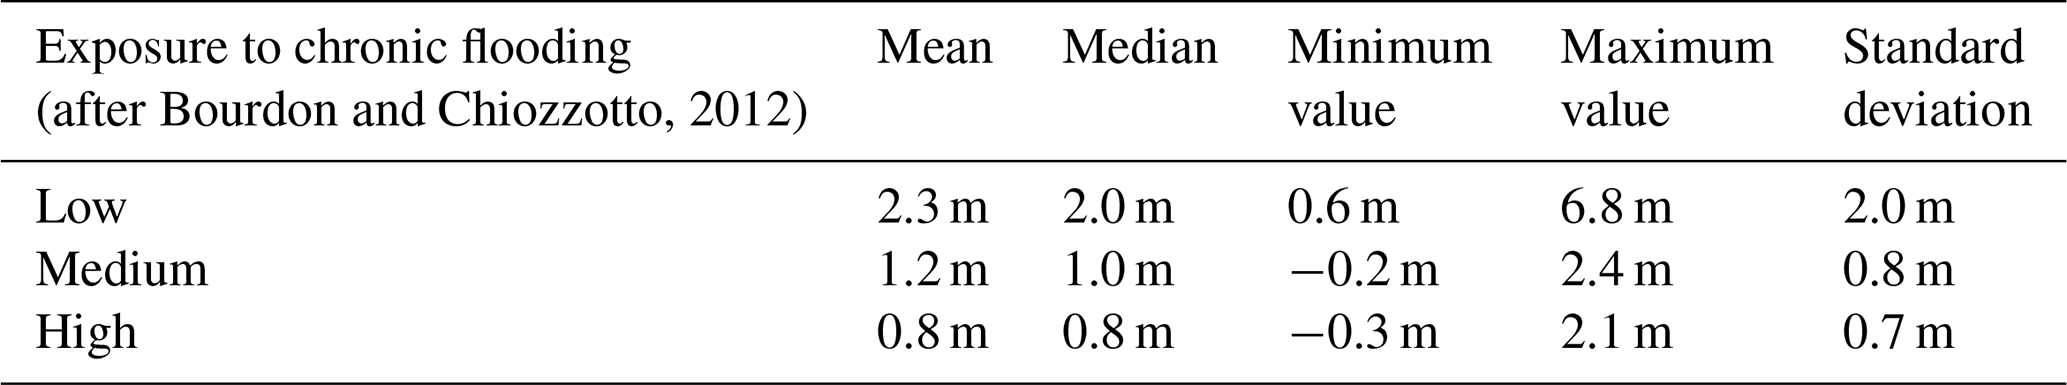
We evaluate the altitude of 34 priority coastal sites identified as vulnerable to chronic flooding by Bourdon and Chiozzotto (2012). No precise measurement of the altitudes is given in this report, but we benefit from recent lidar measurements in Guadeloupe (Litto3D® – IGN & SHOM) to estimate their altitude. This comes with the limitations of the exact location of each site, with a few horizontal meters of geolocation errors potentially accounting for different pixels in the lidar maps, and therefore errors in the evaluation of the altitude. The Litto3D© dataset itself has typically errors on the order of 0.2 m vertically. Bourdon and Chiozzotto (2012) classified the coastal sites into three categories: low (8 sites), medium (13 sites) and high (13 sites) vulnerability to chronic flooding, based on multi-parameter analysis on the field and surveys (Fig. 1).
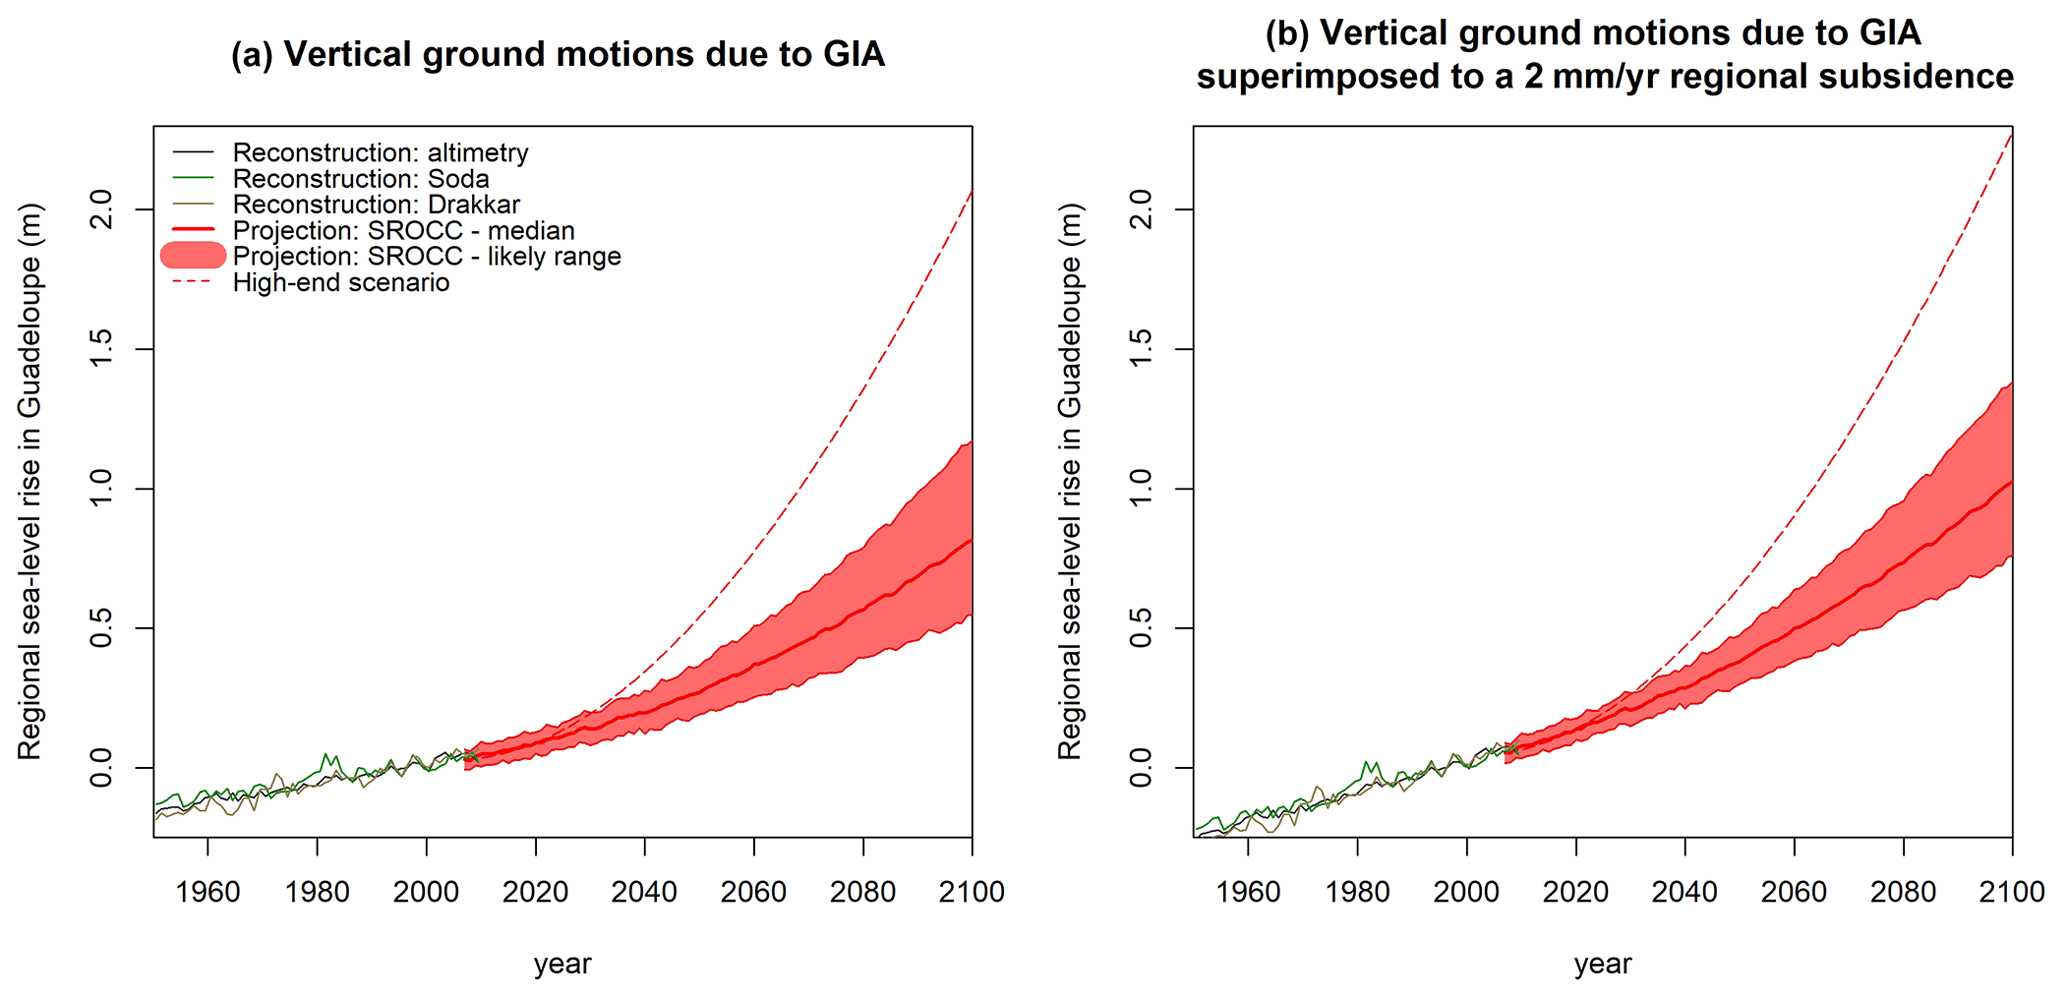
Figure 3Sea-level reconstructions and projections for Guadeloupe, with respect to 1986–2005: (a) assuming vertical ground motions are due to GIA only and (b) assuming an additional regional subsidence of 2 mm/yr. The three reconstructions refer to those presented in Palanisamy et al. (2012). The projections are regional implications of the Special Report on the Ocean and Cryosphere in a Changing Climate (Oppenheimer et al., 2019). The high-end is the regional implication of the high-end projections presented in Thiéblemont et al. (2019).
3.5 Synthesis – evaluation of past and future chronic flooding
We compute the number of chronic flooding days per year by computing the number of days the daily water level exceeds given altitudes. Daily water levels are computed as the sum of projected mean sea-level changes with the daily maxima of water levels resulting from tide, surges and mean seasonal variations related to the regional circulations. As we are interested in chronic flooding, we exclude the water levels resulting from cyclone events in the present study. Our approach neglects the effect of sea-level rise on tidal characteristics (see Sect. 5.4), and we also note that although the coastline is largely reclaimed and stabilized, the area is mostly free from flood defenses such as small walls or dikes that could prevent chronic flooding from taking place.
4.1 Regional sea-level rise
Geocentric sea-level reconstruction projections for Guadeloupe are presented in Fig. 3a. The reconstructions are the same as in Palanisamy et al. (2012): they display regional sea-level changes that are similar to the global average from 1950 to 2010. The projections correspond to the regionalization of the global values presented in Table 1. The regional global median and likely sea-level projections in Guadeloupe remain close to the global average (Oppenheimer et al., 2019). Yet, the high-end scenario is slightly higher in Guadeloupe than at a global scale. This is due to high-end scenarios involving larger contributions from the Greenland ice sheet surface mass balance (Fürst et al., 2015) and Antarctic dynamics of marine ice sheets (Spada et al., 2013; Ritz et al., 2015; DeConto and Pollard, 2016; Edwards et al., 2019). In fact, the mass losses in these two polar regions change the Earth's gravitational field and rotation in a way that cause sea levels to rise faster in tropical regions such as Guadeloupe (Slangen et al., 2012, 2014; Kopp et al., 2014).
4.2 Regional and local vertical ground motion
4.2.1 Regional vertical ground motion
The results obtained by the two groups of the Nevada Geodetic Laboratory (NGL) and the University of La Rochelle (SONEL) are presented in Table 2. They reveal contrasting trends, with one uplifting station and two others subsiding. Yet, the quality of the data is also limited, with two time series displaying discontinuities potentially due to system changes and two others that are too short. While the area is affected by different earthquakes, including subduction earthquakes (low-angle thrust, e.g., in 1843), intraplate events (e.g., 2004) and volcanic events, no obvious connections with existing discontinuities in GNSS time series have been identified.
Furthermore, the tide gauge of Le Gosier does not measure a very rapid rate of relative sea-level rise but only a trend of 0.7 mm/yr, as with the Refmar data (Table 3). This estimate comes with large uncertainties due to relatively short-term and scarce data, but it still suggests low vertical ground motion at the tide gauge, since the geocentric sea-level-rise rates, as computed from satellite altimetry, are 1.9 ± 0.9 mm/yr (Palanisamy et al., 2012). Furthermore, the background vertical ground motion computed directly from the sea-level time series is mm/yr (Kopp et al., 2014), suggesting again stability but with large uncertainties.
Table 3Pointwise vertical ground motions estimates from different sources.
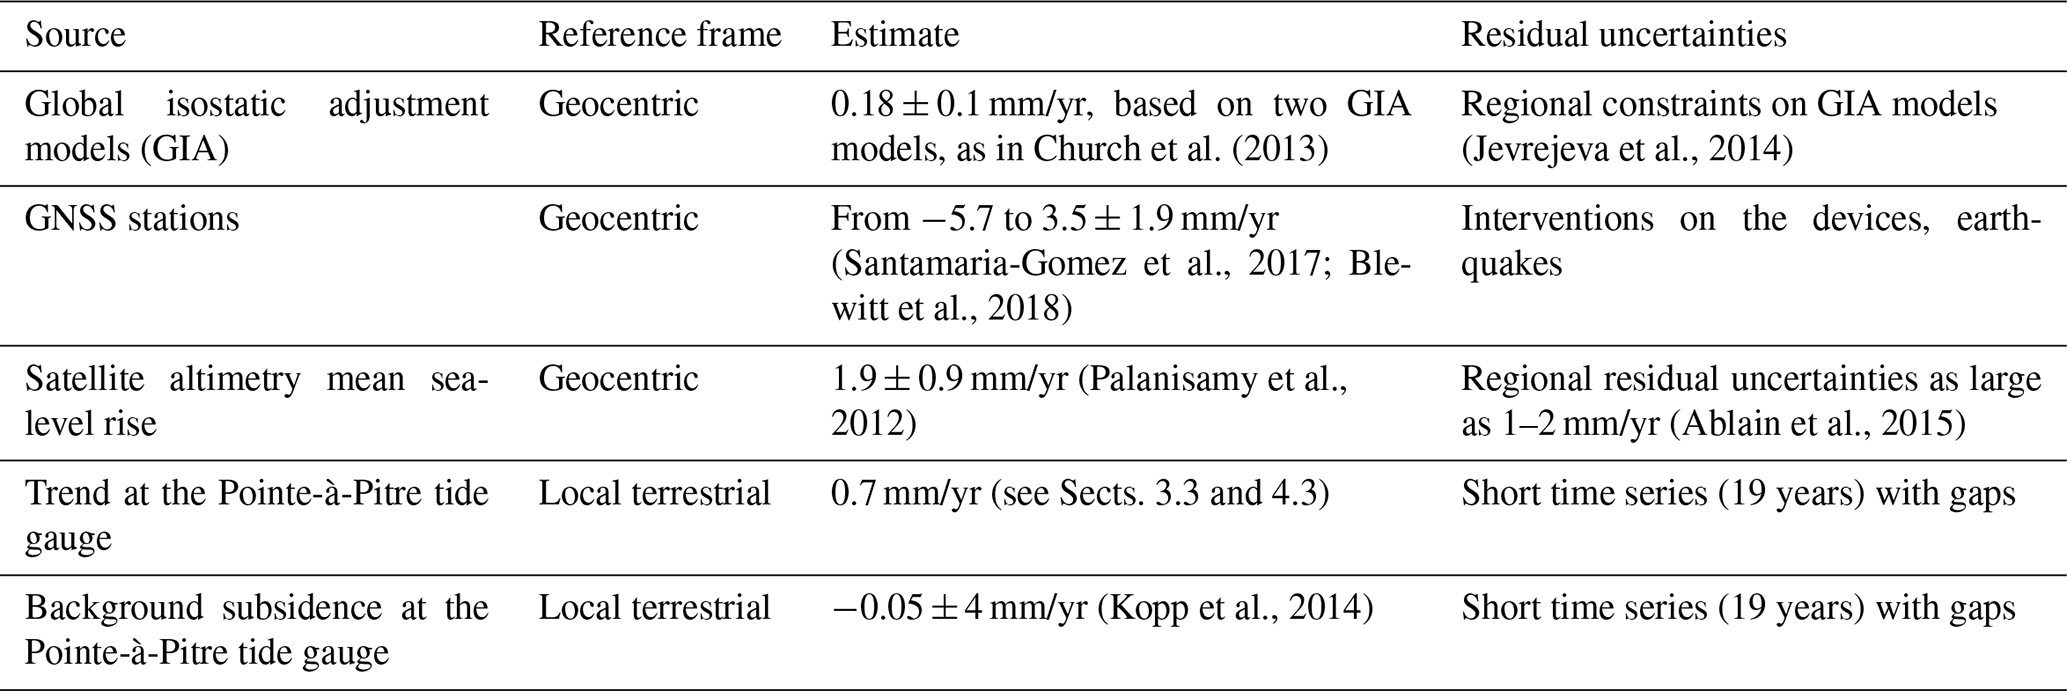
The effects of GIA are included in the geocentric vertical ground motion estimates from GNSS stations and in the sea-level trend directly computed from the tide gauge (0.7 mm/yr) but not in the sea-level estimate from altimetry and in the background vertical ground motion from Kopp et al. (2014). These GIA effects account for a subsidence of approximately 0.18 ± 0.1 mm/yr according to the two GIA models used in the IPCC. Again, these estimate are uncertain, and the error could exceed 1 mm/yr, as it is based on two GIA models only (Jevrejeva et al., 2014).
Hence, we obtain contrasting trends (Tables 2 and 3), which are consistent with those estimated from previous work (Sakic et al., 2020). They may reflect different vertical motion in the area of each GNSS station, some very local vertical ground motion not monitored by InSAR, or unreliable trends due to system changes and short time series.
4.2.2 Local vertical ground motion
The multi-temporal processing of the data, carried out using the GAMMA tool, delivers two products that highlight the ground displacements on the islands of Guadeloupe and its evolution during the observation period (2003–2010). In short, we measure changes in distances between the ground surface and the satellite at different passes over Guadeloupe. These movements are displayed in color-coded form, where red represents an increasing distance from the radar target of the satellite and blue represents a decreasing distance of the radar target towards the satellite (convention chosen by the authors). Given the configuration of the satellite and the data acquisition geometry, we conclude that the ground movement highlighted in the linear velocity map (Fig. 4) could be due to subsidence-type vertical motion (red) or uplift (blue) or projection of horizontal movement onto the line of sight. Figure 4 shows a ground movement around the Bouillante bay on the order of 3–6 mm/yr over the observation period, perhaps due to very slow gravitational landslides or ground subsidence. If these movements are revealed to be linear over time, they will represent a major contribution to relative sea-level changes along the western coast of Basse-Terre for the decades to come. This could be further investigated in future studies, also considering the fact that the observed signal could result from complex 3-dimensional processes, which could be characterized using both ascending and descending modes when more SAR or GNSS data are available.
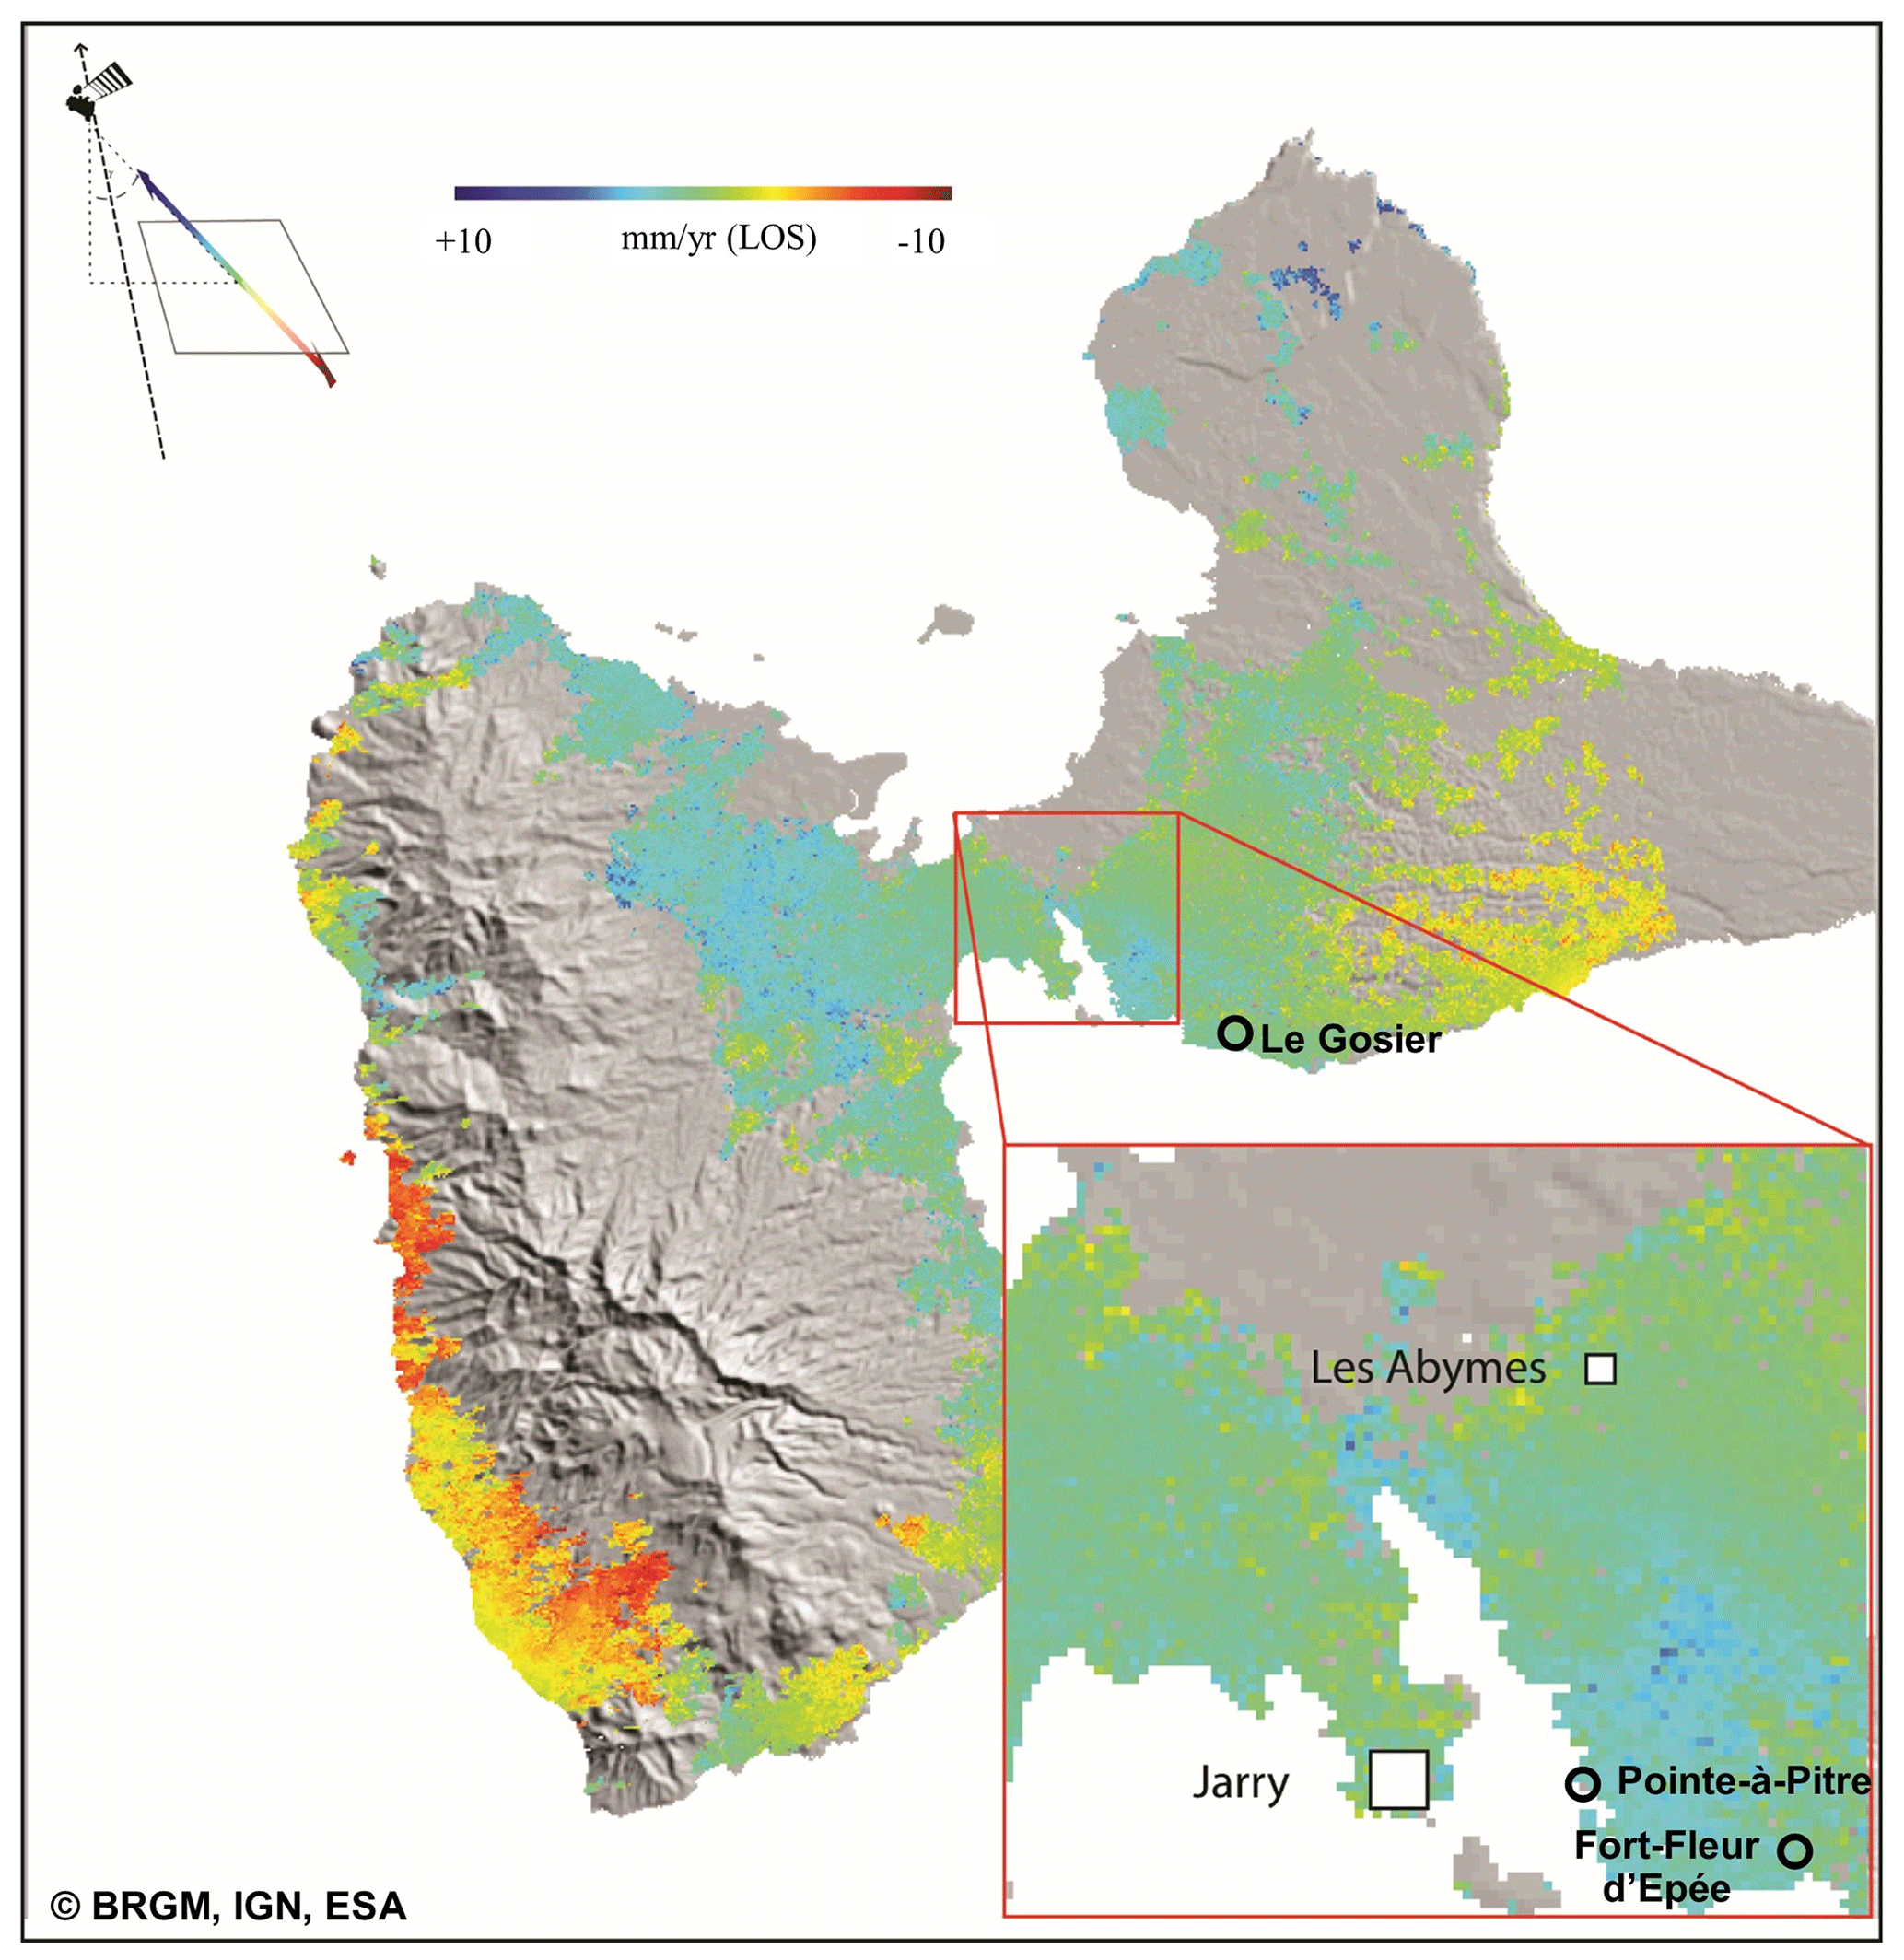
Figure 4Linear velocity map from the multi baseline InSAR method. These results are based on the analysis of 34 radar scenes acquired between 2003 and 2010 by the ASAR sensor on Envisat of the European Space Agency (map created by BRGM; data: IGN, ESA; © BRGM, IGN, ESA).
Yet, the area of the Petit Cul-de-sac marin, which is the focus of this study, appears relatively stable: we find vertical ground motion of 0.4 mm ± 1 mm/yr in Jarry (Baie-Mahault) with respect to Les Abymes (close to the airport, Table 2). The error is computed as 1 standard deviation of the vertical ground motion measured in the 35 pixels in the Jarry area. This is at the limit of the techniques, so this vertical ground motion can be considered insignificant. Since there are no measurements from the Envisat platform after December 2010, this velocity estimation via linear regression should be considered carefully. In fact, non-linear ground motion due to different phenomena (water table variations, local subsidence and uplifts) and uncompensated tropospheric delays could bias the velocity estimation for a short time of observation.
Furthermore, this first estimate is affected by the filtering performed within the InSAR processing procedure. To complete this error assessment, we also calculate an upper bound for the error by dividing the typical residual error from the atmospheric fluctuations (typically 10 mm on a single interferogram at a city scale) (Williams et al., 1998) by the mean duration between two acquisitions and the square root of the number of independent interferograms (Le Mouelic et al., 2005). We find 5 mm/yr for an upper bound of errors in the InSAR-based vertical ground motion maps. While this is large, this is not sufficient to explain the discrepancies between different GNSS measurements.
Hence, the uncertainties associated with the measurements of ground motion velocities range from 1 mm/yr (based on the variability in observations) to 5 mm/yr (maximum possible value). Given these uncertainties, we could not detect any local vertical ground motion in the area of the Petit Cul-de-sac marin, suggesting that local increases in chronic flooding events are unrelated to rapid (centimetric) but local vertical ground motion. Although the 7 years of the processed SAR archive is the longest data acquisition period available in the region, combination with other missions (such as Sentinel-1) could be considered in further works to address other related scientific questions such as the potential motion on the eastern coast of Basse-Terre.
4.2.3 Scenarios for vertical ground motion
To summarize, the vertical ground motion maps derived from InSAR suggest stability with respect to a terrestrial reference frame in the area of Jarry (Baie-Mahault) and Pointe-à-Pitre, within the error of the InSAR technique. Hence, we reject the hypothesis that each individual GNSS or tide gauge instrument considered above is measuring different vertical ground motion that is representative of some local processes such as sediment compaction linked to variations in the groundwater contents. Therefore, the contrasting trends given by the different instruments could be due to very local processes affecting single antennas or to discontinuities due to system changes. In fact, the trends range from −6 to 3.5 mm/yr (Tables 2 and 3), which correspond to very rapid subsidence and uplift rates. Furthermore, all measurements are scarce and include discontinuities, to the point that they are considered not robust as per the SONEL assessment. Hence, we suggest that these trends are suspect and more research is needed to understand and project vertical ground motion trends in Guadeloupe.
Based on these lines of evidence, we define scenarios for vertical ground motion in Jarry (Baie-Mahault). In a similar manner to climate scenarios for sea-level-rise projections (Stammer et al., 2019), to address deep uncertainties we define two scenarios for future vertical ground motion in Guadeloupe:
-
vertical ground motion essentially due to GIA effects, that is, of 0.18 ± 0.1 mm/yr of subsidence, based on an assumption of no significant vertical ground motion and the computation of errors in the Jarry area (Table 2, Fig. 3a)
-
a “high-end” subsidence scenario of 2.3 mm/yr, corresponding to a possible regional subsidence of 2 mm/yr superimposed onto a GIA-induced subsidence of 0.3 mm/yr, which is the upper bound of GIA effects according to the IPCC projections (Table 2, Fig. 3b).
Furthermore, although we consider a linear rate of vertical ground motion, we recognize that it may occur non-linearly, for example in the case of a tectonic or volcanic event.
4.3 Total water levels causing chronic flooding
Figure 5a shows the raw water level signal, and Fig. 5b shows the distribution of total water level maxima obtained following the method described in Sect. 3.3. Figure 5a displays the cyclonic events as blue lines, which we further highlight in red where these events affect our dataset. Cyclone-induced storm surges can reach several tens of centimeters at Pointe-à-Pitre (e.g., ∼0.4 m for the David cyclone, 1979). The first blue line in Fig. 5 corresponds to the cyclone that induced the strongest flood over the period of interest (Hugo, 1989).
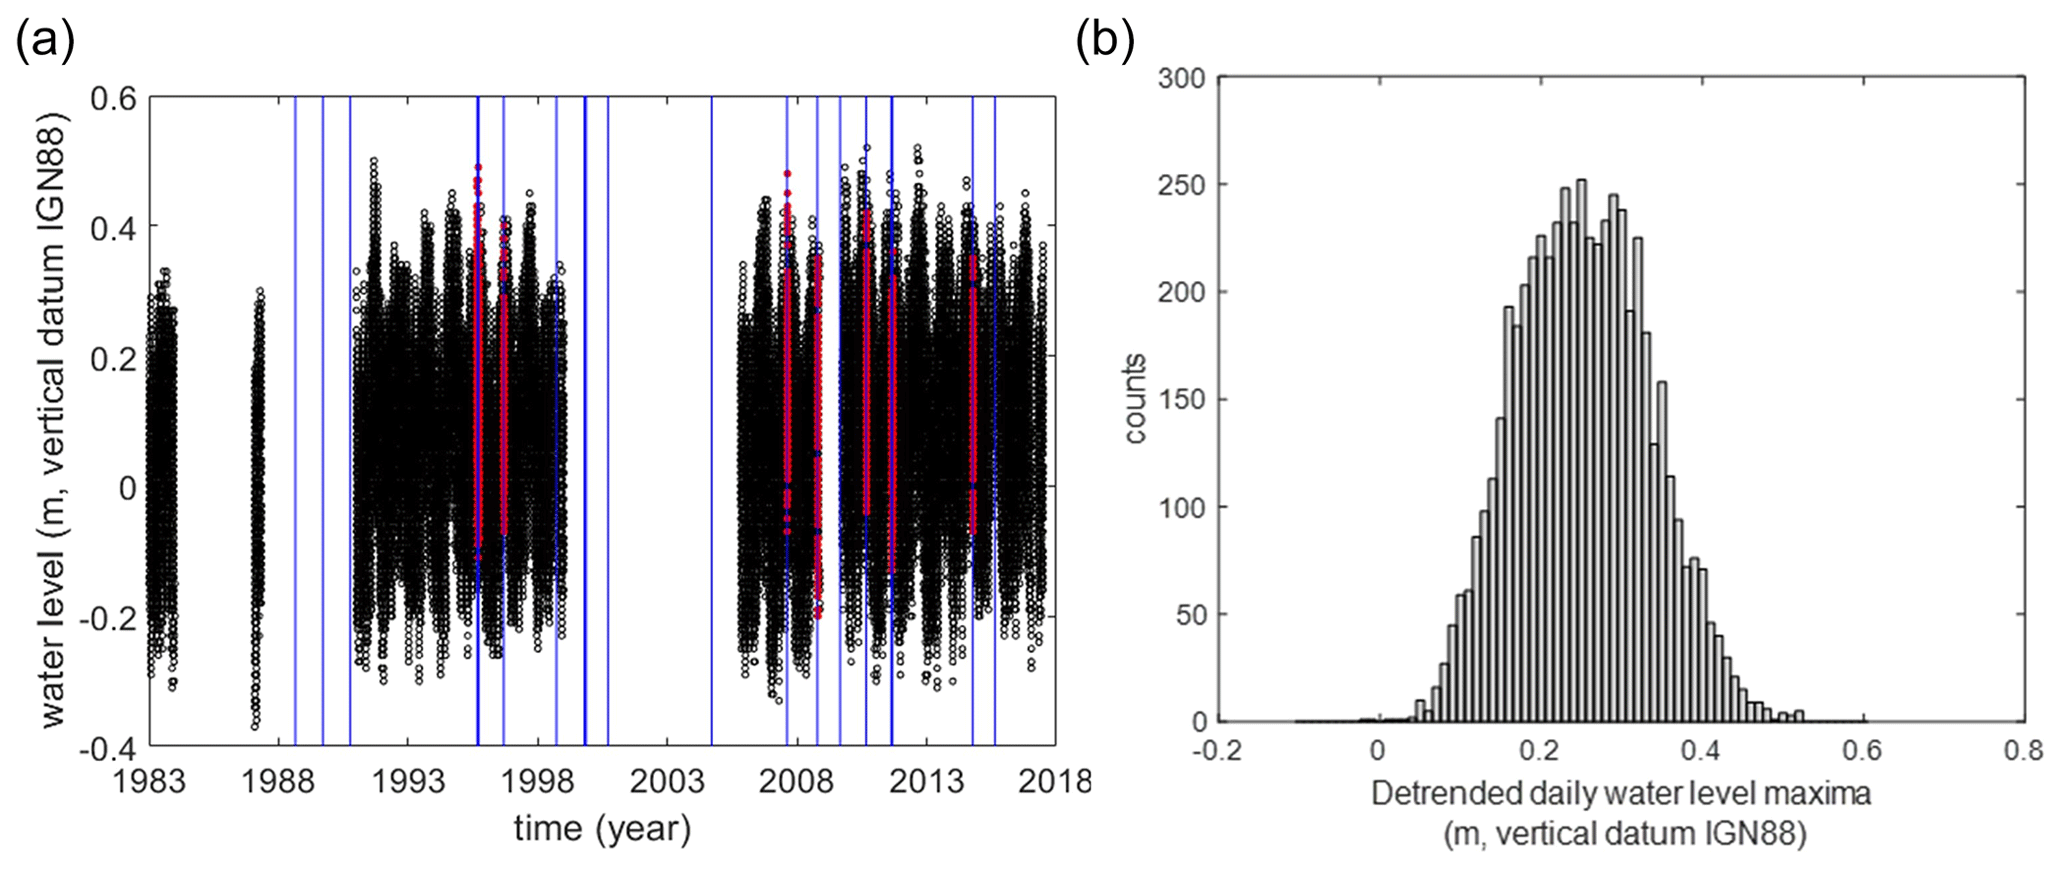
Figure 5Tide gauge data. (a) Time series of raw data (black: raw cleaned data; red: data removed from the analysis and corresponding to the cyclones, identified with blue lines). (b) Distribution of total water level daily maxima, after the water level data post-processing described in Sect. 3.3 (cyclone removed, year and day filtering, detrended sea-level rise).
The daily maxima of total water levels shown in Fig. 5b are caused not only by tidal variations but also by non-cyclonic surges and other processes causing seasonal to interannual sea-level variations. For example, the largest water level record over 1983–2016 corresponds to a seasonal-high monthly mean sea-level record. Hence, once removed from the cyclone events, we obtain a distribution of the highest daily water levels, which are representative of moderate conditions. As a consequence, the distribution of daily high water levels is suitable for the study of chronic flooding, driven by tides; seasonal variations in mean sea levels; and non-cyclonic surges.
Table 4Altitude of coastal locations according to the lidar altitude dataset (reference: regional geodetic reference, IGN88). See Fig. 7 for the precise location of each site.
4.4 Exposure of coastal sites
Table 4 shows the altitude of vulnerable coastal sites identified by Bourdon and Chiozzotto (2012) based on lidar Litto3D© data (see Fig. 6 for exact location and altitude of these vulnerable coastal sites). This analysis shows that the median altitude of high-vulnerability sites is 0.8 m in the local reference frame (IGN88). Medium- and high-vulnerability sites have median altitudes of 1 and 2 m, respectively, in the local reference frame. Some individual altitudes are doubtful, suggesting errors in geo-referencing of the coastal site or in the lidar dataset itself, as discussed in Sect. 3.2. Due to these suspicious values, we consider here only the median altitude of each category of vulnerable coastal site.
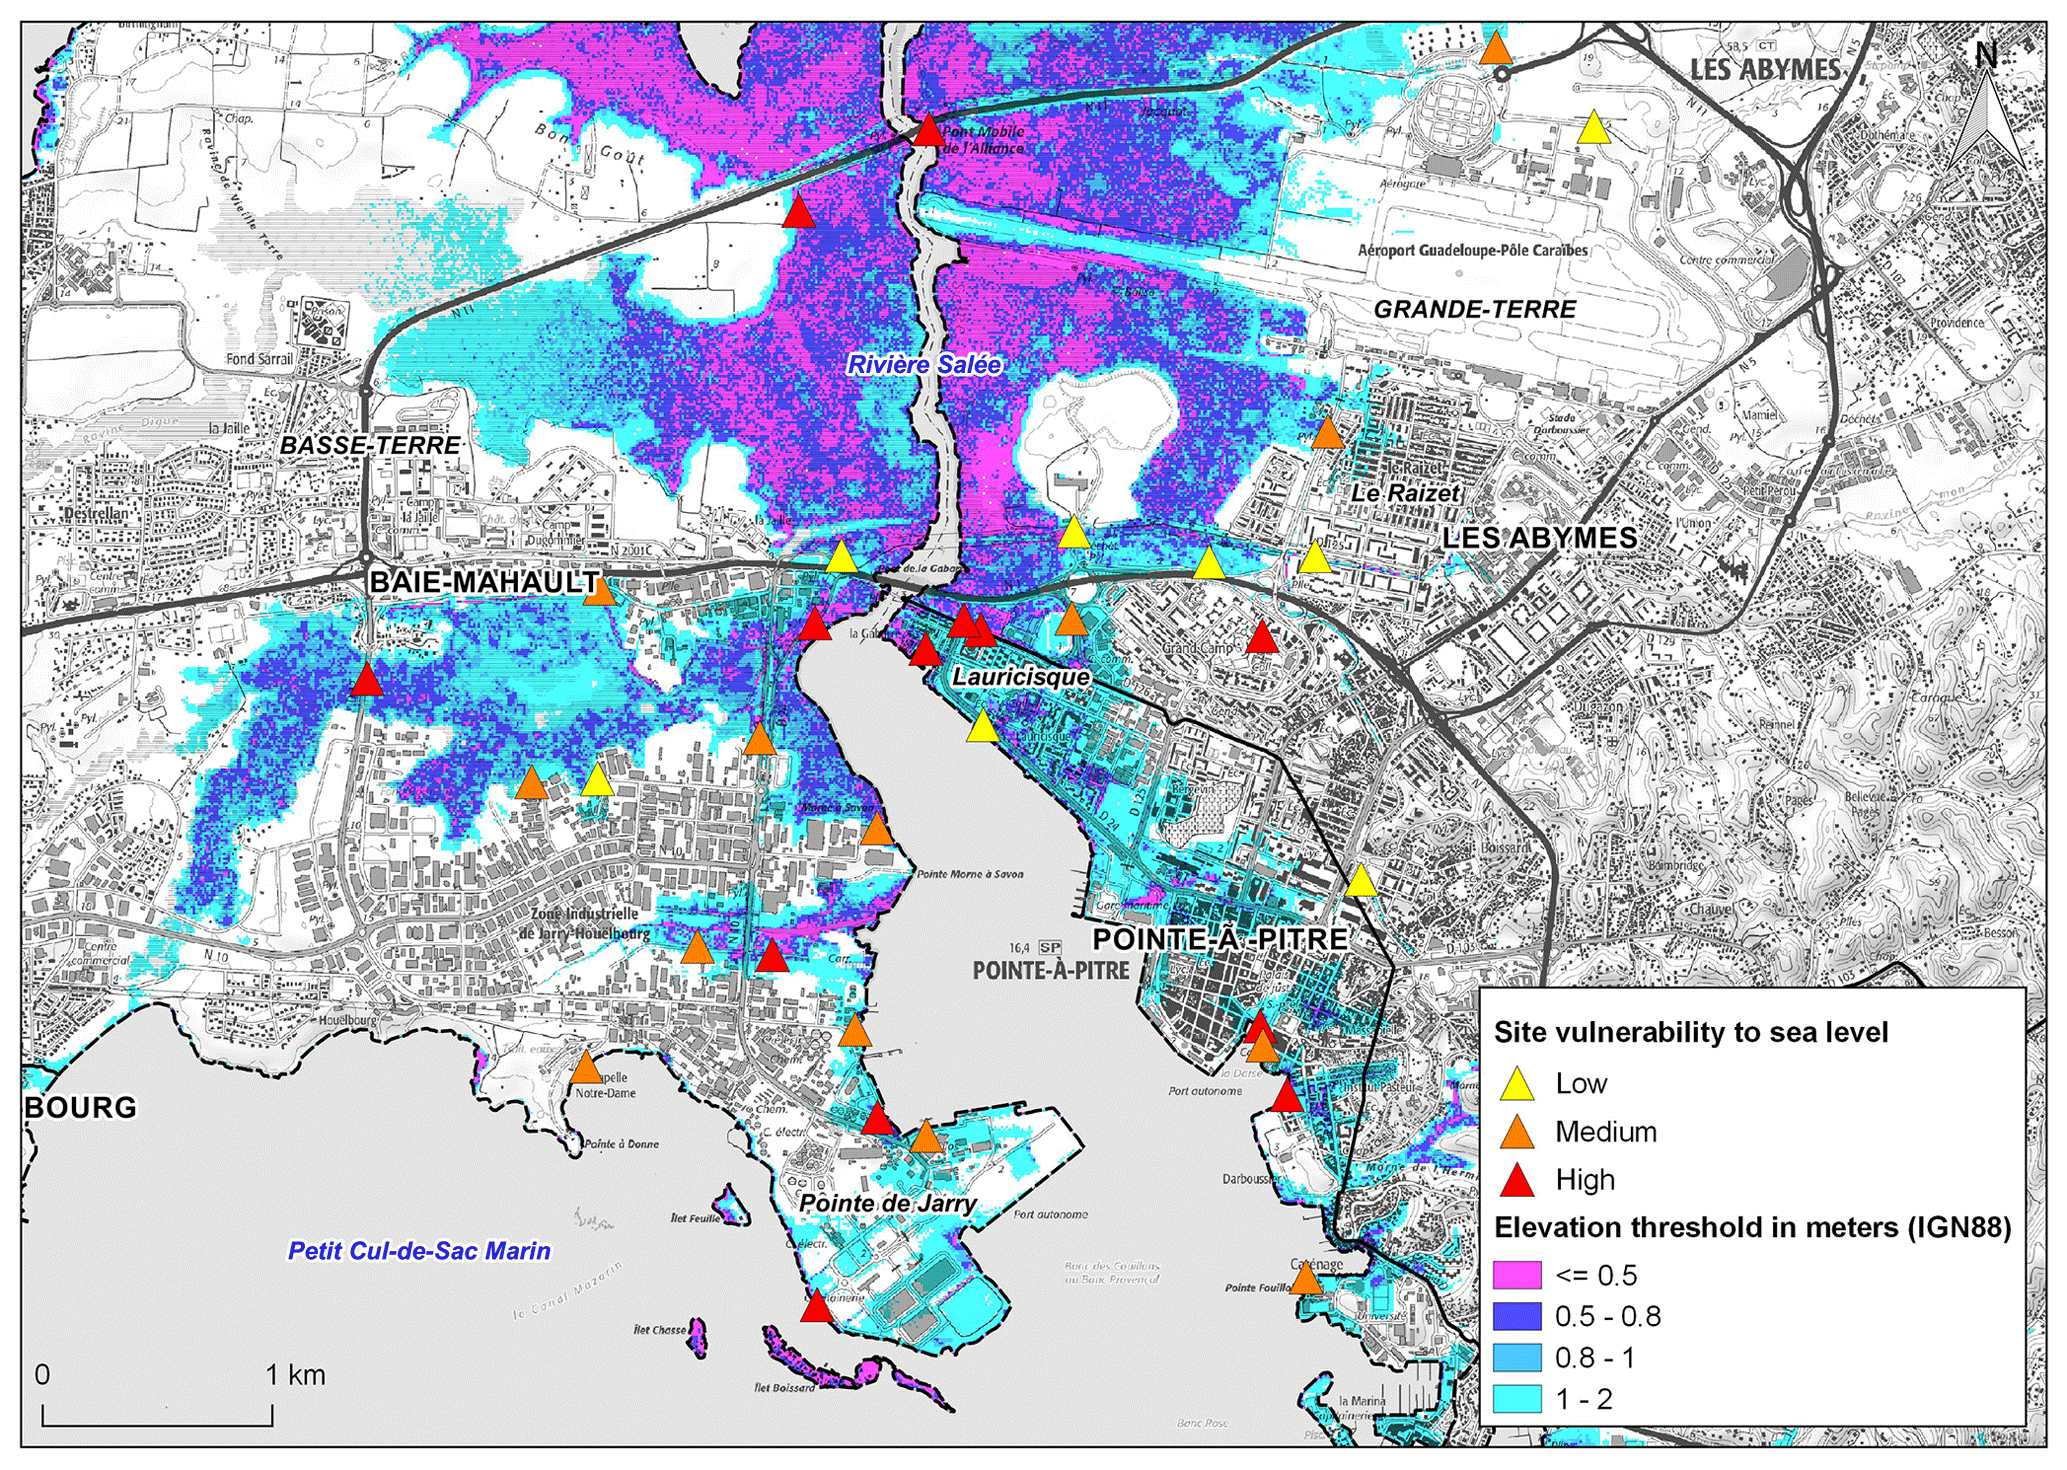
Figure 6Vulnerable sites identified by Bourdon and Chiozzotto (2012) and their degree of vulnerability and altitude in the Petit Cul-de-sac marin area in Guadeloupe (map created by BRGM; data: IGN, SHOM; © BRGM, IGN, SHOM).
4.5 Synthesis – past and future chronic flooding hazards for vulnerable coastal sites
The number of submersions per day from 1950 to 2100 is presented in Fig. 7 for the three idealized vulnerable coastal sites and for the two subsidence scenarios. The results show that depending on the actual altitude of each site, a rapid increase in the number of flood days per year is expected to take place sooner or later during the second half of the 21st century. This is consistent with previous work undertaken in other coastal sites (e.g., Sweet and Park, 2014), and it can be explained by the projected acceleration of sea-level rise after 2050 under RCP8.5. Furthermore, the mean high water level in Guadeloupe is only 12 cm above mean sea levels in Guadeloupe (source is SHOM – Naval Hydrologic and Oceanographic Service). Therefore, the duration of each chronic flooding event increases rapidly as well after the first events have been observed. For example, assuming that the first event is observed in 2050 at a given site, mean sea level would exceed the local critical elevation by 2063 [2059, 2070] (median with the likely range in square brackets) for the ground motion scenario including GIA only, by 2057 for the high-end sea-level-rise scenarios involving large melting from Antarctica and even by 2056 if an additional subsidence of 2 mm/yr is accounted for. We do not know whether stakeholders will respond to early signals of chronic flooding events or to later signals when flooding durations increase. However, the study of Bourdon and Chiozzotto (2012) was motivated by stakeholders being concerned about chronic flooding. This suggests that coastal adaptation practitioners are sensitive to early signals.
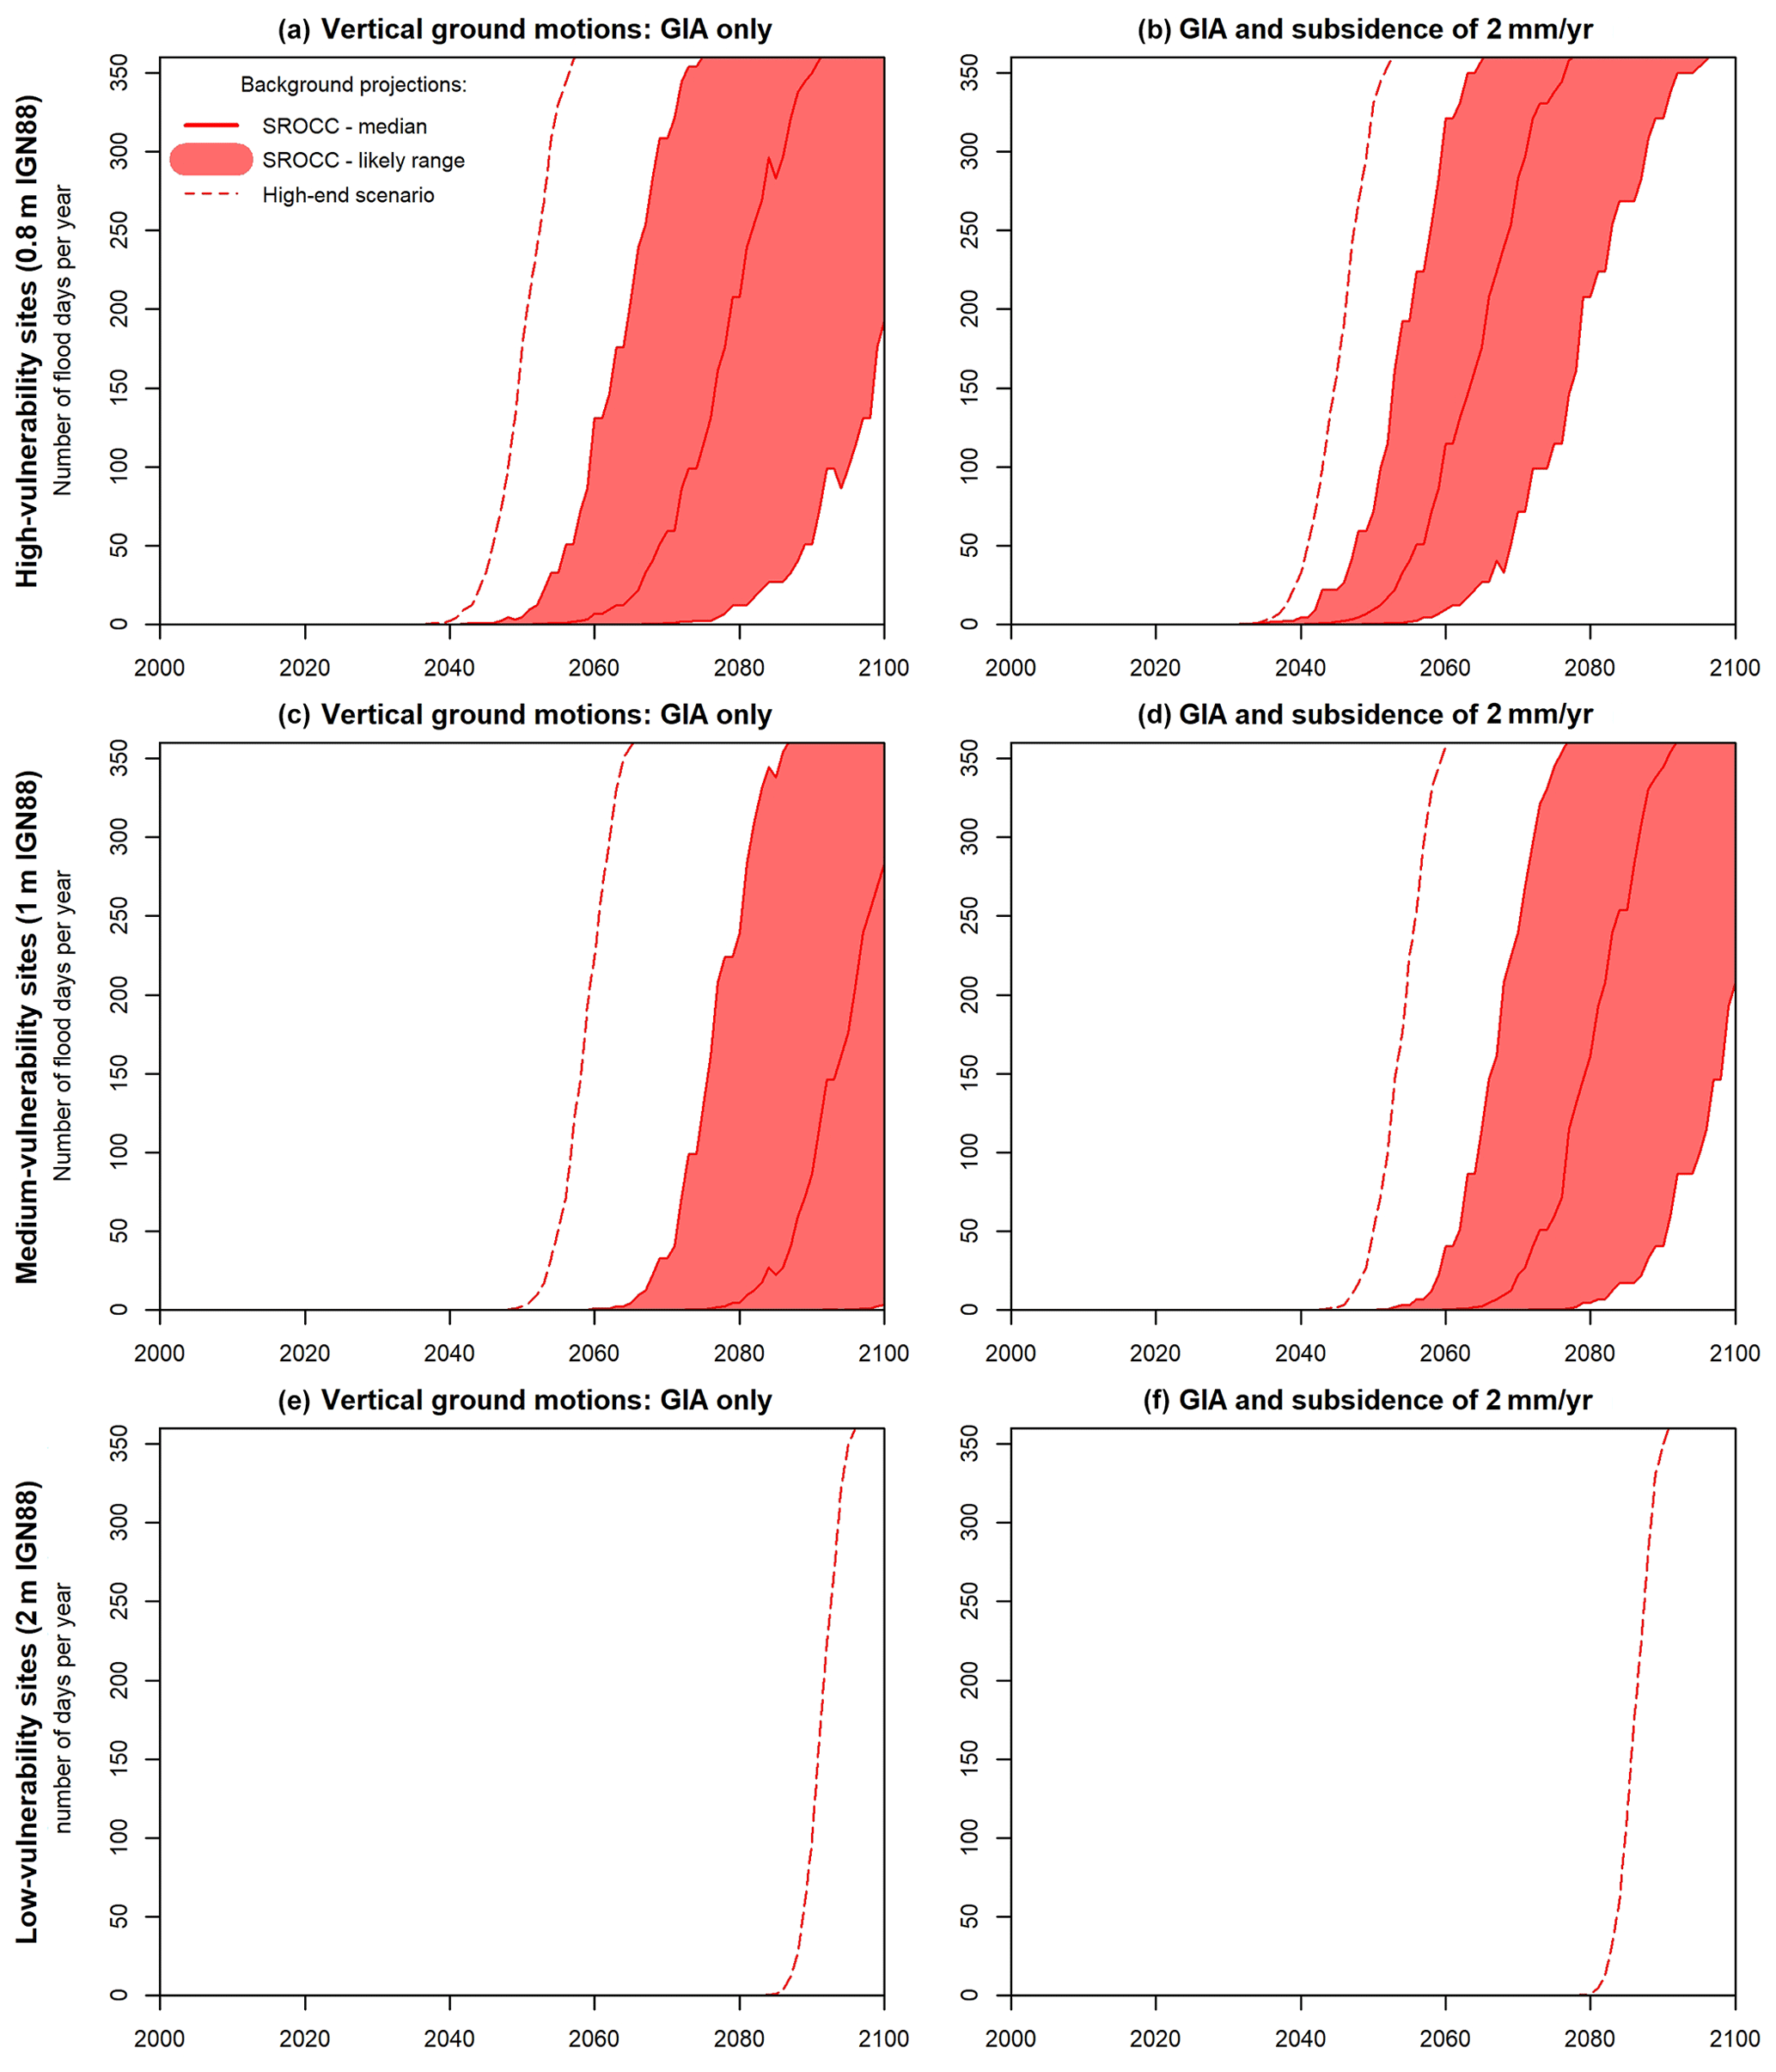
Figure 7Reconstruction and projections of chronic flooding events, for two subsidence scenarios and three idealized types of coastal sites in Jarry and Pointe-à-Pitre. The color code is the same as in Fig. 3.
In the remainder of this paper, we discuss to what extent we can attribute observed chronic flooding to sea-level rise (Sect. 5.1), what are the times of emergence of chronic flooding events depending on the scenario considered (Sect. 5.2), the implications for coastal management (Sect. 5.3) and the limitations of our approach (Sect. 5.4).
5.1 Attribution of observed chronic flooding
Whatever the scenario considered, Fig. 7 shows that chronic flooding is not expected to emerge earlier than 2030 for an altitude of 0.8 m (reference frame is IGN88) corresponding to an average high-vulnerability coastal site. Yet, the lidar data show that some coastal sites have an altitude below this value (Table 4, Fig. 6). For example, if we consider an altitude of 0.5 m, the model predicts 1 day of chronic flooding after the 1990s (Fig. 8). Yet, there are also coastal sites where chronic flooding has been observed, although the altitude according to the lidar dataset is well above 1 m (Bourdon and Chiozzotto, 2012). This suggests that observed chronic flooding (Sect. 2) is not yet completely driven by sea-level rise; on the contrary, the interactions between sea levels, the groundwater table and rainfall events, which we do not model here, probably play a significant role today.
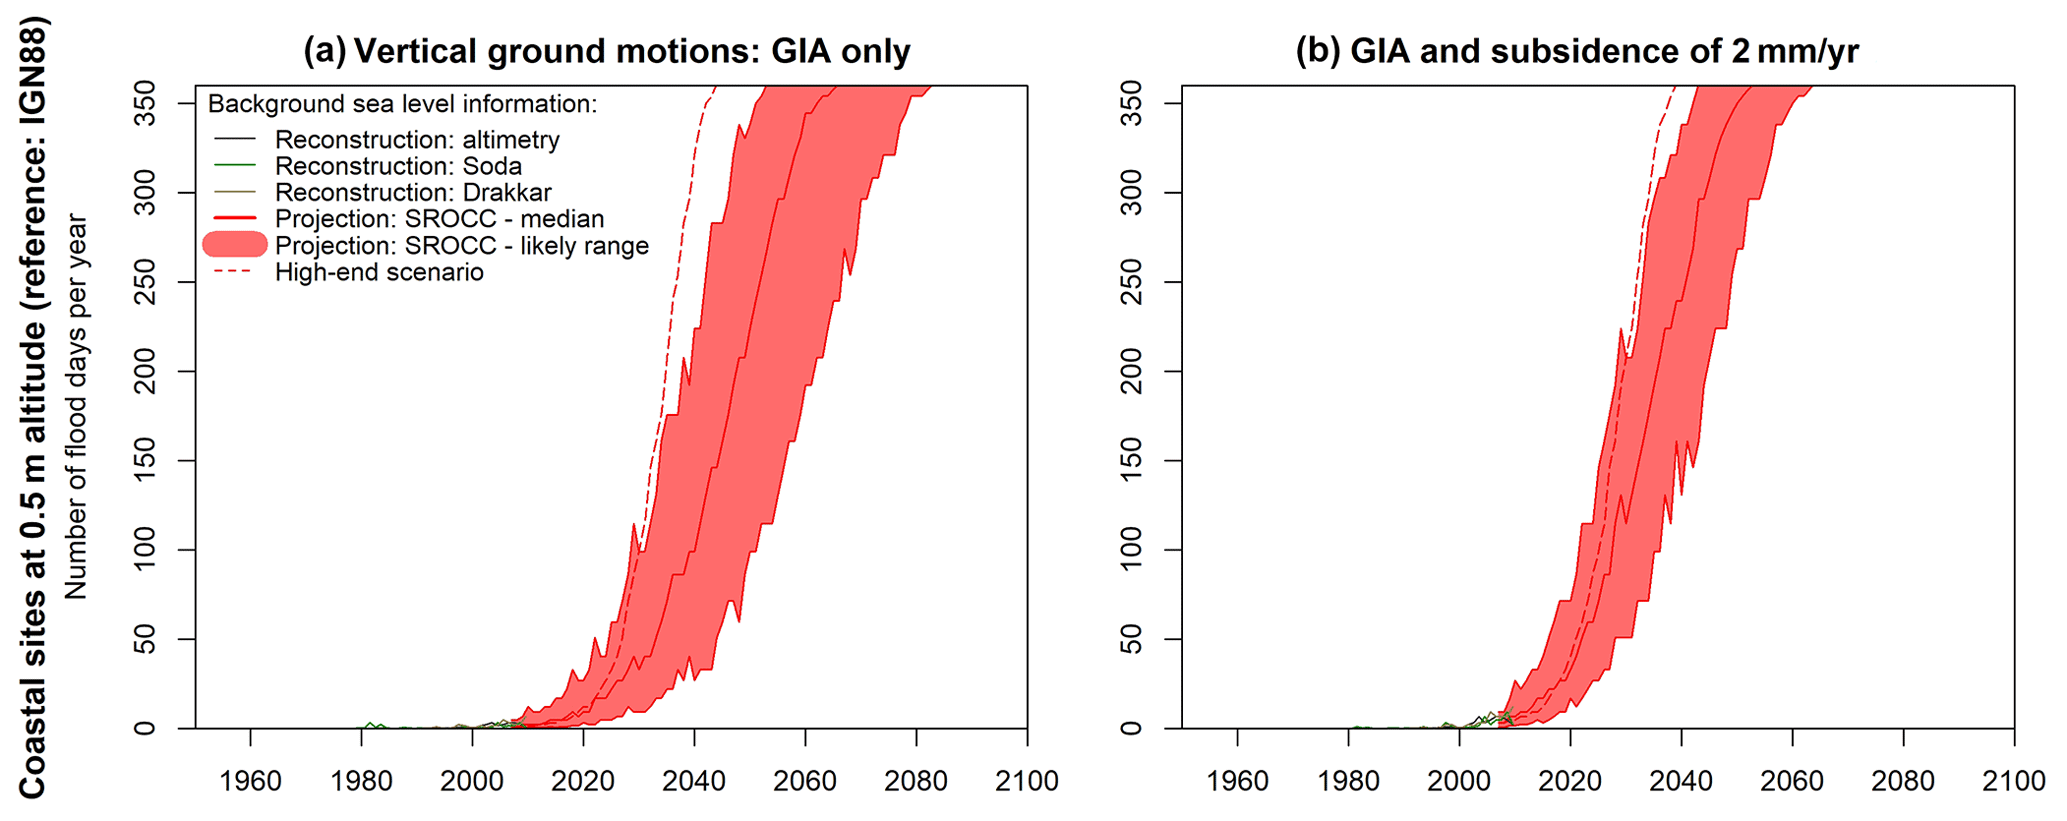
Figure 8Reconstruction and projections of chronic flooding events, for two subsidence scenarios and a coastal site located at an altitude of 0.5 m (local reference frame, IGN88). The color code is the same as in Fig. 3.
To our knowledge, there are no observations or modeling results allowing us to assess precisely the role of changing groundwater levels in Jarry. Yet, the role of changing groundwater levels should not be ruled out because a significant part of the infrastructure has been built on a former mangrove. Reports from the administration in charge of implementing flooding prevention policies acknowledge the role of rainfall and water runoff, not only during cyclones but also during seasonal heavy-rainfall events (DEAL, 2015). The regulatory documents remind us that in an urbanized area such as Jarry, soil sealing prevents water from infiltrating the ground, and the water drainage system can be temporarily challenged.
Hence, our results suggest that sea-level rise may already have caused chronic flooding at coastal sites with the lowest altitudes. Yet, we do not formally attribute observed chronic flooding to sea-level rise alone because the lowest sites are not always those where chronic flooding has been reported. Some of the chronic flooding events observed today may involve groundwater rise, rainfall and runoff as well (Bourdon and Chiozzotto, 2012; DEAL, 2015).
5.2 Emergence of chronic flooding
For coastal sites above 0.8 m (IGN88), the onset of chronic flooding is not projected to take place before the 2030s (Fig. 7). If we rely on the SROCC sea-level scenarios, the high-vulnerability sites are projected to start experiencing chronic flooding in 2050 (2040 if we assume a regional subsidence of 2 mm/yr) (Fig. 7). Yet, the number of flood days per year increases rapidly after the emergence of chronic flooding: for example, high-vulnerability coastal sites are likely to be flooded 180 d/yr between 2060 and 2100 (between 2050 and 2070 if we assume subsidence) (Fig. 7). This rapid increase in the number of flooding days will leave little time for adaptation. The reasons for this are threefold: first, the low altitude and the absence of defenses in the Petit Cul-de-sac marin; second, the variability in daily maxima of total water levels is roughly 0.4 m only (Fig. 5); and third, most of the coastal sites will start to experience chronic flooding after 2050, that is, once sea-level rise has started accelerating significantly as per RCP8.5 (Fig. 3).
Despite being unlikely, high-end scenarios beyond the likely range can provide useful information for risk-averse users (Stammer et al., 2019), such as airport and harbor authorities and the electricity or hydrocarbon providers in Jarry (Baie-Mahault) (Fig. 1). For our high-end scenario, chronic flood events driven by sea-level rise occur 1 decade earlier than for the upper bound of the likely range (dotted line in Fig. 7). Furthermore, once the process is initiated, chronic flood events happen every day 1 decade after their emergence. Therefore, as expected, the high-end scenario leaves even less time for adaptation than the baseline SROCC-based sea-level-rise projections.
5.3 Potential measures to manage future chronic flooding events
A first measure to prevent the future impacts of chronic flooding would be to limit sea-level rise by reducing greenhouse gas emissions. By doing so, chronic flooding would not be avoided in the locations identified as vulnerable in the Petit Cul-de-sac marin, because sea level will continue to rise at least at rates of 3 mm/yr for decades (Oppenheimer et al., 2019). Yet, the impacts would emerge later and at slower rates, thus giving more time for adaptation. Furthermore, the structural changes in the economy that are required to achieve climate goals (Rockström et al., 2017) would offer an opportunity to reconsider the location and the nature of critical infrastructures in Guadeloupe and elsewhere.
Without climate change mitigation, adaptation of coastal infrastructures will be required in the Petit Cul-de-sac marin, possibly as early as the 2030s, regardless of evolution in the intensity or the trajectory of tropical cyclones and hurricanes for futures decades (Chauvin et al., 2020). Figure 7 shows that a small difference in the elevation of coastal areas allows us to avoid chronic flooding for decades. Yet, small walls or dikes would not be efficient in this particular case due to the interactions between rainfall, groundwater flows and sea-level changes in the former mangrove areas, which include fine sediments and porous soils. Hence, raising the ground levels could be an efficient adaptation measure. Yet, this measure should be taken for a large number of already urbanized locations, which could be a challenge for port maintenance operations due to limited resources.
Besides sea-level rise, other cascading impacts such as the combined effects of sea-level rise and wave changes could also affect port operability (Camus et al., 2019). Yet, our understanding of the coastal area is that the most urgent climate-related challenge for Jarry (Baie-Mahault) is adaptation to chronic flooding induced by sea-level rise. Other challenges include prevention of and preparedness for cyclones, heavy tropical rainfall and tsunamis and sustaining ecosystem services (Pedreros et al., 2007; Krien et al., 2015; Jevrejeva et al., 2020; Chauvin et al., 2020). In particular, one important issue will be the management of storm water drainage in a context where the soil is largely impermeable due to the sprawl of commercial and industrial areas.
Overall, the situation in Guadeloupe is representative of many other tropical islands where critical infrastructures are located in low-lying-areas (e.g., atoll islands but also high islands such as Réunion, the Society Islands in Polynesia, the Lesser Antilles) and where extreme total water level events have relatively small amplitudes (Oppenheimer et al., 2019). In such areas, the increasing number of chronic flooding events will become a challenge for coastal management.
To better manage adaptation to such chronic flooding events, we could learn from areas that have experienced rapid relative sea-level changes due to vertical ground motions. For example, a village in the Torres Islands (Vanuatu) was relocated in 2002–2004 due to chronic flooding events caused by relative sea-level changes partly attributed to an earthquake (Ballu et al., 2011). Another earthquake that took place in 2013 in the Philippines caused the subsidence of several islands (e.g., Batasan, Ubay) and chronic flooding events for up to 135 d/yr. Yet, people from these islands preferred accommodating to chronic flooding in this case (Jamero et al., 2017). Hence, the local adaptation response can be very different depending on the local context. For Guadeloupe, it would be interesting to build upon the experience of Mayotte, another French island region with similar institutional contexts. In Mayotte, chronic flooding events emerged in 2019 after a subsidence of about 0.2 m caused by the eruption of a submarine volcano off the islands (Lemoine et al., 2018; Cesca et al., 2020). The rise in sea levels observed within 2 years in Mayotte is typically what is projected to take place on almost all tropical islands worldwide over the coming 3 decades.
5.4 Limitations of the approach and residual uncertainties
Our results are associated with a number of residual uncertainties: first, more research would be needed to characterize vertical ground motion on the islands and potentially define more precise subsidence scenarios (Sect. 4.2). Together with the actual rates of future sea-level changes, this local feature is probably the largest source of uncertainty relevant to our estimate of times of emergence of future chronic flooding.
Other residual uncertainties relate to the assumption that the highest water levels are simply translated upwards as sea level rises. In fact, we assume here that the potential effect of the sea-level rise on the tidal characteristics is negligible in comparison to the sea-level-rise contribution itself. This assumption is supported by global studies showing that the Caribbean islands could be affected by an increase in M2 (and also S2 and O1) and mean high water levels (accounting only for M2, S2, K1 and O1) but in relatively small proportions (Pickering et al., 2017; Schindelegger et al., 2018). For example, the amplitude of M2, S2, K1 and O1 would increase by about 25, 10, 0 and 10 mm, respectively, assuming no shoreline recession at the coast, for a uniform sea-level rise of 2 m, after Pickering et al. (2017). This implies that taking into account this effect would only slightly modify the projected times of emergence (Figs. 7 and 8) and that the chronic flooding in the Petit Cul-de-sac marin would increase only slightly faster than the one predicted here.
In some areas, tide gauge data can contain a contribution of the wave setup affecting all the surrounding area (regional wave setup) or some specific ports (Thompson and Hamon, 1980; Bertin et al., 2015; Pedreros et al., 2018; Melet et al., 2018). In the Petit Cul-de-sac marin, the wave setup contribution is excepted to be negligible both at tide gauge locations and at the coastal locations vulnerable to chronic flooding, except during cyclones (not considered in our study). Indeed, most of the time seasonal waves come from the north to west direction (trade winds) and thus are diffracted by the Grande-Terre island and arrive at the entrance of the Petit Cul-de-sac marin with very low energy.
We assumed the tide gauge data are representative of the tide and storm surges along the coast of the Petit Cul-de-sac marin. In reality, the tide and storm surge are not uniform. Yet, based on expert judgment, we do not expect differences larger than about 0.1 m at this scale at this study site. These processes are not considered here and may be assessed in an observational and modeling study assessing currents and tides within the area. Yet, given the uncertainties in the sea-level projections and vertical ground motions, they do not appear a priority for revising times of emergence of chronic flooding in the area of interest.
To conclude, besides the research priority of better characterizing future contributions to sea-level rise, the most important residual uncertainty relevant to chronic flooding in Guadeloupe appears to be the vertical ground motions.
In this paper, we have characterized the times of emergence of chronic flooding due to sea-level rise in the Petit Cul-de-sac marin, Guadeloupe, a tropical archipelago where critical infrastructure is located in low-lying areas. While rainfall and groundwater processes seem to play a key role in chronic flooding events observed so far, the number of flood days is projected to increase drastically under RCP8.5 in the 2 decades after the first flood event occurs. Depending on the actual altitude of the site considered and the subsidence of the islands, this may occur by 2030, 2040 or later during the 21st century. Subsidence of the islands remains a critical unknown, which we address here using vertical ground motion scenarios, similarly to what is used for climate-induced sea-level rise. In the case of Guadeloupe, the uncertainty in subsidence makes a large difference in times of emergence of chronic flooding. This topic deserves more research.
The expected rapid increase in the number of days with chronic flooding can be explained by three factors: the low altitude and the absence of defenses in the Petit Cul-de-sac marin, the small amplitude of tides, and the rapid increase in sea-level rise during the second half of the 21st century. While raising the ground levels by a few tens of centimeters buys time for adaptation, this issue of chronic flooding remains a challenge due to the number of vulnerable locations and the interaction with rainfall and groundwater processes that make diking a barely viable option. Limiting greenhouse gas emissions would not only allow us to buy time but also require large transformation of the infrastructure in place. This offers an opportunity to design new infrastructure (e.g., renewable electricity production systems) in a way that makes the infrastructure less vulnerable or less exposed to sea-level rise.
We argue that studies assessing future chronic flooding are urgently needed in most low-lying coastal areas across the globe. In fact, sea-level is projected to rise along most inhabited coastlines, and adaptation takes decades to be implemented (Haasnoot et al., 2020). The case of Guadeloupe shows that adaptation should ideally be planned before the first chronic flooding events are attributed to sea-level rise. Based on our study above, we recommend that the following points are considered when performing future assessments of chronic flooding hazards:
-
Attribution of chronic flooding events is needed to assess the urgency of adaptation. Yet, the simple observation that chronic flooding events are becoming more frequent is not sufficient to formally attribute the observed phenomenon to sea-level rise. In Guadeloupe, we do not attribute formally observed events to sea-level rise due to lack of consistency between the locations of hotspots and their altitudes. For future studies attempting formal attribution of chronic flood events, we recommend collecting and analyzing additional information on rainfall, runoff and groundwater flows.
-
The times of emergence of chronic flooding can be assessed provided tide gauge records and some information on vertical ground motions are available. Our study provides additional data and methods allowing us to assess these times of emergence (see “Data availability”). Where resources are limited, a simple preliminary assessment can be performed, by superimposing spring tide levels and sea-level projections available below.
-
Sea-level rise due to climate change is a major driver of future chronic flooding risks, but vertical ground motions due to natural processes or anthropogenic activities need to be considered as well for precise local assessments. In Guadeloupe, the tectonics remain a major source of uncertainties. For future study, we recommend assessing their role, using e.g., the geodetic methods used here (GNSS, InSAR), potentially supplemented with knowledge of the geology. Alternatively, in the case of deep uncertainties, users may also consider following a scenario approach as presented above.
Far from being isolated, the case of Guadeloupe is representative of many small islands, with critical infrastructure located in low-lying areas. When looking at each specific case study, adaptation may seem manageable locally. Yet, the number of places that are exposed to chronic flooding, that is, most small islands with critical low-lying areas (Kumar and Taylor, 2015), raises the need for a more global strategy for public authorities and infrastructure managers such as harbors, airports and other businesses on small islands.
Sea-level projections for Guadeloupe are provided in the Supplement. AR5 projections can be downloaded for other locations from the Integrated Climate Data Center at the University of Hamburg (https://icdc.cen.uni-hamburg.de/en/ar5-slr.html, University of Hamburg, 2021). Other projections used in this article are available at https://sealevelrise.brgm.fr/ (BRGM, 2021). The code and sea-level information for the Guadeloupe case study is provided in the Supplement.
The supplement related to this article is available online at: https://doi.org/10.5194/nhess-21-703-2021-supplement.
GLC conceived and performed the chronic flooding analysis; DI conceived and performed tidal analysis; MdM and DR conceived, performed and interpreted the InSAR analysis; YL and MM conceived and performed the analysis of exposure; RP and YdlT interpreted and analyzed flooding hazards; YL and GS analyzed and interpreted regional vertical ground motion in Guadeloupe; RT contributed with sea-level projections; all wrote and revised the paper.
The authors declare that they have no conflict of interest.
We thank Valérie Ballu (University of La Rochelle) for useful exchanges on vertical ground motion in the Antilles, as well as Yann Krien (University of the French Antilles) and Aurélie Maspataud, Erwan Bourdon, Benjamin Seux and Jean-Marc Mompelat (BRGM) for discussions on chronic flooding in overseas territories. We thank Benoit Meyssignac and Mark Carson for making their data available, the European Space Agency for providing ASAR data, and SONEL and NGL for providing their solutions.
This research was initiated in the C3AF project with the financial support of the European Regional Development Fund, Guadeloupe Regional Council and BRGM, with additional methodological inputs provided by ANR STORISK and ERA4CS INSeaPTION (grant no. 690462), a FFABR (Finanziamento delle Attività Base di Ricerca) grant of the MUR (Ministero dell'Istruzione, dell’Università e della Ricerca), and a research grant of the Dipartimento di Scienze Pure e Applicate (DiSPeA) of the University of Urbino “Carlo Bo”.
This paper was edited by Animesh Gain and reviewed by Patrick Nunn and one anonymous referee.
Ablain, M., Cazenave, A., Larnicol, G., Balmaseda, M., Cipollini, P., Faugère, Y., Fernandes, M. J., Henry, O., Johannessen, J. A., Knudsen, P., Andersen, O., Legeais, J., Meyssignac, B., Picot, N., Roca, M., Rudenko, S., Scharffenberg, M. G., Stammer, D., Timms, G., and Benveniste, J.: Improved sea level record over the satellite altimetry era (1993–2010) from the Climate Change Initiative project, Ocean Sci., 11, 67–82, https://doi.org/10.5194/os-11-67-2015, 2015.
Ballu, V., Bouin, M. N., Siméoni, P., Crawford, W. C., Calmant, S., Boré, J. M., Kanas, T., and Pelletier, B.: Comparing the role of absolute sea-level rise and vertical tectonic motions in coastal flooding, Torres Islands (Vanuatu), P. Natl. Acad. Sci. USA, 108, 13019–13022, https://doi.org/10.1073/pnas.1102842108, 2011.
Berardino, P., Fornaro, G., Lanari, R., and Sansosti, E.: A new algorithm for surface deformation monitoring based on small baseline differential SAR interferograms, IEEE T. Geosci. Remote, 40, 2375–2383, https://doi.org/10.1109/tgrs.2002.803792, 2002.
Bertin, X., Li, K., Roland, A., and Bidlot, J. R.: The contribution of short-waves in storm surges: Two case studies in the Bay of Biscay, Cont. Shelf Res., 96, 1–15, https://doi.org/10.1016/j.csr.2015.01.005, 2015.
Blewitt, G., Hammond, W. C., and Kreemer, C.: Harnessing the GPS data explosion for interdisciplinary science, EOS T. Am. Geophys. Un., 99, https://doi.org/10.1029/2018EO104623, 2018.
BRGM: Regional Sea Level Change web client demonstrator, BRGM, Orléans, France, available at: https://sealevelrise.brgm.fr/, last access: 11 February 2021.
Bourdon, E. and Chiozzotto, C.: impacts géotechniques et hydrauliques de l'élévation du niveau de la mer due au changement climatique dans le contexte urbain côtier de la zone pointoise (Guadeloupe), [geotechnical and hydraulic impacts of sea-level rise caused by climate change in the urban coastal area surrounding Pointe-à-Pitre (Guadeloupe)], available at: http://infoterre.brgm.fr/rapports/RP-60857-FR.pdf (last access: 11 November 2020), 135 pp., 2012 (in French).
Camus, P., Tomás, A., Díaz-Hernández, G., Rodríguez, B., Izaguirre, C., and Losada, I. J.: Probabilistic assessment of port operation downtimes under climate change, Coast. Eng., 147, 12–24, https://doi.org/10.1016/j.coastaleng.2019.01.007, 2019.
Carson, M., Kohl, A., Stammer, D., Slangen, A. B. A., Katsman, C. A., van de Wal, R. S. W., Church, J., and White, N.: Coastal sea level changes, observed and projected during the 20th and 21st century, Clim. Change, 134, 269–281, https://doi.org/10.1007/s10584-015-1520-1, 2016.
Carson, M., Kohl, A., Stammer, D., Meyssignac, B., Church, J., Schroter, J., Wenzel, M., and Hamlington, B.: Regional Sea Level Variability and Trends, 1960–2007: A Comparison of Sea Level Reconstructions and Ocean Syntheses, J. Geophys. Res.-Oceans, 122, 9068–9091, https://doi.org/10.1002/2017jc012992, 2017.
Cazenave, A., Dominh, K., Ponchaut, F., Soudarin, L., Cretaux, J. F., and Le Provost, C.: Sea level changes from Topex-Poseidon altimetry and tide gauges, and vertical crustal motions from DORIS, Geophys. Res. Lett., 26, 2077–2080, https://doi.org/10.1029/1999gl900472, 1999.
Cesca, S., Letort, J., Razafindrakoto, H. N. T., Heimann, S., Rivalta, E., Isken, M. P., Nikkhoo, M., Passarelli, L., Petersen, G. M., Cotton, F., and Dahm, T.: Drainage of a deep magma reservoir near Mayotte inferred from seismicity and deformation, Nat. Geosci., 13, 87–93, https://doi.org/10.1038/s41561-019-0505-5, 2020.
Chauvin, F., Pilon, R., Palany, P., and Belmadani, A.: Future changes in Atlantic hurricanes with the rotated-stretched ARPEGE-Climat at very high resolution, Clim. Dynam., 54, 947–972, https://doi.org/10.1007/s00382-019-05040-4, 2020.
Chen, X. Y., Zhang, X. B., Church, J. A., Watson, C. S., King, M. A., Monselesan, D., Legresy, B., and Harig, C.: The increasing rate of global mean sea-level rise during 1993–2014, Nat. Clim. Change, 7, 492–495, https://doi.org/10.1038/nclimate3325, 2017.
Church, J. A., Clark, P. U., Cazenave, A., Gregory, J. M., Jevrejeva, S., Levermann, A., Merrifield, M. A., Milne, G. A., Nerem, R. S., Nunn, P. D., Payne, A. J., Pfeffer, W. T., Stammer, D., and Unnikrishnan, A. S.: Sea Level Change, in: Climate Change 2013: The Physical Science Basis. Contribution of Working Group I to the Fifth Assessment Report of the Intergovernmental Panel on Climate Change, Cambridge University Press, Cambridge, United Kingdom and New York, NY, USA, 2013a.
Church, J. A., Clark, P. U., Cazenave, A., Gregory, J. M., Jevrejeva, S., Levermann, A., Merrifield, M. A., Milne, G. A., Nerem, R. S., Nunn, P. D., Payne, A. J., Pfeffer, W. T., Stammer, D., and Unnikrishnan, A. S.: Sea-Level Rise by 2100, Science, 342, 1445–1445, https://doi.org/10.1126/science.342.6165.1445-a, 2013b.
Dahl, K. A., Fitzpatrick, M. F., and Spanger-Siegfried, E.: Sea level rise drives increased tidal flooding frequency at tide gauges along the US East and Gulf Coasts: Projections for 2030 and 2045, Plos One, 12, e0170949, https://doi.org/10.1371/journal.pone.0170949, 2017.
Dangendorf, S., Marcos, M., Woppelmann, G., Conrad, C. P., Frederikse, T., and Riva, R.: Reassessment of 20th century global mean sea level rise, P. Natl. Acad. Sci. USA, 114, 5946–5951, https://doi.org/10.1073/pnas.1616007114, 2017.
DEAL: Cartographie du territoire à risque d'inondation important (TRI) – Centre Guadeloupe. Rapport de présentation, [Mapping territories at risk of important innundation – Guadeloupe Center – presentation report], available at: http://www.guadeloupe.developpement-durable.gouv.fr/IMG/pdf/20150400_tricentre_i.pdf (last access: 11 February 2021), 2015 (in French).
de Michele, M.: Interférométrie radar sur la Guadeloupe 2003–2010 (champ géothermique de Bouillante), [Radar interferometry in Guadeloupe 2003–2010 (geothermal field of Bouillante)], BRGM, 23 pp., BRGM/RP-59247-FR, available at: http://infoterre.brgm.fr/rapports/RP-59247-FR.pdf (last access: 11 February 2021), 2010.
DeConto, R. M. and Pollard, D.: Contribution of Antarctica to past and future sea-level rise, Nature, 531, 591–597, https://doi.org/10.1038/nature17145, 2016.
Dieng, H. B., Cazenave, A., Meyssignac, B., and Ablain, M.: New estimate of the current rate of sea level rise from a sea level budget approach, Geophys. Res. Lett., 44, 3744–3751, https://doi.org/10.1002/2017gl073308, 2017.
Edwards, T. L., Brandon, M. A., Durand, G., Edwards, N. R., Golledge, N. R., Holden, P. B., Nias, I. J., Payne, A. J., Ritz, C., and Wernecke, A.: Revisiting Antarctic ice loss due to marine ice-cliff instability, Nature, 566, 58–64, https://doi.org/10.1038/s41586-019-0901-4, 2019.
Ezer, T. and Atkinson, L. P.: Accelerated flooding along the US East Coast: On the impact of sea-level rise, tides, storms, the Gulf Stream, and the North Atlantic Oscillations, Earths Future, 2, 362–382, https://doi.org/10.1002/2014ef000252, 2014.
Fürst, J. J., Goelzer, H., and Huybrechts, P.: Ice-dynamic projections of the Greenland ice sheet in response to atmospheric and oceanic warming, The Cryosphere, 9, 1039–1062, https://doi.org/10.5194/tc-9-1039-2015, 2015.
Gabriel, A. K., Goldstein, R. M., and Zebker, H. A.: MAPPING SMALL ELEVATION CHANGES OVER LARGE AREAS – DIFFERENTIAL RADAR INTERFEROMETRY, J. Geophys. Res.-Solid, 94, 9183–9191, https://doi.org/10.1029/JB094iB07p09183, 1989.
Garner, A. J., Weiss, J. L., Parris, A., Kopp, R. E., Horton, R. M., Overpeck, J. T., and Horton, B. P.: Evolution of 21st Century Sea Level Rise Projections, Earths Future, 6, 1603–1615, https://doi.org/10.1029/2018ef000991, 2018.
Gregory, J. M., Griffies, S. M., Hughes, C. W., Lowe, J. A., Church, J. A., Fukimori, I., Gomez, N., Kopp, R. E., Landerer, F., Le Cozannet, G., Ponte, R. M., Stammer, D., Tamisiea, M. E., and van de Wal, R. S. W.: Concepts and Terminology for Sea Level: Mean, Variability and Change, Both Local and Global, Surv. Geophys., 40, 1251–1289, https://doi.org/10.1007/s10712-019-09525-z, 2019.
Haasnoot, M., Kwadijk, J., Van Alphen, J., Le Bars, D., Van Den Hurk, B., Diermanse, F., Van Der Spek, A., Oude Essink, G., Delsman, J., and Mens, M.: Adaptation to uncertain sea-level rise; how uncertainty in Antarctic mass-loss impacts the coastal adaptation strategy of the Netherlands, Environ. Res. Lett., 15, 034007, https://doi.org/10.1088/1748-9326/ab666c, 2020.
Hanna, E., Fettweis, X., and Hall, R. J.: Brief communication: Recent changes in summer Greenland blocking captured by none of the CMIP5 models, The Cryosphere, 12, 3287–3292, https://doi.org/10.5194/tc-12-3287-2018, 2018.
Hinkel, J., Jaeger, C., Nicholls, R. J., Lowe, J., Renn, O., and Shi, P. J.: Sea-level rise scenarios and coastal risk management, Nat. Clim. Change, 5, 188–190, https://doi.org/10.1038/nclimate2505, 2015.
Hinkel, J., Church, J. A., Gregory, J. M., Lambert, E., Le Cozannet, G., Lowe, J., McInnes, K. L., Nicholls, R. J., van der Pol, T. D., and van de Wal, R.: Meeting User Needs for Sea Level Rise Information: A Decision Analysis Perspective, Earths Future, 7, 320–337, https://doi.org/10.1029/2018ef001071, 2019.
Jackson, L. P. and Jevrejeva, S.: A probabilistic approach to 21st century regional sea-level projections using RCP and High-end scenarios, Global Planet. Change, 146, 179–189, https://doi.org/10.1016/j.gloplacha.2016.10.006, 2016.
Jacobs, J. M., Cattaneo, L. R., Sweet, W., and Mansfield, T.: Recent and Future Outlooks for Nuisance Flooding Impacts on Roadways on the US East Coast, Transp. Res. Record, 2672, 1–10, https://doi.org/10.1177/0361198118756366, 2018.
Jamero, M. L., Onuki, M., Esteban, M., Billones-Sensano, X. K., Tan, N., Nellas, A., Takagi, H., Thao, N. D., and Valenzuela, V. P.: Small-island communities in the Philippines prefer local measures to relocation in response to sea-level rise, Nat. Clim. Change, 7, 581–586, https://doi.org/10.1038/nclimate3344, 2017.
Jevrejeva, S., Moore, J. C., Grinsted, A., Matthews, A. P., and Spada, G.: Trends and acceleration in global and regional sea levels since 1807, Global Planet. Change, 113, 11–22, https://doi.org/10.1016/j.gloplacha.2013.12.004, 2014.
Jevrejeva, S., Bricheno, L., Brown, J., Byrne, D., De Dominicis, M., Matthews, A., Rynders, S., Palanisamy, H., and Wolf, J.: Quantifying processes contributing to marine hazards to inform coastal climate resilience assessments, demonstrated for the Caribbean Sea, Nat. Hazards Earth Syst. Sci., 20, 2609–2626, https://doi.org/10.5194/nhess-20-2609-2020, 2020.
Knapp, K. R., Kruk, M. C., Levinson, D. H., Diamond, H. J., and Neumann, C. J.: The International Best track Archive for Climate Stewardship (IBTrACS) Unifying Tropical Cyclone Data, B. Am. Meteorol. Soc., 91, 363–376, https://doi.org/10.1175/2009bams2755.1, 2010.
Kopp, R. E.: Does the mid-Atlantic United States sea level acceleration hot spot reflect ocean dynamic variability?, Geophys. Res. Lett., 40, 3981–3985, https://doi.org/10.1002/grl.50781, 2013.
Kopp, R. E., Horton, R. M., Little, C. M., Mitrovica, J. X., Oppenheimer, M., Rasmussen, D. J., Strauss, B. H., and Tebaldi, C.: Probabilistic 21st and 22nd century sea-level projections at a global network of tide-gauge sites, Earths Future, 2, 383–406, https://doi.org/10.1002/2014ef000239, 2014.
Kopp, R. E., DeConto, R. M., Bader, D. A., Hay, C. C., Horton, R. M., Kulp, S., Oppenheimer, M., Pollard, D., and Strauss, B. H.: Evolving Understanding of Antarctic Ice-Sheet Physics and Ambiguity in Probabilistic Sea-Level Projections, Earths Future, 5, 1217–1233, https://doi.org/10.1002/2017ef000663, 2017.
Krien, Y., Dudon, B., Roger, J., and Zahibo, N.: Probabilistic hurricane-induced storm surge hazard assessment in Guadeloupe, Lesser Antilles, Nat. Hazards Earth Syst. Sci., 15, 1711–1720, https://doi.org/10.5194/nhess-15-1711-2015, 2015.
Kumar, L., and Taylor, S.: Exposure of coastal built assets in the South Pacific to climate risks, Nat. Clim. Change, 5, 992–996, https://doi.org/10.1038/nclimate2702, 2015.
Le Bars, D., Drijfhout, S., and de Vries, H.: A high-end sea level rise probabilistic projection including rapid Antarctic ice sheet mass loss, Environ. Res. Lett., 12, 044013, https://doi.org/10.1088/1748-9326/aa6512, 2017.
Le Bars, D.: Uncertainty in Sea Level Rise Projections Due to the Dependence Between Contributors, Earths Future, 6, 1275–1291, https://doi.org/10.1029/2018ef000849, 2018.
Le Cozannet, G., Raucoules, D., Woppelmann, G., Garcin, M., Da Sylva, S., Meyssignac, B., Gravelle, M., and Lavigne, F.: Vertical ground motion and historical sea-level records in Dakar (Senegal), Environ. Res. Lett., 10, , 084016, https://doi.org/10.1088/1748-9326/10/8/084016, 2015.
Le Cozannet, G., Nicholls, R., Hinkel, J., Sweet, W., McInnes, K., Van de Wal, R., Slangen, A., Lowe, J., and White, K.: Sea Level Change and Coastal Climate Services: The Way Forward, J. Mar. Sci. Eng., 5, 49, https://doi.org/10.3390/jmse5040049, 2017.
Le Cozannet, G., Thiéblemont, R., Rohmer, J., Idier, D., Manceau, J. C., and Quique, R.: Low-End Probabilistic Sea-Level Projections, Water, 11, 1507, https://doi.org/10.3390/w11071507, 2019.
Le Mouelic, S., Raucoules, D., Carnec, C., and King, C.: A least squares adjustment of multi-temporal InSAR data: Application to the ground deformation of Paris, Photogramm. Eng. Remote Sens., 71, 197–204, https://doi.org/10.14358/pers.71.2.197, 2005.
Lemoine, A., Briole, P., Bertil, D., Roullé, A., Foumelis, M., Thinon, I., Raucoules, D., De Michele, M., and Valty, P.: The 2018–2019 Seismo-volcanic Crisis East of Mayotte, Comoros Islands: Seismicity and Ground Deformation Markers of an Exceptional Submarine Eruption, Geophys. J. Int., 223, 22–44, https://doi.org/10.1093/gji/ggaa273, 2018.
Martinez-Asensio, A., Woppelmann, G., Ballu, V., Becker, M., Testut, L., Magnan, A. K., and Duvat, V. K. E.: Relative sea-level rise and the influence of vertical land motion at Tropical Pacific Islands, Global Planet. Change, 176, 132–143, https://doi.org/10.1016/j.gloplacha.2019.03.008, 2019.
Massonnet, D., Rossi, M., Carmona, C., Adragna, F., Peltzer, G., Feigl, K., and Rabaute, T.: The Displacement Field of the Landers Earthquake Mapped by Radar Interferometry, Nature, 364, 138–142, https://doi.org/10.1038/364138a0, 1993.
Melet, A., Meyssignac, B., Almar, R., and Le Cozannet, G.: Under-estimated wave contribution to coastal sea-level rise, Nat. Clim. Change, 8, 234–239, https://doi.org/10.1038/s41558-018-0088-y, 2018.
Meredith, M., Sommerkorn, M., Cassotta, S., Derksen, C., Ekaykin, A., Hollowed, A., Kofinas, G., Mackintosh, A., Melbourne-Thomas, J., Muelbert, M. M. C., Ottersen, G., Pritchard, H., and Schuur, E. A. G.: Polar Regions, in: IPCC Special Report on the Ocean and Cryosphere in a Changing Climate, edited by: Pörtner, H.-O., Roberts, D. C., Masson-Delmotte, V., Zhai, P., Tignor, M., Poloczanska, E., Mintenbeck, K., Alegría, A., Nicolai, M., Okem, A., Petzold, J., Rama, B., and Weyer, N. M., available at: https://www.ipcc.ch/srocc/chapter/chapter-3-2/ (last access: 11 February 2021), 2019.
Meyssignac, B., Becker, M., Llovel, W., and Cazenave, A.: An Assessment of Two-Dimensional Past Sea Level Reconstructions Over 1950–2009 Based on Tide-Gauge Data and Different Input Sea Level Grids, Surv. Geophys., 33, 945–972, https://doi.org/10.1007/s10712-011-9171-x, 2012.
Moftakhari, H. R., AghaKouchak, A., Sanders, B. F., Feldman, D. L., Sweet, W., Matthew, R. A., and Luke, A.: Increased nuisance flooding along the coasts of the United States due to sea level rise: Past and future, Geophys. Res. Lett., 42, 9846–9852, https://doi.org/10.1002/2015gl066072, 2015.
Moftakhari, H. R., AghaKouchak, A., Sanders, B. F., and Matthew, R. A.: Cumulative hazard: The case of nuisance flooding, Earths Future, 5, 214–223, https://doi.org/10.1002/2016ef000494, 2017.
Nachmany, M. and Mangan, E.: Aligning national and international climate targets, available at: https://www.lse.ac.uk/granthaminstitute/publication/targets/ (last access: 11 February 2021), 2018.
Nicholls, R. J., Hanson, S. E., Lowe, J. A., Warrick, R. A., Lu, X. F., and Long, A. J.: Sea-level scenarios for evaluating coastal impacts, WIRES Clim. Change, 5, 129–150, https://doi.org/10.1002/wcc.253, 2014.
Nurse, L. A., McLean, R. F., Agard, J., Briguglio, L. P., Duvat-Magnan, V., Pelesikoti, N., Tompkins, E., and Webb, A.: Small islands, in: Climate Change 2014: Impacts, Adaptation, and Vulnerability. Part B: Regional Aspects.Contribution of Working Group II to the Fifth Assessment Report of the Intergovernmental Panel on Climate Change, edited by: Barros, V. R., Field, C. B., Dokken, D. J., Mastrandrea, M. D., Mach, K. J., Bilir, T. E., Chatterjee, M., Ebi, K. L., Estrada, Y. O., Genova, R. C., Girma, B., Kissel, E. S., Levy, A. N., MacCracken, S., Mastrandrea, P. R., and White, L. L., Cambridge University Press, Cambridge, United Kingdom and New York, NY, USA, 1613–1654, 2014.
Oppenheimer, M., Glavovic, B. C., Hinkel, J., van de Wal, R., Magnan, A. K., Abd-Elgawad, A., Cai, R., Cifuentes-Jara, M., DeConto, R. M., Ghosh, T., Hay, J., Isla, F., Marzeion, B., Meyssignac, B., and Sebesvari, Z.: Sea Level Rise and Implications for Low-Lying Islands, Coasts and Communities, in: IPCC Special Report on the Ocean and Cryosphere in a Changing Climate, edited by: Pörtner, H.-O., Roberts, D. C., Masson-Delmotte, V., Zhai, P., Tignor, M., Poloczanska, E., Mintenbeck, K., Alegría, A., Nicolai, M., Okem, A., Petzold, J., Rama, B., and Weyer, N. M.: available at: https://www.ipcc.ch/site/assets/uploads/sites/3/2019/11/08_SROCC_Ch04_FINAL.pdf (last access: 11 February 2021), 2019.
Palanisamy, H., Becker, M., Meyssignac, B., Henry, O., and Cazenave, A.: Regional sea level change and variability in the Caribbean Sea since 1950, J. Geodetic Sci., 2, 125–133, https://doi.org/10.2478/v10156-011-0029-4, 2012.
Pattyn, F.: The paradigm shift in Antarctic ice sheet modelling, Nat. Commun., 9, 2728–2728, https://doi.org/10.1038/s41467-018-05003-z, 2018.
Pedreros, R., Terrier, M., and Poisson, B.: Tsunamis: Etude de cas au niveau de la côte antillaise française, Rapport de synthèse, [Tsunamis: case study at the French Carribean coasts – synthesis report] BRGM/RP-55795-FR, 72 pp., 2007 (in French).
Pedreros, R., Lecacheux, S., Paris, F., Lambert, J., Le Roy, S., Garcin, M., and Mompelat, J. M.: OURAGAN 1928: Modélisation de la submersion marine que génèrerait aujourd'hui un ouragan de type 1928 sur le Petit-Cul-de-Sac-marin et l'agglomération Pontoise [Marine flooding modelling induced by a 1928-like event in the Petit-Cul-de-Sac-marin and in the area of Pointe-à-Pitre], Rapport final, 78 pp., 2016 (in French).
Pedreros, R., Idier, D., Muller, H., Lecacheux, S., Paris, F., Yates-Michelin, M., Dumas, F., Pineau-Guillou, L., and Senechal, N.: Relative Contribution of Wave Setup to the Storm Surge: Observations and Modeling Based Analysis in Open and Protected Environments (Truc Vert beach and Tubuai island), in: Proceedings from the International Coastal Symposium (ICS) 2018 (Busan, Republic of Korea), edited by: Shim, J.-S., Chun, I., and Lim, H. S., J. Coast. Res., 1046–1050, https://doi.org/10.2112/si85-210.1, 2018.
Pickering, M. D., Horsburgh, K. J., Blundell, J. R., Hirschi, J. J. M., Nicholls, R. J., Verlaan, M., and Wells, N. C.: The impact of future sea-level rise on the global tides, Cont. Shelf Res., 142, 50–68, https://doi.org/10.1016/j.csr.2017.02.004, 2017.
Raucoules, D., Le Cozannet, G., Woppelmann, G., de Michele, M., Gravelle, M., Daag, A., and Marcos, M.: High nonlinear urban ground motion in Manila (Philippines) from 1993 to 2010 observed by DInSAR: Implications for sea-level measurement, Remote Sens. Environ., 139, 386–397, https://doi.org/10.1016/j.rse.2013.08.021, 2013.
Riahi, K., van Vuuren, D. P., Kriegler, E., Edmonds, J., O'Neill, B. C., Fujimori, S., Bauer, N., Calvin, K., Dellink, R., Fricko, O., Lutz, W., Popp, A., Cuaresma, J. C., Kc, S., Leimbach, M., Jiang, L., Kram, T., Rao, S., Emmerling, J., Ebi, K., Hasegawa, T., Havlik, P., Humpenöder, F., Da Silva, L. A., Smith, S., Stehfest, E., Bosetti, V., Eom, J., Gernaat, D., Masui, T., Rogelj, J., Strefler, J., Drouet, L., Krey, V., Luderer, G., Harmsen, M., Takahashi, K., Baumstark, L., Doelman, J. C., Kainuma, M., Klimont, Z., Marangoni, G., Lotze-Campen, H., Obersteiner, M., Tabeau, A., and Tavoni, M.: The Shared Socioeconomic Pathways and their energy, land use, and greenhouse gas emissions implications: An overview, Global Environ. Chang., 42, 153–168, https://doi.org/10.1016/J.GLOENVCHA.2016.05.009, 2017.
Ritz, C., Edwards, T. L., Durand, G., Payne, A. J., Peyaud, V., and Hindmarsh, R. C. A.: Potential sea-level rise from Antarctic ice-sheet instability constrained by observations, Nature, 528, 115–118, https://doi.org/10.1038/nature16147, 2015.
Rockström, J., Gaffney, O., Rogelj, J., Meinshausen, M., Nakicenovic, N., and Schellnhuber, H. J.: A roadmap for rapid decarbonization, Science, 355, 1269–1271, 2017.
Roques, C., Bengoubou-Valérius, M., Le Cozannet, G., Bourdon, E., Mompelat, J.-M., and Oliveros, C.: Evolution et dynamique du trait de côte de l'archipel guadeloupéen étude de 1956 à 2004, [Shoreline evolution and dynamics in the Guadeloupe archipellago from 1956 to 2004], Rapport BRGM/RP-58750-FR, 93 pp., 28 fig., 5 ann., 2010.
Rueda, A., Vitousek, S., Camus, P., Tomas, A., Espejo, A., Losada, I. J., Barnard, P. L., Erikson, L. H., Ruggiero, P., Reguero, B. G., and Mendez, F. J.: A global classification of coastal flood hazard climates associated with large-scale oceanographic forcing, Sci. Rep.-UK, 7, 5038, https://doi.org/10.1038/s41598-017-05090-w, 2017.
Sakic, P., Männel, B., Bradke, M., Ballu, V., de Chabalier, J.-B., and Lemarchand, A.: Estimation of Lesser Antilles vertical velocity using a GNSS-PPP software comparison, in: International Association of Geodesy Symposia, Springer, Berlin, Heidelberg, https://doi.org/10.1007/1345_2020_101, 2020.
Santamaria-Gomez, A., Gravelle, M., Collilieux, X., Guichard, M., Miguez, B. M., Tiphaneau, P., and Woppelmann, G.: Mitigating the effects of vertical land motion in tide gauge records using a state-of-the-art GPS velocity field, Global Planet. Change, 98–99, 6–17, https://doi.org/10.1016/j.gloplacha.2012.07.007, 2012.
Santamaria-Gomez, A., Gravelle, M., Dangendorf, S., Marcos, M., Spada, G., and Woppelmann, G.: Uncertainty of the 20th century sea-level rise due to vertical land motion errors, Earth Planet. Sci. Lett., 473, 24–32, https://doi.org/10.1016/j.epsl.2017.05.038, 2017.
Schindelegger, M., Green, J. A. M., Wilmes, S. B., and Haigh, I. D.: Can We Model the Effect of Observed Sea Level Rise on Tides?, J. Geophys. Res.-Oceans, 123, 4593–4609, https://doi.org/10.1029/2018jc013959, 2018.
Slangen, A. B. A., Katsman, C. A., van de Wal, R. S. W., Vermeersen, L. L. A., and Riva, R. E. M.: Towards regional projections of twenty-first century sea-level change based on IPCC SRES scenarios, Clim. Dynam., 38, 1191–1209, https://doi.org/10.1007/s00382-011-1057-6, 2012.
Slangen, A. B. A., Carson, M., Katsman, C. A., van de Wal, R. S. W., Kohl, A., Vermeersen, L. L. A., and Stammer, D.: Projecting twenty-first century regional sea-level changes, Climatic Change, 124, 317–332, https://doi.org/10.1007/s10584-014-1080-9, 2014.
Spada, G., Bamber, J. L., and Hurkmans, R.: The gravitationally consistent sea- level fingerprint of future terrestrial ice loss, Geophys. Res. Lett., 40, 482–486, https://doi.org/10.1029/2012gl053000, 2013.
Stammer, D., Cazenave, A., Ponte, R. M., and Tamisiea, M. E.: Causes for Contemporary Regional Sea Level Changes, Annu. Rev. Mar. Sci., 5, 21–46, 2013.
Stammer, D., van de Wal, R. S. W., Nicholls, R. J., Church, J. A., Le Cozannet, G., Lowe, J. A., Horton, B. P., White, K., Behar, D., and Hinkel, J.: Framework for High-End Estimates of Sea Level Rise for Stakeholder Applications, Earths Future, 7, 923–938, https://doi.org/10.1029/2019ef001163, 2019.
Stephens, S. A., Bell, R. G., and Lawrence, J.: Developing signals to trigger adaptation to sea-level rise, Environ. Res. Lett., 13, 104004, https://doi.org/10.1088/1748-9326/aadf96, 2018.
Sweet, W. V. and Park, J.: From the extreme to the mean: Acceleration and tipping points of coastal inundation from sea level rise, Earths Future, 2, 579–600, https://doi.org/10.1002/2014ef000272, 2014.
Thiéblemont, R., Le Cozannet, G., Toimil, A., Meyssignac, B., and Losada, I. J.: Likely and High-End Impacts of Regional Sea-Level Rise on the Shoreline Change of European Sandy Coasts Under a High Greenhouse Gas Emissions Scenario, Water, 11, 2607, https://doi.org/10.3390/w11122607, 2019.
Thompson, R. and Hamon, B. V.: Wave setup of harbor water levels, J. Geophys. Res.-Oceans, 85, 1151–1152, https://doi.org/10.1029/JC085iC02p01151, 1980.
University of Hamburg: AR5 Sea Level Rise, Integrated Climate Data Center (ICDC), University of Hamburg, Hamburg, Germany, available at: https://icdc.cen.uni-hamburg.de/en/ar5-slr.html, last access: 11 February 2021.
Usai, S.: A least squares database approach for SAR interferometric data, IEEE T. Geosci. Remote, 41, 753–760, https://doi.org/10.1109/tgrs.2003.810675, 2003.
Wegmüller, U., Werner, C. L., and Santoro, M.: Motion monitoring for Etna using ALOS PALSAR time series, ALOS PI Symposium 2009, Hawaii, 9–13 November 2009, 2009.
Williams, S., Bock, Y., and Fang, P.: Integrated satellite interferometry: Tropospheric noise, GPS estimates and implications for interferometric synthetic aperture radar products, J. Geophys. Res.-Solid, 103, 27051–27067, https://doi.org/10.1029/98jb02794, 1998.
Woppelmann, G. and Marcos, M.: Vertical land motion as a key to understanding sea level change and variability, Rev. Geophys., 54, 64–92, https://doi.org/10.1002/2015rg000502, 2016.