the Creative Commons Attribution 4.0 License.
the Creative Commons Attribution 4.0 License.
 | 02 Feb 2021
A revision of the Combined Drought Indicator (CDI) used in the European Drought Observatory (EDO)
Carmelo Cammalleri
Carolina Arias-Muñoz
Paulo Barbosa
Alfred de Jager
Diego Magni
Dario Masante
Marco Mazzeschi
Niall McCormick
Gustavo Naumann
Jonathan Spinoni
Jürgen Vogt
Building on almost 10 years of expertise and operational application of the Combined Drought Indicator (CDI), which is implemented within the European Commission's European Drought Observatory (EDO) for the purposes of early warning and monitoring of agricultural droughts in Europe, this paper proposes a revised version of the index. The CDI conceptualizes drought as a cascade process, where a precipitation shortage (WATCH stage) develops into a soil water deficit (WARNING stage), which in turn leads to stress for vegetation (ALERT stage). The main goal of the revised CDI proposed here is to improve the indicator's performance for those events that are currently not reliably represented, without altering either the modelling conceptual framework or the required input datasets. This is achieved by means of two main modifications: (a) use of the previously occurring CDI value to improve the temporal consistency of the time series and (b) introduction of two temporary classes – namely TEMPORARY RECOVERY for soil moisture and vegetation greenness, respectively – to avoid brief discontinuities in a stage. The efficacy of the modifications is tested by comparing the performances of the revised and currently implemented versions of the indicator for actual drought events in Europe during the last 20 years. The revised CDI reliably reproduces the evolution of major droughts, outperforming the current version of the indicator, especially for long-lasting events, and reducing the overall temporal inconsistencies in stage sequencing of about 70 %. Since the revised CDI does not need supplementary input datasets, it is suitable for operational implementation within the EDO drought monitoring system.
- Article
(6182 KB) - Full-text XML
- BibTeX
- EndNote


In the past 20 years, the monitoring of drought events has gained increasing relevance thanks to the shift in the paradigm for drought risk management from a reactive to a proactive approach (Wilhite and Pulwarty, 2005). As advocated by WMO and GWP (2014), drought monitoring and early warning systems represent one of the three main pillars for successful integrated drought management (the others being vulnerability and impact assessment and drought preparedness, mitigation, and response). A drought monitoring and early warning system identifies climate and water resources trends and detects the emergence or probability of occurrence and the likely severity of droughts and its impacts, and it should provide reliable information about impending drought conditions that can be timely communicated to water managers, policymakers, and the public (Vogt et al., 2018a).
As highlighted in WMO and GWP (2016), monitoring the different aspects of drought may require a variety of drought indicators and indices. In particular, the authors distinguish among three typologies of index-based monitoring systems: (i) single indicator, (ii) multiple indicators, and (iii) composite or hybrid indicators. The latter group allows for the integration of a potentially large number of elements into the assessment process of drought characteristics.
A progenitor in the composite indicator category is the approach developed in the United States Drought Monitor (https://droughtmonitor.unl.edu, last access: January 2021), based on an expert-supervised combination of a percentile ranking of several indices for a weekly-based index (Svoboda et al., 2002). Another combined indicator, which was developed as part of the operational Global Integrated Drought Monitoring and Prediction System (GIDMaPS, http://drought.eng.uci.edu, last access: January 2021), is the Multivariate Standardized Drought Index (MSDI; Hao and AghaKouchak, 2013), which is based on a combination of soil moisture and precipitation anomalies through a copula function.
At a European scale, the Combined Drought Indicator (CDI) provides a concise representation of the evolution of agricultural droughts, suitable for communication to both specialized end users, policymakers, and the general public (Vogt et al., 2018b). The CDI, originally conceived by Sepulcre-Canto et al. (2012), has been successfully applied within the European Drought Observatory (EDO, https://edo.jrc.ec.europa.eu, last access: January 2021) of the EU's Copernicus Emergency Management Service (https://emergency.copernicus.eu, last access: January 2021), as part of a near-real-time monitoring with dekadal (roughly 10 d, 3 times per month) updates and a time lag of just a few days.
A similar combining approach, albeit with a strong focus on agricultural production and food security, has been recently implemented as part of the European Commission's Anomaly hot Spots of Agricultural Production (ASAP, https://mars.jrc.ec.europa.eu/asap, last access: January 2021) system (Rembold et al., 2019).
Other hybrid drought indicators, mostly based on the combination of meteorological soil moisture and streamflow indices via artificial neural networks or entropy theory, were recently introduced in the literature and applied in several regional studies (i.e. Karamoutz et al., 2009; Yang et al., 2014; Zhu et al., 2018).
Regarding the CDI, it has proved to be effective at reliably capturing the start and development of most of the severe droughts that affected European countries throughout almost 10 years of its operational use in EDO, as documented by the analytical drought reports that are regularly published through the EDO web portal (https://edo.jrc.ec.europa.eu/edov2/php/index.php?id=1051, last access: January 2021). Maps of EDO's CDI have also been extensively used by the European Commission's Emergency Response Coordination Centre (ERCC), for their daily maps on the most important ongoing emergency events (https://erccportal.jrc.ec.europa.eu/Maps/Daily-maps, last access: January 2021).
While the CDI can claim a considerable number of successful applications in the case of recognized drought events, a day-by-day analysis of its various components has led to an increased understanding of its behaviour and has also highlighted potential improvements, particularly with regard to its temporal consistency in the case of long-lasting events. The resulting expertise, which is based on extensive practical experience and a long history of actual cases, can be used to improve the indicator's performance in those circumstances where it currently may fall short of expectations. However, given the operational nature of the index and its reliance on the availability of near-real-time input data, changes on the current forcing data are not considered at this stage, since this may require the acquisition of additional datasets not readily available in an operational context. Additionally, any modifications to the modelling framework of an established indicator such as the CDI must take into account the existing considerable community of users, who are accustomed to the indicator in its current form, as well as its acceptance within the scientific community as a recognized indicator (e.g. Clark et al., 2016; Mariani et al., 2018; WMO and GWP, 2016), as further exemplified by its use in major case studies and inter-comparison analyses (e.g. Blauhut et al., 2016; Jiménez-Donaire et al., 2020; Schwarz et al., 2020).
In light of these considerations, the main goal of this paper is to propose a revised version of the CDI, with a focus on improving the overall quality of the indicator's performance without introducing additional or alternative input datasets, and to preserve the original modelling concept that has achieved successful results over many documented case studies. To this end, the study compares the performance of the proposed revision of the indicator against the current operational EDO version during some of the main drought events in Europe in the past 20 years. The spatiotemporal characteristics of these droughts were derived from independent data sources, such as yield and impact databases, and were used as reference to assess the consistency of the model outcomes with the background theoretical framework and the adherence to the observed real drought dynamics.
In this section, the input datasets that are used for computing the CDI are described, and the computation methods that are applied in both the current version and proposed revision of the indicator are outlined. The set of case studies of past drought events used to compare the performances of the current and proposed new versions of the indicator is also described, together with the adopted evaluation strategy.
2.1 Input datasets
The Combined Drought Indicator (CDI) is computed on the basis of the inter-dependency of three main variables: precipitation, soil moisture, and vegetation greenness. The values for each of these quantities are standardized as deviations from historical climatology and compared with a threshold value to discriminate between normal and extreme conditions. While the data processing approach is conceptually analogous for all three variables, some peculiarities (for example regarding the data's spatiotemporal resolution and reference baseline) are worth highlighting, and these are described in the following sub-sections.
2.1.1 Precipitation
Monthly precipitation maps at a spatial resolution of 0.25∘ are derived by blending daily rainfall observations at SYNOP (surface synoptic observations) stations from the MARS database (Monitoring Agricultural ResourceS, http://mars.jrc.ec.europa.eu, last access: January 2021) of the European Commission's Joint Research Centre (JRC), with monthly precipitation maps at a spatial resolution of 1.0∘ from the Global Precipitation Climatology Centre (GPCC, https://opendata.dwd.de/climate_environment/GPCC/html/download_gate.html, last access: January 2021).
The 1-month and 3-month standardized precipitation indices (SPI-1 and SPI-3, respectively; McKee et al., 1993) are calculated using the two-parameter gamma distribution fitted over a 30-year reference period (1981–2010) using the maximum likelihood estimators of Thom (1958) and Greenwood and Durand (1960). SPI-3 is selected because of its documented correlation with agricultural drought (WMO, 2012), whereas SPI-1 is selected due to its suitability for detecting the possible occurrence of flash droughts (when combined with increased evaporative demand due to high temperatures, low humidity, and/or strong winds), as described by Otkin et al. (2018). In line with Sepulcre-Canto et al. (2012), a threshold value of −1.0 is used for SPI-3, marking the start of moderately dry conditions according to McKee et al. (1993), whereas a threshold value of −2.0 is used for SPI-1, denoting the start of extremely dry conditions.
For computing the CDI, both SPI indicators are used jointly to detect precipitation shortages. Hence, for the sake of simplicity a Boolean SPI indicator (zSPI) is defined, which assumes a value of 1 if either SPI-1 or SPI-3 reports a dry status, as follows:
2.1.2 Soil moisture
The soil moisture anomaly index (zSM) is computed using the modelled soil moisture output of the LISFLOOD hydrological precipitation–runoff model (De Roo et al., 2000). Firstly, dekadal (roughly 10 d) maps of the soil moisture index (SMI; Seneviratne et al., 2010) are computed at a spatial resolution of 5 km, as a weighted average of the daily volumetric soil moisture values produced by LISFLOOD for the skin and root zone layers. Successively, the zSM is computed as standardized deviations (i.e. z scores) of the values from the full available period (1995–2018).
In the present study, SMI replaces the soil suction (pF) that was previously used both within EDO and for the original development of the CDI. This has been done as part of a reorganization of the EDO data portal, in order to improve the readability of maps for non-expert users, given that SMI simply ranges from 0 (dry) to 1 (wet). Since both SMI and pF are derived from the same daily volumetric soil moisture dataset and using the same pedotransfer function (PTF; Laguardia and Niemeyer, 2008), the obtained zSM maps are in practical terms the opposite of the anomaly pF used in Sepulcre-Canto et al. (2012). Following these considerations, a threshold of −1 is adopted to discriminate dry conditions in zSM, analogously to what is used for SPI-3.
2.1.3 Vegetation greenness
In this study, the biophysical variable fraction of absorbed photosynthetically active radiation (fAPAR), which is estimated from satellite remote sensing data, is used as a proxy for the health status of vegetation. Sepulcre-Canto et al. (2012) adopted the 10 d composite fAPAR images provided by the European Space Agency (ESA), derived from the Medium Resolution Imaging Spectrometer (MERIS) on board the Envisat (Environmental Satellite) platform. Following the failure of ENVISAT in 2012, the MOD15A2H Collection 6 fAPAR product (Myneni et al., 2015), as derived from the Moderate-Resolution Imaging Spectroradiometer (MODIS) sensor on board the Terra satellite, has been used as a replacement in the operational implementation of the CDI.
The MOD15A2H product is provided by the US National Aeronautics and Space Administration (NASA) at a spatial resolution of 500 m, as 8 d maximum composites. Within EDO, these raw data are re-projected onto a 0.01∘ latitude and longitude regular grid, and dekadal maps are derived by means of a weighted average of the two closest 8 d maps followed by an exponential smoothing (Cammalleri et al., 2019). As in the case for soil moisture, anomalies of fAPAR (zfAPAR) are computed as a standardized z score on the full available dataset baseline period (2001–2018). Also here, a threshold value of −1.0 is adopted to highlight dry conditions.
2.2 The current version of the CDI, as implemented in EDO (CDI-v1)
As is described in detail by Sepulcre-Canto et al. (2012), in the modelling framework of the CDI the evolution of a drought event is conceptualized by a cause–effect relationship, assuming that a shortage in precipitation leads to a soil moisture deficit, culminating in reduced vegetation productivity. In its original form, data for the variables zSPI, zSM, and zfAPAR (see above) are used to characterize three stages of an idealized agricultural drought:
-
WATCH, in which the precipitation is below normal (zSPI =1) and an early warning signal of a potential drought affecting agriculture can be observed;
-
WARNING, when a precipitation deficit propagates in the hydrological cycle and affects soil water content (zSPI =1 & zSM < −1); and
-
ALERT, when the effects of drought become visible as vegetation stress (zSPI =1 & zfAPAR <−1).
During the operational implementation of the indicator, two additional recovery stages were introduced (see https://edo.jrc.ec.europa.eu/factsheets, last access: January 2021), aimed at better capturing the fade-out phase of a drought, namely the PARTIAL RECOVERY and FULL RECOVERY stages. In both stages, the previous month's zSPI (zSPIm−1) is introduced to account for the preceding conditions:
-
PARTIAL RECOVERY: zSPI returns to normal values even if vegetation is still negatively affected (zSPI & zSPI =0 & zfAPAR <−1).
-
FULL RECOVERY: both precipitation and fAPAR return to normal conditions (zSPI & zSPI =0 & zfAPAR ).
This operational implementation of the index is the one commonly referred to in the scientific and technical drought literature when the CDI is described.
The CDI modelling framework described above is summarized in Fig. 1, where the different stages of the CDI (from WATCH to FULL RECOVERY) are depicted according to the eight cases that can be obtained by combining the two possible binary states for each of the three main variables (zSPI, zSM, and zfAPAR), as well as a function of zSPIm−1.
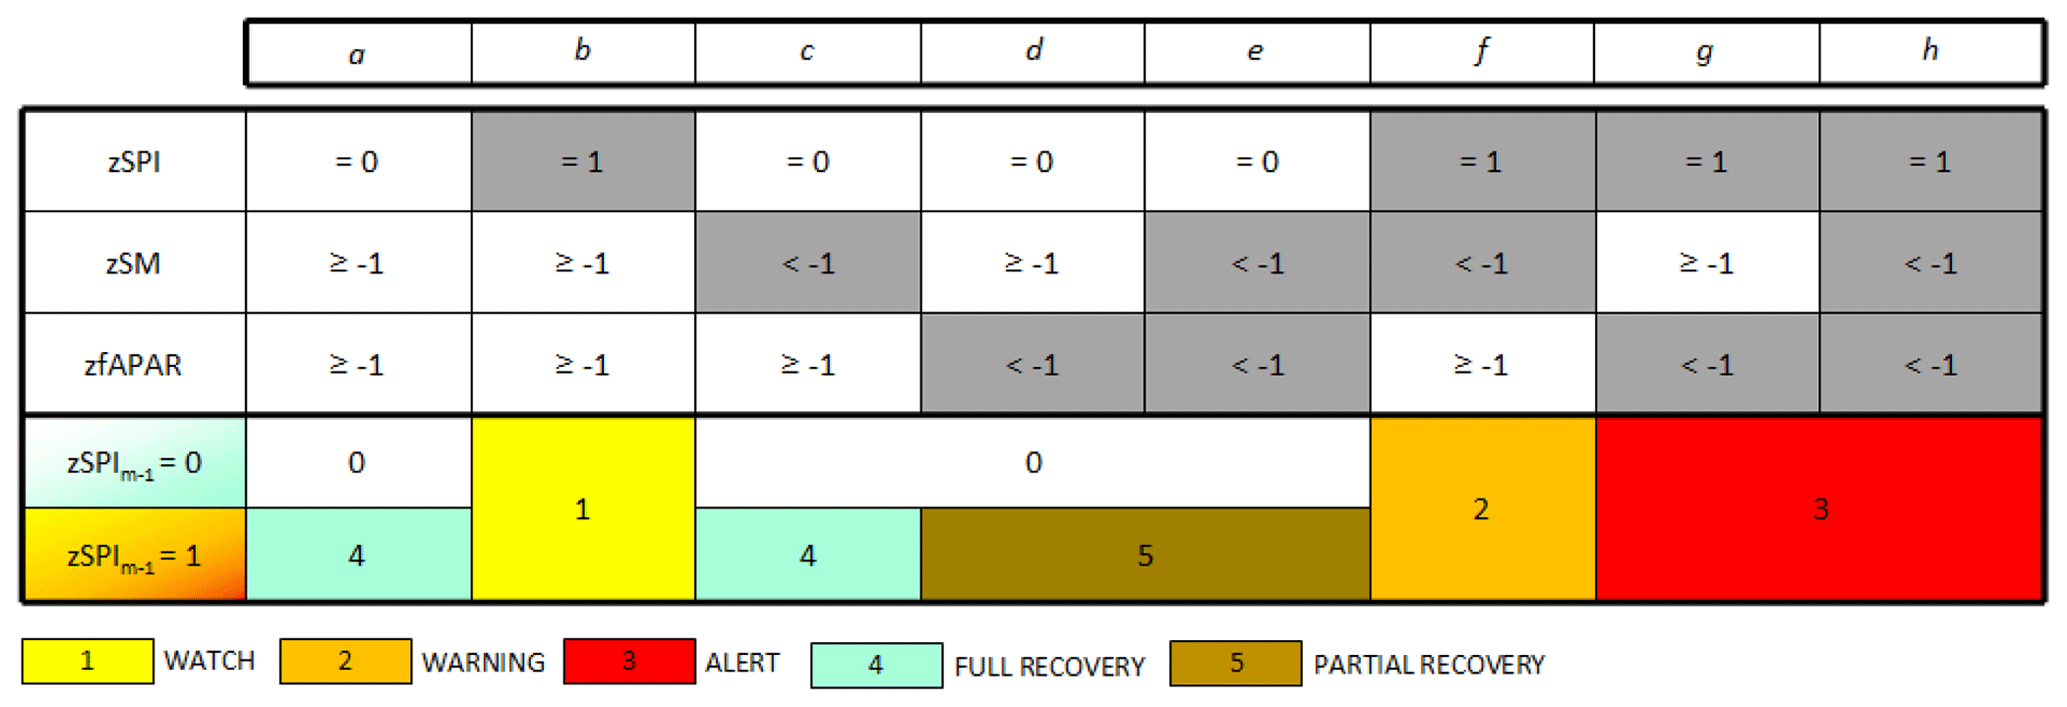
Figure 1Schematic representation of the CDI-v1 computation procedure. The upper part of the table reports the eight possible combinations of the three main Boolean quantities (from a to h). The lower part of the table reports the corresponding CDI classes for the two possible cases of antecedent zSPI (subscript m−1).
Due to its operational status, the maps of the CDI that are currently available in EDO are always processed using data available up to the release date of a new map. For this reason, some inconsistencies in the reference baseline and actual data (e.g. fAPAR data source) are present in this operational dataset. For the present study, a self-consistent dataset has been produced by re-computing the CDI with the best data available at the end of 2018. This dataset (referred to here as CDI-v1) consists of 648 dekadal maps at 5 km spatial resolution, from January 2001 to December 2018. In order to compute the CDI at this spatial resolution, the original data for zSPI and zfAPAR were initially resampled over the zSM grid, using the nearest-neighbour and spatial-average procedure, respectively.
2.3 The revised version of the CDI proposed here (CDI-v2)
In order to better understand the modifications to the CDI that are proposed here, two case studies where CDI-v1 was not able to capture the evolution of the drought in full, are first reported.
The original concept behind the CDI assumes the sequential occurrence of extreme conditions detected by the three constituent indicators (i.e. SPI, soil moisture anomalies, and fAPAR anomalies). In fact, while Sepulcre-Canto et al. (2012) illustrated the CDI scheme as a cascade process (see the schematization in that paper's Fig. 1), its actual implementation can be seen more in the context of a nested approach, since each successive stage is contained within the definition of the previous one. This is exemplified by the inclusive nature of the calculation (see above, where “&” is used in the definition of the classes). This approach can lead to abrupt breaks in tracking a drought event, when a substantial temporal shift among the three quantities can be observed.
For example, the plots in Fig. 2 report the time series of SPI-3 (upper panel), zSM (middle panel), and zfAPAR (lower panel) for a year that includes a drought event in Spain. Dotted vertical lines demarcate the full span of the drought event. At the top of each plot, a box demarcates the period when the stage-specific conditions for WATCH, WARNING, and ALERT are met. By an a posteriori analysis of the event, it is easy to assess a desirable sequence of stages for each dekad, as reported in the bottom part of the lower plot (i.e. the ideal outcome of a revised CDI, ideally CDI-v2). However, from the actual sequence of CDI values (CDI-v1) it can be seen that the event is interrupted in the middle of the soil moisture deficit period due to the return of precipitation to normal conditions.
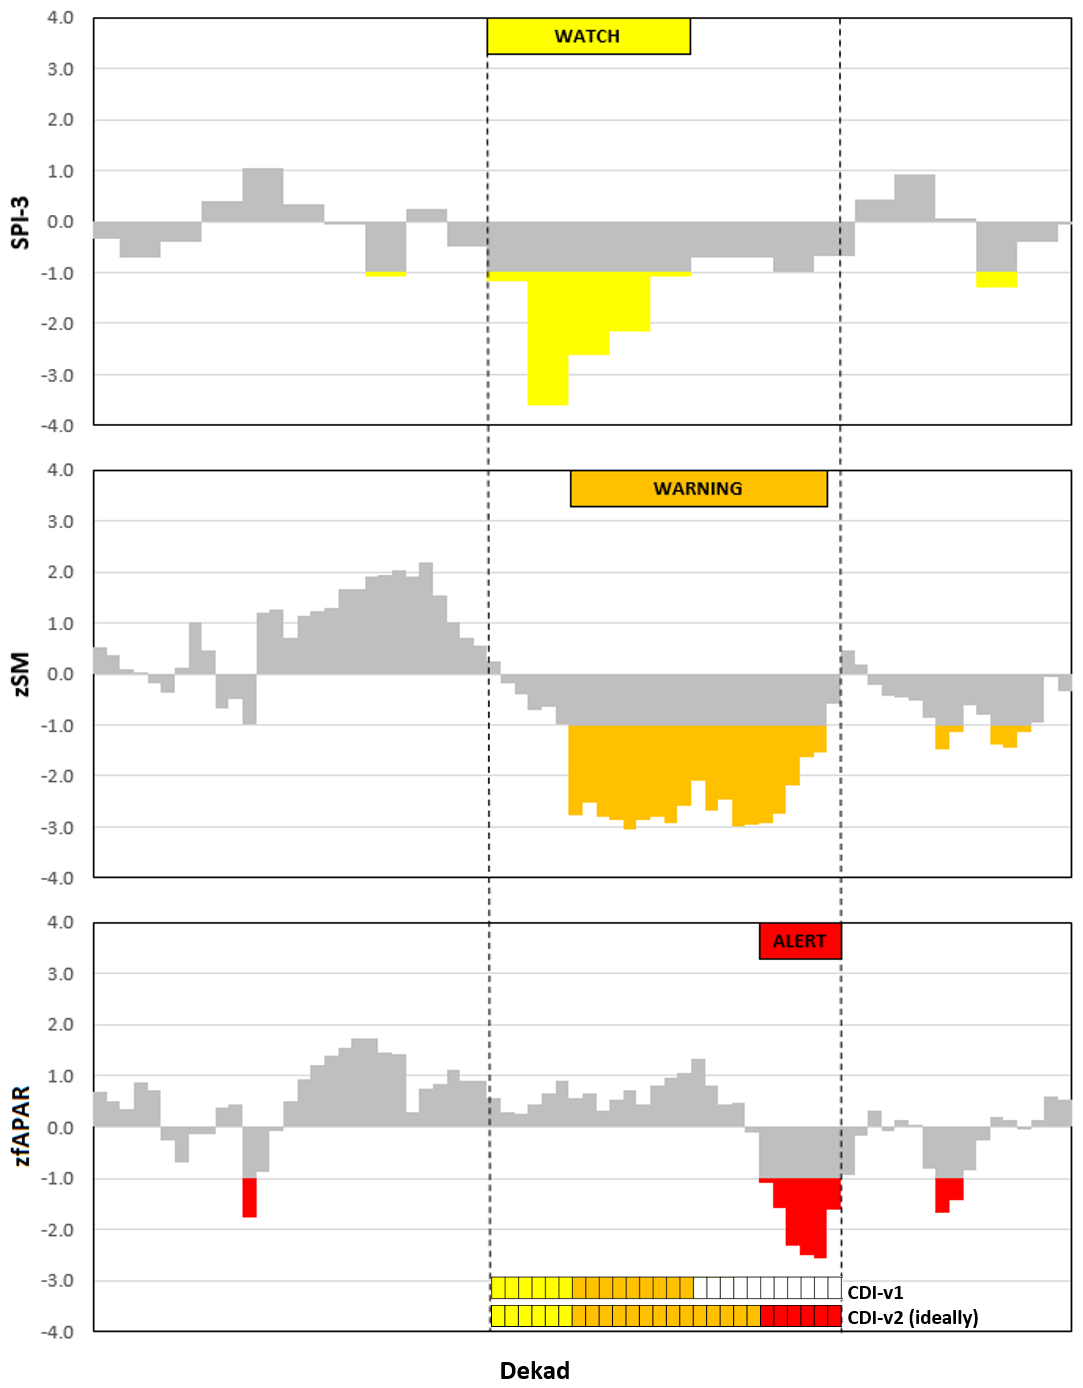
Figure 2Example of the possible cascade process driving the evolution in the case of a drought event in Spain. Dotted lines delimit the period under drought, whereas the squares at the bottom of the plots report the outcome of the operational CDI (CDI-v1, upper line) and the ideal evolution of a revised version's (CDI-v2 ideally, lower line) values for each dekad.
A second example is shown in Fig. 3 for a drought event in France, where the time series of SPI-3, zSM, and zfAPAR suggest an extensive period of soil moisture deficit following a precipitation deficit, which caused a short period of fAPAR anomalies. Even if two periods meeting the requirement for a WARNING and an ALERT status are observed (see boxes at the top of the middle and lower panels, respectively), a temporary return above the thresholds is observed (for 1 or 2 dekads) in both zSM and zfAPAR time series. In an a posteriori analysis, a single continuous ALERT period would have been likely detected (see ideal CDI sequence at the bottom of Fig. 3). CDI-v1 instead treats those gaps as interruptions, causing a back-and-forth transition between the ALERT and WARNING stages.
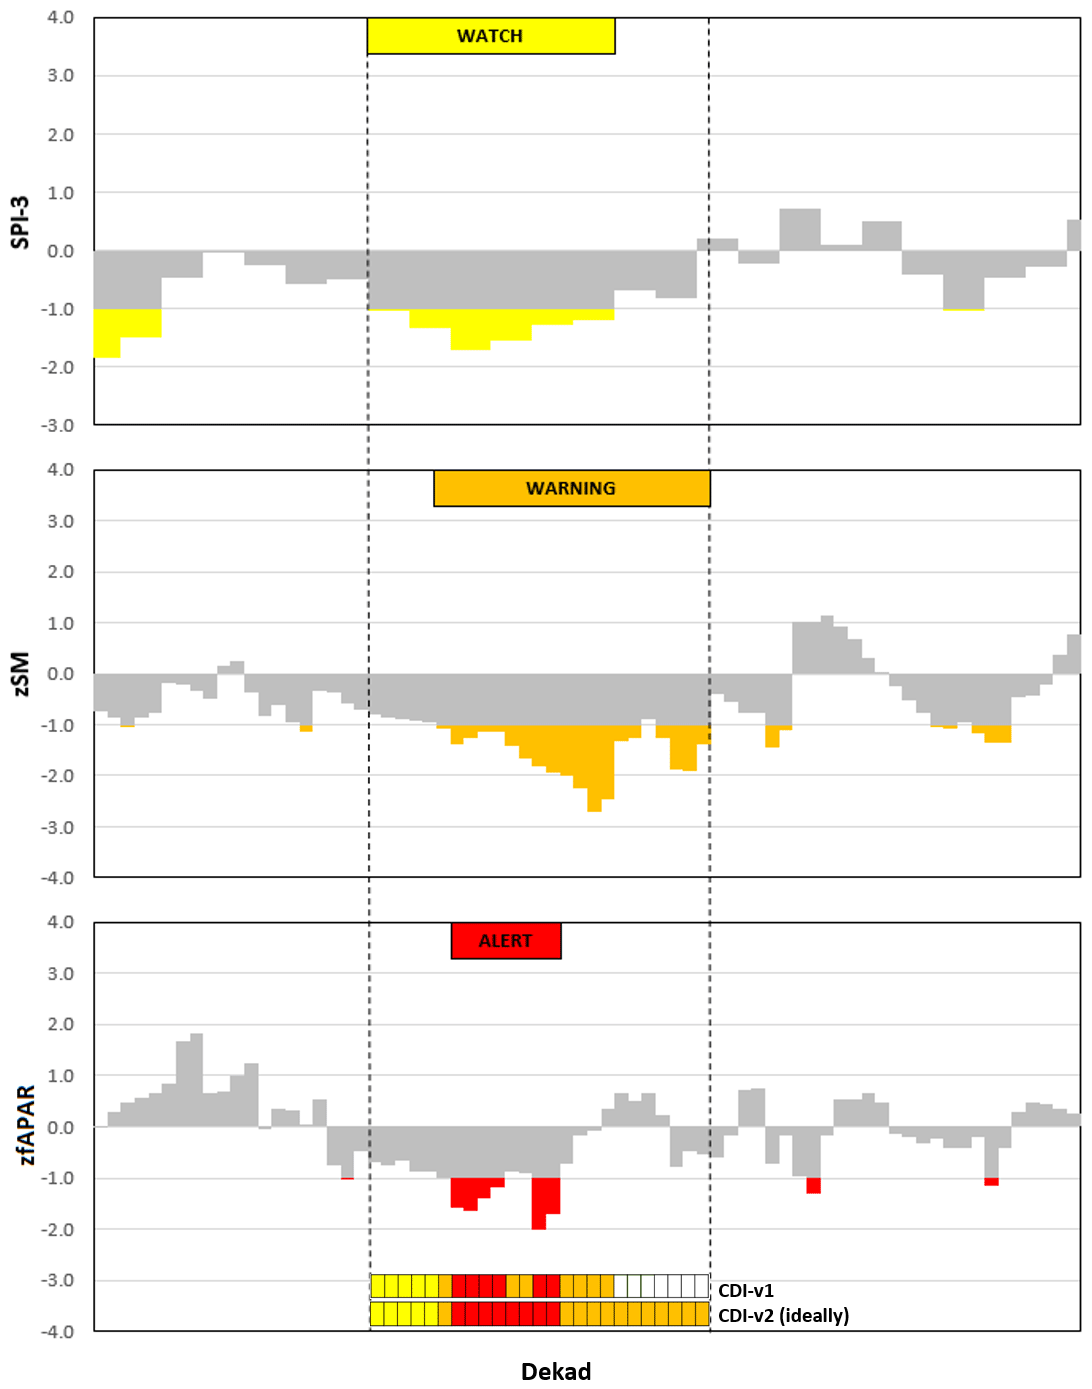
Figure 3Example of the small gaps that can occur during a drought event in France. Dotted lines delimit the period under drought, whereas the squares at the bottom of the plots report the outcome of the operational CDI (CDI-v1, upper line) and the ideal evolution of a revised version's (CDI-v2 ideally, lower line) values for each dekad.
This behaviour is in contrast to the cause–effect principle on which the indicator is based, and even if this occurrence cannot be always avoided in real case studies, it should be kept to a minimum. It is worth noting how, also in this second case, according to CDI-v1 the event stops well before the end of the soil moisture deficit, due to the return of precipitation to normal conditions (SPI-3 >−1).
The two examples reported above highlight the main drawbacks of the current operational version of the CDI, which can be summarized as follows:
-
lack of a proper cascade process in favour of a nested approach, which can cause an early interruption in drought events in case of notable shifts between time series, and
-
absence of a check for possible small gaps within a stage, which can lead to inconsistencies in the temporal sequence and quick alternation of different stages.
The revised version of the CDI that is proposed here (i.e. hereafter called CDI-v2) addresses these two key issues by introducing two principal modifications:
-
set-up of different rules to ensure temporal continuity based on the previous dekad's CDI (CDId−1) rather than the preceding SPI (SPIm−1)
-
addition of a second set of threshold values to detect both temporary gaps within a stage, and the fade-out phase of a drought.
These modifications are implemented according to the scheme depicted in Fig. 4, where the upper part of the table is analogous to that of Fig. 1, while the lower part details the values assumed by the index for all the possible cases of preceding CDI values.
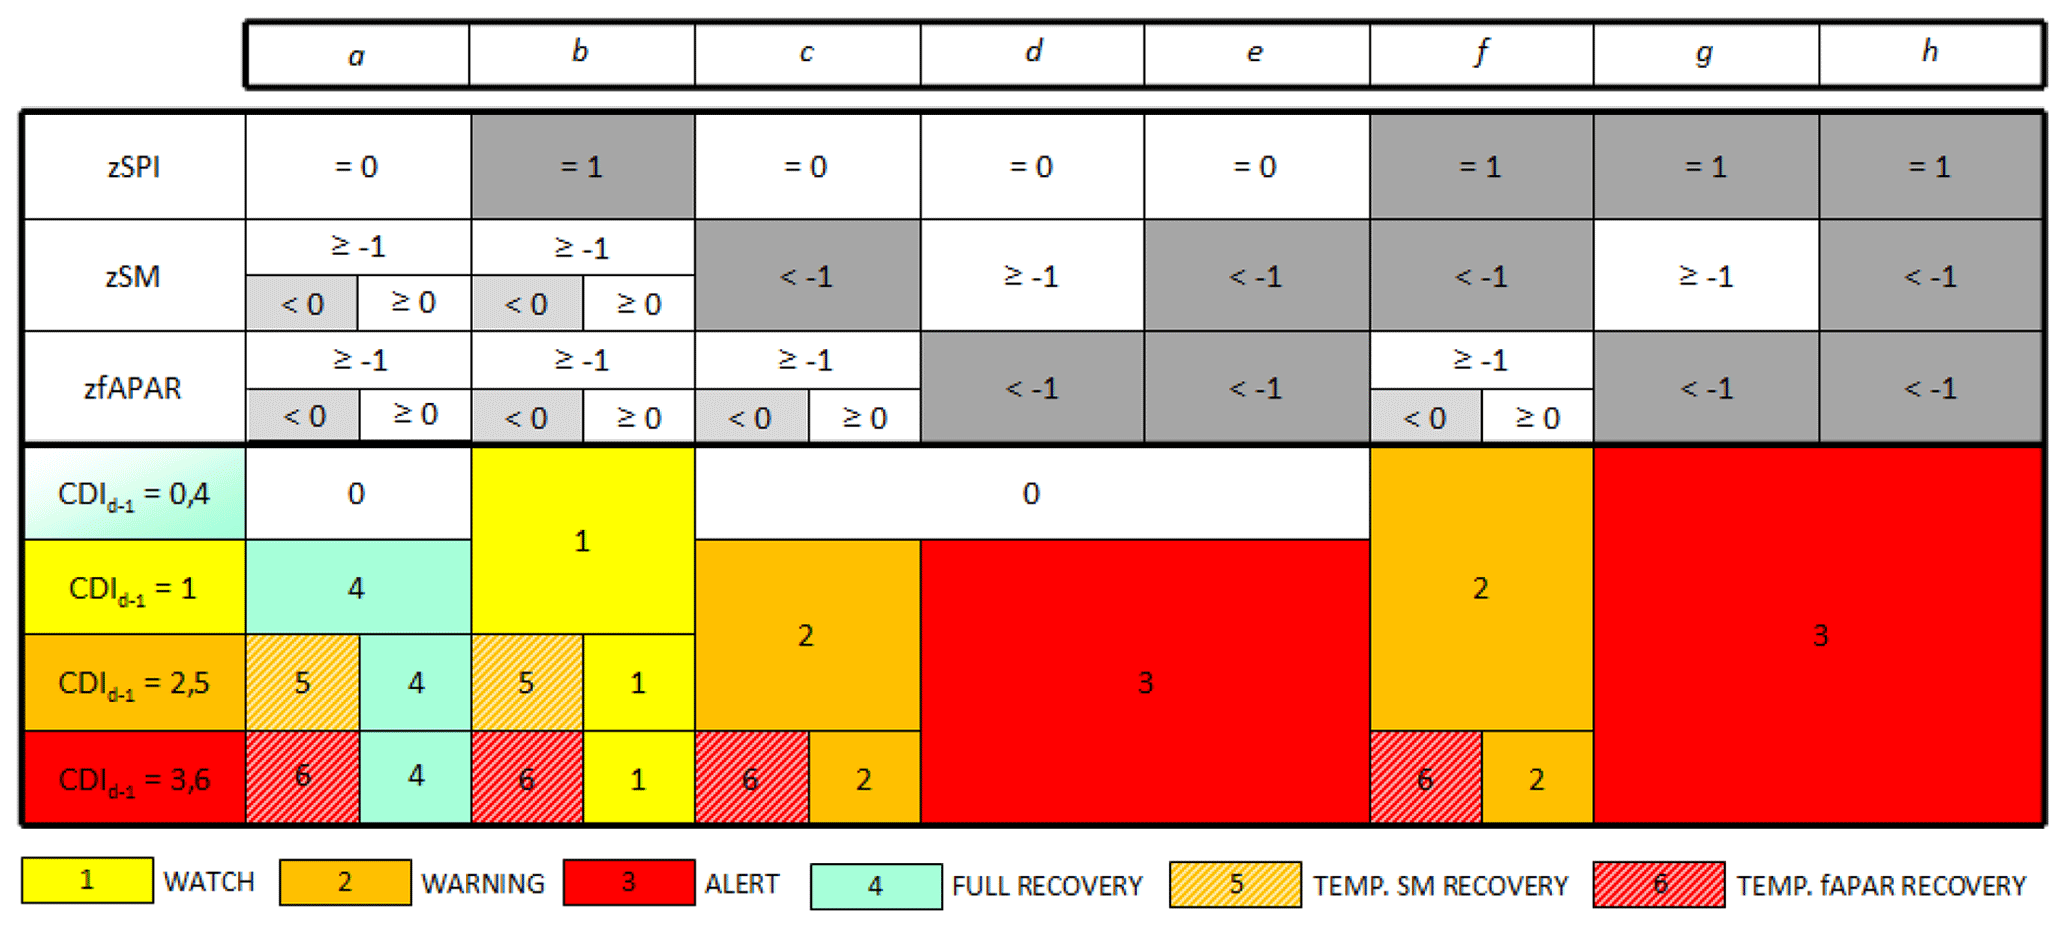
Figure 4Schematic representation of the CDI-v2 computation procedure. The upper part of the table reports the eight possible combinations of the three main Boolean quantities (from a to h), with sub-cases (based on the second set of thresholds) reported where used. The lower part of the table reports the corresponding CDI classes for all the antecedent CDI values (subscript d−1).
By juxtaposing Figs. 1 and 4, it is possible to highlight the main changes introduced after discriminating the outputs on the basis of CDId−1. On the one hand, it is possible to notice how CDI-v2 (i.e. the proposed revision) behaves identically to CDI-v1 (i.e. the current version) at the start of a new event (first row, CDI or 4). On the other hand, for an on-going event (CDI, 2, 5, 3, 6), CDI-v2 still behaves similarly to CDI-v1 for the combinations a–b and f–h, whereas some major differences can be observed for the cases c–e. In these latter instances, both the WARNING and ALERT stages are preserved if zSM and zfAPAR values support these conditions independently from the value of zSPI. This modification aims at solving the problem highlighted by the example in Fig. 2.
The lower part of the table in Fig. 4 highlights how the inclusion of a second threshold for zSM and zfAPAR (i.e. 0.0 in both cases) aims at addressing those situations when the CDI tends to return to a stage that conceptually precedes that of the previous dekad (i.e. a WARNING following an ALERT). In all these circumstances, two TEMPORARY RECOVERY stages are introduced – one for soil moisture and one for fAPAR – if the values of zSM or zfAPAR fall between the two threshold values (i.e. −1.0 and 0.0). Since these classes are meant to be temporary, we wish to avoid that the index remains locked in these classes for long periods. For this reason, a constraint on the maximum duration of the TEMPORARY RECOVERY stages is fixed at 4 dekads. This value is chosen as the minimum length to ensure the inclusion of two consecutive monthly zSPI values.
2.4 Past drought events
In absence of a reliable independent benchmark for the evaluation of the CDI behaviour, the performance of the proposed revision of the CDI (CDI-v2 in this paper) is compared against the current version of the index (called CDI-v1) over selected past drought events in Europe occurring during the period 2001–2018 (years when all the input datasets are overlapping).
Several drought events of different extents and severities were observed during the reference period, including the three large-scale and renowned events of 2003 in central Europe (Rebetez et al., 2006), 2005 in Iberia Peninsula (Garcia-Herrera et al., 2007), and 2018 in northern Europe (Buras et al., 2020). Other documented events at national or regional scales include the droughts in Italy and Romania in 2007, western Germany and France in 2011, Romania and Portugal in 2012, eastern Spain in 2014, eastern France and western Germany in 2015, and central Italy in 2017.
For these events, the improvement in the coherence between the proposed revision of the index and the CDI theoretical modelling framework is firstly verified for two test datasets of locations where the operational CDI-v1 was successfully validated in the past. The first dataset of locations corresponds to drought events that were originally used by Sepulcre-Canto et al. (2012) to validate the index. These include data from Magdeburg (Germany), Ciampino (Italy), and Wattisham (UK) during the 2003 drought; Albacete (Spain) and Beja (Portugal) in 2005–2004; Ciampino (Italy) for the drought in 2007; and Magdeburg (Germany) and Déols (France) during 2011.
The second dataset of locations is derived from the droughts documented in the reports produced by EDO (https://edo.jrc.ec.europa.eu/edov2/php/index.php?id=1051, last access: January 2021) since the CDI's operational implementation. These include data from Lisbon (Portugal) in 2012; Valencia (Spain) for the 2014 drought; Strasbourg (France) in 2015; Rome (Italy) during summer 2017; and Dublin (Ireland), Hannover (Germany), Poznan (Poland), and Silkeborg (Denmark) for the drought in 2018.
This qualitative analysis over selected test sites is complemented by a quantitative analysis on the full dataset that evaluates the frequency in which each cell experiences a stage sequencing in contrast with the assumed cause–effect modelling (i.e. a dekad with a WARNING stage followed by one with a WATCH stage), providing a metric to quantify the improvements associated with the proposed revision.
2.5 Evaluation strategy
Long records of yield data for cereals (including rice) from the Eurostat (European Statistical Office) database were used to detect specific regions with documented drought impacts in agriculture during the above-reported drought years. Even if it was not possible to extract evidence of drought impacts for all the events, mainly due to gaps in data records, six regions were detected from the above-mentioned drought years, as summarized in Table 1. The reported yield data show how the production was lower than the long-term average yield for all the regions, as they were actually the minimum in the records for all the cases, the only exception being ES62, region of Murcia (which recorded the second-to-last yield in 2014 only after 2005).
Table 1Cereals (including rice) yield (t ha−1) data for different NUTS regions as derived from the Eurostat database. The column “Avg. 2000–2018” reports the average yield during the whole period, whereas the column “Drought year” reports the actual yield for the drought year specified in the “Year” column.
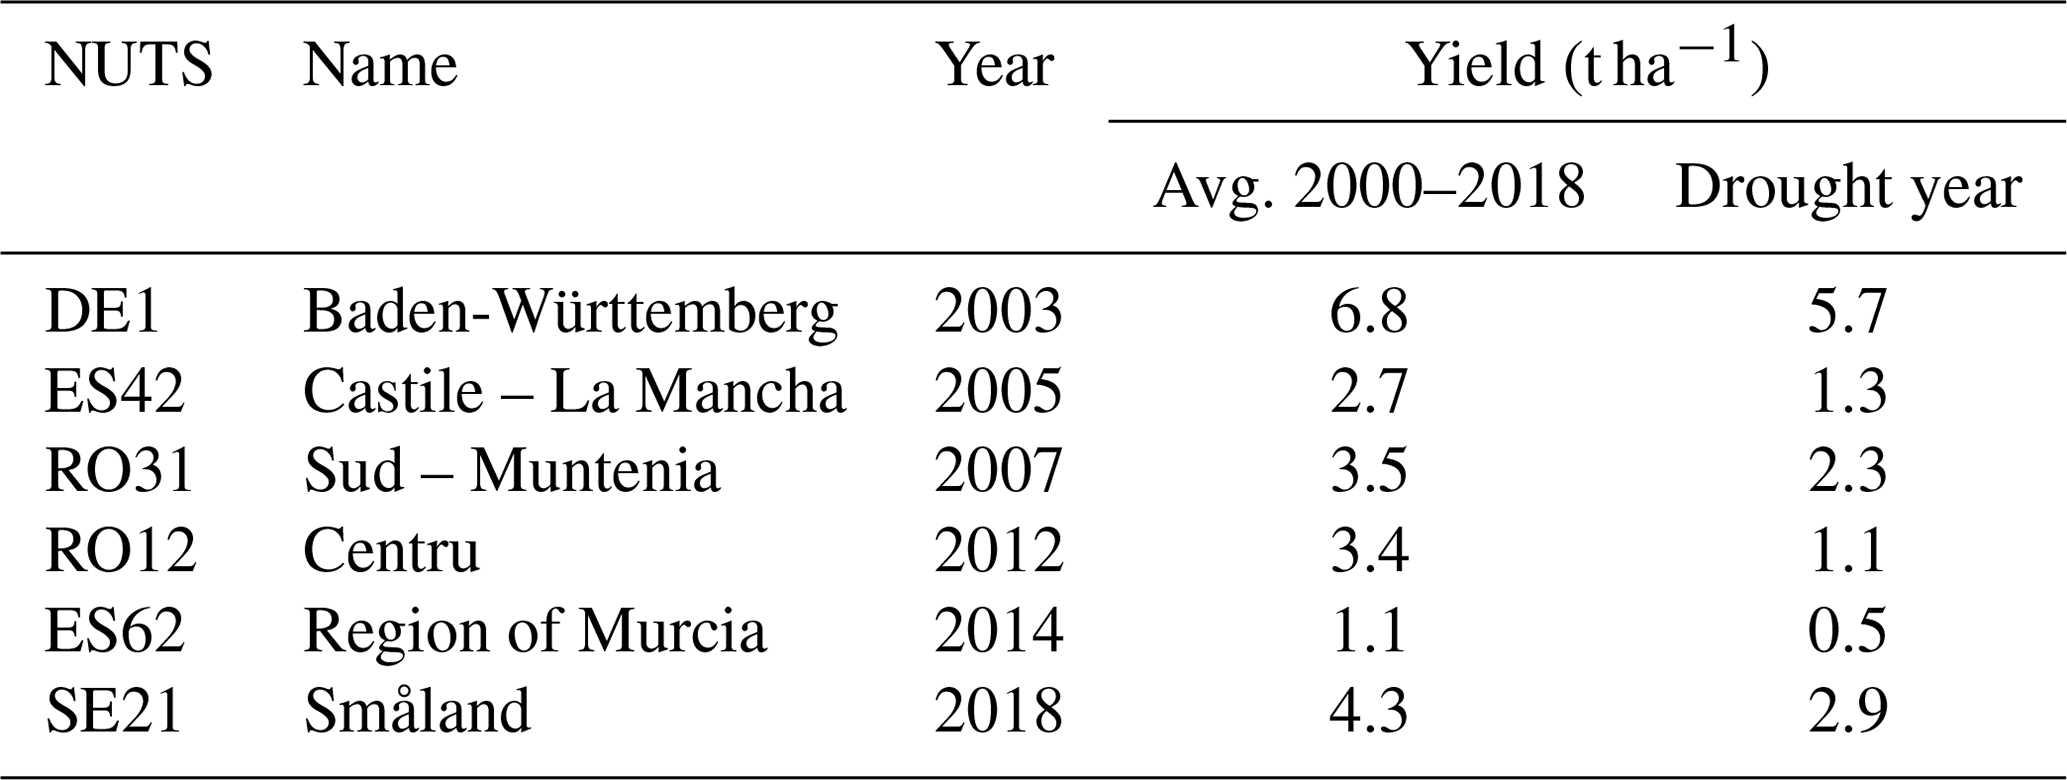
Assuming that the reduction in yield is a measure of the impacts of drought over vegetated land, statistics of the ALERT stage in these Eurostat NUTS (Nomenclature of Territorial Units for Statistics) regions during the drought events were investigated as a means of quantifying the effects of the proposed modification of the CDI. The duration of the drought according to the CDI is quantified as the period when the percentage of NUTS with WATCH+WARNING+ALERT is at least 20 % and when within this period the average percentage of area under ALERT (PALERT) and the maximum modelled ALERT percentage in the same period (MALERT) are computed for the two CDI versions, assuming that high values in both PALERT and MALERT are expected in these study cases given the observed drastic reduction in yield.
3.1 Temporal consistency of drought stages
Following the modification introduced, one of the main improvements that may be expected in the revised version of the CDI (CDI-v2) concerns the temporal consistency at the local scale. For this reason, an initial test was made to compare the temporal behaviour of the current version (CDI-v1) and proposed revision (CDI-v2) of the indicator, over selected locations in Europe, during well-documented drought events.
The plots in Figs. 5 and 6 show dekadal time series of CDI-v1 (upper line) and CDI-v2 (lower line), with the colours corresponding to the classifications in Figs. 1 and 4, respectively. The sites in Fig. 5 correspond to the locations used for validation by Sepulcre-Canto et al. (2012), whereas the sites in Fig. 6 were extrapolated from the EDO reports for the most recent drought events.

Figure 5Time series of CDI-v1 (upper lines) and CDI-v2 (lower lines) for different test sites under drought between 2001 and 2011, as documented in Sepulcre-Canto et al. (2012). See Figs. 1 and 4 for the corresponding legends. The labels on the x axis correspond to the beginning of the month.
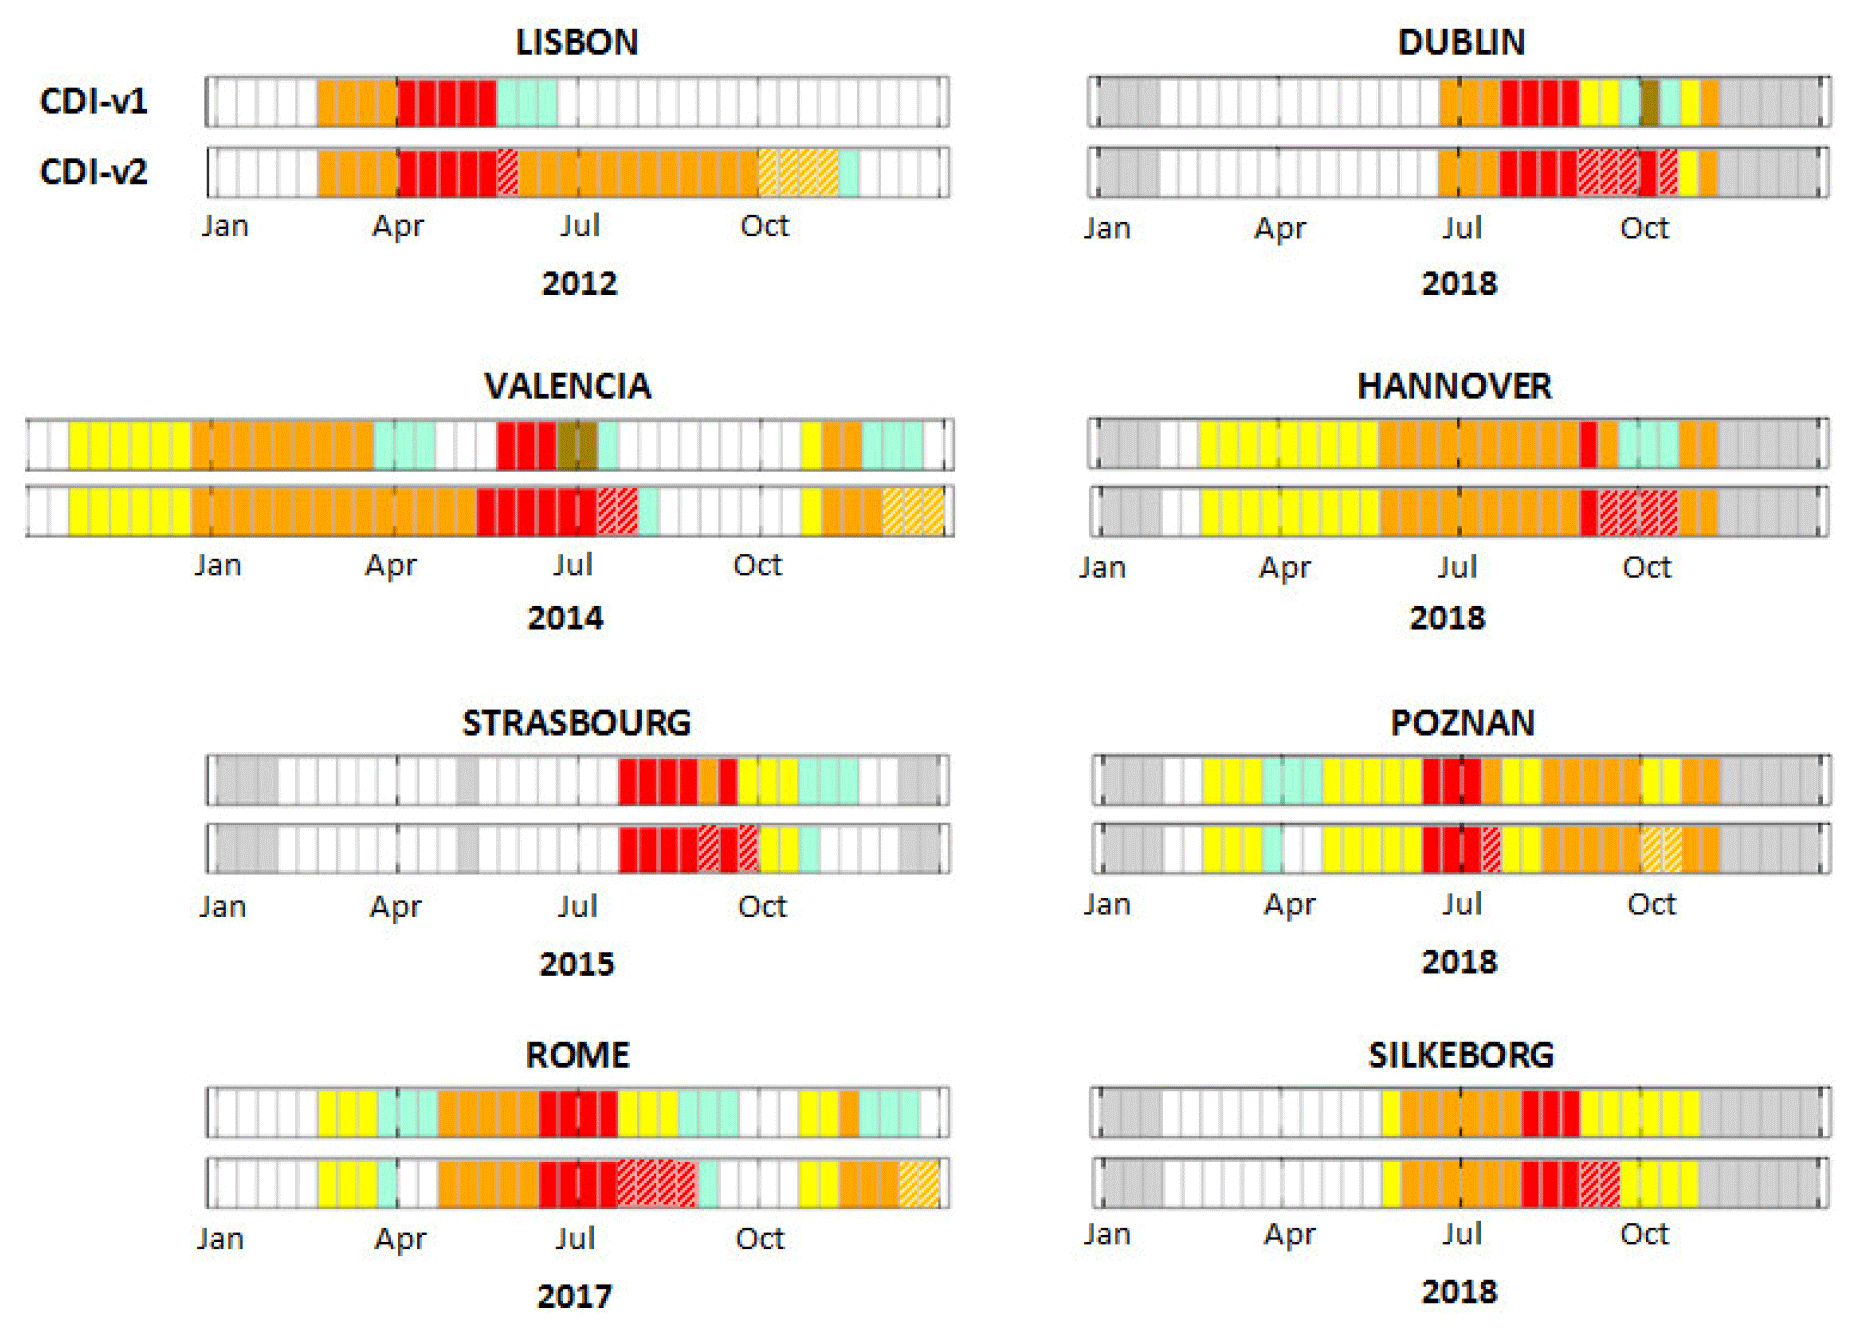
Figure 6Time series of CDI-v1 (upper lines) and CDI-v2 (lower lines) for different test sites under drought between 2012 and 2018, as documented in the analytical drought reports in EDO (https://edo.jrc.ec.europa.eu/edov2/php/index.php?id=1051, last access: January 2021). See Figs. 1 and 4 for the corresponding legends. The labels on the x axis correspond to the beginning of the month.
In all the sites, the start of the drought event coincides for the two versions of the indicator (CDI-v1 and CDI-v2), as is to be expected given the analogous conditions adopted to define a new event. Over some sites, the two versions do not differ substantially, as in the case of Wattisham and Magdeburg (Fig. 5) and Silkeborg and Poznan (Fig. 6), where only minor signs of the issues highlighted in Figs. 2 and 3 can be observed. In those study sites, the temporal evolution of the droughts appears to be well reproduced by both versions of the indicator, with the start, peak, and end dates consistent with the scientific literature for the events (Buras et al., 2020; Ciais et al., 2005; Hanel et al., 2018; Rebetez et al., 2006).
Conversely, the drought development for the sites of Albacete (2005 drought), Ciampino (2007 drought), Lisbon (2012 drought), and Valencia (2014 drought) differs substantially for the revised version (CDI-v2) compared with the current version (CDI-v1), with an overall longer duration and prolonged periods under the WARNING and ALERT stages. The drought events at those sites are rather similar to what is depicted in Fig. 2, with a long period of soil water deficit and plant water stress during the whole dry season following a rainfall deficit early in spring and hot and dry summers. In these cases, the new version of the index appears to be capable of capturing those instances when a drought is prolonged by higher-than-normal evaporative demand even after the rainfall returns to normal. Considering the well-documented severity of those droughts (Garcia-Herrera et al., 2007; MeteoAM, 2007; Spinoni et al., 2015), the behaviour of CDI-v2 seems to be much more in line with the expected evolution of the droughts.
Finally, for some study cases – specifically Déols (2011 drought), Strasbourg (2015 drought), and Dublin (2018 drought) – the erratic behaviour of CDI-v1 that is evident later in the event (similar to the example of Fig. 3) is replaced by a noticeably smoother dynamic in CDI-v2, which is more in line with both the desirable sequencing of stages and the expected behaviour of a slow-evolving phenomenon such as drought.
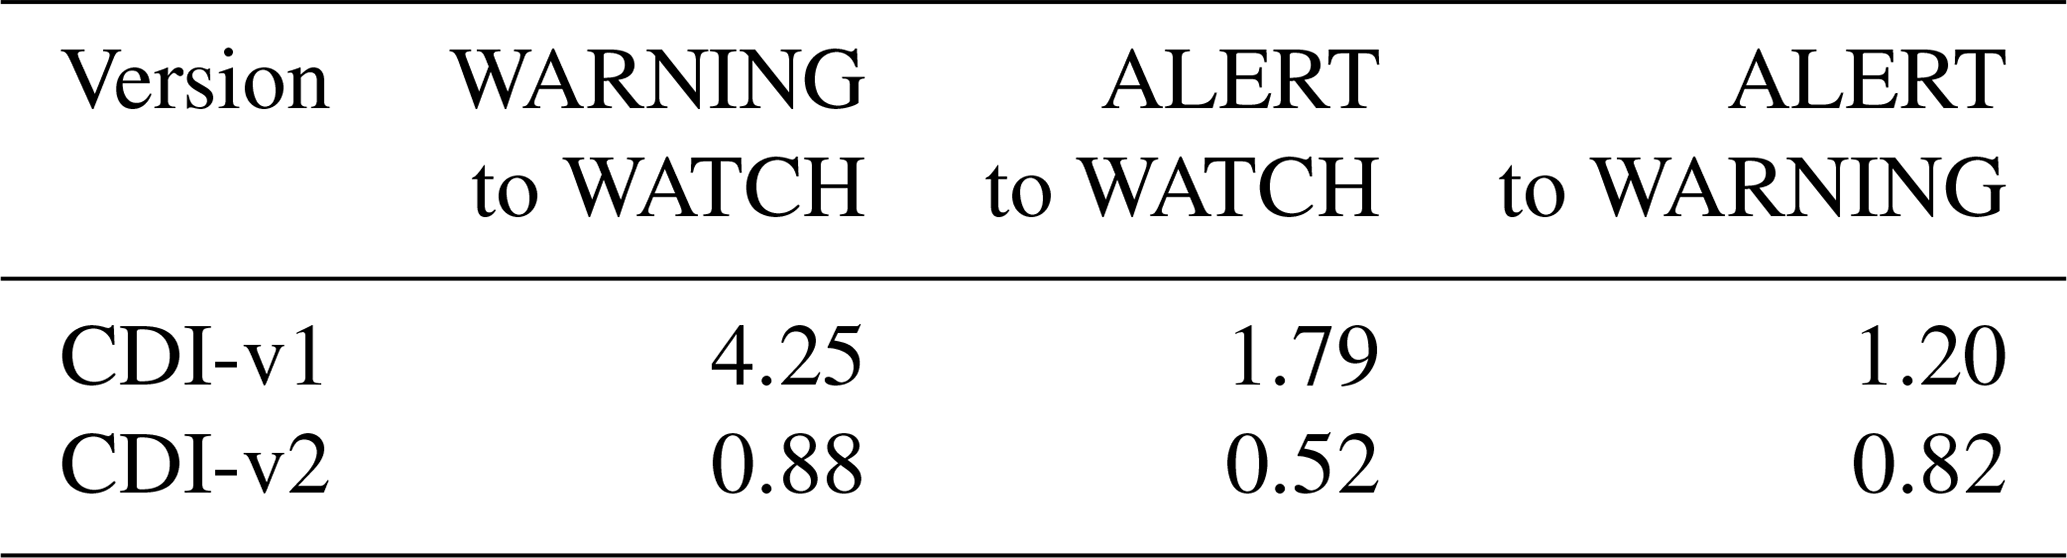
For most of the test sites, the representation of the temporal evolution of the drought events by CDI-v2 better fits the conceptual “cause–effect” framework of the indicator, by reducing inconsistent changes in the drought stages. This is quantified by the data reported in Table 2, where the percentage of cells experiencing one of the three major unexpected stage sequencing is reported, specifically: (i) WATCH following a WARNING, (ii) WATCH following an ALERT, or (iii) WARNING following an ALERT. In all three cases the results, expressed as an average percentage of the area affected by drought (i.e. the sum of all stages excluding FULL RECOVERY), show a drastic decrease when CDI-v2 is used instead of CDI-v1. While the reduction occurs for all the three conditions considered, major improvements can be observed in the reduction of the instances when a WARNING is followed by a WATCH (4.25 % for CDI-v1 compared with 0.88 % for CDI-v2). Overall, the total percentage of inconsistent sequencing is reduced from about 7 % for CDI-v1 to just 2 % for CDI-v2, supporting the assumption that the revised indicator (CDI-v2) better captures the expected evolution of the droughts compared to the current version (CDI-v1) by minimizing the unexpected behaviours.
Table 2Average percentage of cells in drought areas with sequencing in contrast with the cause–effect relationship for the full European domain.
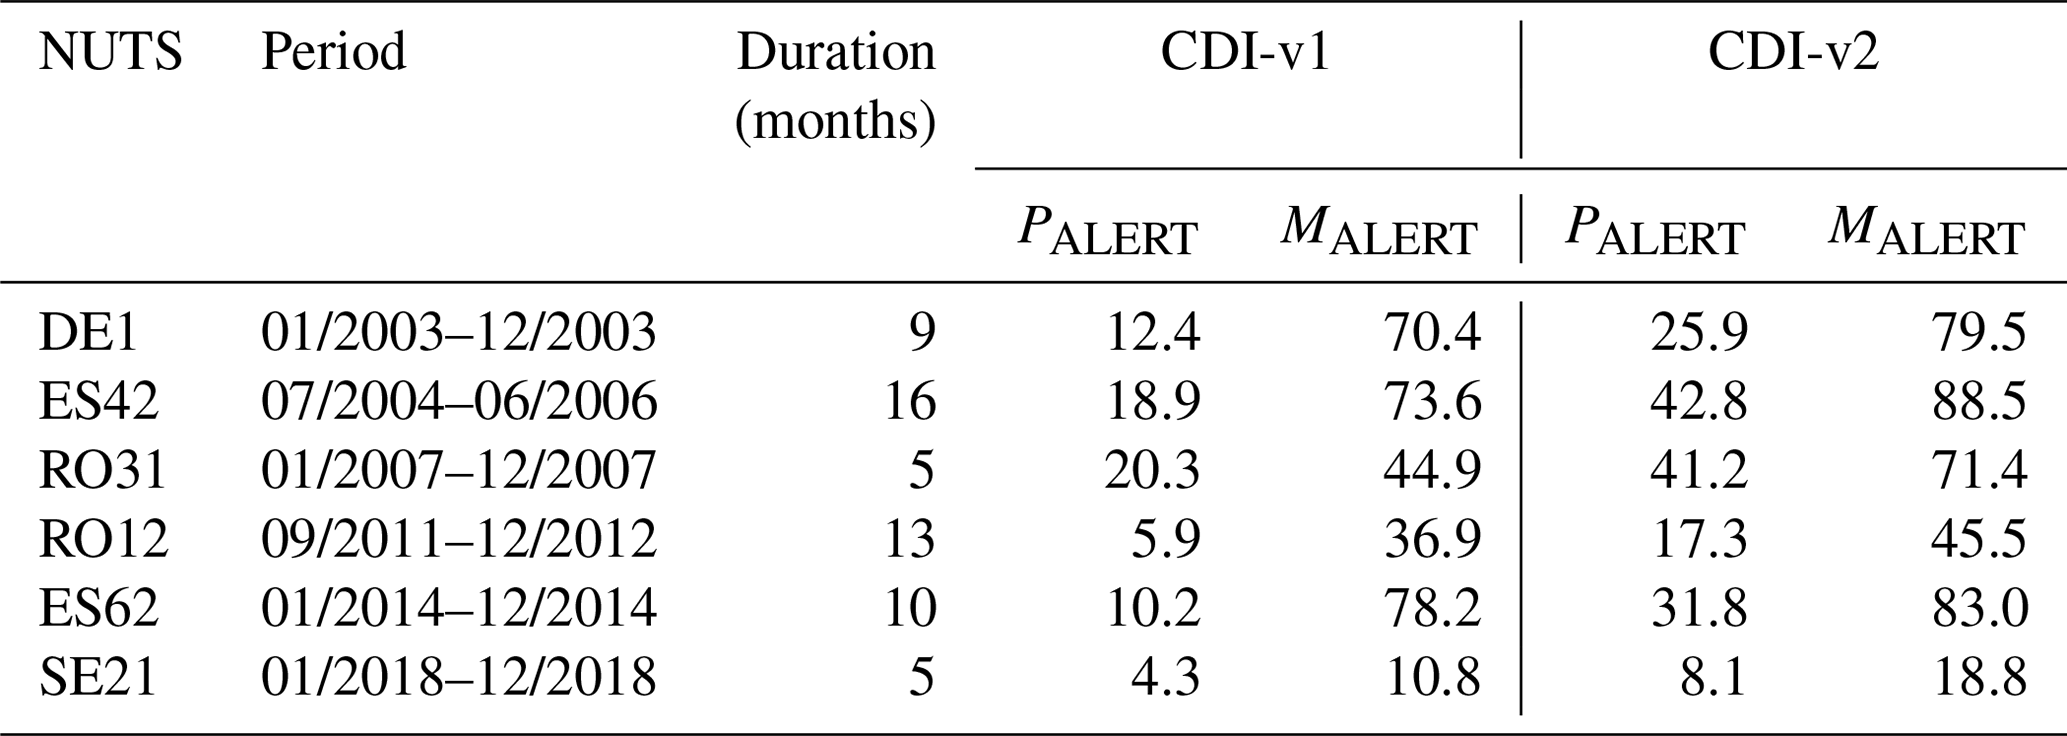
The data in Table 3 summarize some key statistics of the ALERT stage over the areas where significant impact in agricultural production (i.e. yield) were recorded during past droughts (see Table 1). Overall, both PALERT and MALERT are higher for CDI-v2 compared with CDI-v1, with PALERT being more than double and MALERT about 30 % higher on average for CDI-v2, with the highest values observed for the two case studies in Spain and the lowest over Sweden in 2018. Given the severe impact of drought over these regions, documented by the concurrently reduced yields recorded (see Table 1), the large presence of ALERT conditions reported by CDI-v2 is more in line with the expected severity of the drought event according to the CDI conceptual modelling framework.
Table 3ALERT stage statistics over the NUTS regions with observed yield impacts during drought events (see Table 1). PALERT is the average percentage of the ALERT stage during the drought duration, and MALERT is the maximum percentage in the same period. The drought duration is defined as the period when the percentage of the NUTS with WATCH+WARNING+ALERT is >20 % for either CDI-v1 or CDI-v2. Please note that the date format in this table is month year (mm/yyyy).
3.2 Analysis during major drought events
An analysis of the full spatiotemporal evolution of the drought events based on the current (CDI-v1) and revised (CDI-v2) versions of the CDI indicator is performed for the three largest droughts, as summarized in Figs. 7 to 9 for central Europe (2003), the Iberian Peninsula (2005), and northern Europe (2018). In each case, the upper plot shows the percentage of the area affected by drought (i.e. the sum of all stages excluding FULL RECOVERY) for each month, whereas the maps show examples of the CDI's spatial distribution for selected dekads during the event (as demarcated by squares on the upper plot's x axis).
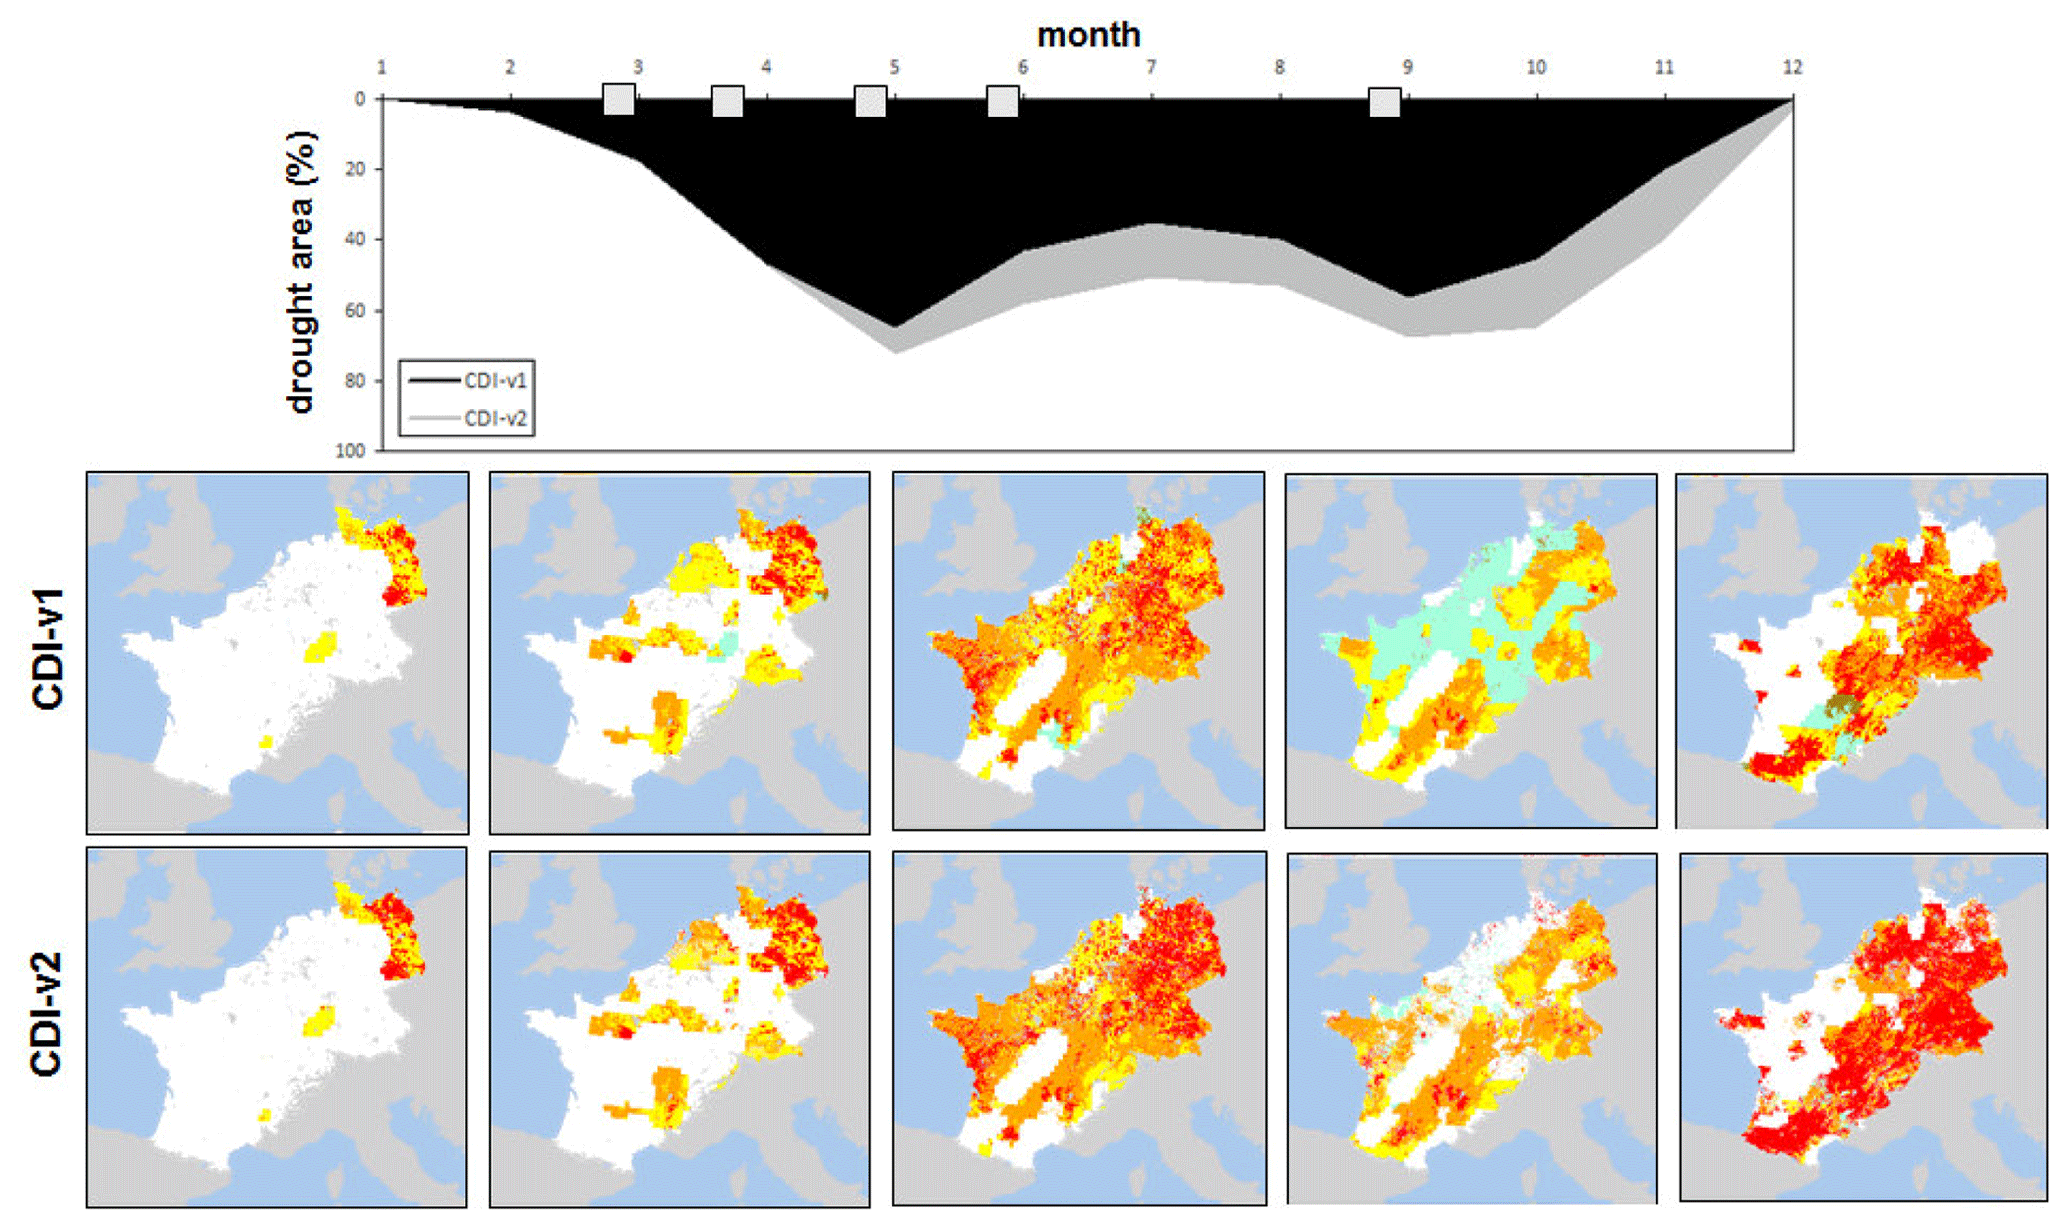
Figure 7Temporal evolution of the 2003 central European drought according to the two versions of the CDI. The upper plot shows the percentage of the area under drought (WATCH+WARNING+ALERT, in black for CDI-v1 and in grey for CDI-v2), whereas the lower images depict the spatial distribution of CDI-v1 (upper row) and CDI-v2 (lower row) for the selected dekads (demarked in the upper plot by the squares on the x axis).
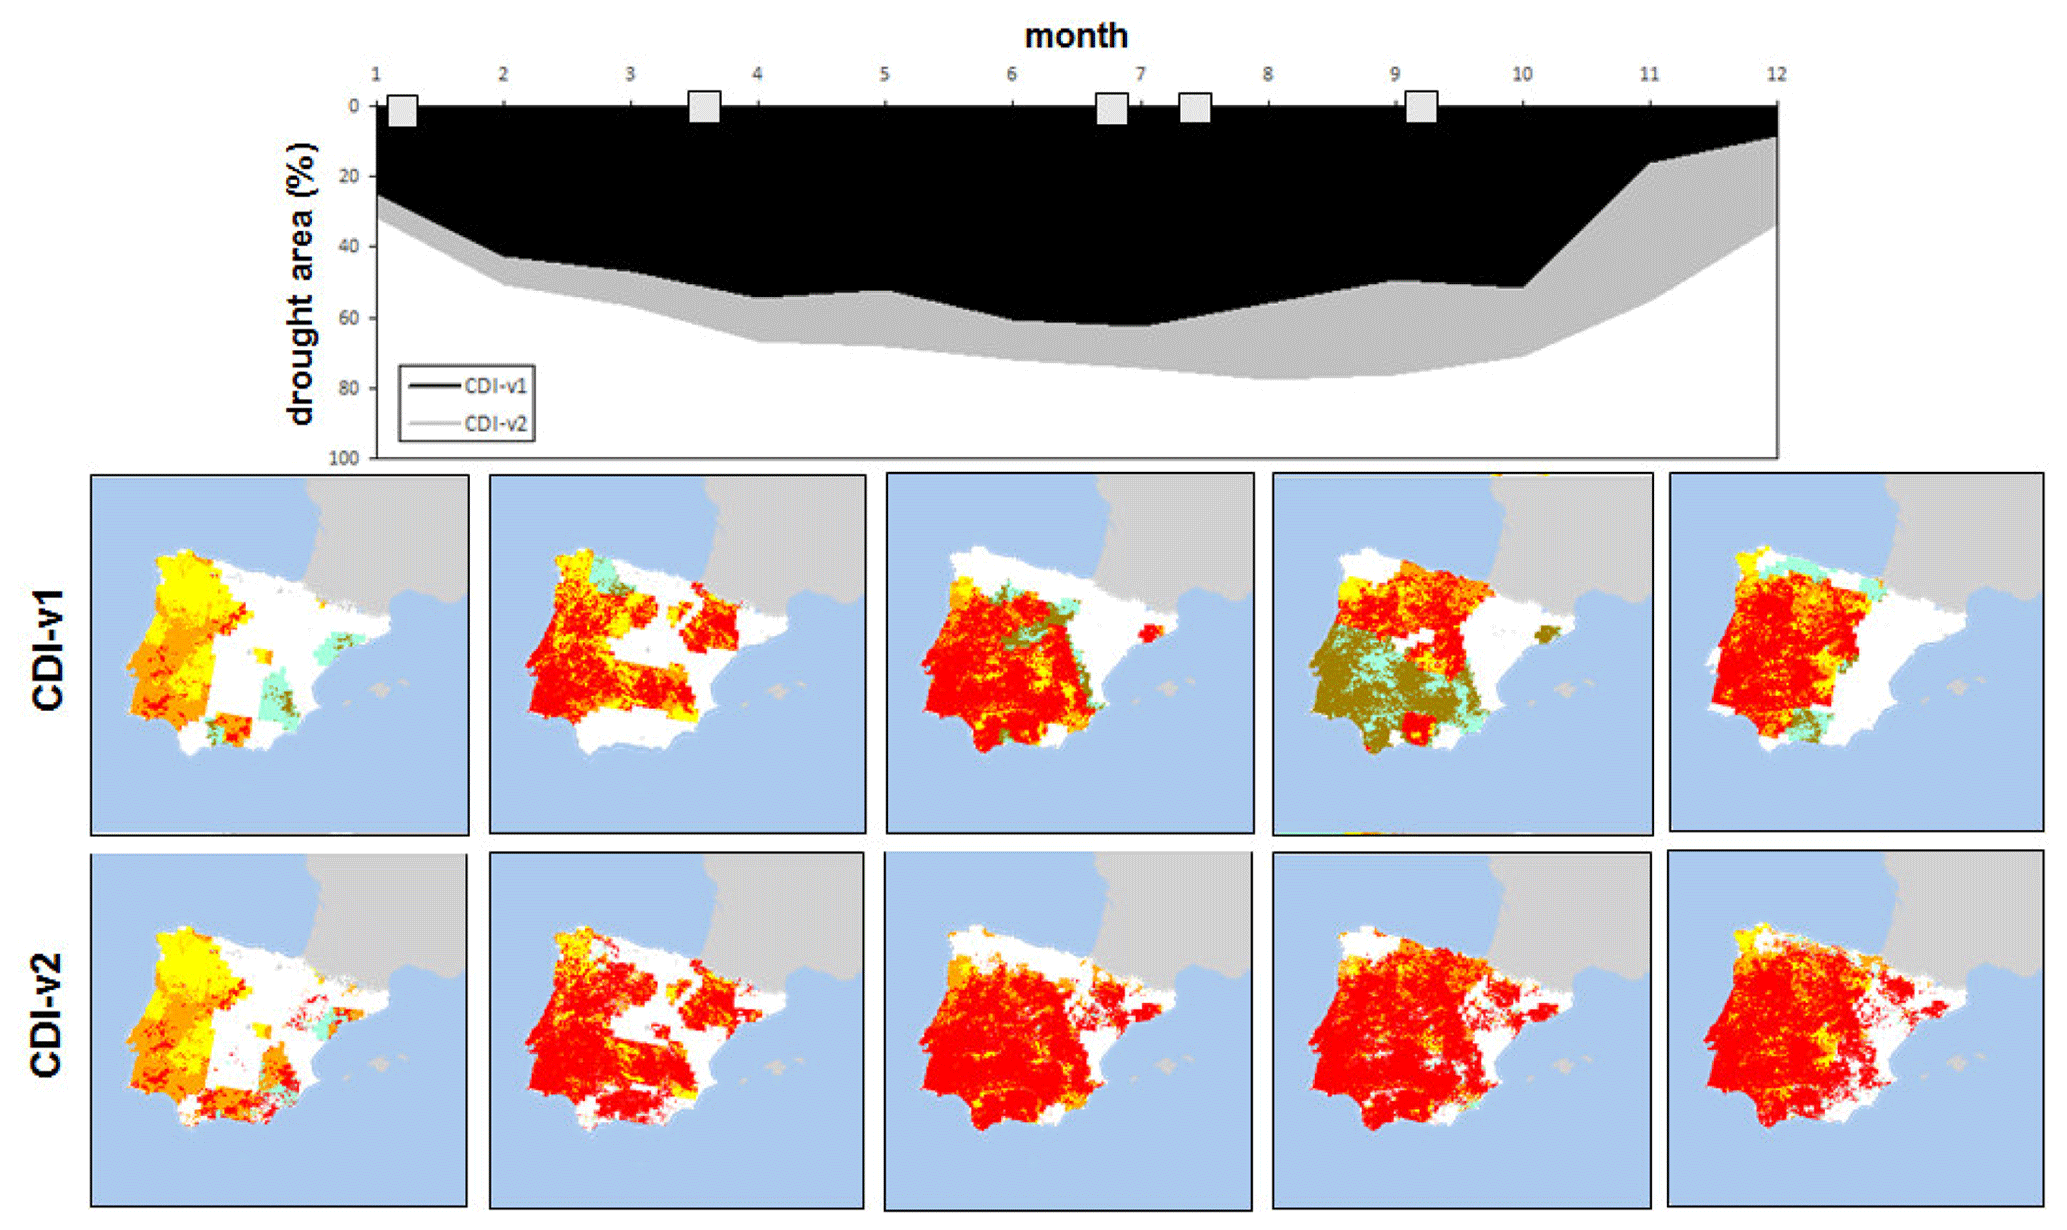
Figure 8Temporal evolution of the 2005 Iberian Peninsula drought according to the two versions of the CDI. The upper plot shows the percentage of the area under drought (WATCH+WARNING+ALERT, in black for CDI-v1 and in grey for CDI-v2), whereas the lower images depict the spatial distribution of CDI-v1 (upper row) and CDI-v2 (lower row) for the selected dekads (demarked in the upper plot by the squares on the x axis).
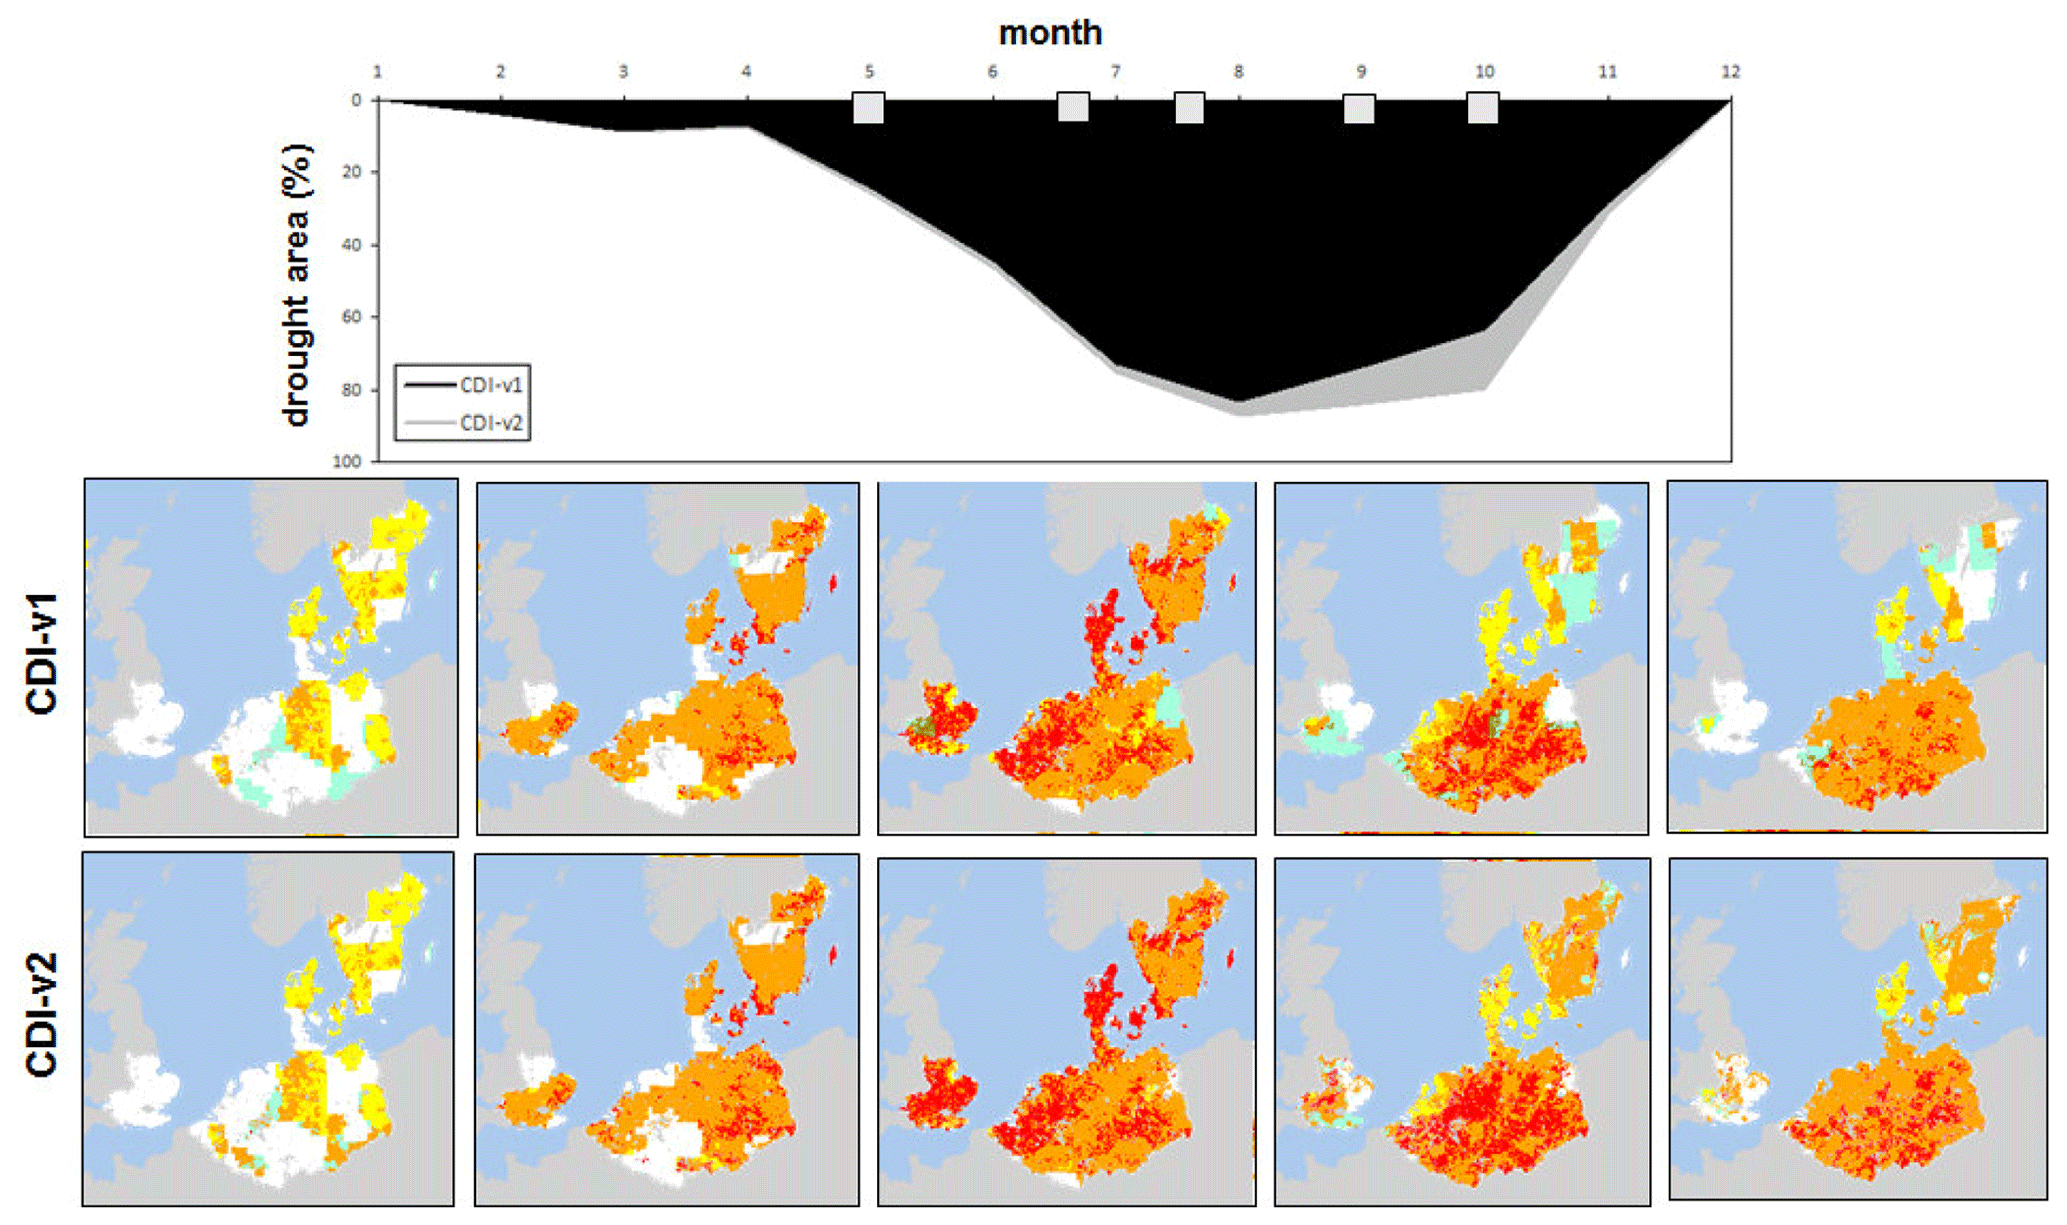
Figure 9Temporal evolution of the 2018 northern European drought according to the two versions of the CDI. The upper plot shows the percentage of the area under drought (WATCH+WARNING+ALERT, in black for CDI-v1 and in grey for CDI-v2), whereas the lower images depict the spatial distribution of CDI-v1 (upper row) and CDI-v2 (lower row) for the selected dekads (demarked in the upper plot by the squares on the x axis).
In all these study cases, it is evident how the percentage of the area that is considered under drought has a similar temporal behaviour for the two (current and revised) versions of the indicator, with the latter having only a slightly larger spatial coverage later in the events. An examination of the maps, however, shows that even if the total area affected is similar, the partitioning among the different stages may drastically differ around the peak of the drought. Indeed, the maps for CDI-v1 and CDI-v2 look quite similar at the beginning of the events, but in the case of CDI-v2 these become much more uniform, with a higher number of cells under the ALERT stage, later in the event. The larger number of ALERT stages in CDI-v2 is more in line with the conceptualized behaviour of the index, which should reach the ALERT stage at the peak of the drought development in the case of severe droughts.
The overall dynamic of the 2003 drought (Fig. 7) depicted by the two versions of the index is in line with the historical reconstruction of the event made by the European Drought Impact Inventory (EDII) and the European Drought Reference (EDR) database (https://www.geo.uio.no/edc/droughtdb, last access: January 2021). According to EDII, the event started around April 2003 with a main incidence for eastern Europe up to early June, followed by a propagation through central Europe and its peak in late August, before ending in November 2003. However, some key differences in favour of the proposed revision of the index can be observed, such as the higher and more realistic fraction of areas under ALERT status, which can be seen in CDI-v2 compared with CDI-v1 during the drought peak (last map of the series in Fig. 7), against the FULL RECOVERY areas modelled by CDI-v1 during the expansion of the event in June.
Similarly, the drought event of 2005 over the Iberia Peninsula (Fig. 8) seems to be well reproduced by both indices. Based on EDII and EDR, the drought in 2005 was part of a longer drought between autumn–winter 2004 and summer 2006. The event stated in the west, already in late 2004, mainly over Portugal, and reached its full extent between July and October 2005, with a secondary wave observed in summer 2006. The latter was due to the residual deficit that followed the extremely hot and dry summer of 2005.
This dynamic is well depicted by the plot in Fig. 8 (upper panel), with an already significant fraction of area under drought at the start of 2005 (about 20 % and 30 %, according to CDI-v1 and CDI-v2, respectively) mostly located over Portugal (see the first map of the series in January 2005). Peak extension is reached in July for CDI-v1 and between August and September for CDI-v2, followed by a slow decline that left still a significant area under drought entering 2006, especially in the case of CDI-v2. Even if the depiction of the event is quite similar in the first half of the year (i.e. first three maps of the series), in some circumstances (e.g. between July and August) the current version (CDI-v1) shows rather different patterns for two consecutive dekads, whereas the revised version (CDI-v2) gives more temporally consistent outcomes, especially when comparing maps in succession.
The drought event of 2018 (Fig. 9) was characterized by an extremely warm but not exceptionally dry spring, that rapidly became an extended and persistent summer drought, due to the extreme record-breaking temperatures (Peters et al., 2020). This behaviour is well depicted by both versions of the CDI, with a sudden start between April and June (area under drought jumping from 0 % to 80 %) and a quite widespread and enduring drought between July and October. In this study case, less discrepancies can be observed between the behaviour of the two versions of the index, compared with the previous two droughts. The most notable difference is the abrupt stop to drought conditions in Sweden around the peak of the event for CDI-v1 (see last two images of the series in September and October).
Overall, the analysis of the spatial patterns of both CDI versions during these three major drought events reveals a more stable behaviour for CDI-v2 compared with CDI-v1. In order to provide a quantitative estimation of the effects of the proposed changes to the partitioning of drought stages during an event, the plots of Fig. 10 show the time series of the percentage differences between CDI-v1 and CDI-v2, in the fraction of the area in the WATCH, WARNING, and ALERT stages, for the same three main droughts that are depicted in Figs. 7–9. Those plots show no substantial differences at the beginning of each event (first 2–3 months with changes <5 %) and a reduction in the WATCH fraction for CDI-v2 (negative differences) in favour of an increase in the WARNING and ALERT fractions during the development of the events. The results are consistent across the three study cases, suggesting that the revised version of the indicator (CDI-v2) better reflects the cause–effect principle, by showing a progressive propagation of the drought from one stage to the next. For example, in Fig. 10, some areas that are classified as WATCH by CDI-v1 in a late phase of the events are marked as WARNING and ALERT by CDI-v2, with an increased percentage of the WARNING stage preceding the peak of the drought (June–July in 2003 and May–June in 2018) and an increased percentage of the ALERT stage at the peak of the event (September in 2003 and 2018 and August–September in 2005).
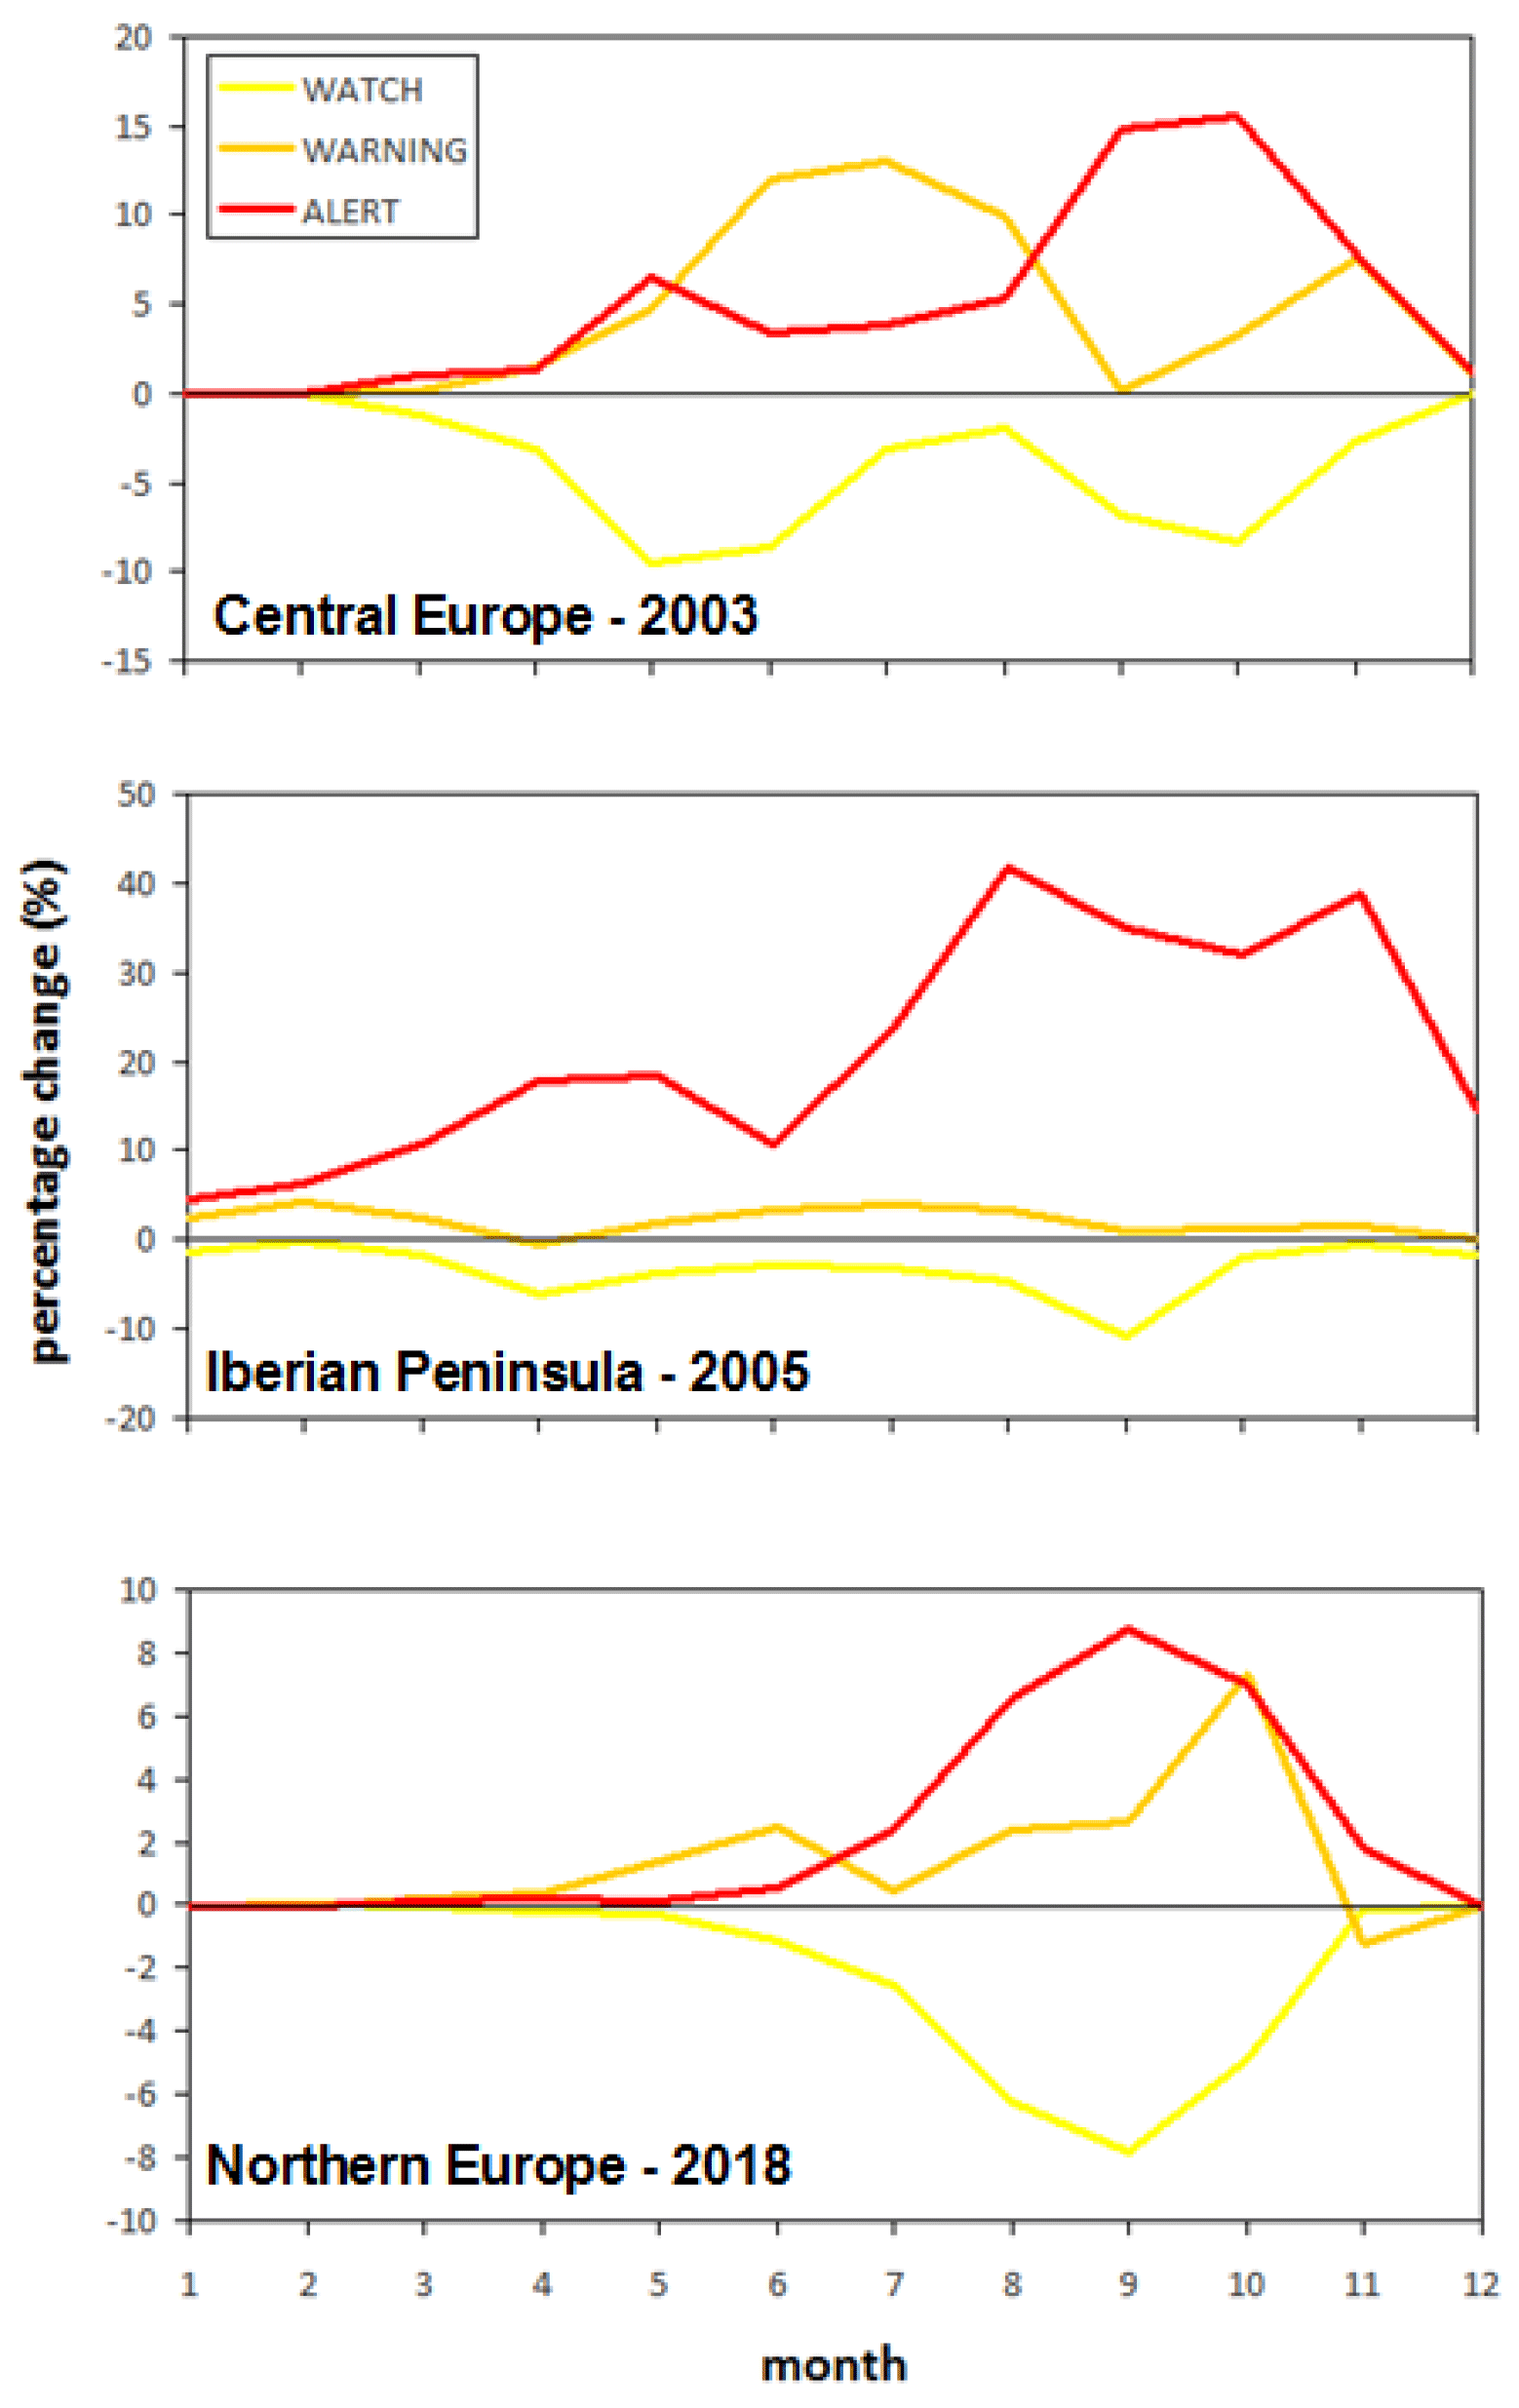
Figure 10Percentage differences between the CDI-v1 and CDI-v2 fraction of area in the WATCH (yellow line), WARNING (orange line), and ALERT (red line) stages for the same three main droughts depicted in Figs. 7–9. Negative (positive) values indicate a reduction (increase) in CDI-v2 compared to CDI-v1.
It is worth noting that even some of the largest percentage changes from WATCH to ALERT occur later in the event (i.e. in autumn after the peak), which is not accompanied by a larger drought area, as shown by the upper plots of Figs. 7–9. In fact, after the drought has reached its peak, CDI-v2 depicts an affected area that is reduced in size but mostly constituted by the ALERT stage, whereas in the previous version WATCH conditions were still reported towards the end of the event.
A revised version of the Combined Drought Indicator (CDI), which is currently implemented operationally within the European Commission's European Drought Observatory (EDO) for providing an early warning system and monitoring of agricultural droughts, has been analysed. The proposed revision of the CDI is based on the extensive experience that has been gained from applying the indicator during several major drought events that have affected different parts of Europe over the last 10 years.
While the current version of the CDI (called CDI-v1 in this paper) has successfully captured the onset of most of the documented major drought events, its ability to track correctly the evolution of events has been limited in the case of long-lasting droughts, with a significant temporal shift between periods of reduced rainfall, soil moisture deficit, and vegetation stress caused by high temperature and evaporative demand following the rainfall deficit. The proposed revision of the CDI (called CDI-v2 in this paper) aims at addressing those shortcomings, without either modifying the required input data or substantially altering the conceptual cause–effect framework underlying its original development, especially given the indicator's proven reliability based on many case studies and inter-comparison analyses. This enables the retroactive application of the revised indicator to past drought events, without the need for additional inputs or changes in the underlying datasets. For similar reasons, the three main stages of drought (i.e. WATCH, WARNING, and ALERT), which were originally defined in Sepulcre-Canto et al. (2012), remain unchanged, as does the inclusion of a FULL RECOVERY stage to identify the end of a drought period and the return to normal conditions.
The two main changes that are introduced in CDI-v2 are:
-
the inclusion of a constraint on the temporal consistency, based on the CDI's value in the preceding dekad (thus rendering obsolete the previously defined PARTIAL RECOVERY stage), and
-
the addition of two TEMPORARY RECOVERY stages – one for soil moisture and the other for vegetation greenness (represented by fAPAR) – with the aim of improving temporal continuity in the case of small gaps in the middle of periods that are otherwise characterized by the same drought stage.
A comparison of the performance of the current version (CDI-v1) and proposed revision (CDI-v2) of the indicator highlights the capability of CDI-v2 to improve on the results of CDI-v1 in several circumstances, without impairing the overall performance for drought events that are already correctly reproduced by CDI-v1. This is indicated by the reduced number of instances where a specific stage is followed by another that is not coherent with the cause–effect modelling framework, as well as by the increase in the extension of ALERT areas (i.e. visible vegetation stress) during events with recorded impacts in agricultural production quantified by reduced annual yield.
While for a few test cases (e.g. the 2018 drought in northern Europe) only marginal changes are observed, in the majority of the cases the new version of the indicator (CDI-v2) clearly outperforms the current version, with an overall better temporal consistency and a more continuous sequencing of the drought stages. In all the observed study cases, CDI-v2 returns a reduced number of cells under the WATCH stage around the peak of the drought in favour of the WARNING (before the peak) and ALERT (at the peak) stages.
On a general level, it is clear that the new version of the indicator better approximates the expected spatiotemporal characteristics of a drought event in all the performed analyses, with a more realistic succession of the WATCH, WARNING, and ALERT stages and a large spatial consistency in the modelled patterns. In addition, in spite of the improved performance of the revised version of the CDI, the indicator's “look and feel” are not substantially altered. Given the well-established community of users of the current version of the CDI that is implemented in EDO, this is a key consideration that can ensure a smooth future transition to the operational use within EDO of the revised version of the CDI that is proposed here.
Finally, with regard to potential further developments of the methodology, in the framework of the continuous maintenance of the EDO system, additional analyses shall be carried out in order to evaluate the potential integration of other indicators, aimed at better capturing drought events at different timescales (e.g. indices based on groundwater) or also incorporating information on evaporative demand into the modelling of meteorological conditions.
Underlying processing code can be obtained via the EDO web portal (https://edo.jrc.ec.europa.eu/, European Commission, 2021) upon request.
All the data used in this study are freely available to the public via the EDO web portal (https://edo.jrc.ec.europa.eu/, European Commission, 2021) upon request. The CDI data are available through the JRC Data Catalogue (http://data.europa.eu/89h/e83b19ce-08c2-4e0c-b93a-5fd62be21e5e, European Drought Observatory, 2020).
The study was conceived by CC. CAM, AdJ, DiM, DaM, and MM provided model input data and support. CC carried out the analysis, with contributions from GN, JS, PB, and JV. CC drafted the article with the help of NMcC. All the authors contributed to the interpretation of the results, provided suggestions, and reviewed the final version of the article.
The authors declare that they have no conflict of interest.
The authors would like to thank the GPCC, NASA, the ECMWF, and the JRC flood group for providing the raw data used in the analysis.
This paper was edited by Ricardo Trigo and reviewed by two anonymous referees.
Blauhut, V., Stahl, K., Stagge, J. H., Tallaksen, L. M., De Stefano, L., and Vogt, J.: Estimating drought risk across Europe from reported drought impacts, drought indices, and vulnerability factors, Hydrol. Earth Syst. Sci., 20, 2779–2800, https://doi.org/10.5194/hess-20-2779-2016, 2016.
Buras, A., Rammig, A., and Zang, C. S.: Quantifying impacts of the 2018 drought on European ecosystems in comparison to 2003, Biogeosciences, 17, 1655–1672, https://doi.org/10.5194/bg-17-1655-2020, 2020.
Cammalleri, C., Verger, A., Lacaze, R., and Vogt, J. V.: Harmonization of GEOV2 FAPAR time series through MODIS data for global drought monitoring, Int. J. Appl. Earth Obs., 80, 1–12, https://doi.org/10.1016/j.jag.2019.03.017, 2019.
Ciais, P., Reichstein, M., Viovy, N., Granier, A., Ogée, J., Allard, V., Aubinet, M., Buchmann, N., Bernhofer, C., Carrara, A., Chevallier, F., De Noblet, N., Friend, A. D., Friedlingstein, P., Grünwald, T., Heinesch, B., Keronen, P., Knohl, A., Krinner, G., Loustau, D., Manca, G., Matteucci, G., Miglietta, F., Ourcival, J. M., Papale, D., Pilegaard, K., Rambal, S., Seufeet, G., Soussana, J. F., Sanz, M. J., Schulze, E. D., Vesala, T., and Valentini, R.: Europe-wide reduction in primary productivity caused by the heat and drought in 2003, Nature, 437, 529–533, https://doi.org/10.1038/nature03972, 2005.
Clark, A., McGowen, I., Crean, J., Kelly, R., and Wang, B.: Stage 1 – Enhanced Drought Information System: NSW DPI Combined Drought Indicator, Technical Report, NSW Department of Primary Industries, 76 pp., Orange, NSW, Australia, ISBN 978-1-76058-016-2, 2016.
De Roo, A., Wesseling, C., and Van Deursen, W.: Physically based river basin modeling within a GIS: The LISFLOOD model, Hydrol. Process., 14, 1981–1992, https://doi.org/10.1002/1099-1085(20000815/30)14:11/12<1981::AID-HYP49>3.0.CO;2-F, 2000.
European Commission: European Drought Observatory, available at: https://edo.jrc.ec.europa.eu/, last access: January 2021.
European Drought Observatory (EDO): EDO Combined Drought Indicator, European Commission, Joint Research Centre (JRC) [Dataset] PID, available at: http://data.europa.eu/89h/e83b19ce-08c2-4e0c-b93a-5fd62be21e5e (last access: January 2021), 2020.
Garcia-Herrera, R., Paredes, D., Trigo, R. M., Trigo, I. F., Hernandez, H., Barriopedro, D., and Mendes, M. T.: The outstanding 2004–2005 drought in the Iberian Peninsula: associated atmospheric circulation, J. Hydrometeorol., 8, 483–498, https://doi.org/10.1175/JHM578.1, 2007.
Greenwood, J. A. and Durand, D.: Aids for fitting the gamma distribution by maximum likelihood, Technometrics, 2, 55–65, https://doi.org/10.1080/00401706.1960.10489880, 1960.
Hanel, M., Rakovec, O., Markonis, Y., Máca, P., Samaniego, L., Kyselý, J., and Kumar, R.: Revisiting the recent European droughts from a long-term perspective, Sci. Rep., 8, 9499, https://doi.org/10.1038/s41598-018-27464-4, 2018.
Hao, Z. and AghaKouchak, A.: Multivariate Standardized Drought Index: a multi-index parametric approach for drought analysis, Adv. Water Resour., 57, 12–18, https://doi.org/10.1016/j.advwatres.2013.03.009, 2013.
Jiménez-Donaire, M. P., Tarquis, A., and Giráldez, J. V.: Evaluation of a combined drought indicator and its potential for agricultural drought prediction in southern Spain, Nat. Hazards Earth Syst. Sci., 20, 21–33, https://doi.org/10.5194/nhess-20-21-2020, 2020.
Karamoutz, M., Rasouli, K., and Nazif, S.: Development of a hybrid index for drought prediction: Case study, J. Hydrol. Eng., 14, 9, https://doi.org/10.1061/(ASCE)HE.1943-5584.0000022, 2009.
Laguardia, G. and Niemeyer, S.: On the comparison between the LISFLOOD modelled and the ERS/SCAT derived soil moisture estimates, Hydrol. Earth Syst. Sci., 12, 1339–1351, https://doi.org/10.5194/hess-12-1339-2008, 2008.
Mariani, S., Braca, G., Romano, E., Lastoria, B., and Bussettini, M.: Linee Guida sugli Indicatori di Siccità e Scarsità Idrica da utilizzare nelle attività degli Osservatori Permanenti per gli Utilizzi Idrici – Stato Attuale e Prospettive Future (in Italian), Technical Report, CREiAMO PA, 56 pp., 2018.
McKee, T. B., Doesken, N. J., and Kleist, J.: The relationship of drought frequency and duration to time scales, Proceedings of the 8th Conference of Applied Climatology, Anaheim, CA, 17–22 January 1993, Am. Meteorol. Soc., 179–184, 1993.
MeteoAM: Climatologia – temperatura e precipitazioni Aprile 2007, available at: http://clima.meteoam.it/bollettinoMensile.php (last access: 10 March 2020), 2007.
Myneni, R., Knyazikhin, Y., and Park, T.: MOD15A2H MODIS/Terra Leaf Area Index/FPAR 8-Day L4 Global 500 m SIN Grid V006 [Data set], NASA EOSDIS Land Processes DAAC, https://doi.org/10.5067/MODIS/MOD15A2H.006, 2015.
Otkin, J. A., Svoboda, M., Hunt, E. D., Ford, T. W., Anderson, M. C., Hain, C., and Basara, J. B.: Flash droughts: A review and assessment of the challenges imposed by rapid-onset droughts in the United States, B. Am. Meteorol. Soc., 99, 911–919, https://doi.org/10.1175/BAMS-D-17-0149.1, 2018.
Peters, W., Bastos, A., Ciais, P., and Vermeulen, A.: A historical, geographical and ecological perspective on the 2018 European summer drought, Philos. T. R. Soc. B., 375, 20190505, https://doi.org/10.1098/rstb.2019.0505, 2020.
Rebetez, M., Mayer, H., Dupont, O., Schindler, D., Gartner, K., Kropp, J. P., and Menzel, A.: Heat and drought 2003 in Europe: A climate synthesis, Ann. For. Sci., 63, 569–577, https://doi.org/10.1051/forest:2006043, 2006.
Rembold, F., Meroni, M., Urbano, F., Csak, G., Kerdiles, H., Perez-Hoyos, A., Lemoine, G., Leo, O., and Negre, T.: ASAP: A new global early warning system to detect anomaly hot spots of agricultural production for food security analysis, Agr. Syst., 168, 247–257, https://doi.org/10.1016/j.agsy.2018.07.002, 2019.
Schwarz, M., Landmann, T., Cornish, N., Wetzel, K.-F., Siebert, S., and Franke, J.: A spatially transferable drought hazard and drought risk modeling approach based on remote sensing data, Remote Sens., 12, 237, https://doi.org/10.3390/rs12020237, 2020.
Seneviratne, S. I., Corti, T., Davin, E. L., Hirschi, M., Jaeger, E. B., Lehner, I., Orlowsky, B., and Teuling A. J.: Investigating soil moisture-climate interactions in a changing climate: a review, Earth‐Sci. Rev., 99, 125–161, 2010.
Sepulcre-Canto, G., Horion, S., Singleton, A., Carrao, H., and Vogt, J.: Development of a Combined Drought Indicator to detect agricultural drought in Europe, Nat. Hazards Earth Syst. Sci., 12, 3519–3531, https://doi.org/10.5194/nhess-12-3519-2012, 2012.
Spinoni, J., Naumann, G., Vogt, J. V., and Barbosa, P.: The biggest drought events in Europe from 1950 to 2012, J. Hydrol. Regional Studies, 3, 509–524, https://doi.org/10.1016/j.ejrh.2015.01.001, 2015.
Svoboda, M., Lecomte, D., Hayes, M., Heim, R., Gleason, K., Angel, J., Rippey, B., Tinker, R., Palecki, M., Stooksbury, D., Miskus, D., and Stephens, S.: The drought monitor, B. Am. Meteorol. Soc., 83, 1181–1190, https://doi.org/10.1175/1520-0477-83.8.1181, 2002.
Thom, H. C. S.: A note on the Gamma distribution, Mon. Weather Rev., 86, 117–122, https://doi.org/10.1175/1520-0493(1958)086<0117:ANOTGD>2.0.CO;2, 1958.
Vogt, J. V., Naumann, G., Masante, D., Spinoni, J., Cammalleri, C., Erian, W., Pischke, F., Pulwarty, R., and Barbosa, P.: Drought Risk Assessment and Management: A Conceptual Framework, JRC Technical Reports, Publications Office of the European Union, Luxemburg, https://doi.org/10.2760/919458, 2018a.
Vogt, J. V., Barbosa, P., Cammalleri, C., Carrão, H., and Lavaysse, C.: Drought Risk Management: Needs and Experiences in Europe, in: Drought and Water Crises, Integrating Science, Management, and Policy (Chap. 18), edited by: Wilhite, D. A. and Pulwarty, R. S., CRC Press (Taylor & Francis), Boca Raton, Florida, USA, 385–407, 2018b.
Wilhite, D. A. and Pulwarty, R. S.: Drought and Water Crises: Lessons learned and the road ahead, in: Drought and Water Crises: Science, Technology, and Management Issue (Chap. 15), CRC Press (Taylor & Francis), Boca Raton, Florida, USA, 389–398, 2005.
World Meteorological Organization (WMO): Standardized Precipitation Index User Guide (Svoboda, M., Hayes, M., and Wood, D.), WMO-No. 1090, Geneva, Switzerland, 16, available at: https://public.wmo.int/en/resources/library/standardized-precipitation-index-user-guide (last access: January 2021), 2012.
World Meteorological Organization (WMO), and Global Water Partnership (GWP): National Drought Management Policy Guidelines – A Template for Action, (Wilhite, D. A.), Integrated Drought Management Programme (IDMP) Tools and Guidelines Series 1., WMO, Geneva, Switzerland and GWP, Stockholm, Sweden, ISBN 978-92-63-11164-7 and 978-91-87823-03-9, 2014.
World Meteorological Organization (WMO), and Global Water Partnership (GWP): Handbook of Drought Indicators and Indices (Svoboda, M. and Fuchs, B. A.), Integrated Drought Management Programme (IDMP), Integrated Drought Management Tools and Guidelines, Series 2, Geneva, Switzerland, 45, available at: https://public.wmo.int/en/resources/library/standardized-precipitation-index-user-guide (last access: January 2021), 2016.
Yang, T., Zhou, X., Yu, Z., Krysanova, V., and Wang, B.: Drought projection based on a hybrid drought index using Artificial Neural Networks, Hydrol. Process., 29, 2635–2648, https://doi.org/10.1002/hyp.10394, 2014.
Zhu, J., Zhou, L., and Huang, S.: A hybrid drought index combining meteorological, hydrological, and agricultural information based on the entropy weight theory, Arab. J. Geosci., 11, 91, https://doi.org/10.1007/s12517-018-3438-1, 2018.