the Creative Commons Attribution 4.0 License.
the Creative Commons Attribution 4.0 License.
 | 23 Dec 2021
How is avalanche danger described in textual descriptions in avalanche forecasts in Switzerland? Consistency between forecasters and avalanche danger
Veronika Hutter
Ross S. Purves
Effective and efficient communication of expected avalanche conditions and danger to the public is of great importance, especially where the primary audience of forecasts are recreational, non-expert users. In Europe, avalanche danger is communicated using a pyramid, starting with ordinal levels of avalanche danger and progressing through avalanche-prone locations and avalanche problems to a danger description. In many forecast products, information relating to the trigger required to release an avalanche, the frequency or number of potential triggering spots, and the expected avalanche size is described exclusively in a textual danger description. These danger descriptions are, however, the least standardized part of avalanche forecasts. Taking the perspective of the avalanche forecaster and focusing particularly on terms describing these three characterizing elements of avalanche danger, we investigate first which meaning forecasters assign to the text characterizing these elements and second how these descriptions relate to the forecast danger level. We analyzed almost 6000 danger descriptions in avalanche forecasts published in Switzerland and written using a structured catalogue of phrases with a limited number of words. Words and phrases representing information describing these three elements were labeled and assigned to ordinal classes by Swiss avalanche forecasters. These classes were then related to avalanche danger. Forecasters were relatively consistent in assigning labels to words and phrases with Cohen's kappa values ranging from 0.64 to 0.87. Avalanche danger levels were also described consistently using words and phrases, with for example avalanche size classes increasing monotonically with avalanche danger. However, especially for danger level 2 (moderate), information about key elements of avalanche danger, for instance the frequency or number of potential triggering spots, was often missing in danger descriptions. In general, the analysis of the danger descriptions showed that extreme conditions are described in more detail than intermediate values, highlighting the difficulty of communicating conditions that are neither rare nor frequent or neither small nor large. Our results provide data-driven insights that could be used to refine the ways in which avalanche danger could be communicated. Furthermore, through the perspective of the semiotic triangle, relating a referent (the avalanche situation) through thought (the processing process) to symbols (the textual danger description), we provide an alternative starting point for future studies of avalanche forecast consistency and communication.
- Article
(1853 KB) - Full-text XML
-
Supplement
(2017 KB) - BibTeX
- EndNote


Public avalanche forecasts, as provided in many mountainous regions, inform readers about snow and avalanche conditions at a regional scale. To effectively communicate different components of the avalanche situation, forecasts often describe expected conditions systematically, using a hierarchical information pyramid communicating the current regional danger level, the most avalanche-prone locations (slope aspects and elevation range, also called the core zone), and the dominant avalanche problem as well as narrative text, a danger description (Fig. 1a and b; e.g., Engeset et al., 2018; SLF, 2020), or snowpack and weather summaries. Although the communication of danger levels, corresponding core zones, and dominant avalanche problems is often standardized using common terms or icons (e.g., in Europe: five danger levels, EAWS, 2021a, and five avalanche problems, EAWS, 2021b), the degree of detail and the use of text and graphics vary considerably between forecast products issued by different (usually national) forecasting centers (Burkeljca, 2013; Engeset et al., 2018; Techel et al., 2018). Important information describing the severity of the avalanche conditions, such as likely triggers required to release an avalanche, the frequency with which such triggering spots will be found in a region, the specifics of the likely locations of these triggering spots, and the expected avalanche sizes, is communicated in various ways (Table 1). Even though this information defines the avalanche danger level, its communication is much less standardized. In North America, this information is often provided through a combination of keywords and graphics. In Europe, however, narrative textual danger descriptions are much more common (Table 1, Fig. 1b), though in Norway a tabular format has been adopted (Engeset et al., 2018).
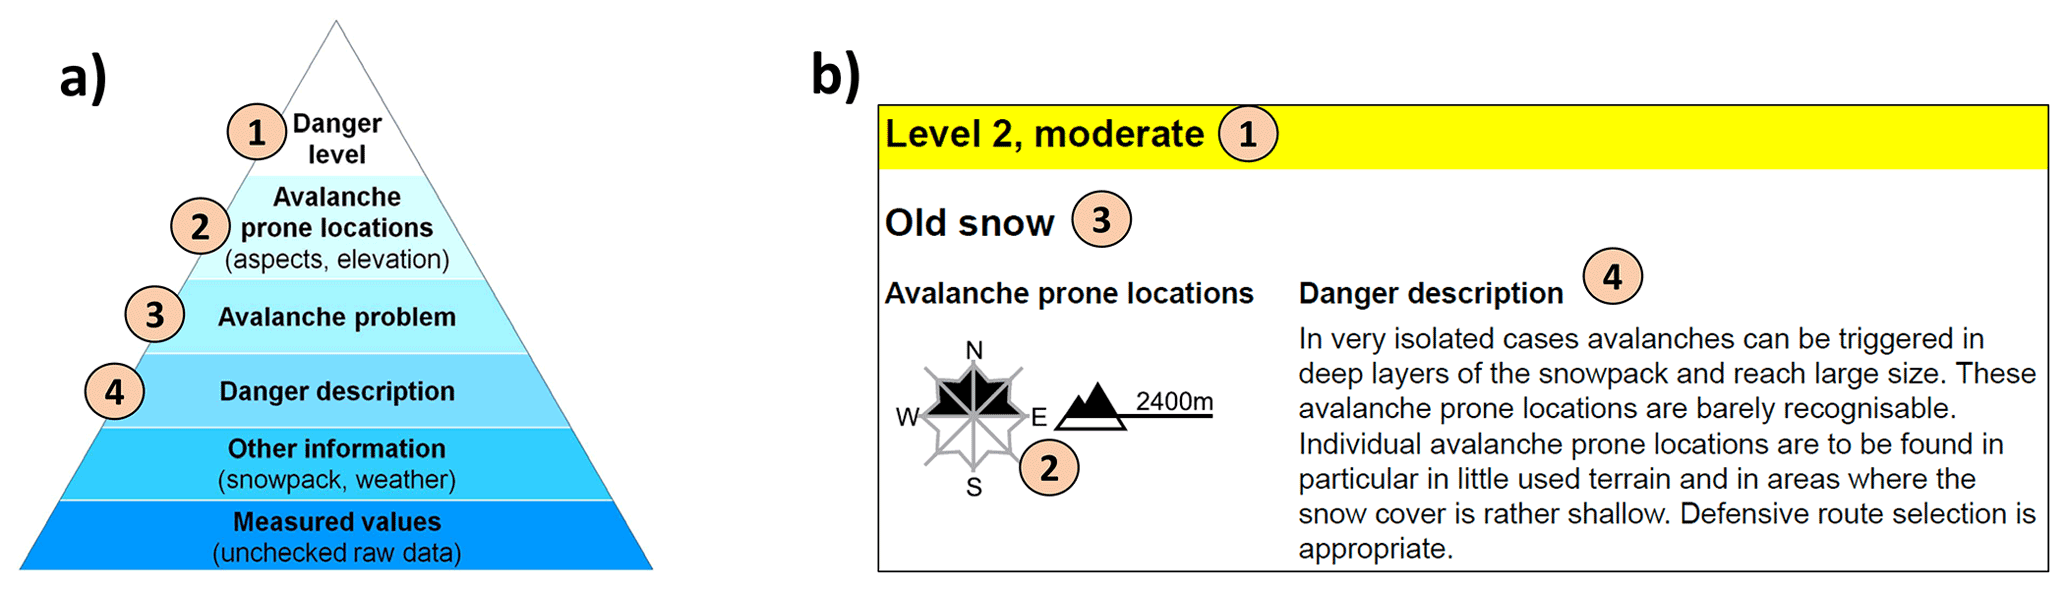
Figure 1(a) In Europe, avalanche forecasts are structured according to an information pyramid (EAWS, 2021c), with the danger level at the top (1), followed by the avalanche-prone locations and the avalanche problem (2 and 3) and a danger description (4) providing further details. (b) Exemplary description of a danger region in the Swiss avalanche forecast (forecast published on 26 February 2021 at 08:00 CET). Even though the danger description is written in present tense, it describes the expected conditions for the 24 h following publication.
Table 1Overview showing examples of how information regarding contributing factors of avalanche danger is presented in avalanche forecast products. For each forecasting center, a randomly selected forecast product is provided in the supplementary material (see Supplement).
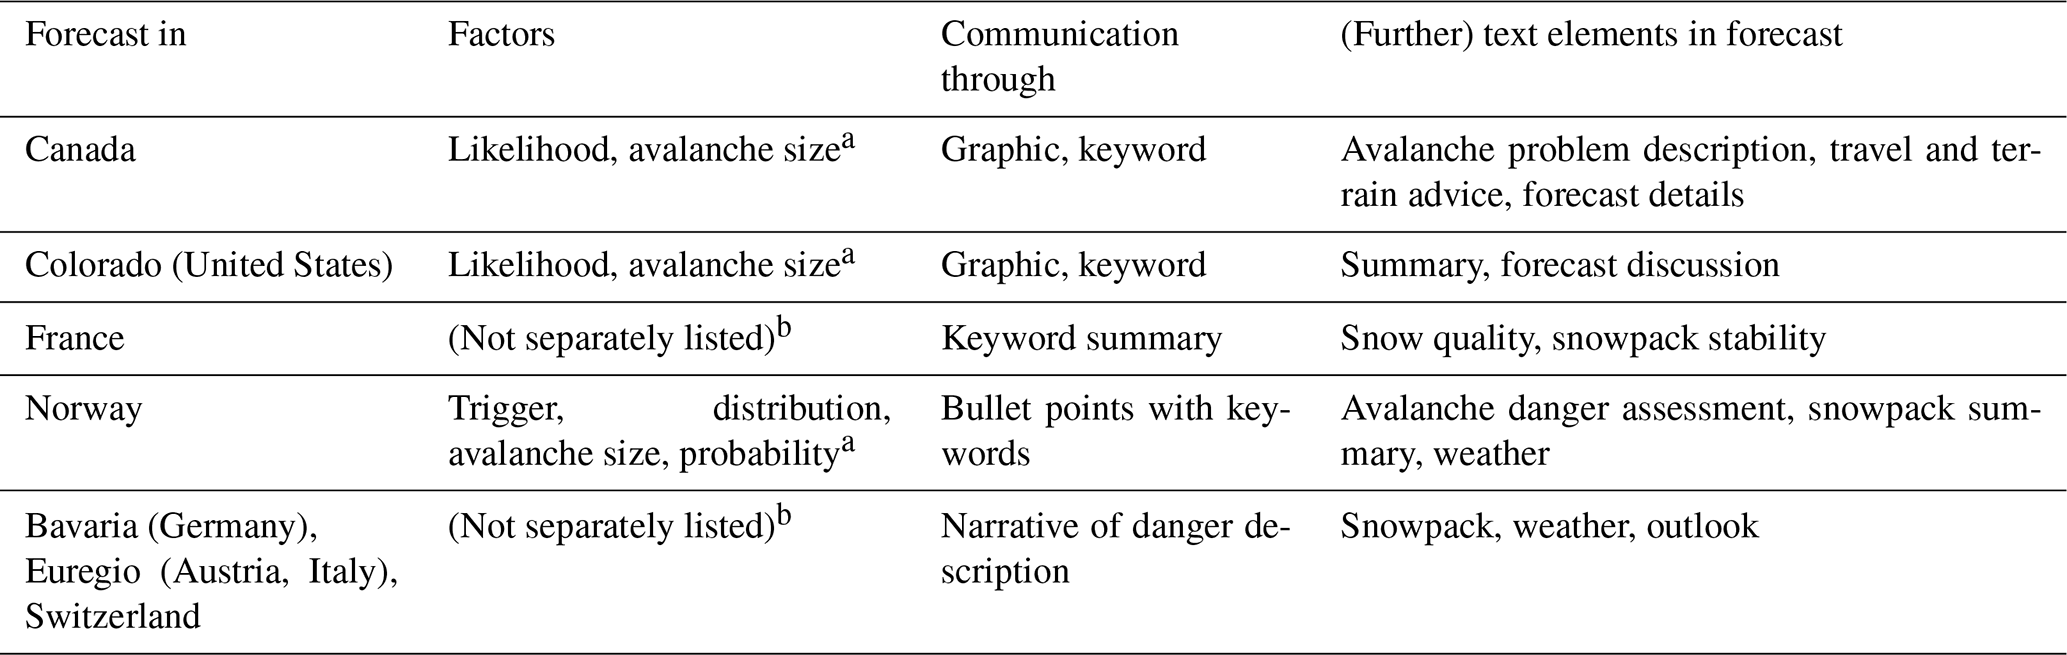
a The factors characterize the avalanche problem(s) separately.
b The description of the factors refers to the main avalanche problem(s) relevant for the avalanche danger assessment and/or avalanche danger as a whole. The description of all the factors characterizing the avalanche problem or avalanche danger within the text is not compulsory.
Canada: Avalanche Canada; Colorado: Colorado Avalanche Information Center (CAIC); France: Météo-France; Norway: Norwegian Water Resources and Energy Directorate (NVE); Euregio: Province of Tyrol, Autonomous Provinces of Bolzano–South Tyrol and Trento; Switzerland: Swiss Federal Institute for Forest, WSL Institute for Snow and Avalanche Research (SLF).
Public avalanche warning services in Europe aim to provide efficient and effective forecasts to their users (e.g., EAWS, 2017). To achieve this goal, forecasts in general must provide credible information of value to the user (e.g., Williams, 1980; Gordon and Shaykewich, 2000). Value, however, is directly influenced by forecasts being consistent and accurate (Murphy, 1993). In recent years, this fact has increasingly been recognized in avalanche forecasting. To date, the most effort exploring quality and consistency of avalanche forecasts has focused on the forecast danger level (e.g., Elder and Armstrong, 1987; Giraud et al., 1987; Brabec and Stucki, 1998; Lazar et al., 2016; Techel and Schweizer, 2017; Techel et al., 2018) and more rarely on other forecast elements, such as the avalanche problem (Statham et al., 2018b). Little research has explored either consistency or quality of icons or the text used by forecasters when assessing avalanche danger. For instance, when asking avalanche professionals to assign a probability to the meaning of the five classes describing the likelihood of avalanches (Thumlert et al., 2020) or to rate the size of observed avalanches (Moner et al., 2013), considerable variation in responses was noted. Most studies have treated the forecast as a product and, for example, explored usability by testing whether users were aware of different elements of the forecast (Winkler and Techel, 2014) or whether users understood the information presented (LWD Steiermark, 2015). Engeset et al. (2018) tested the comprehension of text, icons, and pictures among Norwegian avalanche bulletin users and noted that ability to comprehend the information provided in the forecast depends on the competency of the user and the complexity of the avalanche scenario. Recent work in North America used interviews to develop a typology of avalanche forecast users' competency with respect to forecast content (St. Clair et al., 2021). In a similar vein, Finn (2020) surveyed the literacy of forecast readers with respect to standardized terms and icons used in North America (such as listing or ordering the danger levels, identifying avalanche problem icons, or applying information in a slope-choice experiment). Clark (2019) explored the characterization of the severity of the avalanche problem in Canadian avalanche forecasts, described by the likelihood of avalanches (comparable to the combination of snowpack stability and the frequency distribution of snowpack stability in Europe) and avalanche size for each avalanche problem type separately, in relation to the avalanche danger rating. Clark (2019) noted variations in the way the same avalanche danger level was characterized between different avalanche problems.
However, to our knowledge, there has been no systematic exploration of how forecasters actually describe the avalanche conditions in the narrative part of avalanche forecasts, despite such textual descriptions being the main way of communicating the factors describing the severity of the expected avalanche conditions in many forecast products in Europe (Table 1).
Standards used in avalanche forecasting, including the avalanche danger scale (Table 2; EAWS, 2021a), the avalanche problems (EAWS, 2021b), the avalanche size classification (EAWS, 2021b), or the conceptual model of avalanche hazard (Statham et al., 2018a), make use of specific terms to describe the stability of the snowpack (or what it takes to trigger an avalanche), the frequency distribution of snowpack stability (or how frequent triggering spots are), and what the expected avalanche size and hence the damage potential are. Nonetheless, these descriptions often include undefined, ambiguous, or hedged statements (Schweizer et al., 2020; Ebert and Milne, 2021) allowing considerable room for interpretation by both forecasters and forecast users. Furthermore, there are many possible ways for forecasters to incorporate individual terms into the narrative texts often used to communicate details of avalanche danger in Europe (Table 1).
Thus, to answer the question of how avalanche danger is described in textual descriptions in avalanche forecasts, focusing on the perspective of the forecaster, we arrive at our first research question: (1) how well do forecasters agree on the meaning of terms characterizing triggers required to release avalanches, frequencies of triggering spots, and expected avalanche sizes? Our second research question builds on this characterization, and asks the following: (2) how does the use of language in danger descriptions relate to avalanche danger? To address these questions, we explored danger descriptions, written using a controlled-language environment (referred to as the catalogue of phrases; Winkler and Kuhn, 2017), and avalanche danger published in more than 1000 avalanche forecasts by the national avalanche warning service in Switzerland during eight forecast seasons. The use of the catalogue of phrases is important as it impacts the forecast product since all forecasters use the same set of words. It also impacts the analysis as the number of possible combinations of words and phrases, though large, is finite and known. We analyzed these texts in a two-step process: first, starting from an iterative annotation process (Pustejovsky and Stubbs, 2013), we annotated textual phrases relating to avalanche danger for further analysis. In a second step, Swiss avalanche forecasters related these text phrases directly to contributing factors of avalanche danger (RQ1). Building on this classification, we then extracted and analyzed text used in published danger descriptions and related it to the reported avalanche danger levels (RQ2).
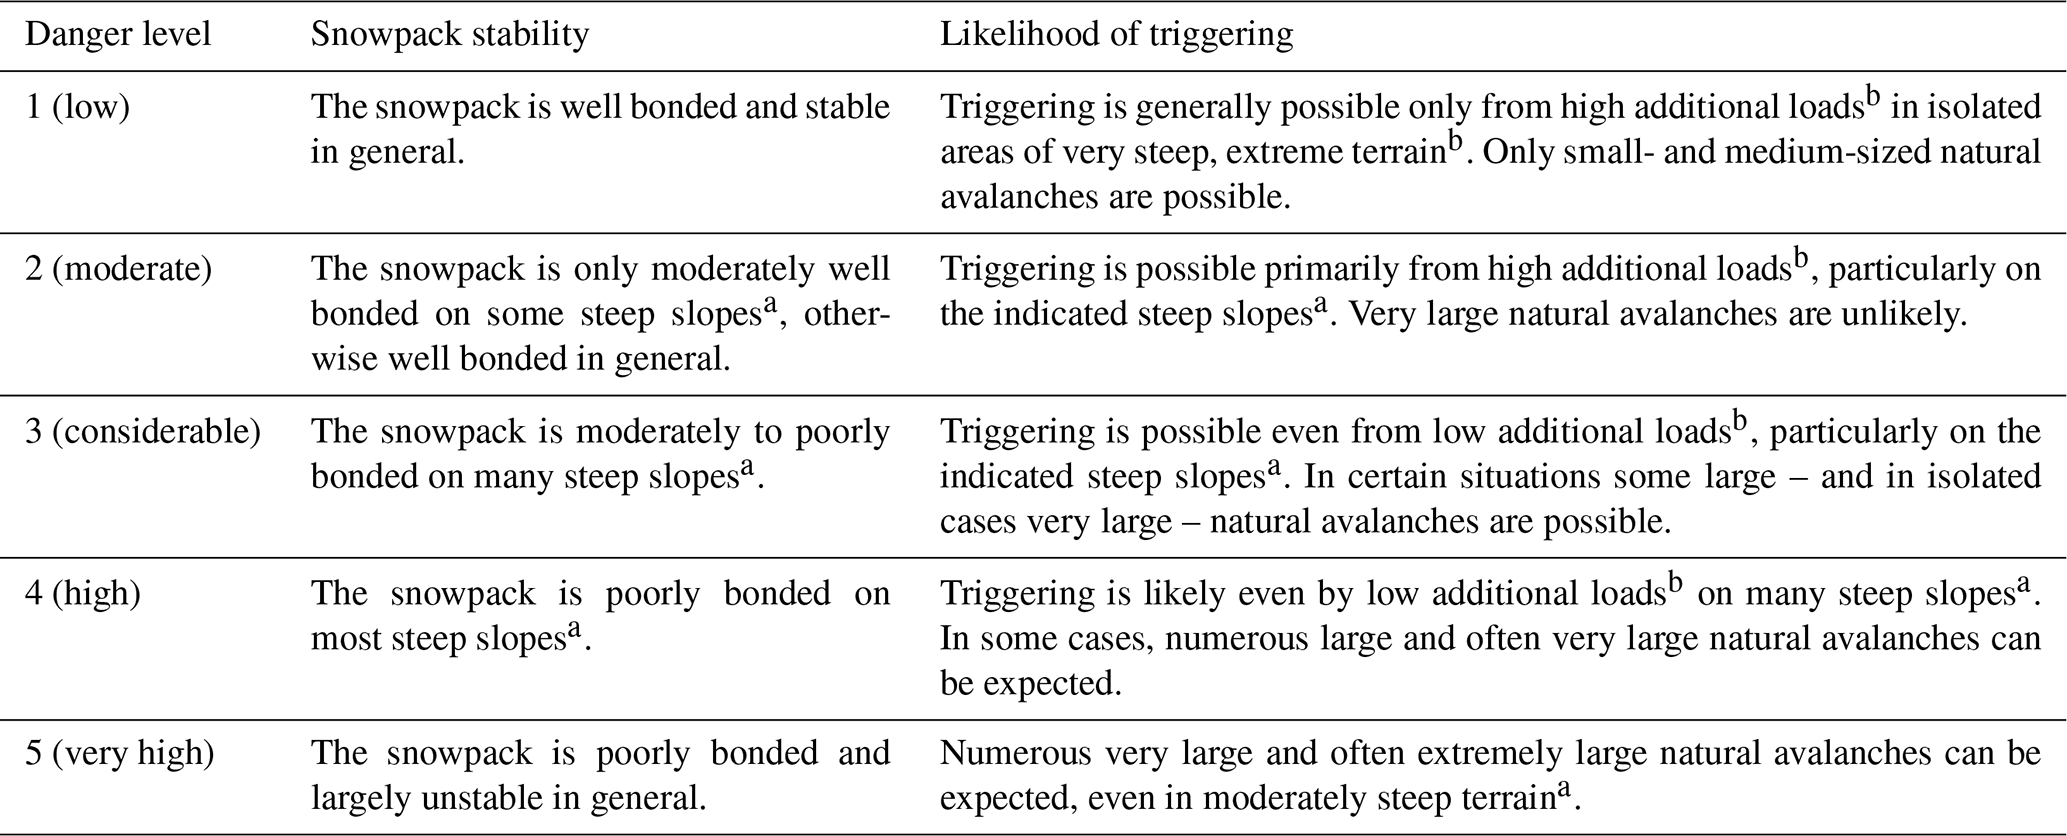
a The avalanche-prone locations are described in greater detail in the avalanche forecast (altitude, slope aspect, type of terrain): moderately steep terrain – slopes shallower than about 30∘; steep slopes – slopes steeper than about 30∘; very steep, extreme terrain – particularly adverse terrain related to slope angle (more than about 40∘), terrain profile, proximity to ridge, smoothness of underlying ground surface.
b Additional loads: low – individual skier or snowboarder riding softly and not falling, snowshoer, group with good spacing (minimum 10 m) and keeping distances; high: two or more skiers or snowboarders without good spacing (or without intervals), snow machine, explosives; natural – without human influence.
In Switzerland, the national avalanche warning service at the WSL Institute for Snow and Avalanche Research (SLF), Davos, is responsible for the publication of avalanche forecasts covering the Swiss Alps and the Jura mountains.
Avalanche forecasters in Switzerland use definitions and guidelines provided by the European Avalanche Warning Services (EAWS) when assessing and communicating avalanche danger. Of particular relevance is the European Avalanche Danger Scale (EADS; EAWS, 2021a, Table 2), which qualitatively describes the five danger levels (1 (low), 2 (moderate), 3 (considerable), 4 (high), 5 (very high)) in terms of snowpack stability and the likelihood of triggering. The EADS links triggers typically required to release avalanches, the number of potential triggering spots or of avalanches, the probability of avalanche release, and the potential size of avalanches to the ordinal danger levels.
Swiss avalanche forecasts describe expected regional avalanche conditions, always communicating the highest danger level expected during the forecast period (SLF, 2020). In Switzerland, dry-snow conditions, where they exist, are essentially always summarized by a danger rating, with the danger description describing these dry-snow conditions and relevant avalanche problems. Wet-snow conditions, on the other hand, are often mentioned only as a secondary problem. This in turn means that danger resulting from secondary wet-snow problems is at most as high as the danger level communicated with the primary problem but may often be lower. A danger rating referring to wet-snow conditions is only given if the danger of wet-snow or gliding avalanches exceeds that of dry-snow avalanches.
To communicate spatial variation in avalanche conditions, the forecast area is divided into almost 150 warning regions, the smallest spatial units used in the forecast. These warning regions are aggregated flexibly to danger regions, which are characterized with the same danger level, avalanche problems, avalanche-prone locations, and danger description (see example in Fig. 1b, which shows the forecast components describing avalanche danger in a danger region). Each danger region contains a textual description of avalanche conditions. In Switzerland, the severity of the avalanche situation is described exclusively in the danger description (see also Table 1 for a comparison with other forecasts). The trigger, the frequency of triggering spots, and avalanche size described in the text may refer to a specific avalanche problem (as in the example in Fig. 1b) or to the avalanche conditions as a whole.
Avalanche forecasts are published in the evening at 17:00 CET and are valid until the following day at 17:00 CET During the main winter season forecasts are also updated at 08:00 CET, remaining valid until 17:00 CET on the same day.
Since November 2012, the text of Swiss avalanche forecasts has been prepared using a controlled-language environment, relying on a so-called catalogue of phrases (Winkler et al., 2013; Winkler and Kuhn, 2017) – a collection of predefined sentence templates, permitting instantaneous, automatic translation of the German text into French, Italian, and English. The aim of such a catalogue of phrases is, for one base language, to allow generation of naturalistic texts using a restricted lexicon, base syntax, and semantics Kuhn (2014). The resulting texts are understandable by speakers of the base language, and as shown by Winkler and Kuhn (2017), speakers could not distinguish between danger descriptions written using the catalogue of phrases and freely written danger descriptions. Using this catalogue of phrases also makes automatic translation straightforward, and recently the catalogue has been extended to Spanish and Catalan (since winter 2020/21).
The catalogue of phrases consists of a number of sentences, each containing a number of phrase_options. Phrase_options contain either values, the actual textual content, or up to two additional levels of phrase_options, thus allowing an enormous number of possible combinations. An example, illustrating the creation of a single sentence, is shown and explained in Fig. 2.
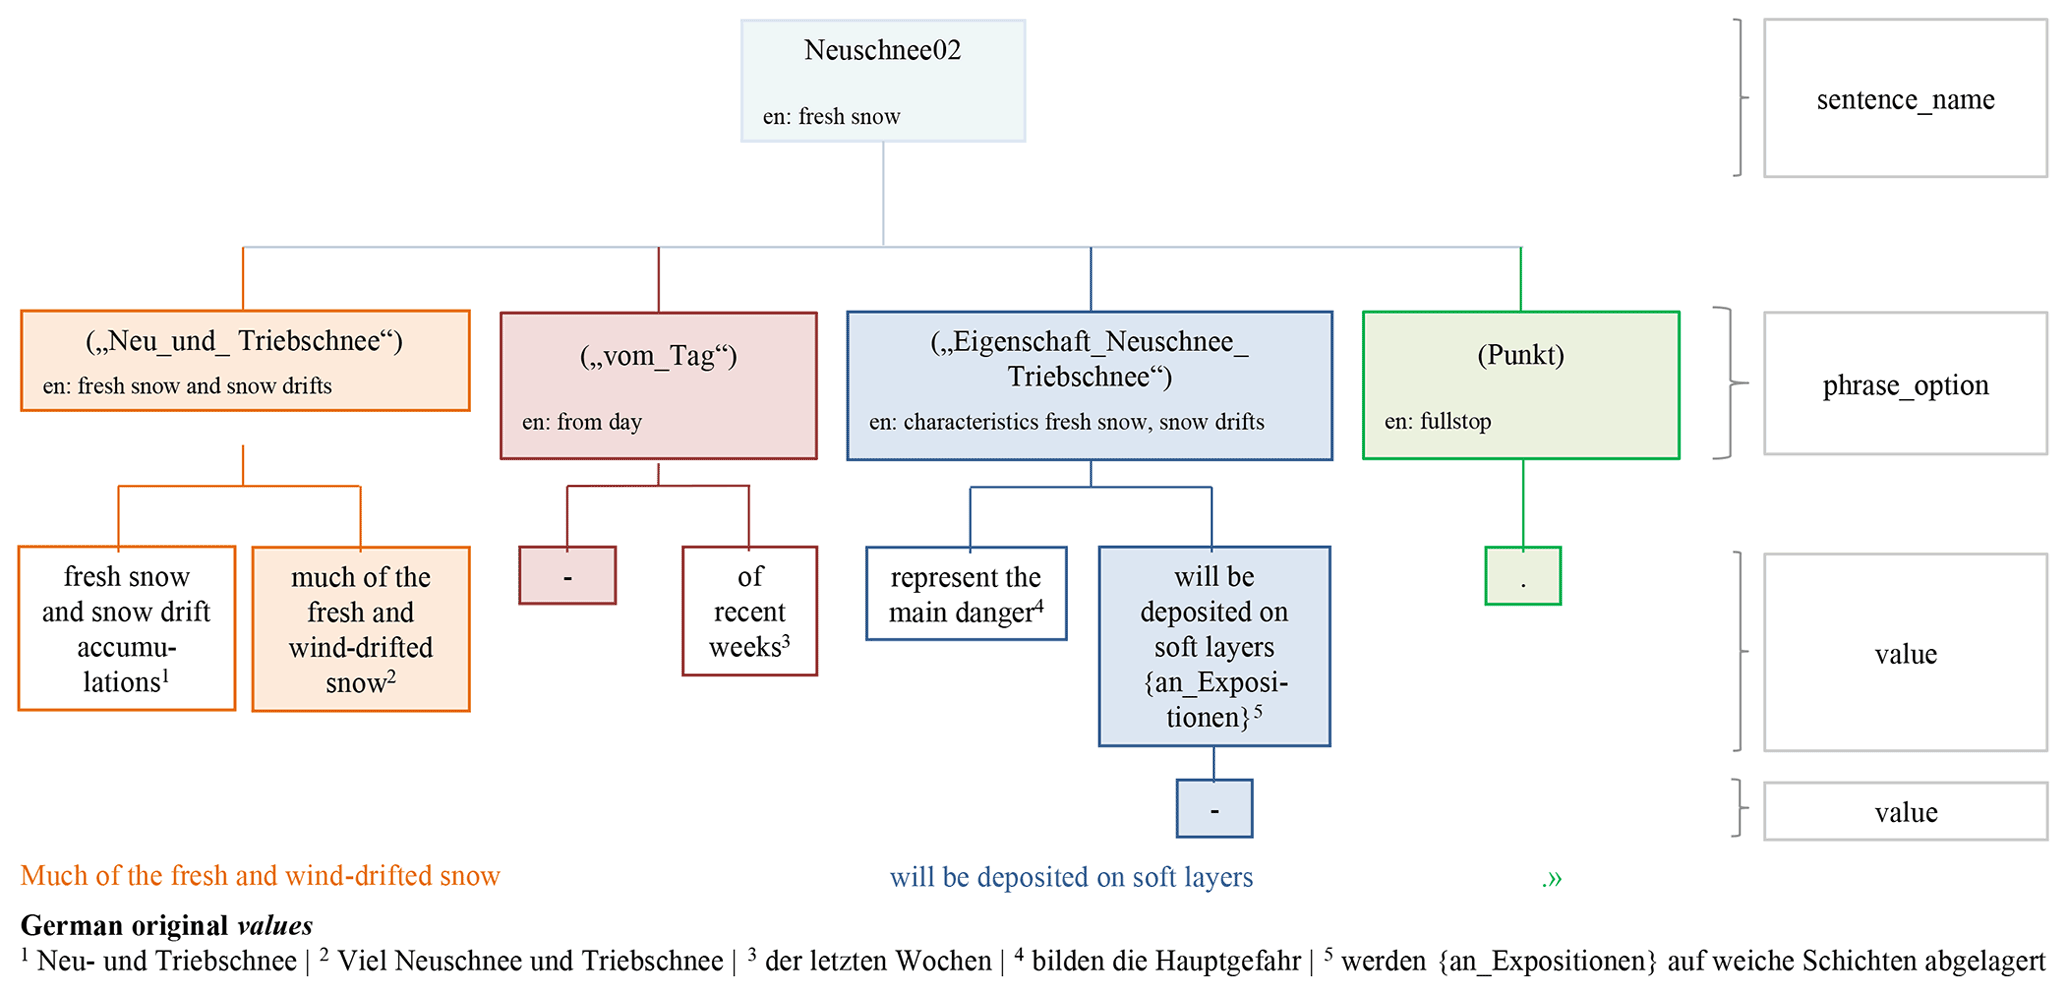
Figure 2Structure of the catalogue of phrases. A sentence consists of phrase_options. These must be filled with values. In this example, the sentence labeled Neuschnee02 is selected. This sentence contains four phrase_options, each providing a set of values (text modules). In this example, only two of the possible values are shown. The operational language in the Swiss catalogue of phrases is German.
We analyzed 1286 map-based avalanche forecasts published at 17:00 CET during eight winter seasons between 27 November 2012 and 13 February 2020. A total of 5897 danger regions were described by a danger level, an avalanche problem, aspects and elevations where the danger prevails, and a danger description.
For this study, we extracted the forecast danger level (element 1 in Fig. 1) and the respective danger description related to the major problem being either dry-snow conditions or wet-snow or gliding avalanches (elements 4 and 3 in Fig. 1, Table 3).

We worked with German danger descriptions as German is both the working language of forecasters in Switzerland and the base language used in the creation of the catalogue of phrases. Since the danger descriptions, written with the catalogue of phrases, are a form of controlled natural language (Kuhn, 2014), they can be analyzed using standard natural language processing methods. As we are working with a finite corpus of phrases, and we are interested in how those meanings or phrases can be and are interpreted (the semantics), we manually annotated textual elements in the catalogue of phrases (Pustejovsky and Stubbs, 2013). We followed the iterative annotation proposed by Pustejovsky and Stubbs (2013), which they describe as the model–annotate–model–annotate (MAMA) cycle.
Our starting point was the catalogue of phrases and its 9989 unique values. As only some values contain information related to the three key factors characterizing avalanche danger – type of trigger, the frequency of triggering spots, and avalanche size – a two-step approach was used to annotate the text.
First, rules were defined (step 1 in Fig. 3) before individual values in the catalogue of phrases were assigned to one of the three key factors in an iterative annotation process using these rules (Sect. 4.1). This initial step allowed us to retain only values contained in the catalogue of phrases judged to describe one of the three key factors, considerably reducing the amount of labeling to be done in the following step. Second (step 2 in Fig. 3), the values which characterize the key factors were assigned ordinally ranked thematic labels according to current practice and/or suggested labeling used in avalanche forecasting or recent research (Sect. 4.2). These two steps allowed us to answer research question 1: how well do forecasters agree on the meaning of terms characterizing triggers required to release avalanches, frequencies of triggering spots, and expected avalanche sizes?
Finally, danger descriptions and the labels assigned to them were analyzed with respect to avalanche danger (step 3 in Fig. 3, Sect. 4.3), permitting the exploration of research question 2: how does the use of language in danger descriptions relate to avalanche danger?
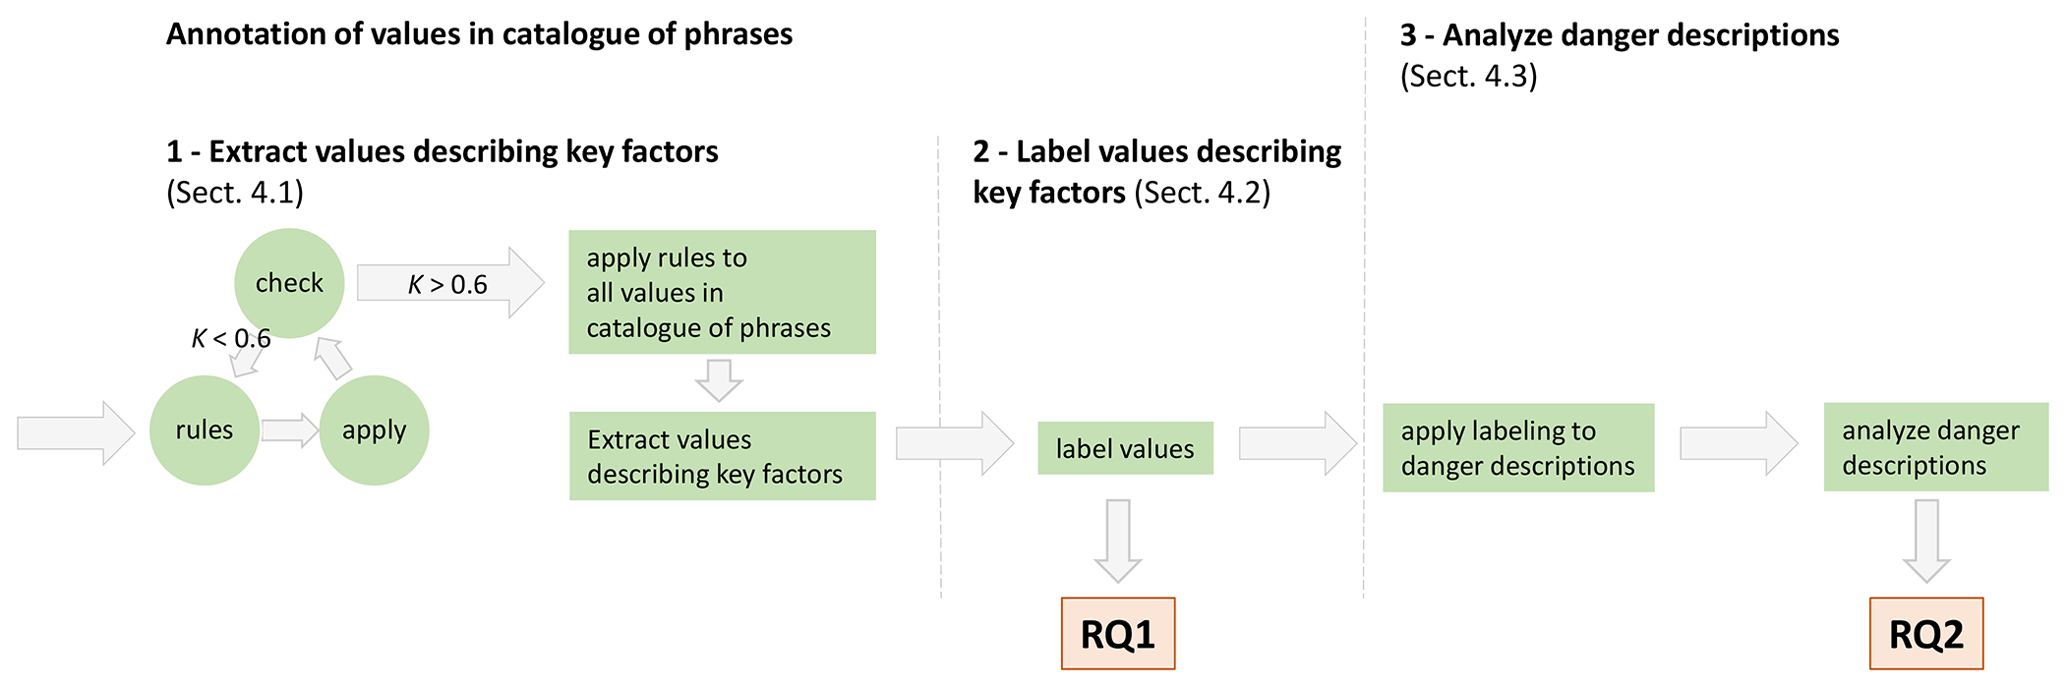
Figure 3Workflow describing the annotation of values in the catalogue of phrases and the analysis of the danger descriptions. The annotation (step 1) and labeling (step 2) of the values allowed research question 1 to be answered (RQ1: how well do forecasters agree on the meaning of terms characterizing triggers required to release avalanches, frequencies of triggering spots, and expected avalanche sizes?), while the application of the labeling to the danger descriptions (step 3) permitted RQ2 to be answered (RQ2: how does the use of language in danger descriptions relate to avalanche danger?). For details refer to text.
4.1 Catalogue of phrases: annotation and extraction of values describing key factors
The values in the catalogue of phrases were labeled in an iterative process (Hutter, 2020), summarized as follows (see also Fig. 3 – step 1):
- (a)
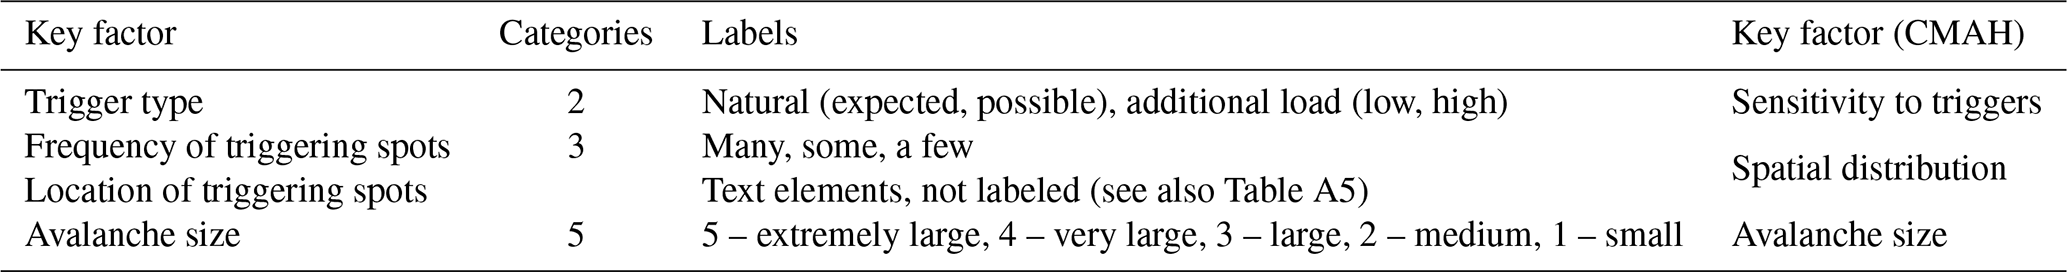
Annotation rules were developed based on the definitions or descriptions of key factors in the scientific literature and operational guidelines. We distinguished three key factors, which we refer to as the trigger type, the frequency of triggering spots, and avalanche size (Table 4). A short version of the annotation rules is provided in Appendix Table A1. In addition, we also annotated text values specifying the location of triggering spots.
- (b)
Relying on these rules, all the values in a set of 10 randomly selected danger descriptions (2 for each danger level) were annotated with regard to which of the key factors they belonged to.
- (c)
Following annotation, the agreement between pairs of annotators was assessed by calculating the inter-rater agreement score (Cohen's kappa coefficient κ), which also takes into account the agreement by random chance (Landis and Koch, 1977).
- (d)
Steps (a) to (c) were repeated until sufficient agreement in labeling was achieved. We considered a sufficient agreement if the minimal agreement between any of the annotators was κ>0.6, which is considered substantial agreement according to Landis and Koch (1977). To achieve this level of agreement, three annotation rounds, after each of which the annotation rules were discussed and revised, were carried out. In each of these rounds, 10 new danger descriptions were annotated. The agreement between annotators increased from κ>0.54 (round 1) to κ>0.7 (round 3).
- (e)
Applying the annotation rules, the values contained in the catalogue of phrases were assigned to a key factor. As only a small subset was annotated in the three annotation rounds (5 % of the values), the assigned labels were quality-checked, resulting in the inclusion of two additional values. About 1200 values contained information characterizing one of the three key factors.
Table 4Labels and number of categories used to describe the key factors. In addition to the labels shown, a value could also be labeled not assignable. The order of the labels corresponds to the rank order used in this analysis with the left-most labels representing the most unfavorable conditions and the right-most label the most favorable conditions. A comparison with the terms used in the conceptual model of avalanche hazard (CMAH) is also provided as a guide.
4.2 Catalogue of phrases: labeling of values
Once the values were assigned to key factors, the second step was the labeling of the individual values (see also Fig. 3 – step 2).
We first grouped values with very similar meanings. Values considered similar included variations which we judged to be synonymous, such as even in places that are not usually affected (German original: an sonst wenig gefährdeten Orten) and even in places that are usually less vulnerable (German original: an sonst weniger gefährdeten Orten), or singular and plural forms. This reduced the original set of 1200 values to 109.
To label the values, no further annotation rules were defined as we were interested in how the forecasters (our annotators) understood these values (RQ 1). The number and labels of classes was based on definitions and descriptions used in avalanche forecasting in Europe (Table 4): five avalanche size classes and their official labels (EAWS, 2021b), the distinction of trigger types as natural or artificial triggers (EAWS, 2021a), and three classes for the frequency of triggering spots or number of avalanches as in the current working documents of the European Avalanche Warning Services (e.g., EAWS, 2021a). In addition, two probability terms are used in Switzerland to describe the occurrence of natural avalanches.
- (i)
Three annotators assigned a single class to the 109 groups of values, including the option that a class could not be assigned. The inter-rater agreement rates ranged from 0.53 (considered moderate) to 0.63 (considered substantial). A total of 53 % of the groups of values were rated the same by all 3 annotators; 22 of the values could not be assigned to a class by at least 2 of the 3 annotators. For instance, text describing avalanches releasing deep within the snowpack (German original: tief in der Schneedecke) or weak layers existing close to the snow surface (German original: Schwachschichten nahe an der Schneeoberfläche) could be interpreted as being related to avalanche size. These text values were therefore assigned a relation with avalanche size in the annotation step described in the previous section (Sect. 4.1). However, in the annotation round described here, when annotators were specifically asked to assign a size class (or two), none could do so.
- (ii)
Removing the values which could not be assigned to a class in the first round (i), the eight avalanche forecasters working at SLF assigned one or two classes to values. The inter-rater agreement rate κ was on average 0.74 (considered substantial; Landis and Koch, 1977) between any two annotators, but ranged between 0.64 (considered substantial) and 0.87 (considered almost perfect; see also Appendix Fig. A1). A total of 53 % of the values were assigned the same class by all eight forecasters.
If five annotators (a majority) indicated the same class, the value was assigned to this class. If there was no clear majority vote, the value was assigned to the two most frequent classes chosen. The values and their assignment to classes are shown in the Appendix (Tables A2 to A4), with their German original, a corresponding English translation, and the assigned class labels. For the remainder of this paper, we refer purely to the class labels shown in Table 4.
Values which described the location of potential trigger locations were not categorized. An overview of these values is given in the Appendix (Table A5).
4.3 Danger description: analysis
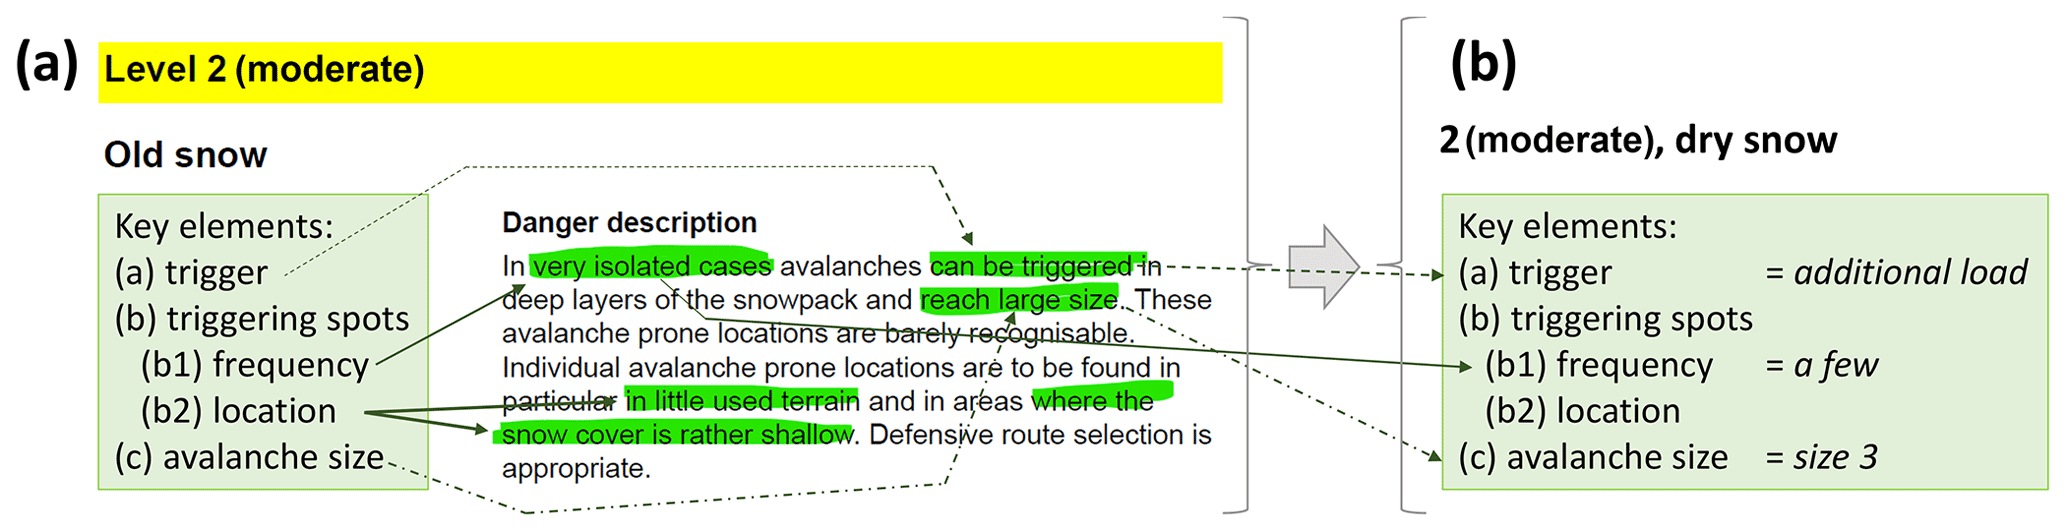
Applying the annotated catalogue of phrases to the actual danger descriptions (Fig. 3 – step 3), we were able to analyze the content of the danger descriptions. Labels were assigned to values according to Tables A2 to A4. For example, as shown in Fig. 4, the values reach large size (= size 3), very isolated cases (= a few), and can be triggered (= additional load) would be used for further analysis. Where a value was not linked to a single class, we randomly selected one of the two most frequent labels rather than removing these cases or always opting for a more unfavorable label so as to retain the ambiguity expressed by forecasters in the analysis. This random assignment was primarily required for values referring to avalanche sizes (Table A3) as some terms were assigned to two size classes. For instance, rather large was linked to avalanche sizes 2 and 3 by seven of the eight forecasters.
We analyzed danger descriptions relating to dry-snow and wet-snow conditions separately. We make this distinction as the danger rating and the accompanying danger description often refers to dry-snow conditions in the Swiss forecast (Sect. 2). In addition, wet-snow avalanches almost always release naturally (e.g., Schweizer et al., 2020), in contrast to dry-snow avalanches, where naturally released and artificially triggering avalanches are of equal concern. The EADS, however, does not make this distinction between dry-snow and wet-snow conditions.
We conducted this part of the analysis in two steps: first, we explored whether information describing each of the key factors was present in the danger descriptions, regardless of their label. Second, we analyzed the frequency that a certain class was mentioned, considering all danger descriptions of a specific data subset (e.g., a specific danger level). To do so, we searched for the most unfavorable piece of information describing a specific key factor within a danger description relying on the rank-order shown in Table 4. To compare two proportions, we relied on a one-sided proportion test (R function prop.test; Newcombe, 1998), testing the hypothesis as to whether the proportion in one subgroup was significantly lower (or higher) than in another subgroup. We always explored the proportions from sequential danger levels (i.e., for 2 (moderate) and 3 (considerable)) in a pairwise fashion. We refer to results as statistically significant if p<0.05 and report p values in three classes: p<0.05, p<0.01, p<0.001. Where the proportion test indicated significant differences for comparisons of consecutive danger level pairs, we report only the highest p value (indicating the lowest significance). The entire analysis was conducted using the software R (R Core Team, 2020).
5.1 Description of dry-snow avalanche conditions
A total of 5274 danger descriptions referred to dry-snow conditions. Of these, avalanche size (68 % of all cases) and the frequency of triggering spots (referred to as frequency, 76 %) were described most of the time, while information on the type of trigger was provided as often as not (53 %). In addition to describing the frequency, 72 % of the danger descriptions specified the location of triggering spots (referred to as location). Text indicating either a frequency or a specific location was indicated in 90 % of the danger descriptions.
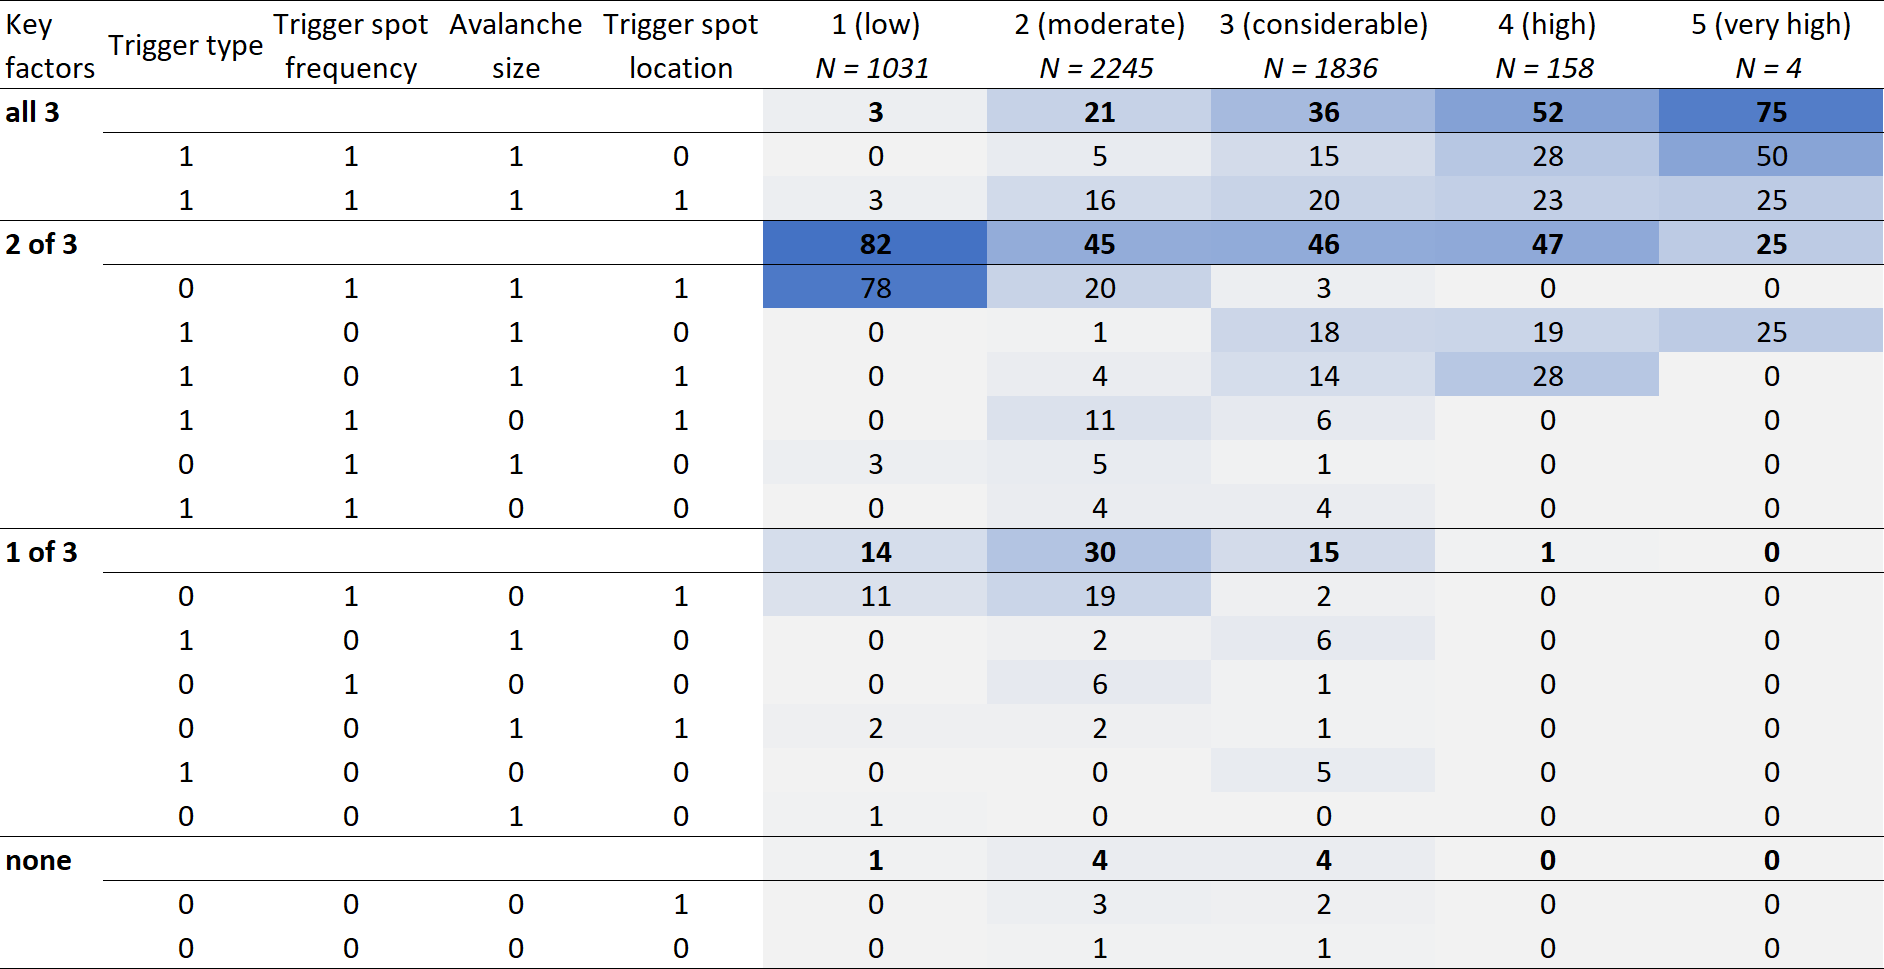
The proportion of danger descriptions providing information on all three elements characterizing avalanche danger decreased consistently from one danger level to the next lowest one (see also uppermost row labeled all 3 factors in Table 5). Differences were significant (p<0.001) for all comparisons, except when comparing 5 (very high) (75 %) and 4 (high) (52 %). The description of 2 (moderate) was the most incomplete in this regard: 34 % of the danger descriptions described only one or none of the three key factors (Table 5, rows labeled 1 of 3 or none).
Table 5Percentage of dry-snow danger descriptions which contained information on the key factors trigger type, frequency of triggering spots, and avalanche size. In addition, the proportion for the location of triggering spots is shown. The figure provides two levels of detail. First, the proportions that information on the three key factors characterizing avalanche danger was given in the danger description (i.e., when two of three factors were described). These proportions are highlighted bold. Second, proportions are shown for each individual combination of factors within these subgroups, with a 1 indicating when a key factor was described and 0 when a key factor was not described (i.e., in the second row, when trigger, frequency, and avalanche size were described (= 1), but not location (= 0)).
In the following, we explore the actual values of the key factors in the danger descriptions for each danger level. The results are summarized in Fig. 5a, c, and e and Table 6.
The proportion of danger descriptions, which indicated a trigger, increased clearly with increasing danger level. A trigger was rarely specified at 1 (low) (3 %), more often at 2 (moderate) (43 %), and most of the time or always at the other danger levels (≥88 %). We labeled the trigger required to release an avalanche as either a natural avalanche or requiring an additional load (Table 4). All the danger descriptions at 4 (high) and 5 (very high) indicated natural avalanches, compared to a proportion of 33 % at 3 (considerable), 2 % at 2 (moderate), and 0.5 % at 1 (low). Overall, the proportion of danger descriptions, which mentioned natural avalanche occurrence increased significantly from one danger level to the next highest for all danger level pairs (p<0.001). In the Swiss forecast, two German terms are used to describe the probability of natural avalanche release: expected or probable (German original: zu erwarten), indicating a high probability, and possible (German original: möglich), indicating a lower probability. For cases, when either of these terms was used, it was generally expected or probable at 4 (high) and 5 (very high) (88 % and 100 %, respectively) and mostly possible at the other danger levels (1 (low): 96 %; 2 (moderate): 90 %; 3 (considerable): 76 %). In contrast, an additional load was comparably rarely indicated at 1 (low) (3 % of the time) and about as often as not at 2 (moderate) (41 %) and 3 (considerable) (55 %). If an additional load was specified, it was mostly described as a low additional load at 3 (considerable) (98 %) and at 2 (moderate) (68 %) and a high additional load for the few cases containing this information at 1 (low) (72 %).
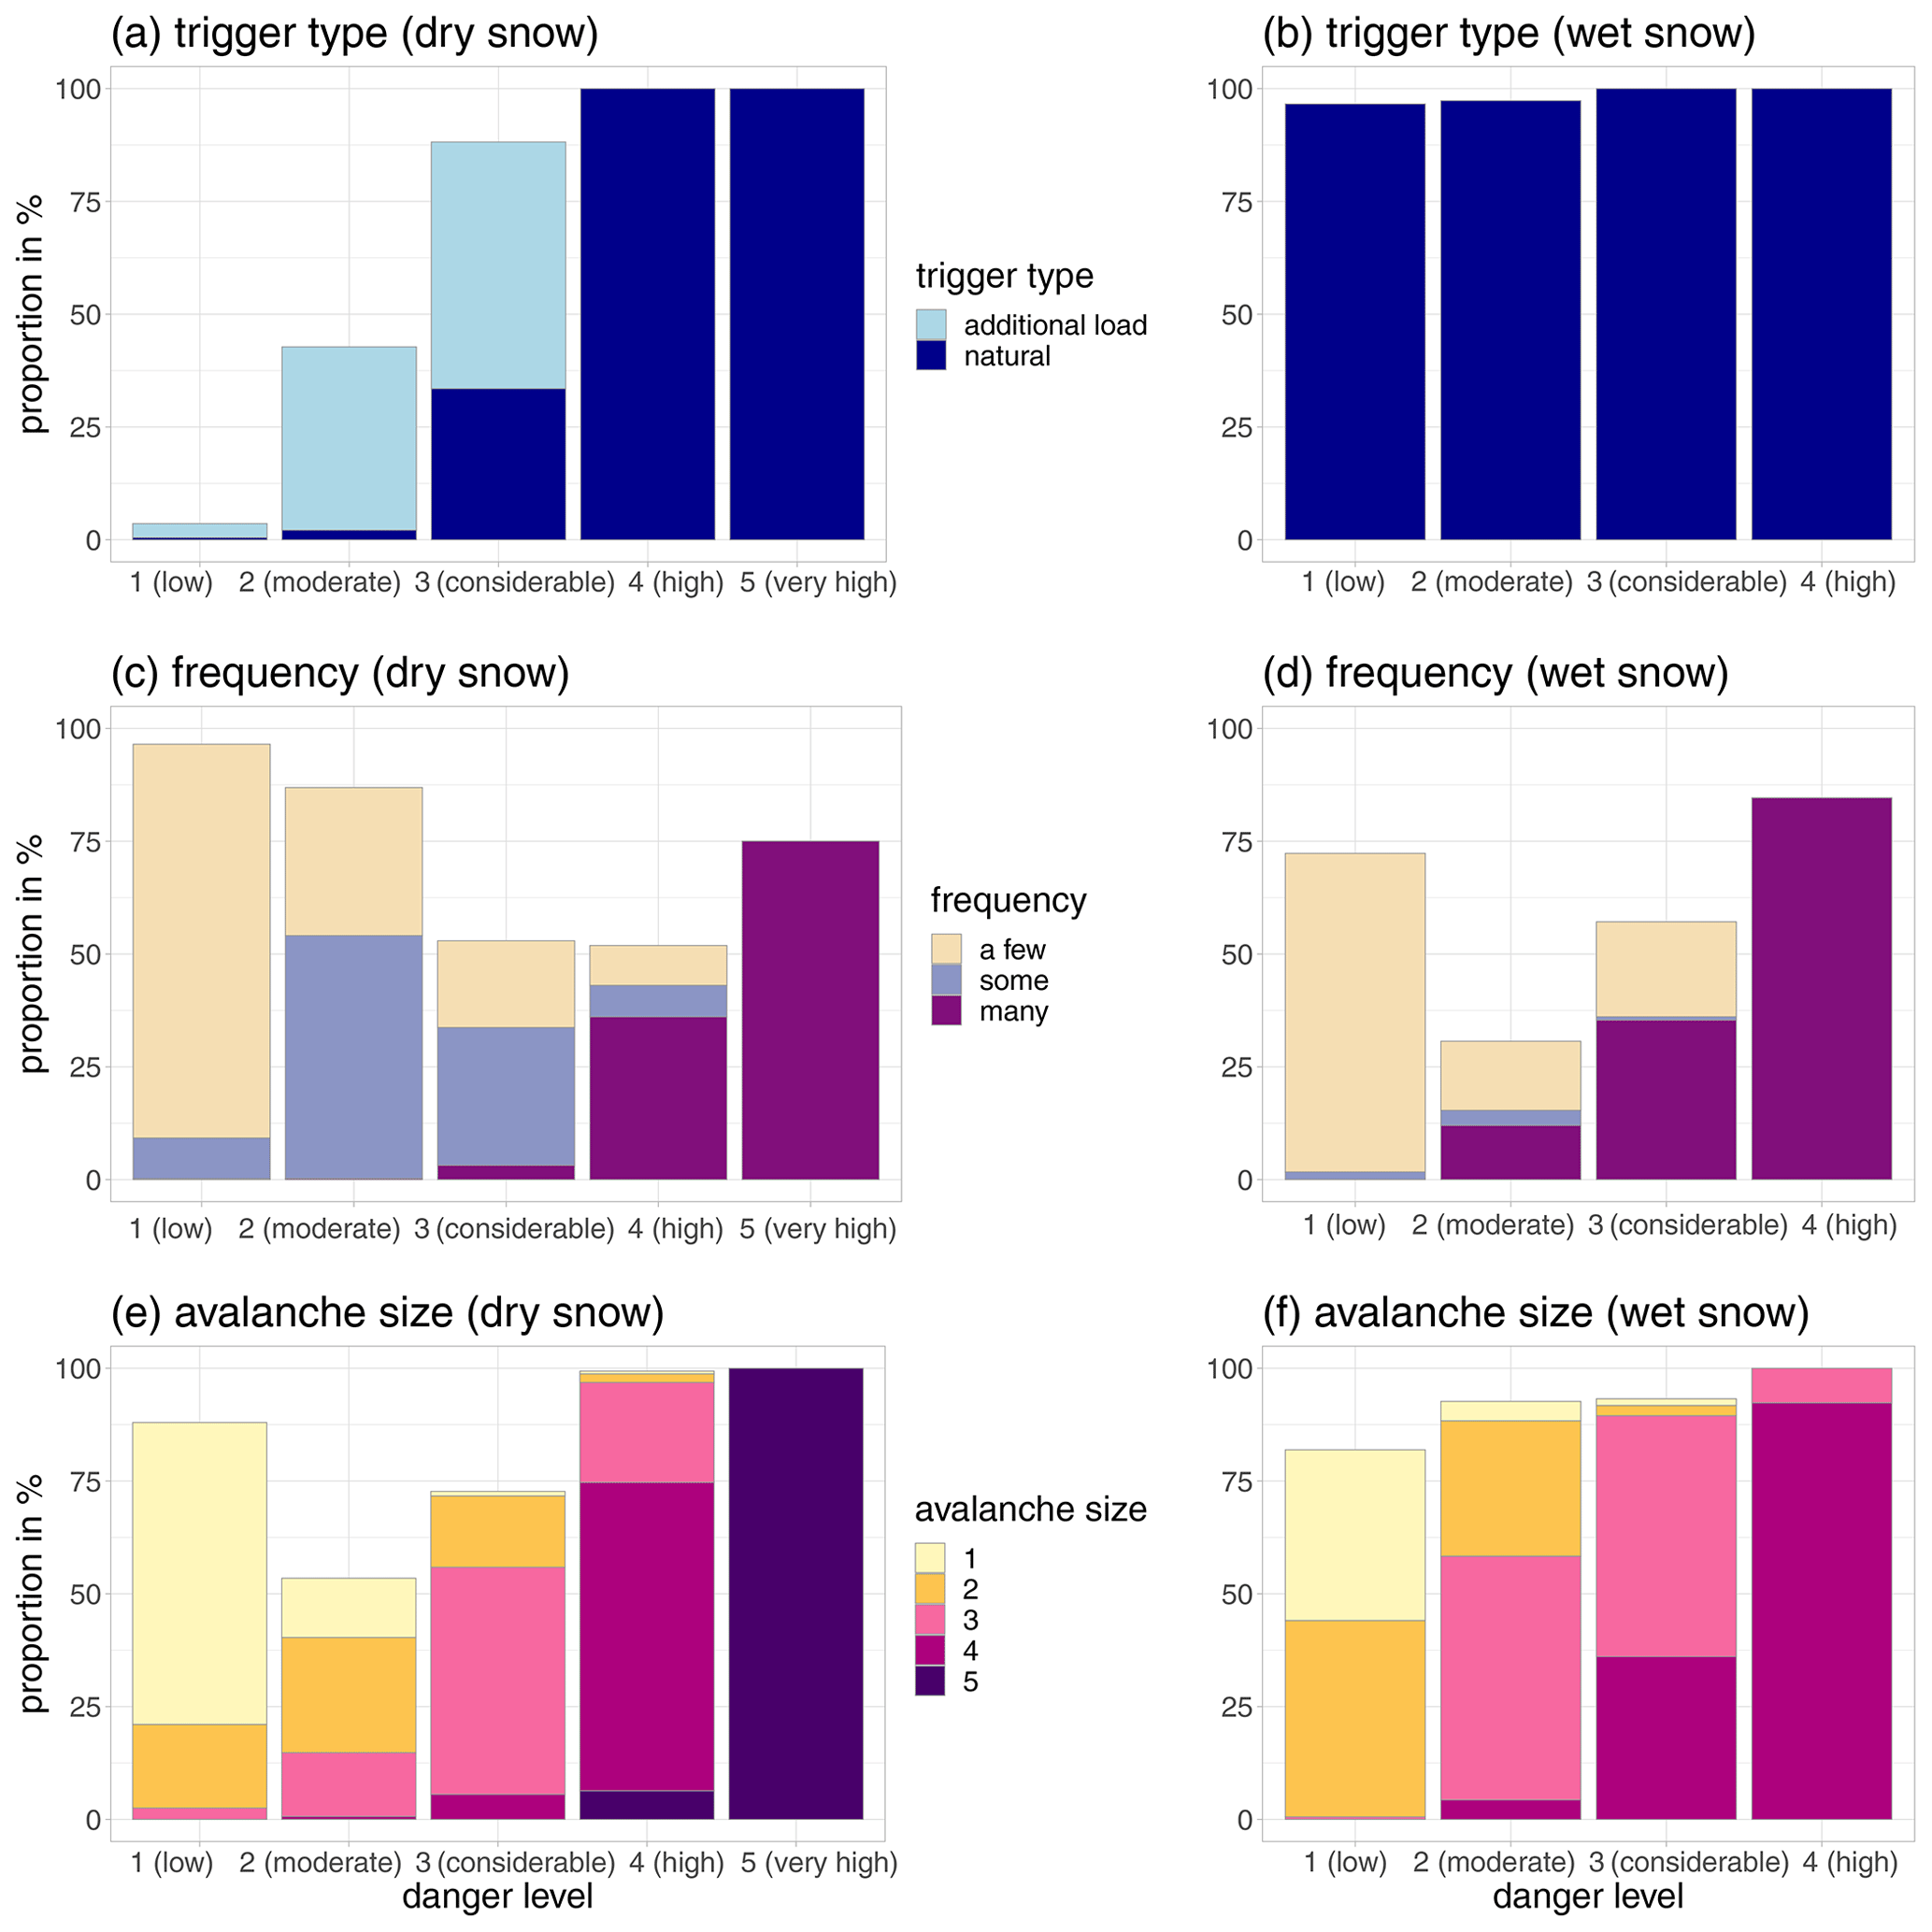
Figure 5Bar plots showing the proportions for the terms characterizing the three key factors by danger level. The left column (a, c, e) shows the distributions for dry-snow conditions and the right column (b, d, f) for wet-snow conditions. The upper row (a, b) shows the trigger, the middle row (c, d) the frequency of triggering spots, and the lower row (e, f) the avalanche size. No data for wet-snow conditions for danger level 5 (very high).
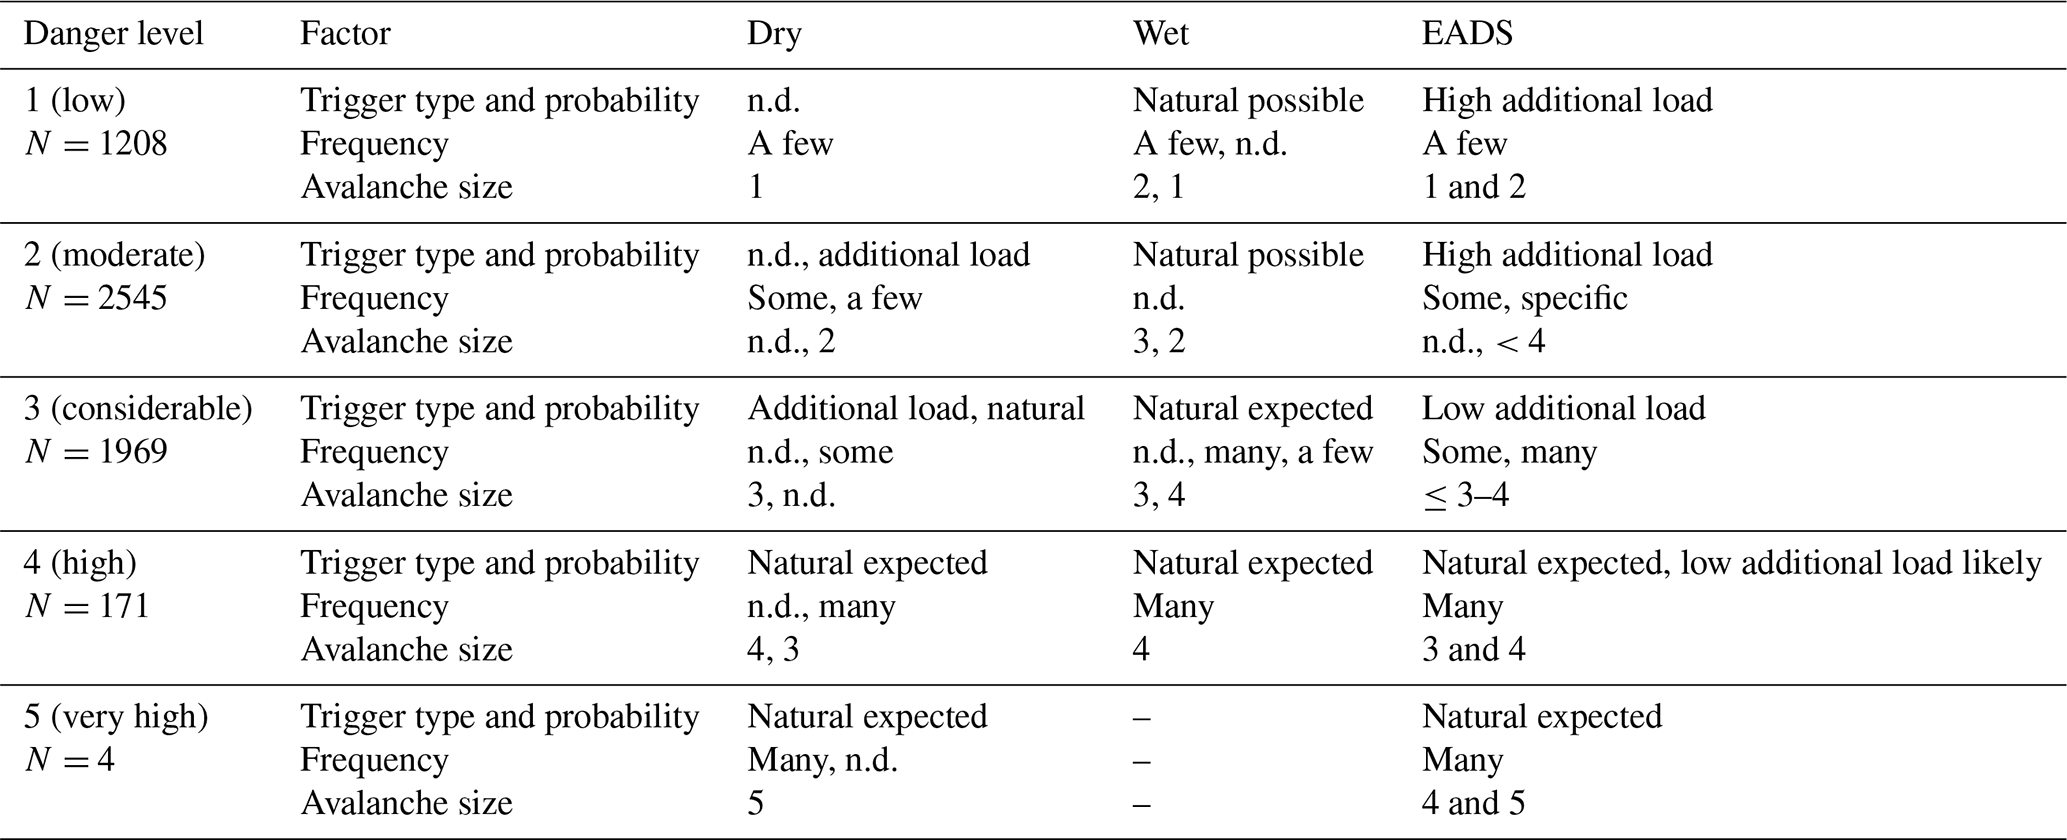
Table 6Description of the contributing factors of avalanche danger for dry-snow and for wet-snow conditions and – as comparison – in the European Avalanche Danger Scale (EADS; extracted from Table 2; EAWS, 2021a). Results from this study are summarized by showing the list of the most frequent terms ordered according to their frequency of occurrence and if more than 20 % of the time. The words in the EADS are translated according to the annotation in Tables A2–A4 and the overview by Müller et al. (2016); n.d. indicates that a key factor was not described in the danger descriptions or the EADS. If n.d. is listed first, this means that this key factor was more often not described compared to the most frequent label which was described; “–”: no data for wet-snow conditions at level 5 (very high).
The frequency of potential triggering spots or of the number of avalanches, classified as either a few, some, or many, was described about half of the time (52 %–53 %) at 3 (considerable) and 4 (high) and more often at the other danger levels (≥75 %). When the frequency was described, it was most often a few at 1 (low), some at 2 (moderate) and 3 (considerable), and many at 4 (high) and 5 (very high). The proportion of danger descriptions which indicated a few locations decreased significantly (p<0.001) from 1 (low) (87 %) to 2 (moderate) (0.33), from 2 (moderate) to 3 (considerable) (19 %), and from 3 (considerable) to 4 (high) (9 %). Similarly, the proportion of forecasts which mentioned many locations increased significantly (p<0.001) from 2 (moderate) (0.3 %) to 3 (considerable) (3 %) and from 3 (considerable) to 4 (high) (36 %).
Beside simply describing the frequency of potential triggering spots, a specific description of where in the terrain these spots were likely to be was provided often at 1 (low) (95 %) and 2 (moderate) (80 %), less often at 3 (considerable) (57 %) and 4 (high) (54 %), and rather seldom at 5 (very high) (25 %). In other words, pointing out specific locations was more often the case at danger levels when the frequency was rather low (a few or some). In most danger descriptions, there was at least an indication of either the frequency or the location of triggering spots (between 75 % at 5 (very high) and 99 % at 1 (low)).
Avalanche size was comparably rarely indicated at 2 (moderate) (53 %). For cases when an avalanche size was indicated, there was a perfect monotonic correlation between the most frequently indicated avalanche size and the danger level, with, for instance, size 1 being most frequently indicated at 1 (low) and size 5 at 5 (very high). As outlined in Sect. 4.3, we opted to randomly assign labels where forecasters had no majority opinion with regard to the classification of textual elements. This was particularly common for some frequently used terms describing avalanche size. This meant that 35 % of the textual elements were therefore randomly assigned to avalanche size 1 or 2 or size 2 or 3. If we had instead consistently assigned the larger of the avalanche sizes, at 1 (low) the proportions of size 2 avalanches would have increased (from 19 % to 33 %) at the cost of size 1 avalanches (67 % to 52 %). A similar, though less pronounced shift in the proportion of size 3 avalanches would be observed at 2 (moderate) (from 14 % to 17 %) and 3 (considerable) (from 50 % to 57 %). However, the correlation between the most frequently indicated avalanche size and the danger level would still be perfectly monotonic.
5.2 Description of wet-snow or gliding avalanche conditions
A total of 623 danger descriptions described wet-snow or gliding avalanches as the primary danger (Fig. 5b, d, and f and Table 6). These were almost always described as natural avalanches (>96 %). The probability terms used to describe the occurrence of natural avalanches were predominantly possible at 1 (low) (94 %) and about as often possible (49 %) or expected (51 %) at 2 (moderate), while at 3 (considerable) and 4 (high) natural avalanches were almost always expected (93 % and 100 %, respectively).
The description of the frequency of expected avalanches showed a bi-modal distribution, with the middle class some rarely being used (5 %). Furthermore, frequency information was missing in 70 % of the cases at 2 (moderate) and 45 % of the time at 3 (considerable). However, as for dry-snow conditions, in these cases an indication of the location of potential release areas was often made in the text. When frequency information was indicated, it was essentially always a few at 1 (low) (98 %) and always many at 4 (high). Considering text information describing the frequency and location of release spots together, the danger descriptions contained at least one piece of information in this regard (between 73 % at 2 (moderate) and 92 % at 1 (low)).
Avalanche size was often indicated (>80 % of the time) and increased from size 1 to 2 at 1 (low) (46 % and 53 %, respectively) to size 2 to 3 at 2 (moderate) (32 % and 58 %, respectively), to size 3 to 4 at 3 (considerable) (57 % and 39 %, respectively), and to size 4 at 4 (high) (92 %).
Our approach aimed to better understand how words and phrases from a structured catalogue are used to convey avalanche danger. In contrast to the relatively small number of other studies which have concerned themselves with the communication of avalanche danger through forecasts (e.g., Burkeljca, 2013; Engeset et al., 2018; St. Clair et al., 2021; Finn, 2020), our starting point was to explore how forecasters interpret (RQ1) and use narrative text to convey avalanche hazard (RQ2). We took advantage of a unique data set to perform our analysis: avalanche forecasts written over eight winter seasons using a structured catalogue in Switzerland. To discuss our results, we introduce here the semiotic triangle (Ogden and Richards, 1925; MacEachren, 2004), a concept commonly used in linguistics and cartography to understand the relationships between a
-
referent, an instance in the real world, in our case a (partially observable) avalanche situation;
-
thought, the mental models used to form a judgment about a situation; and
-
symbols, the words or icons used to describe a referent.
This triangle is helpful as it emphasizes that the process of moving from a referent (the avalanche situation) to a symbol (the avalanche forecast) is influenced by those observing and communicating that situation and that this process is not completely knowable. Perhaps the most important aspect of the semiotic triangle with respect to forecasting is that it makes explicit the obvious, but often forgotten reality that a forecast is an abstraction of a reality understood by individuals and communicated through symbols.
To answer the first research question (how well do forecasters agree on the meaning of terms characterizing triggers required to release avalanches, frequencies of triggering spots, and expected avalanche sizes?), we asked forecasters to assign labels to text values available in the catalogue of phrases to describe these factors. This annotation process was a necessary step in exploring our second research question since we needed these labels to understand how avalanche danger was described by forecasters. However, equally importantly, it gave us insight into the degree to which a trained team of forecasters uses language to describe different characteristics of avalanche danger. Since the task was performed in isolation – that is to say forecasters classified terms independently of a specific avalanche situation – it relates to one side of the semiotic triangle: the relationship between the symbol (the language used to convey a situation using the varied options available in the catalogue of phrases) and thought (the abstraction of an avalanche situation described using a small number of key factor labels). Although the overall agreement in the assigned labels between forecasters was rather high (Fig. A1; κ>0.64), with 50 % of the text symbols being assigned to the same class by all forecasters, it is important to note that these values are based on expert annotation by a team working together on a daily basis.
Zooming in on the individual classifications, it is possible to identify areas for discussion in the forecasting team with regard to three issues. First, the terms used most consistently were those taken directly from definitions. For example, there was 100 % agreement about the use of terms used in the definition of avalanche size classes (e.g., small avalanche for a size 1 avalanche or very large avalanche for a size 4 avalanche). Second, other terms, especially those which hedge, were considered more ambiguous by the forecasters, with for example rather small avalanches being considered by four forecasters to be representative of size class 1 and by four forecasters to be representative of size class 1–2 avalanches. This difference matters since size 1 avalanches are typically not associated with burials, while size 2 may “bury, injure or kill a person” (EAWS, 2021b) and as size 2 avalanches more often lead to burials of recreationalists in Switzerland. Third, we also identified a number of terms present in the structured catalogue which were never used by the forecasters. In general, annotating and assigning words and phrases to particular situations gave valuable insights into the ways in which avalanche forecasters describe avalanche situations and help identify areas where consistency could be improved.
Our second research question asked how the use of language in danger descriptions relates to avalanche danger. The answer to this question provides knowledge as to how forecasters take a referent, in this case the expected evolution of the avalanche situation over the next 24 h, and represents it through language. The annotations of words and phrases used in the avalanche forecast allow us to first characterize how avalanche danger is described and second explore the consistency of descriptions of similar avalanche danger.
The description of the three elements characterizing the danger level – the trigger required to release an avalanche, the frequency of triggering spots, and the expected avalanche size – varied in their degree of completeness. Danger level 2 (moderate) regarding avalanche danger in dry-snow conditions was characterized by all three factors only 21 % of the time, and 30 % of descriptions only mentioned one factor (most often the frequency and location of the likely triggering spots). Since in Switzerland many avalanche accidents happen at this level of forecast avalanche danger (e.g., Winkler et al., 2021), characterizing the likely consequences and triggers of these avalanches more often may be useful in communicating the situation. For danger levels 3 (considerable) and 4 (high), the frequency of triggering spots was missing about half the time.
These distributions of missing information are clearly not random and reflect systematic choices made by forecasters in translating the avalanche danger (referent) to a danger description (symbol) through a thought process unknown to forecast users. It appears that the cases where information is missing are those where values would likely describe the middle ground rather than the extremes. Since this middle ground may in practice be where the interpretation of avalanche forecasts is more difficult for a recreationalist, and given that avalanche danger definitions include all three factors at all levels of avalanche danger, it is important to consider further the likely influence of missing information on users.
Irrespective of whether factors are described in a forecast, it is also important that the factors included are used consistently. In general, we found this to be the case, and the description of the elements characterizing avalanche danger changed significantly from one danger level to the next. As shown in Sect. 5 (Table 6), dry-snow and wet-snow avalanche conditions were described differently: natural avalanches are essentially always mentioned in danger descriptions describing wet-snow or gliding avalanches, regardless of danger level, while in dry-snow conditions they are primarily mentioned at danger level 3 (considerable) or higher. Differences also exist regarding the largest expected avalanche size: these tended to be larger for wet-snow than for dry-snow avalanche conditions. For instance, for cases when avalanche size was described, size 3 avalanches were the most frequently expected avalanche size at 2 (moderate) in wet-snow conditions (55 %) and at 3 (considerable) in dry-snow conditions (50 %). These findings vary from the definitions given by the EADS, which does not distinguish between avalanche sizes expected in dry- or wet-snow conditions. They do, however, correspond well with a study exploring a large data set of avalanche occurrence data in the region of Davos (eastern Swiss Alps), which showed that the largest observed avalanche was larger and that the number of natural avalanches was higher for wet-snow avalanches compared to dry-snow avalanches on days with the same forecast danger level (Schweizer et al., 2020). Although this means that the description of the forecast corresponds to observations, it also highlights an inconsistency in the application of the danger levels allowing more natural avalanches at a larger size in wet-snow conditions than dry-snow conditions. This may also be one explanation for variations in the use of the danger levels in Switzerland compared to, for instance, its neighbors in Italy (Techel et al., 2018).
6.1 Implications for forecasters
The list of German words related to key factors and their association with a set of (categorical) labels (Tables A2 to A4 in the Appendix) provides an opportunity to improve the consistency of the terms used to describe specific conditions by avalanche forecasters in Switzerland. This list of words may also provide a valuable starting point to harmonizing danger descriptions in other parts of the Alps, where the operating language of avalanche forecasters is German. Since hedged phrases seem to reduce consistency between forecasters and thus cannot be correctly interpreted by forecast users, we suggest identifying and discussing the use of these terms in the catalogue of phrases.
Our results showed that information is often lacking with respect to trigger type, frequency of triggering spots, or avalanche size. It is unclear whether this missing information reflects (a) a conscious decision by forecasters to omit information considered redundant, (b) uncertainty by forecasters with respect to these factors at some danger levels, or (c) simply forgetting to provide information about these factors. If information is simply being forgotten, then a more structured approach, such as proposed by the CMAH, would solve the problem. However, providing information for all factors presupposes that this information is reliable and relevant to users. Our results suggest that investigating the reliability and the use of these key factors in forecasts in more detail is urgent before decisions can be made about the most effective format in which to communicate such information.
6.2 Implications for users of the avalanche forecast
The purpose of an avalanche forecast is, in the case of recreationalists, to provide useful information aiding decision-making in planning and carrying out activities. The first requirement for a useful avalanche forecast is therefore that it is correct and consistent. Our results show that in general, the use of language to communicate and specify avalanche danger is (reasonably) consistent between forecasters and correlates with forecast avalanche danger. Here, the semiotic triangle again comes into play as a user interprets the symbols used by a forecaster to create their own mental model of the avalanche conditions.
Our work though explored the use of language from a different perspective – that of expert forecasters. It reveals that forecasters' use of language describing avalanche situations is more consistent using words and phrases which relate directly to definitions and that the characterization of avalanche danger is least complete where the situation is more ambiguous. Leaving out information, for example the likely triggers or size classes of avalanches expected for danger level 2 (moderate), may, for forecasters, actually convey information about the situation. For instance, information on the type of trigger is often missing at lower danger levels. To a forecaster not mentioning natural avalanches may be a clear indication that an additional load is required to release avalanches. However, it is unlikely that users of an avalanche forecast will interpret absence of information in this way. Again, a potential solution to this problem may be a more structured format, such as that used in Norway or in Canada, where important characteristics describing avalanche conditions, including expected avalanche size and whether natural avalanches are expected, are provided in tabular format (Norway) or graphically (Canada). However, such approaches still assume that forecasters are able to classify information about all factors unambiguously.
Our results suggest that communication of non-extreme situations is most subject to ambiguity and lack of information. Since these situations are also where most recreationalists are involved in accidents, exploring how avalanche danger is interpreted and used in decision-making by users is most important here (e.g., St. Clair et al., 2021; Finn, 2020).
6.3 Limitations
We explored danger descriptions from avalanche forecasts published in Switzerland using a structured sentence catalogue, where the operational language used by forecasters was German. Thus, care is required in generalizing our results to forecasts published by other warning services in other languages, even where the same avalanche danger scale is in use. For instance, Techel et al. (2018) noted a different use of danger level 4 (high) in France and parts of Italy, which may indicate that these are interpreted in a slightly different way compared to forecasts issued in Switzerland or Austria.
Words and phrases were annotated by the forecasting team, who always work in pairs and thus are very familiar with both the structured sentence catalogue and the avalanche situation in Switzerland. Our inter-annotator agreement is therefore likely higher than for avalanche warning services where forecasters work alone or where free text is used to write forecasts. Furthermore, situations with avalanche danger levels of 4 (high) and 5 (very high) were much rarer (N=158, N=4, respectively) than the large number of danger descriptions for danger levels 1 (low) to 3 (considerable).
The annotation was performed at the level of the entire set of phrases, not the list of phrases actually used in the forecasts. Thus, our approach does not distinguish whether a phrase not being used is simply due to it being typical for a rare situation (for instance describing danger level 5 (very high)) or because forecasters are not in full agreement using this phrase as suggested in the EADS (for instance a single mountain climber representing a high additional load).
Finally, the structured sentence catalogue was not completely static over time (Hutter, 2020). Although we took account of changes to the available words and phrases, these changes (and changes to the various definitions used for, for example, avalanche size; Table A6; EAWS, 2021b) are likely to have influenced the interpretations made by the avalanche forecasting team in their annotation and the use of language in forecast.
We analyzed the text describing the expected avalanche conditions in almost 6000 danger descriptions, written relying on a catalogue of phrases, published in the public avalanche forecast in Switzerland. We focused specifically on three factors described in the textual danger description – the type of trigger required to release an avalanche, the frequency of potential triggering spots, and the expected largest avalanche size – and their relation with the issued danger level. To conduct this analysis, the Swiss avalanche forecasters assigned categories to individual terms used in the danger description. Although the agreement in the labeling was rather high – 50 % of the terms were assigned to the same class by all eight annotators – not all terms could be assigned to a specific class by some forecasters.
When we linked the factors used in danger descriptions to avalanche danger we found that, especially for avalanche danger level 2 (moderate), only 21 % of descriptions used all three factors, and 30 % of descriptions mentioned only a single factor. Furthermore, avalanche size classes are used differently to describe dry-snow and wet-snow or gliding avalanche conditions. The results highlight the demand to review and harmonize the use of terms to describe the trigger required to release an avalanche, the frequency of potential triggering spots, and the expected largest avalanche size and their relation to the danger level. Since our approach is data-driven, it provides very clear pointers as to terms which are used inconsistently or not at all by forecasters and thus gives a valuable framework for forecasting services in reviewing the quality and consistency of written forecasts. However, we focused exclusively on the perspective of Swiss forecasters working in German. Our results cannot be directly transferred to other forecasting services and languages, and the analysis was greatly simplified by use of the sentence catalogue used to write Swiss avalanche danger descriptions.
Future work should also explore the perspective of the user of the avalanche forecast. Are danger descriptions the best possible way to communicate important pieces of information including avalanche size or the occurrence of natural avalanches? Do users interpret this information in similar ways to forecasters?
In the following, we first provide a short version of the annotation rules (Table A1).
Tables A2 to A5 list the German words and their English translation for the three key factors and their labels. These may be used as a guidance for the interpretation of the labels used in the Swiss avalanche forecasts. The proportions shown in brackets indicate how often a German word was assigned to a label. For instance, for maintaining distances between individuals (German original: Entlastungsabstände) (0.75) (Table A2), six of the eight forecasters considered this to mean a low additional load. Note that the proportions shown in the English column are indications only as many-to-one and one-to-many translations were possible (i.e., two English translations for one German word, as for spontan (German) and English spontaneous or occur naturally).
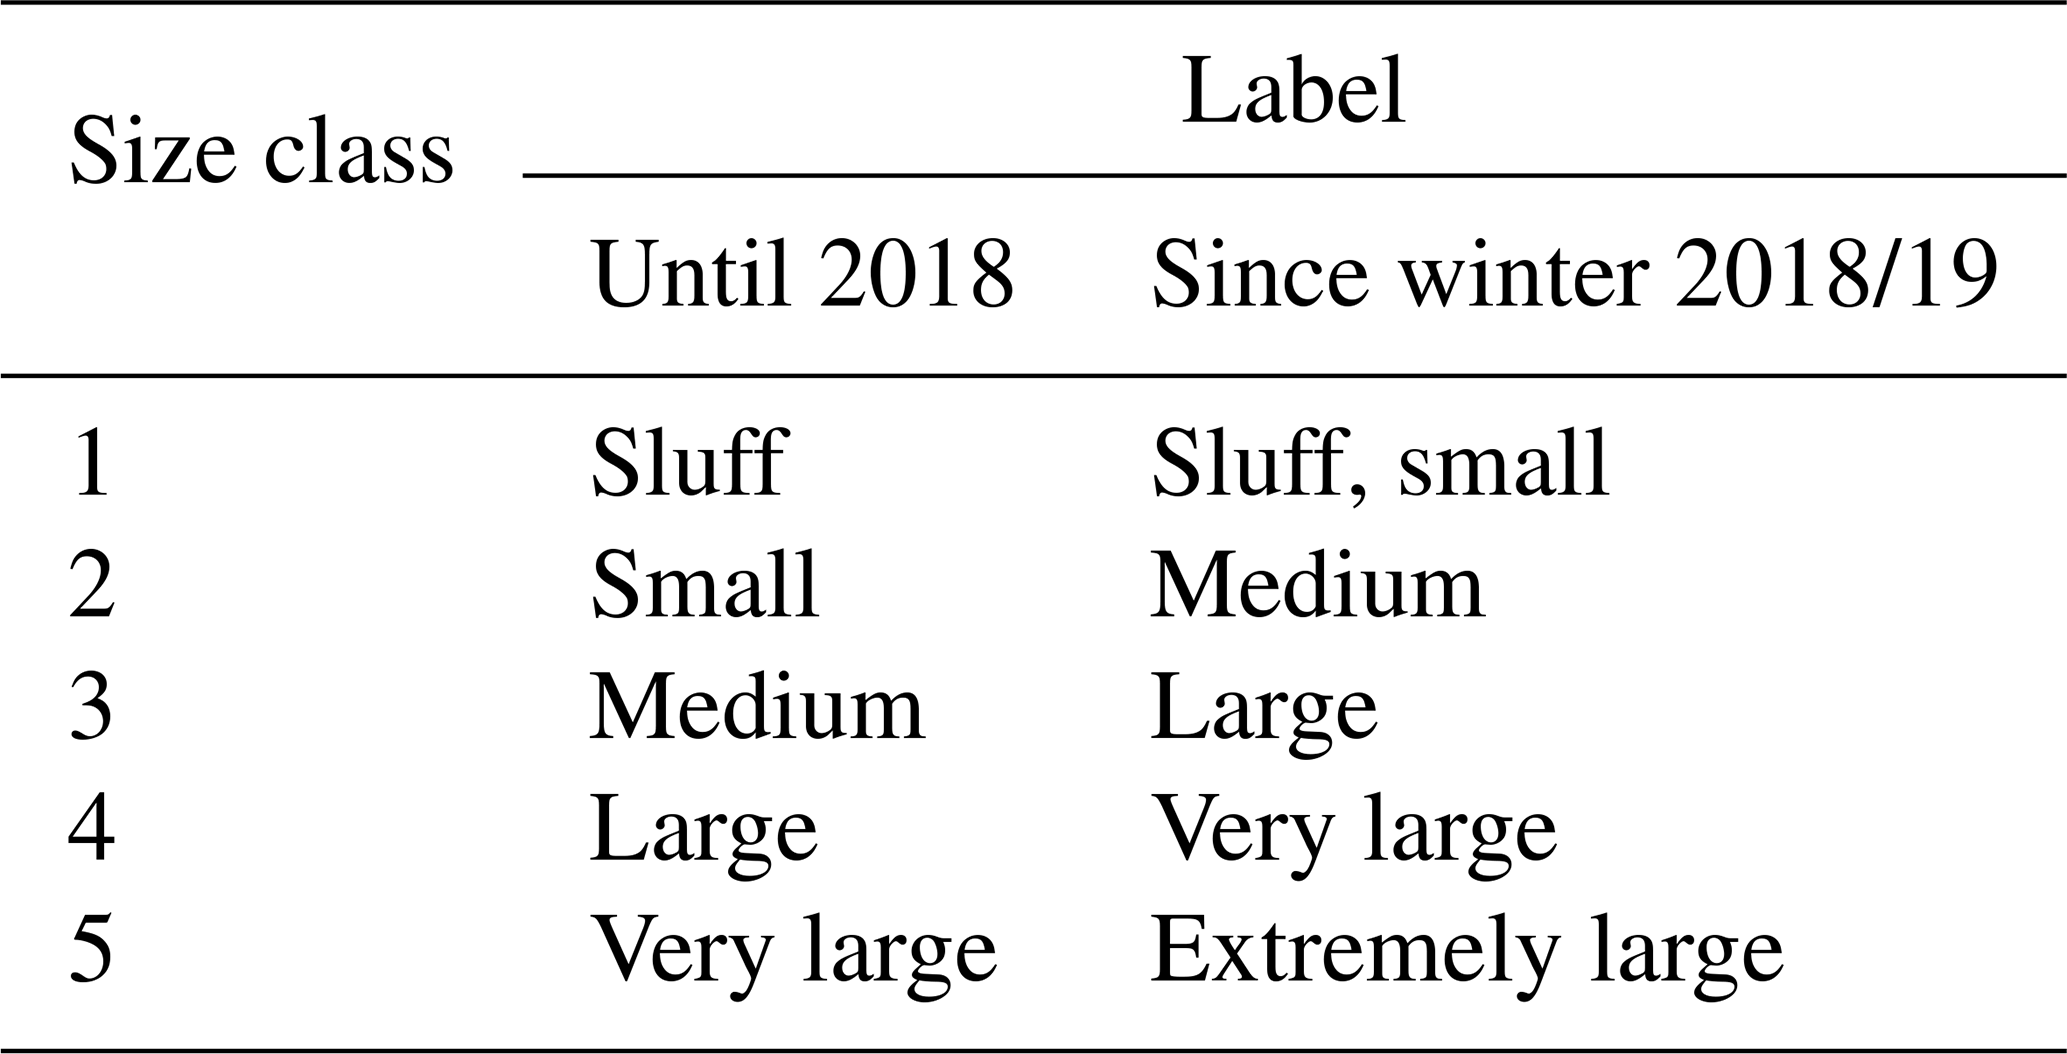
Finally, Table A6 shows the labels for the avalanche size classification prior to their renaming in 2019.
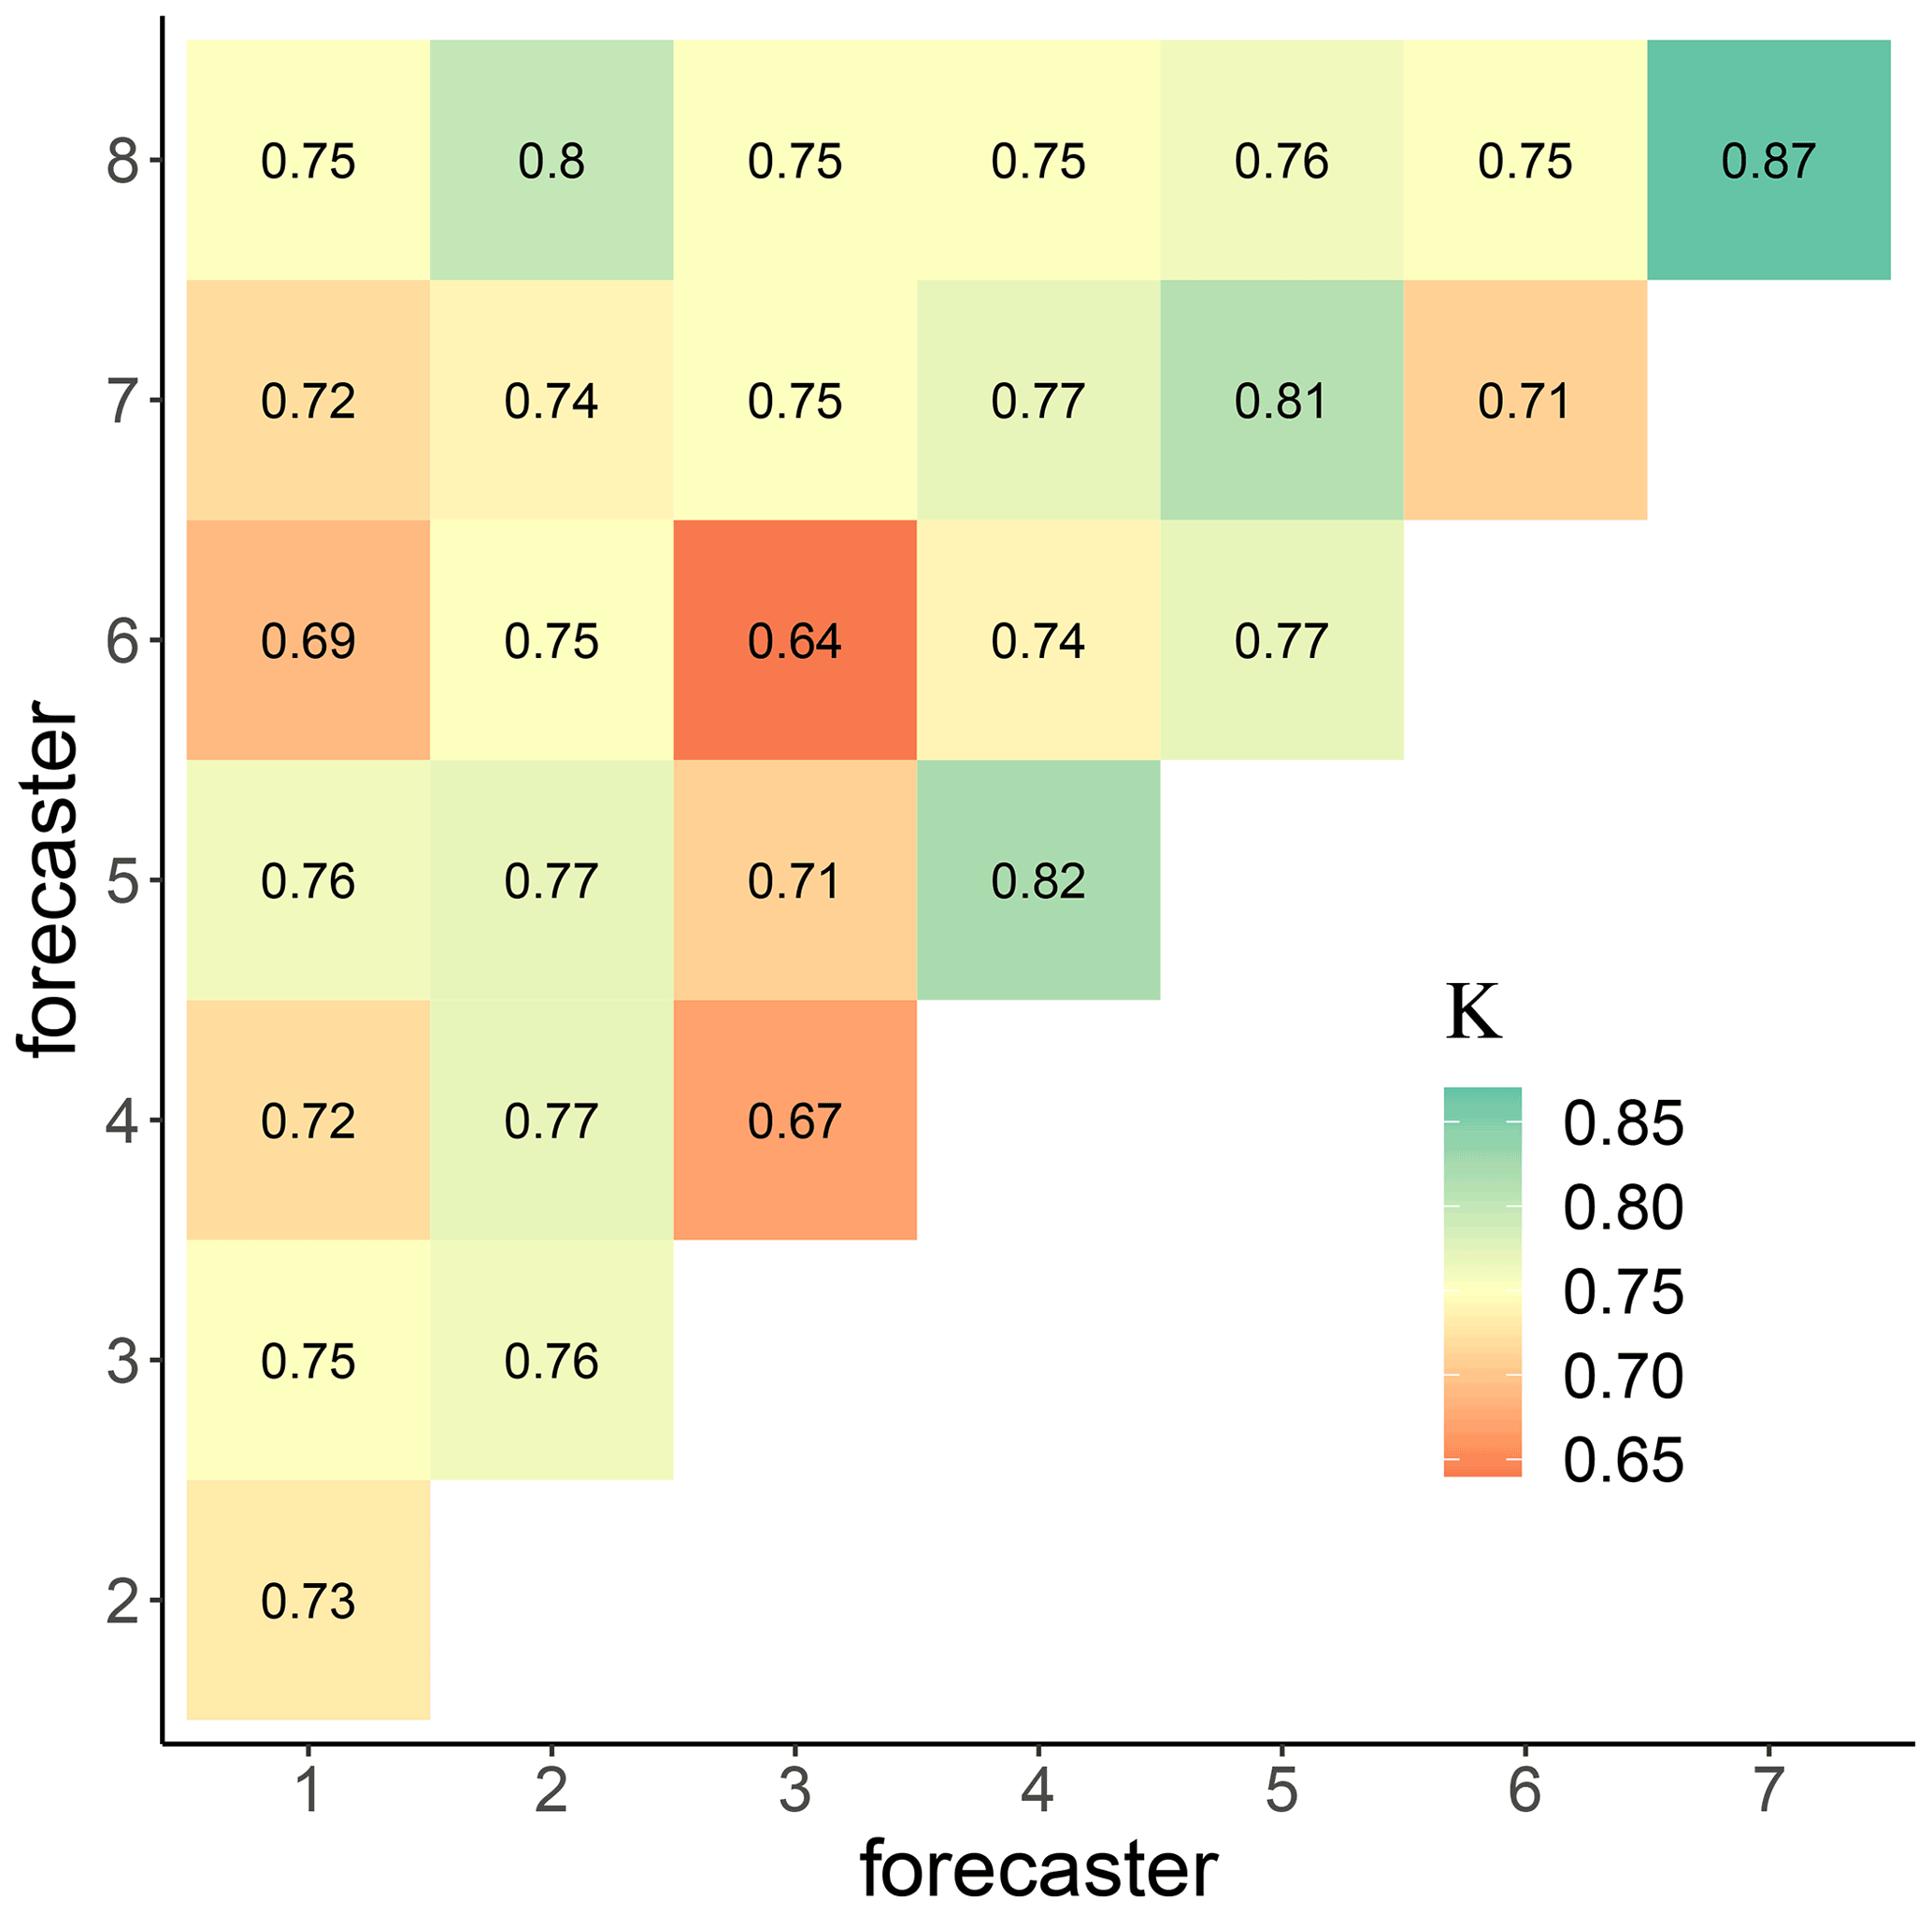
Figure A1Kappa scores for the eight forecasters (f1–f8); κ>0.6 is considered substantial, κ>0.8 almost perfect (Landis and Koch, 1977).
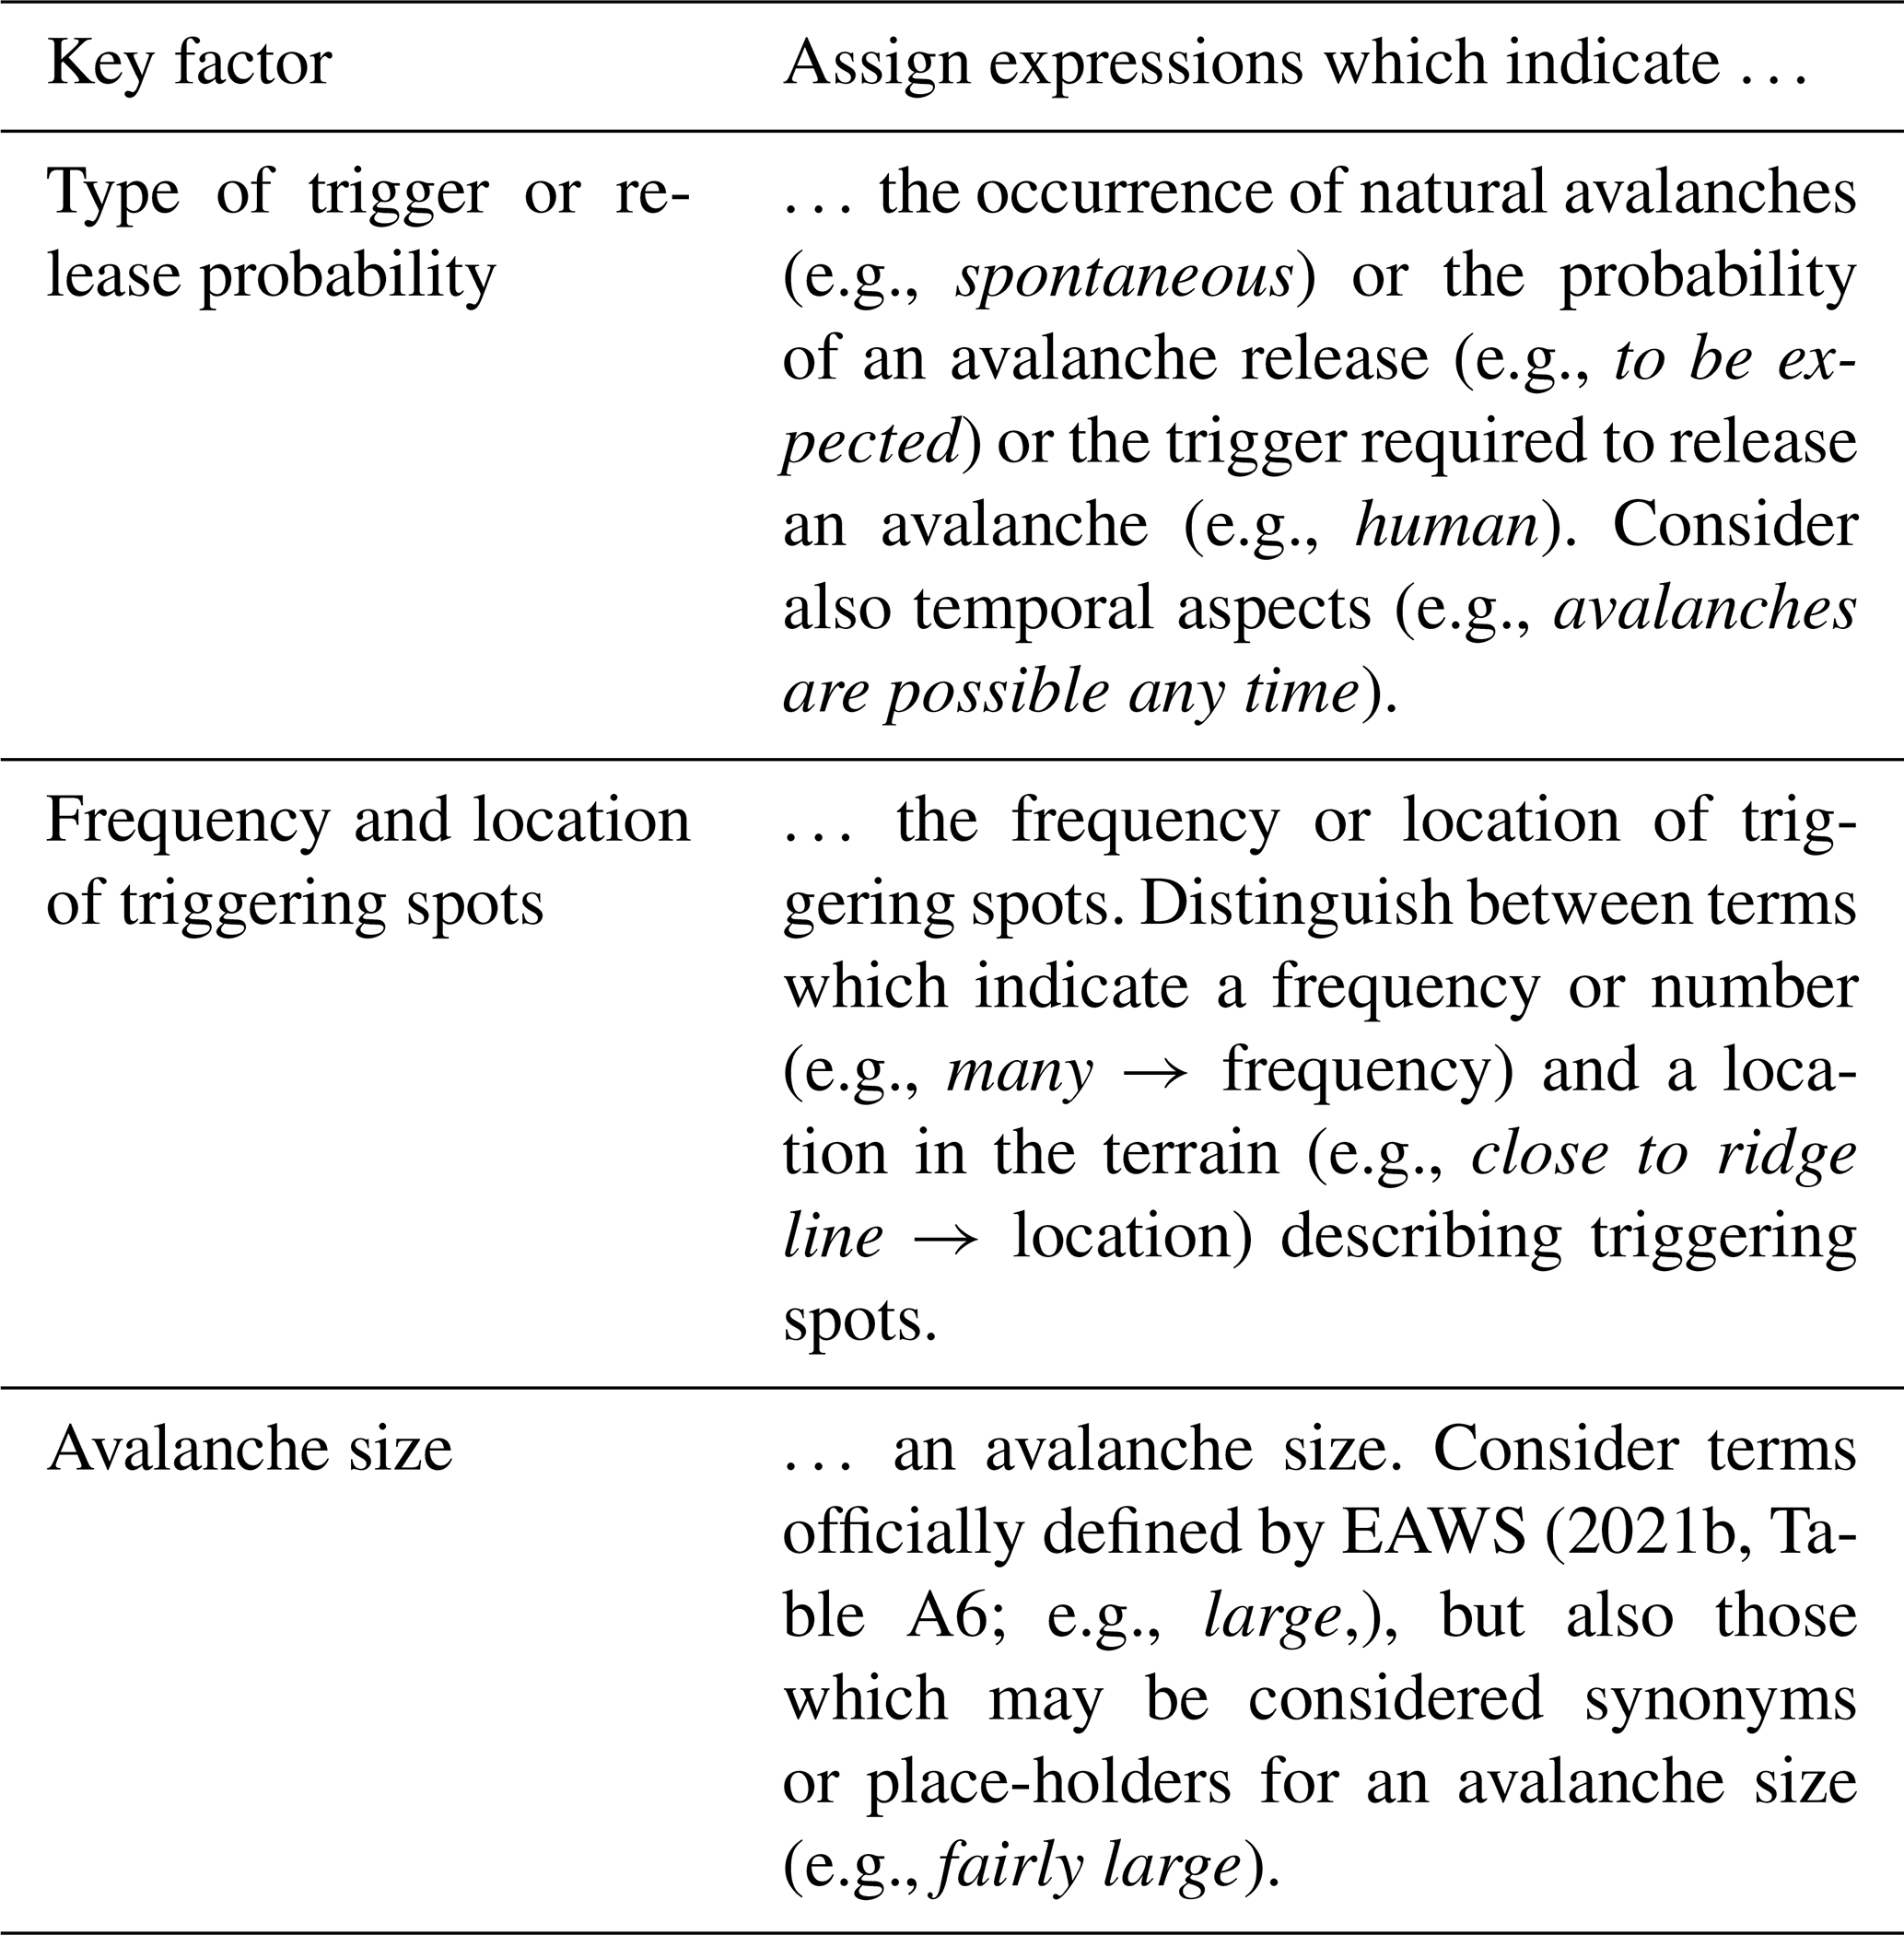
Table A2Labels assigned to German text values describing the type of trigger (or load) to release an avalanche, including the proportion of forecasters who assigned the respective label–sub-label combination to this value (in brackets) and their corresponding English translations. Note that the proportions shown in the English column are indications only as many-to-one and one-to-many translations were possible (i.e., one English translation for two German words or vice versa). Bold – value was used during the 8 years.
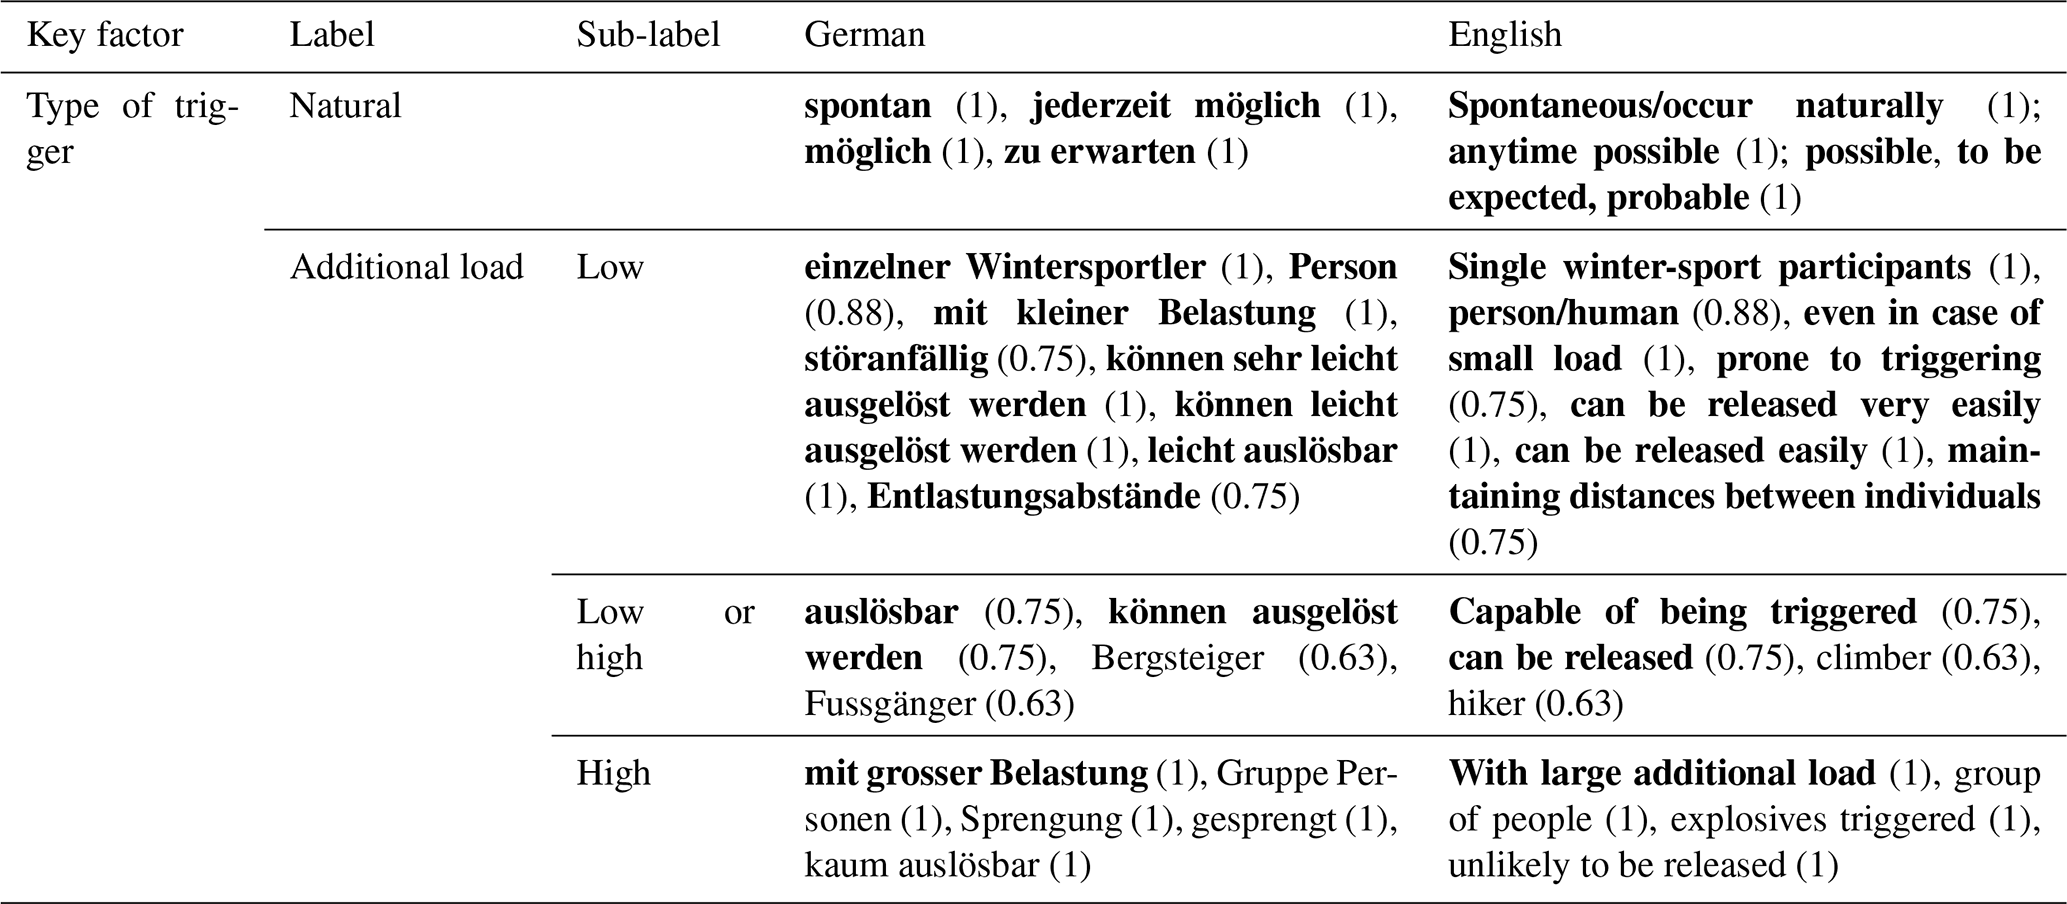
Table A3Labels assigned to German text values describing the frequency of potential triggering spots or the number of avalanches, including the proportion of forecasters who assigned the respective label to this value (in brackets) and their corresponding English translations. Note that the proportions shown in the English column are indications only as many-to-one and one-to-many translations were possible (i.e., one English translation for two German words or vice versa). Bold – value was used during the 8 years.

Table A4Labels assigned to German text values describing avalanche size, including the proportion of forecasters who assigned the respective label to this value (in brackets) and their corresponding English translations. Not shown are values describing avalanche size, which could not be assigned to a label (step 1, Sect. 4.1). Note that the proportions shown in the English column are indications only as many-to-one and one-to-many translations were possible (i.e., one English translation for two German words or vice versa). Bold - value was used during the 8 years.

Table A5Text values providing location-specific information. Numerous combinations and variants exist. Not shown are values describing aspect and elevation as these are normally shown in the aspect–elevation plot (Fig. 1b) and values which were not used in the analyzed forecasts. This list should therefore be seen as an example rather than an exhaustive list.

Data will be made available at the data repository of the Swiss Federal Institute for Forest Snow and Landscape Research (WSL; https://doi.org/10.16904/envidat.266; Techel, 2021).
The supplement related to this article is available online at: https://doi.org/10.5194/nhess-21-3879-2021-supplement.
This contribution is based on the MSc thesis by VH (Hutter, 2020). VH developed the study design and performed the annotation of the values and the initial analysis. FT and RSP supervised the MSc thesis. For the purpose of this paper, FT re-analyzed a subset of the data used in the MSc thesis and conducted the survey of the avalanche forecasters. FT and RSP wrote the manuscript, and VH provided repeated feedback on the manuscript.
The contact author has declared that neither they nor their co-authors have any competing interests.
Publisher's note: Copernicus Publications remains neutral with regard to jurisdictional claims in published maps and institutional affiliations.
We thank Kurt Winkler for providing a detailed overview of the catalogue of phrases and Marc Ruesch for his support with the extraction of the textual descriptions from the database. We thank Benjamin Zweifel, Célia Lucas, Christine Pielmeier, Jürg Trachsel, Kurt Winkler, Lukas Dürr, and Thomas Stucki – avalanche forecasters at the national avalanche warning service at the WSL Institute for Snow and Avalanche Research (SLF) in Switzerland – for their annotations. We thank Christoph Mitterer (avalanche warning service Tyrol, Austria) and Thomas Feistl (avalanche warning service Bavaria, Germany) for providing feedback regarding the structure and content of their forecast products (Table 1). We also thank the two anonymous reviewers and the editor Pascal Haegeli for providing constructive feedback, which helped us to improve this paper.
This paper was edited by Pascal Haegeli and reviewed by two anonymous referees.
Brabec, B. and Stucki, T.: Verification of avalanche bulletins by questionnaires, in: Proceedings 25 Years of Snow Avalanche Research at NGI, Norges Geotekniske Institutt NGI, 12–16 May 1998, Voss, Norway, edited by: Hestnes, E., NGI publication, 203, 79–83, 1998. a
Burkeljca, J.: Shifting audience and the visual language of avalanche risk communication, in: Proceedings ISSW 2013, International Snow Science Workshop, 7–11 October 2013, Grenoble – Chamonix Mont-Blanc, 2013. a, b
Clark, T.: Exploring the link between the Conceptual Model of Avalanche Hazard and the North American Public Avalanche Danger Scale, Master's thesis, Simon Fraser University, Vancoucer, Canada, 115 pp., 2019. a, b
EAWS: Memorandum of understanding for the European Avalanche Warning Services (EAWS), memorandum, European Avalanche Warning Services EAWS, available at: https://www.avalanches.org/about/memorandum-of-understanding/ (last access: 22 December 2021), 2017. a
EAWS: Definition of avalanche danger, avalanche danger level and their contributing factors; presented at EAWS General Assembly, Davos, Switzerland, 2021, EAWS working group Matrix and Scale, working group members: Müller, K., Bellido, G., Bertrando, L., Feistl, T., Mitterer, C., Palmgren, P., Sofia, S., and Techel, F., presented at: EAWS General Assembly, Davos, Switzerland, June 2021, 2021a. a
EAWS: Standards: avalanche size, European Avalanche Warning Services (EAWS), available at: https://www.avalanches.org/standards/avalanche-size/ (last access: 17 November 2021), 2021b. a, b, c, d, e, f
EAWS: Standards: European Avalanche Danger Scale (2018/19), https://www.avalanches.org/standards/avalanche-danger-scale/ (last access: 17 November 2021), 2021a. a, b, c, d, e, f
EAWS: Standards: Avalanche problems, available at: https://www.avalanches.org/standards/avalanche-problems/ (last access: 17 November 2021), 2021b. a, b
EAWS: Standards: Information pyramid, available at: https://www.avalanches.org/standards/information-pyramid/ (last access: 17 November 2021), 2021c. a
Ebert, P. A. and Milne, P.: Methodological and conceptual challenges in rare and severe event forecast-verification, Nat. Hazards Earth Syst. Sci. Discuss. [preprint], https://doi.org/10.5194/nhess-2021-215, in review, 2021. a
Elder, K. and Armstrong, B.: A quantitative approach for verifying avalanche hazard ratings, in: Symposium at Davos 1986 on Avalanche Formation, Movement and Effects, vol. 162 of International Association of Hydrological Sciences Publication, 593–603, 1987. a
Engeset, R. V., Pfuhl, G., Landrø, M., Mannberg, A., and Hetland, A.: Communicating public avalanche warnings – what works?, Nat. Hazards Earth Syst. Sci., 18, 2537–2559, https://doi.org/10.5194/nhess-18-2537-2018, 2018. a, b, c, d, e
Finn, H.: Examining risk literacy in a complex decision-making environment: A study of public avalanche bulletins, Master's thesis, School of Resource and Environmental Management. Simon Fraser University, Burnaby, B.C., m.R.M. research project no. 745, 2020-04, 2020. a, b, c
Giraud, G., Lafeuille, J., and Pahaut, E.: Evaluation de la qualité de la prévision du risque d'avalanche, Int. Ass. Hydrol. Sci. Publ., 162, 583–591, 1987. a
Gordon, N. and Shaykewich, J.: Guidelines of performance assessment of public weather services, World Meteorological Organization, Geneva, Switzerland, available at: https://library.wmo.int/index.php?lvl=notice_display&id=11898#.YcHrS1kxlZc (last access: 21 December 2021), WMO/TD No. 1023, 2000. a
Hutter, V.: The link between danger level and danger description in Swiss snow avalanche forecasts, Master's thesis, Fakultät für Forstwissenschaften und Ressourcenmanagement, Technische Universität München, Deutschland, 82 pp., 2020. a, b, c
Kuhn, T.: A survey and classification of controlled natural languages, Computational Linguistics, 40, 121–170, https://doi.org/10.1162/COLI_a_00168, 2014. a, b
Landis, J. R. and Koch, G. G.: The measurement of observer agreement for categorical data, Biometrics, 33, 159–174, https://doi.org/10.2307/2529310, 1977. a, b, c, d
Lazar, B., Trautmann, S., Cooperstein, M., Greene, E., and Birkeland, K.: North American avalanche danger scale: Do backcountry forecasters apply it consistently?, in: Proceedings ISSW 2016. International Snow Science Workshop, 2–7 October 2016, Breckenridge, Co., 457–465, 2016. a
LWD Steiermark: Ergebnisse der Online-Umfrage des LWD Steiermark 2015, Lawinenwarndienst Steiermark, Graz, 2015. a
MacEachren, A. M.: How maps work: representation, visualization, and design, Guilford Press, New York, 2004. a
Moner, I., Orgué, S., Gavaldà, J., and Bacardit, M.: How big is big: results of the avalanche size classification survey, in: Proceedings ISSW 2013. International Snow Science Workshop, 7–11 October 2013, Grenoble – Chamonix Mont-Blanc, France, 2013. a
Müller, K., Mitterer, C., Engeset, R., Ekker, R., and Kosberg, S.: Combining the conceptual model of avalanche hazard with the Bavarian matrix, in: Proceedings ISSW 2016, International Snow Science Workshop, 2–7 October 2016, Breckenridge, Co., USA, 472–479, 2016. a
Murphy, A. H.: What is a good forecast? An essay on the nature of goodness in weather forecasting, Weather Forecast., 8, 281–293, https://doi.org/10.1175/1520-0434(1993)008<0281:WIAGFA>2.0.CO;2, 1993. a
Newcombe, R. G.: Interval estimation for the difference between independent proportions: comparison of eleven methods, Stat. Med., 8, 873–890, https://doi.org/10.1002/(sici)1097-0258(19980430)17:8<873::aid-sim779>3.0.co;2-i, 1998. a
Ogden, C. K. and Richards, I. A.: The Meaning of Meaning: A Study of the Influence of Language upon Thought and of the Science of Symbolism, vol. 29, Harcourt, Brace, 1925. a
Pustejovsky, J. and Stubbs, A.: Natural Language Annotation for Machine Learning: A guide to corpus building for applications, O'Reilly Media, Sebastopol, CA, 2013. a, b, c
R Core Team: R: A Language and Environment for Statistical Computing, R Foundation for Statistical Computing, Vienna, Austria, available at: https://www.R-project.org/ (last access: 1 July 2020), 2020. a
Schweizer, J., Mitterer, C., Techel, F., Stoffel, A., and Reuter, B.: On the relation between avalanche occurrence and avalanche danger level, The Cryosphere, 14, 737–750, https://doi.org/10.5194/tc-14-737-2020, 2020. a, b, c
SLF: Avalanche bulletin interpretation guide, WSL Institute for Snow and Avalanche Research SLF, available at: http://www.slf.ch/lawineninfo/zusatzinfos/interpretationshilfe/interpretationshilfe_e.pdf (last access: 20 October 2018), edition December 2017, 53 pp., 2017. a
SLF: Avalanche bulletin interpretation guide, WSL Institute for Snow and Avalanche Research SLF, available at: https://www.slf.ch/files/user_upload/SLF/Lawinenbulletin_Schneesituation/Wissen_zum_Lawinenbulletin/Interpretationshilfe/Interpretationshilfe_EN.pdf (last access: 15 September 2020), edition December 2019, 52 pp., 2019. a
SLF: Avalanche bulletin interpretation guide, WSL Institute for Snow and Avalanche Research SLF, available at: http://www.slf.ch/lawineninfo/zusatzinfos/interpretationshilfe/interpretationshilfe_e.pdf (last access: 1 November 2021), edition December 2020, 53 pp., 2020. a, b
St. Clair, A., Finn, H., and Hageli, P.: Where the rubber of the RISP model meets the road: Contextualizing risk information seeking and processing with an avalanche bulletin user typology, Int. J. Dis. Risk Red., 66, 102626, https://doi.org/10.1016/j.ijdrr.2021.102626, 2021. a, b, c
Statham, G., Haegeli, P., Greene, E., Birkeland, K., Israelson, C., Tremper, B., Stethem, C., McMahon, B., White, B., and Kelly, J.: A conceptual model of avalanche hazard, Nat. Hazards, 90, 663–691, https://doi.org/10.1007/s11069-017-3070-5, 2018a. a
Statham, G., Holeczi, S., and Shandro, B.: Consistency and accuracy of public avalanche forecasts in Western Canada, in: Proceedings ISSW 2018, International Snow Science Workshop, 7–12 October 2018, Innsbruck, Austria, 1491–1496, 2018b. a
Techel, F.: How is avalanche danger described in textual descriptions in avalanche forecasts in Switzerland?, EnviDat [data set], https://doi.org/10.16904/envidat.266, 2021. a
Techel, F. and Schweizer, J.: On using local avalanche danger level estimates for regional forecast verification, Cold Reg. Sci. Technol., 144, 52–62, https://doi.org/10.1016/j.coldregions.2017.07.012, 2017. a
Techel, F., Mitterer, C., Ceaglio, E., Coléou, C., Morin, S., Rastelli, F., and Purves, R. S.: Spatial consistency and bias in avalanche forecasts – a case study in the European Alps, Nat. Hazards Earth Syst. Sci., 18, 2697–2716, https://doi.org/10.5194/nhess-18-2697-2018, 2018. a, b, c, d
Thumlert, S., Statham, G., and Jamieson, B.: The likelihood scale in avalanche forecasting, The Avalanche Review, 38, 31–33, 2020. a
Williams, K.: Credibility of avalanche warnings, J. Glaciol., 26, 93–96, https://doi.org/10.1017/S0022143000010625, 1980. a
Winkler, K. and Kuhn, T.: Fully automatic multi-language translation with a catalogue of phrases – successful employment for the Swiss avalanche bulletin, Lang. Resour. Eval., 51, 13–35, https://doi.org/10.1007/s10579-015-9316-5, 2017. a, b, c
Winkler, K. and Techel, F.: Users rating of the Swiss avalanche forecast, in: Proceedings ISSW 2014, International Snow Science Workshop, 29 September–3 October 2014, Banff, Canada, 437–444, 2014. a
Winkler, K., Bächtold, M., Gallorini, S., Niederer, U., Stucki, T., Pielmeier, C., Darms, G., Dürr, L., Techel, F., and Zweifel, B.: Swiss avalanche bulletin: automated translation with a catalogue of phrases, in: Proceedings ISSW 2013, International Snow Science Workshop, 7–11 October 2013, Grenoble – Chamonix Mont-Blanc, France, 437–441, 2013. a
Winkler, K., Schmudlach, G., Degraeuwe, B., and Techel, F.: On the correlation between the forecast avalanche danger and avalanche risk taken by backcountry skiers in Switzerland, Cold Reg. Science Technol., 188, 103299, https://doi.org/10.1016/j.coldregions.2021.103299, 2021. a