the Creative Commons Attribution 4.0 License.
the Creative Commons Attribution 4.0 License.
 | 22 Nov 2021
Modeling of a compound flood induced by the levee breach at Qianbujing Creek, Shanghai, during Typhoon Fitow
Yuhan Yang
Jie Yin
Weiguo Zhang
Yan Zhang
Yi Lu
Yufan Liu
Aoyue Xiao
Yunxiao Wang
Wenming Song
Levee-breach-induced flooding occurs occasionally but always causes considerable losses. A serious flood event occurred due to the collapse of a 15 m long levee section in Qianbujing Creek, Shanghai, China, during Typhoon Fitow in October 2013. Heavy rainfall associated with the typhoon intensified the flood severity (extent and depth). This study investigates the flood evolution to understand the dynamic nature of flooding and the compound effect using a well-established 2D hydro-inundation model (FloodMap) to reconstruct this typical event. This model coupled urban hydrological processes with flood inundation for high-resolution flood modeling, which has been applied in a number of different environments, and FloodMap is now the mainstream numerical simulation model used for flood scenarios. Our simulation results provide a comprehensive view of the spatial patterns of the flood evolution. The worst-hit areas are predicted to be low-lying settlements and farmland. Temporal evaluations suggest that the most critical time for flooding prevention is in the early 1–3 h after dike failure. In low-elevation areas, temporary drainage measures and flood defenses are equally important. The validation of the model demonstrates the reliability of the approach.
- Article
(17799 KB) - Full-text XML
- BibTeX
- EndNote


Flooding is a common and devastating natural hazard, causing considerable personal injury, loss of life, and property damage worldwide (Jonkman et al., 2005; Jongman et al., 2012). Engineering measures such as dikes and barriers are typically constructed in low-lying deltas and floodplains to prevent flooding. However, weak or aging dikes without regular maintenance may fail during extreme flood events. Levee breaches may result in extensive flooding and damages throughout the hinterland (Ying et al., 2003). For example, Hurricane Katrina-induced flooding significantly damaged the dike system of New Orleans and overwhelmed the city, making it the costliest disaster in US history (Kates et al., 2006). A more recent flood catastrophe with more than 50 deaths and hundreds of missing people resulted from a dam breach due to a Himalayan glacier outburst flood in northern India (Devjyot Ghoshal et al., 2021).
In addition, the co-occurrence or subsequent occurrence of multiple flood drivers such as coastal high tide, storm surge, extreme precipitation, and high river flow resulting in large runoff may cause compound flooding. The compound effect is much greater than the effect of individual flood events (Wahl et al., 2015; Ghanbari et al., 2021). For instance, Typhoon Fitow in 2013 brought torrential rain and caused high storm surges, resulting in record-breaking riverine water levels in the upstream region of the Huangpu River, Shanghai, China. As a result, the floodwall along the upstream Qianbujing Creek could not withstand the high water level, leading to a breach in a 15 m long section at 14:30 (all times are in China standard time) on 8 October 2013. Although the broken section was repaired after about 8 h, the levee breach combined with heavy precipitation resulted in extensive flood inundation in the rural areas.
Over the last few decades, numerous studies analyzed the compound effects of various flood hazards at different scales (Ganguli et al., 2020). Most previous studies focus on calculating the joint flood risk probability. For instance, Lian et al. (2013) evaluated the joint probability of rainfall and tidal level both exceeding their threshold values through the copula and then analyzed the combined effect of them on flood risk in a complex river network in a coastal city in China. At a global scale, Couasnon et al. (2020) and Eilander et al. (2020) explored the compound flood potential resulting from storm surges and riverine floods. Meanwhile, dike-failure-induced flooding and the compound effect have received increasing attention from decision makers, researchers, and even the general public. Recent studies have provided considerable progress on dike reliability analysis and compound flood modeling (Curran et al., 2018; Naulin et al., 2018). Several approaches for levee-breach-induced flood modeling were developed. Some previous studies have investigated the breaching mechanism and the hydrological process of dike failure flooding; Vorogushyn (2010) proposed an Inundation Hazard Assessment Model (IHAM), which coupled a 1D hydrodynamic model of river channel routing, a probabilistic dike breach model, and a 2D raster-based inundation model. Cannata et al. (2011) used a GIS-based approach to simplify a 2D dam break simulation. Recent advances have been made in the application of methodologies for predicting the dike-failure-induced flooding; Yin et al. (2020) predicted dike failures and flood inundations in Shanghai, China, under various emission scenarios using an interdisciplinary process-based approach.
The above studies contributed significantly to the modeling and evaluation of dike-failure-induced flooding, as well as compound flood risk. However, most previous studies have paid attention to the occurrence probability and final impact of compound flooding. Few studies investigated the complete compound dynamic hydrological process and mechanism of these extreme cases. Moreover, few historical compound flooding events have been adequately investigated in previous articles; these real-life cases play an important role to demonstrate the feasibility and robustness of study results. To address the research gaps, this case study seeks to examine the changing nature of levee-breach-induced compound flooding. A 2D hydro-inundation model FloodMap is used to simulate the process of the compound flood event that occurred in Qianbujing Creek to improve our understanding of the evolution of flood inundation. The results of the approach are validated by field measurements, including the inundation depth and the flood extent over time. The findings can provide support for decision makers to develop flood adaptation measures.
2.1 Study area
The study area is located at the junction of the Huangpu River and Qianbujing Creek in the upstream Huangpu River basin, Shanghai, China. The rural area covers about 1.5 km2, with the majority being agricultural land and the minority being human settlements. It is characterized by a mild and low-lying topography (with an average altitude of about 3 m above Wusong Datum). Due to its location, the study area has faced high flood risk from the river system; however, the heights of the flood defense measures are relatively low (i.e., a 50-year-return-period flood protection standard) compared to the high floodwall (1000-year-period flood protection standard) along the middle and downstream urban regions of the Huangpu River (Yin et al., 2020). Furthermore, because of the northern subtropical monsoon climate in this region, pluvial flood events caused by extreme rainfall, typically associated with typhoons, are frequently recorded during the flood season (June to September) (Yin and Zhang, 2015). Therefore, the risk of compound flooding from both riverine and pluvial sources is significantly higher than that in other locations. Figure 1 shows the location of the study area and the levee breach during Typhoon Fitow.
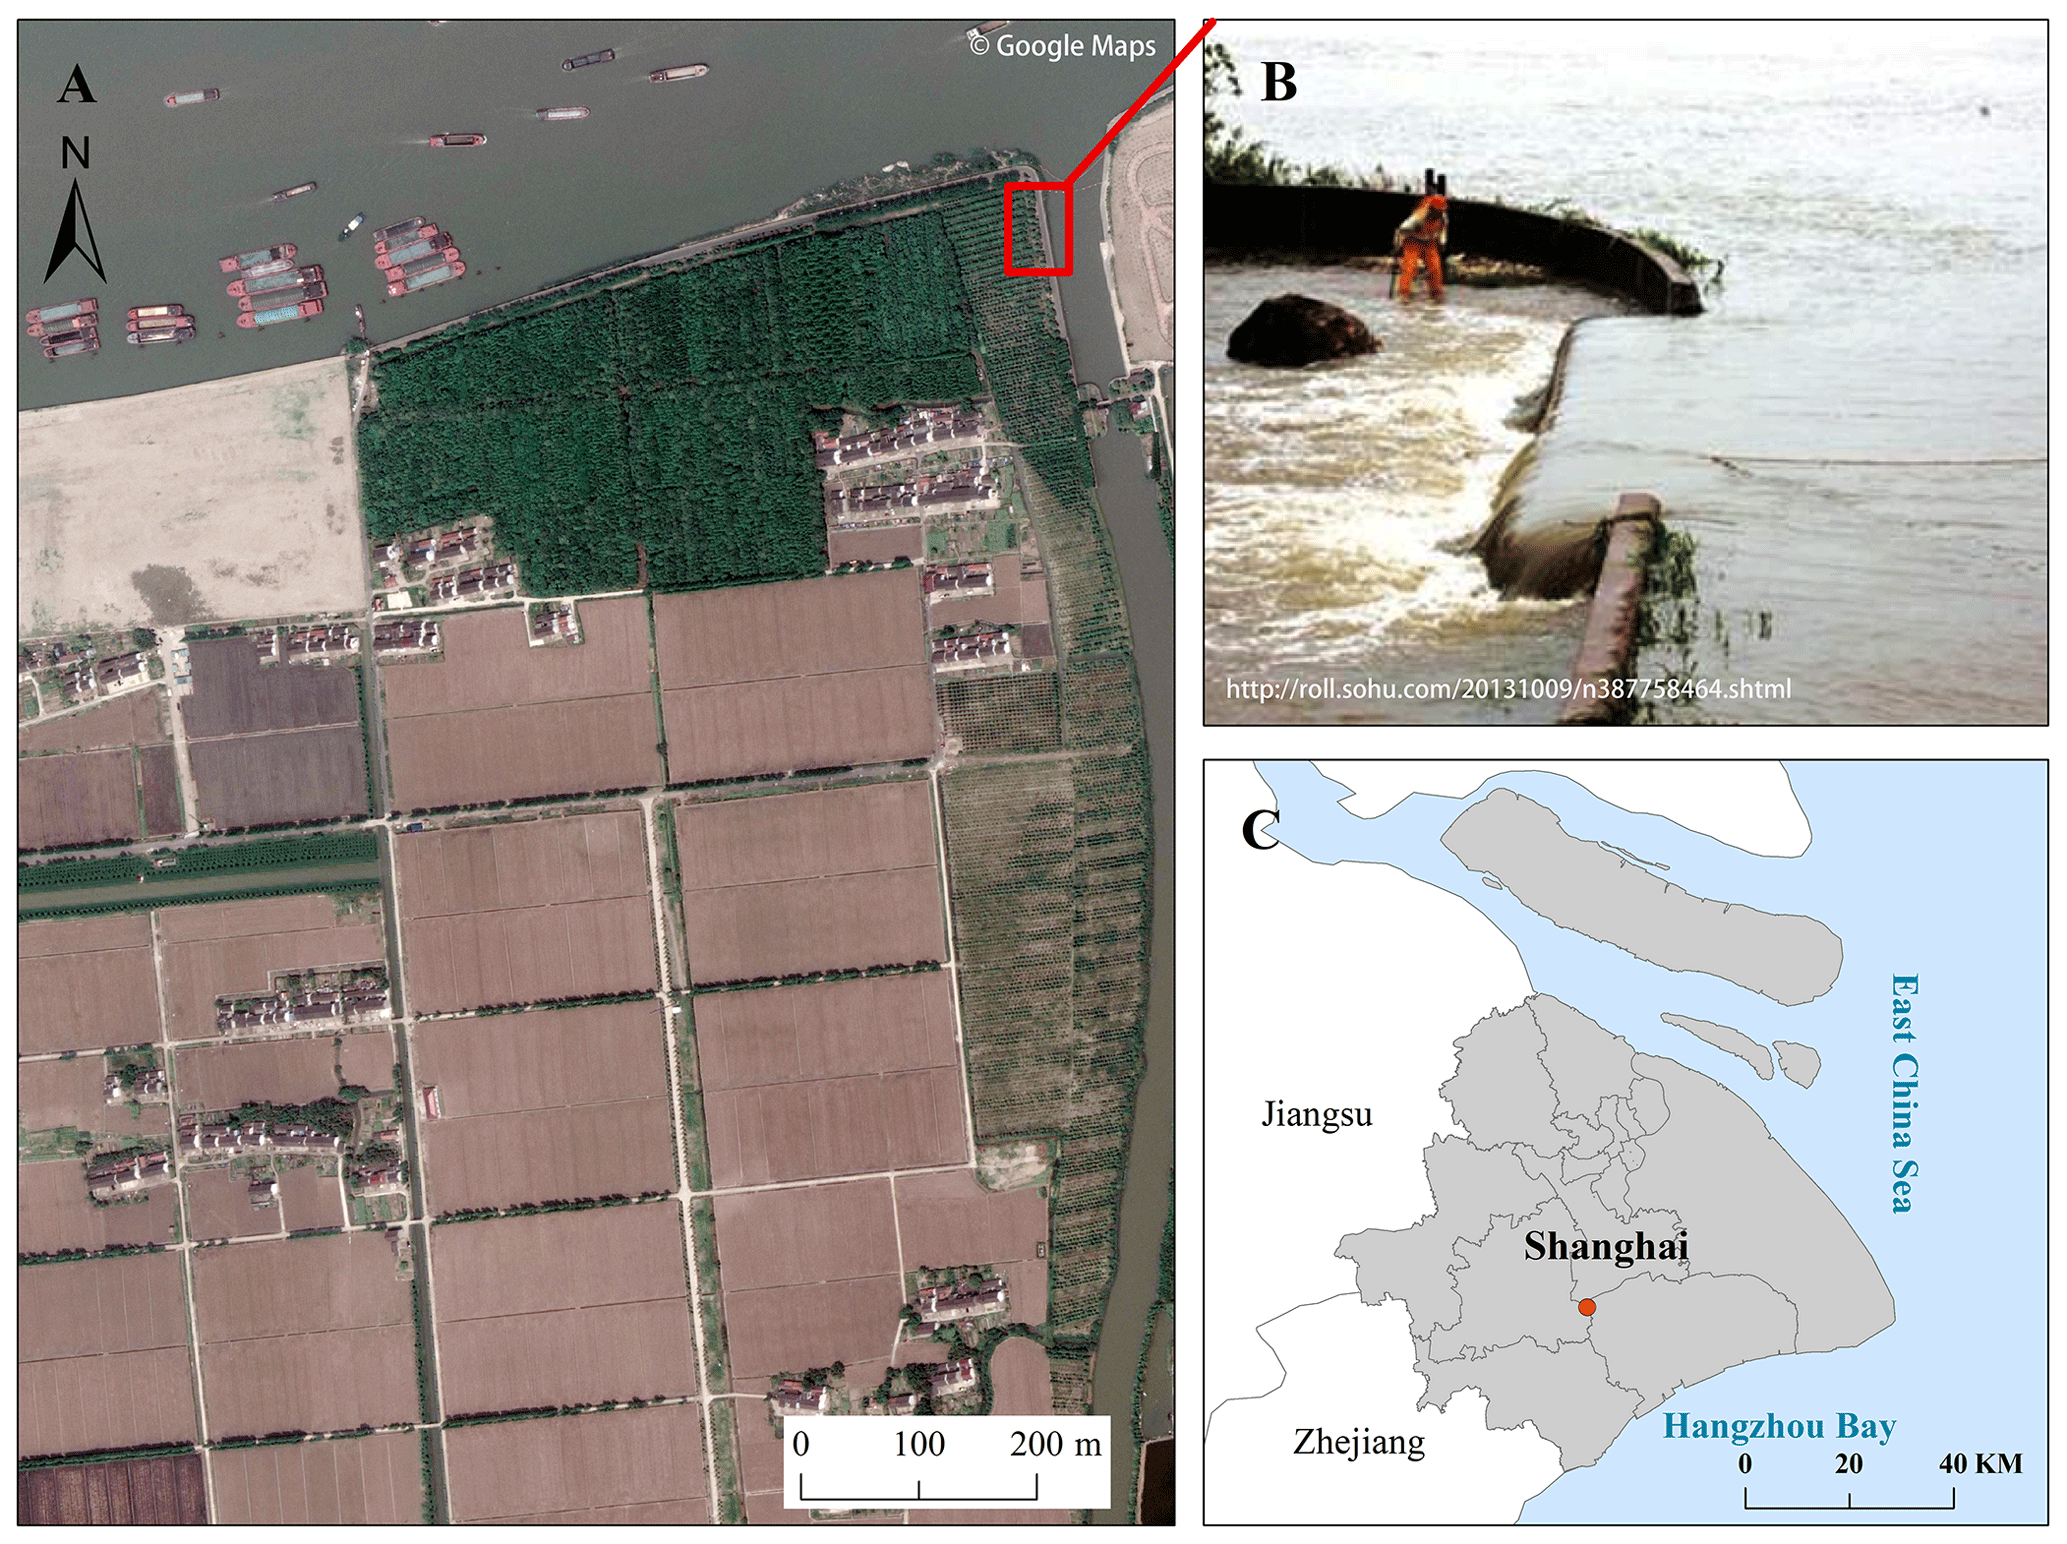
Figure 1Location of the study area and levee breach during Typhoon Fitow.
2.2 Data sources and processing
2.2.1 Topographic data
We use a high-resolution digital surface model (DSM) with the 6 m horizontal resolution and 0.1–0.2 m vertical resolution of the study area, which was constructed from images of the China Resource 3 satellite (ZY-3) and other high-resolution satellites. Since buildings and trees represent barriers to water flow and reduce the area available for water storage in the hydrodynamic model, we remove the non-topographic features (e.g., trees and buildings) according to the Google historical dataset of remote sensing images to generate a bare-earth digital elevation model (DEM) based on the Wusong Datum of Shanghai (Yu and Lane, 2006a; Fewtrell et al., 2010; Neal et al., 2011). We further resample the cell size of the bare-earth DEM from 6 to 2 m using ArcGIS software to improve the spatial resolution of the flood inundation model. The simulation domain of the study area consisted of 0.3 million cells with an area of nearly 1.26 km2.
2.2.2 Precipitation and water level
Time series of the precipitation and water level records during Typhoon Fitow are used as boundary conditions to simulate the hydrodynamic process of the levee-breach-induced flooding and the rainfall–runoff. The data are typically derived from the stage measurements at gauge stations or radar-based rainfall data. However, due to the small scale of the study area, the gauging records are considered to be more reliable. Thus, we collected the historical records of the precipitation and water level data at the nearest gauging station from 00:00 on 8 October to 12:00 on 9 October 2013 for about 12 h before and after the levee failure.
The station-based precipitation records (at 1 h intervals) are obtained from the Information Center of the Shanghai Meteorological Administration. The water level data (at 5 min intervals) at the closest gauging station along the Huangpu River (i.e., Songpu Bridge gauging station at the upstream of the Huangpu River, about 4 km away from Qianbujing Creek) are provided by the Shanghai Municipal Water Authority. The time series of the rainfall and water level data interpolated from the gauging stations is shown in Fig. 2a and b. Heavy rainfall occurred 4 h before the levee breach, with the maximum hourly rainfall exceeding 20 mm h−1, resulting in the high water level of the river. Due to the high rainfall and rising storm tide, the water level increased rapidly to nearly 4.8 m and caused the collapse of a 15 m long floodwall section at about 14:30 on 8 October.
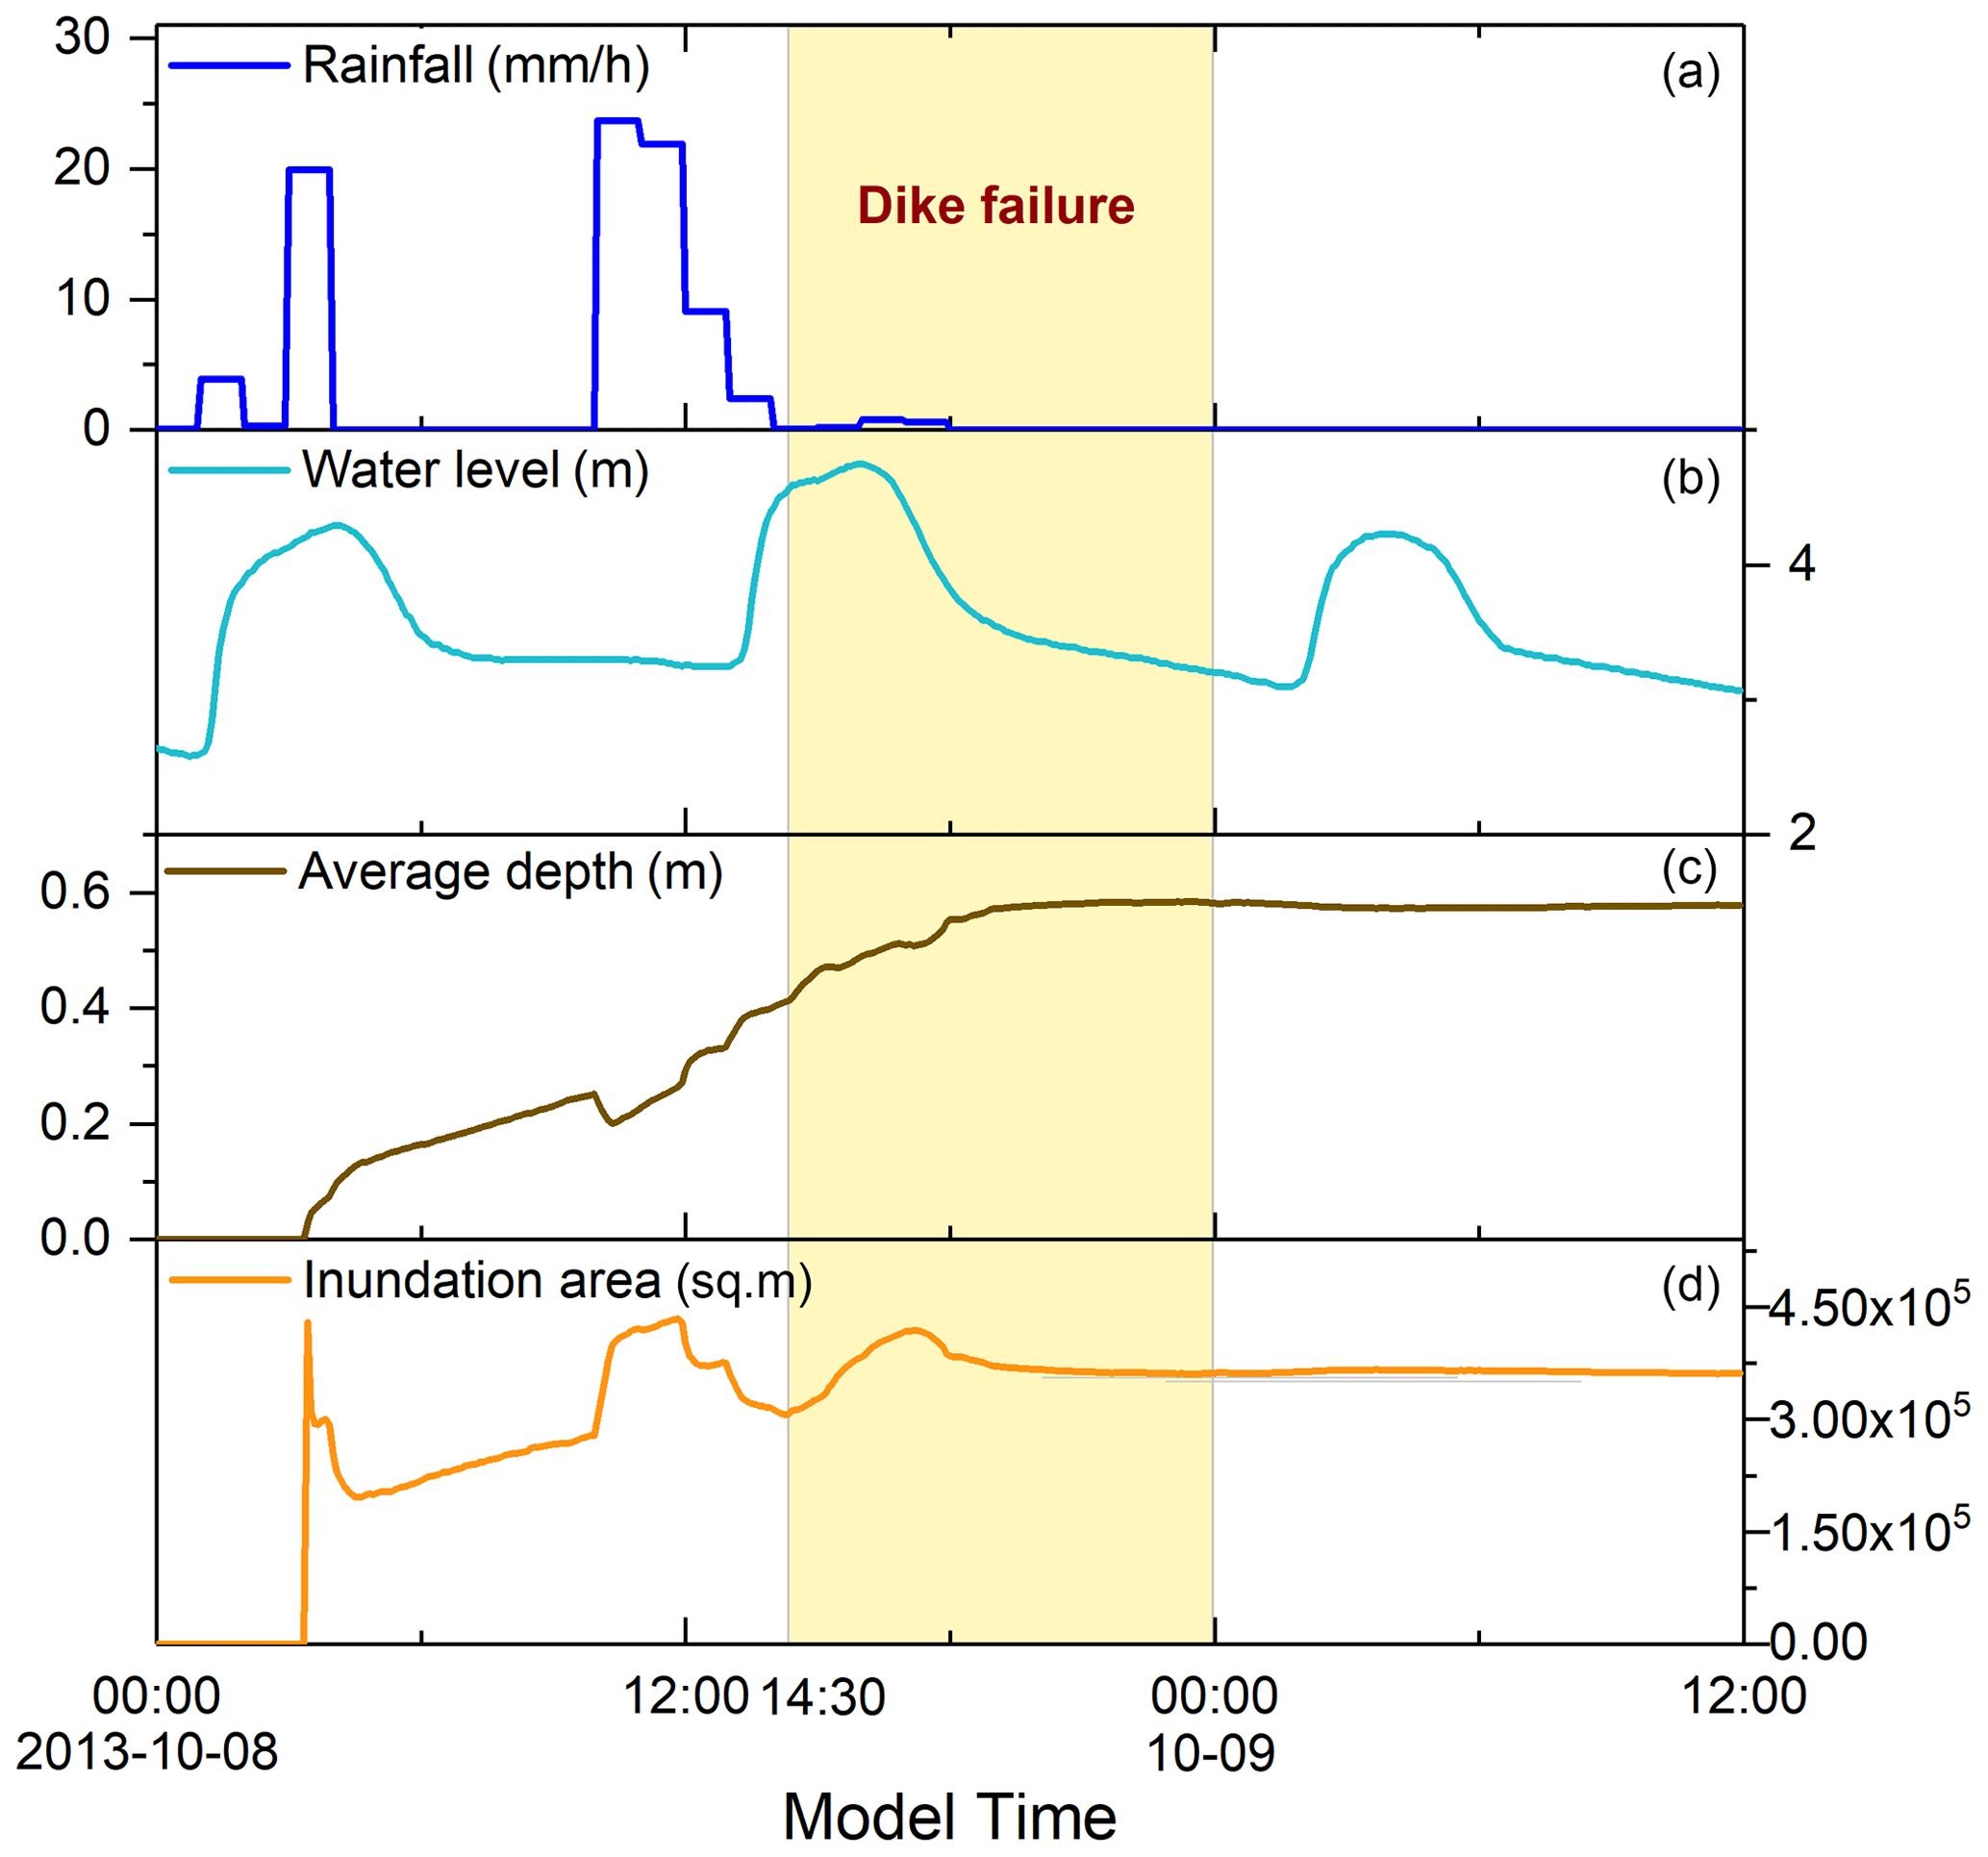
Figure 2Time series of the rainfall (a) and water level (b) data at Qianbujing Creek during Typhoon Fitow; time series of simulated average water depth (c) and inundation area (d).
2.2.3 Validation data
Aerial images or field surveys of flood extent are not available for the study event. There is also a lack of water depth data from electronic gauges and flood incidents reported by the public. Therefore, we validate the model through the field investigation of high watermarks in the study area. We visited the study area three times in 2020 and investigated the residential areas (house by house), roadways, and farmland mostly affected by the flood event. Validation data were collected using questionnaires, and the coordinates of the locations were recorded by GPS. However, since this flood event occurred more than 7 years ago, there are inherent uncertainties in the investigation due to the changing environment and people's fading memory for the details of the event. Similarly, people tend to exaggerate their injuries and losses during hazards; thus, questionnaires can be highly biased. Finally, we pinpointed 32 incidents in total where locations are confidently identified. Among the 32 observed inundation data, 14 were buildings, 10 were roadways, and 8 were farmland locations (Fig. 3).
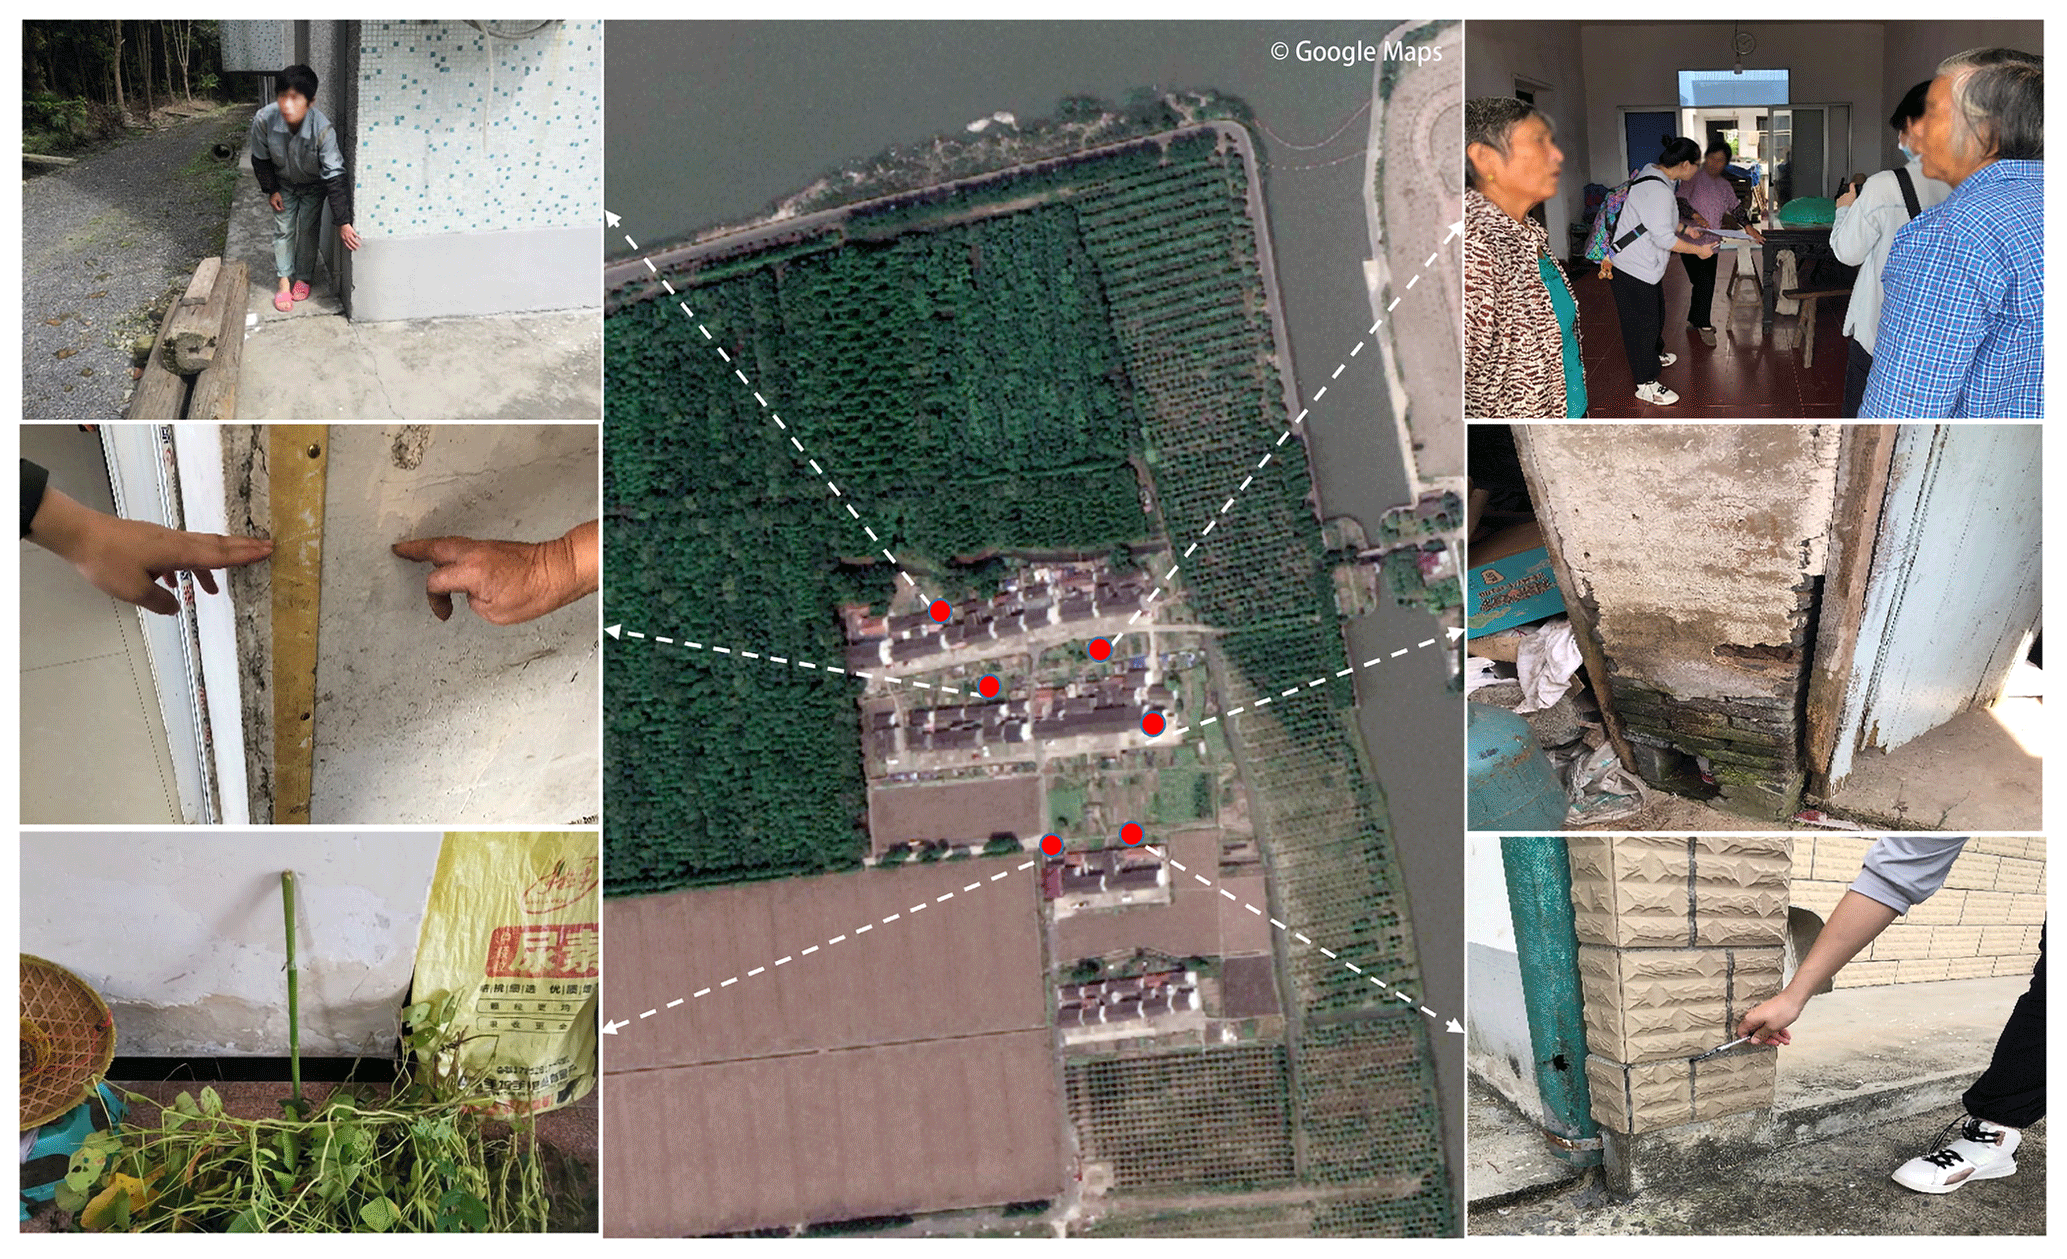
Figure 3Field investigation of flood inundation after the event.
2.3 Levee breach modeling
In general, levee breach mechanisms mainly include structural instability failures and structural strength failures. The former pattern includes horizontal instability and rotational instability, whereas the latter refers to the destruction of structures (Wang, 2016). Due to the configuration of the floodwalls and the soil structure in Shanghai, structural instability failures always occur during low water levels when critical inundation is less likely. In this case, structural strength failure was considered the major reason for the levee breach in the study area, namely, the levee collapse under an excessive hydraulic load on the wall due to an extremely high water level or the uneven settlement of the floodwalls.
We identified the location of the levee breach from the historical news reports and through field investigation. The 15 m long levee breach was located at the junction of Qianbujing Creek and the main channel of the Huangpu River. The levee height and location are obtained from the Shanghai Municipal Institute of Surveying and Mapping. The height of the remaining intact floodwalls without the breach section (about 5 m above Wusong Datum) is then overlaid onto the original bare-earth DEM using the raster calculator in ArcGIS 10.6 software. Due to the model, we cannot change the topography boundary during the running time, so we control the levee height by changing the relative water level – namely, before the levee breach, the relative water level is 0 because there was no flooding, while during the levee breaching period, the relative water level is the historical river water level, so that the flood spread from the breach section.
2.4 Compound flood modeling
The compound flood modeling is performed using a 2D hydro-inundation model (FloodMap) (Yu and Lane, 2006a, b; Yu and Coulthard, 2015), which couples hydrological processes (e.g., infiltration, evapotranspiration, and drainage) module with 2D surface flood inundation modeling. The FloodMap model provides an effective approach for compound flood simulation, allowing for more than one hydrological boundary condition, including pluvial, fluvial, coastal, and groundwater sources. The fluvial flood modeling and pluvial flood modeling are described in Sect. 2.4.1 and 2.4.2, respectively.
2.4.1 Fluvial flood modeling
For simulating the levee-breach-induced flooding, a simplified flood inundation module based on a raster environment is used to solve the inertial form of the 2D shallow water equations. The module considered the mass and momentum exchange between the river flow and floodplain inundation; it has been used to simulate the dynamic nature of flood routing and to extract potential flood maps (Yin et al., 2015; Yang et al., 2020). The 2D inundation model is similar to the inertial algorithm of Bates et al. (2010). The difference is the time-step calculation approach. The optimal time step is calculated using the subsequent iteration instead of using the time step of the next iteration calculated by the current iteration. The main structure of the model is presented below.
The Saint-Venant momentum equation without the convective acceleration has the following form:
where g is the acceleration of gravity, q is the flow per unit width, R is the hydraulic radius, h is the water depth, z is the bed elevation, and n is Manning's roughness coefficient. For wide and shallow flows, R can be approximated with h. The equation discretized with respect to time is
The qt in the friction term can be replaced by qt+Δt to obtain the explicit expression in the next time step:
The flows in the x and y directions are decoupled and have the same form. The discharge is evaluated at the cell edges, and the depth is determined at the cell center. For model constancy and minimizing numerical diffusion, we use the forward Courant–Friedrichs–Lewy condition (FCFL), which was used by Yu and Lane (2011) for the diffusion-based version of FloodMap, to calculate the time step in the inertial model:
where w represents the cell size, i and j are the indices for the flow direction in the x and y directions, di and dj are the effective water depths, and Si and Sj are the water surface slopes. The effective water depth is defined as the difference between the high water surface elevation and the high bed elevation of two cells that exchange water. The minimum time step that satisfies the FCFL condition for all wet cells is used as the global time step for this iteration. This approach does not require the back calculation of the Courant number because the time step is calculated based on the FCFL condition that satisfies every wet grid cell for the current iteration. The universal time step calculated with the FCFL may need to be scaled further by a coefficient with a value between 0 and 1 because the FCFL condition is not strictly the right stability criteria for an inertial system. A scaling factor in the range of 0.5–0.8 was found to yield a stable solution in previous studies; here, a scaling factor of 0.7 is used for all simulations. The calibration and validation of the model for the study area were conducted by Yin et al. (2016).
2.4.2 Pluvial flood modeling
In terms of the pluvial flooding module, we run the surface water flood routing using the same structure as the fluvial flooding module. The infiltration over saturation is calculated by the widely used Green–Ampt equation, and the evapotranspiration is represented using a simple seasonal sine curve of daily potential evapotranspiration (Calder et al., 1983). This module also considered the amount of runoff loss to the urban storm sewer systems by scaling the drainage capacity (mm h−1) for each time step.
The infiltration over saturation is determined by the widely used Green–Ampt equation, which approximates the rate of infiltration as a function of the capillary potential, porosity, hydraulic conductivity, and time using the following form:
where Ks expresses the hydraulic conductivity of the saturated soil, φf is the capillary potential across the wetting front, ho is the water ponding on the soil surface, and zf is the cumulative depth of infiltration.
The evapotranspiration is determined using a simple seasonal sine curve of daily potential evapotranspiration (Calder et al., 1983) as follows:
where Ep is the mean daily potential evapotranspiration, and i is the day of the year. The mass lost to evapotranspiration is typically limited due to the short duration of urban pluvial flooding.
We use the topography boundary conditions, flow boundary conditions, and precipitation boundary conditions as inputs to model a 36 h compound flood process, including the 12 h before and after the levee breach, and we assumed evapotranspiration of 3 mm d−1, a value that generates a good inundation prediction in the urbanized area (Yin et al., 2016; Yu and Coulthard, 2015). The soil hydraulic conductivity (Ks) is an important but highly complex parameter used to calculate infiltration. Empirically based correlation methods or in situ hydraulic laboratory measurements can be used to determine the value of Ks. Given the practical constraints, this study refers to previous flood simulations in Shanghai (Yin et al., 2015, 2016; Yu and Coulthard, 2015; Yu et al., 2016) and uses the value of 0.001 m h−1 for the hydraulic conductivity. A relatively high roughness value (n=0.06) is used in the simulation, according to the type of cultivated land and crops in the study area. Since the Qianbujing Creek is located in a rural area, we did not consider the urban storm drainage capacity in this simulation.
3.1 Time series of flood inundation
Figure 4 shows the changes in the predicted flood inundation every 4 h during the event, and Fig. 2c and d depict the time series of average water depth and flood extent. These results show the spatial and temporal evolution of the levee-breach-induced compound flooding during Typhoon Fitow. Prior to the levee breach, it is apparent from Figs. 4 and 5 that heavy rainfall in the study area led to localized shallow waterlogging, mainly in the low-lying farmland and forests. The inundation area reached its first peak in the early hours on 8 October, but the water retention time was very short due to the shallow water depth (<15 cm). At around 11:00 on 8 October, another short-term rainstorm with rainfall over 20 mm h−1 occurred. Shortly after the precipitation peak, the water level of Qianbujing Creek showed an increasing trend. The compound effects of tide rising and heavy rain made the water level soon reach nearly 4.8 m (Fig. 2a, b). Due to the high water pressure, the bearing capacity of the floodwall was exceeded, resulting in a 15 m breached section (at 14:30). Subsequently, overland flow through breached floodwalls and extensive flood inundation occurred quickly along the riverbank, first in the low-lying farmland near the river and then on roads and residential areas. About 10 homes were completely inundated during the water level rising period (until 16:00), with the maximum inundation depth higher than 2 m. After 16:00, as the rainfall stopped and the water level dropped, the inundation area gradually stopped spreading.
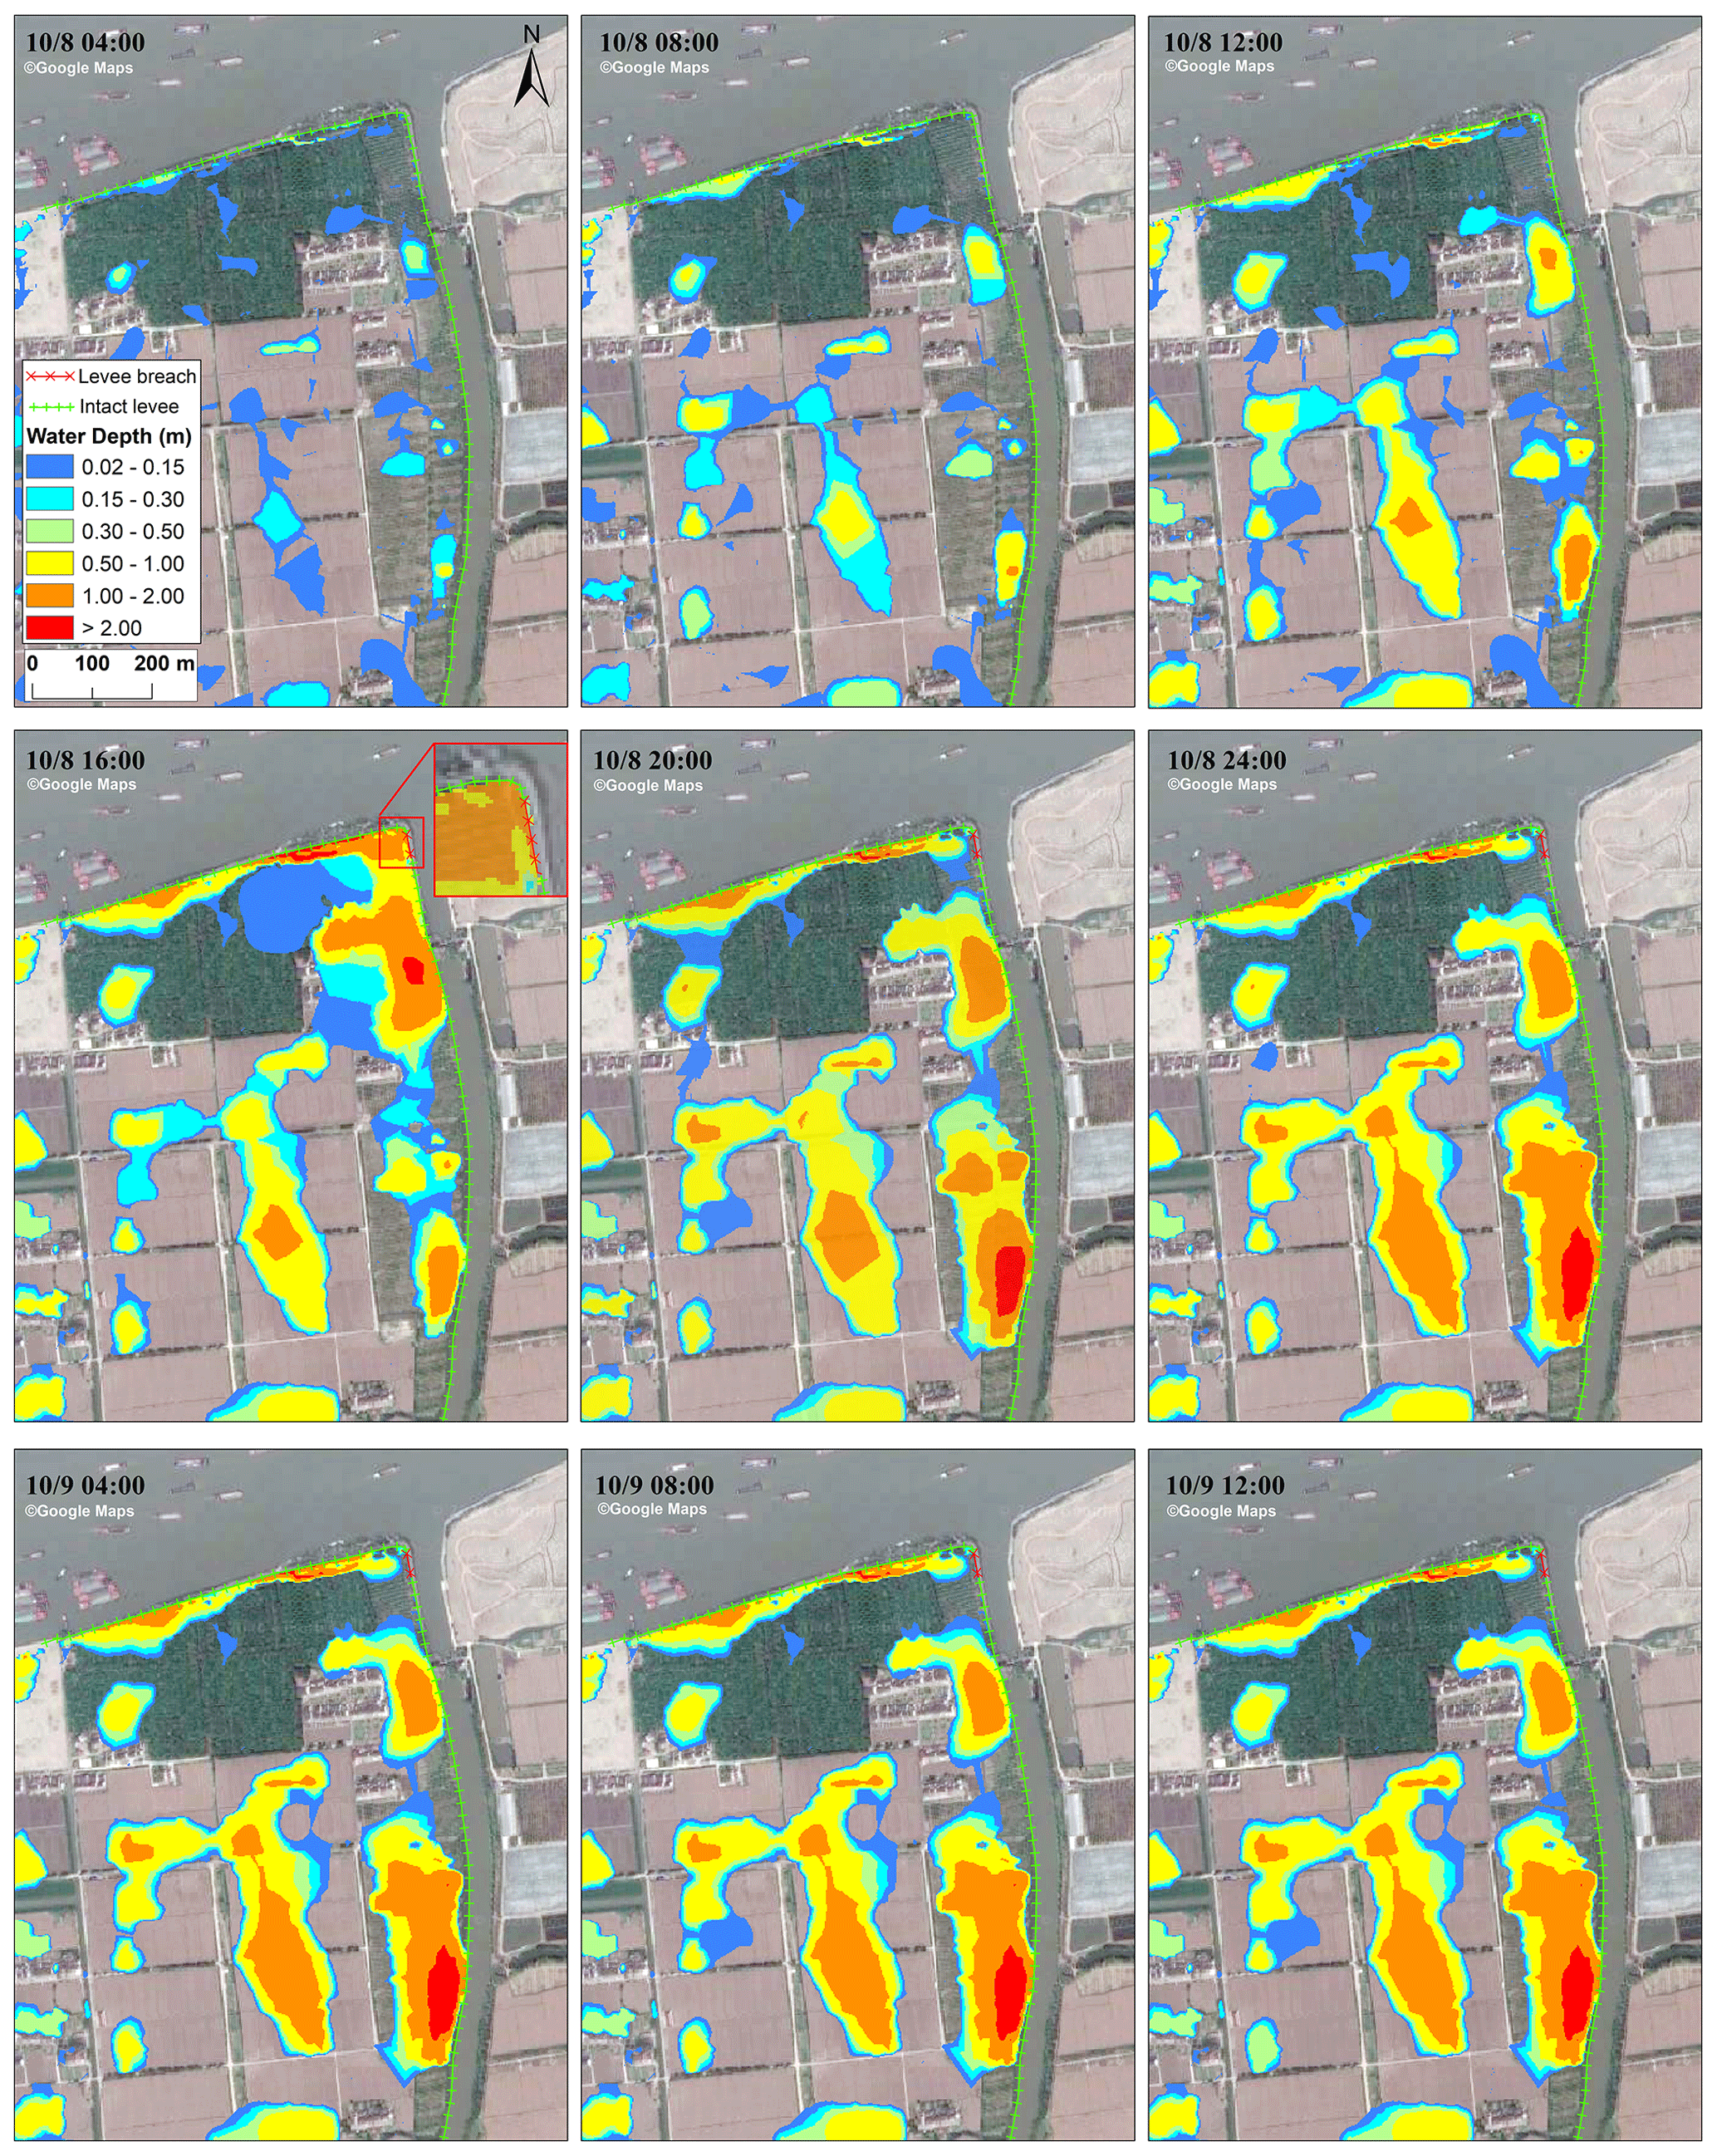
Figure 4Time series of flood inundation during the typhoon event.
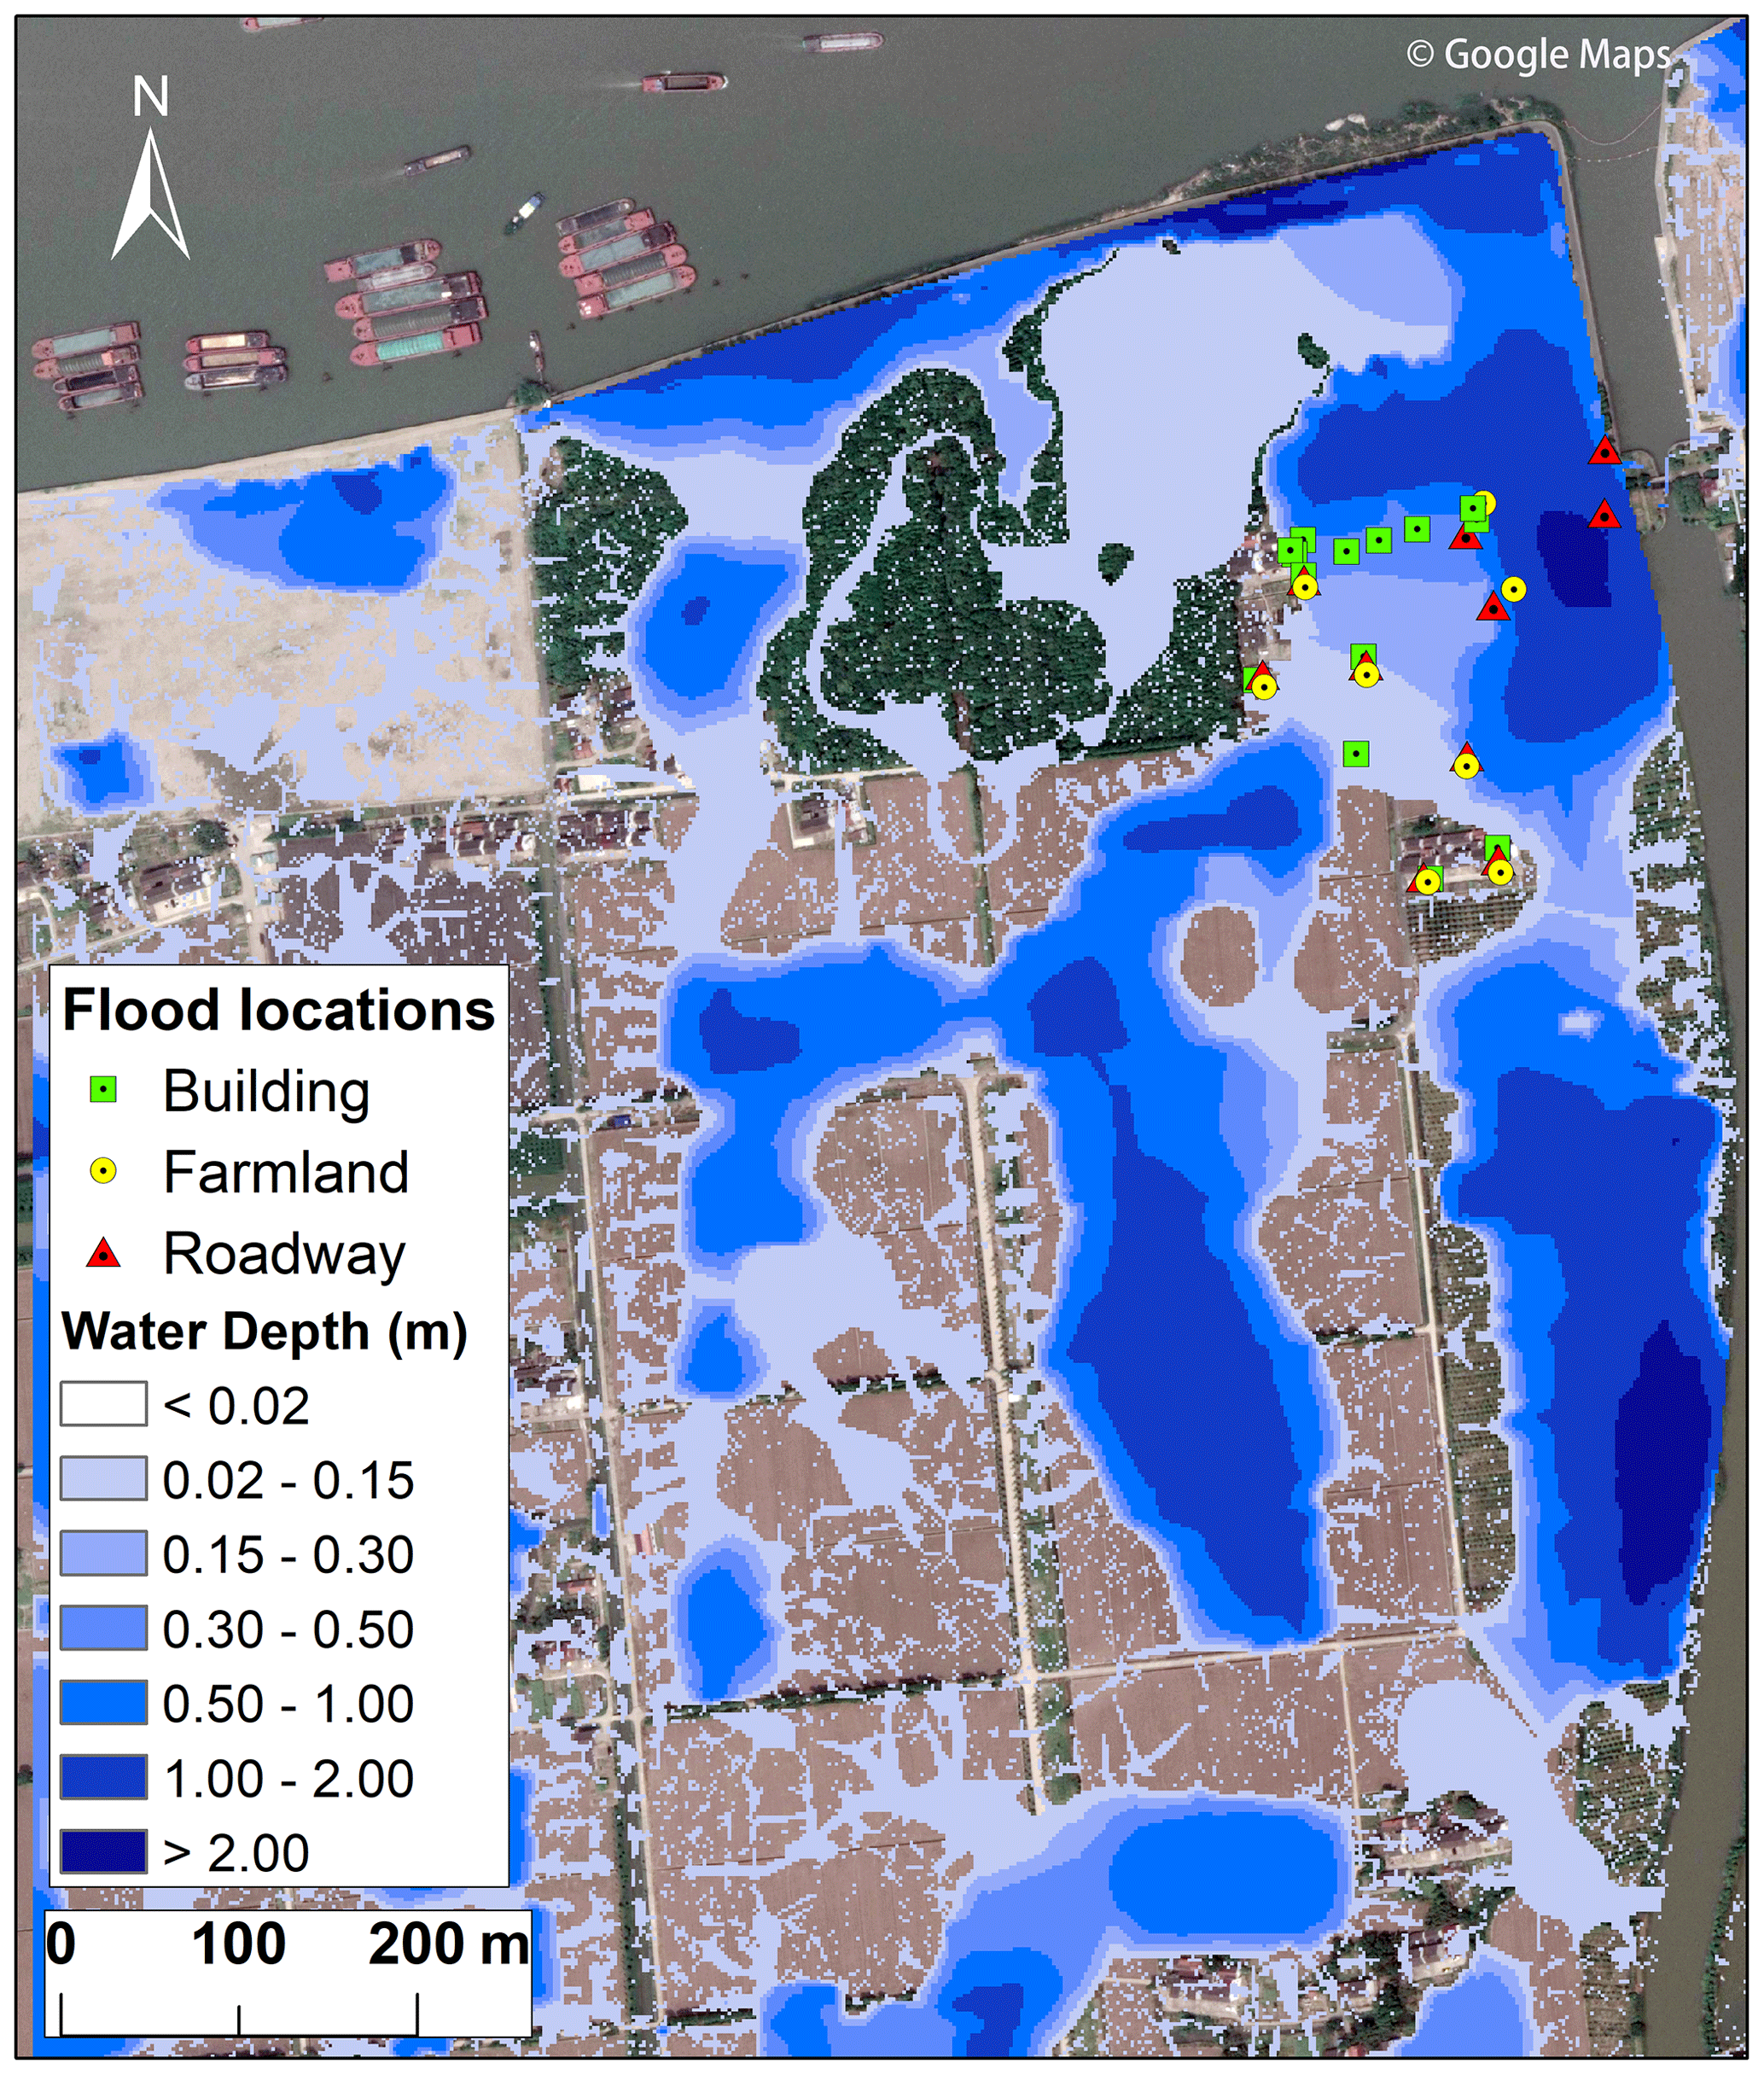
Figure 5Maximum flood extent and depth predicted by the model.
A cross comparison of the derived flood hazard maps over time further indicated that although the rainstorm caused extensive surface water flooding in the majority of the study area, the inundation depth was generally shallow (<15 cm). This effect can be attributed to the evapotranspiration and infiltration in a few hours. However, unlike the short-term waterlogging caused by the rainstorm, the compound effects of the rainfall and levee-breach-induced flood inundation continued over 12 h, with an average water depth of nearly 60 cm.
3.2 Maximum flood inundation
The maximum flood extent and inundation during the event are shown in Fig. 5. We use 2 cm as the threshold for surface water flooding and treat water depths shallower than 2 cm as sheet flow, which did not accumulate in topographic lows (Yu et al., 2016). Figure 5 shows that over half (56 %) of the study area was inundated from the compound flooding, and most of the flooded areas were low-lying farmland with maximum flood depths of higher than 2 m. Aside from the waterfront areas, many low-lying farmland areas were affected by the rainstorm, with maximum water depths over 50 cm. In contrast, the water depth on the roads and the buildings were shallow; most of it was less than 0.5 m and disappeared quickly. In nearly half of the flooded locations, the water depths were between 2 and 15 cm (44.1 %), and a smaller proportion of the area (21.12 %) had water depths between 15 and 50 cm. About 33.26 % of the inundated areas had water depths of 50 cm to 2 m. In combination with the time series of water level and rainfall (Fig. 2a, b), it can be inferred that the maximum flood inundation occurred at about the fourth hour after the levee breaching (at ∼ 16:00) in the waterfront area, while it occurred at about 11:30 in other areas.
3.3 Model validation
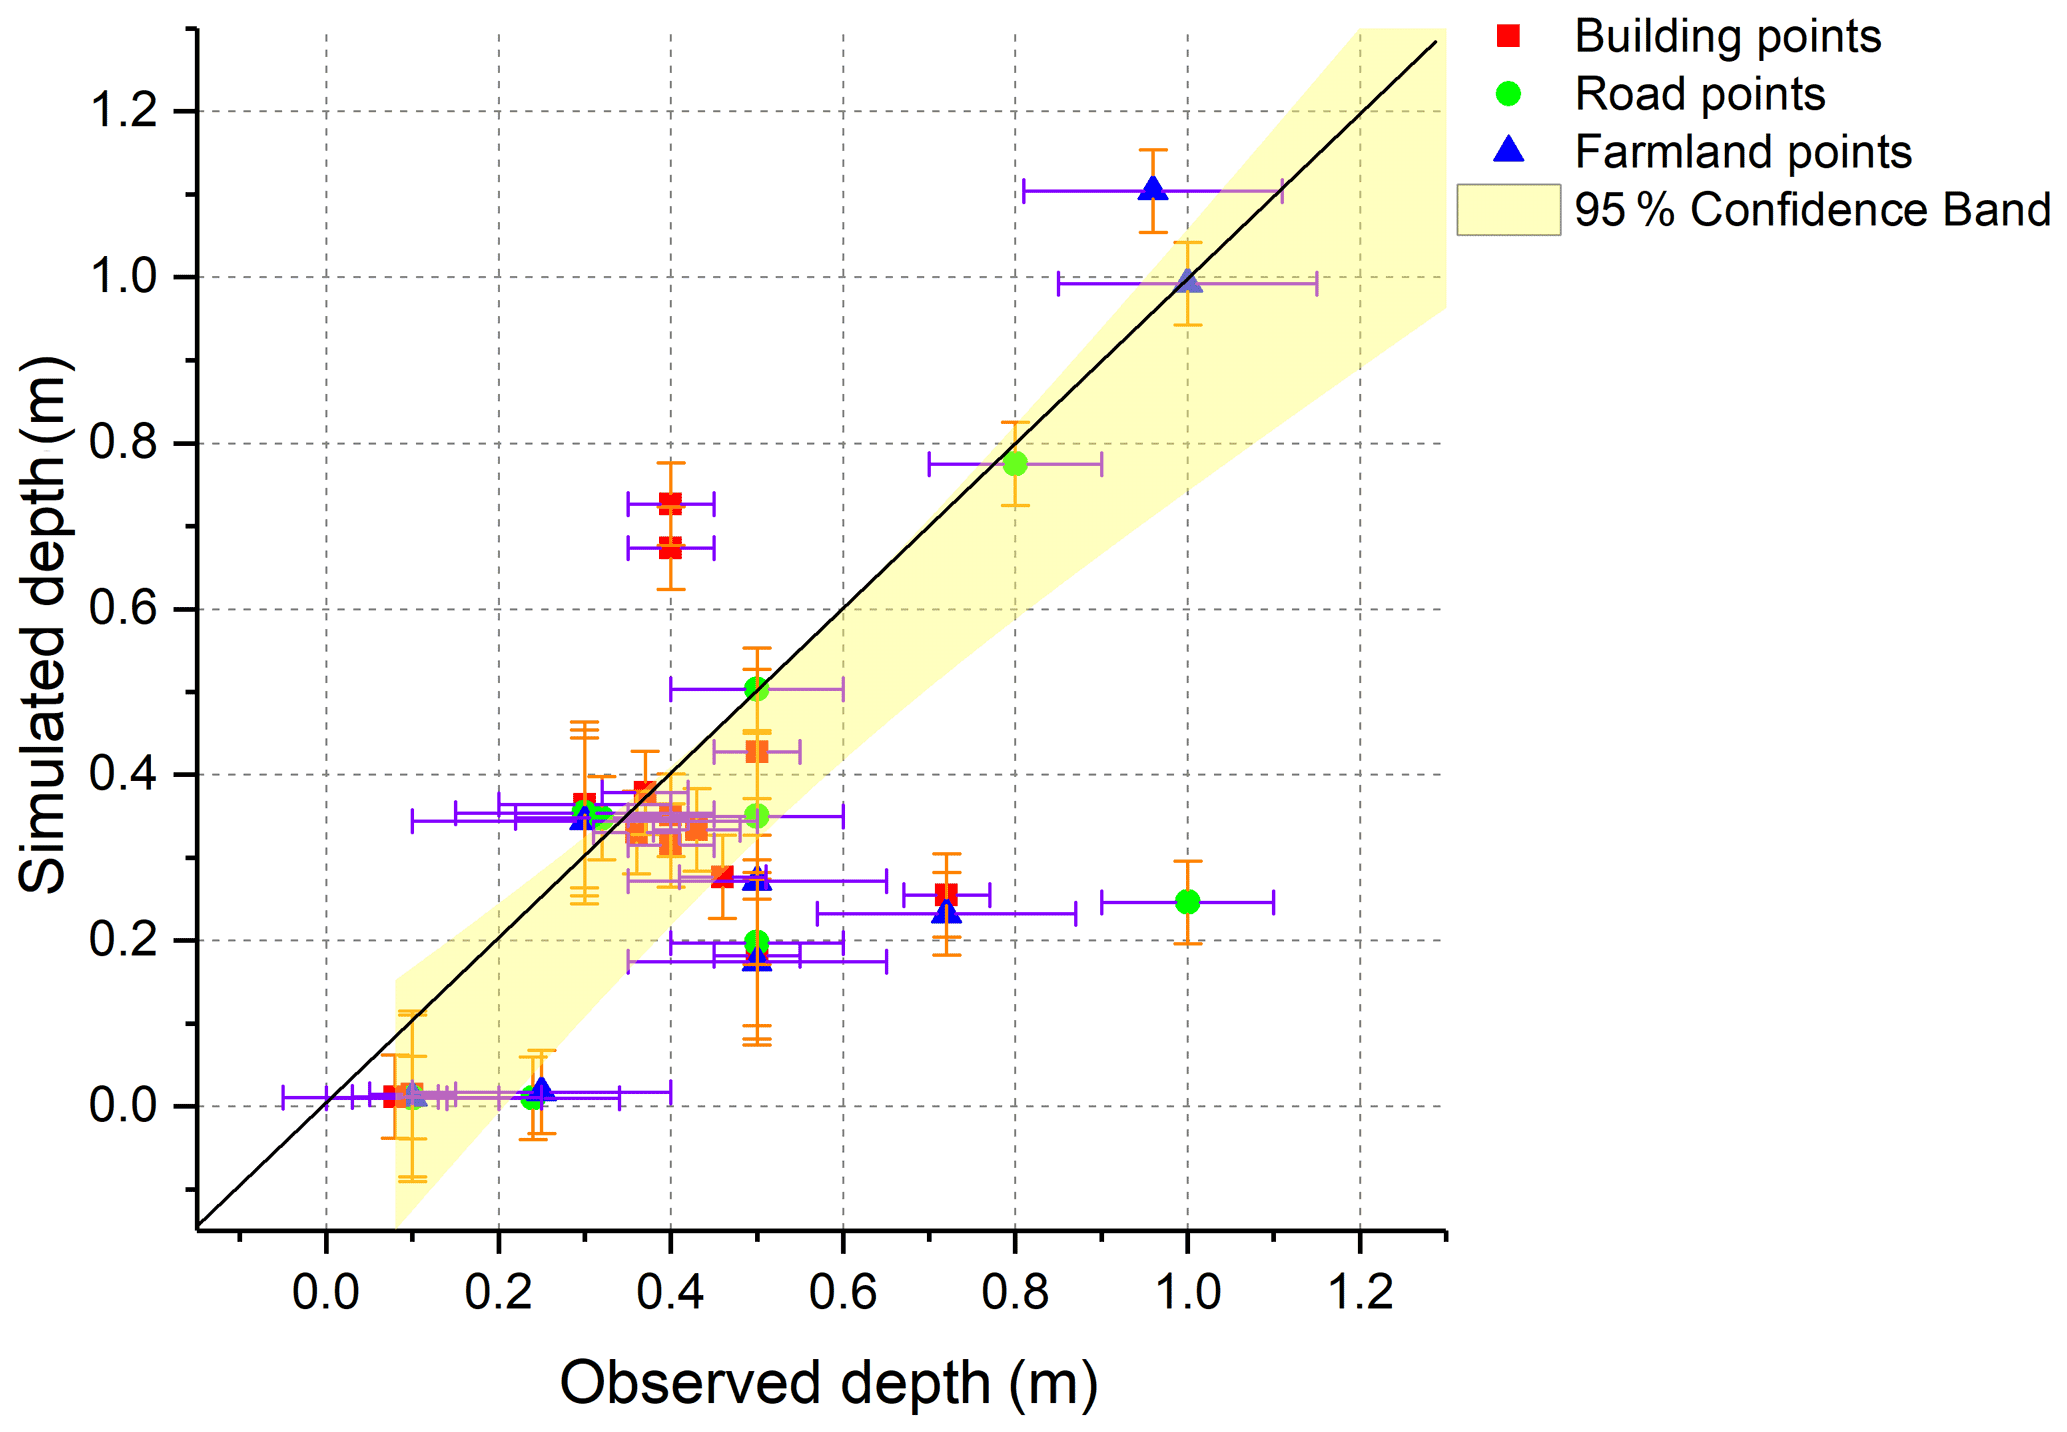
The field measurements are used to validate the performance of the compound flooding model. Figure 5 shows the location of the measurement points. The points are divided into building, road, and farmland types. Since there are few residential areas in the study area, reliable inundation information could not be obtained in most flooding areas. Therefore, most points represent buildings with extensive inundation. Since there are uncertainties and errors in the survey results, including the respondents' memory bias, exaggeration of inundation, and false positives, we set the observed error to 5 cm for building points, 10 cm for road points, and 15 cm for farmland points. The simulation error is set as 5 cm. Figure 6 shows the scatter plot of the simulated and observed water depth and the 95 % confidence interval. A correlation is observed between the simulated water depth and observed water depth, and most points fell within the confidence band. The observed water depth was slightly higher than the simulated water depth, which may be attributed to the exaggeration of the water depth by the respondents.
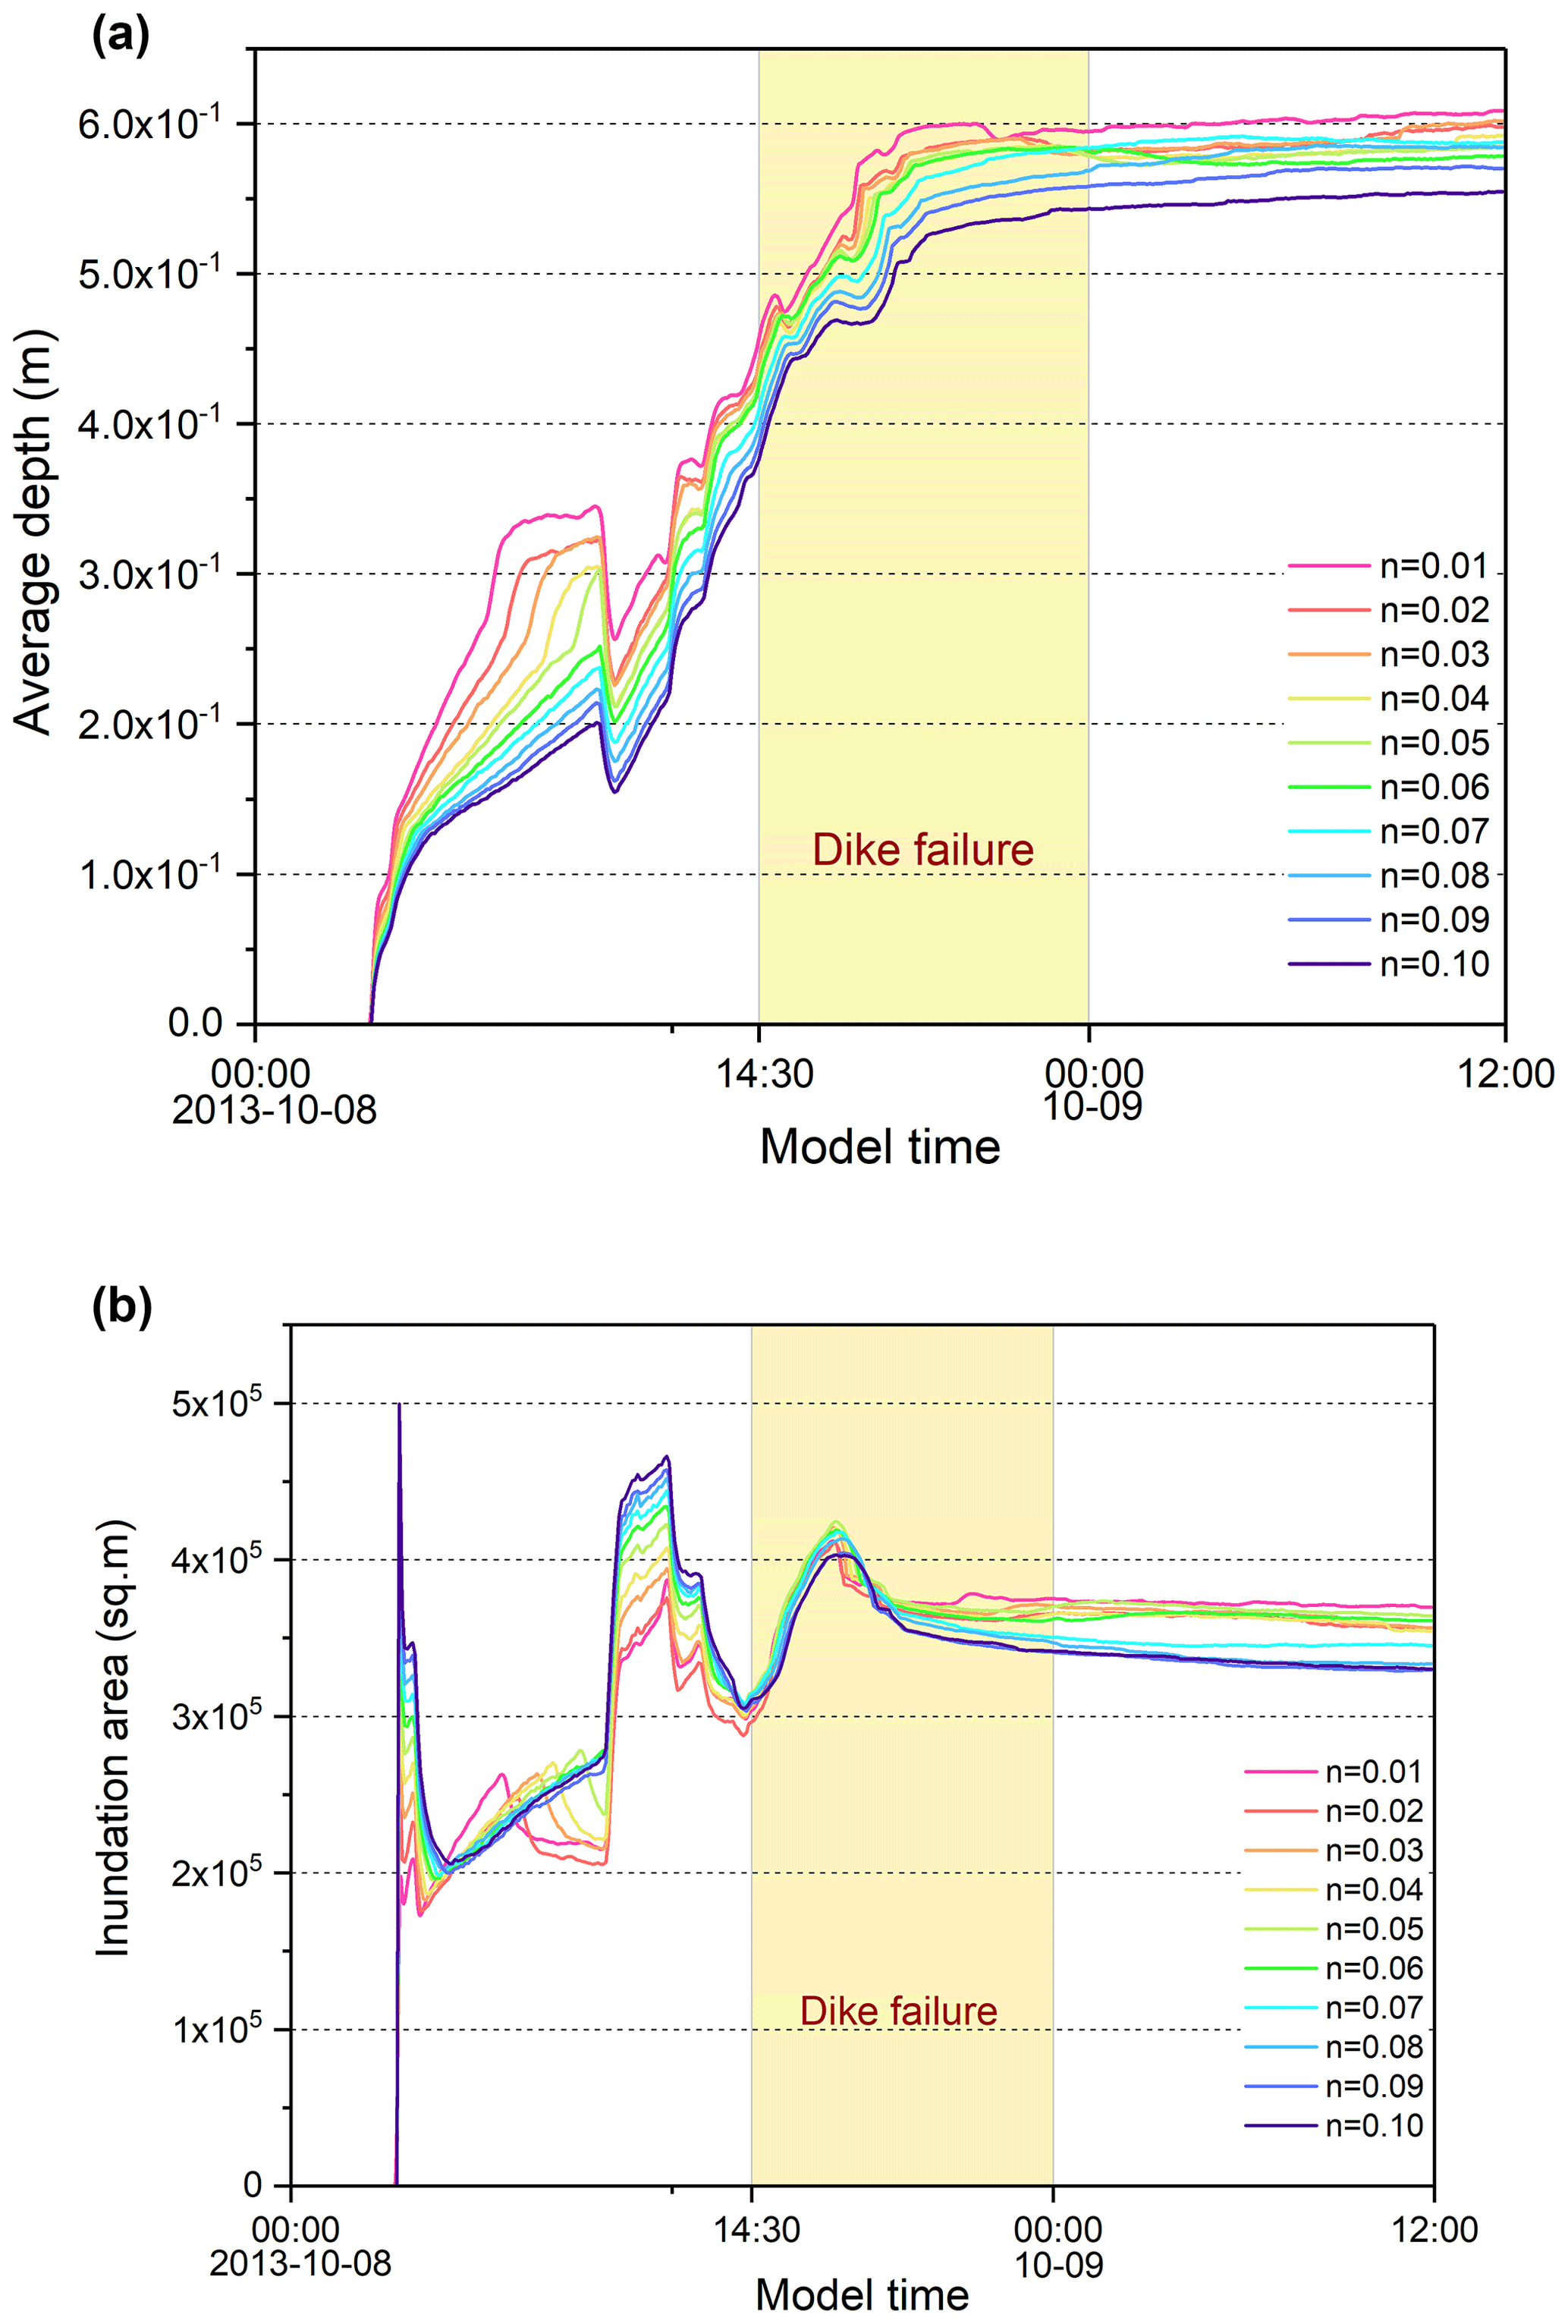
3.4 Sensitivity analysis
The model sensitivity to Manning's roughness coefficient over time is analyzed. Several Manning n values (0.01–0.1 at a 0.01 increment) are used for the roughness parameterization. The difference between the average water depth (Fig. 7a) and the total inundation area (Fig. 7b) predicted by the simulations with different n values is calculated on a cell-by-cell basis. The results indicate similar trends of the average water depth and inundation area for different roughness values and differences in the values. As the roughness increased, the average water depth decreased, and the difference is more pronounced at higher roughness values. For example, the maximum average depth decreased from 0.61 to 0.55 m, with an increase in the n value of 0.01 to 0.1. Interestingly, there are differences in the sensitivity to the roughness before and after the levee breach for the flood inundation extent. The inundation area increases as the roughness rises during the rainstorm. However, the inundation area decreases slightly with the growth of the n value during the levee breach when the river flow is the major cause of the flooding. As a result, the rainfall is more likely to cause ponding with high roughness, as it drops the flow velocity, whereas when the river flow is the main force, the decline of roughness value leads to an increase in flood velocity, which accelerates the spread of flood. These results demonstrate the sensitivity of the model to the roughness.
Simulation of real-life historical severe flooding events can reveal the dynamic flooding process and mechanism. In this study, a serious compound levee-breach-induced flooding during the Typhoon Fitow has been adequately investigated used by a simple 2D hydro-inundation model (FloodMap). The surface runoff caused by the rainstorm and river overflow is well considered in the model.
The following conclusions can be drawn from the simulation results. Firstly, one key advantage of this modeling approach is the analysis of a single historic flood event. The flooding results showed the time series of the flooding extent and inundation depth, indicating that the low-lying area especially for farmland areas near the river had a very high flood risk. The compound flooding caused extensive damage to low-lying areas not only due to the elevation but the lack of a drainage network, resulting in an average water depth of over 0.5 m more than 12 h. Secondly, within 1–3 h after the dike failure, the floodwaters spread rapidly, and the inundation area and average water depth reached the peak value – chiefly because of the rising riverine tides at the same time; however, during the falling tide period, although the dike has not been repaired, the flooding diffusion tends to be slow, and the flood risk decreases as the water level drops as well. Thus, it can be indicated that the levee-breach-induced flooding spread was heavily dependent on the change of riverine tides, and the key period for levee-breach-induced flooding control (such as repairing the levee and evacuation) was from the levee breach to the end of the rising tide. Thirdly, the water does not drain rapidly only by infiltration or evaporation, and the waterlogging lasts for more than 12 h, resulting in the loss of farmland with high vulnerability. Therefore, for levee-breach-induced flood response in the rural area, in addition to repairing the levee in time, it is essential to remove the floodwater using drainage measures at the same time, such as setting water pumps near the farmland or other low-lying area. As well, the government should guide nearby residents to evacuate to a safe place when necessary.
Beyond the flood emergency response measures, effective long-term engineering measures may be more suitable for fundamentally reducing the unpredictable levee-breach flooding risk. Local specifications for flood-control engineering should be updated with the increasing flood risk in the context of climate change (Yang et al., 2015).
Model validation is a challenging aspect of this research. The topographic data resolution, land use, and land cover affect the simulation results. The validation data include field observations, and the uncertainty is associated with incorrect recollections of the residents that led to errors. It is assumed that the error ranged from 5 to 15 cm for different land uses. Most of the verification results match the field observations and fall within the confidence band, demonstrating the model's reliability. Nevertheless, some of the simulated water depths are slightly smaller than the field observations, which is attributed to the exaggeration of the depth by the respondents.
Another important component of this study is the comparison of the predictions (flooding extent and average water depth) using different Manning n values (from 0.01 to 0.1 at a 0.01 interval). The results demonstrated the model's sensitivity to roughness. Overall, the model exhibited good reliability for single and compound flood modeling. Future researches on this topic may focus on the following aspects to improve the robustness of the model. (1) Higher-resolution topography and hydrological boundary conditions should be used to represent typical flood conditions. (2) The drainage capacity could be modeled to provide a more reliable result. (3) Urban compound flood risks should be evaluated to help decision makers develop effective emergency response plans and flood adaptation strategies.
The raw and processed data from the co-authors' research findings cannot be shared at this time, as these data are also part of the ongoing research. The satellite remote sensing images are available from Google Earth open-source datasets (https://earth.google.com/, Google Earth, 2020).
YY and JY initiated and led this research. YY designed the flood event process, analyzed the performance of this model, and wrote the paper. JY provided history records of water level. WZ and JY gave the suggestion for this paper. YiL dealt with the rainfall data. YuL helped analyze the results. YZ, AX, YW, and WS helped in collecting validation data.
The contact author has declared that neither they nor their co-authors have any competing interests.
Publisher’s note: Copernicus Publications remains neutral with regard to jurisdictional claims in published maps and institutional affiliations.
This article is part of the special issue “Advances in flood forecasting and early warning”. It is not associated with a conference.
This paper was supported by the National Natural Science Foundation of China (grant nos. 51761135024 and 41871164), the National Key Research and Development Program of China (grant nos. 2017YFE0107400 and 2018YFC1508803), the Shanghai Philosophy and Social Science Planning Program (grant no. 2021XRM005), and the Shanghai Sailing Program (grant no. 21YF1456900).
This research has been supported by the National Natural Science Foundation of China (grant nos. 51761135024 and 41871164), the National Key Research and Development Program of China (grant nos. 2017YFE0107400 and 2018YFC1508803), the Shanghai Sailing Program (grant no. 21YF1456900), and the Shanghai Philosophy and Social Science Planning Program (grant no. 2021XRM005).
This paper was edited by Heidi Kreibich and reviewed by two anonymous referees.
Bates, P. D., Horritt, M. S., and Fewtrell, T. J.: A simple inertial formulation of the shallow water equations for efficient two-dimensional flood inundation modelling, J. Hydrol., 387, 33–45, https://doi.org/10.1016/j.jhydrol.2010.03.027, 2010.
Bevacqua, E., Maraun, D., Vousdoukas, M. I., Voukouvalas, E., and Widmann, M.: Higher probability of compound flooding from precipitation and storm surge in Europe under anthropogenic climate change, Sci. Adv., 5, eaaw5531, https://doi.org/10.1126/sciadv.aaw5531, 2019.
Calder, I. R., Harding, R. J., and Rosier, P. T. W.: An objective assessment of soil-moisture deficit models, J. Hydrol., 60, 329–355, https://doi.org/10.1016/0022-1694(83)90030-6, 1983.
Cannata, M. and Marzocchi, R.: Two-dimensional dam break flooding simulation: a GIS-embedded approach, Nat. Hazards., 61, 1143–1159, https://doi.org/10.1007/s11069-011-9974-6, 2011.
Couasnon, A., Eilander, D., Muis, S., Veldkamp, T. I. E., Haigh, I. D., Wahl, T., Winsemius, H. C., and Ward, P. J.: Measuring compound flood potential from river discharge and storm surge extremes at the global scale, Nat. Hazards Earth Syst. Sci., 20, 489–504, https://doi.org/10.5194/nhess-20-489-2020, 2020.
Curran, A., De Bruijn, K. M., and Kok, M.: Influence of water level duration on dike breach triggering, focusing on system behaviour hazard analyses in lowland rivers, Georisk Assessment and Management of Risk for Engineered Systems and Geohazards, 14, 26–40, https://doi.org/10.1080/17499518.2018.1542498, 2018.
Eilander, D., Couasnon, A., Ikeuchi, H., Muis, S., Yamazaki, D., Winsemius, H. C., and Ward, P. J.: The effect of surge on riverine flood hazard and impact in deltas globally, Environ. Res. Lett., 15, 104007, https://doi.org/10.1088/1748-9326/ab8ca6, 2020.
Fewtrell, T. J., Bates, P. D., Horritt, M., and Hunter, N. M.: Evaluating the effect of scale in flood inundation modelling in urban environments, Hydrol. Process., 22, 5107–5118, https://doi.org/10.1002/hyp.7148, 2010.
Ganguli, P., Paprotny, D., Hasan, M., Güntner, A., and Merz, B.: Projected Changes in Compound Flood Hazard From Riverine and Coastal Floods in Northwestern Europe, Earths Future, 8, e2020EF001752, https://doi.org/10.1029/2020ef001752, 2020.
Ghanbari, M., Arabi, M., Kao, S. C., and Obeysekera, J.: Climate Change and Changes in Compound Coastal-Riverine Flooding Hazard Along the U.S. Coasts, Earth's Future, 9, e2021EF002055, https://doi.org/10.1029/2021EF002055, 2021.
Ghoshal, D. and Kumar, M.: Himalayan glacier breaks in India, around 125 missing in floods, available at: https://m.bdnews24.com/en/detail/neighbours/1856732, last access: 29 October 2021.
Google Earth: 9.149.0.1, (May 3, 2020), Qianbujing, Shanghai, China, 30∘ N 121∘ E , Maxar Technologies, CNES/Airbus, Eye alt 4841 meter, available at: http://earth.google.com, last access: 28 May 2020.
Jongman, B., Ward, P. J., and Aerts, J. C. J. H.: Global exposure to river and coastal flooding: Long term trends and changes, Global Environ. Chang., 22, 823–835, https://doi.org/10.1016/j.gloenvcha.2012.07.004, 2012.
Jonkman, S. N.: Global perspectives of loss of human life caused by floods, Nat. Hazards., 34, 151–175, https://doi.org/10.1007/s11069-004-8891-3, 2005.
Lian, J. J., Xu, K., and Ma, C.: Joint impact of rainfall and tidal level on flood risk in a coastal city with a complex river network: a case study of Fuzhou City, China, Hydrol. Earth Syst. Sci., 17, 679–689, https://doi.org/10.5194/hess-17-679-2013, 2013.
Moftakhari, H. R., Salvadori, G., AghaKouchak, A., Sanders, B. F., and Matthew, R. A.: Compounding effects of sea level rise and fluvial flooding, Proc. Natl. Acad. Sci. U.S.A., 114, 9785–9790, https://doi.org/10.1073/pnas.1620325114, 2017.
Naulin, M., Kortenhaus, A., and Oumeraci, H.: Reliability-Based Flood Defense Analysis in an Integrated Risk Assessment, Coast. Eng. J., 57, 1540005, https://doi.org/10.1142/S0578563415400057, 2018.
Neal, J., Schumann, G., Fewtrell, T., Budimir, M., Bates, P., and Mason, D.: Evaluating a new LISFLOOD-FP formulation with data from the summer 2007 floods in Tewkesbury, UK, J. Flood. Risk. Manag., 4, 88–95, https://doi.org/10.1111/j.1753-318X.2011.01093.x, 2011.
Vorogushyn, S., Merz, B., Lindenschmidt, K. E., and Apel, H.: A new methodology for flood hazard assessment considering dike breaches, Water Resour. Res., 46, W08541, https://doi.org/10.1029/2009wr008475, 2010.
Wahl, T., Jain, S., Bender, J., Meyers, S. D., and Luther, M. E.: Increasing risk of compound flooding from storm surge and rainfall for major US cities, Nat. Clim. Change., 5, 1093–1097, https://doi.org/10.1038/nclimate2736, 2015.
Yang, L., Scheffran, J., and Qin, H.: Climate-related flood risks and urban responses in the Pearl River Delta, China. Reg. Environ. Change, 15, 379–391, https://doi.org/10.1007/s10113-014-0651-7, 2015.
Yang, Y., Yin, J., Ye, M., She, D., and Yu, J.: Multi-coverage optimal location model for emergency medical service (EMS) facilities under various disaster scenarios: a case study of urban fluvial floods in the Minhang district of Shanghai, China, Nat. Hazards Earth Syst. Sci., 20, 181–195, https://doi.org/10.5194/nhess-20-181-2020, 2020.
Yin, J. and Zhang, Q.: A comparison of statistical methods for benchmarking the threshold of daily precipitation extremes in the Shanghai metropolitan area during 1981–2010, Theor. Appl. Climatol., 120, 601–607, https://doi.org/10.1007/s00704-014-1199-7, 2015.
Yin, J., Yu, D., Yin, Z., Wang, J., and Xu, S.: Modelling the anthropogenic impacts on fluvial flood risks in a coastal mega-city: A scenario-based case study in Shanghai, China, Landscape Urban Plan., 136, 144–155, https://doi.org/10.1016/j.landurbplan.2014.12.009, 2015.
Yin, J., Yu, D., and Wilby, R.: Modelling the impact of land subsidence on urban pluvial flooding: A case study of downtown Shanghai, China, Sci. Total. Environ., 544, 744–753, https://doi.org/10.1016/j.scitotenv.2015.11.159, 2016.
Yin, J., Jonkman, S., Lin, N., Yu, D., and Wang, J.: Flood risks in sinking delta cities: time for a reevaluation?, Earths Future, 8, e2020EF001614, https://doi.org/10.1029/2020EF001614, 2020.
Ying, X., Wang, S. S. Y., and Khan, A. A.: Numerical Simulation of Flood Inundation due to Dam and Levee Breach, in: World Water and Environmental Resources Congress, 23–26 June 2003, Philadelphia, Pennsylvania, United States, 1–9 pp., https://doi.org/10.1061/40685(2003)366, 2003.
Yu, D. and Coulthard, T.J.: Evaluating the importance of catchment hydrological parameters for urban surface water flood modelling using a simple hydro-inundation model, J. Hydrol., 524, 385–400, https://doi.org/10.1016/j.jhydrol.2015.02.040, 2015.
Yu, D. and Lane, S. N.: Urban fluvial flood modelling using a two-dimensional diffusion-wave treatment, part 1: mesh resolution effects, Hydrol Process., 20, 1541–1565, https://doi.org/10.1002/hyp.5935, 2006a.
Yu, D. and Lane, S. N.: Urban fluvial flood modelling using a two-dimensional diffusion-wave treatment, part 2: development of a sub-grid-scale treatment, Hydrol Process., 20, 1567–1583, https://doi.org/10.1002/hyp.5936, 2006b.
Yu, D. and Lane, S. N.: Interactions between subgrid-scale resolution, feature representation and grid-scale resolution in flood inundation modelling, Hydrol Process., 25, 36–53, https://doi.org/10.1002/hyp.7813, 2011.
Yu, D., Yin, J., and Liu, M.: Validating city-scale surface water flood modelling using crowd-sourced data, Environ. Res. Lett., 11, 124011, https://doi.org/10.1088/1748-9326/11/12/124011, 2016.