the Creative Commons Attribution 4.0 License.
the Creative Commons Attribution 4.0 License.
 | 16 Nov 2021
The Mw 7.5 Tadine (Maré, Loyalty Islands) earthquake and related tsunami of 5 December 2018: seismotectonic context and numerical modeling
Bernard Pelletier
Maxime Duphil
Jérôme Lefèvre
Jérôme Aucan
Pierre Lebellegard
Bruce Thomas
Céline Bachelier
David Varillon
On 5 December 2018, a magnitude Mw 7.5 earthquake occurred southeast of Maré, an island of the Loyalty Islands archipelago, New Caledonia. This earthquake is located at the junction between the plunging Loyalty Ridge and the southern part of the Vanuatu Arc, in a tectonically complex and very active area regularly subjected to strong seismic crises and earthquakes higher than magnitude 7 and up to 8. Widely felt in New Caledonia, it was immediately followed by a tsunami warning, confirmed shortly after by a first wave arrival at the Loyalty Islands tide gauges (Maré and Lifou), and then along the east coast of Grande Terre of New Caledonia and in several islands of the Vanuatu Archipelago. Two solutions of the seafloor initial deformation are considered for tsunami generation modeling, one using a non-uniform finite-source model from USGS and the other being a uniform slip model built from the Global Centroid Moment Tensor (GCMT) solution, with the geological knowledge of the region and empirical laws establishing relationships between the moment magnitude and the fault plane geometry. Both tsunami generation and propagation are simulated using the Semi-implicit Cross-scale Hydroscience Integrated System Model (SCHISM), an open-source modeling code solving the shallow-water equations on an unstructured grid allowing refinement in many critical areas. The results of numerical simulations are compared to tide gauge records, field observations and testimonials from 2018. Careful inspection of wave amplitude and wave energy maps for the two simulated scenarios shows clearly that the heterogeneous deformation model is inappropriate, while it raises the importance of the fault plane geometry and azimuth for tsunami amplitude and directivity. The arrival times, wave amplitude and polarities obtained with the uniform slip model are globally coherent, especially in far-field locations (Hienghène, Poindimié and Port Vila). Due to interactions between the tsunami waves and the numerous bathymetric structures like the Loyalty and Norfolk ridges in the neighborhood of the source, the tsunami propagating toward the south of Grande Terre and the Isle of Pines is captured by these structures acting like waveguides, allowing it to propagate to the north-northwest, especially in the Loyalty Islands and along the east coast of Grande Terre. A similar observation results from the propagation in the Vanuatu islands, from Aneityum to Efate.
- Article
(15942 KB) - Full-text XML
- BibTeX
- EndNote


At 04:18:08 UTC on 5 December 2018 (15:18:08 LT – local time in New Caledonia – UTC+11), a major earthquake of magnitude Mw 7.5 occurred 165 km east-southeast of Tadine, Maré, the southernmost inhabited island of the Loyalty Islands archipelago (Fig. 1). It was strongly felt in New Caledonia (Loyalty Islands and Grande Terre) as far as Nouméa, more than 300 km west of the source (Roger et al., 2019a, b, c), while the effects were weaker in Port Vila, the capital of Vanuatu, about 470 km to the north according to a CBS News interview of Dan McGarry, media director at the Vanuatu Daily Post. There is no report of damage linked to the earthquake.
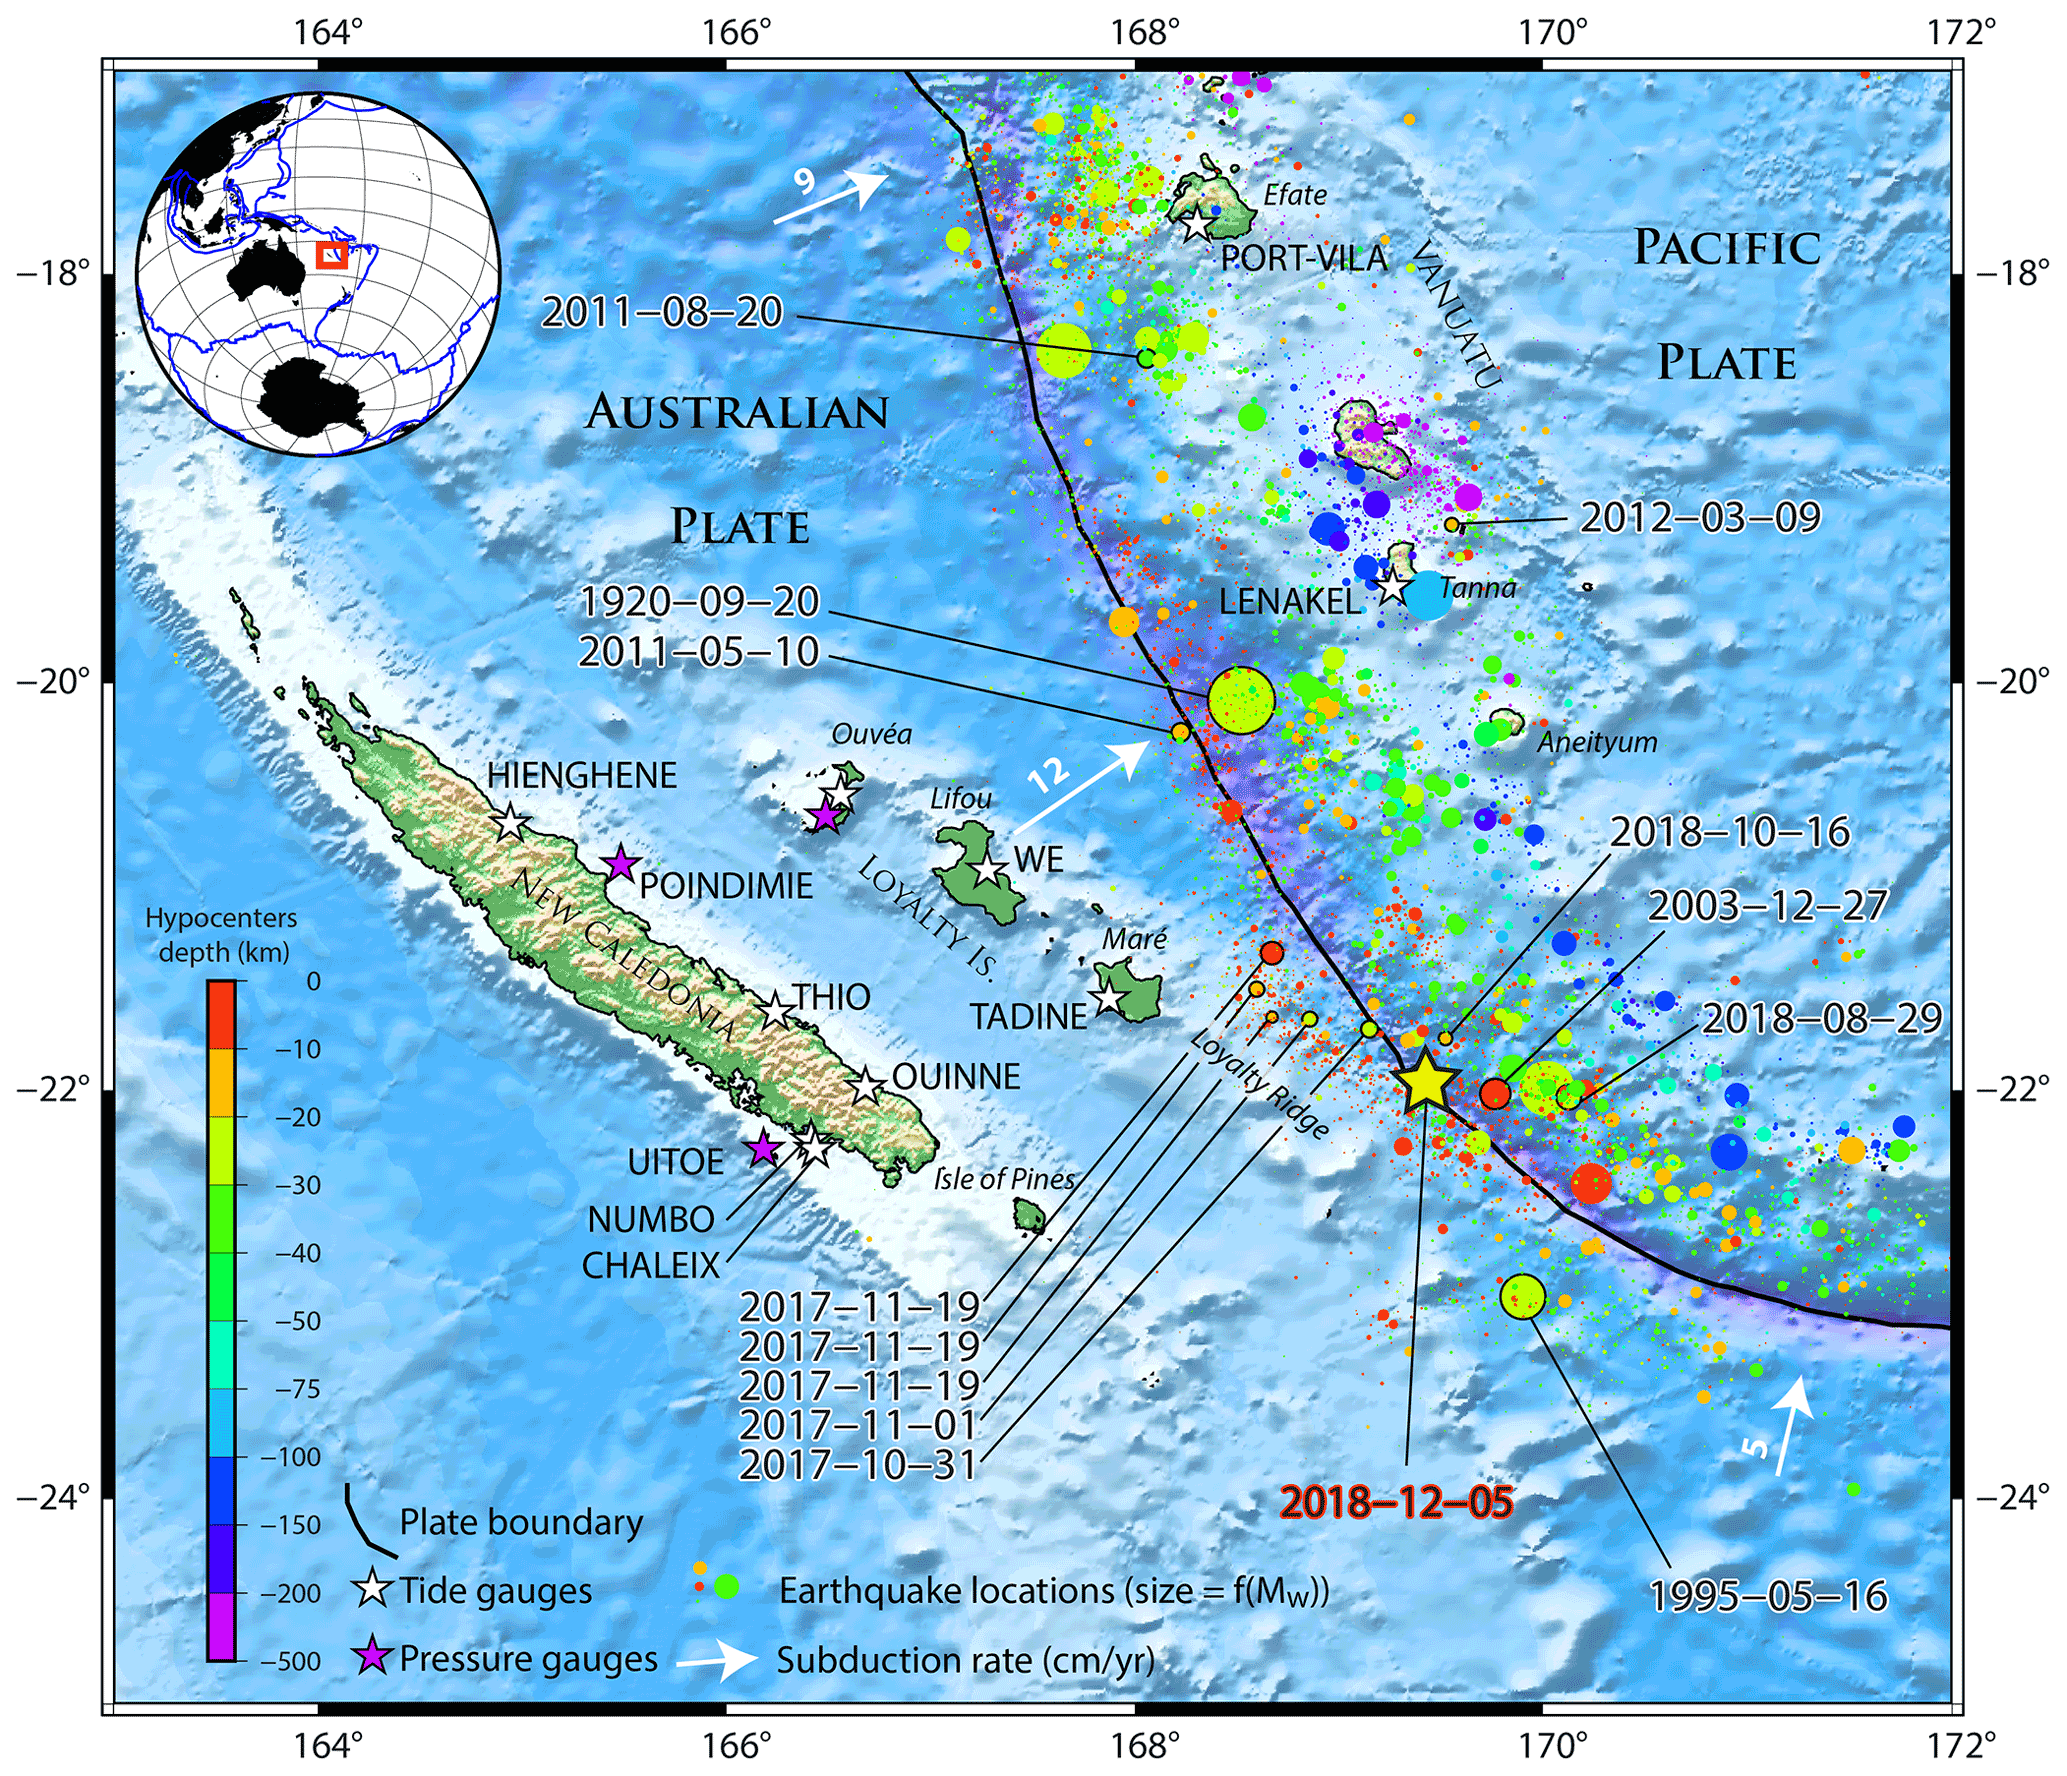
Figure 1New Caledonia and the south Vanuatu subduction zone. The colored dots represent the seismicity from the USGS database for the period from 1 January 1900 to 24 January 2019, with the size of dots being proportional to the event's magnitude. Tsunamigenic earthquakes recorded in New Caledonia (Roger et al., 2019b; US Geological Survey, 2019) are highlighted with black-outlined circles and linked to dates. The black line symbolizes the Vanuatu Trench. The white arrows symbolize the subduction directions and rates of the subducting Australian Plate under the Pacific Plate. Tide and pressure gauges able to record tsunami waves are symbolized with white and purple stars respectively. The yellow star indicates the 5 December 2018 earthquake's epicenter. The study area is located within the red rectangle in the southwestern Pacific Ocean.
Within minutes, its location and magnitude were determined by the New Caledonian Seismic Network (http://www.seisme.nc, last access: 11 November 2021, https://bit.ly/2IMkmgM, last access: 11 November 2021) (Mw 7.6; 22.01∘ S, 169.33∘ E; 30 km), by USGS (Mw 7.5; 21.968∘ S, 169.446∘ E; 10 km) and by the Global Centroid Moment Tensor (GCMT) project as quick CMTs (Mw 7.5; 21.95∘ S, 169.25∘ E) (Dziewonski et al., 1981; Ekström et al., 2012). The maximum distance between these three locations is ∼15 km, in agreement with the acceptable location errors between the different observatories. The revised hypocenter location of the event provided by USGS, GCMT and GEOSCOPE (http://geoscope.ipgp.fr, last access: 11 November 2021) is 21.950∘ S, 169.427∘ E – 10 km; 21.95∘ S, 169.25∘ E – 17.8 km; and 21.969∘ S, 169.446∘ E – 12 km respectively.
The seismic moment Mo of this event has been evaluated to be 2.49×10²⁰ N m−1 (Mw 7.53) by USGS, 2.52×10²⁰ N m−1 by the GCMT project (Mw 7.5) and 2.95×10²⁰ N m−1 (Mw 7.58) by the SCARDEC method (GEOSCOPE).
Considering the strong magnitude of this shallow earthquake, a tsunami alert was released locally by the IRD (Institut de recherche pour le développement) seismological laboratory to the New Caledonia civil security service (DSCGR) and regionally by the NOAA PTWC (Pacific Tsunami Warning Center) shortly after the earthquake occurred. A tsunami was confirmed by real-time tide gauge measurements within minutes at first in the Loyalty Islands and then in most places in the New Caledonia–Vanuatu region.
This earthquake has been added to the list of local earthquakes reported in the past in the south Vanuatu subduction zone, notably the two shocks that triggered major tsunamis in the Loyalty Islands on 28 March 1875 and 20 September 1920 (Sahal et al., 2010) with estimated magnitudes of 8.1–8.2 and 7.5–7.8 respectively (Ioualalen et al., 2017) and the Mw 7.7 17 May 1995 event which occurred close to and south of the 5 December 2018 event showing a similar focal mechanism (i.e., normal faulting in the plunging plate), as explained hereinafter. The tsunami generated by the 1995 earthquake was well observed at the entrance of the first lagoon and on the island of Erakor near Port Vila, located south of Efate, Vanuatu (Lardy, 1995).
This study aims to (1) simulate the 5 December 2018 tsunami in New Caledonia and Vanuatu, comparing the computed maximum amplitudes and the synthetic waveforms to those observed and/or recorded on tide gauges, and (2) discuss the role of earthquake source parameters through sensitivity tests. The first part of the article deals with the particular seismotectonic context of the region between New Caledonia and Vanuatu and its ability to trigger tsunamigenic earthquakes. The second and third parts focus on the 5 December 2018 tsunami observations and records and tsunami numerical modeling respectively, and the fourth and fifth parts present and discuss the simulation results and provide study prospects.
2.1 Junction of the Loyalty Ridge and the Vanuatu subduction zone
The 5 December 2018 Mw 7.5 earthquake was located southeast of Maré (Loyalty Islands, New Caledonia), immediately west of the southern part of the Vanuatu (former New Hebrides) Trench in the junction area between the Loyalty Ridge and the Vanuatu Arc (Fig. 1). The Vanuatu Trench and Vanuatu Arc mark a segment of the convergence zone between the two major plates of the southwestern Pacific region (Australian and Pacific plates).
The junction area around 22∘ S is very active tectonically (Monzier et al., 1984). The plunging Loyalty Ridge supported by the Australian Plate enters and partially clogs the trench. Considering the geometry of the Loyalty Ridge, the strike of the trench and the current orientation and rate of convergence (12 cm yr−1 on an ENE–WSW plane), the subduction/collision of the ridge tends to increase and would have started around 0.3 Ma (Monzier et al., 1990). The data obtained by multibeam mapping and submersible diving (Daniel et al., 1986; Monzier et al., 1989, 1990) at the junction zone (between 21.5 and 22.2∘ S) indicate (1) a spectacular collapse of the ridge as it approaches the trench (reef limestones affected by normal faulting are at 4300 m depth), (2) a migration of the deformation front on the outer wall of the trench with the unusual presence of folds, (3) a narrowing and an eastward retreat of the trench by around 20 km relatively to its supposed initial position, (4) an uplift of the inner wall, and (5) the development of E–W-trending scarps suggesting left-lateral strike-slip motion. The rapid variation in the convergence vector and the presence of numerous left-lateral strike-slip-faulting earthquakes around 22∘ S, at the front of the junction zone and along or at the rear of the Matthew–Hunter Arc segment, also suggest that the subduction/collision of the Loyalty Ridge causes the development of a new left-lateral plate boundary through the overlapping plate, connecting the trench to the spreading center of the North Fiji Basin and thus isolating a microplate (the Matthew–Hunter microplate) at the southern end of the arc (Louat and Pelletier, 1989). The rate of motion on this transform fault zone was estimated by these authors at 10.5 cm yr−1. However, its precise geometry and location are not known, and several variants have been proposed (Louat and Pelletier, 1989; Maillet et al., 1989; Monzier, 1993; Patriat et al., 2015). As these authors have partially indicated, it is likely that this left-lateral shear zone is complex and that a bookshelf tectonics occurs at the southernmost part of the Vanuatu Trench (21–23∘ S), by associating with the main sinistral motion and dextral and extensive movements along NW–SE-trending faults and pull-apart basins.
Series of GPS geodetic measurements on the Loyalty Ridge (Walpole, Maré, Lifou) and the Vanuatu Arc (Matthew, Hunter, Aneityum, Tanna) sites from 1992 to 2000 have confirmed the presence of the left-lateral transform fault zone (Pelletier et al., 1998; Calmant et al., 2003). The data indicate that the convergence rate (Australia fixed) of 120 mm yr−1 at 248∘ N of the ridge–arc junction (Tanna, Aneityum) is partitioned toward the south into a convergence rate of 50 mm yr−1 perpendicular (197∘ N) to the trench (Matthew) and with a sinistral movement of 90 mm yr−1 along an E–W-trending transform zone, cross-cutting the arc around 22∘ S and thus isolating the Matthew–Hunter microplate at the southern end of the arc (Calmant et al., 2003). In addition, GPS-derived vectors of the New Caledonia sites are in good agreement with the movement of the Australian Plate, suggesting therefore no significant intra-plate deformation between islands of the New Caledonia Archipelago. The termination of the southern Vanuatu back arc basins north of the junction zone, the increase in seismic activity and the shift toward the trench of the seismogenic zone in front of the junction zone, the short length of the Wadati–Benioff plane south of Aneityum (less than 200 km), the weak development of the volcanic arc at the front of the junction zone, the particular chemistry of the volcanism of the termination of the arc south of the ridge–arc junction (calco-alkaline magnesian and boninitic series), and the offset of the central spreading axis in the North Fiji Basin have also been linked to the subduction/collision of the Loyalty Ridge (Monzier et al., 1984, 1990; Louat and Pelletier, 1989; Maillet et al., 1989; Monzier, 1993).
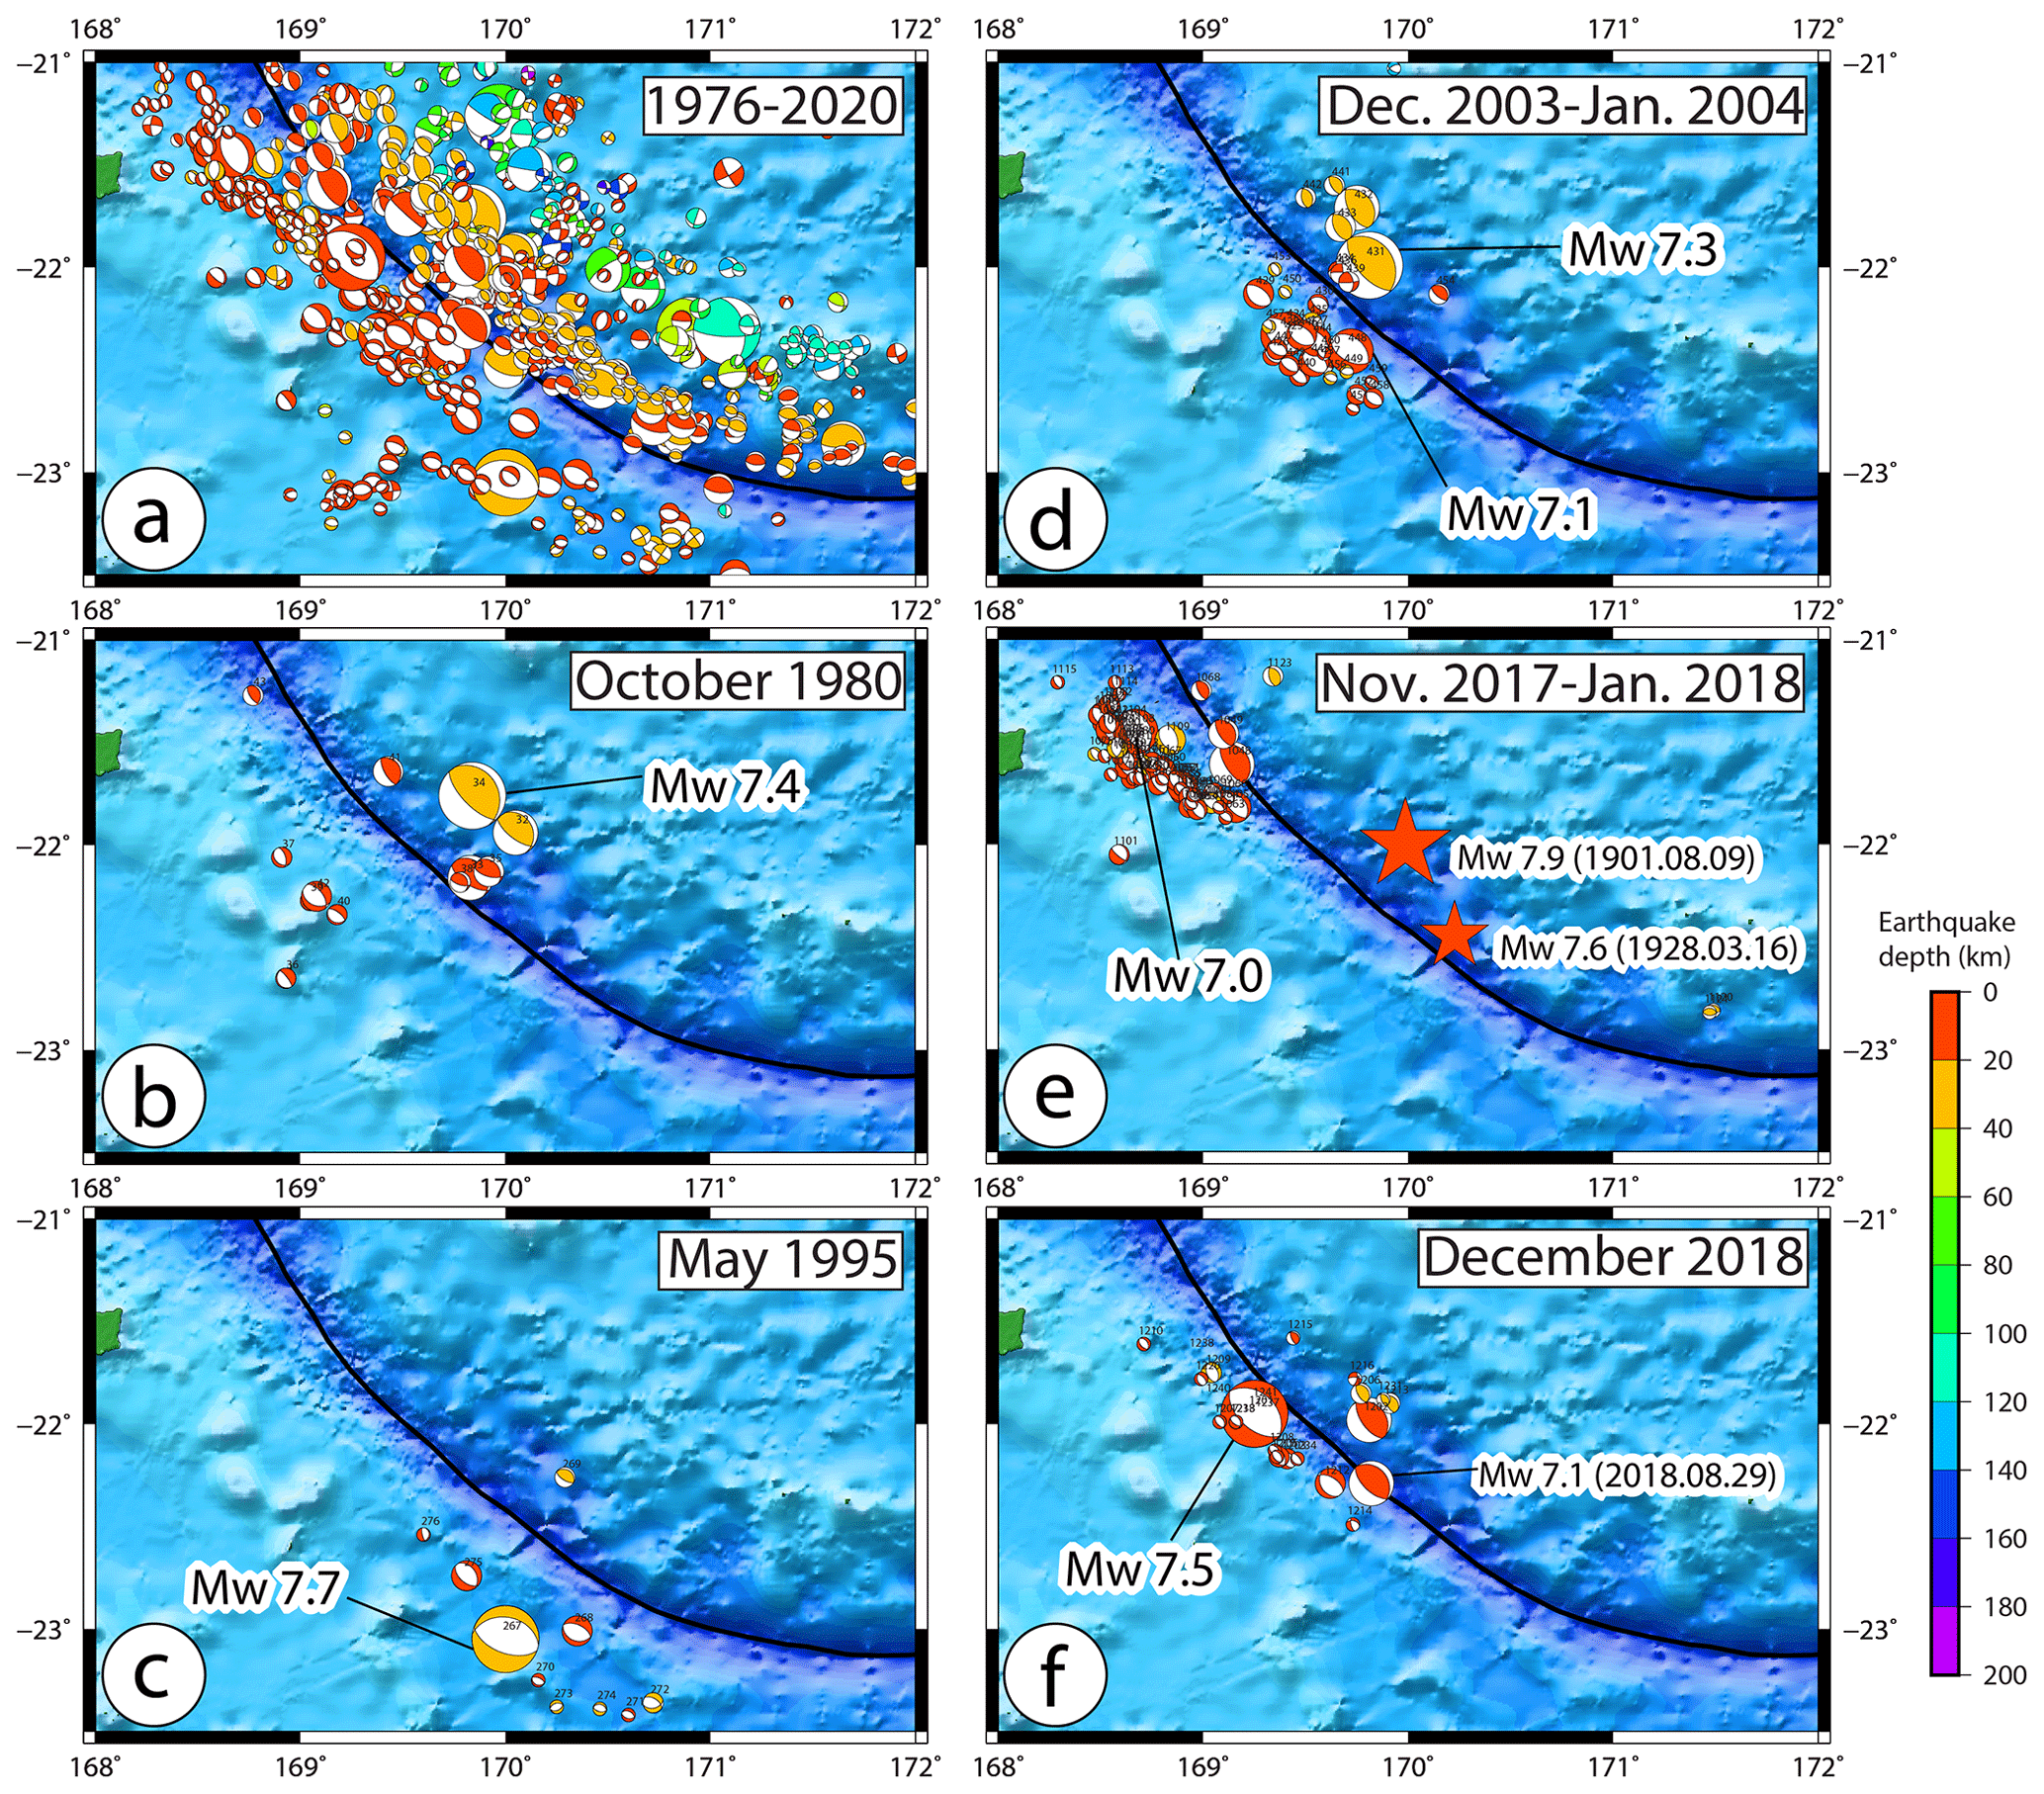
Figure 2Focal mechanism solutions from the GCMT project plotted for the period 1976–2020 with focus on five different seismic crises showing nine large shallow earthquakes at the Loyalty Ridge–Vanuatu Arc subduction zone.
2.2 Seismicity at the Loyalty Ridge–Vanuatu Arc junction
The Loyalty Islands region and especially the Loyalty Ridge–Vanuatu Arc junction area around 22∘ S, 169.5∘ E are seismically very active. Nine large shallow earthquakes with magnitudes equal to or greater than 7 have occurred in this junction area since 1900. The largest was a M 7.9 earthquake on 9 August 1901, located at 22∘ S, 170∘ E (note that there are doubts about its exact location). A M 7.6 earthquake occurred on 16 March 1928 at 170.24∘ E, 22.45∘ S. The other seven occurred during seismic crises in the last 40 years: a Mw 7.4 earthquake on 25 October 1980, a Mw 7.7 earthquake on 16 May 1995, a Mw 7.3 earthquake on 27 December 2003, a Mw 7.1 earthquake on 3 January 2004, a Mw 7.0 earthquake on 29 November 2017, a Mw 7.1 earthquake on 29 August 2018 and a Mw 7.5 earthquake on 15 December 2018. Among these seven M 7+ events, four occurred to the west of the trench, as the result of shallow normal faulting within the downgoing Australian Plate, including the two largest Mw 7.7 and 7.5 events.
All earthquakes occurring during the crises and the period 1976–2020 and having a focal mechanism solution (CMTs) have been plotted in Fig. 2a.
In October 1980 more than 100 events were recorded by the worldwide network (Vidale and Kanamori, 1983). The sequence includes 12 M 5.4+ events (Fig. 2b). Six of them including the Mw 7.4 main shock and two Mw 6.5+ foreshocks are thrust-faulting earthquakes east of the plate boundary, and five of them are normal-faulting earthquakes in the downgoing plate west of the trench. The sequence started with the three main thrust fault events and continued with the alternating of normal and thrust fault events.

Figure 3Tsunami maximum wave amplitude of the 5 December 2018 tsunami in the southwestern Pacific region. Monitored amplitudes are represented with colored circles, while those coming from witness observations are represented by diamonds.
During the May 1995 seismic crisis 13 events with magnitude greater than 5 were located around 23∘ S, 170∘ E (Fig. 2c). Most of them are of normal faulting type southwest of the trench including the Mw 7.7 main shock, 125 km to the southeast of the December 2018 event. This Mw 7.7 event is one of the largest normal-faulting earthquakes known in the world in a plunging plate on the trench outer slope (Rouland et al., 1995). In detail, this earthquake and its associated aftershocks are located at the foot of the Loyalty Ridge in the adjacent South Fiji Basin. These normal-type events affecting the crust of the South Fiji Basin (from 169.75 to 171∘ E) are farther from the axis of the trench relatively to the normal-faulting events of the December 2003 and 2018 sequences which are on the Loyalty Ridge (169.5∘ E). This difference could be explained by a different rheological behavior (more buoyancy of the ridge).
Between 25 December 2003 and 5 January 2004, a shallow seismic swarm very similar to the one of 1980 occurred (same zone, same magnitude and same spatial organization of fault types; Fig. 2d) (Régnier et al., 2004). More than 1000 events were recorded by the local IRD seismic network, among which about 270 were recorded by the worldwide network. Those include 37 events with magnitude greater than 4.9, 12 with magnitude equal to or greater than 6, and 2 with magnitude greater than 7. The sequence started with normal-faulting events with magnitude of up to 6.8 west of the trench, continued with several interplate thrust-faulting events including the large Mw 7.3 event on 27 December located immediately to the east of the trench, and ended by normal-faulting events including a large Mw 7.1 event on 3 January located southwest of the trench.
An important seismic crisis occurred from November 2017 to January 2018 with several thousands of events located about 70–100 km northwest of the December 2018 swarm (Fig. 2e). Among them, 350 M 4+ events have been recorded, and most of the 80M 4.7+ events are normal-faulting earthquakes located west of the trench along the northern edge of the Loyalty Ridge. However, in detail, the sequence began with a Mw 6.7 earthquake and then a Mw 5.9 thrust-faulting earthquake on 31 October 2017 and continued with numerous normal-faulting foreshocks and the Mw 7.0 normal-faulting main shock on 19 November 2017.
The 5 December 2018 Mw7.5 earthquake can be considered part of a seismic crisis that began on 29 August 2018 with a Mw 7.1 interplate thrust-faulting earthquake located southeastward (Fig. 2f). The Mw 7.5 normal-faulting main event located west of the trench was preceded 4 min before by a Mw 6.3 event (magnitude estimated as 5.8 by the local Oceania Regional Seismic NETwork (ORSNET, http://www.orsnet.org/, last access: 11 November 2021)) and more interestingly was followed 2 h 25 min later by a Mw 6.8 interplate thrust faulting east of the trench. During December 2018, about 89, 49 and 18 aftershocks of M 4+, M 4.5 and M 5+ respectively were recorded by the local network.
It appears clearly that the successive seismic crises were quite similar and included both interplate-thrust-fault-type earthquakes northeast of the trench and normal-fault-type events southwest of the trench in the plunging plate (Fig. 2). The strong spatiotemporal pattern between these two types of event suggests that static stress interactions may account for triggering non-distant earthquakes and normal faulting on the plunging plate, leading to interplate thrust faulting or the reverse.
The tsunami following the 5 December 2018 Mw 7.5 earthquake was recorded not only by tide gauges in New Caledonia and Vanuatu but also at a regional scale (Fig. 3). In addition, several observations of tsunami waves in locations not equipped with sensors provided important information to consider in the study of the event (Figs. 3 and 4).
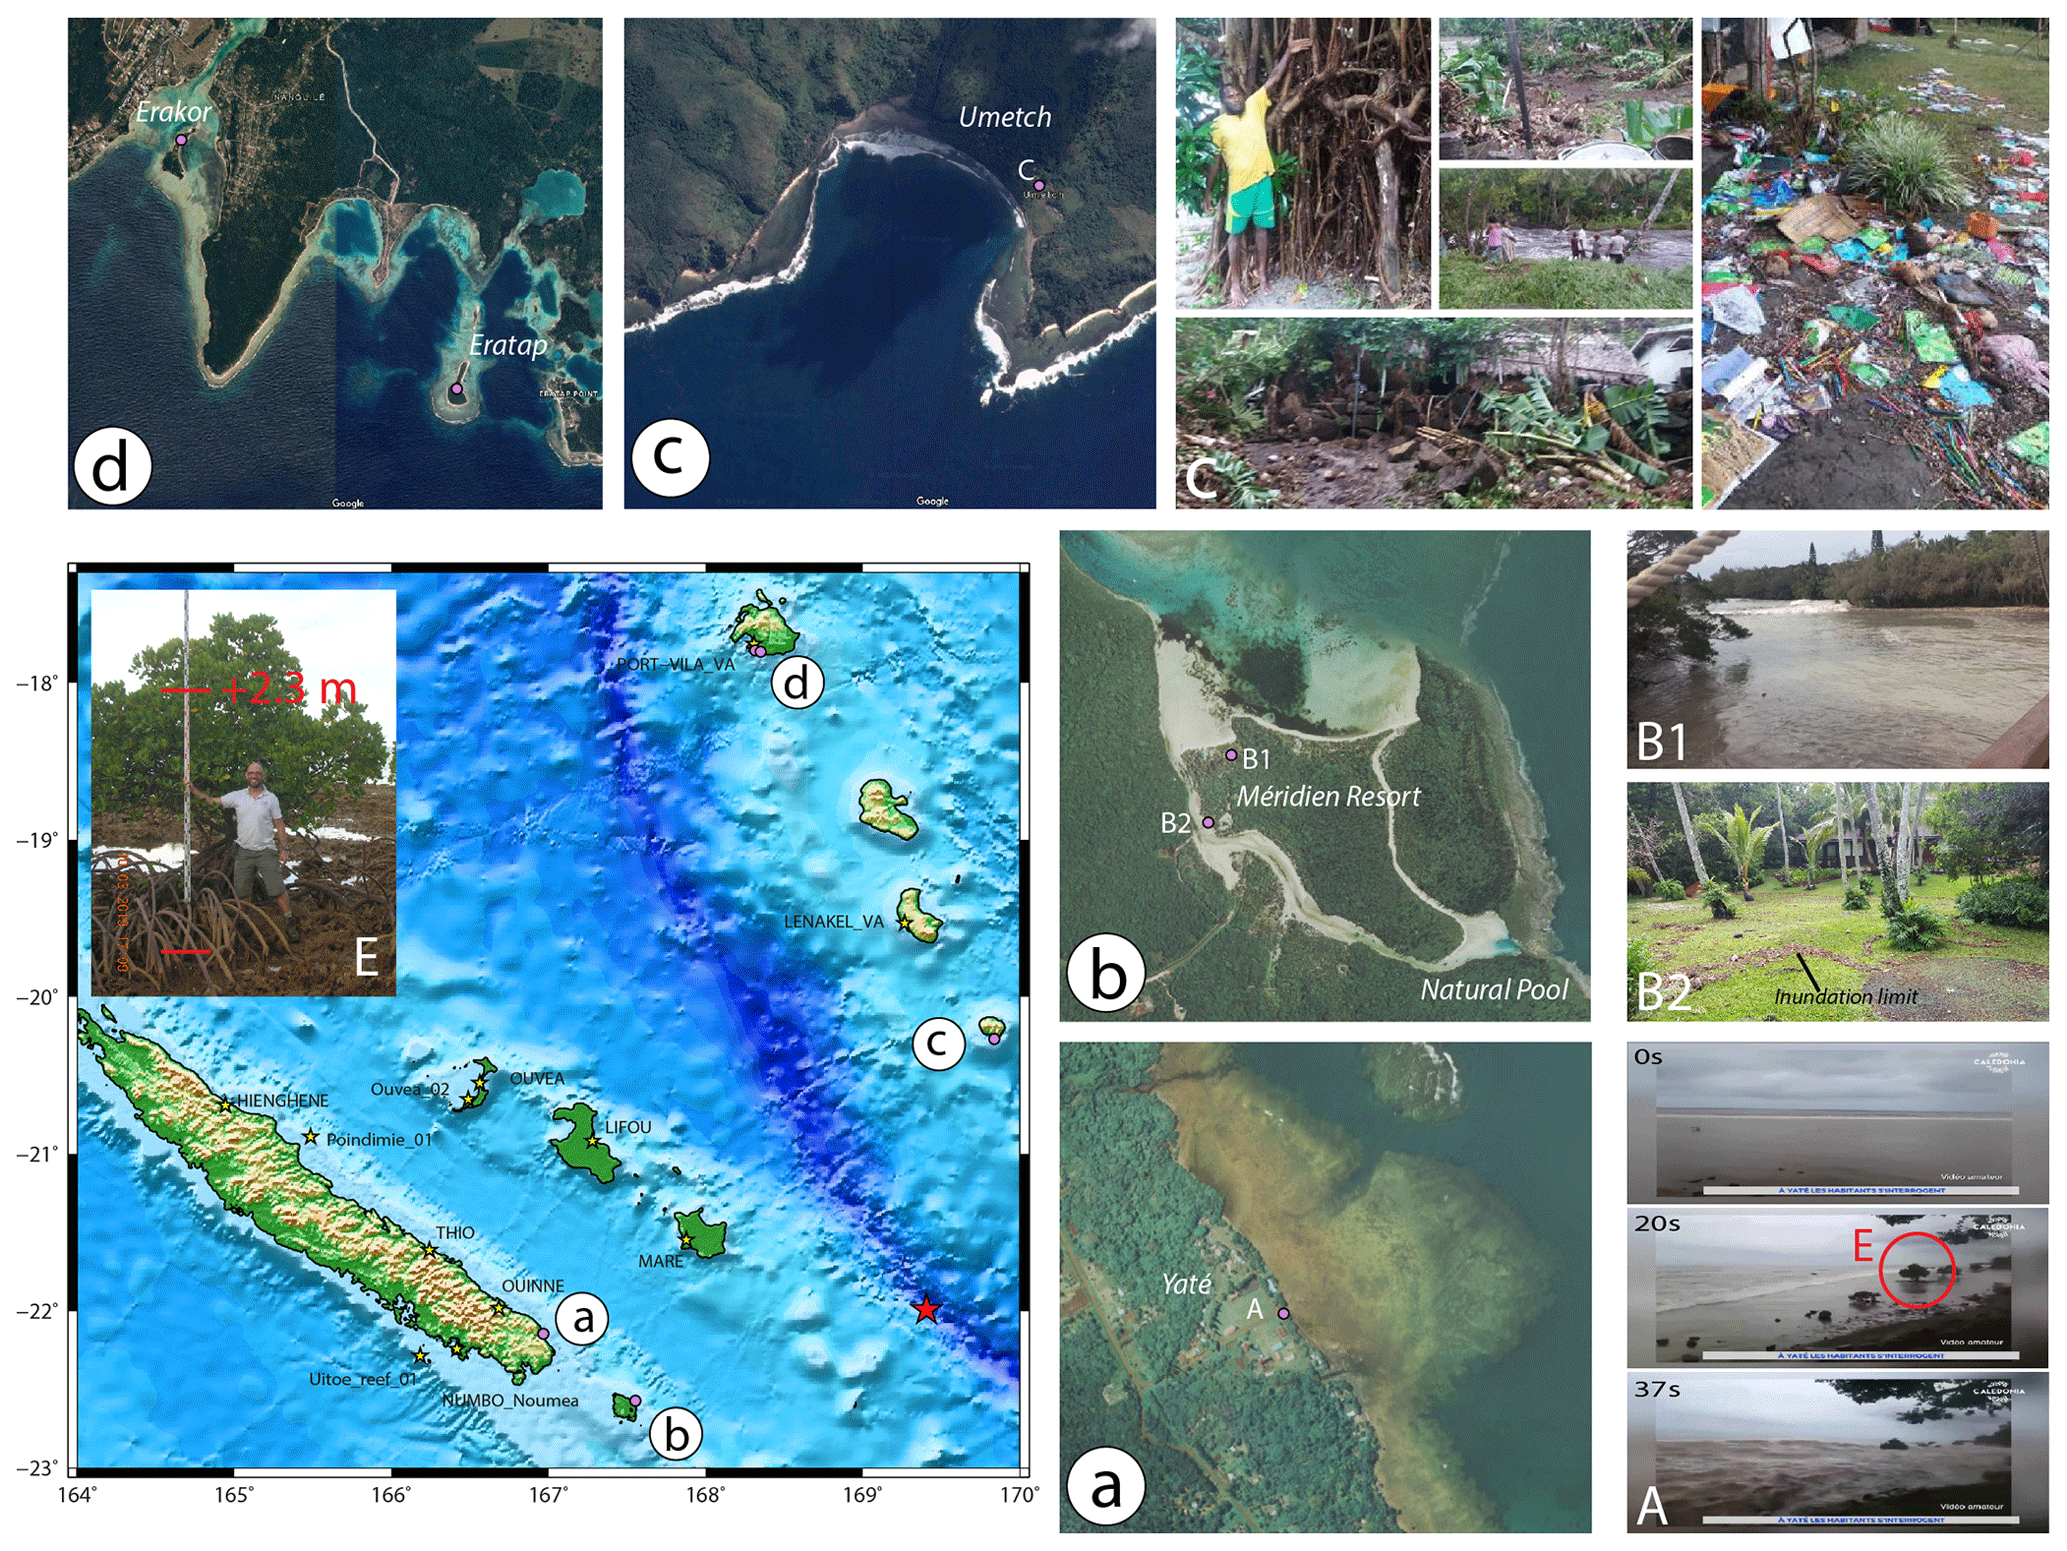
Figure 4Observations of the tsunami arrival and height in several places in New Caledonia and Vanuatu. (a) Yaté; (b) Pine Island – Le Méridien resort; (c) south Aneityum; (d) south of Port Vila, south Efate. (Photo credits – a, b: © Georep New Caledonia 2021; c, d: © Google Earth 2021 – CNES/Airbus; A: Caledonia TV; B1, B2: Moana Bretault; C: Vanuatu Meteorology and Geohazards Department; E: authors.)
3.1 Tide gauge records
The tide gauge of the island of Maré, located in Tadine Harbor on the southwest coast of the island, was the first to record the tsunami signal at 04:43 UTC (15:43 LT – UTC+11), 25 min after the main shock even though local people reported an earliest arrival at the southeasternmost village (Kurin) of this island ∼15 min after the earthquake. Then, the wave train reached the other tide gauges located in New Caledonia (04:43 UTC in Wé, Lifou; 05:11 UTC in Ouinné; 05:10 UTC in Thio; 05:27 UTC in Hienghène) as well as several pressure gauges like in Poindimié, on the east coast of New Caledonia. According to Roger et al. (2019b) for what concerns New Caledonia only, a maximum tsunami height of ∼60–70 cm was recorded by the Ouinné tide gauge.
In Vanuatu, the tsunami reached the tide gauge located at Lenakel Harbor (the island of Tanna) at 04:41 UTC, showing a maximum height of ∼1.5 m (amplitude of ∼75 cm a.s.l.). On Efate (05:06 UTC in Port Vila), the tsunami was also recorded on the tide gauge located at Port Vila where it reached a maximum height of ∼50 cm (maximum amplitude of ∼25 cm a.s.l.).
The tsunami was also recorded by tide gauges in other locations of the southwestern Pacific region, as far as Port Kembla, Australia, about 2200 km away from the source; North Cape, New Zealand (∼1400 km southward); or Pago Pago in American Samoa (more than 2250 km northeastward). As far as known, except in New Caledonia and Vanuatu, it never reached more than 30 cm high. Figure 3 shows the locations of the different tide gauges that were able to record the tsunami within the southwestern Pacific region and illustrates the recorded maximum wave amplitudes obtained after de-tiding the time series coming from different origins.
For Maré, Ouinné, Thio and Hienghène, the data come directly from the raw dataset of the pressure sensors. For Lifou, the data have been provided by SHOM (the hydrographic service of the French navy, http://refmar.shom.fr/en/lifou, last access: 11 November 2021). The data used for Lenakel and Port Vila as well as places outside New Caledonia and Vanuatu come from the IOC database (http://www.ioc-sealevelmonitoring.org/, last access: 11 November 2021), and the data for Poindimié come from a local New Caledonia coastal water monitoring project (ReefTEMPS project, http://www.reeftemps.science/en/data/, last access: 11 November 2021; Varillon et al., 2018).
Note about the tide
The arrival time in Tadine Harbor corresponds to 48 min before high tide (high tide at 16:30 LT) and about 1 or 2 min after high tide in Hienghène (northeast of Grande Terre, New Caledonia) where high tide was at 16:25 LT and the tsunami arrival was recorded at 16:26–16:27 LT.
3.2 Eyewitnesses' observations
In the aftermath of this event, two videos showing the tsunami arrival at two different locations were collected.
The first video from Yaté (Fig. 4a), on the southeast coast of Grande Terre and circulating on social networks the day of the event, is very informative. It shows the arrival of the tsunami over the fringing reef shelf exposed out of the water by a first important withdrawal of the sea between ∼100 and 200 m; note that the sea had nearly reached high tide at the moment of the tsunami arrival with a predicted maximum water level of 1.55 m at 16:31 LT at Ouinné, the nearby tide gauge, corresponding to a water depth of ∼1.2–1.3 m over the reef shelf in Yaté. Two quantitative pieces of information come from the analysis of the video. The first one is an estimate of the tsunami speed of ∼5 to 10 m s−1 (18 to 36 km h−1). The second one is the maximum tsunami height of ∼2.3 m reached in ∼20 s (after the withdrawal), derived using one isolated mangrove tree exploited as a flood scale afterwards (Fig. 4E).
The second video and related pictures show the tsunami arrival and its consequences at the resort of Le Méridien (Fig. 4b), the Isle of Pines, the southernmost island of New Caledonia, and were provided courtesy of Moana Bretault (technical director of the resort of Le Méridien of the Isle of Pines). The video shows the tsunami traveling into the shallow channel that encircles the resort complex and its surrounding (Fig. 4B1). With the help of aerial orthophotos (government of New Caledonia, tile no. 55-17-IV, https://georep-dtsi-sgt.opendata.arcgis.com/pages/orthophotographies, last access: 11 November 2021), one can derive the tsunami speed in the channel of around 5 m s−1 (18 km h−1). The pictures were taken after the tsunami and reveal the damage to several bungalows and around the swimming pool and show the run-up extent of the waves (Fig. 4B2).
In Vanuatu, the tsunami was reported in several places from the island of Aneityum in the south to the islands of Tanna and Efate. It reached Aneityum first, where the impact was probably been the worst in the whole region affected by the tsunami; the effects were severe especially in the Umetch area where it washed the coast and the plantations with waves reaching ∼4 m (Tari and Siba, 2018) and penetrated more than 200 m inland (Vanuatu Daily Post, 6 December 2018, https://www.dailypost.vu/news/tsunami/article_49e902fc-af1e-5b8a-8f1c-2c6542c55e3a.html, last access: 11 November 2021) as shown in Fig. 4c, leaving people homeless. It also badly damaged Mystery Island and its airport to the southwest of Aneityum, a major source of income for the island. Other places like Anelghowhat also experienced the tsunami but without important damage as reported in the Vanuatu Daily Post (8 December 2018). Then the tsunami reached Tanna where it was recorded by the Lenakel tide gauge as reported hereinabove, but it was also been reported by the manager of Ipikel, a village on the southeastern coast of the island (Sulphur Bay), as having reached the first houses without any damage, about 80 m from the shoreline and ∼1.5 m high (Isaac, manager of Ipikel, personal communication, 2019). On Efate, witnesses reported a small inundation on the island of Erakor, south of Port Vila (Fig. 4d).
In this section, details about the Digital Elevation Model (DEM) used in computational grid generation, models used to simulate bottom deformation, tsunami generation and propagation and sensitivity tests to detail of the rupture model are presented.
4.1 Input data
4.1.1 Bathymetric grids
It is well known that a tsunami's behavior is dependent upon bathymetric features and coastal geometries (e.g., Matsuyama, 1999; Hentry et al., 2010; Yoon et al., 2014). When it approaches coastlines or seamounts, the wave shoaling leads to the rising up of the amplitude and slows down the tsunami as the water depth reduces. It is even worse when the tsunami enters harbors, bays, lagoons or fjords able to produce resonance, a phenomenon particularly well studied during the last 2 decades (e.g., Barua et al., 2006; Rabinovich, 2009; Roger et al., 2010; Roeber et al., 2010; Bellotti et al., 2012; Vela et al., 2014; Aranguiz et al., 2019). It is also possible that a resonant behavior occurs between neighboring islands as happened in Hawaii during the 2006 Kuril tsunami (Munger and Cheung, 2008).
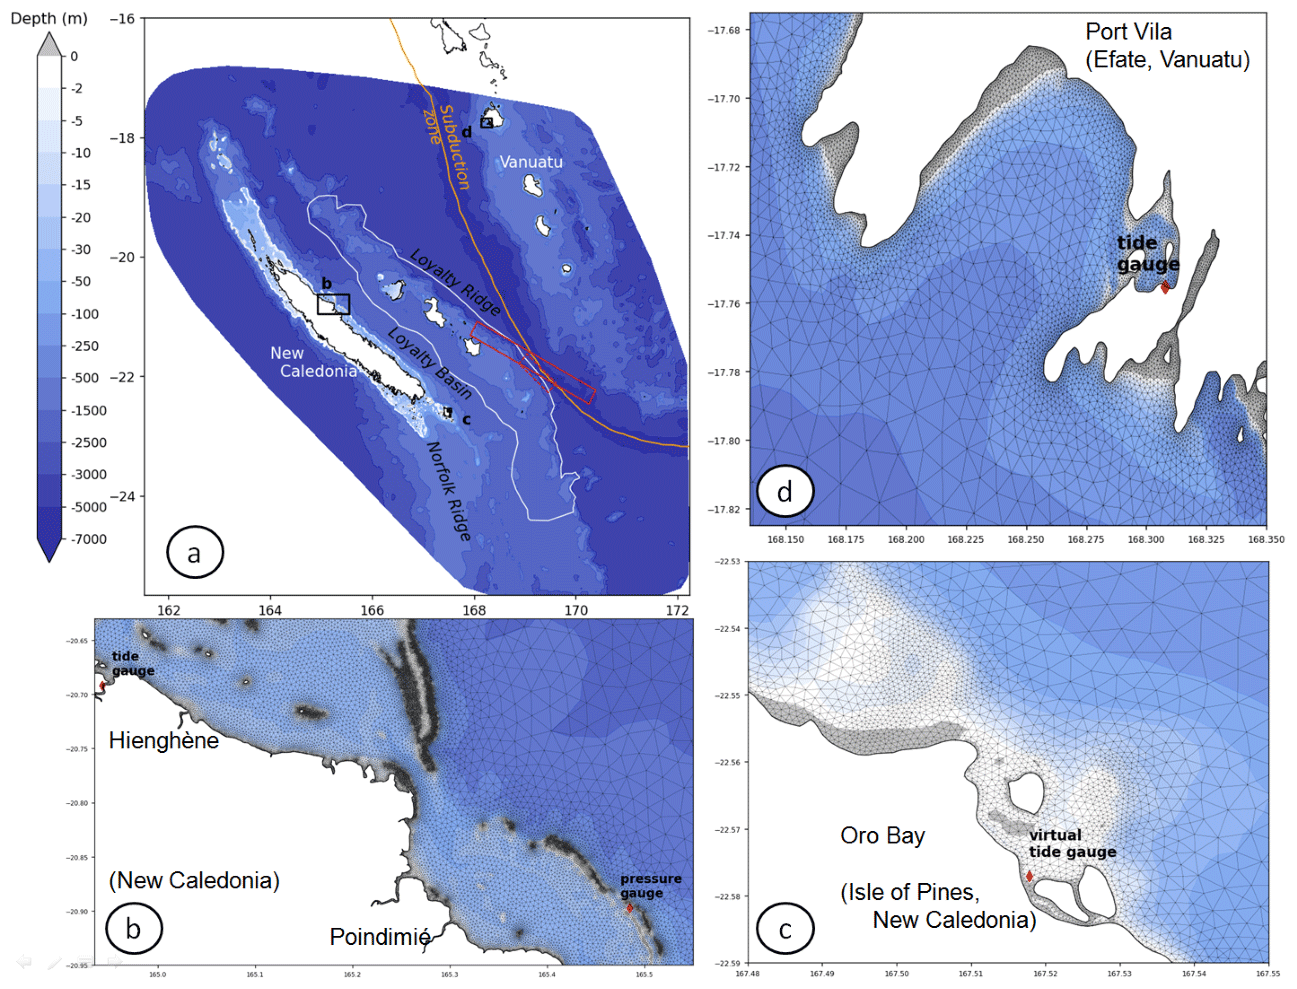
Figure 5Triangular irregular network (TIN) DEM including New Caledonia and southern Vanuatu islands. The three insets show mesh details and the location of some gauges (see black boxes b–d for exact locations). In (a), extents of both the non-uniform and uniform slip models considered in this study are displayed with solid and dashed red lines respectively. The white contour indicates the area of the Loyalty Ridge where the ocean bottom is modified to further investigate the impact of this ridge on the wave propagation (see Discussion and Fig. 10).
For these reasons, it is necessary to model tsunami propagation on bathymetric grids keeping the most relevant details. There are two main traditional downscaling strategies in wave and tsunami modeling. One uses a sequence of nested structured-grid models; the other relies on a single unstructured-grid model. Both techniques aim at obtaining high-resolution wave fields in shallow areas and provide similar results (Harig et al., 2008; Pallares et al., 2017), even though several studies have highlighted that the use of only one unstructured mesh grid for tsunami modeling provides better reproduction of tsunami observations and records in comparison to nested-grid-scheme use (e.g., Harig et al., 2008; Shigihara and Fujima, 2012). When considering the presence of many archipelagos forming the Melanesian volcanic arc (Solomon Islands and Vanuatu, Fig. 3) and peculiar details along New Caledonia's coastline (Fig. 4), the unstructured-grid method provides multiple advantages. This technique allows more flexibility in mesh design and can capture more coastline details than regular meshes at the same computational cost.
The bathymetric grid is an unstructured mesh forming a triangular irregular network (TIN) DEM (Fig. 5) with varying mesh size (from 5 m along the coastline to 2150 m in the deep ocean, with a median value of 70 m, corresponding to the target size for grid resolution along the coastline), used for calculation of tsunami generation, propagation and interaction with the shallow-water features.
The TIN DEM generation was made with Shingle 2.0 (Candy and Pietrzak, 2018), an automatic-grid-generation algorithm, using (1) the Smith and Sandwell (1997) v 8.2 dataset; (2) an extended ∼180 m resolution DEM covering the whole economic zone of New Caledonia and Vanuatu, based on single-beam and multibeam echosounder data and produced especially for the assessment of tsunami hazard in New Caledonia; and (3) 10 m resolution data on harbors where tide gauges and/or witnesses' observations are located. These latest data come from digitized nautical charts, aerial picture interpretation and multibeam bathymetric surveys.
A variable mesh size function is designed to capture the evolution of the tsunami wave with a spatial discretization of 30 points per wavelength. Along the coastline or places with shallow features and gauge stations, additional mesh refinement rules are imposed in the mesh size function. Figure 5b–d illustrate the increase in spatial resolution when approaching the barrier reef and the coastline.
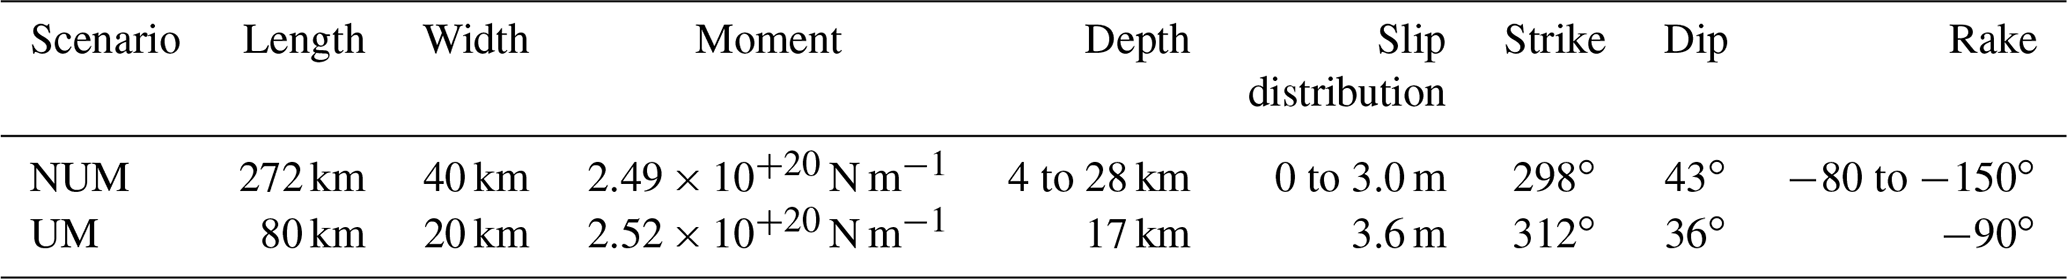
Table 1Rupture parameters used for each scenario NUM (non-uniform fault model) and UM (uniform slip model).
4.1.2 Initial deformation
The location of the 5 March 2018 earthquake and the different focal mechanism solutions indicate that the earthquake was the result of shallow normal faulting along a fault plane trending NW–SE within the plunging Australian Plate on the northern border of the Loyalty Ridge. USGS, GCMT and GEOSCOPE (SCARDEC) propose a magnitude Mw 7.5 to 7.6 and parameters for the rupture (strike, dip, rake) of [298, 43, −111∘], [312, 36, −90∘] and [297, 55, −108∘] respectively.
Analysis of seismic data by USGS indicates a rupture duration of about 50 s and three phases of displacement during the rupture (https://earthquake.usgs.gov/earthquakes/eventpage/us1000i2gt/finite-fault, last access: 11 November 2021). Using inversion in the wavelet domain of teleseismic broadband data and long-period surface waves (Ji et al., 2002), USGS proposes a non-uniform fault model (called NUM hereafter) of 272 km × 40 km composed of 272 fault segments of 8 km × 5 km with a slip ranging from a few millimeters up to 3 m mainly distributed in the upper-15 km part of the fault plane (hypocenter at 12 km) and a maximum displacement patch at an along-strike distance of around 40 km northward of the hypocenter. All segments have the same orientation parameters for azimuth (298∘) and dip (43∘).
Considering the variability in parameter values, the geological and tectonic context and the effects of the tsunami along the shores of New Caledonia, as well as the role played by submarine features in the tsunami propagation, sensitivity tests have been computed through uniform slip rupture scenarios to assess the importance of each parameter for the tsunami amplitude at key locations. A uniform slip model scenario (called UM hereafter) based on the GCMT solution has been built choosing its parameters in agreement with the geological knowledge of the region and the empirical relationships from Strasser et al. (2010) and Blaser et al. (2010). These relationships link the earthquake seismic moment magnitude to the geometry of the fault plane considering the faulting condition (interslab or intraslab). It helps to estimate a rupture length L of 80 km and a rupture width W of 30 km (i.e., a rupture surface A of 2400 km2) corresponding to the seismic moment Mo of N m−1 estimated by GCMT. The relationship gives a coseismic slip on the fault plane s of 3.5 m with a rigidity (or shear) modulus μ of 3×10¹¹ dyn cm−2 (3×10¹⁰ N m−2).
Each seafloor initial deformation has been computed using Okada's (1985) static surface deformation analytical expressions modeling an earthquake rupture in an elastic half-space. The shape of this initial deformation is directly linked to essential parameters like the depth of the hypocenter and the movement on the fault plane. This initial deformation is transmitted to the water surface above for further tsunami simulations assuming an incompressible fluid.
Table 1 details fault geometries and orientation parameters (Φ strike, δ dip and λ rake) for NUM and UM.
As there is a large body of evidence that small changes in Φ, δ and λ angles may impact both the wave propagation over rugged seafloor (for example see Burbidge et al., 2015) and amplitudes of leading tsunami waves in exposed points (Necmioglŭ and Özel, 2014), sensitivity tests have been also conducted using different sets of fault orientation parameters. As detailed in Table 2, we use variations in Φ, δ and λ angles from values used in the UM case. The range of tested values for Φ, δ and λ is based on the geological knowledge of the region's faults.
Table 2Rupture orientation parameters investigated in sensitivity tests.

4.2 Tsunami generation and propagation
Tsunami waves generated by the seafloor displacement and their propagation are computed using the Semi-implicit Cross-scale Hydroscience Integrated System Model (SCHISM), an unstructured ocean model developed by the Virginia Institute of Marine Science (Zhang et al., 2015, 2016a) based on the former 3D ocean model SELFE from Zhang and Baptista (2008). It is an open-source community-supported ocean model that has been heavily tested and is subject to continuous improvement in laboratories worldwide, oriented toward a handful of different modeling domains using specific modules like wind–wave modeling (e.g., Roland et al., 2012; Hsiao et al., 2020), sediment transport modeling (e.g., Pinto et al., 2012; Lopez and Baptista, 2017) or tsunami modeling (e.g., Zhang et al., 2016b; Priest and Allan, 2019). Modeling of tsunami propagation and coastal interaction is performed through unstructured grids like TINs. Inundation could also be calculated, but the authors have decided not to do this due to the inadequacy of topographic data. According to Horrillo et al. (2015), SCHISM has passed successfully the United States of America NTHMP (National Tsunami Hazard Mitigation Program) benchmarks from the OAR PMEL-135 standard providing a list of exercises like the famous 1993 Okushiri tsunami exercise (https://nctr.pmel.noaa.gov/benchmark/index.html, last access: 11 November 2021).
SCHISM can solve the 3D Reynolds-averaged Navier–Stokes (RANS) equations. It uses a semi-implicit Galerkin finite-element and finite-volume method on unstructured grids (Zhang and Baptista, 2008; Zhang et al., 2016a, b) with time stepping with no CFL (Courant–Friedrichs–Lewy) stability/convergence condition. This way, large time steps could be applied even with high-resolution meshes. In this study, SCHISM is used in barotropic mode with a hydrostatic assumption and one layer. In 2D mode, RANS equations are depth-integrated, and the circulation is described using non-linear shallow-water wave (NSW) equations, a simplification widely used to model tsunamis. Neglecting wind stress, earth tidal potential and atmospheric pressure forces, the NSW equations used in SCHISM 2D at point (x,y) with depth h below the geoid are
Here, t is time, the depth-averaged horizontal velocity with components (u,v), η the sea surface elevation above the geoid, b the time-dependent seabed displacement (positive for uplift), H the total water depth (), f the Coriolis factor, g the gravity acceleration, fhd the horizontal eddy viscosity (set to 10−4 m2 s−1) and τb the bottom drag following a quadratic form:
where Mn is Manning's roughness coefficient set to be spatially uniform with a value of 0.025 s m. All tsunami simulations are performed assuming that the prevailing tide was static (no flow) and equal to the high water (+1.6 m). To limit undesirable wave reflection, a Flather radiation condition (Flather, 1987) is applied along the open boundaries with specified outer values 0 m s−1 and 1.6 m for U and η respectively.
In a first step, SCHISM is used to generate the sea surface initial deformation and flow dynamics in response to the bottom motion. The dynamic displacement of the seafloor can be described in SCHISM by adding a time-dependent seafloor displacement term b incorporated into NSW governing equations. This is done by multiplying Okada's static solution b0 by a uniform rate function of the rising time. In agreement with seismic records, a rising time of 50 s has been used and SCHISM was run with a time stepping dt of 1 s. During the rising time, the seafloor anomaly b0 is progressively injected to give the initial condition for the free surface and horizontal momentum conditions. Then, to simulate tsunami propagation, the model runs with dt=30 s for a duration of 3 h. It is worth noting that using the default value of 10 s for the rising time leads to marginal effects on results.
To detect changes due to fault parameters, total wave energy (E, unit j m−2) is added in SCHISM outputs as the sum of two components, kinetic energy (first term) and gravitational potential energy (second term):
It is important to underline that the sea level was set to a high tide value of 1.6 m, which was approximately the situation in most places when the tsunami reached New Caledonia and Vanuatu on 5 December 2018.
5.1 Wave energy
Figure 6 presents the maximum wave energy maps obtained after 3 h of tsunami propagation over the TIN DEM for NUM and UM. The first observation is that NUM is accompanied by much less tsunami wave energy than UM. Within the two tsunami beams propagating from the rupture location, there are differences in wave energy higher than 10 % in the deep ocean. But, in shallow areas, like banks and seamounts near the rupture, there is a 100 % change. In exposed locations, like the Isle of Pines and Aneityum in the SW and NE quadrants respectively, wave energy anomalies are higher than 50 %, implying lower simulated wave amplitudes in those locations using NUM instead of UM. It is also very striking that despite its proximity and it facing the NUM rupture fault, simulated wave energy along the western coast of Maré is lower compared to in UM.
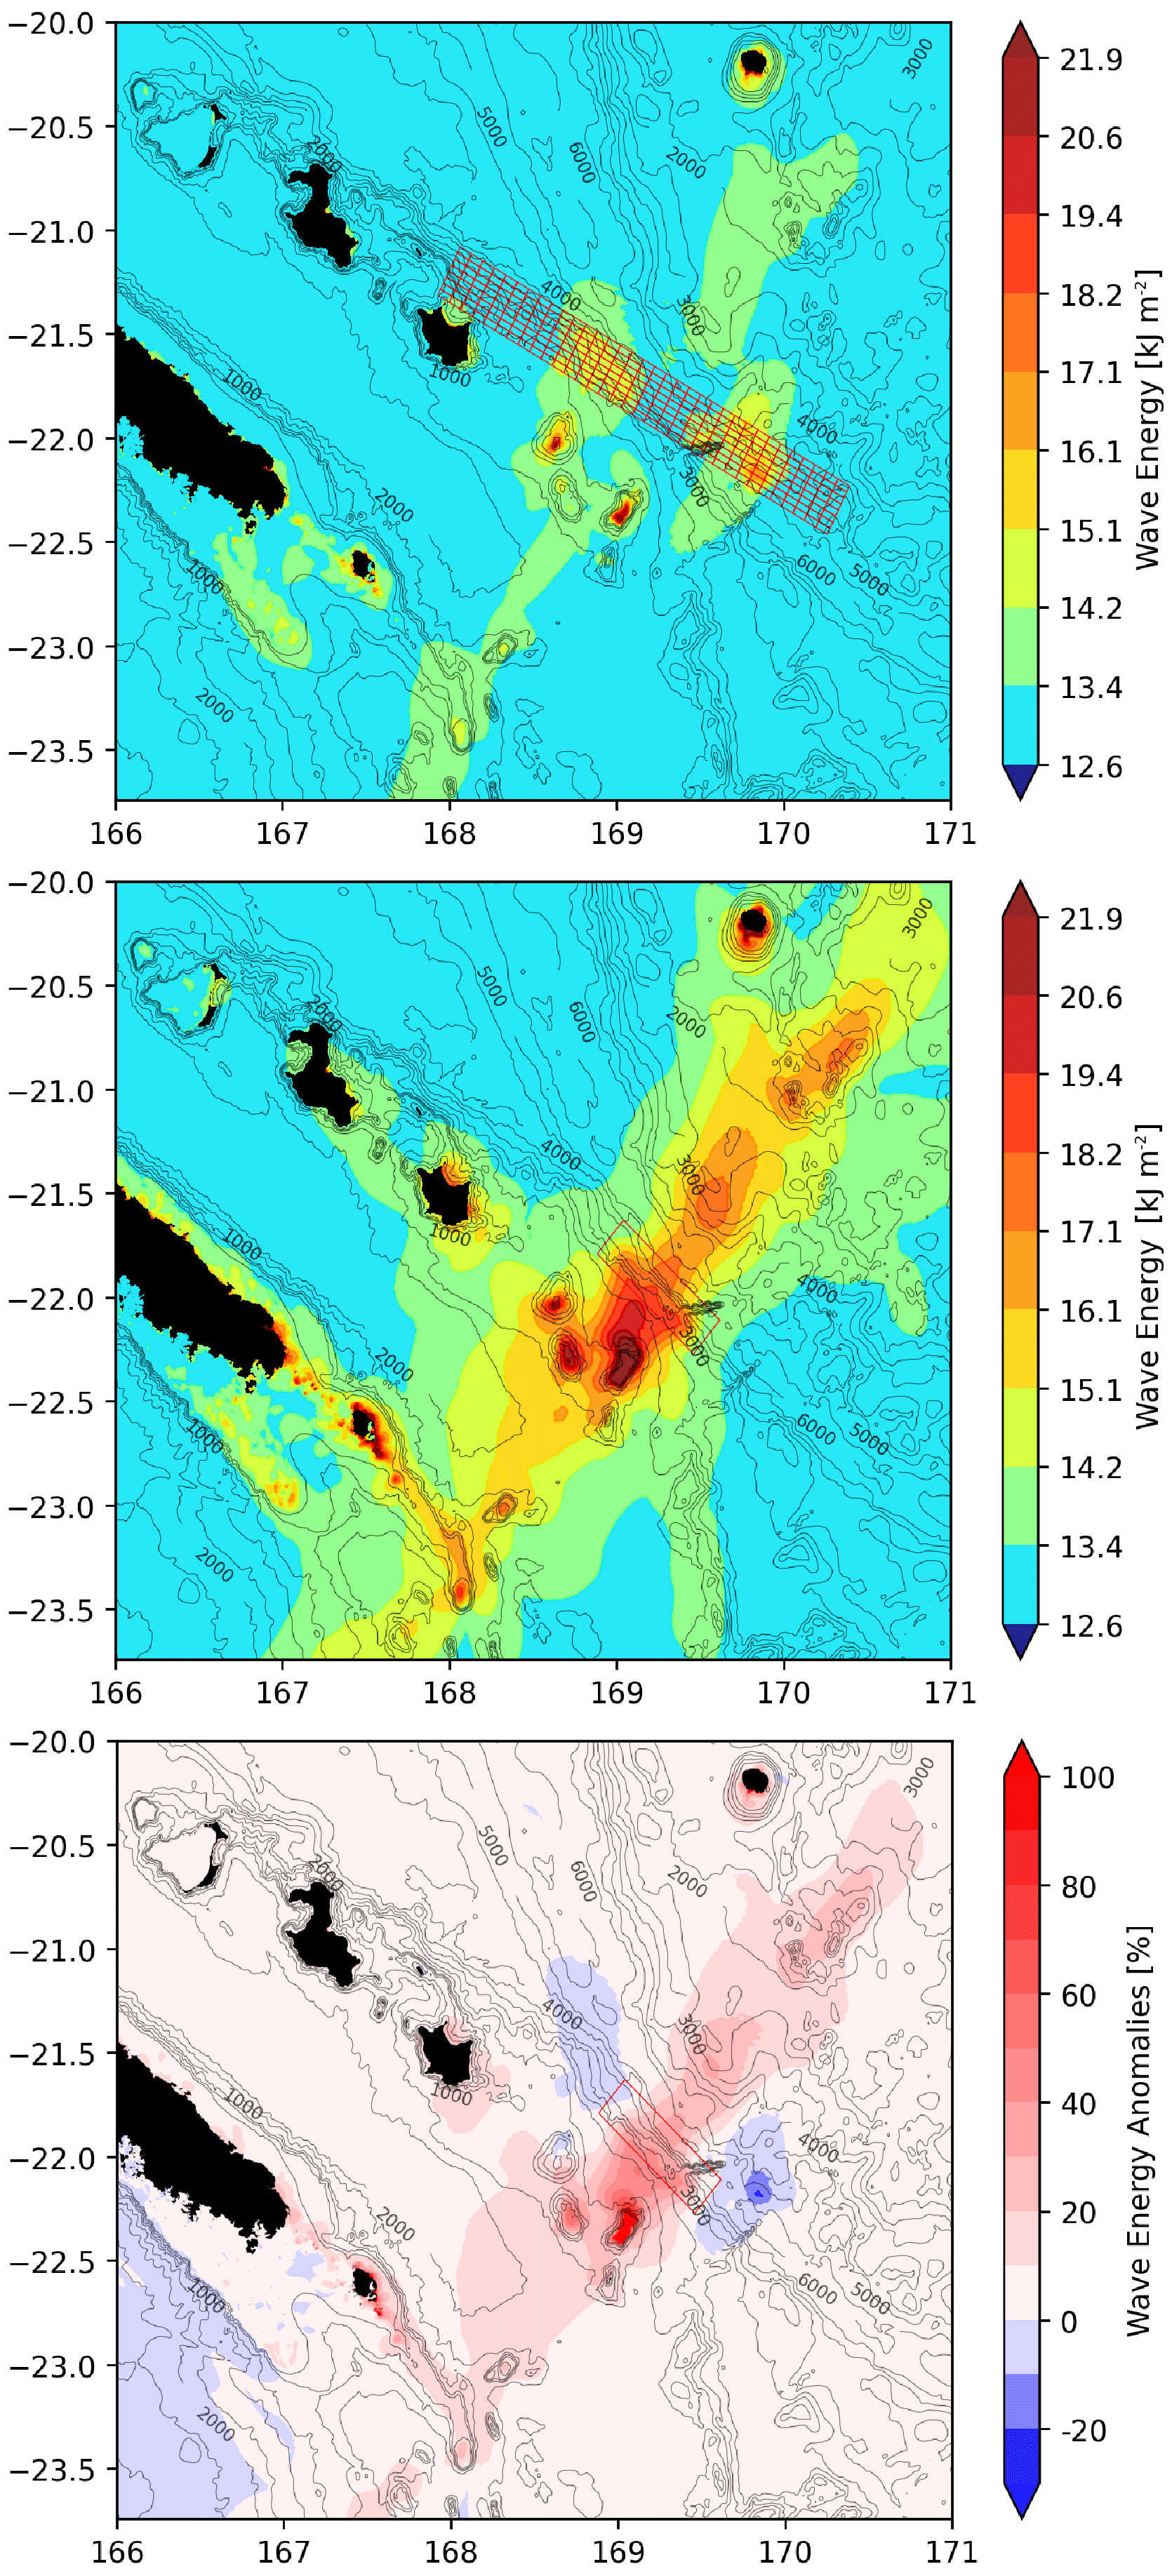
Figure 6Total wave energy maps for two different models – NUM with a strike angle of 298∘ (top panel), UM with a strike angle of 312∘ (middle panel) – and the relative energy anomaly between the two (bottom panel). The bathymetric contours underline the features playing a possible role in tsunami wave propagation. The extent of the sources is symbolized with the red rectangles: small boxes (top panel) denote the 272 fault segments solution from USGS where heterogeneous slip distribution (NUM) is applied along a 270 km long rupture fault. In the UM case (middle panel), uniform slip deformation is applied over the 80 km long rupture model.
The second observation is that, in both cases, the maximum wave energy field is mainly oriented in the direction perpendicular to the azimuth of the fault, i.e., NE–SW, with respect to the slip angle (rake) (Okal, 1988). Even if it is less obvious for NUM than UM, the wave energy is clearly captured by the Loyalty Ridge, which supports the Loyalty Islands, and the Norfolk Ridge, which is the extension of Grande Terre of New Caledonia toward the south. This refocusing of the wave train in another direction is due to the fact that the tsunami speed relies only on the bathymetric depth in the open ocean (Satake, 1988; Titov et al., 2005; Swapna and Srivastava, 2014). Thus, if the waves encounter submarine features like seamounts or ridges, which means that the sea depth decreases, the trajectory of the tsunami could be considerably modified. In the present case, the Loyalty and Norfolk ridges acting like waveguides help the waves to propagate in the azimuthal direction toward the northwest (Loyalty Islands and Grande Terre).
The wave energy difference between the two models shown in Fig. 6 highlights that the main coastal differences concern the Isle of Pines, Maré and Aneityum within a range of 20 % to 60 % more energy for UM than for NUM. Along the east coast of the Isle of Pines, the energy increase is in the range 20 % to 30 % and up to 50 % near specific coastal features like bay entrances. Along the south coast of Aneityum, the closest observation site in the main energy path of the tsunami, the total wave energy increases by about 30 %.
5.2 Tide gauges' records
Simulated time series of sea level variation from the two scenarios are compared to maregraphic records in Fig. 7. Clearly, at all stations, NUM does not fit well the recorded amplitudes: the simulated amplitudes of the first leading waves are very low in comparison to records. In terms of arrival times, it is globally in good agreement with the UM scenario except for at Maré, as a consequence of the exaggerated extension of the rupture fault toward this island provided by USGS. There is some evidence that the heterogeneous slip distribution and geometry from USGS is not appropriate, and a simple model for rupture like UM is still more justified for that event. On this basis, further investigations will continue with UM, leaving aside the NUM scenario.
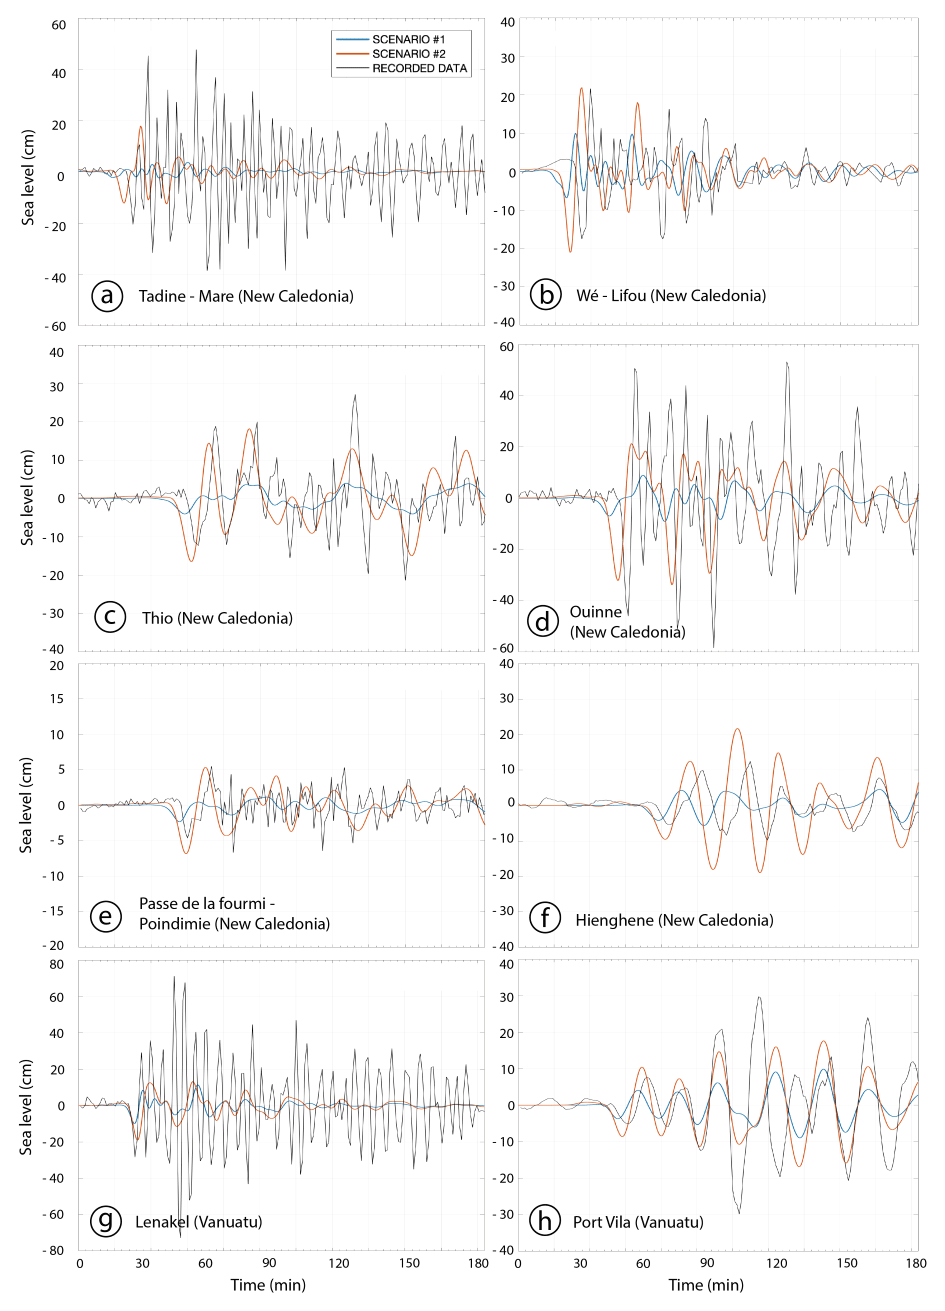
Figure 7Comparison between real (black) and simulated (blue: NUM; red: UM) records for eight different tide gauges located in New Caledonia (a–f) and Vanuatu (g, h). These tide gauges are located in Fig. 3b. Time is relative to the earthquake occurrence time (04:18 UTC). Note the sea level scale for each panel.
Synthetic time series obtained with UM show the following:
-
At Tadine (Maré), the modeling is not able to reproduce correctly the tide gauge record in terms of arrival time and wave amplitude (Fig. 7a). It shows a delay of ∼5 min, with the simulated signal arriving earlier than the observed one. Also, it does not reproduce the oscillation of a period of ∼4–5 min, with amplitudes more than 3 times larger than the modeled ones.
-
At Wé (Lifou), the simulated signal exhibits some strong similarities with the real one recorded in terms of polarity, wave amplitude and periodicity, but there is a delay of more than 5 min, with the modeling being faster than the reality (Fig. 7b).
-
At Thio, the simulated signal can reproduce the real record concerning the polarity, the amplitude or the periodicity but cannot exactly reproduce the arrival time, being still early by a couple of minutes (Fig. 7c).
-
At Ouinné, the modeling is not able to reproduce the recorded signal, except for the first-wave polarity; the simulated record arrives 5 min beforehand (Fig. 7d). An oscillation with a period of ∼6–8 min seems to occur after the first arrival.
-
At Poindimié – Passe de la Fourmi, there is a good agreement between modeling and observations. The arrival time exhibits only a small shift of 1–2 min, with the modeled signal being the fastest (Fig. 7e). The wave amplitude and polarity are quite good, and the periodicity shows only a few differences that will be discussed further.
-
At Hienghène, the modeled tide gauge record is observed again to arrive in advance by about 2–3 min with respect to the real one (Fig. 7f). The wave polarity and periodicity are well reproduced, but the amplitude is slightly overestimated by the modeling.
-
In Vanuatu, at Lenakel, Tanna, there is good agreement between the arrival time and first-wave amplitude of the modeled and real tsunami signal (Fig. 7g). But the periodicity and amplitudes are strongly different, with the modeling being unable to reproduce what looks like a resonant oscillation with a period of ∼6 min and a maximum amplitude reaching nearly 40 cm around 25 min after the first tsunami wave arrival.
-
At Port Vila the simulated signal reproduces the tide gauge record well not only in terms of arrival time ∼40 min after the earthquake (exhibiting only a small delay of ∼1–2 min) but also in terms of polarity, wave amplitudes and periodicity (Fig. 7h). Note that the large trough and peak occurring after 100 min are not reproduced satisfactorily in the simulation.
It is worth noting that sea level records from several stations located in bays and harbors exhibit large oscillations typical of harbor resonance triggered by the first leading waves. It is also worth noting that with the actual model settings for SCHISM (30 nodes per tsunami wavelength and time step dt of 30 s), the model seems unable to reproduce resonance in harbors (Wé, Tadine, Lenakel) or semi-enclosed bays like Ouinné. Since such wave amplification processes represent a significant but undocumented threat in New Caledonia, future works will be devoted to the representation of harbors and bay resonances due to tsunamis with SCHISM.
5.3 Tsunami maximum wave amplitude
The tsunami energy is partially captured by the submarine ridges oriented perpendicular to its main propagation way, leading to amplifications in the Loyalty Islands (via the Loyalty Ridge) and around the Isle of Pines (via a series of seamounts and guyots constituting the southeastern seamount complex of the Pines Ridge). The TIN DEM allows zooming in to specific areas like Aneityum (Fig. 8b); the Isle of Pines (Fig. 8c); Yaté (Fig. 8d); Port Vila (Fig. 8e); and Sulphur Bay, the island of Tanna (Fig. 8f), helping to further compare the testimonials to the simulation results. Important coastal amplifications of the tsunami occur along the south coast of Aneityum from Mystery Island to Umetch, showing a maximum wave amplitude of more than 1.5 m between Mystery Island and the main island (Fig. 8b). Coastal amplification is also relatively important in some restricted locations along the east coast of the Isle of Pines (Fig. 8c), showing a wave amplitude of more than 1 m in front of the resort of Le Méridien and also of ∼40–50 cm in Ouaméo Bay on the west coast and the Bay of Crabs in the north of the island. Wave amplification along the coast of Yaté (southeastern part of Grande Terre, Fig. 8d) leads to a maximum wave amplitude of ∼50 cm in front of the church of Touaourou and in the Yaté River estuary. Focus on Port Vila, located along the south coast of the island of Efate (Fig. 8e), and on Sulphur Bay, southeast of the island of Tanna (Fig. 8f), show wave amplification in a few places, reaching ∼40 cm maximum in both cases.
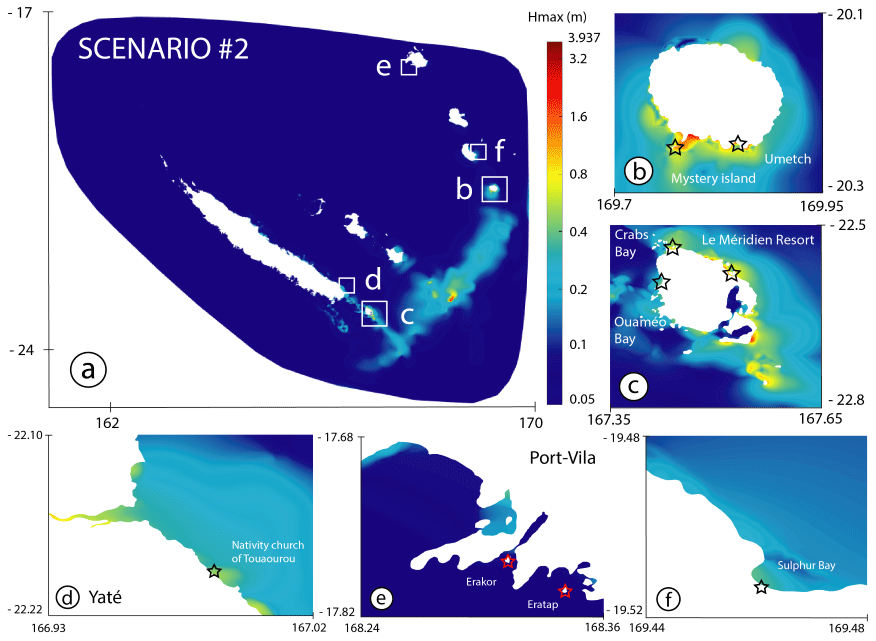
Figure 8Maximum wave amplitude maps (Hmax) obtained after 3 h of tsunami propagation on the TIN DEM for scenario 2 (UM) in New Caledonia and South Vanuatu. (a) Across the entire area; (b) the island of Aneityum; (c) the Isle of Pines; (d) Yaté; (e) Port Vila, Efate; (f) Sulphur Bay, Tanna. Stars stand for eyewitnesses' observation points.
5.4 Sensitivity study
Table 3 and Fig. 9 detail model results concerning the sensitivity of uncertainties in fault angle parameters (Φ strike, δ dip and λ rake) to the maximum generated tsunami wave amplitude (Hmax) and tsunami travel time (TTT) at key locations in New Caledonia and Vanuatu. Table 3a gives the range of variation for all key locations for both Hmax as a function of Φ, δ and λ. In general, changing the azimuth (Φ) of the UM source from 290 to 320∘ and keeping all other parameters stable results in large variations in exposed locations like in front of the resort of Le Méridien, the Isle of Pines (New Caledonia), or at Mystery Island (Aneityum, Vanuatu) with changes of about 62 % and 86 % respectively. It is the same with the dip and rake to a lesser extent: variations in the dip from 25 to 60∘ and in the rake from −120 to −80∘ lead to relative variations in Hmax of about 20 % and 55 % respectively at the same places. It is worth noting that the location exhibiting the largest change to strike angle uncertainties (with a 100 % change) is We, Lifou, aligned with the rupture fault. But, in terms of strike sensitivity (), the slope computed from linear regression between Hmax and Φ (see relationships in Fig. 9, left panels), the sensitivity to Φ at an exposed location like the Isle of Pines is twice the value at We, Lifou (1.2 against 0.6 cm per degree).
Table 3Results of our sensitivity tests at keys locations using three sets of parameters acting on the rupture fault orientation. There are strike, dip and rake angles with values incremented as detailed in Table 2. (a) Impact on the maximum elevation (Hmax). (b) Impact on the travel time (TTT).
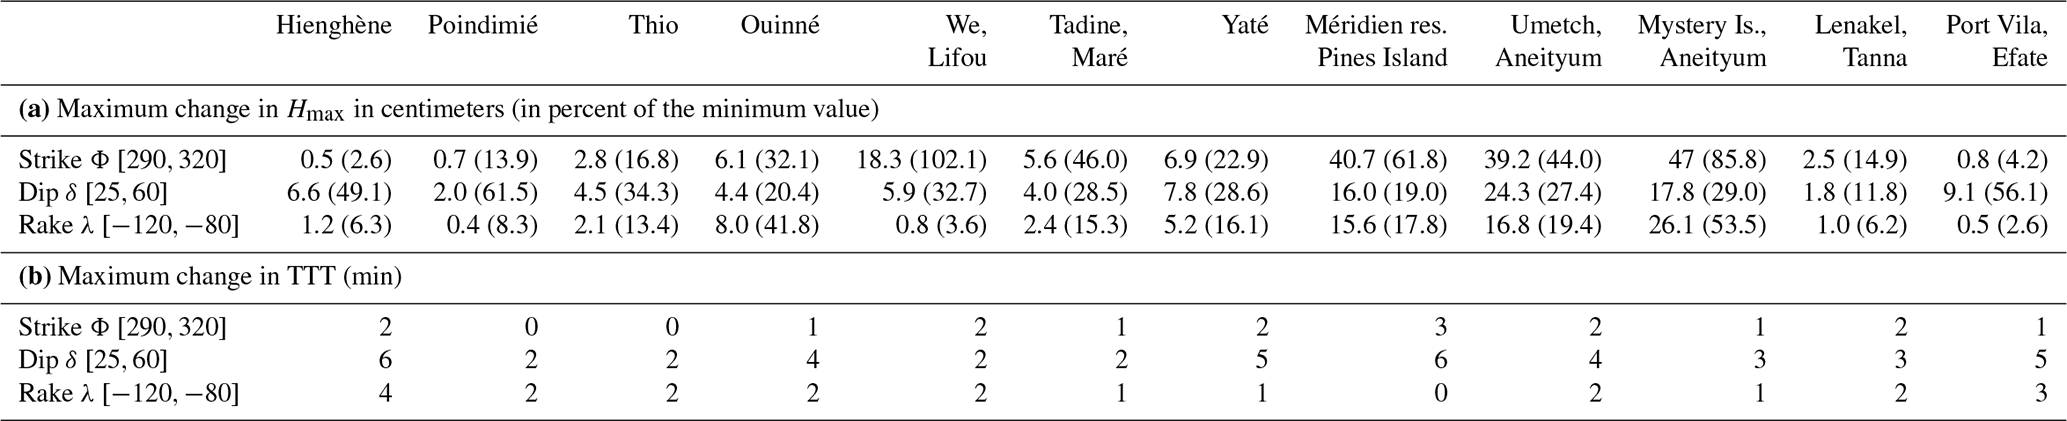

Figure 9Examples of relationship between Hmax (left panels) or TTT (right panels) and the fault deformation angle (strike, dip or rake). Results are extracted from the sensitivity tests at four places located in New Caledonia.
But uncertainties in Φ, δ and λ angles also have significant control on the arrival time of the first leading wave as investigated in Table 3b and in the right panels of Fig. 9. Results indicate that it is the dip angle δ that could exert large variation in the TTT, with variations of up 5 to 6 min at Hienghène and Port Vila, the more remote location from the rupture fault considered in the model domain. Obviously, possible uncertainties in Φ, δ and λ may explain some lags between model results and observations.
The comparison of the maximum energy path derived from the two scenarios (Fig. 6) and the sensibility tests shown in Fig. 9 highlights that UM exhibiting a 312∘ angle has a bigger impact on the Isle of Pines and the island of Aneityum, matching much better with the observations than NUM with an azimuth of 298∘. In addition, the maximum wave height maps calculated over a high-resolution TIN grid (Fig. 8) clearly indicate that the modeling results obtained with UM are in good agreement with the direct observations of the tsunami in both New Caledonia and Vanuatu. In fact, the coastal places where the modeling shows maximum amplitudes (>0.4–0.5 m) are also the places where witnesses reported the tsunami (the Isle of Pines, Aneityum, Yaté, Tanna, Erakor) and sometimes damage (the Isle of Pines – the resort of Le Méridien, Aneityum, Mystery Island and the southern coast to Umetch).
In addition, the tide gauge record comparisons show that globally the UM and, therefore, the tsunami generation and propagation model are together able to reproduce the tsunami records in terms of arrival times, especially in far-field locations (Poindimié, Tanna and Port Vila tide gauges) (Fig. 7e, g and h), polarity (Fig. 7b and d–h) and amplitude (Fig. 7b, e and h).
Except for Poindimié – Passe de la Fourmi where there is a pressure sensor offshore the reef barrier, the observed delay between the simulations and the reality (the simulated signal being always the fastest) for all the New Caledonia coastal tide gauges managed by SHOM is mainly explained by the fact that there are some transmission issues from the gauge to the data center. Also, it has been demonstrated that the waves slow down during propagation due to reverse dispersions for the long periods for numerous reasons not considered in the presented modeling, leading to delays between the observed and simulated travel times of up to 15 min for transoceanic tsunamis (Watada et al., 2014).
But small variations in fault orientation, like the dip for example, may also exert a control on the timing of the first leading wave in remote and shallow locations. As indicated in Table 3b, places outside the lagoon (Poindimié) or devoid of lagoons (Wé, Tadine) show little TTT sensitivity to dip variations, in contrast with Hienghène or Port Vila, indicating complicated interactions between changes in fault geometry and orientation parameters (Φ, δ, λ), seafloor details (like ridges and seamounts) and other geomorphological features (reef, lagoon, bay) in the tsunami wave propagation.
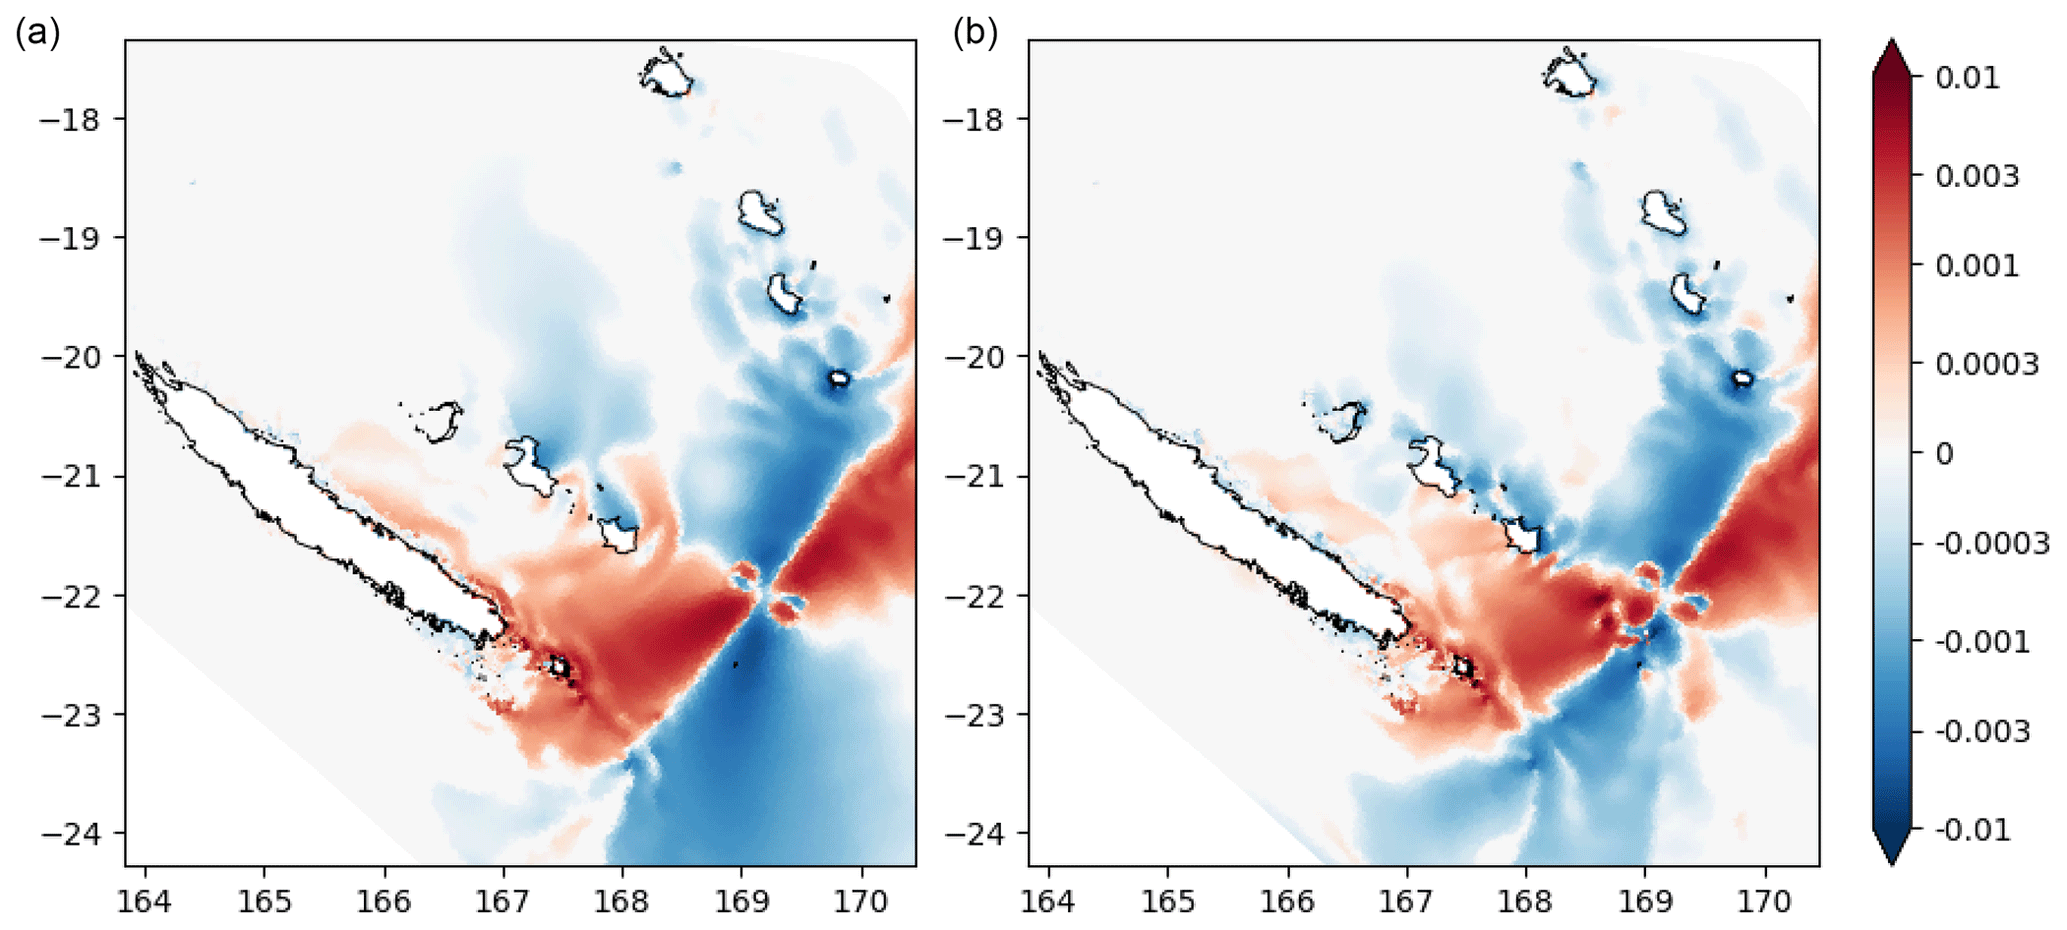
Figure 10Spatial distribution of across the model domain for the case with the simplified Loyalty Ridge (a); the case with preserved bathymetry (b). Scale bar units are in centimeters per degree.
As a straightforward demonstration of the impact of both uncertainties in earthquake source parameters and the influence of ridges on the wave propagation, two maps of using slopes of the linear regression between Hmax and Φ are provided. In Fig. 10, left panel, the rugged seafloor of the Loyalty Ridge is simplified, with a flattening of shallow depths above 2500m (the flattened region is indicated in Fig. 5), while the original bathymetry is preserved in the right panel. From the map comparison, there is evidence that the Loyalty Ridge interacts with the tsunami waves at the first stage of propagation and that a part of tsunami energy is focused onto the Loyalty Ridge by wave refraction. A similar mechanism of refocusing is at work along the eastern flank of the New Caledonia Ridge (Norfolk Ridge), trapping a portion of tsunami energy toward the Loyalty Basin. Finally, as pointed out earlier using the Hmax–Φ relationship at Wé (Lifou), locations aligned with the rupture fault have a large sensitivity to bottom features, in particularly the northeastern shore of Maré.
Concerning the high-frequency oscillations that the model is not able to reproduce, especially at Maré, Ouinné and Lenakel, it is presumably the result of resonant behavior of the tsunami waves interacting with semi-enclosed water bodies represented by Maré Harbor, Ouinné Harbor and Lenakel Bay and with the fringing reefs. A similar behavior has been described in the literature for other places (e.g., Horrillo et al., 2008; Rabinovich, 2009; Aranguiz, 2015). The fact that the high-resolution coastal zones surrounding the location of the tide gauges have been built from sparse bathymetric data coming from low-resolution nautical chart and aerial picture interpretation could explain that the model is not able to reproduce the resonance as the shape of the water bodies and thus their natural oscillation modes are not exactly the same. According to previous studies, it is a safe bet that either a source refinement (complex source showing slip heterogeneity for example) or high-resolution bathymetric data coming from multibeam or lidar surveys would be able to reproduce such phenomena in these small and complicated places (e.g., Sahal et al., 2009; Vela et al., 2014).
Considering both maximum amplitude maps compared to the testimonials (locations and amplitudes) and the tide gauge simulation results' comparison to the real recorded data, the simple fault plane rupture scenario chosen for this study provides quite good results compared to the more sophisticated one from USGS, based on heterogeneous slip distribution. Observed and simulated TTT at Maré may suggest that the USGS fault geometry is inappropriate. This raises questions about their fault model inversion results for that event and a need to devote more effort in the settings of accurate earthquake fault models at the Loyalty Ridge–Vanuatu Arc junction.
It is interesting to notice that, nearly 2 years after the tsunami occurred, hidden observations are still being transmitted by witnesses. With tsunami modeling showing that the north and west coasts of the Isle of Pines would have also been impacted by the tsunami, several people were questioned during a field survey: a fisherman living at the Bay of Crabs indicated that the sea receded from the bay and came back quickly in a rolling foam; witnesses at the diving center and the Kodjeue Hotel located within Ouaméo Bay indicated that the diving club boat, supposed to be loaded at high tide, was lying on the sand instead at the exact arrival time of the tsunami (Pierre-Emmanuel Faivre, personal communication, 2020). Then the water came back, and the sea rose above its natural maximum reaching the foot of the trees (according to a local fisherman, 2019), measured ∼1 m above high tide.
Model results presented in this study for the 5 December 2018 Tadine tsunami indicate that using a simple fault plane rupture scenario is enough in such a case of a near-field event to reproduce the tsunami correctly in terms of maximum wave amplitude and polarity.
There are some issues in simulated travel times, having serious implications for neighboring islands like Maré (TTT<20 min) and the places in New Caledonia (with Lifou and Ouvéa) more exposed to tsunami waves generated from the Vanuatu subduction zone; a probable origin may stem from inaccurate rupture parameters, like the orientation angles strike, dip and rake. The role of sharp changes in depth and tsunami wave refraction at the crossing of the Loyalty Ridge raises the question of wave energy refocusing and trapping toward the Loyalty Basin, as demonstrated by flattening the local bathymetry. The question of possible wave amplification due to refocusing and reflection within the New Caledonia Archipelago deserves future investigations using SCHISM, in order to increase our local knowledge of tsunami hazards for remote and sheltered locations.
In terms of study perspectives, it would be interesting to investigate how tides and lagoon hydrodynamics interact with tsunami waves. The role played by the tide in tsunami impact has been demonstrated by several studies (e.g., Ford et al., 2014; Nakada et al., 2016). Such small-amplitude events occurring at low tide could be dramatic as many people could be looking for shells and octopuses on the fringing reef.
Finally, considering the sea level rise due to global warming in combination with storm surge or exceptionally high spring tides would also help to assess the future impact of small to moderate tsunamis, like the one of 5 December 2018, on island communities, with the following question arising: would the growth of coastal ecosystems such as corals and mangroves be able to adapt quickly enough to rising sea level to maintain their protective role against small events?
SCHISM is publicly available as an open-source code (http://ccrm.vims.edu/schismweb/; CCRM, 2021). Specific developments have been carried out within the framework of this project and are available upon request to the corresponding author. The global bathymetric dataset (Smith and Sandwell, 1997, v 8.2) used in this study is publicly available (https://data.noaa.gov/dataset/dataset/ow-smith-and-sandwell-v8-2-1-30-degree-bathymetry-topography1, last access: December 2019; Smith and Sandwell, 1997); the high-resolution DEM covering New Caledonia and Vanuatu has been prepared as part of the TSUCAL project and is available for research purposes by contacting the first author. The earthquakes (https://earthquake.usgs.gov/earthquakes/search/, US Geological Survey, 2019), centroid moment tensors (https://www.globalcmt.org; Global CMT, 2021) and coastal gauge records (http://www.ioc-sealevelmonitoring.org, IOC, 2021; http://refmar.shom.fr, REFMAR, 2021; https://doi.org/10.17882/55128, Varillon et al., 2018) are publicly available.
JR supervised the study, conducted the field investigations, worked on the DEM constructions, performed tsunami numerical simulations, wrote the manuscript and prepared some figures. BP co-supervised the study, participated in the field investigations, wrote the manuscript and helped to prepare the figures. MD constructed the unstructured grid, processed the data and prepared some figures. JL performed numerical modeling, wrote the manuscript and prepared some figures. JA acquired funding, processed data and worked on the results discussion. PL processed seismic data. BT worked on mapping and data processing. CB and DV maintained the seismic network.
The authors declare that they have no conflict of interest.
Publisher's note: Copernicus Publications remains neutral with regard to jurisdictional claims in published maps and institutional affiliations.
The authors are very grateful to the Vanuatu Meteorology and Geohazards Department, which provided the post-tsunami survey report about Aneityum, and to all the people who shared their testimony of the 5 December 2018 tsunami, which was collected within the months following the event and also more specifically during the 2019 PALEOTSU field survey of paleotsunami deposits all around New Caledonia. They are also very grateful to Paul Wessel and Walter Smith, who developed and maintain the free GMT (Generic Mapping Tools) which were used to produce most of the maps of this study. Finally, they would like to thank Alberto Armigliato and an anonymous referee for their constructive comments to improve the quality of this paper. This study has been carried out within and funded by the TSUCAL project.
This research has been supported by the TSUCAL project.
This paper was edited by Mauricio Gonzalez and reviewed by Alberto Armigliato and one anonymous referee.
Aranguiz, R.: Tsunami resonance in the Bay of Conception (Chile) and the effect of future events, in: Handbook of Coastal Disaster Mitigation for Engineers and Planners, edited by: Esteban, M., Takagi, H., and Shibayama, T., Butterworth-Heinemann, Boston, 93–113, https://doi.org/10.1016/B978-0-12-801060-0.00006-X, 2015.
Aranguiz, R., Catalan, P. A., Cecioni, C., Bellotti, G., Henriquez, P., and Gonzalez, J.: Tsunami resonance and spatial pattern of natural oscillation modes with multiple resonators, J. Geophys. Res.-Oceans, 124, 7797–7816, https://doi.org/10.1029/2019JC015206, 2019.
Barua, D. K., Allyn, N. F., and Quick, M. C.: Modelling tsunami and resonance response of Alberni Inlet, British Columbia, Coast. Eng., 5, 1590–1602, https://doi.org/10.1142/9789812709554_0135, 2006.
Bellotti, G., Briganti, R., and Beltrami, G. M.: The combined role of bay and shelf modes in tsunami amplification along the coast, J. Geophys. Res.-Oceans, 117, C08027, https://doi.org/10.1029/2012JC008061, 2012.
Blaser, L., Krüger, F., Ohrnberger, M., and Scherbaum, F.: Scaling relations of earthquake source parameter estimates with special focus on subduction environment, Bull. Seismol. Soc. Am., 100, 2914–2926, https://doi.org/10.1785/0120100111, 2010.
Burbidge, D., Mueller, C., and Power, W.: The effect of uncertainty in earthquake fault parameters on the maximum wave height from a tsunami propagation model, Nat. Hazards Earth Syst. Sci., 15, 2299–2312, https://doi.org/10.5194/nhess-15-2299-2015, 2015.
Calmant, S., Pelletier, B., Bevis, M., Taylor, F., Lebellegard, P., and Phillips, D.: New insights on the tectonics of the New Hebrides subduction zone based on GPS results, J. Geophys. Res., 108, 2319–2340, 2003.
Candy, A. S. and Pietrzak, J. D.: Shingle 2.0: generalising self-consistent and automated domain discretisation for multi-scale geophysical models, Geosci. Model Dev., 11, 213–234, https://doi.org/10.5194/gmd-11-213-2018, 2018.
CCRM: SCHISM, available at: http://ccrm.vims.edu/schismweb/, last access: 11 November 2021.
Daniel, J., Collot, J. Y., Monzier, M., Pelletier, B., Butscher, J., Deplus, C., Dubois, J., Gerard, M., Maillet, P., Monjaret, M. C., Recy, J., Renard, V., Rigolot, P., and Temakon, S. J.: Subduction et collision le long de l'arc des Nouvelles-Hébrides (Vanuatu): résultats préliminaires de la campagne SEAPSO (leg I), C. R. Acad. Sci. Paris, 303, 805–810, 1986.
Dziewonski, A. M., Chou, T.-A., and Woodhouse, J. H.: Determination of earthquake source parameters from waveform data for studies of global and regional seismicity, J. Geophys. Res., 86, 2825–2852, https://doi.org/10.1029/JB086iB04p02825, 1981.
Ekström, G., Nettles, M., and Dziewonski, A. M.: The global CMT project 2004–2010: Centroid-moment tensors for 13,017 earthquakes, Phys. Earth Planet. Inter., 200–201, 1–9, https://doi.org/10.1016/j.pepi.2012.04.002, 2012.
Flather, R. A.: A tidal model of Northeast Pacific, Atmos.-Ocean, 25, 22–45, 1987.
Ford, M., Becker, J. M., Merrifield, M. A., and Song, T.: Marshall Islands fringing reef and atoll lagoon observations of the Tohoku tsunami, Pure Appl. Geophys., 171, 3351–3363, https://doi.org/10.1007/s00024-013-0757-8, 2014.
Global CMT: Introduction and Explanation, available at: https://www.globalcmt.org, last access: 11 November 2021.
Harig, S., Chaeroni, C., Pranowo, W. S., and Behrens, J.: Tsunami simulations on several scales, Ocean Dynam., 58, 429–440, 2008.
Hentry, C., Chandrasekar, N., Saravanan, S., and DajkumarSahayam, J.: Influence of geomorphology and bathymetry on the effects of the 2004 tsunami at Colachel, South India, Bull. Eng. Geol. Environ., 69, 431–442, https://doi.org/10.1007/s10064-010-0303-1, 2010.
Horrillo, J., Knight, W., and Kowalik, Z.: 2008 Kuril Islands tsunami of November 2006: 2. Impact at Crescent City by local enhancement, J. Geophys. Res.-Oceans, 113, C01021, https://doi.org/10.1029/2007JC004404, 2008.
Horrillo, J., Grilli, S. T., Nicolsky, D., Roeber, V., and Zhang, J.: Performance benchmarking tsunami models for NTHMP's inundation mapping activities, Pure Appl. Geophys., 172, 869–884, https://doi.org/10.1007/s00024-014-0891-y, 2015.
Hsiao, S.-C., Chen, H., Wu, H.-L., Chen, W.-B., Chang, C.-H., Gui, W.-D., Chen, H.-M., and Lin, L.-H.: Numerical simulation of large wave heights from super typhoon Nepartak (2016) in the eastern waters of Taiwan, J. Mar. Sci. Eng., 8, 217, https://doi.org/10.3390/jmse8030217, 2020.
IOC: Sea Level Station Monitoring Facility, available at: http://www.ioc-sealevelmonitoring.org, last acces: 11 November 2021.
Ioualalen, M., Pelletier, B., and Solis Gordillo, G.: Investigating the March 28th 1875 and the September 20th 1920 earthquakes/tsunamis of the Southern Vanuatu arc, offshore Loyalty Islands, New Caledonia, Tectonophysics, 709, 20–38, https://doi.org/10.1016/j.tecto.2017.05.006, 2017.
Ji, C., Wald, D. J., and Helmberger, D. V.: Source description of the 1999 Hector Mine, California earthquake; Part I: Wavelet domain inversion theory and resolution analysis, Bull. Seismol. Soc. Am., 92, 1192–1207, 2002.
Lardy, M.: Quelques remarques à propos du séisme et du tsunami du 17 mai 1995 à Port Vila, Note ORSTOM (ex IRD), ORSTOM, Nouméa, Nouvelle-Calédonie, 29 May 1995.
Lopez, J. E. and Baptista, M. A.: Benchmarking an unstructured grid sediment model in an energetic estuary, Ocean Model., 110, 32–48, https://doi.org/10.1016/j.ocemod.2016.12.006, 2017.
Louat, R. and Pelletier, B.: Seismotectonics and present-day relative plate motions in the New Hebrides – North Fiji basin region, Tectonophysics, 167, 41–55, 1989.
Maillet, P., Monzier, M., Eissen, J. P., and Louat, R.: Geodynamics of an arc ridge junction: the case of the New Hebrides arc-North Fiji Basin, Tectonophysics, 165, 251–268, 1989.
Matsuyama, M.: The effect of bathymetry on tsunami characteristics at Sisano Lagoon, Papua New Guinea, Geophys. Res. Lett., 26, 3513–3516, https://doi.org/10.1029/1999GL005412, 1999.
Monzier, M.: Un modèle de collision arc insulaire-ride océanique. Evolution sismo-tectonique et petrologie des volcanites de la zone d'affrontement arc des Nouvelles-Hébrides – ride des Loyauté, 2 volumes, Thèse de doctorat, Univ. Française du Pacifique, Nouméa, p. 322, 1993.
Monzier, M., Maillet, P., Foyo Herrera, J., Louat, R., Missegue, F., and Pontoise, B.: The termination of the southern New Hebrides subduction zone (southwestern Pacific), Tectonophysics, 101, 177–184, 1984.
Monzier, M., Boulin, J., Collot, J. Y., Daniel, J., Lallemand, S., and Pelletier, B.: Premiers résultats des plongées NAUTILE de la campagne SUPSO 1 sur la zone de collision “ride des Loyauté/arc des Nouvelles-Hébrides” (sud-ouest Pacifique), C. R. Acad. Sci. Paris, 309, 2069–2076, 1989.
Monzier, M., Daniel, J., and Maillet, P.: La collision “ride des Loyauté/arc des Nouvelles Hébrides” (Pacifique Sud-Ouest), Oceanol. Acta, 10, 43–56, 1990.
Munger, S. and Cheung, K. F.: Resonance in Hawaii waters from the 2006 Kuril Islands tsunami, Geophys. Res. Lett., 35, L07605, https://doi.org/10.1029/2007GL032843, 2008.
Nakada, S., Hayashi, M., Koshimura, S., Yoneda, S., and Kobayashi, E.: Tsunami-tide simulation in a large bay based on the greatest earthquake scenario along the Nankai Trough, Int. J. Offsh. Polar Eng., 26, 392–400, https://doi.org/10.17736/ijope.2016.jc652, 2016.
Necmioglŭ, Ö. and Özel, N. M.: An earthquake source sensitivity analysis for tsunami propagation in the Eastern Mediterranean, Oceanography, 27, 76–85, https://doi.org/10.5670/oceanog.2014.42, 2014.
Okada, Y.: Surface deformation due to shear and tensile faults in a half-space, Bull. Seismol. Soc. Am., 75, 1135–1154, 1985.
Okal, E. A.: Seismic parameters controlling far-field tsunami amplitudes: a review, Nat. Hazards, 1, 67–96, https://doi.org/10.1007/BF00168222, 1988.
Pallares, E., Lopez, J., Espino, M., and Sánchez-Arcilla, A.: Comparison between nested grids and unstructured grids for a high-resolution wave forecastingsystem in the western Mediterranean sea, J. Operat. Oceanogr., 10, 45–58, https://doi.org/10.1080/1755876X.2016.1260389, 2017.
Patriat, M., Collot, J., Danyushevsky, L., Fabre, M., Meffre, S., Falloon, T., Rouillard, P., Pelletier, B., Roach, M., and Fournier, M.: Propagation of back-arc extension into the arc lithosphere in the southern New Hebrides volcanic arc, Geochem. Geophy. Geosy., 16, 3142–3159, 2015.
Pelletier, B., Calmant, S., and Pillet, R.: Current tectonics of the Tonga-New Hebrides region, Earth Planet. Sc. Lett., 164, 263–276, 1998.
Pinto, L., Fortunato, A. B., Zhang, Y., Oliveira, A., and Sancho, F. E. P.: Development and validation of a three-dimensional morphodynamic modelling system for non-cohesive sediments, Ocean Model., 57–58, 1–14, https://doi.org/10.1016/j.ocemod.2012.08.005, 2012.
Priest, G. R. and Allan, J. C.: Comparison of Oregon tsunami hazard scenarios to a probabilistic tsunami hazard analysis (PTHA), Open-file Report 0-19-04, Oregon Department of Geology and Mineral Industries, Oregon, USA, 94 pp., 2019.
Rabinovich, A. B.: Seiches and harbor oscillations, in: Handbook of Coastal and Ocean Engineering, edited by: Kim, Y. C., World Scientific Publishing Co Pte Ltd, Singapore, 193–236, https://doi.org/10.1142/9789812819307_0009, 2009.
REFMAR: http://refmar.shom.fr, last access: 11 November 2021.
Régnier, M., Deschamps, A., Monfret, T., Pelletier, B., Pillet, R., Lebellegard, P., Courboulex, F., Delouis, B., and Gaffet, S.: Stress interaction during a seismic swarm at the southern termination of the New Hebrides trench, in: EGU 2004 Session TS19, 29 April 2004, Nice, 2004.
Roeber, V., Yamazaki, Y., and Cheung, K. F.: Resonance and impact of the 2009 Samoa tsunami around Tutuila, American Samoa, Geophys. Res. Lett., 37, L21604, https://doi.org/10.1029/2010GL044419, 2010.
Roger, J., Allgeyer, S., Hébert, H., Baptista, M. A., Loevenbruck, A., and Schindelé, F.: The 1755 Lisbon tsunami in Guadeloupe Archipelago: source sensitivity and investigation of resonance effects, Open Oceanogr. J., 4, 58–70, https://doi.org/10.2174/1874252101004010058, 2010.
Roger, J., Aucan, J., Pelletier, B., Lebellegard, P., and Lefèvre, J.: The December 5, 2018 Mw 7.5 earthquake on the south Vanuatu subduction zone: numerical modelling and development of a scenario database for New Caledonia tsunami hazard assessment, Geophysical Research Abstracts, 21, EGU2019-3210, available at: https://meetingorganizer.copernicus.org/EGU2019/EGU2019-3210.pdf (last access: 11 November 2021), 2019a.
Roger, J., Pelletier, B., and Aucan, J.: Update of the tsunami catalogue of New Caledonia using a decision table based on seismic data and marigraphic records, Nat. Hazards Earth Syst. Sci., 19, 1471–1483, https://doi.org/10.5194/nhess-19-1471-2019, 2019b.
Roger, J., Pelletier, B., Aucan, J., and Thomas, B.: Tsunamis in New Caledonia: from the update of the catalogue to the December 5, 2018 event, in: STAR 2019 Abstracts Booklet, STAR Conference, 19–22 November 2019, Fiji, available at: http://star.gem.spc.int/docs/Abstract-booklet.pdf (last access: 11 November 2021), 2019c.
Roland, A., Zhang, Y. L., Wang, H. V., Meng, Y., Teng, Y.-C., Maderich, V., Brovchenko, I., Dutour-Sikiric, M., and Zanke, U.: A fully coupled 3D wave-current interaction model on unstructured grids, J. Geophys. Res., 117, C00J33, https://doi.org/10.1029/2012JC007952, 2012.
Rouland, D., Régnier, M., Pillet, R., and Lafoy, Y.: An unexpected large magnitude earthquake south of New Hebrides trench: broad band investigations and tectonic implications, in: AGU Fall Meeting abstract, 11–15 December 1995, San Francisco, 1995.
Sahal, A., Pelletier, B., Chatelier, J., Lavigne, F., and Schindelé, F.: A catalog of tsunamis in New Caledonia from 28 March 1875 to 30 September 2009, Comptes Rendus Geoscience, 342, 437–444, 2010.
Sahal, A., Roger, J., Allgeyer, S., Lemaire, B., Hébert, H., Schindelé, F., and Lavigne, F.: The tsunami triggered by the 21 May 2003 Boumerdès-Zemmouri (Algeria) earthquake: field investigations on the French Mediterranean coast and tsunami modelling, Nat. Hazards Earth Syst. Sci., 9, 1823–1834, https://doi.org/10.5194/nhess-9-1823-2009, 2009.
Satake, K.: Effects of bathymetry on tsunami propagation: application of ray tracing to tsunamis, Pure Appl. Geophys., 126, 27–36, https://doi.org/10.1007/BF00876912, 1988.
Shigihara, Y. and Fujima, K.: A nesting approach using unstructured grid system for numerical simulation of tsunami. J. Jpn. Soc. Civ. Eng. Ser. B2, 68, I_186–I_190, https://doi.org/10.2208/kaigan.68.I_186, 2012.
Smith, H. F. W. and Sandwell, D. T.: Global sea floor topography from satellite altimetry and ship depth soundings, Science, 277, 1956–1962, https://doi.org/10.1126/science.277.5334.1956, 1997.
Strasser, F. O., Arango, M. C., and Bommer, J. J.: Scaling of the source dimensions of interface and intraslab subduction-zone earthquakes with moment magnitude, Seismol. Res. Lett., 81, 941–950, https://doi.org/10.1785/gssrl.81.6.941, 2010.
Swapna, M. and Srivastava, K.: Effects of Murray ridge on the tsunami propagation from Makran subduction zone, Geophys. J. Int., 199, 1430–1441, https://doi.org/10.1093/gji/ggu336, 2014.
Tari, D. and Siba, G.: Brief summary of the Aneityum tsunami impact assessment report 05th December 2018, Vanuatu Meteorology and Geohazards Department report, Vanuatu Meteorology and Geohazards Department, Port Vila, 4 pp., 2018.
Titov, V. V., Rabinovich, A. B., Mofjeld, H. O., Thomson, R. E., and Gonzalez, F. I.: The global reach of the 26 December 2004 Sumatra tsunami, Science, 309, 2045–2048, 2005.
US Geological Survey: Earthquake catalog, available at: https://earthquake.usgs.gov/earthquakes/search/, last access: 10 January 2019.
Varillon, D., Fiat, S., Magron, F., Allenbach, M., Hoibian, T., De Ramon N'Yeurt, A., Ganachaud, A., Aucan, J., Pelletier, B., and Hocdé, R.: ReefTEMPS: the observation network of the coastal sea waters of the South, West and South-West Pacific, SEANOE [code], https://doi.org/10.17882/55128, 2018.
Vela, J., Pérez, B., Gonzalez, M., Otero, L., Olabarrieta, M., Canals, M., and Casamor, J. L.: Tsunami resonance in Palma Bay and Harbor, Majorca Island, as induced by the 2003 Western Mediterranean earthquake, J. Geol., 122, 165–182, https://doi.org/10.1086/675256, 2014.
Vidale, J. and Kanamori, H.: The October 1980 earthquake sequence near the New Hebrides, Geophys. Res. Let., 10, 1137–1140, 1983.
Watada, S., Kusumoto, S., and Satake, K.: Traveltime delay and initial phase reversal of distant tsunamis coupled with the self-gravitating elastic Earth, J. Geophys. Res.-Solid, 119, 4287–4310, https://doi.org/10.1002/2013JB010841, 2014.
Yoon, S. B., Kim, S. C., Baek, U., and Bae, J. S.: Effects of bathymetry on the propagation of tsunamis towards the east coast of Korea, J. Coast. Res., 70, 332–337, https://doi.org/10.2112/SI70-056.1, 2014.
Zhang, Y. J. and Baptista, A. M.: SELFE: a semi-implicit Eulerian-Lagrangian finite-element model for cross-scale ocean circulation, Ocean Model., 21, 71–96, https://doi.org/10.1016/j.ocemod.2007.11.005, 2008.
Zhang, Y.J., Ateljevich, E., Yu, H.-C., Wu, C. H., and Yu, J. C. S.: A new vertical coordinate system for a 3D unstructured-grid model, Ocean Model., 85, 16–31, https://doi.org/10.1016/j.ocemod.2014.10.003, 2015.
Zhang, Y. J., Ye, F., Stanev, E. V., and Grashorn, S.: Seamless cross-scale modelling with SCHISM, Ocean Model., 102, 64–81, https://doi.org/10.1016/j.ocemod.2016.05.002, 2016a.
Zhang, Y. J., Priest, G., Allan, J., and Stimely, L.: Benchmarking an Unstructured-Grid Model for Tsunami Current Modelling, Pure Appl. Geophys., 173, 4075–4087, https://doi.org/10.1007/978-3-319-55480-8_20, 2016b.