the Creative Commons Attribution 4.0 License.
the Creative Commons Attribution 4.0 License.
 | 09 Nov 2021
Tidal flood area mapping in the face of climate change scenarios: case study in a tropical estuary in the Brazilian semi-arid region
Paulo Victor N. Araújo
Venerando E. Amaro
Leonlene S. Aguiar
Caio C. Lima
Alexandre B. Lopes
Previous studies on tidal flood mapping are mostly through continental- and/or global-scale approaches. Moreover, the few works on local-scale perception are concentrated in Europe, Asia, and North America. Here, we present a case study approaching a tidal flood risk mapping application in the face of climate change scenarios in a region with a strong environmental and social appeal. The study site is an estuarine cut in the Brazilian semi-arid region, covering part of two state conservation units, which has been suffering severe consequences from tidal flooding in recent years. In this case study, we used high-geodetic-precision data (lidar DEM), together with robust tidal return period statistics and data from current sea level rise scenarios. We found that approximately 327.60 km2 of the estuary is under tidal flood risk and in need of mitigation measures. This case study can serve as a basis for future management actions, as well as a model for applying risk mapping in other coastal areas.
- Article
(7579 KB) - Full-text XML
- BibTeX
- EndNote


Climate change has been associated with various environmental and socioeconomic damage worldwide, with global mean sea level rise (SLR) being one of the main associated phenomena (Nicholls and Cazenave, 2010; IPCC, 2014; Busman et al., 2016; Dangendorf et al., 2019; Bamber et al., 2019). The SLR global mean is occurring at an accelerating rate. The Special Report on the Ocean and Cryosphere in a Changing Climate (SROCC) finds that global mean sea levels (GMSLs) will most likely rise between 0.95 ft (0.29 m) and 3.61 ft (1.1 m) by the end of this century, threatening coastal communities and ecosystems worldwide (Nerem et al., 2018; Bamber et al., 2019; IPCC, 2019). SLR will radically redefine the coastline of the 21st century (Taherkhani et al., 2020).
The changes produced by rising and falling mean sea levels (MSLs) have important implications for the dynamics and morphology of coastal environments, and it is in these environments that a considerable part of the world's population lives (Neumann et al., 2015). Furthermore, it has been causing flooding of natural habitats and coastal infrastructures and consequently causing environmental and socioeconomic impacts of varying magnitudes (Dwarakisha et al., 2009; IPCC, 2014; Murray et al., 2019). Decades ago, the flooding that used to happen only during a powerful or localized storm now can happen when a steady breeze or a change in coastal current overlaps with high tide, as occurs, for example, in the USA (NOAA, 2019).
In past decades, high-tide flooding had little impact on coastal communities because our shorelines were not as heavily developed, and sea level was not as high. Today, however, the reach and effect of the tides are changing, and many coastal towns and cities are already grappling with how best to protect their communities and infrastructure (Dahl et al., 2017).
In Brazil, the current panorama of coastal flooding is worrying. The Brazilian Panel on Climate Change (PBMC) systematized data and information which indicate that different regions in Brazil are already experiencing changes in their characteristic climates (PBMC, 2014). These changes are expected to affect the country's natural, human, infrastructure, and production systems in a non-uniform manner (Brasil, 2016). The country stands out as the seventh largest nation in the world by coastal population and as having the seventh most prevalent proportion of coastal zones in low-lying areas (Mcgranahan et al., 2007). About 25 % of the Brazilian population lives in the coastal zone and has lately been suffering from the damage caused by the relative SLR (SMC-Brasil, 2018). Approximately 60 % of the natural events that hit Brazil from 1948 to 2006 with harmful consequences to the population were related to flooding and/or sea advances (Brasil, 2016). These data, combined with scenarios of rising sea level trends (Easterling et al., 2000; Taherkhani et al., 2020), warn us of the need for (local-scale) projections for the next decades to support the preparation and planning to respond to the increasing threat related to SLR. According to Taherkhani et al. (2020), the 21st century will see significant changes to coastal flooding regimes (in which present-day extreme-but-rare events become common), which poses a major risk to the safety and sustainability of coastal communities worldwide. Climate risk adaptations involving large infrastructure investments represent difficult decisions and require an accurate information base (Hall et al., 2019; Kulp and Strauss, 2019).
Coastal flooding is becoming more frequent and expensive (Herdman et al., 2018). Dahl et al. (2017) concluded that SLR drives increased tidal flooding frequency at tide gauges along the US East and Gulf coasts in projections for the next years. The Fifth Assessment Report (AR5) of the United Nations Intergovernmental Panel on Climate Change (IPCC) presented climate scenarios called Representative Concentration Pathways (RCPs) (IPCC, 2014). Each RCP was defined on a global scale and considers the historical evolution of several factors, such as the cumulative measure of greenhouse gas emissions from all sources of emissions and their total radiative forcing pathway, by 2100. Under RCP, the IPCC AR5 projected GMSL by summing the input from physical processes to provide a likely (central 66 % probability) estimation of a GMSL rise of 0.52–0.98 m in the case of an unmitigated increase in emissions (RCP 8.5) by 2100, relative to 1986–2005 (Church et al., 2013). Although in all scenarios the projected increase in MSL is a maximum of 1 m for the year 2100, they have been designed on global and continental scales. Many studies have analysed the risk arising from these flood scenarios across the low-lying coastal zone (altitude up to 10 m) (Nicholls et al., 2007; Dwarakish et al., 2009; Nicholls and Cazenave, 2010; Nicholls et al., 2011; Boori et al., 2012; Busman et al., 2016). However, the lack of work on the theme in focus in the South American region, especially in Brazil, is striking. Therefore, the objective of this research is to develop and apply a tidal flood risk mapping, given the current scenarios of rising sea level trends, adopting as a case study the Piranhas–Açu estuary in the northern portion of the state of Rio Grande do Norte, Brazil.
Finally, this study has an innovative character since it applies a robust data set in an integrated spatial analysis.
The tropical watershed of the Piancó–Piranhas–Açu river estuary is located in northeastern Brazil and is the widest watershed of the Northeast Atlantic Eastern Hydrographic Region, with a total area of 43 683 km2. Its territory is divided between the states of Paraíba (60 %) and Rio Grande do Norte (40 %) (ANA, 2016). Fully inserted in a very hot and semi-arid climate territory, the basin presents concentrated rainfall in a few months of the year (rainy season in late autumn and early winter) and a pattern of strong interannual variability, characterized by alternation between years of above-average, regular, and consecutive years of below-average values resulting in prolonged droughts and low water availability.
The study area covers the entire Piancó–Piranhas–Açu estuary, represented by a rectangle with the measurements of 62×35.5 km, corresponding to an area of approximately 2201 km2. This area is an estuarine section comprising parts of four municipalities of the northern coast of the state of Rio Grande do Norte (Porto do Mangue, Carnaubais, Pendencias, and Macau) (Fig. 1).
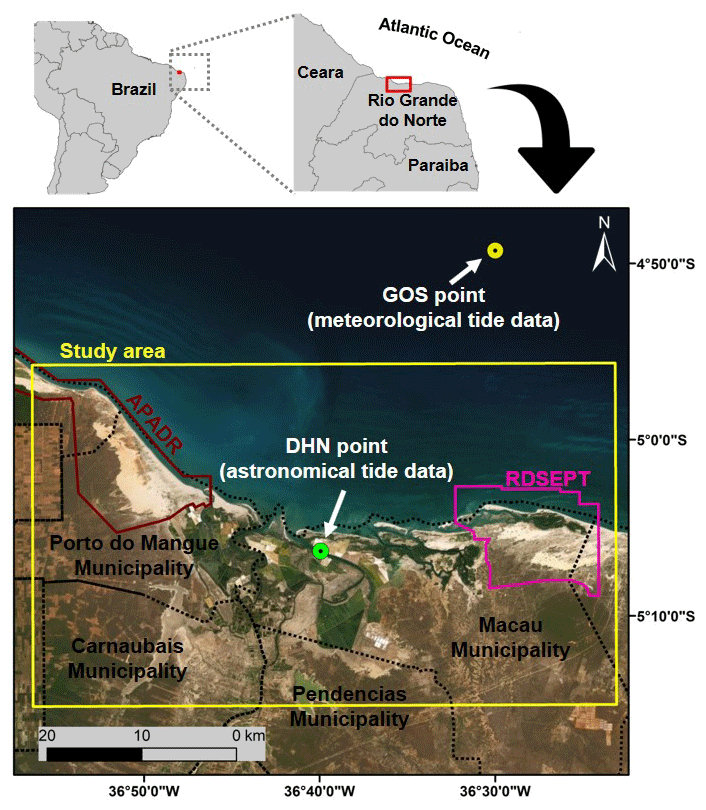
Figure 1Location of the study area. The yellow rectangle represents the delimitation of the study area: Piancó–Piranhas–Açu estuary and its surroundings. The pink polygon highlights the boundary of the Ponta do Tubarao State Sustainable Development Reserve (RDSEPT), while the burgundy polygon delimits the Rosado Dunes Environmental Preservation Area (APADR). The dotted black line represents the geopolitical boundaries of the municipalities that make up the study area. Basemap from ArcGIS Online: © ESRI.
In general, the study area is represented by a tropical or equatorial zone climate and is framed in the semi-arid climate subdomain (Diniz and Pereira, 2015). The region in focus stands out as the driest stretch of the entire Brazilian coast, with an average rainfall of 537.6 mm/yr in the city of Macau. The daily temperatures vary from 26 to 30 ∘C (with a mean temperature of 26.8 ∘C), and the average relative air humidity is 70 % (IDEMA, 1999; Diniz and Pereira, 2015; Barbosa et al., 2018a). In geomorphological terms, there is a wide fluvial–marine plain that constitutes the coastal strip (Barbosa et al., 2018b; Costa et al., 2020). The number and extent of various channels present along adjacent large river plains reveal the great influence of oceanic waters on this stretch of the continent, with tidal action being one of the major natural forces responsible for hydrographic control.
The study area is inserted in a sheltered coastal region dominated by tide-modified and tide-dominated beaches (Vital et al., 2016). In this region, the local tide is semidiurnal, with two high and two low tides, for which the average level set as a reference is 1.39 m above the reduction level (RL), as established by the Directorate of Hydrography and Navigation (DHN) of the Brazilian Navy. The DHN of the Brazilian Navy, the body responsible for maritime monitoring, adopts the so-called RL as a reference for maritime quotas. The RL is a level that corresponds to the average of low syzygy tides to eliminate the variations in tides and to assure navigators that they will not find any depths less than those represented in the nautical chart. The RL is a chart datum estimation of the mean lower low water. In the region, there are mean semidiurnal high tides of 2.34 m above the RL (Matos et al., 2019; DHN, 2018). As for marine currents, the region is under the influence of the South Equatorial Current that acts throughout the northern coast of Brazil (Diniz et al., 2017).
In general terms, this coastal region has a mosaic of ecosystems marked by mangrove forests, together with an extensive ebb tidal delta, exposed and sheltered sandy ocean beaches, barrier island systems, active dune fields, spits, and short-term high-sedimentary dynamic tidal channels (Grigio et al., 2006; Amaro et al., 2012; Santos and Amaro, 2013; Busman et al., 2016; Vital et al., 2016). The industrial sector of the area under study comprises essentially mineral exploration, especially salt, oil, and gas. The extraction of oil and natural gas is a very important activity in the basin and for the economy of the state of Rio Grande do Norte due to the royalties generated (IDEMA, 2005). Aquaculture and artisanal fishing also play a part in the local economy, as well as irrigated agriculture, shrimp farming, salt marshes, and, more recently, typical wind industry infrastructure.
There are two noteworthy state conservation units in the study area: Ponta do Tubarao State Sustainable Development Reserve (RDSEPT) and the Rosado Dunes Environmental Protection Area (APADR). The RDSEPT was created through State Law No. 8,349 of 18 July 2003, and its objectives are to safeguard the traditional way of life and ensure activities based on sustainable exploitation of natural resources, traditionally developed over generations and adapted to local ecological conditions, which play a fundamental role in protecting nature and maintaining biological diversity. The APADR was recently created by State Decree No. 27,695 of 21 February 2018, and it aims to protect biological diversity, regulate occupational practices, and ensure the sustainable use of the natural resources of the respective area.
Historically, although the Piranhas–Açu estuary has suffered from some drastic river flooding in the last decade (2004, 2008, and 2009) as a result of extreme rainfall events (Medeiros and Zanella, 2019; Medeiros, 2018), it has been suffering with the effects of tidal flooding (type of flooding which is the focus of this work). Recent reports from the 2010s were found in local newspapers and blogs, as well as in situ personal observations (personal communication). Since then, due to the effects of the sea, streets and houses have been frequently flooded by water, bringing negative consequences to several communities of the northern coast of Rio Grande do Norte (Fig. 2). The current facts, together with local disrupted employment, the environmental and economic importance of the region, the scenarios of SLR, and finally the lack of literature on the case (tidal flood), make this region an area of great appeal for the development of scientific works to subsidize information for decision-making about climate change adaptations.
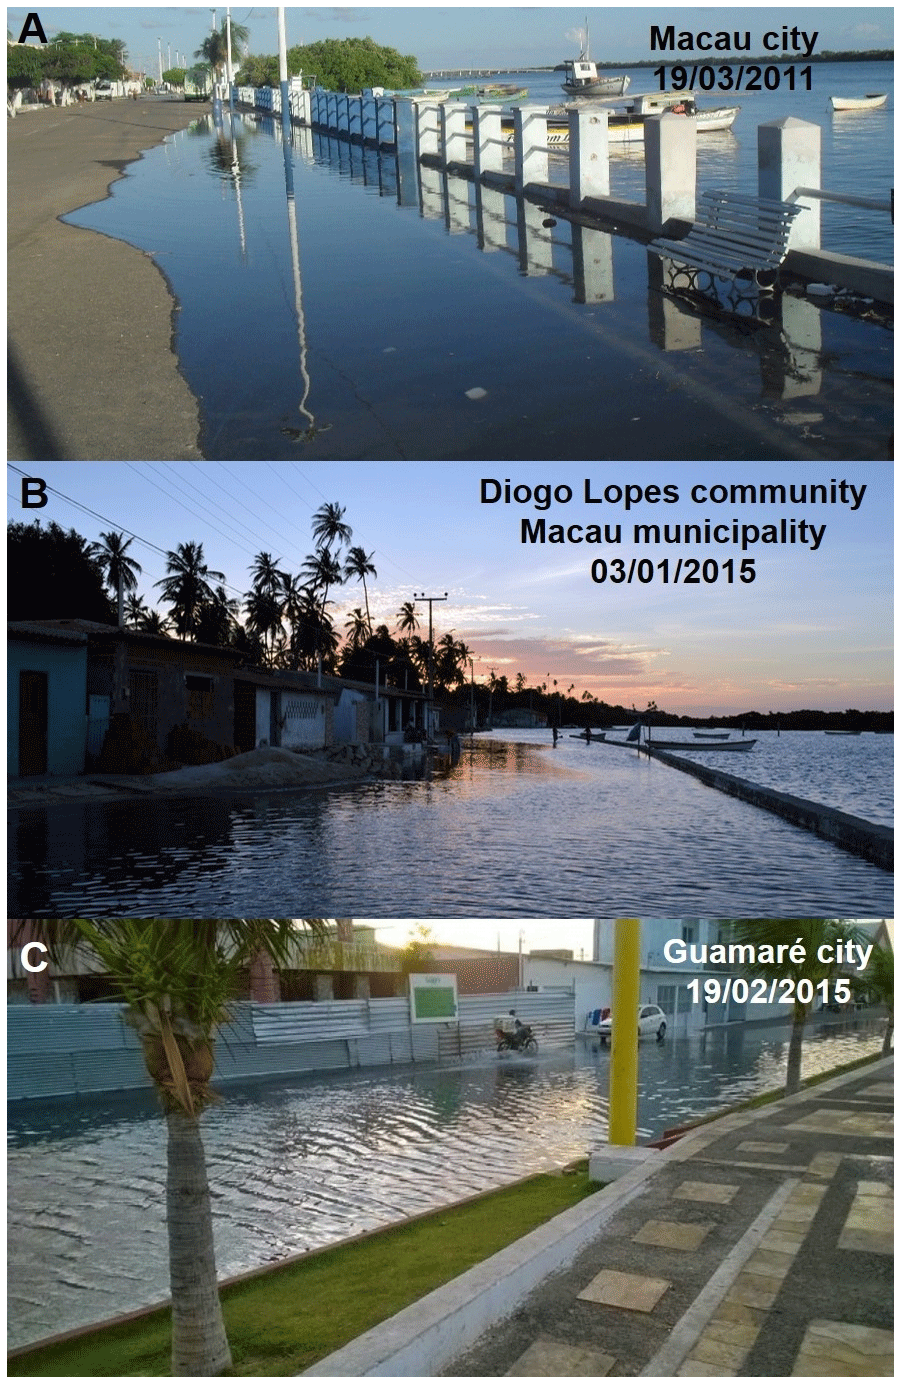
Figure 2Tidal flooding events of the northern coast of Rio Grande do Norte state: (a) Macau urban area, Macau municipality, 19 March 2011 (unknown author); (b) Diogo Lopes community, Macau municipality, 3 January 2015 (Tiago Ezequiel); and (c) Guamaré urban area, Guamaré municipality, 19 February 2015 (unknown author).
Tidal flood risk mapping was performed using data on the meteorological tide (MT) and astronomical tide, as well as a high-resolution lidar digital elevation model (DEM) calibrated for the study area. The data were subjected to statistical analysis and return period calculations. The 20-year return period was adopted as the base reference quota for this study and joined with the projections found in the literature on the global SLR for the coming years. Finally, flood risk mapping was performed based on flood scenarios and the vulnerability of land use and cover.
3.1 Tide database
For this study, sea level variation was represented by the sum of the meteorological and astronomical tides (SMC-Brasil, 2018).
3.1.1 Meteorological tide (MT)
The MT or storm surge (also known as non-astronomical sea level) is the result of atmospheric forcing such as wind pressure or sea level pressure variations. To compose the local MT historical series, the maximum annual tide level was obtained from the data from point 19 (lat 4.821∘ S, long 36.500∘ W (Fig. 1) from the GOS (Global Ocean Surge) database of the SMC-Brasil project (SMC-Brasil, 2018). This database is a selection of regional reanalysis series located along the Brazilian coast, built with a forced numerical simulation with atmospheric pressure fields and winds, and validated for the region. To generate the series, we used the barotropic module (2DH) of the model in a global mesh with 0.25∘ spatial resolution and bathymetry data from the ETOPO2 model (NOAA). As oceanographic influences of the model, pressure data at sea level and global winds (10 m high) from Reanalysis 1 (NCEP/NCAR) were used. The wind and pressure data have a spatial resolution of 1.9∘ and a 6 h temporal resolution. Each of the series has a duration of 60 years (1948–2008) with a time interval of 1 h (SMC-Brasil, 2018).
3.1.2 Astronomical tide (AT)
AT is defined as the set of regular sea level rise and fall motions over 12 or 24 h, produced by the gravitational effects of the Earth–Moon–Sun system. Other celestial bodies in the solar system also exert gravitational force, yet they are weak when compared to and considering the Moon and Sun. Tide description and prediction at a given location can be done by harmonic tidal analysis (Pugh, 1987). In this investigation, the astronomical tide data are the result of deterministic forecasts prepared and provided by the Brazilian Navy's Directorate of Hydrography and Navigation (DHN). The maximum annual astronomical tide level was used from the astronomical tide forecast data released by the DHN, linked to the tidal gauge station of the Port of Macau (lat 4∘49′05′′ S, long 37∘02′04′′ W) (Fig. 1), for the period 1998 to 2018. These data were available through tables showing the maximum and minimum daily values of astronomical tidal heights.
3.1.3 Statistical analyses of tide database
The Mann–Kendall sequential test (Mann, 1945; Kendall, 1975) was applied to evaluate the temporal serial behaviour of the annual maximum of meteorological and astronomical tides. The Mann–Kendall test is a robust, sequential, and non-parametric statistical method used to determine if a specific data series has a temporal tendency towards statistically significant changes. Among its advantages, it does not require normal distribution of data and is only slightly influenced by abrupt changes or non-homogenous series (Zhang et al., 2009). In recent years, with growing concerns over environmental degradation and about the implications of greenhouse gases for the environment, researchers and practitioners have frequently applied the non-parametric Mann–Kendall test to detect trends in recorded hydrologic time series such as water quality, streamflow, and precipitation time series (Yue and Wang, 2004; Araújo et al., 2019). Although it has no influence on the tidal flood risk mapping, the Mann–Kendall test was applied to investigate if the elevation of tides is showing any upward or downward trend.
Subsequently, the data were submitted to fit the extreme value of the Gumbel distribution function (Gumbel, 1958). Extreme value statistics are used primarily to quantify the stochastic behaviour of a process at unusually large or small values. Particularly, such analyses usually require the estimation of the probability of events that are more extreme than any previously observed. Many fields have begun to use extreme value theory, and some have been using it for a very long time including meteorology, hydrology, finance and ocean wave modelling to name just a few (Gilleland and Katz, 2016). The Gumbel distribution is also known as type I extreme value distribution, or Fisher–Tippett type I distribution, and it has the function of accumulated probabilities given by Eq. (1):
x being the ratio and y the reduced Gumbel variable given by Eq. (2):
where α and β are characteristic parameters of the Gumbel line; α represents metre of scale and β the position parameter. The return period (Tr) in years can be obtained by Eq. (3):
In this work, the 20-year return period (Tr20) was adopted as the starting reference for flood hazard mapping in question. All statistical analyses were performed using R software (R Development Core Team, 2020). The packages used were “Kendall” and “extRemes” for the Mann–Kendall sequential test and to fit extreme values of the Gumbel distribution function, respectively.
3.2 Adjustment of the reduction level to the Brazilian Geodetic System
The astronomical tidal information provided by the DHN is all linked to the so-called RL, which is the altimetric reference system for bathymetric depth measurements adopted by the Brazilian Navy. This reference system assigns the average low tides of spring to a measurement reference made at local level. Thus, the establishment of the local sea level found in the nautical charts and information provided by the Brazilian Navy has its own framework aimed at knowledge of the seabed relief for navigators' safety (CHM, 2019a, b). Therefore, it is a different altimetric reference than the official geodetic reference system adopted by the country (Matos, 2005; Ramos and Krueger, 2009).
In order to standardize the altimetric reference of this work, Brazilian Vertical Datum of Imbituba was adopted in association with the Brazilian Geodetic System (SGB). For this purpose, a level reference point was traced over approximately 50 min employing a two-frequency GNSS (Global Navigation Satellite System) receiver (L1/L2) near the Port of Macau (Fig. 3). This landmark, code-named RN-2 (DHN), was deployed during the construction of the respective navigational station by the Brazilian Navy. After the screening, the GNSS data were submitted to coordinate adjustment post-processing through MAPGEO2015, the official Brazilian geoidal undulation model, and its SGB-linked orthometric altitude was obtained through the precise point positioning of the Brazilian Institute of Geography and Statistics (IBGE-PPP). IBGE-PPP is a free online service for GNSS data post-processing that makes use of the GPS precise point positioning (CSRS) programme developed by the Geodetic Survey Division of Natural Resources Canada. It allows users with GPS and/or GLONASS receivers to obtain coordinates referenced to SIRGAS2000 (Geocentric Reference System for the Americas) and ITRF (International Terrestrial Reference Frame) through precise processing.
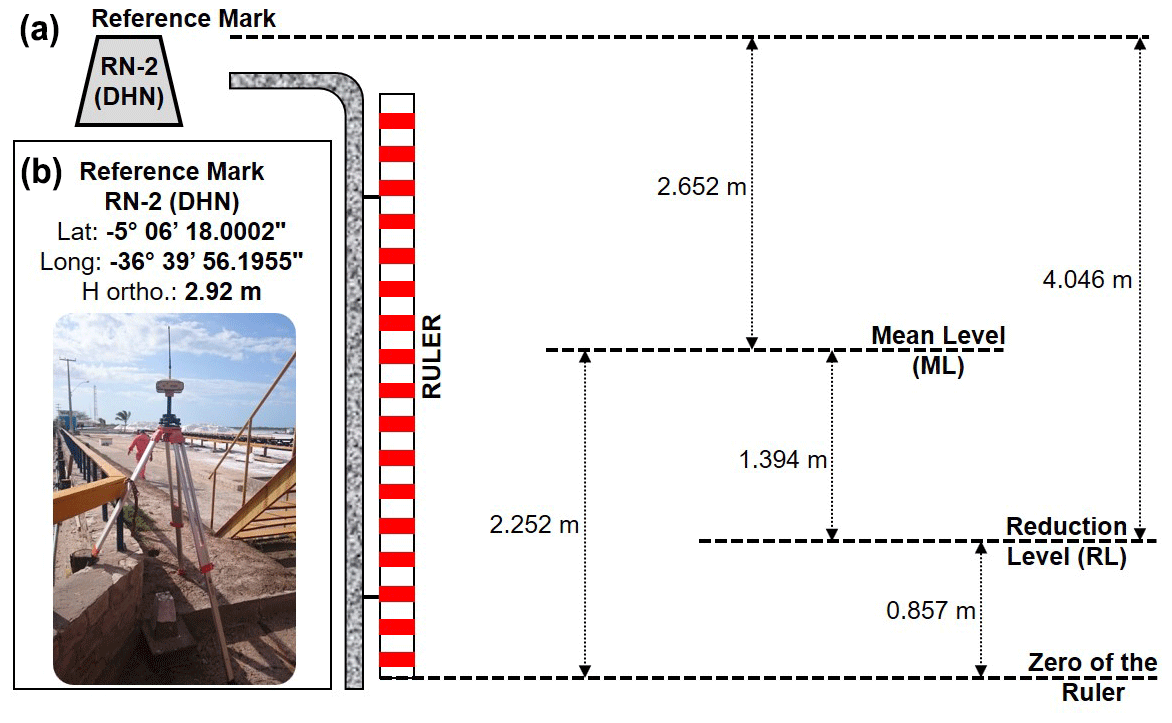
Figure 3Scheme illustrating the differences in quotas between the references adopted by the Brazilian Navy: (a) reference mark RN-2 (DHN) and (b) coordinates of reference mark RN-2 (DHN).
Finally, the RL orthometric altitude was obtained by mathematical subtraction operations at the RN-2 (DHN) level reference orthometric altitude, as presented in Eq. (4):
3.3 Lidar digital elevation model
An airborne lidar DEM was used with 1 m horizontal spatial resolution and coverage for the entire local area. The DEM was built by Petrobras, granted in terms of technical cooperation between the said institution and the Federal University of Rio Grande do Norte (UFRN) and made available by the graduate programme in geodynamics and geophysics (PPGG), utilizing a confidentiality agreement. The survey took place between February and September 2012 through integrated aerophotogrammetry. In this aerial survey, we used a model ALS60 piece of equipment manufactured by Leica Geosystems. The average point density was 4.2 per square metre with a frequency of 200 000 pulses per second (200 kHz) and a 26∘ aperture angle (FOV). The operating frequency adopted was 160.2 kHz with 65 Hz profiling frequency and an average aircraft speed of 190 km/h. The average point spacing was 0.41 m (in the flight direction) and 0.80 m in the transverse flight direction. The geodetic reference system adopted for planimetric data was SIRGAS2000. For altimetry data, the geoidal undulation model MAPGEO2015 was used. The geometric altitude was converted to orthometric altitude to leave all in the same altimetry reference (all linked to the Brazilian Geodetic System). The altimetry RMSE of this product, obtained during the evaluation and calibration process (Araújo et al., 2018), was 0.1704 m.
3.4 Scenarios for mean sea level rise
Mean sea level rise (MSLR) has been widespread in the international community as one of the impacts related to climate change, for which most estimates are projected to the year 2100. For this research, we adopted three scenarios of MSLR at global and regional scales to incorporate the predictions of average SLR until the year 2100. The forecast scenarios of the IPCC AR5 (Church et al., 2013), reviewed by Oppenheimer et al. (2019), using a collection of process-based models and supplementary databases, project a median and likely (66 % probability) global MSLR of 0.53 m (0.36–0.71 m) and 0.74 m (0.52–0.98 m) by 2100 for RCP 4.5 and RCP 8.5, respectively. Also, stations of the Geodetic Permanent Tide Gauge Network (RMPG) operated by the Brazilian Institute of Geography and Statistics (IBGE) have shown an MSLR of 2.1 mm/yr on Brazilian coast since 2001 (IBGE, 2016). RCPs are scenarios with a global projection, whereas the IBGE scenario is a projection at a regional level, mainly for the Brazilian northeastern coast. The IBGE scenario is the result of a simple linear projection based on data variation obtained by RMPG, while the IPCC scenarios are results from robust modelling of sea level projection in the face of climate change.
3.5 Land use and cover map
Land use and cover mapping of the study area was carried out in three stages arranged in a systematic way: (1) digital image processing (DIP), mainly based on applications of images processing algorithms, (2) fieldwork, and (3) cartographic digitization and manual vectorization.
The first stage consisted of highlighting thematic information using DIP techniques on multispectral optical images from the Operational Land Imager (OLI) sensor on the LANDSAT-8 platform and Synthetic Aperture Radar (SAR) Multi-look Fine image from the RADARSAT-2 mission. The DIP techniques included multispectral band ratios and principal component analysis (PCA) applied in the red–green–blue (RGB) colour system and RGB–intensity hybrid colour system. Thus, the multispectral colour composites R(7/5)G(6/4)B(5/4) and R(PC5)G(PC6)B(PC7) and hybrid colour composites R(7/5)G(6/4 )B(5/4)I(RADARSAT-2) were analysed in order to highlight thematic classes associated with the compositional differences of the soil, vegetation, water, and anthropic materials. Principal components (PCs) 5, 6, and 7 showed a predominant contribution of 58 % of band 6, 56 % of band 4, and 60 % of band 1, respectively, elucidating information from the middle, near, and visible infrared spectra. The use of RADARSAT-2 images sought to extract the maximum textural information from each target on the surface due to the principles of diffuse and specular reflection of SAR images (Jensen, 2009).
The second stage consisted of an in-person visit to the study area with the purpose of validating information extracted from DIP, in addition to providing analyses on a detailed scale. Correlations were made between field observations and land use and cover classes, recognized through spectral data on colour composite images.
Finally, in the third stage, all the information on the land use and cover mapping was integrated and mapped by manual vectorization on a scale of 1 : 10 000 with ArcMap 10 software.
3.6 Tidal flood risk mapping
For this investigation, we adopted as a quantitative risk the likelihood of harmful consequences or expected losses (dead, injured, destroyed and damaged buildings, etc.) occurring as a result of interactions between a natural hazard and conditions of local vulnerability (UNDP, 2004). The formula proposed by Wisner et al. (2011), for which the same concept was one of the references of the fifth IPCC report (IPCC, 2014), is Eq. (5):
where “hazard map” is the likelihood of the process occurring with magnitude M (destructive potential), and “vulnerability map” (physical vulnerability) is the degree of damage or loss to the exposed environment as a result of the impact and as a function of magnitude M.
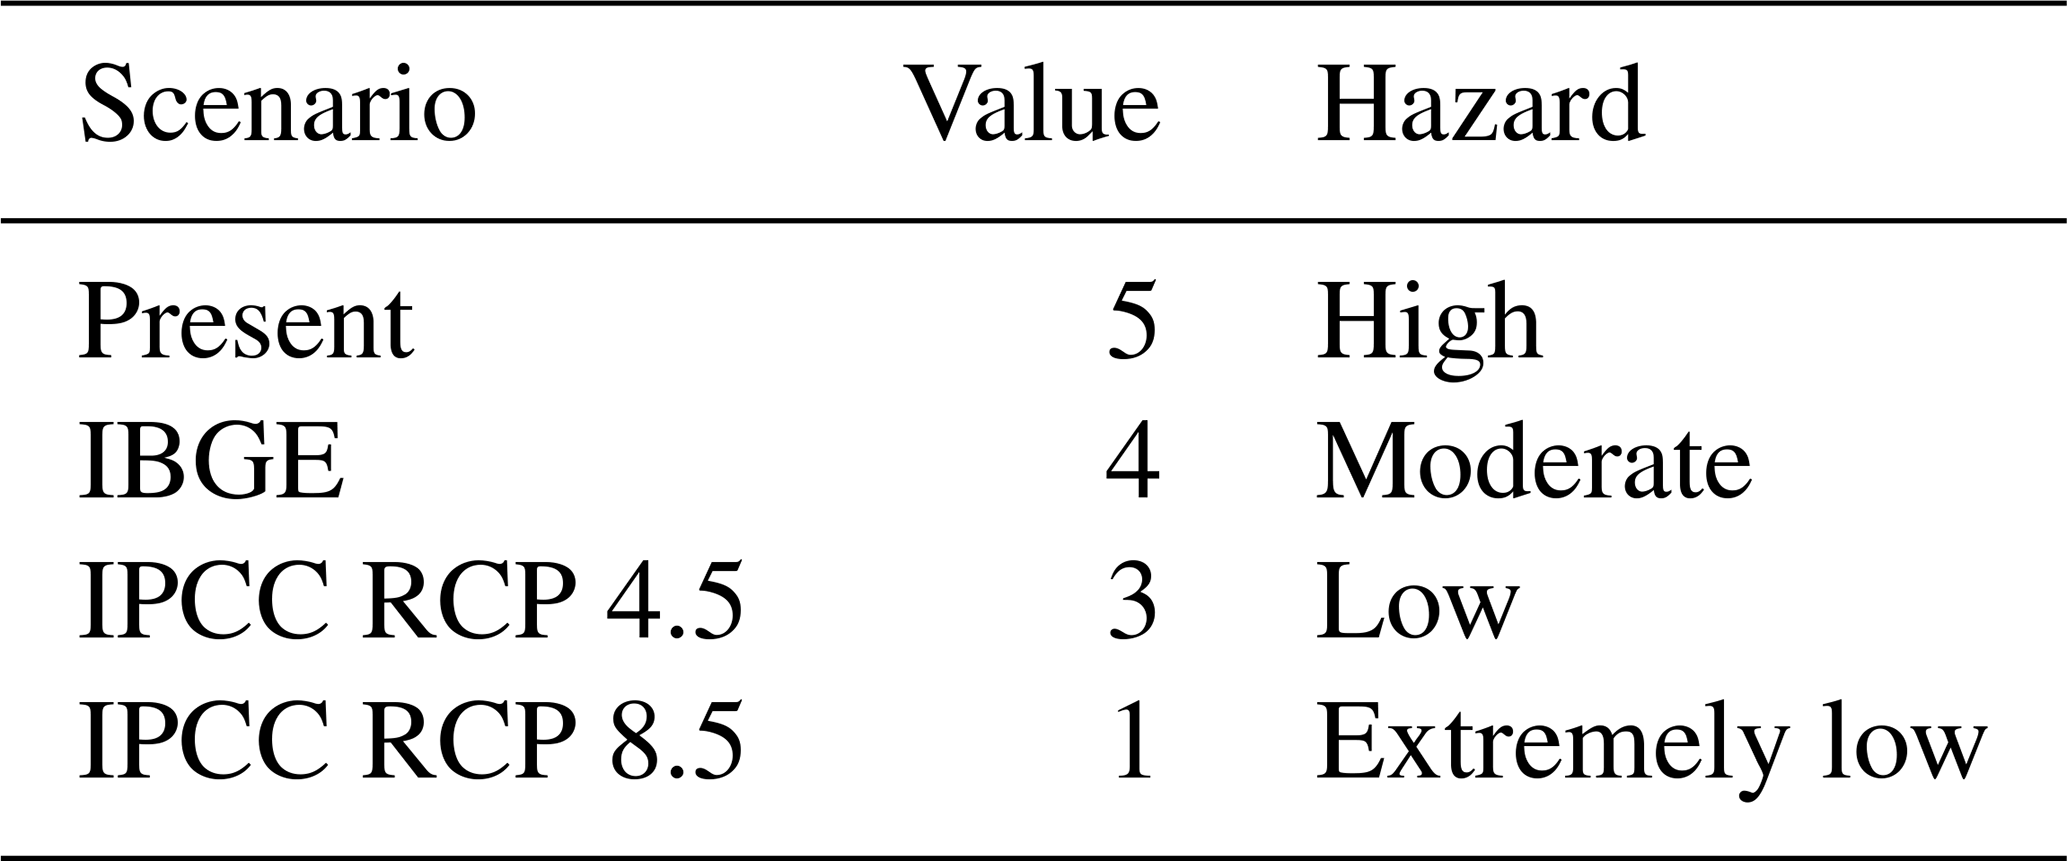
For tidal flood hazard mapping, four classes were assigned based on the scenarios under study, in addition to the current flooding (Table 1). Each class represented the quota resulting from the sum of
-
projection of MSL elevation to 2100
-
meteorological tide (Tr20)
-
astronomical tide linked to SGB (Tr20)
-
RMSE of DEM.
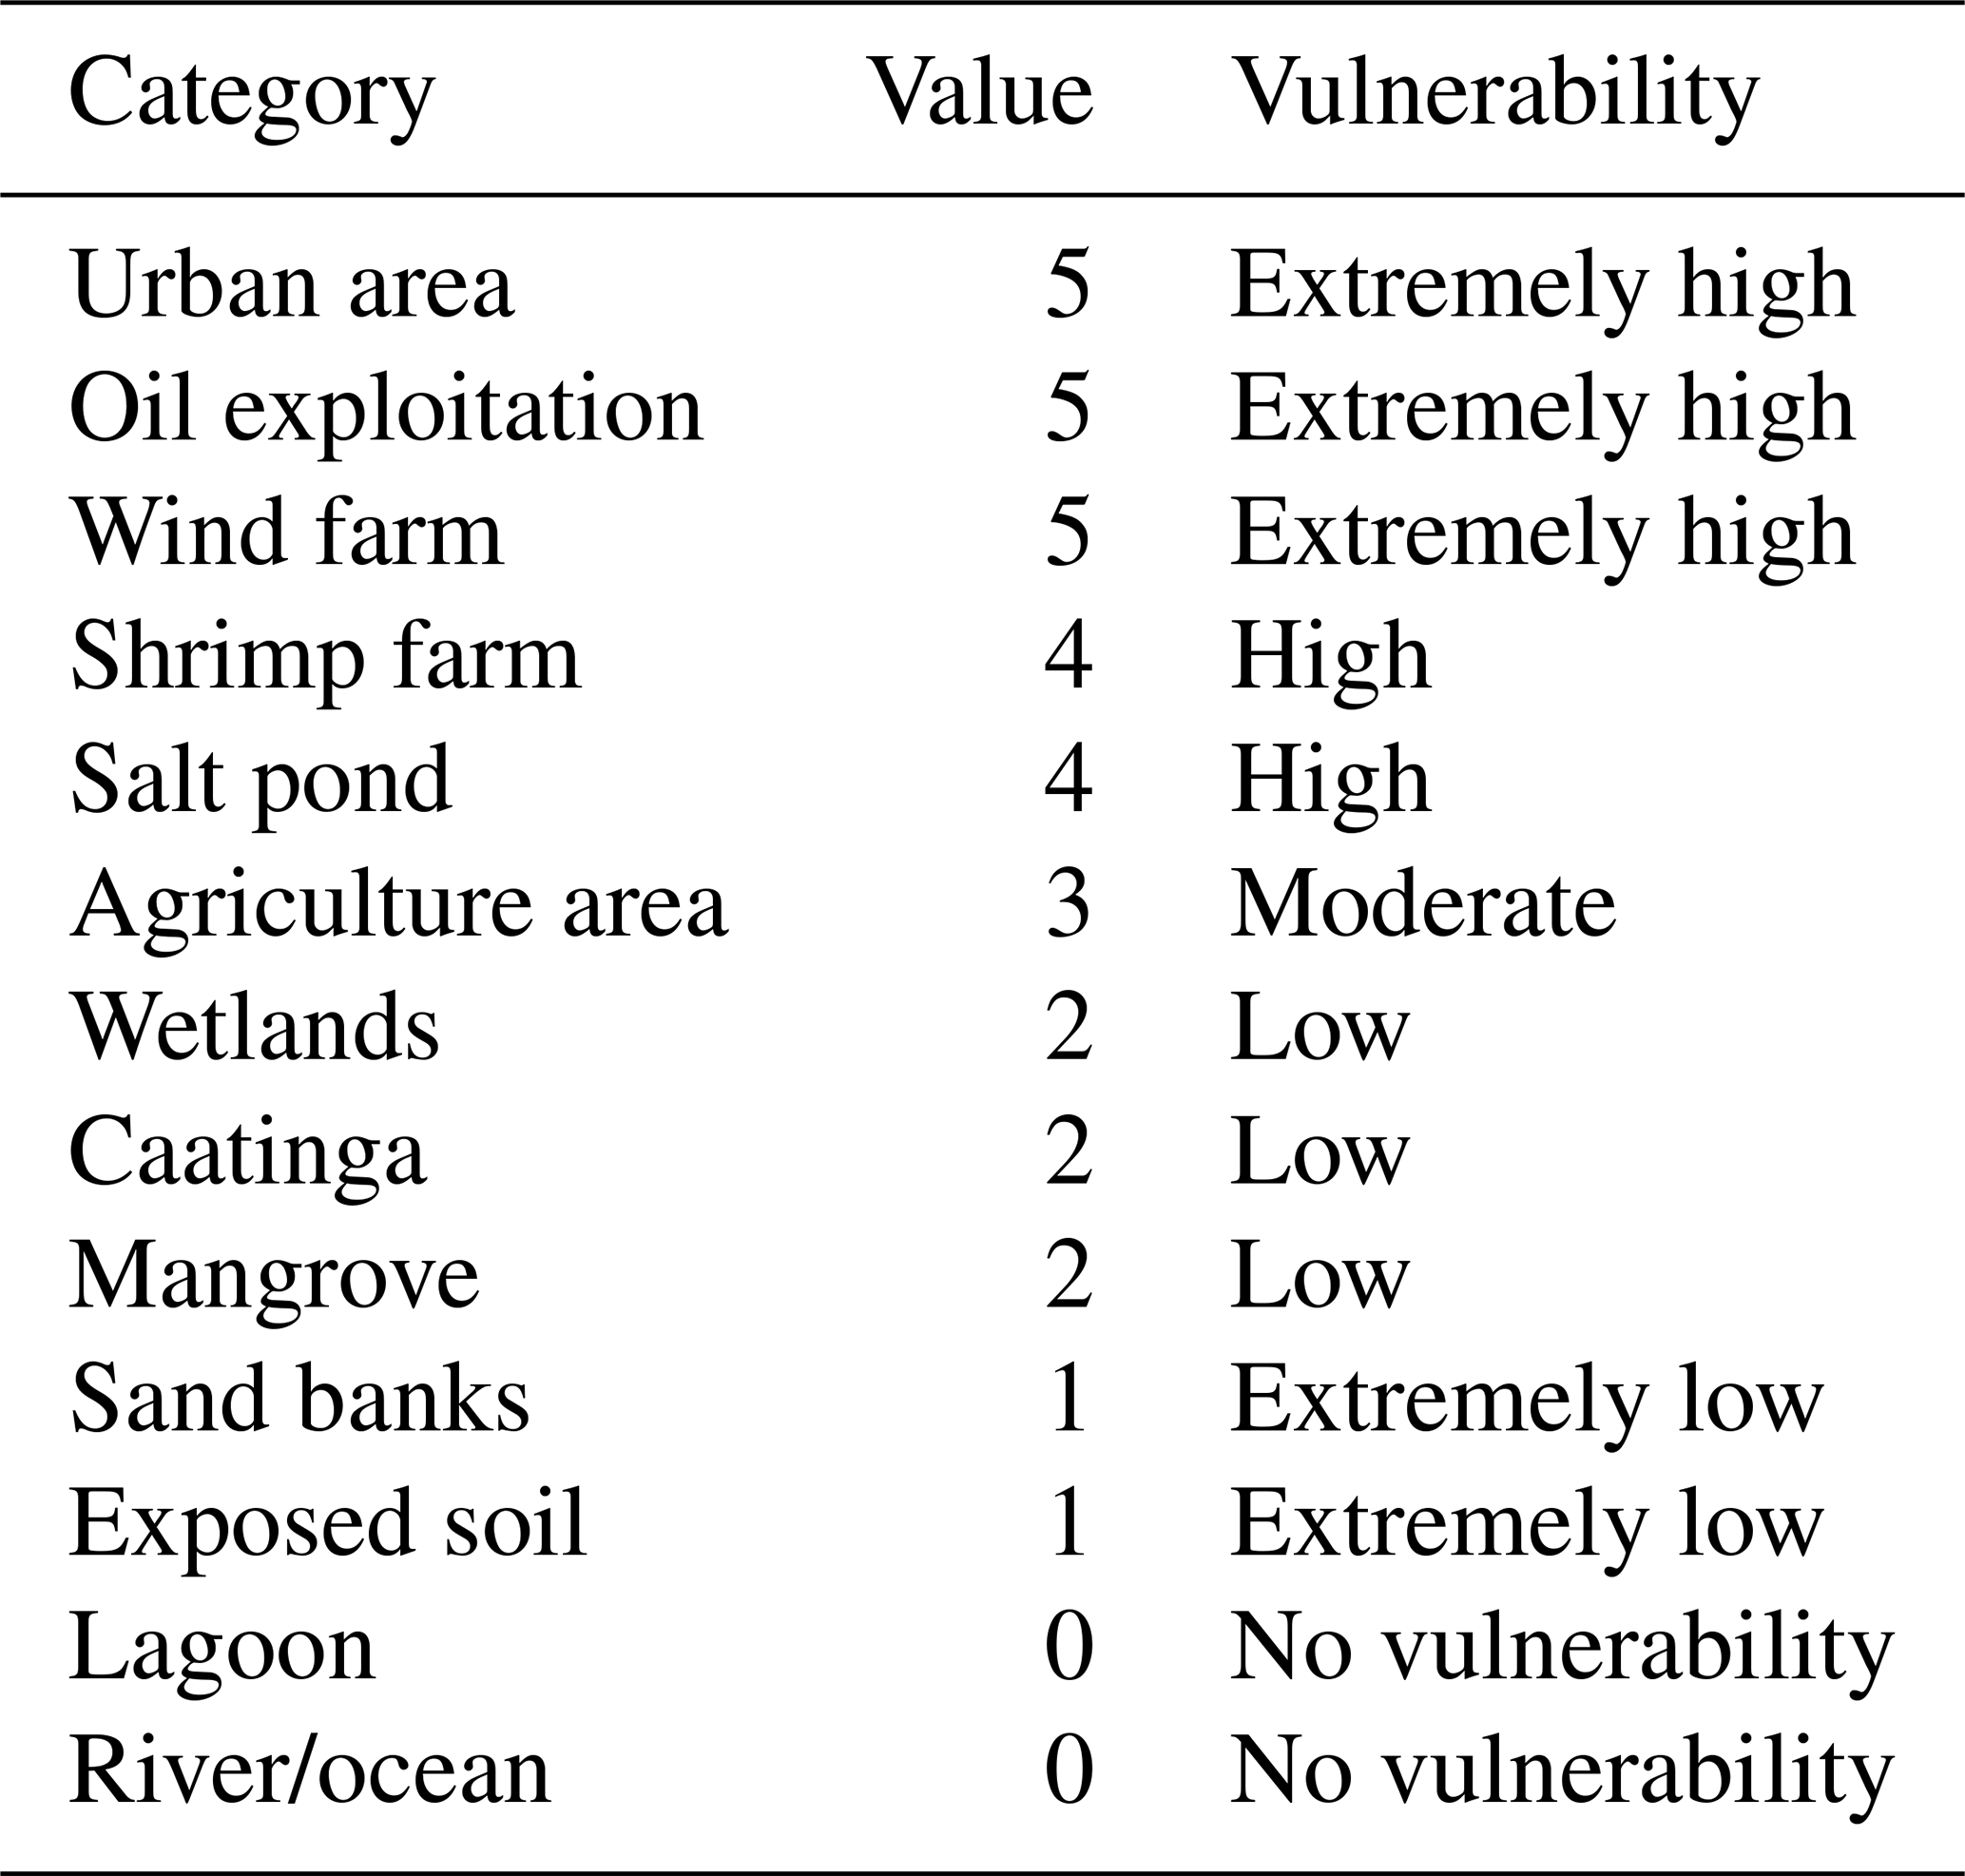
For the construction of the flood vulnerability mapping, the land use land cover mapping previously designed for this work was used as the basis. The land use and cover mapping vector file was transformed into a raster file with a spatial resolution of 1 m due to the spatial resolution of the altimetry data (DEM data). Finally, the raster file was reclassified with vulnerability values in scores from 0 (no vulnerable) to 5 (most vulnerable) assigned to the land use and cover category (Table 2).

After obtaining the flood hazard and vulnerability maps, the risk map was obtained using the risk equation mentioned above. The risk was classified into five classes according to the values in Table 3.
The flood risk mapping from high-resolution DEM provides the knowledge to optimize investments and provide flood risk management with high accuracy (Schröter et al., 2018). The standardized altimetry reference in centimetre intervals becomes essential, especially when there is an interest in the analysis of land use and cover or when economic activities occur in these environments in order to estimate risks with accuracy (Aguiar et al., 2019).
The flood quota reached in a region is a particularly complex phenomenon, both in the number of elements involved in the flooding process and in the interaction between these elements. However, it was possible to robustly model the complexity of tidal flooding that occurred in the Piranhas–Açu estuary, as well as the risk in its probabilistic potential for the coming years.
4.1 Tidal behaviour and return period
The effect of AT and MT on the coast is observed as a variation in sea level or free surface, and it is at this level that waves propagate (SMC-Brasil, 2018). From the GOS data and the DHN data applied in this research, it was possible to observe the tidal behaviour in the tropical Piancó–Piranhas–Açu estuary (Fig. 4).
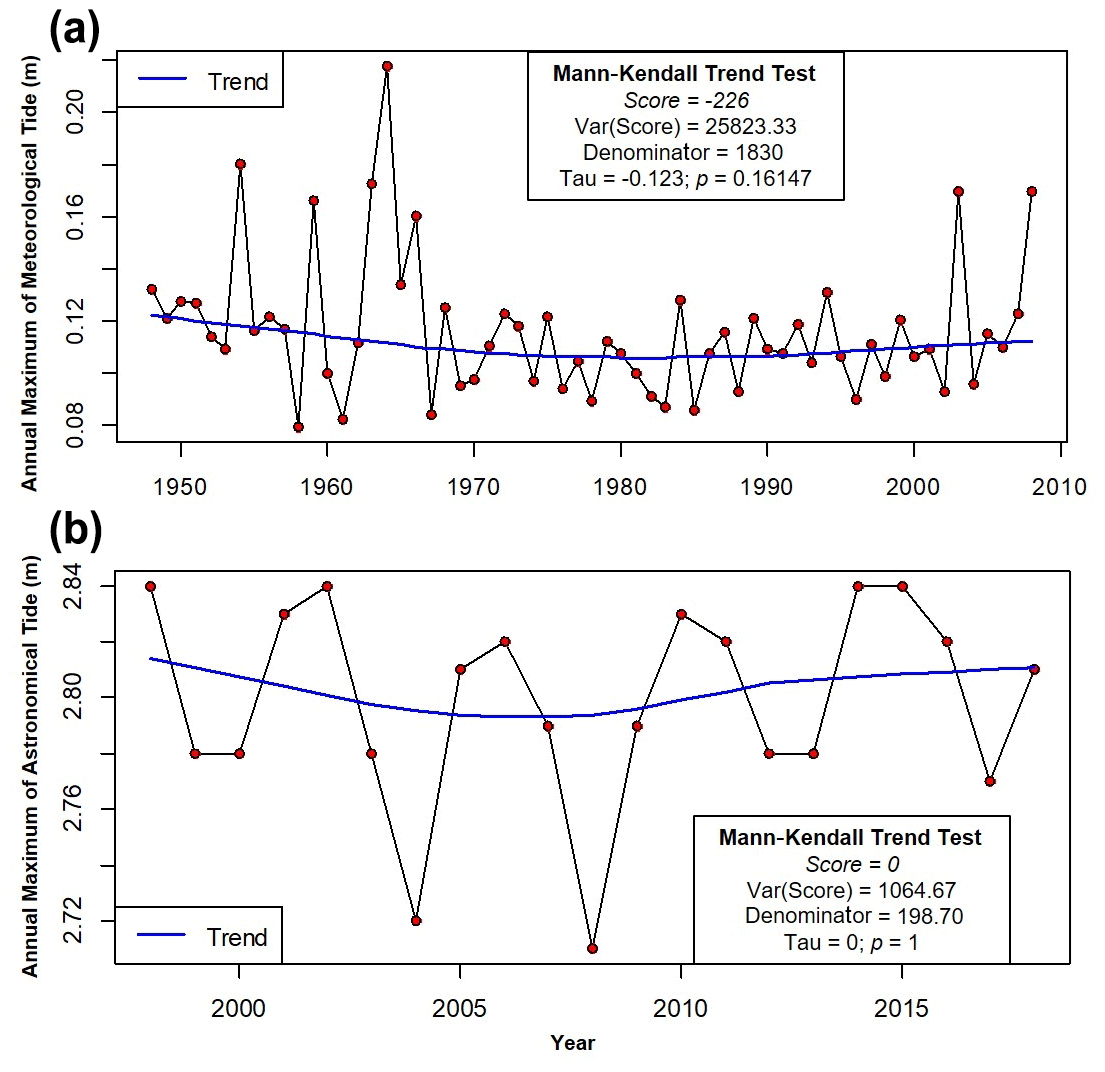
Figure 4Annual tide maximum level temporal series: (a) meteorological tide and (b) astronomical tide.
The meteorological surge or storm surge is a sea level fluctuation caused by weather effects mainly derived from wind and variations in pressure fields. Throughout the 61 years of data from the GOS point, the maximum annual quota of the meteorological tide presented an average of 12 cm and an amplitude of 14 cm, with a maximum of 22 cm and a minimum of 8 cm in the years 1964 and 1958, respectively. When applying the Mann–Kendall test, no statistically significant trend (Tau ; p= 0.16147) was observed in the data set.
The astronomical tide is the result of the interaction of the gravitational forces of Earth, Moon, and the Sun, which are completely predictable. With the DHN data set provided by the Brazilian Navy, it was observed that the maximum annual astronomical tide quota presented an average of 2.80 m and a 13 cm amplitude, with a maximum of 2.84 m and a minimum of 2.71 m. In the same study, when the Mann–Kendall test was applied, no statistically significant trend was observed (Tau = 0; p= 1), showing a steady pattern.
The descriptive values of the tides are presented to corroborate the values found in the literature. Frota et al. (2016), studying the tidal behaviour in the Brazilian northeast during the period from 2009 to 2011 with buoys about 200 km from the Piranhas–Açu estuary, found that the average maximum tide height was 2.79 m, ranging from 2.23 to 3.34 m. In the same study, Frota et al. (2016) found that the sea level variability in the sub-FT (the non-astronomical sea level signal) represents low oscillation, with a maximum of 0.12 m. Matos et al. (2019) made a scientific expedition from December 2010 to February 2011 to study significant wave heights and found that the tide table of Guamaré (approximately 40 km east of the table of Macau) had averages of 2.34 m (in syzygy tides) and 2.21 m (in quadrature tides), both above the reduction level.
Regarding the return period (Tr20years), estimated by the Gumbel distribution function, the values of 15.90 cm and 2.90 m were found for MT and AT, respectively (Fig. 5).

Figure 5Return period graph of tide data: (a) meteorological tide and (b) astronomical tide.
By performing the geodetic tracking of the DHN RN-2 framework, Macau's tide gauge was adjusted to the Brazilian Geodetic System (SGB), and in it, we found the RL orthometric altitude, represented by the value of −1.126 m (Fig. 3). Thus, the orthometric altitude of the maximum astronomical tide quota for the 20-year return period was 1.777 m, which served as a start for flood models.
4.2 Tidal flood hazard and vulnerability maps
It was possible to produce the four-class tidal flood hazard map for the study area based on the mean sea level projection values for the year 2100 (Table 4). In this map, the use of the astronomical tide quota in association with the Brazilian Geodetic System (SGB) was of paramount importance, thus ensuring that all input variables for flood hazard mapping were in the same geodetic framework.
After the spatialization of the classes in a GIS environment, we verified the spatial behaviour of the tidal flood hazard throughout the Piranhas–Açu estuary (Fig. 6a). In general, there was a positive north–south gradient, with a predominance of the flood class of the present scenario (high hazard). The high hazard class represented 257.60 km2 of the estuary flood hazard, while the moderate hazard, low hazard, and extremely low hazard classes represented 286.26, 338.67, and 359.42 km2 , respectively.
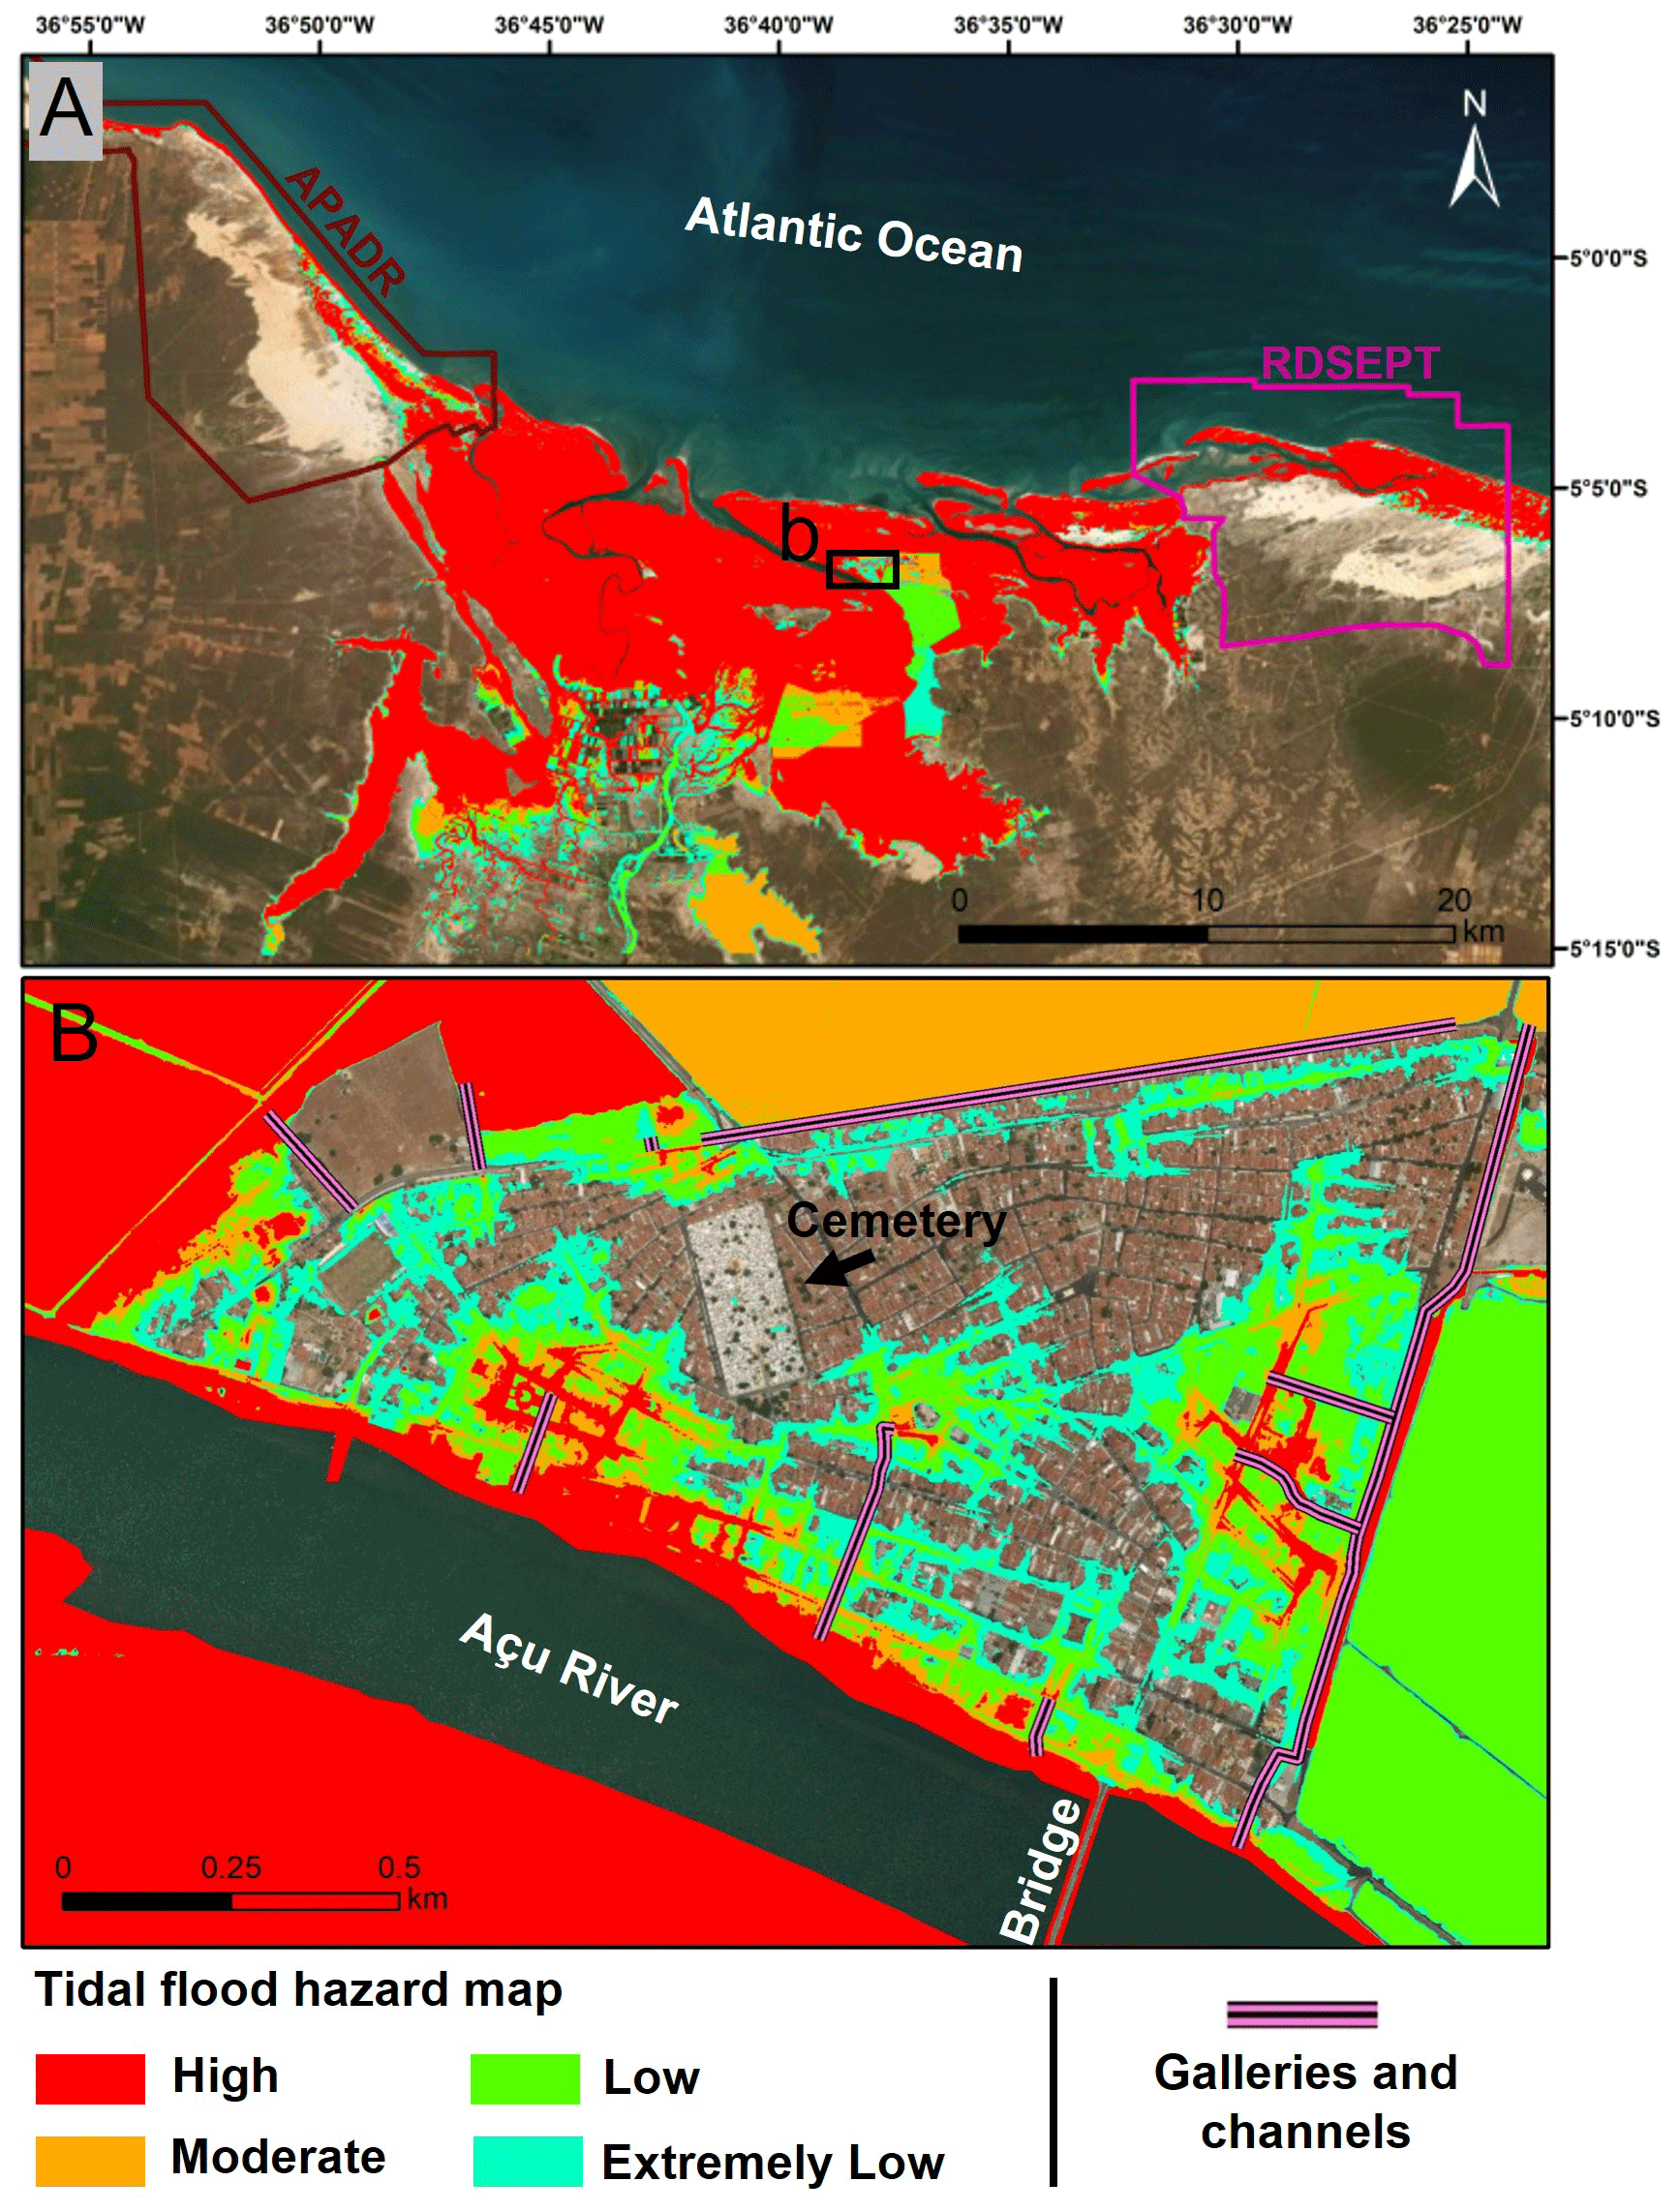
Figure 6Tidal flood hazard map: (a) total area under study and (b) detail in Macau urban area. Basemap from ArcGIS Online: © ESRI.
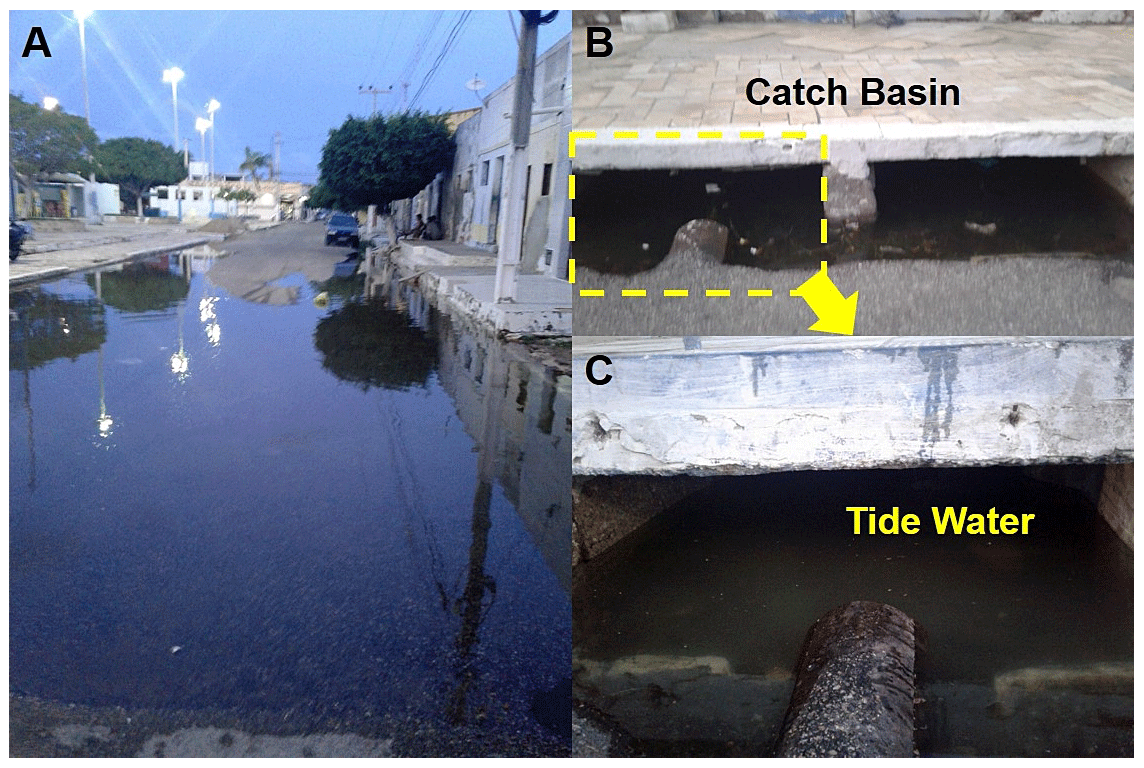
Figure 7Tidal flood through the rain drainage system: (a) tidal flooding event on 10 March 2020 (Macau urban area); (b) example of local catch basin; and (c) catch basin in detail.
Tidal flood stains were observed inside the urban area of the city of Macau. These spots are justified by the current layout of the city's drainage system, in which at high-tide times seawater enters the galleries and canals, affecting the interior of the city (Figs. 6b and 7). Aguiar et al. (2019) found the same structural problem in the urban area of the city of Areia Branca (approximately 58 km west of the city of Macau). It is important to mention that the land on which the local cemetery is in the urban area of Macau is one of the few urban sectors in the city not to suffer from tidal flood scenarios. This result becomes extremely important for the future urban planning of the city.
It was found that the flood event of January 3, 2015, had an orthometric altitude of 1.73 m (Fig. 8). The same spatial pattern of tidal flooding was observed between the photographic record and the flood model proposed in this work, thus validating the applied flood model.

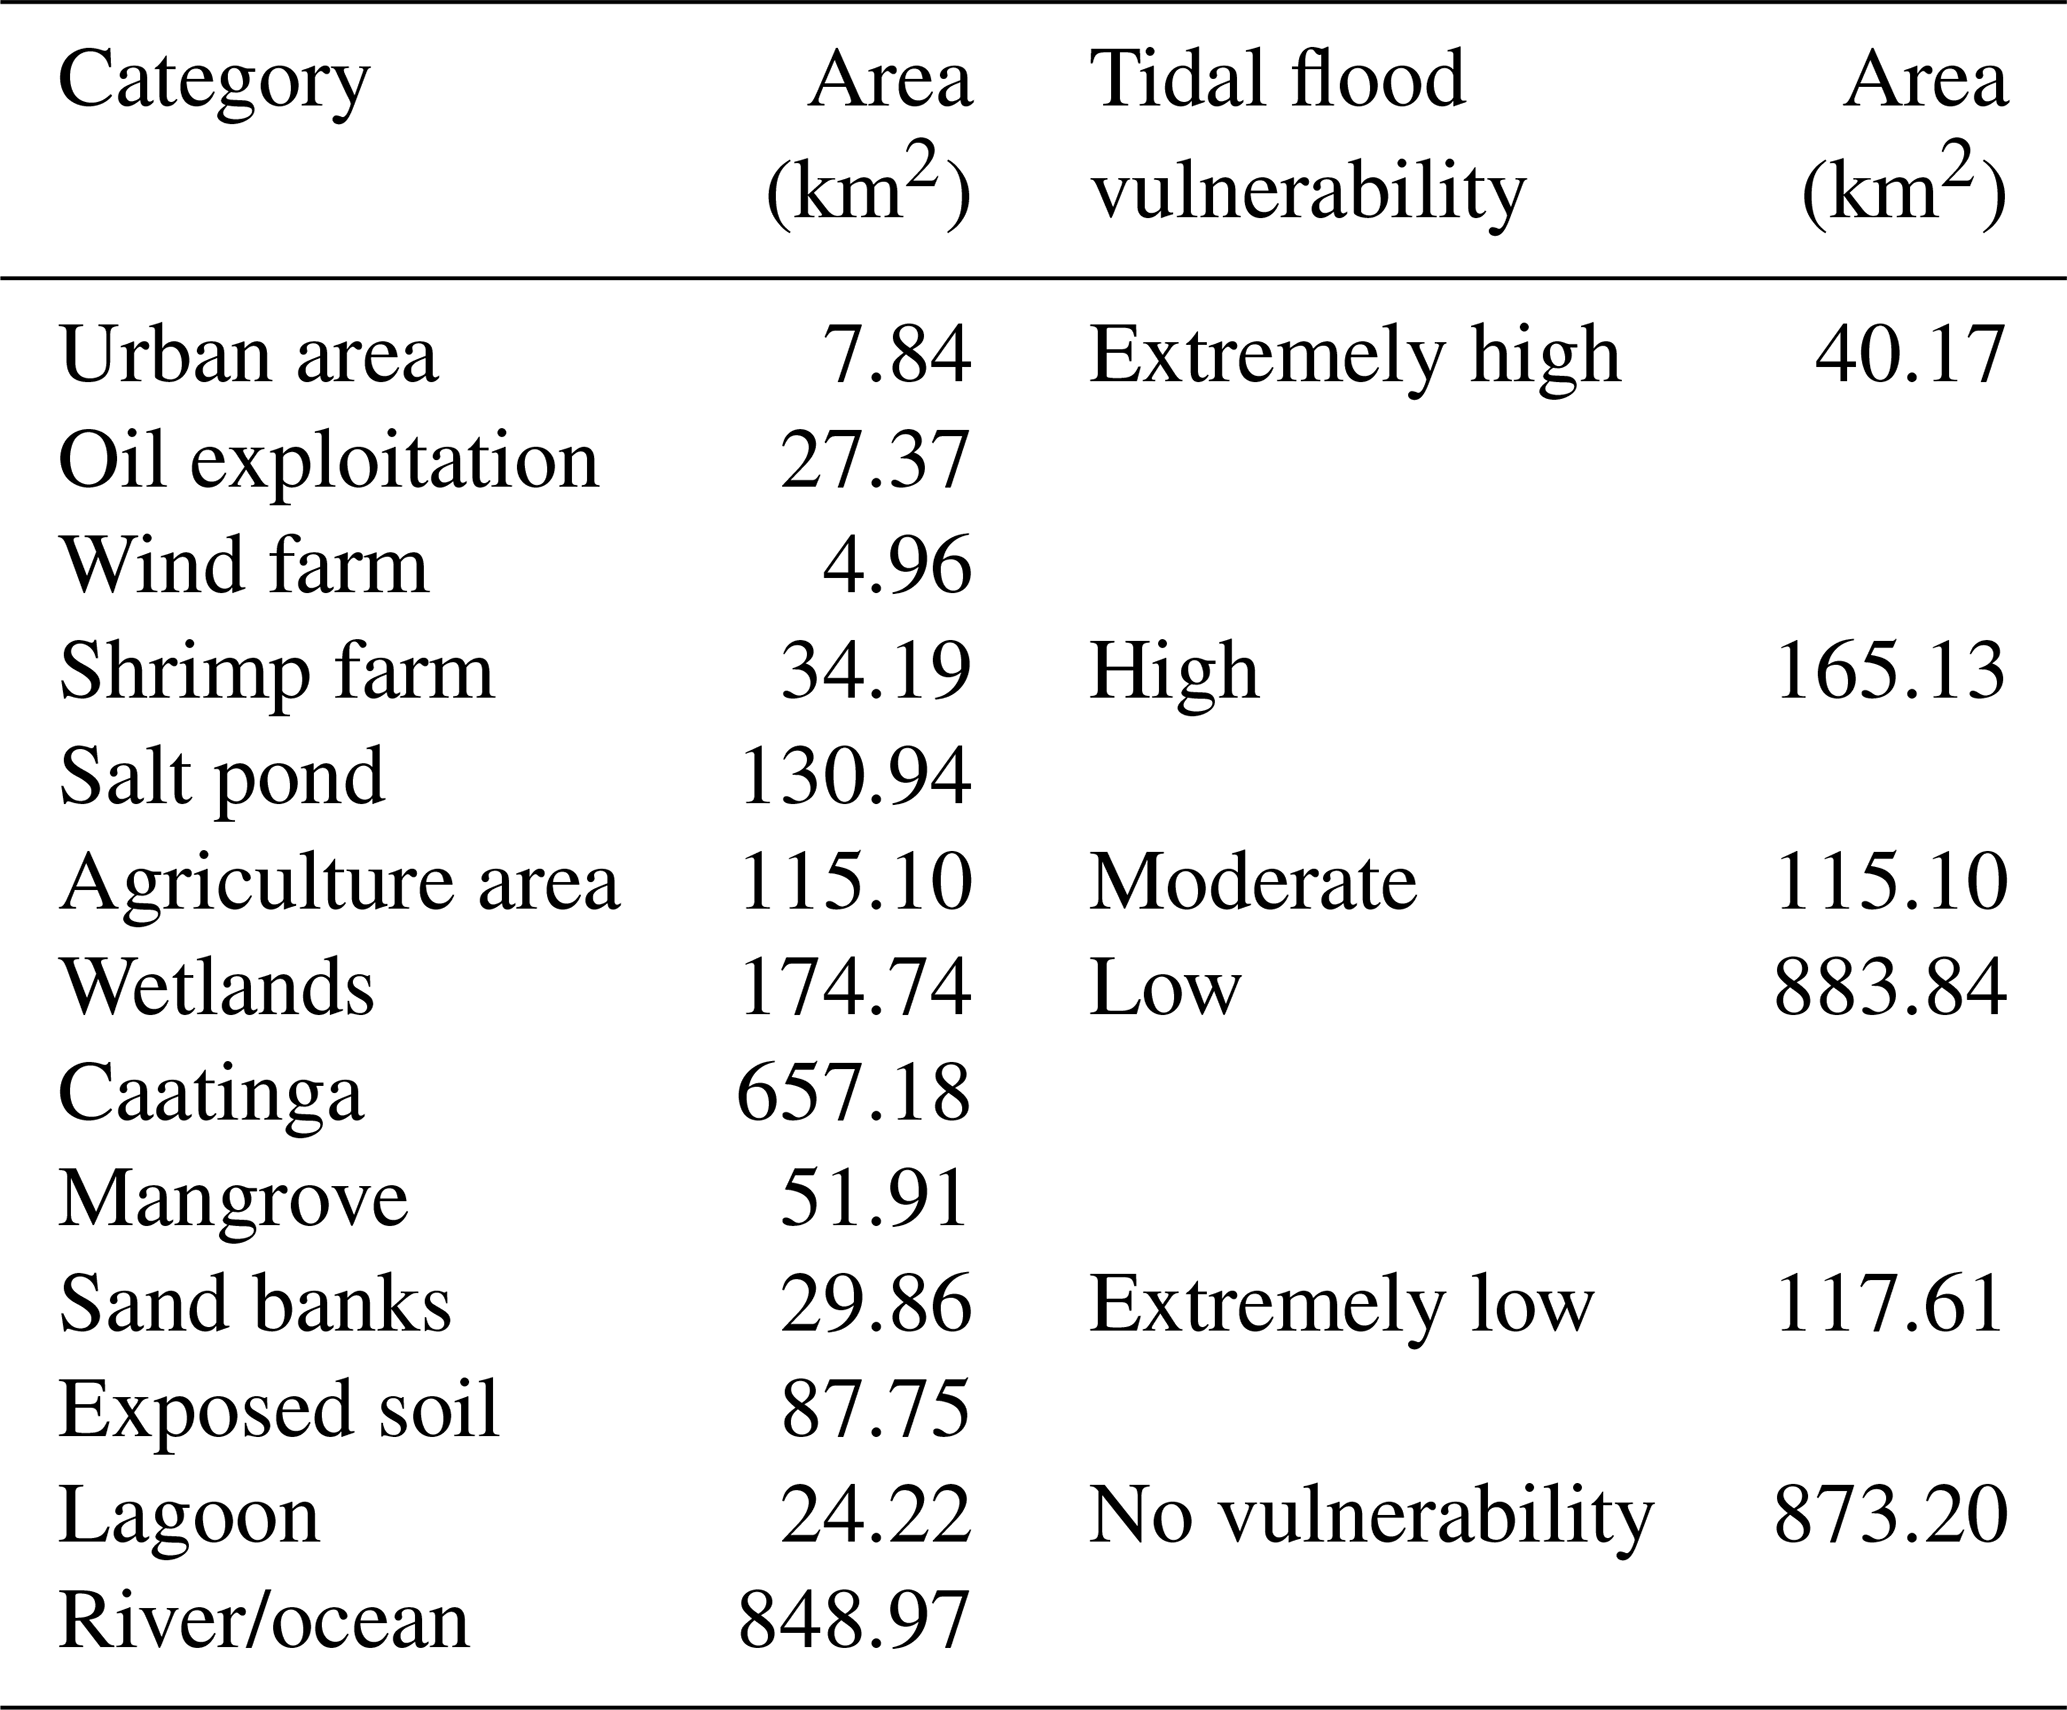
By ranking the mapping of the land use and land cover, we obtained the quantification of the areas of the mapped units (Table 5 and Fig. 9), highlighting the Caatinga area, which corresponded to 657.18 km2.

Figure 8Tidal flooding events on the northern coast of Rio Grande do Norte state: (a) photographic record of Diogo Lopes community, Macau City, on 3 January 2015 (Tiago Ezequiel) and (b) simulated flood event for Diogo Lopes community on 3 January 2015. Orthometric height of tidal flood = 1.73 m. Basemap from Google Earth Pro: © Google LLC.
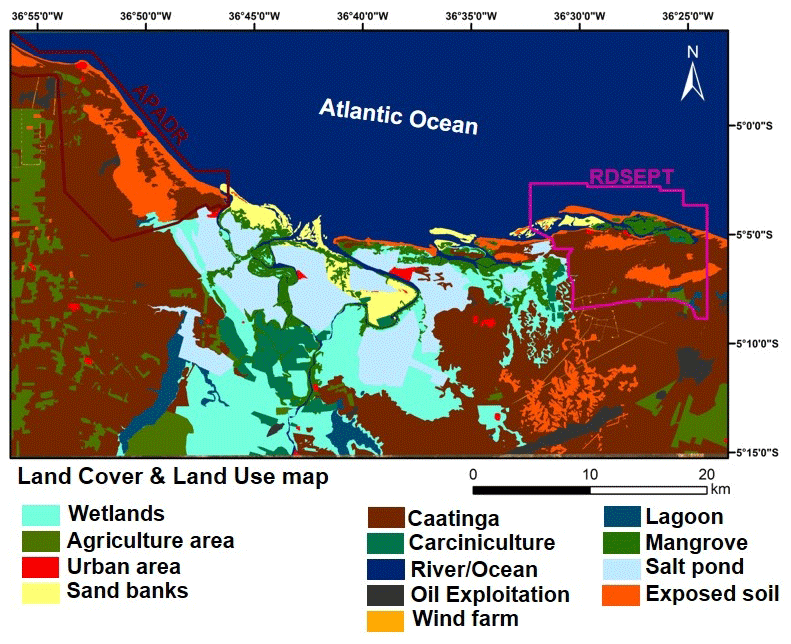
Figure 9Land cover and land use map for study area.
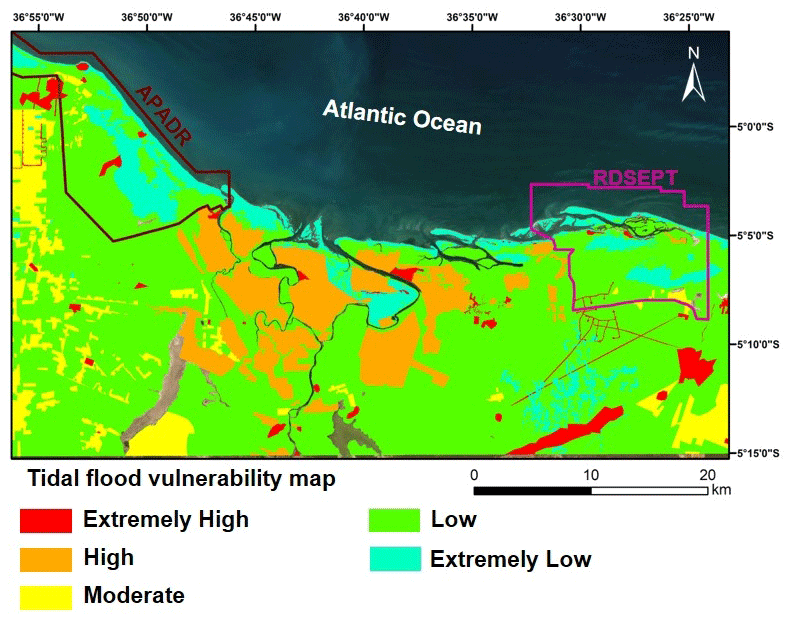
Figure 10Tidal flood vulnerability map.
Regarding the vulnerability map, it was observed that 66.86 % (883.84 km2) of the vulnerable areas had low flood vulnerability (Table 5 and Fig. 10). However, it is important to note that 16 % of vulnerable areas have high and extremely high vulnerability, corresponding to an area of 205.30 km2.
4.3 Tidal flood risk map
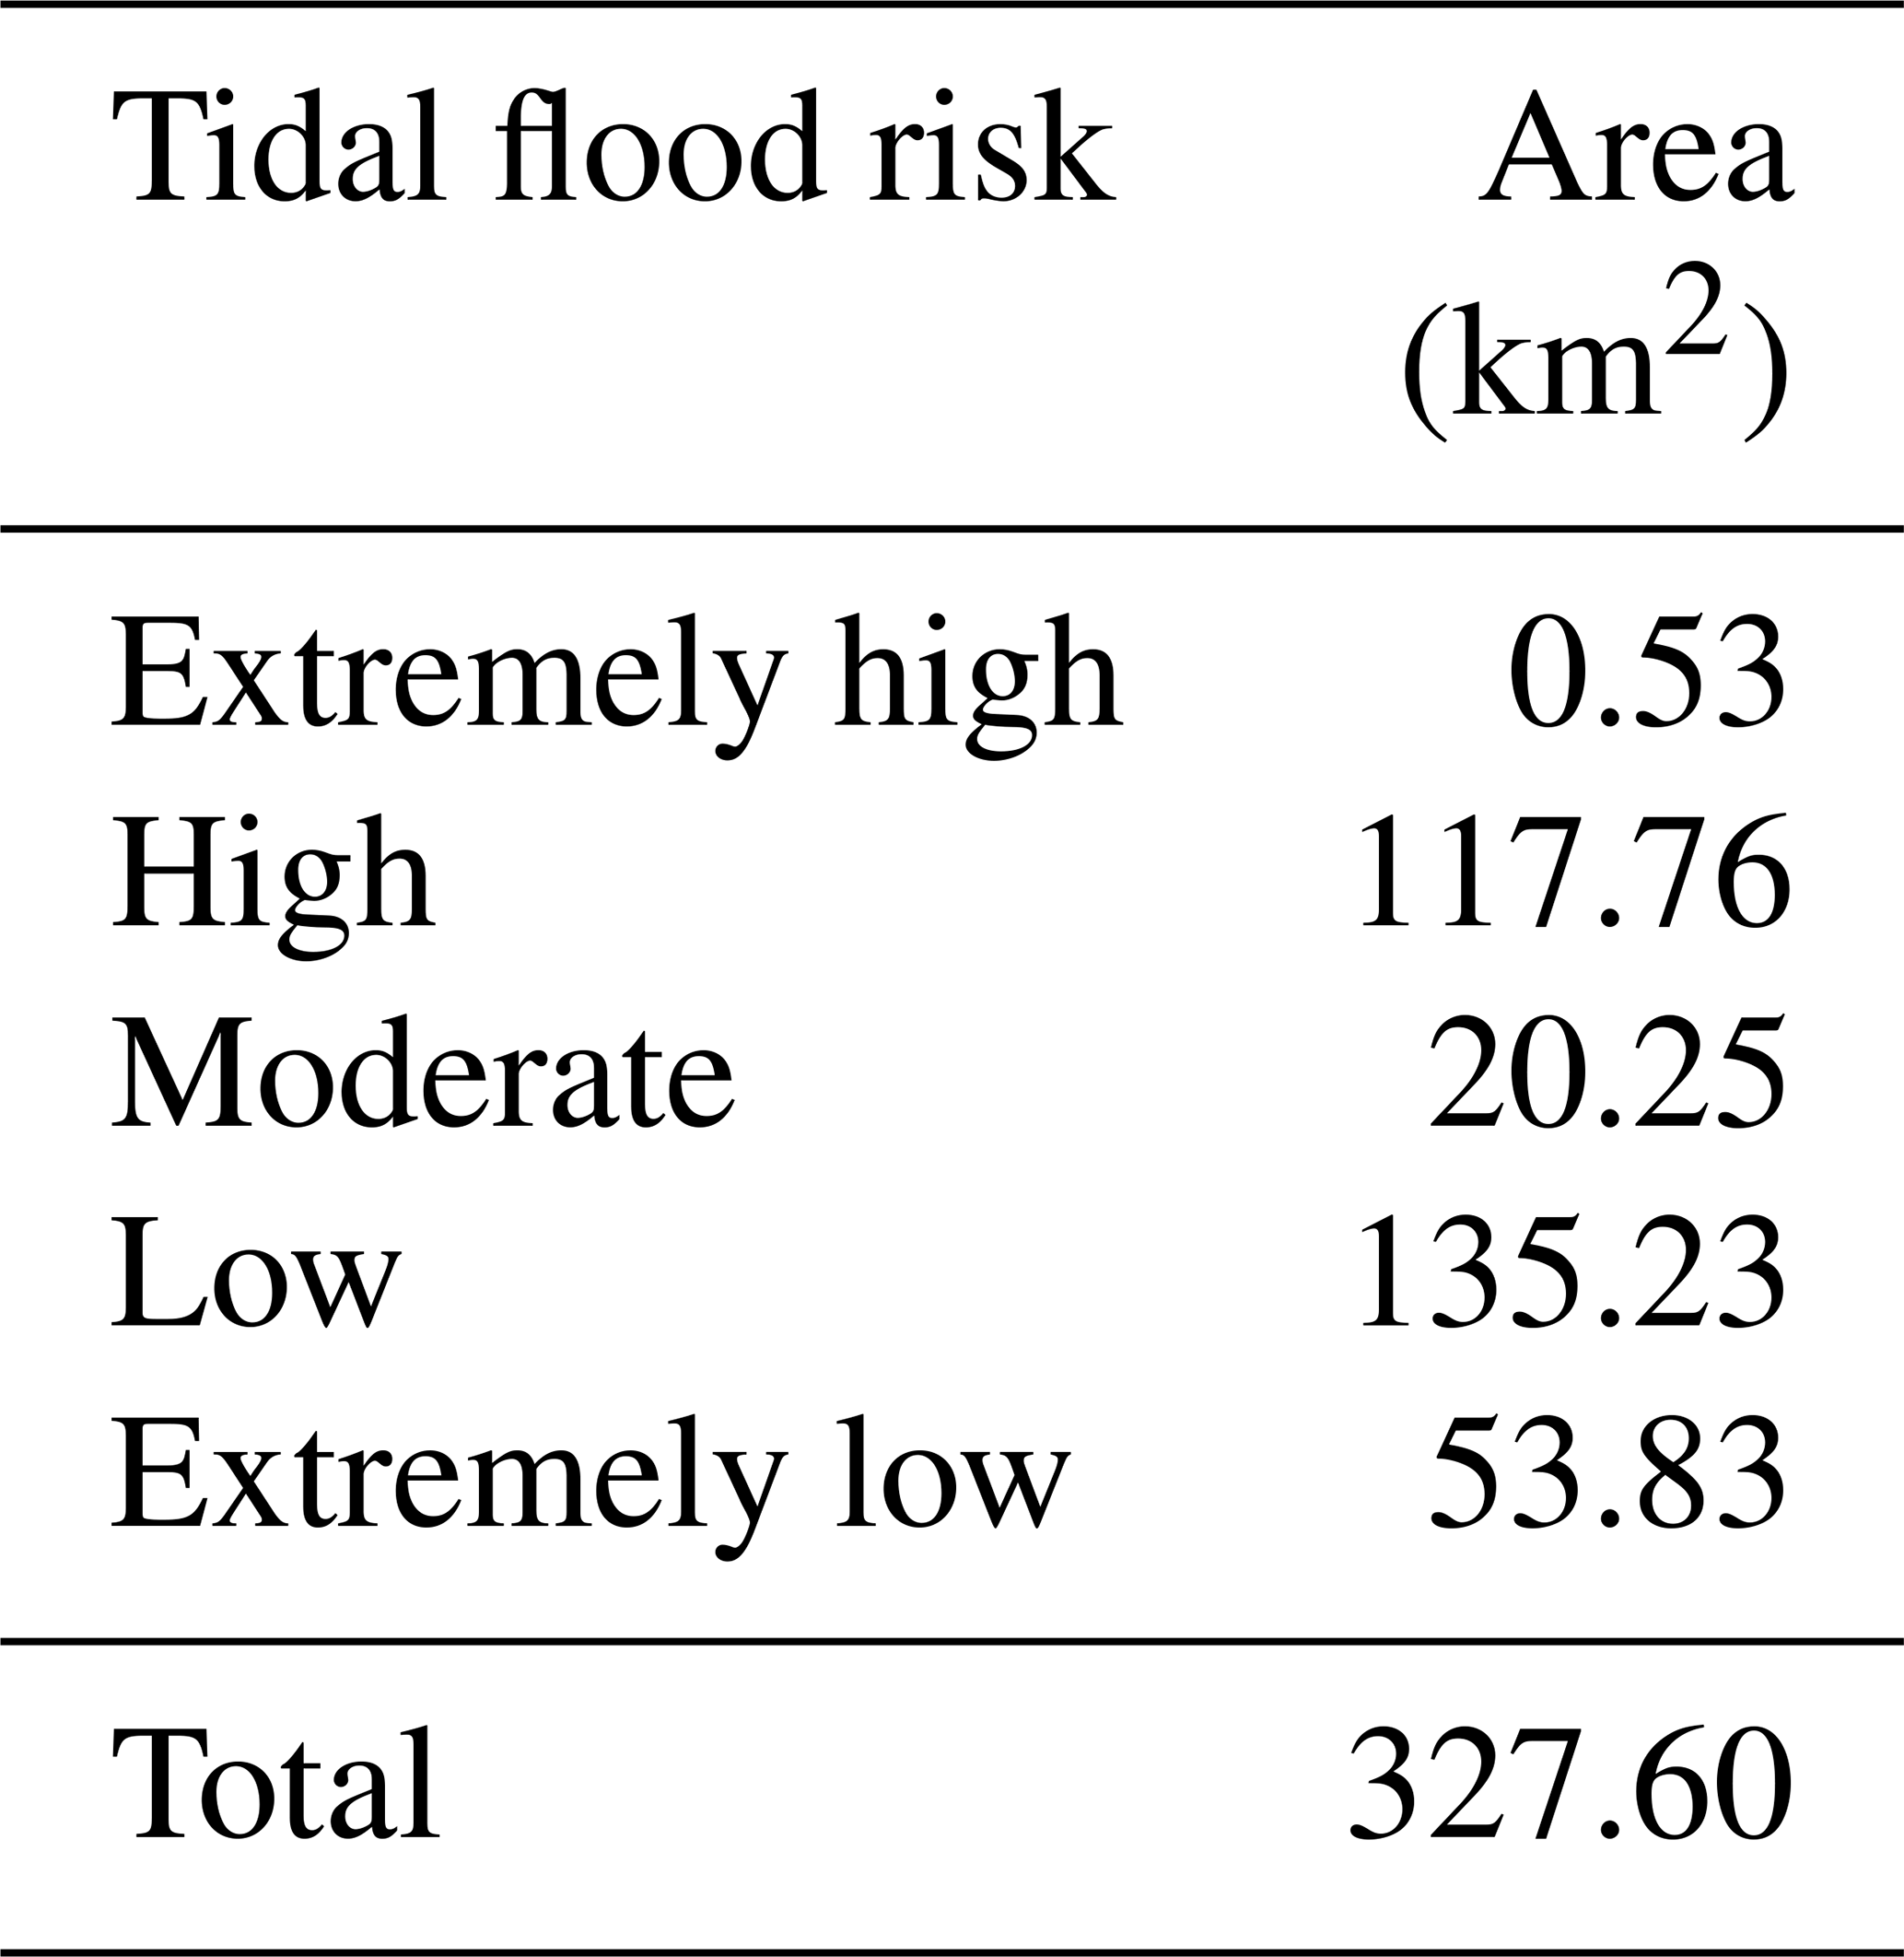
From the result of flood hazard and vulnerability mappings, the flood risk map was obtained (Table 6 and Fig. 11).
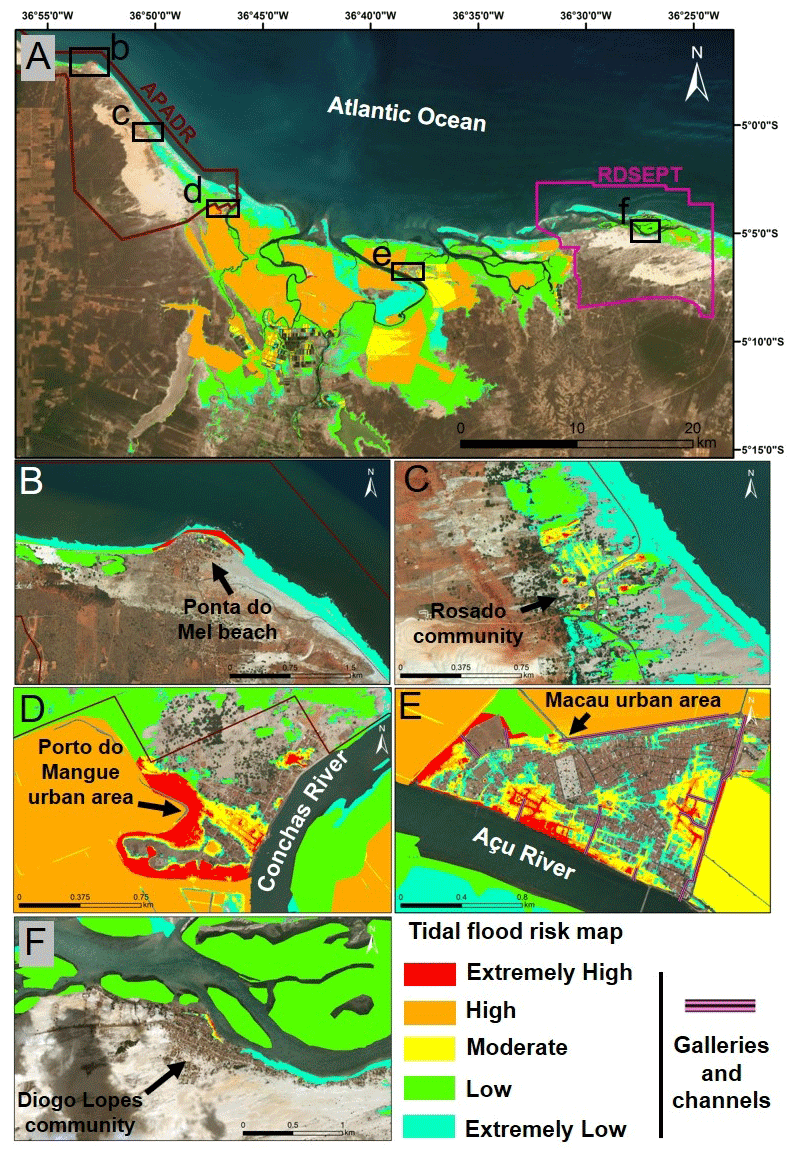
Figure 11Tidal flood risk map for Piranhas–Açu estuary: (a) view of entire study area; (b) Ponta do Mel community; (c) Rosado community; (d) Porto do Mangue urban area; (e) Macau urban area; and (f) Diogo Lopes community. Basemap from ArcGIS Online: © ESRI.
The risk areas represent a total of approximately 360 km2, where the 135.23 km2 low-risk class stands out, while the other classes represented 85.64 km2 (extremely low risk), 20.25 km2 (moderate risk), 117.73 km2 (high risk), and 0.53 km2 (extremely high-risk). Extremely high-risk environments were sections of the urban areas of the cities of Porto do Mangue and Macau and the communities of Ponta do Mel, Rosado, and Diogo Lopes (Fig. 10).
The SLR by a few millimetres per year is an important variable since loss of land in lowland areas can quickly destroy coastal ecosystems such as lagoons, coastal lakes, and mangroves. In addition to flooding of socio-economically and environmentally sensitive relevant areas, the SLR can change the energy balance of coastal environments, causing large variations in the sedimentary process and, consequently, erosion of large stretches of shoreline (Castro et al., 2010). In the Piranhas–Açu estuary, SLR was not statistically significant, and we believe that the temporal scale of the meteorological tide data set (1948 to 2008) favoured the masking of this phenomenon since it has been reported by the local community and the news for the last 10 years only.
It is possible that tidal flooding in the region under study has been closely linked to rising sea levels in recent years. Extreme tidal weather events are the main factor in flood danger. Flood hazard, vulnerability, and risk maps are crucial for planning and intervention in flood-prone areas. The case study results for the Piranhas–Açu estuary can be used by local environmental management mainly to characterize risk zones and support the implementation of tidal flood risk management plans in this coastal area. The materials and methodology applied to this study area have proven to be effective in identifying tidal flood risk areas using a high-resolution DEM that has been calibrated based on high-precision GNSS, historical tidal quota data, and geoprocessing techniques.
It is noteworthy that the methodological approach to the Piranhas–Açu estuary is suitable to be replicated with other estuaries, particularly those in Brazilian semi-arid regions (estuaries with low hydrological contribution from rivers). The application of tidal flood risk mapping may be particularly useful for regions with a good historical series of tidal databases. In this case study, the tide flood event modelling of 2015 was compared with the photographic records of the respective event and established high visual similarity between them.
This paper also demonstrates that well-applied geoprocessing techniques, such as GIS and high-precision geodetic features, provide results that can be very effective in environmental management with low-cost investments, highlighting the unique features of a given locality, especially floodplains and wetlands.
All data included in this study are available upon request by contacting the corresponding author.
PVNA and VEA designed the study. PVNA, CCLA, and ABL conducted the acquisition of geodetic data. PVNA, LSA, and CCL conducted the analysis and wrote the paper. All authors reviewed this paper.
The authors declare that they have no conflict of interest.
Publisher’s note: Copernicus Publications remains neutral with regard to jurisdictional claims in published maps and institutional affiliations.
This article is part of the special issue “Remote sensing and Earth observation data in natural hazard and risk studies”. It is not associated with a conference.
The authors express special thanks to Petrobras for providing lidar digital elevation model data. We also thank the reviewers of the Natural Hazards and Earth System Sciences (NHESS) journal for their many insightful comments.
This paper was edited by Paolo Tarolli and reviewed by three anonymous referees.
Aguiar, L. S., Amaro, V. E., Araújo, P. V. N., and Santos, A. L. S.: Geotecnologias de Baixo Custo Aplicadas à Avaliação de Risco por Inundação em Áreas Urbanas Costeiras em Cenários de Mudanças Climáticas, Anuário do Instituto de Geociências – UFRJ, 42, 267–290, https://doi.org/10.11137/2019_1_267_290, 2019.
Amaro, V. E., Santos, M. S. T., and Souto, M. V. S.: Geotecnologias Aplicadas ao Monitoramento Costeiro: Sensoriamento Remoto e Geodésia de Precisão, 1st Ed., Edição dos Autores, Natal, RN, 118 pp., 2012.
ANA – Agência Nacional das Águas: Plano de recursos hídricos da bacia hidrográfica do rio Piancó-Piranhas-Açu, Brasília-DF, 167 pp., available at: http://piranhasacu.ana.gov.br/produtos/PRH_PiancoPiranhasAcu_ResumoExecutivo_30062016.pdf (last access: 25 June 2019), 2016.
Araújo, P. V. N., Amaro, V. E.; Alcoforado, A. V. C., and Santos, A. L. S.: Acurácia Vertical e Calibração de Modelos Digitais de Elevação (MDEs) para a Bacia Hidrográfica Piranhas-Açú, Rio Grande do Norte, Brasil, Anuário do Instituto de Geociências – UFRJ, 41, 351–364, https://doi.org/10.11137/2018_1_351_364, 2018.
Araújo, P. V. N., Amaro, V. E., Silva, R. M., and Lopes, A. B.: Delimitation of flood areas based on a calibrated a DEM and geoprocessing: case study on the Uruguay River, Itaqui, southern Brazil, Nat. Hazards Earth Syst. Sci., 19, 237–250, https://doi.org/10.5194/nhess-19-237-2019, 2019.
Bamber, J. L., Oppenheimer, M., Kopp, R. E., Aspinall, W. P., and Cookeh, R. M.: Ice sheet contributions to future sea-level rise from structured expert judgment, P. Natl. Acad. Sci. USA, 116, 11195–11200, https://doi.org/10.1073/pnas.1817205116, 2019.
Barbosa, M. E. F., Boski, T., Bezerra, F. H. R., Gomes, M. P., Lima-Filho, F. P., Pereira, L. C., and Maia, R. P.: Late Quaternary infilling of the Assu River embayment and related sea level changes in NE Brazil, Mar. Geol., 405, 23–37, https://doi.org/10.1016/j.margeo.2018.07.014, 2018a.
Barbosa, M. E. F., Bezerra, F. H. R., Boski, T., Lima-Filho, F. P., and Valdevino, D. S.: Padrões geomorfológicos na região estuarina do Rio Assu, NE – Brasil, Revista Brasileira de Geomorfologia, 19, 525–545, https://doi.org/10.20502/rbg.v19i3.1208, 2018b.
Boori, M. S., Amaro, V. E., and Targino, A.: Coastal risk assessment and adaptation of the impact of sea-level rise, climate change and hazards: A RS and GIS based approach in Apodi-Mossoró estuary, Northeast Brazil, International Journal of Geomatics and Geosciences, 2, 815–832, 2012.
Brasil: Plano Nacional de Adaptação à Mudança do Clima, estratégias setoriais e temáticas, Ministério do Meio Ambiente, Brasília-DF, v.2, 295 pp., available at: https://www.mma.gov.br/images/arquivo/80182/LIVRO_PNA_ Plano Nacional_V2_copy_copy.pdf (last access: 12 April 2019), 2016.
Busman, D. V., Amaro, V. E., and Souza-Filho, P. W. M.: Análise Estatística Multivariada de Métodos de Vulnerabilidade Física em Zonas Costeiras Tropicais, Revista Brasileira de Geomorfologia, 17, 499–516, https://doi.org/10.20502/rbg.v17i3.912, 2016.
Castro, B. M., Brandini, F. P., Wainer, I. E. K. C., and Dottori, M.: O mar de amanhã, com as mudanças climáticas de hoje, Ciência e Cultura, 62, 40–42, available at: http://cienciaecultura.bvs.br/pdf/cic/v62n3/a16v62n3.pdf (last access: 11 November 2019), 2010.
CHM – Centro de Hidrografia da Marinha, Marinha do Brasil: Sondagem batimétrica, available at: https://www.marinha.mil.br/chm/dados-do-segnav-lev-hidro/sondagem-batimetrica, last access: 20 April 2019a.
CHM – Centro de Hidrografia da Marinha. Marinha do Brasil. Maregrafia e fluviometria. available at: https://www.marinha.mil.br/chm/dados-do-segnav-lev-hidro/maregrafia-e-fluviometria, last access: 20 April 2019b.
Costa, L. R. F., Maia, R. P., Barreto, L. L., and Sales, V. C. C.: Geomorfologia do nordeste setentrional brasileiro: uma proposta de classificação, Revista Brasileira de Geomorfologia, 21, 185–208, https://doi.org/10.20502/rbg.v21i1.1447, 2020.
Dahl, K. A., Fitzpatrick, M. F., and Spanger-Siegfried, E.: Sea level rise drives increased tidal flooding frequency at tide gauges along the U.S. East and Gulf Coasts: Projections for 2030 and 2045, PLoS ONE, 12, e0170949, https://doi.org/10.1371/journal.pone.0170949, 2017.
Church, J. A., Clark, P. U., Cazenave, A., Gregory, J. M., Jevrejeva, S., Levermann, A., Merrifield, M. A., Milne, G. A., Nerem, R. S., Nunn, P. D., Payne, A. J., Pfeffer, W. T., Stammer, D., and Unnikrishnan, A. S.: Sea level change, in: Climate Change 2013: The Physical Science Basis. Contribution of Working Group 1 to the Fifth Assessment Report of the Intergovernmental Panel on Climate Change, edited by: Stocker, T. F., Qin, D., Plattner, G.-K., Tignor, M., Allen, S. K., Boschung, J., Nauels, A., Xia, Y., Bex, V., and Midgley, P. M., Cambridge, England and New York, NY: Cambridge University Press, 1137–1216, 2013.
Dangendorf, S., Hay, C., Calafat, F. M., Marcos, M., Piecuch, C. G., Berk, K., and Jensen, J.: Persistent acceleration in global sea-level rise since the 1960s, Nat. Clim. Change, 9, 705–710, https://doi.org/10.1038/s41558-019-0531-8, 2019.
DHN – Diretoria de Hidrografia e Navegação: Tábuas de marés, available at: https://www.marinha.mil.br/chm/tabuas-de-mare, last access: 3 January 2018.
Diniz, C. H. G., Amaro, V. E., Prudêncio, M. C., and Felipe R. F.: Representação Tridimensional de Processos de Erosão Costeira em Ilhas Barreiras Utilizando Tecnologia de Jogos, Anuário do Instituto de Geociências – UFRJ, 40, 147–158, https://doi.org/10.11137/2017_3_147_158, 2017.
Diniz, M. T. M. and Pereira, V. H. C.: Climatologia do Estado do Rio Grande do Norte, Brasil: sistemas atmosféricos atuantes e mapeamento de tipos de clima, Boletim Goiano de Geografia, 35, 488–506, https://doi.org/10.5216/bgg.v35i3.38839, 2015.
Dwarakisha, G. S., Vinaya, S. A., Natesanb, U., Asanoc, T., Kakinumac, T., Venkataramanad, K., Paia, B. J., and Babitaa, M. K.: Coastal vulnerability assessment of the future sea level rise in Udupi coastal zone of Karnataka state, west coast of India, Ocean Coast. Manage., 52, 467–478, https://doi.org/10.1016/j.ocecoaman.2009.07.007, 2009.
Easterling, D. R., Meehl, G. A., Parmesan, C., Changnon, S. A., Karl, T. R., and Mearns, L. O.: Climate Extremes: Observations, Modeling, and Impacts, Science, 289, 2068–2074, https://doi.org/10.1126/science.289.5487.2068, 2000.
Frota, F. F., Truccolo, E. C., and Schettini, C. A. F.: Tidal and sub-tidal sea level variability at the northern shelf of the Brazilian Northeast Region, Anais da Academia Brasileira de Ciências, 88, 1371–1386, https://doi.org/10.1590/0001-3765201620150162, 2016.
Gilleland, E. and Katz, R. W.: extRemes 2.0: An Extreme Value Analysis Package in R, J. Stat. Softw., 72, 1–39, https://doi.org/10.18637/jss.v072.i08, 2016.
Grigio, A. M., Castro, A. F., Souto, M. V. S., Amaro, V. E., Vital, H., and Diodato, M. A.: Use of remoting sensing and geographical information system in the determination of the natural and environmental vulnerability of the Municipal District of Guamaré – Rio Grande do Norte – Northeast of Brazil, J. Coastal. Res., Special Issue, 1427–1431, https://www.jstor.org/stable/25742990 (last access: 22 December 2019), 2006.
Gumbel, E. J.: Statistics of extremes, Columbia University Press, New York, 375 pp., 1958.
Hall, J. W., Harvey, H., and Manning, L. J. Adaptation thresholds and pathways for tidal flood risk management in London, Climate Risk Management, 24, 42–58, https://doi.org/10.1016/j.crm.2019.04.001, 2019.
Herdman, L., Erikson, L., and Barnard, P.: Storm Surge Propagation and Flooding in Small Tidal Rivers during Events of Mixed Coastal and Fluvial Influence, Journal of Marine Science and Engineering, 6, 158, https://doi.org/10.3390/jmse6040158, 2018.
IBGE – Instituto Brasileiro de Geografia e Estatística: Análise do Nível Médio do Mar nas Estações da Rede Maregráfica Permanente para Geodésia – RMPG 2001/2015, Diretoria de Geociências, Coordenação de Geodésia, Rio de Janeiro, 65 pp., available at: ftp://geoftp.ibge.gov.br/informacoes_sobre_posicionamento_geodesico/rmpg/relatorio/relatorio_RMPG_2001_2015_GRRV.pdf (last access: 25 June 2019), 2016.
IDEMA – Instituto de Desenvolvimento Sustentável e Meio Ambiente: Informações dos municipios de Mossoró, Grossos e Tibau, v. 24, 1–24, 1999.
IDEMA – Instituto de Desenvolvimento Sustentável e Meio Ambiente: Projeto de Zoneamento Ecológico-Econômico dos Estuários do Rio Grande do Norte – ZEE/RN, Natal-RN, 35 pp., 2005.
IPCC: Climate Change 2014: Synthesis Report, Contribution of Working Groups I, II and III to the Fifth Assessment Report of the Intergovernmental Panel on Climate Change (IPCC), Geneva, Switzerland, 151 pp., 2014.
IPCC: Climate Change and Land: an IPCC special report on climate change, desertification, land degradation, sustainable land management, food security, and greenhouse gas fluxes in terrestrial ecosystems, edited by: Shukla, P. R., Skea, J., Calvo Buendia, E., Masson-Delmotte, V., Pörtner, H.-O., Roberts, D. C., Zhai, P., Slade, R., Connors, S., van Diemen, R., Ferrat, M., Haughey, E., Luz, S., Neogi, S., Pathak, M., Petzold, J., Portugal Pereira, J., Vyas, P., Huntley, E., Kissick, K., Belkacemi, M., and Malley, J., in press, available at: https://www.ipcc.ch/site/assets/uploads/2019/11/SRCCL-Full-Report-Compiled-191128.pdf (last access: 26 January 2020), 2019.
Jensen, J. R.: Sensoriamento Remoto do Ambiente: Uma Perspectiva em Recursos Terrestres, Tradução da Segunda Edição, Parêntese Editora, São José dos Campos, 598 pp., 2009.
Kendall, M. G.: Rank Correlation Methods, Charles Griffin, London, 1975.
Kulp, S. and Strauss, B. H.: New elevation data triple estimates of global vulnerability to sea-level rise and coastal flooding, Nat. Commun., 10, 4844, https://doi.org/10.1038/s41467-019-12808-z, 2019.
Mann, H. B.: Nonparametric tests against trend, Econometrica, 13, 245–259, https://doi.org/10.2307/1907187, 1945.
Matos, A. C. O. C.: Implementação de Modelos Digitais de Terreno para Aplicações na Área de Geodésia e Geofísica na América do Sul, PhD theses, Postgraduate Program in Transport Engineering, Federal University of Sao Paulo, 335 pp., https://doi.org/10.11606/T.3.2005.tde-10102005-104155, 2005.
Matos, M. F. A., Amaro, V. E., Scudelari, A. C., and Bezerra, A. C. N.: Análises estatísticas de alturas significativas de ondas de série temporal de curto prazo na costa do Rio Grande do Norte, Pesquisas em Geociências, 46, e0731, https://doi.org/10.22456/1807-9806.93246, 2019.
McGranahan, G., Balk, D., and Anderson, B.: The rising tide: assessing the risks of climate change and human settlements in low elevation coastal zones, Environ. Urban., 19, 17–37, https://doi.org/10.1177/0956247807076960, 2007.
Medeiros, M. D.: Eventos hidroclimáticos extremos e vulnerabilidade socioambiental a inundações no Baixo-Açu – RN, PhD thesis, Postgraduate Program in Geography, Federal University of Ceara, Brazil, 209 pp., available at: http://www.repositorio.ufc.br/handle/riufc/35674 (last access: 22 December 2019), 2018.
Medeiros, M. D. and Zanella, M. E.: Estudo das vazões e estimativas de inundações no Baixo-Açu-RN, Geo UERJ, 40946, 1–30, https://doi.org/10.12957/geouerj.2019.40946, 2019.
Murray, N. J., Phinn, S. R., DeWitt, M., Ferrari, R., Johnston, R., Lyons, M, B., Clinton, N., Thau, D., and Fuller, R. A.: The global distribution and trajectory of tidal flats, Nature, 565, 222–225, https://doi.org/10.1038/s41586-018-0805-8, 2019.
Nerem, R. S., Beckley, B. D., Fasullo, J. T., Hamlington, B. D., Masters, D., and Mitchum, G. T.: Climate-change-driven accelerated sea-level rise detected in the altimeter era, P. Natl. Acad. Sci. USA, 115, 2022–2025, https://doi.org/10.1073/pnas.1717312115, 2018.
Neumann, B., Vafeidis, A. T., Zimmermann, J., And Nicholls, R. J.: Future coastal population growth and exposure to sea-level rise and coastal flooding – a global assessment, PLOS ONE, 10, e0131375, https://doi.org/10.1371/journal.pone.0131375, 2015.
Nicholls, R. J. and Cazenave, A.: Sea-level rise and its impact on coastal zones, Science, 328, 1517–1520, https://doi.org/10.1126/science.1185782, 2010.
Nicholls, R. J., Wong, P. P., Burkett, V., Codignotto, J., Hay, J., McLean, R., Ragoonaden, S., Woodroffe, C. D., Abuodha, P. A. O., Arblaster, J., Brown, B., Forbes, D., Hall, J., Kovats, S., Lowe, J., McInnes, K., Moser, S., Rupp-Armstrong, S., and Saito, Y.: Coastal systems and low-lying areas, in: Climate change 2007: impacts, adaptation and vulnerability. Contribution of Working Group II to the fourth assessment report of the Intergovernmental Panel on Climate Change, edited by: Parry, M. L., Canziani, O. F., Palutikof, J. P., van der Linden, P. J., and Hanson, C. E., Cambridge, UK, Cambridge University Press, 315–356, available at: http://ro.uow.edu.au/cgi/viewcontent.cgi?article=1192&context=scipapers (last access: 22 December 2019), 2007.
Nicholls, R. J., Hanson, S. E., Lowe, J. A., Warrick, R. A., Lu, X., Long, A. J., and Carter, T. R.: Constructing Sea-Level Scenarios for Impact and Adaptation Assessment of Coastal Areas: A Guidance Document. Technical Guidelines of the Task Group on Data and Scenario Support for Impact and Climate Analysis (TGICA) of the Intergovernmental Panel on Climate Change (IPCC), 64 pp., available at: https://www.ipcc-data.org/docs/Sea_Level_Scenario_Guidance_Oct2011.pdf (last access: 5 December 2019), 2011.
NOAA – National Oceanic and Atmospheric Administration: 2018 State of U.S. High Tide Flooding with a 2019 Outlook, NOAA Technical Report NOS CO-OPS 090, Silver Spring, Maryland, 31 pp., available at: https://repository.library.noaa.gov/view/noaa/20691 (last access: 9 November 2019), 2019.
Oppenheimer, M., Glavovic, B. C., Hinkel, J., van de Wal, R., Magnan, A. K., Abd-Elgawad, A., Cai, R., Cifuentes-Jara, M., DeConto, R. M., Ghosh, T., Hay, J., Isla, F., Marzeion, B., Meyssignac, B., and Sebesvari, Z.: Sea Level Rise and Implications for Low-Lying Islands, Coasts and Communities, in: IPCC Special Report on the Ocean and Cryosphere in a Changing Climateedited by: Pörtner, H.-O., Roberts, D. C., Masson-Delmotte, V., Zhai, P., Tignor, M., Poloczanska, E., Mintenbeck, K., Alegría, A., Nicolai, M., Okem, A., Petzold, J., Rama, B., and Weyer, N. M., in press, available at: https://www.ipcc.ch/srocc/chapter/chapter-4-sea-level-rise-and-implications-for-low-lying-islands-coasts-and-communities/ (last access: 26 January 2020), 2019.
PBMC – Painel Brasileiro de Mudanças Climáticas: Impactos, vulnerabilidades e adaptação às mudanças climáticas, Contribuição do Grupo de Trabalho 2 do Painel Brasileiro de Mudanças Climáticas ao Primeiro Relatório da Avaliação Nacional sobre Mudanças Climáticas, edited by: Assad, E. D. and Magalhães, A. R., COPPE, Federal University of Rio de Janeiro, Rio de Janeiro, RJ, Brazil, 414 pp., available at: http://www.pbmc.coppe.ufrj.br/documentos/RAN1_completo_vol2.pdf (last access: 10 October 2019), 2014.
Pugh, D. T.: Tides, surges and mean sea level: a handbook for Engineers and Scientists, John Wiley & Sons Ltd., New York, available at: https://eprints.soton.ac.uk/19157/1/sea-level.pdf (last access: 22 December 2019), 1987.
R Development Core Team: R: A language and environment for statistical computing, R Foundation for Statistical Computing, Vienna, Austria, available at: http://www.R-project.org/, last access: 28 February 2020.
Ramos, A. M. and Krueger, C. P.: Aplicação de reduções batimétricas GPS em levantamentos hidrográficos, Boletim de Ciencias Geodesicas, 15, 615–635, available at: https://revistas.ufpr.br/bcg/article/view/16284/10775 (last access: 22 December 2019), 2009.
Schröter, K., Lüdtke, S., Redweik, R., Meier, J., Bochow, M., Ross, L., Nage, C., and Kreibich, H.: Flood loss estimation using 3D city models and remote sensing data, Environ. Modell. Softw., 105, 118-131, https://doi.org/10.1016/j.envsoft.2018.03.032, 2018.
Santos, M. S. T. and Amaro, V. E.: Dinâmica sazonal de processos costeiros e estuarinos em sistema de praias arenosas e ilhas barreira no nordeste do Brasil, Revista Brasileira de Geomorfologia, 14, 151–162, https://doi.org/10.20502/rbg.v14i2.298, 2013.
SMC-Brasil: Níveis e cota de inundação, Documento temático, Ministério do Meio Ambiente, Brasília-DF, 130 pp., available at: https://www.mma.gov.br/images/arquivo/80342/Livro_SMC_4___Niveis_e_Cota_de_inundacao.pdf (last access: 16 November 2019), 2018.
Taherkhani, M., Vitousek, S., Barnard P. L., Frazer, N., Anderson, T. R., and Fletcher, C. H.: Sea-level rise exponentially increases coastal flood frequency, Sci. Rep.-UK, 10, 6466, https://doi.org/10.1038/s41598-020-62188-4, 2020.
UNDP – United Nations Development Programme: Reducing Disaster Risk: A Challenge for development, A global report, 169 pp., available at: http://www.planat.ch/fileadmin/PLANAT/planat_pdf/alle_2012/2001-2005/Pelling__Maskrey_et_al_2004_-_Reducing_Disaster_Risk.pdf (last access: 4 December 2019), 2004.
Vital, H., Silveira, I. M., Tabosa, W. F., Lima, Z. M. C., Lima-Filho, F. P., Souza, F. E. S., Chaves, M. S., and Pimenta, F. M.: Beaches of Rio Grande do Norte, in: Brazilian Beach Systems, Coastal Research Library, edited by: Short A. and Klein A., vol. 17. Springer, Cham, https://doi.org/10.1007/978-3-319-30394-9_8, 2016.
Wisner, B., Gaillard, J. C., and Kelman, I.: Framing disaster: theories and stories seeking to understand hazards, vulnerabilty and risk, in: The Routledge Handbook of Hazards and Disaster Risk Reduction, edited by: Wisner, B., Gaillard, J. C., and Kelman I., London, Routledge, 18–33, available at: https://www.routledgehandbooks.com/pdf/doi/10.4324/9780203844236.ch3 (last access: 7 November 2019), 2011.
Yue, S. and Wang, C.: The Mann–Kendall Test Modified by Effective Sample Size to Detect Trend in Serially Correlated Hydrological Series, Water Resour. Manage., 18, 201–218, https://doi.org/10.1023/B:WARM.0000043140.61082.60, 2004.
Zhang, W., Yan, Y., Zheng, J., Li, L., Dong, X., and Cai, H.: Temporal and spatial variability of annual extreme water level in the Pearl River Delta region, China, Global Planet. Change, 69, 35–47, https://doi.org/10.1016/j.gloplacha.2009.07.003, 2009.