the Creative Commons Attribution 4.0 License.
the Creative Commons Attribution 4.0 License.
 | 19 Oct 2021
Assessment of direct economic losses of flood disasters based on spatial valuation of land use and quantification of vulnerabilities: a case study on the 2014 flood in Lishui city of China
Haixia Zhang
Weihua Fang
Hua Zhang
Lu Yu
Detailed and reliable assessment of direct economic losses of flood disasters is important for emergency dispatch and risk management in small- and medium-sized cities. In this study, a single flood disaster in Lishui city in 2014 was taken as an example to study and verify a method for rapid and detailed assessment of direct economic loss. First, based on a field investigation, the inundation data simulated by the one-dimensional hydrodynamic model and geographic information system (GIS) analysis method were verified. Next, the urban land use map and high-resolution land use classifications based on remote sensing data were fused and combined with expert questionnaire surveys, thereby providing the 47 types and values of land use. Then, based on the previous depth–damage function in the past study, the vulnerability curves of 47 types of land use in Liandu district were fitted by the lognormal cumulative distribution function and then calibrated using disaster loss report data. Finally, the distributions of the loss ratio and loss value were estimated by spatial analysis. It is found that the land use data have detailed types and value attributes as well as high resolution. Secondly, the vulnerability curves after function fitting and calibration effectively reflect the change characteristics of land use loss ratio in this area. Finally, except for the three types of land for agriculture, recreational and sports facilities, and green parking spaces, the optimized simulated total loss is CNY 322.6 million, which is 0.16 % higher than the statistics report data. The estimated loss ratio and loss value can reliably reflect the distribution pattern of disaster losses in detail, which can be applied by government and private sectors to implement effective disaster reduction and relief measures.
- Article
(9237 KB) - Full-text XML
- BibTeX
- EndNote


Detailed and reliable assessments of the direct economic losses of flood disasters are very important in disaster emergency rescue and urban flood risk management (Li et al., 2017; UNISDR, 2015). The results of a rapid quantitative assessment of disaster losses with high spatial resolution not only provide suggestions for the government to formulate emergency dispatch management measures, such as releasing disaster information, deploying rescue forces and relief materials, and the emergency resettlement of disaster victims, but also lay a data foundation for decision-makers to plan sponge cities and formulate flood risk management systems and climate change adaptation policies (Alfieri et al., 2016; Merz et al., 2010). Among them, sponge city refers to a city that can be as flexible as a sponge in adapting to environmental changes and natural disasters. It absorbs, stores, infiltrates and purifies water when it rains and releases and reuses the stored water when necessary (Yu et al., 2015). In order to solve the problems of water shortage, waterlogging and water pollution caused by rapid urbanization, the Chinese government launched the sponge city construction plan on 31 December 2014 (MHURD, 2014), which can effectively alleviate urban waterlogging, reduce runoff pollution, save water resources and improve ecological environment.
As a key component of flood risk assessment, flood loss assessment has been extensively analyzed by researchers (Falter et al., 2015; Koks et al., 2015). The flood loss data obtained from a comprehensive high-quality field survey after a disaster can accurately reflect the disaster loss situation and has important reference value for the establishment and verification of flood loss models (Carisi et al., 2018). However, given that loss data can only be obtained after a flood, these data cannot provide timely guidance for disaster relief. In addition, the collection of the loss data is also time-consuming and laborious.
Due to the development of existing flood loss assessment models, there are relatively mature methods and tools (EMA, 2002; Scawthorn et al., 2006), and the popularization of flood insurance provides relatively complete socioeconomic and disaster loss data; thus, disaster losses can be quickly assessed when floods occur (Hsu et al., 2011). The United States (Custer and Nishijima, 2015; USACE, 2006), the United Kingdom (Stephenson and D'Ayala, 2014), Japan (Dutta et al., 2003), Canada (NRC, 2017), Australia (Hasanzadeh Nafari et al., 2016b, a; Wehner et al., 2017), Italy (Amadio et al., 2016), China (Li et al., 2012; Penning-Rowsell et al., 2013) and other flood-prone countries have carried out a large number of loss assessment studies using different classification systems of exposure data and then used the existing loss database and post-disaster investigation data to establish local flood vulnerability functions.
In addition, with the development and application of geographic information systems (GISs), remote sensing (RS), hydrological models and hydrodynamic models (Elkhrachy, 2015; Jonkman et al., 2008), flood loss assessment models based on depth–damage functions have been improved (Komolafe et al., 2018). However, there are still some problems. First, there is a lack of depth–damage functions for use in specific areas, which need to be constructed through extensive post-disaster survey data (Albano et al., 2018). Second, the effect and accuracy of the assessment are affected by the scale of the exposure data. The microscale loss assessment model for each affected object (building, infrastructure object, etc.) has poor applicability. However, mesoscale exposure data mainly refer to land use obtained through remote sensing (RS) interpretation (Merz et al., 2010). Although mesoscale data can effectively be used to extract the spatial distribution of buildings, it is difficult to identify the occupancy types of buildings. These problems lead to high uncertainties and disparities in flood loss assessments (Gerl et al., 2016; Pinelli et al., 2020).
With the introduction of fuzzy mathematics, gray system models, genetic algorithms and other mathematical methods, the rapid estimation and prediction of regional flood direct economic loss can be realized (Qie and Rong, 2017; Zhao et al., 2014; Zhou et al., 2006), which can effectively reflect the overall situation of economic losses in a large region and reduce the investment in human and material resources. However, due to the lack of high-resolution location information, this approach cannot provide timely and effective suggestions for the government to formulate targeted emergency scheduling plans.
To effectively improve the accuracy, timeliness and practicability of flood disaster loss assessment, a refined assessment model of single-flood disaster losses in small- and medium-sized cities is explored in this paper. The heavy rainfall from 18 to 20 August 2014 caused severe river backflow and urban waterlogging, and many houses and roads were flooded in Lishui city. Therefore, taking this flood disaster as an example, a refined assessment model for the direct economic losses of regional flooding disasters was developed. The model included flood inundation simulation, land use type fusion, land use value quantification, vulnerability function fitting and optimization, loss ratio, and loss value estimation.

Figure 1Location of the study area. (a) The location of Oujiang River basin in China. (b) The distribution of hydrological stations, precipitation stations, rivers and sub-basins in Oujiang River basin and the location of Liandu district in Oujiang River basin. (c) The terrain distribution and town boundary of Liandu district.
2.1 Study area
Liandu district is in southwestern Zhejiang Province, between 28∘06′–28∘44′ N and 119∘32′–120∘08′ E (Fig. 1). This district is in the middle reaches of the Oujiang River basin, surrounded by mountains and a plain in the middle, with a total area of approximately 1502 km2. Liandu is a district under the jurisdiction of Lishui city, with a relatively concentrated population and socioeconomic status. As a result of both urban planning and topography, the flood disaster in Liandu district causes heavy losses. Because topography has a great impact on hydrology and hydrodynamics, it is easy to ignore regional differences based on administrative units. Considering the impact of the Jinshuitan Reservoir operation, the upper reaches of the Oujiang River basin are divided into three subwatersheds (Fig. 1b).
2.2 Precipitation
The gridded precipitation data come from the hourly precipitation data set of the National Meteorological Information Center, which integrates China's automatic station data with the National Oceanic and Atmospheric Administration (NOAA) Climate Data Record (CDR) Climate Prediction Center morphing technique (CMORPH) product with a resolution of 0.1∘. The overall error is within 10 %, and the accuracy in areas with heavy rainfall and sparse sites is greater than in similar international products (Shen et al., 2014). The data can effectively reproduce the spatiotemporal pattern of rainfall and are suitable for simulating flood inundation.

Figure 2Distribution of hourly and accumulated precipitation in the upper reaches of the Oujiang River basin (basin I + II + III) and each sub-basin. (The gray column is hourly precipitation, and the black curve is accumulated precipitation. The precipitation time is from 20:00 on 15 August to 20:00 on 21 August 2014 (UTC + 8 h).
Based on the hourly precipitation levels, the mean accumulated precipitation of the upper reaches of the Oujiang River basin and the three subwatersheds was calculated (Fig. 2). The precipitation change trend of each subwatershed was generally the same, with the accumulated precipitation exceeding 210 mm. The precipitation increased rapidly after 05:00 on 18 August (UTC + 8 h), and the entire precipitation process basically ended at 10:00 on 20 August (UTC + 8 h).
2.3 Water level and flood inundation
The water level data come from the hourly observations of hydrological stations of the Zhejiang Water Resources Department, including the measured water level, warning water level and guaranteed water level. Xiaobaiyan and Lishui are river stations, and the Jinshuitan Reservoir and the Kaitan Reservoir are reservoir stations (Fig. 1). Based on the hourly measured water level, beginning at 12:00 on 19 August (UTC + 8 h), the water levels of the Jinshuitan Reservoir, Xiaobaiyan and Lishui increased significantly, while the water level of the Kaitan Reservoir first dropped slightly and then increased significantly, and the water levels at these stations reached a peak at approximately 12:00 on 20 August (UTC + 8 h). The water levels at Xiaobaiyan, Lishui and the Kaitan Reservoir returned to normal at 00:00 on 21 August (UTC + 8 h), while that at the Jinshuitan Reservoir dropped to a certain water level at 00:00 on 22 August (UTC + 8 h), and the subsequent downward trend was slow (Fig. 3).
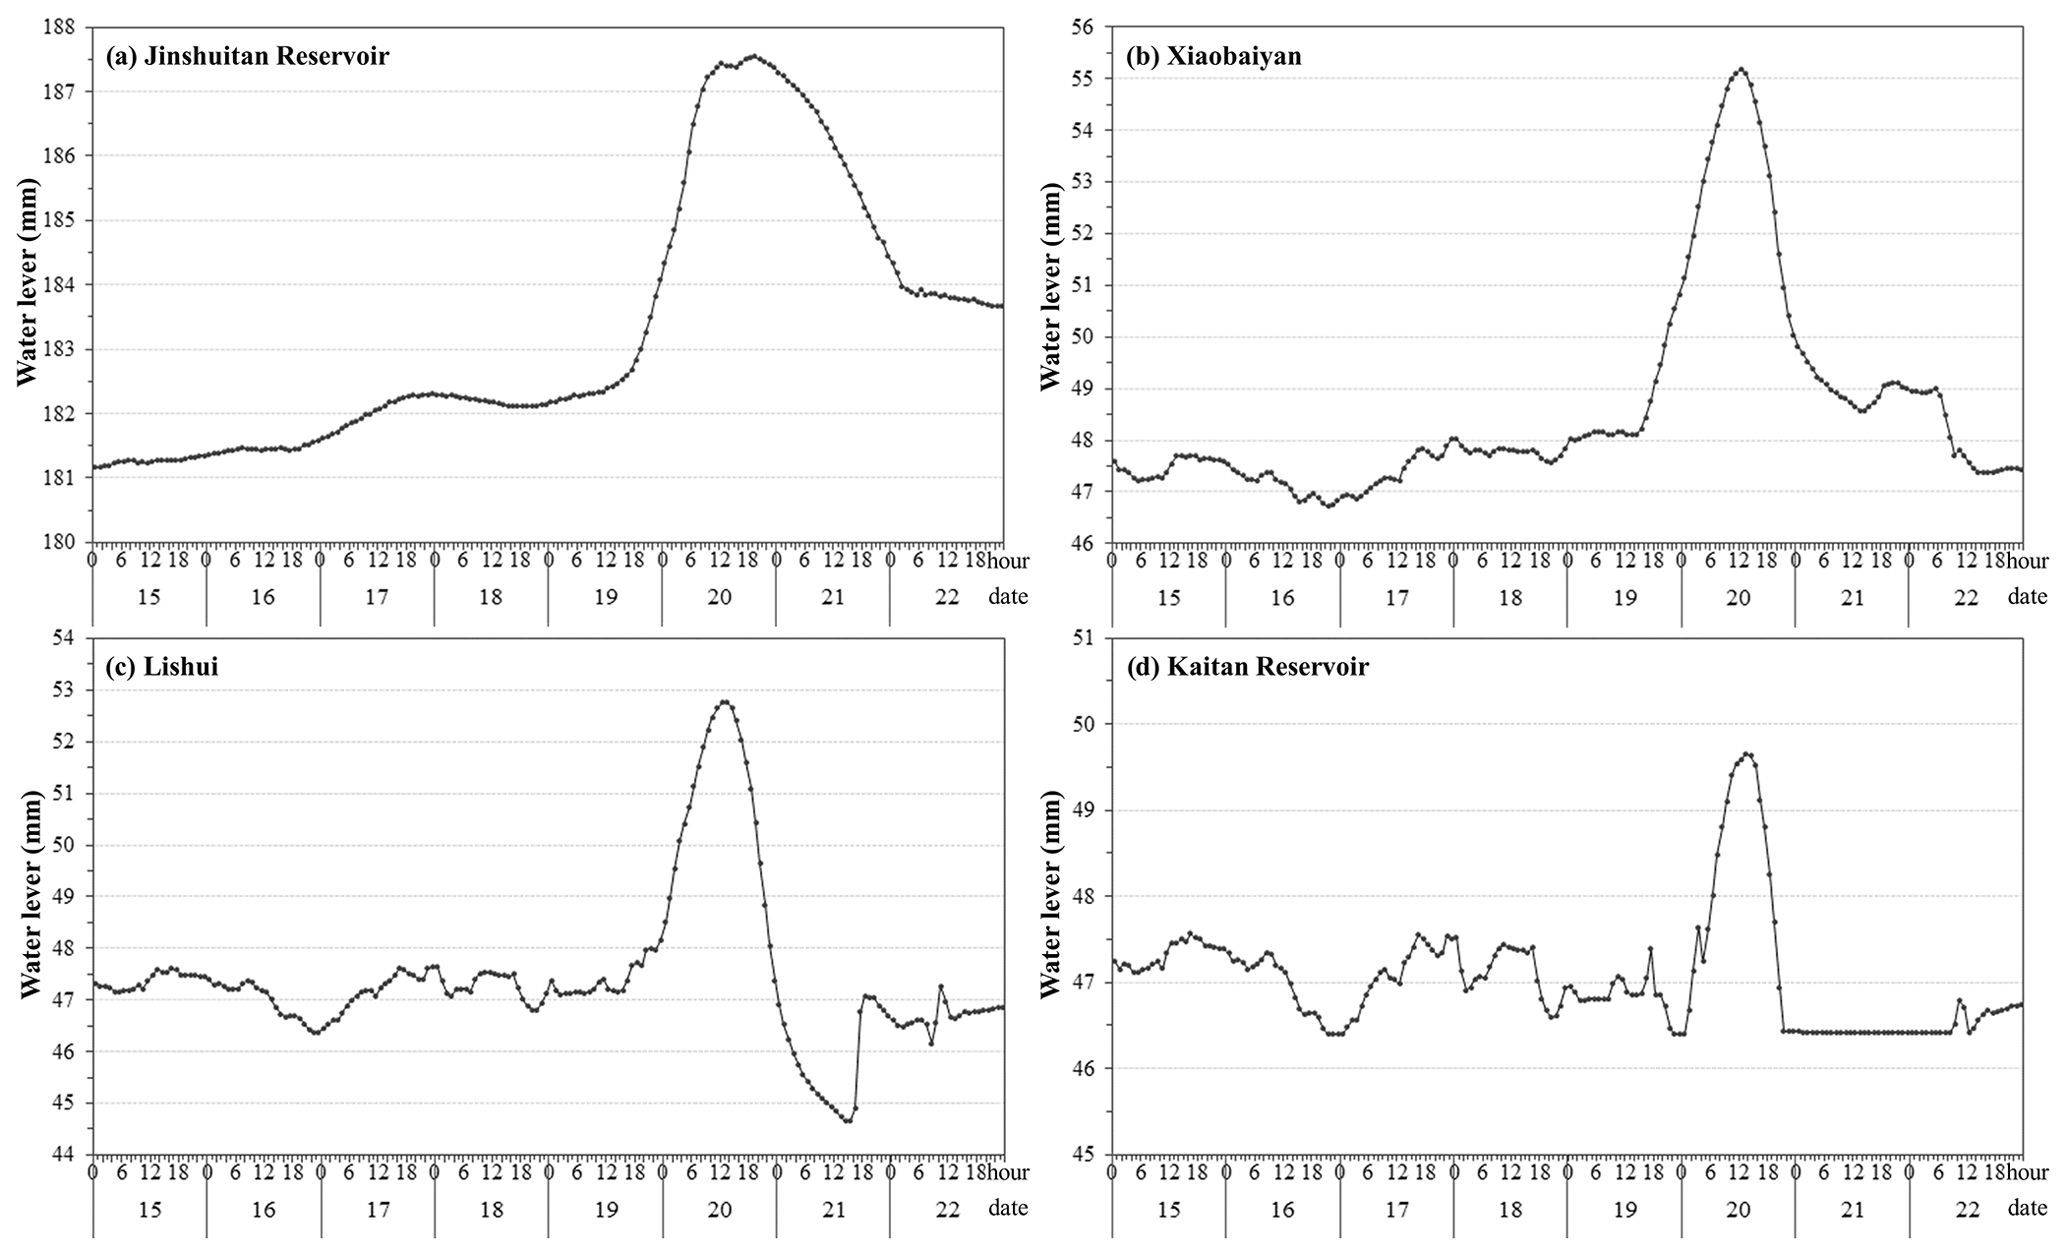
Figure 3Distribution of hourly water levels at hydrological stations. (The time of water level data are from 00:00 on 15 August to 00:00 on 23 August 2014 (UTC + 8 h).)
The flood inundation was calculated from the Yuxi to Kaitan Reservoir hydraulic model constructed by Zhejiang Design Institute of Water Conservancy and Hydroelectric Power. In this study, the middle and upper reaches of the Oujiang River basin were generalized into a mathematical model, the unsteady flow partial differential equations of the Saint-Venant open channel were used to describe the flood evolution process, and the implicit difference method was used to transform it into a difference equation. Newton iteration and Gaussian principal component elimination methods were used to solve the problem time by time so as to obtain the water level and discharge of each section (Kang and Chen, 2007). This model considered weirs, gates, water-blocking bridges, water exchange between intervals, flood detention areas, etc., and it can be applied to the quantitative analysis and calculation of the flood evolution of this section of the river.
In order to make the flood evolution calculation better simulate the water depth of this basin, the measured river section and the flood in 2014 were selected for simulation calculation to verify the accuracy of the mathematical model of the flood evolution calculation and determine the parameters of the model. The simulation result of the measured flood on 20 August 2014 was carried out. The upper boundary used the discharge process of each reservoir and the measured data from the hydrological station, and the lower boundary used the measured water level. Comparing the model result with the measured flood traces and the measured process at the hydrological station, the difference in water level between the two was 0–0.09 m, which shows that the model parameters were reasonable. The flood volume was calculated based on the simulated water level and the elevation of the embankment (Table 1). Based on the overflow volume and topographic data, the submerged area and inundation depth were estimated by GIS tools. Through measured flood traces, field surveys and aerial photography, it was found that the simulated submergence results can well reflect the actual flood.
Table 1Overflow volume of Liandu district in 2014 based on the hydraulic model (10 000 m3).
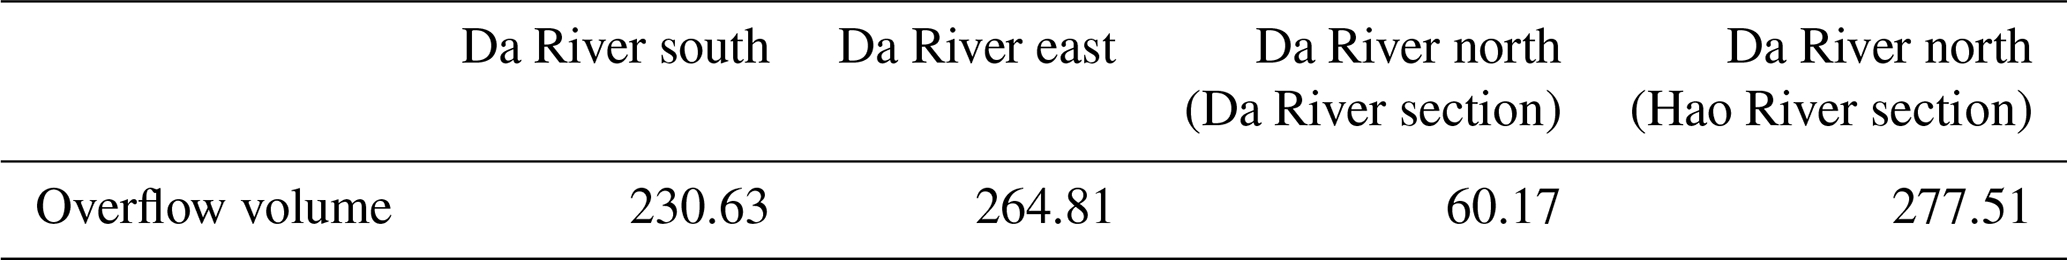
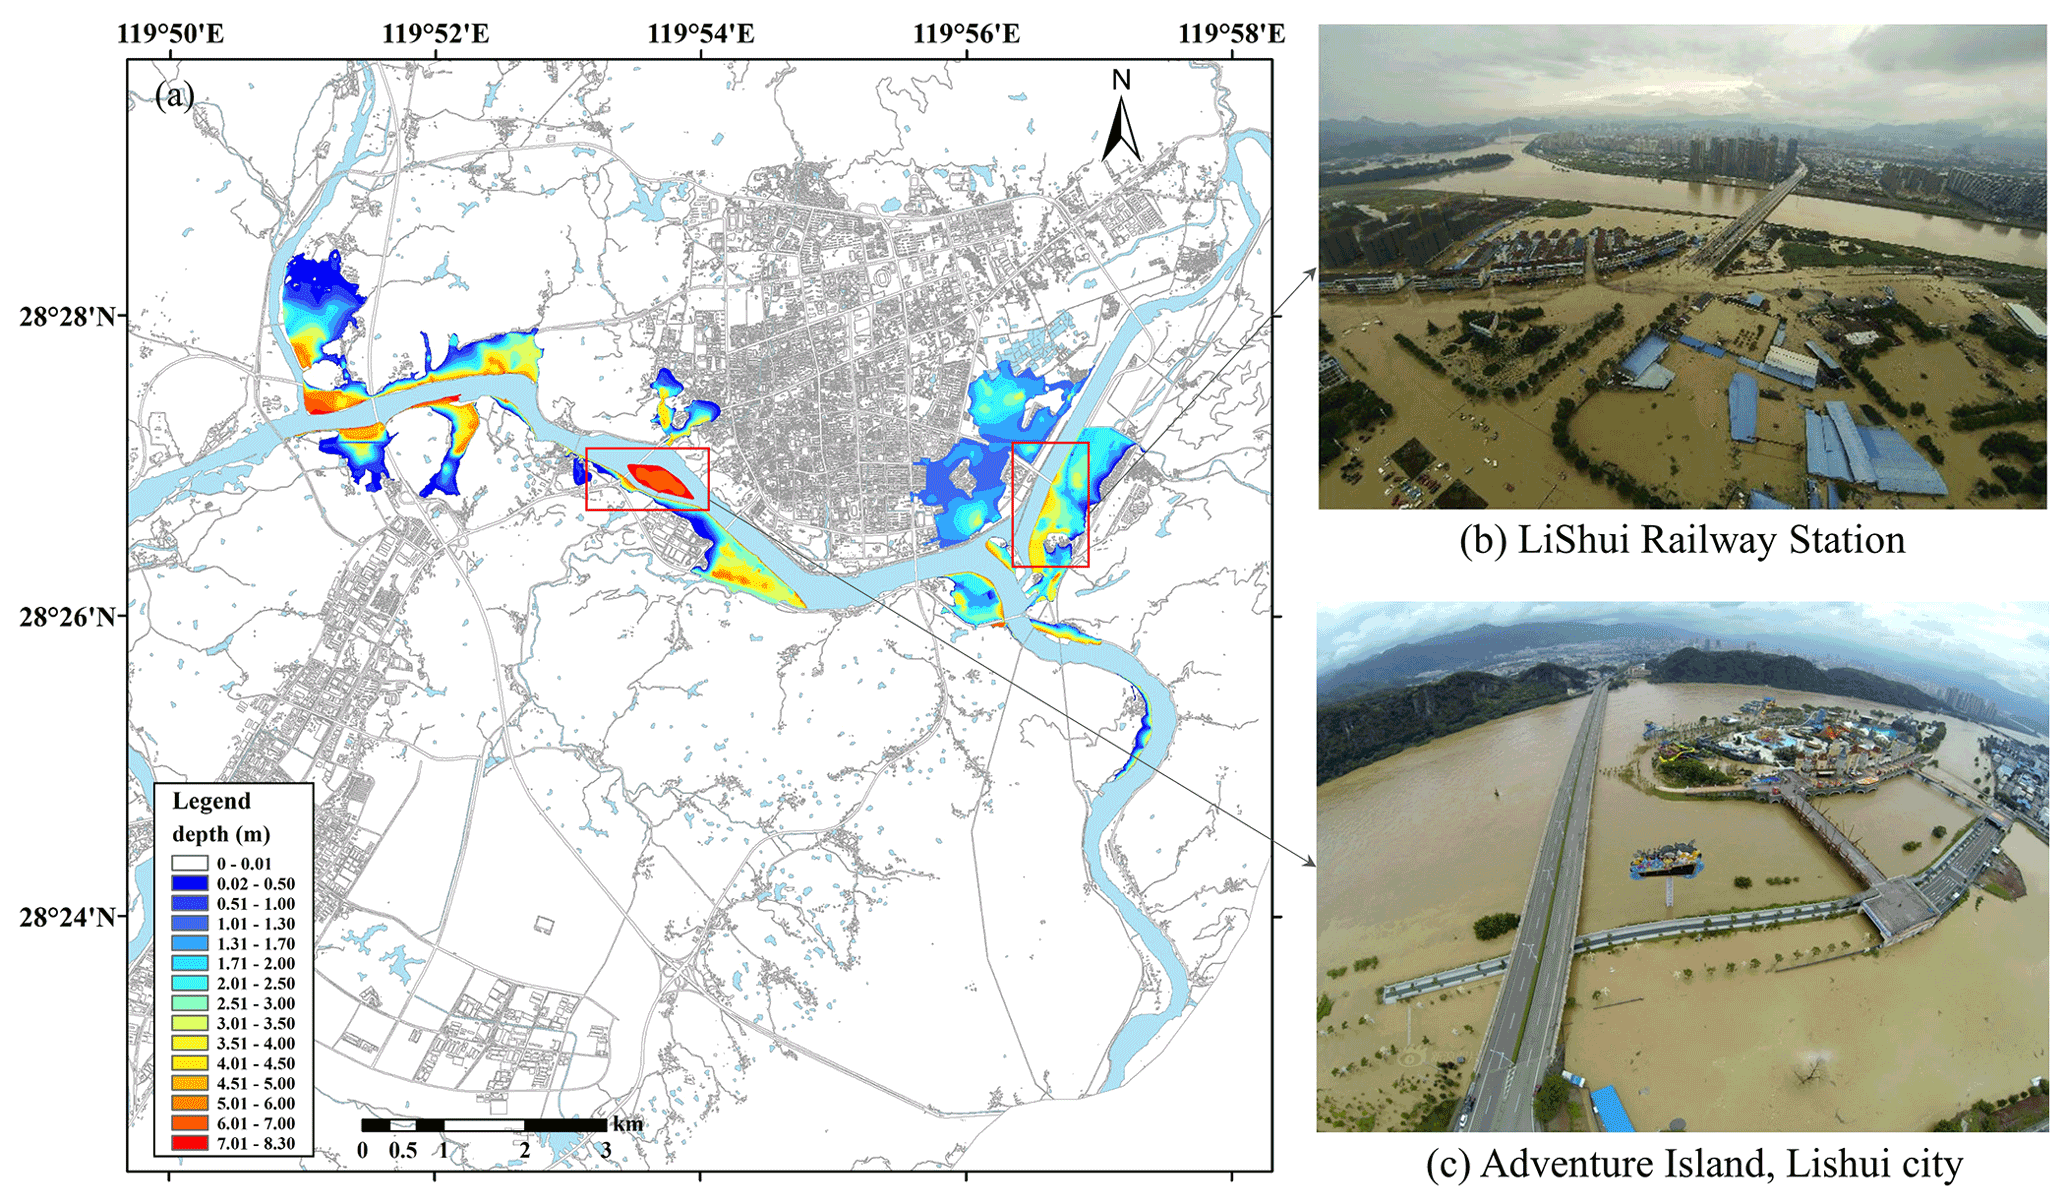
Figure 4(a) Distribution of maximum simulated submergence depth. (b, c) Aerial photographs of Liandu district in 2014.
Based on the simulated maximum inundation depth distribution (Fig. 4a) and real-time aerial photographs (Fig. 4b, c), the flood inundation area was mainly concentrated in the river confluence and both sides of the river, the inundation depth decreased from the river bank to both sides, and the inundation depth of the central island was generally greater than 7 m.
2.4 Disaster loss reporting
The disaster loss report was obtained from the Lishui Civil Affairs Bureau, which was reported by the local government. The report recorded 41 statistical indicators, including the affected population, affected area of crops, agricultural losses, infrastructure losses, public welfare facility losses, household property losses and direct economic losses. According to these statistics, a total of 167 300 people were affected in Liandu, 17 330 people were relocated in emergencies, 247 rural houses collapsed, and the direct economic loss was approximately CNY 377.15 million.
The insurance claim data set came from the auto insurance list of the catastrophe “Zhejiang 0819 Rainstorm” of the Lishui branch of the People's Insurance Company of China (PICC), and the data set recorded 19 indicators, including the policy number, the information of the insured, the estimated compensation and the compensation paid. As of 24 August, a total of 1045 motor vehicle insurance reports were received, with a reported loss of CNY 50.7969 million and a decided compensation of CNY 50.6893 million. According to the analysis of the market share of various insurance types in Zhejiang Province in December 2014, PICC motor vehicle insurance accounted for approximately 48.357 % of Lishui city.
In this study, an assessment model of the direct economic loss ratio and loss value of flood disasters was developed by utilizing methods such as land use type fusion, land use value estimation, vulnerability curve fitting and optimization.
3.1 Data fusion of land use types
The distribution of land use types was obtained through the fusion of current land use data in Lishui city with high-resolution land use classification results based on remote sensing data. The former data came from the urban and rural space development current status map of the Natural Resources and Planning Bureau in 2013, which was divided into 47 categories (Table 2) according to the Code for Classification of Urban Land Use and Planning Standards of Development Land (MHURD, 2011). The land use classification results were derived from the Gaode map with a resolution of 2.3870768 m, including five categories: transportation, grassland, waters, agriculture and forest, and buildings. The fusion steps of vector data and raster data are as follows.
-
First, we selected the unified geographic coordinate system used in this study. In order to be consistent with the flood inundation results, we interpolated the land use classification results into raster data with a resolution of 2 m by the nearest neighbor interpolation method. Then the vectorized current land use data were spatially adjusted to make them overlap with the position of the land use classification results.
-
Second, we extracted the land use type in the current land use data corresponding to the location of each building pixel in the land use classification result and assigned the type to the corresponding building pixel. The building pixels that have not been reassigned were assigned according to the adjacent building types. In addition, the road within 2 m of the residence was set as community parking, and the buildings far from urban areas were set as the village construction land.
-
The water, agriculture and forest, and road in the land use classification results were assigned as water, agriculture and forest, and urban road, respectively. The agriculture and forest in areas with urban buildings and the agriculture and forest and grassland in park areas were assigned as park green land.
-
Finally, we rechecked whether there were un-reassigned pixels in the land use classification results. If so, these pixels were reclassified according to the corresponding current land type.
3.2 Estimation of land use values
The value of land use obtained from expert questionnaires is relatively reliable, and the steps are as follows.
-
Based on the Lishui City Master Plan (2013–2030), Lishui City 13th Five-Year Plan and Lishui City Statistical Yearbook in 2015, we gave the reference information of current area, planned area, planned investment, unit area budget and description of land use types.
-
Due to the different disaster characteristics of land use, the exposure value of the indoor properties of the four major categories of residential, commercial, public management and public services, and industrial was estimated, and the value or cost per unit area of the other categories was estimated, as shown in Table 2.
-
We issued questionnaires to seven experts in fields such as municipal engineering design, construction industry, water design, ecological city planning and natural disasters and invited experts to estimate the land use value based on their professional background knowledge and the actual situation of the study area.
-
The value of each land use was determined by collating the questionnaires and calculating the average values.
3.3 Calibration of vulnerability curves
Although the vulnerability curves of different regions are different, there are similarities in the trend of the loss ratio with the inundation depth, and we can learn from them. Therefore, based on the existing vulnerability curves in many countries and regions (Coto, 2002; FEMA, 2013; Mo and Fang, 2016; Shi, 2010), the fitting and optimization steps of vulnerability function are as follows.
-
According to the existing depth–damage database, the relationship between inundation depth and loss ratio of each land use in Liandu district was developed. Since the HAZUS-FLOOD had a complete building occupancy class, this study mainly referred to it. First, we developed the comparison table between the building occupancy class in HAZUS-FLOOD and the land use type in Liandu district. Second, based on the inundation depth in Liandu district and the water depth in HAZUS-FLOOD, the range of inundation depth in the depth–damage function was set, and the unit of water depth was converted to meters. Finally, the HAZUS-FLOOD was summarized according to the building occupation class, and the average loss ratio of all samples for each building occupancy class under each inundation depth was calculated, which was used as the reference of the loss ratio of corresponding land use types under the same inundation depth in Liandu district. If there was no similar building occupancy type in HAZUS-FLOOD, other databases were referenced (Fig. 6).
-
The appropriate function was selected to fit the curve of inundation depth and loss ratio for each land use type developed in step 1. In the previous study, the vulnerability curve can be fitted by a polynomial, a power function (Büchele et al., 2006) or logistic regression (Cao et al., 2016), and it can also be smoothed by nonparametric forms such as the kernel density (Merz et al., 2004). In this paper, the lognormal cumulative distribution function (Limpert et al., 2001) was selected to fit the vulnerability curve. The formula is as follows:
where y is the loss ratio; x is the inundation depth; and σ and μ are the standard deviation and mean of the log x, respectively. For the lognormal cumulative distribution function F, the shape parameter affects the shape of the distribution, and the scale parameter affects the stretching and shrinking of the distribution.
-
Based on the vulnerability function fitted in step 2, the loss ratio and loss value of land use in Liandu district were estimated. First, the two raster layers of land use type and inundation depth were overlaid. Then, the loss ratio of each grid was calculated based on the vulnerability function. If the inundation depth of the grid was 0 m, the loss ratio was also 0. Otherwise, the corresponding vulnerability function was searched according to the land use type of the grid, and its loss ratio was calculated based on the inundation depth of the grid. Finally, the loss value of each grid was calculated by Eq. (2).
where L is the loss value of the land use, DR is the loss ratio of the land use, and V is the value of the land use.
-
The vulnerability function was optimized by disaster loss reporting data. First, the mapping table between the statistical indicators of disaster loss reporting and land use types in Liandu district was developed (Table 2). Second, the simulated total loss of land use in Liandu district corresponding to the loss reporting data of indicator k was calculated by Eq. (3). Then, the nonlinear equation was established with the minimum error between the disaster reporting loss and the simulated total loss as the objective function, and the scaling factor ak was solved by the least square method.
where TLk is the simulated total loss; nk is the number of land use types corresponding to the disaster loss reporting indicator k; mik is the number of grids of the land use type i corresponding to the indicator k; and Lij and are the loss value and loss ratio of the grid j of the land use type i, respectively. Valuei is the asset value or cost per unit area of land use type i, xij is the inundation depth of the grid j of the land use type i, shapei and scalei are the parameter of the vulnerability function of the land use type i, ak is the scaling factor of the indicator k, and the initial value is 1.
-
Based on the optimized vulnerability function, we used the method in step 3 to re-estimate the loss ratio and loss value of land use in Liandu district.
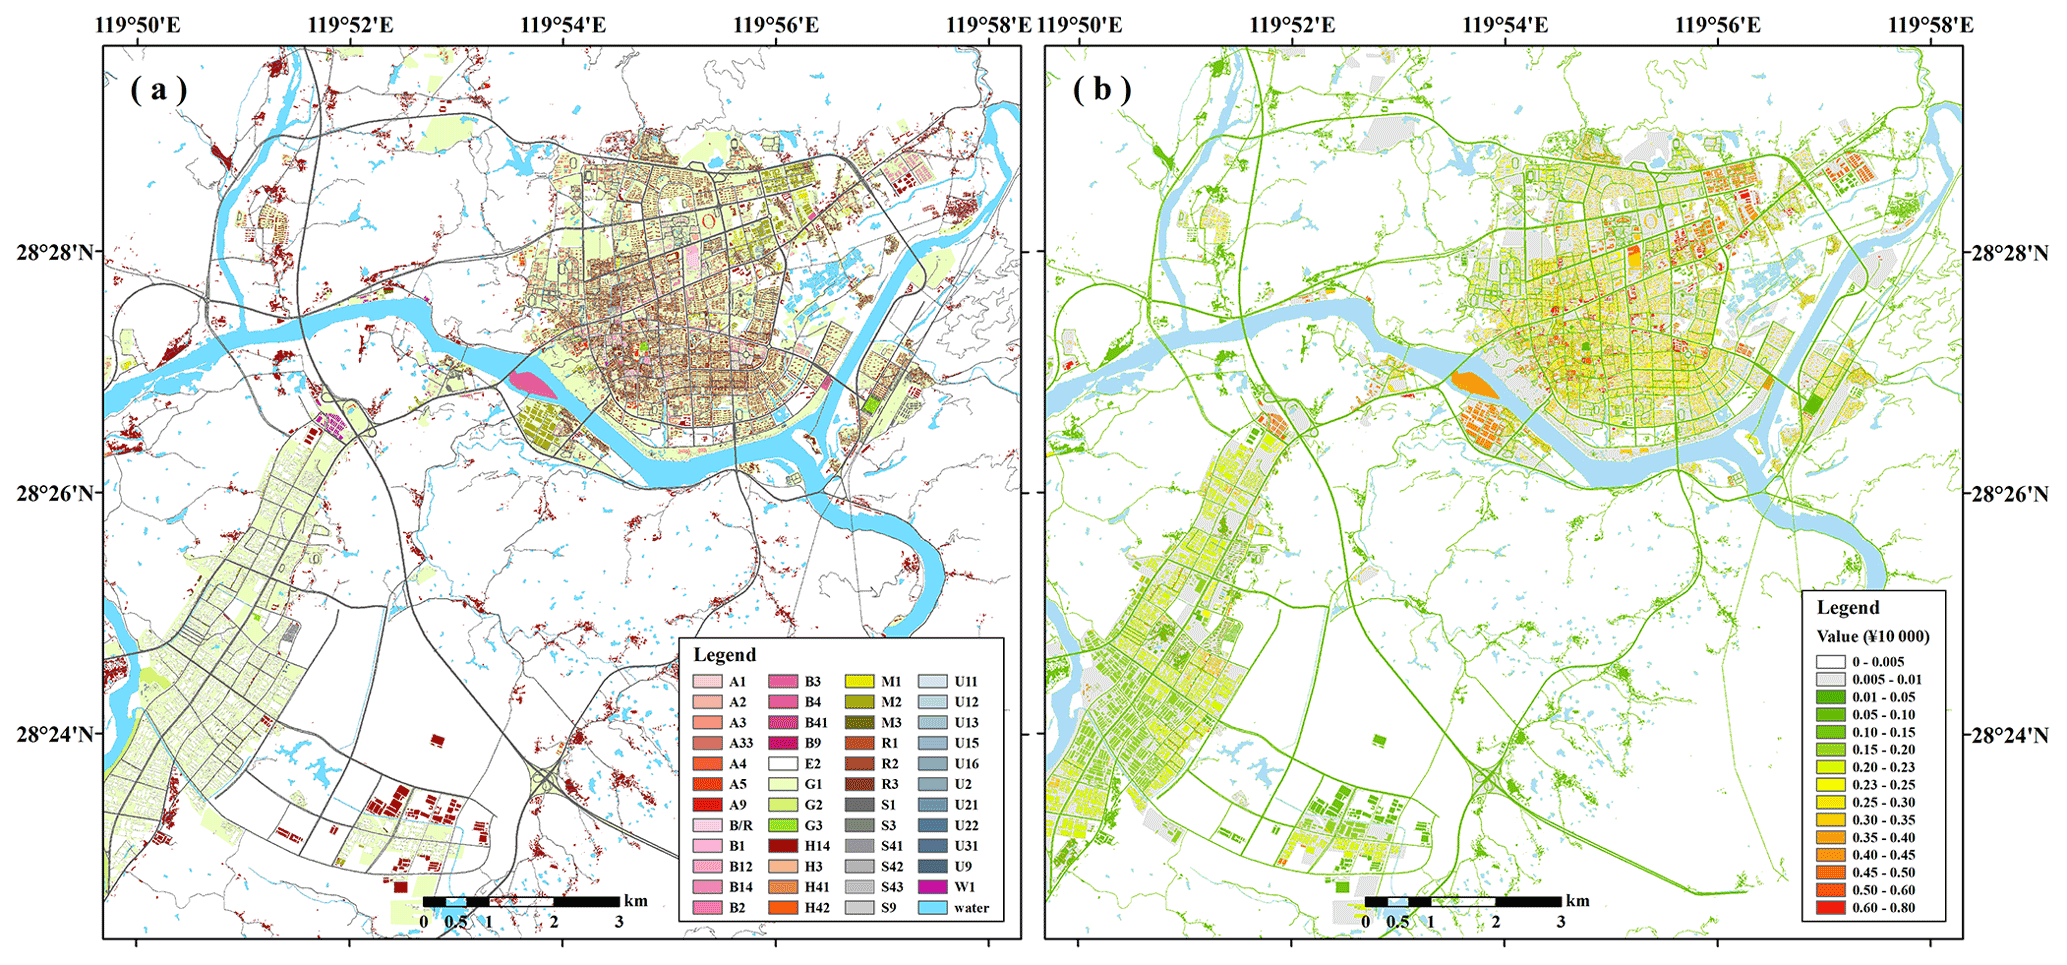
Figure 5Distribution of land use types (a) and land use values (b) in the central urban area of Liandu district in 2013.
4.1 Distribution of land use types
The distribution of high-resolution land use types in Liandu was obtained by using the data fusion method (Fig. 5a), and the names and codes of land use types were shown in Table 2. The fused land use type data effectively integrate the respective advantages of the current urban land use and land use classification results based on remote sensing images. The data not only have high-resolution spatial location information but also reflect the detailed types of land use.
Agricultural and forestry land in Liandu district is the most widely distributed type. Woodlands are mainly distributed in the hilly areas of the north, east, south and northeast. The built-up area of Liandu district is distributed along the river in a block shape, among which residential land is mainly distributed in communities near the river. Industrial land is mainly distributed on northeastern Wanxiang Street and in the Economic and Technological Development Zone, which is currently in the development stage, and many industrial plants have been built.
To strengthen intraregional connections, the roads and traffic facilities are relatively complete, with an urban road area of 4.33 km2. Commercial, warehouse, public management and public service facilities are relatively small and scattered. They are mainly concentrated near residential and industrial land, providing various services. Park green space is distributed along the river or close to residential and commercial land, while square green space, protective green space and public facilities are small and scattered.
4.2 Distribution of land use values
The asset value or cost per unit area of land use types was estimated based on expert questionnaires (Table 2). Commercial and industrial land has a large amount of internal equipment and many items with the highest asset unit price. Public management and public service facilities and residential land have a higher indoor property value. The value of agricultural and forestry land is the lowest.
The spatial distribution of land use value in Liandu in 2013 was calculated through grid assignment (Fig. 5b). The value of assets per unit area in the northern city and Wanxiang Street is generally high due to the concentration of commercial, industrial, residential, public management and public service facilities in the area. There is a water amusement project on the central island, which has a higher value per unit area. Many industrial plants are distributed in the Economic and Technological Development Zone, but due to the development stage and incomplete internal facilities, the unit price of the industrial land in this zone is calculated at half of the estimated value. Agricultural and forestry land is widely distributed and low in value, so most areas of Liandu have low values.
4.3 Fitted vulnerability curves
The vulnerability curves of all land use types were fitted by a lognormal cumulative distribution function based on the matrix of the inundation depth and loss ratio. Based on the comparison of simulated losses and disaster loss report data (Table 2), we optimized the scale parameters of the vulnerability function (Fig. 6) through the vulnerability curve calibration method (Sect. 3.3).
Table 2The classification, value and inundated area of land use types as well as the comparison of simulated loss before optimization, simulated loss after optimization and statistics loss of each land use type in Liandu district.
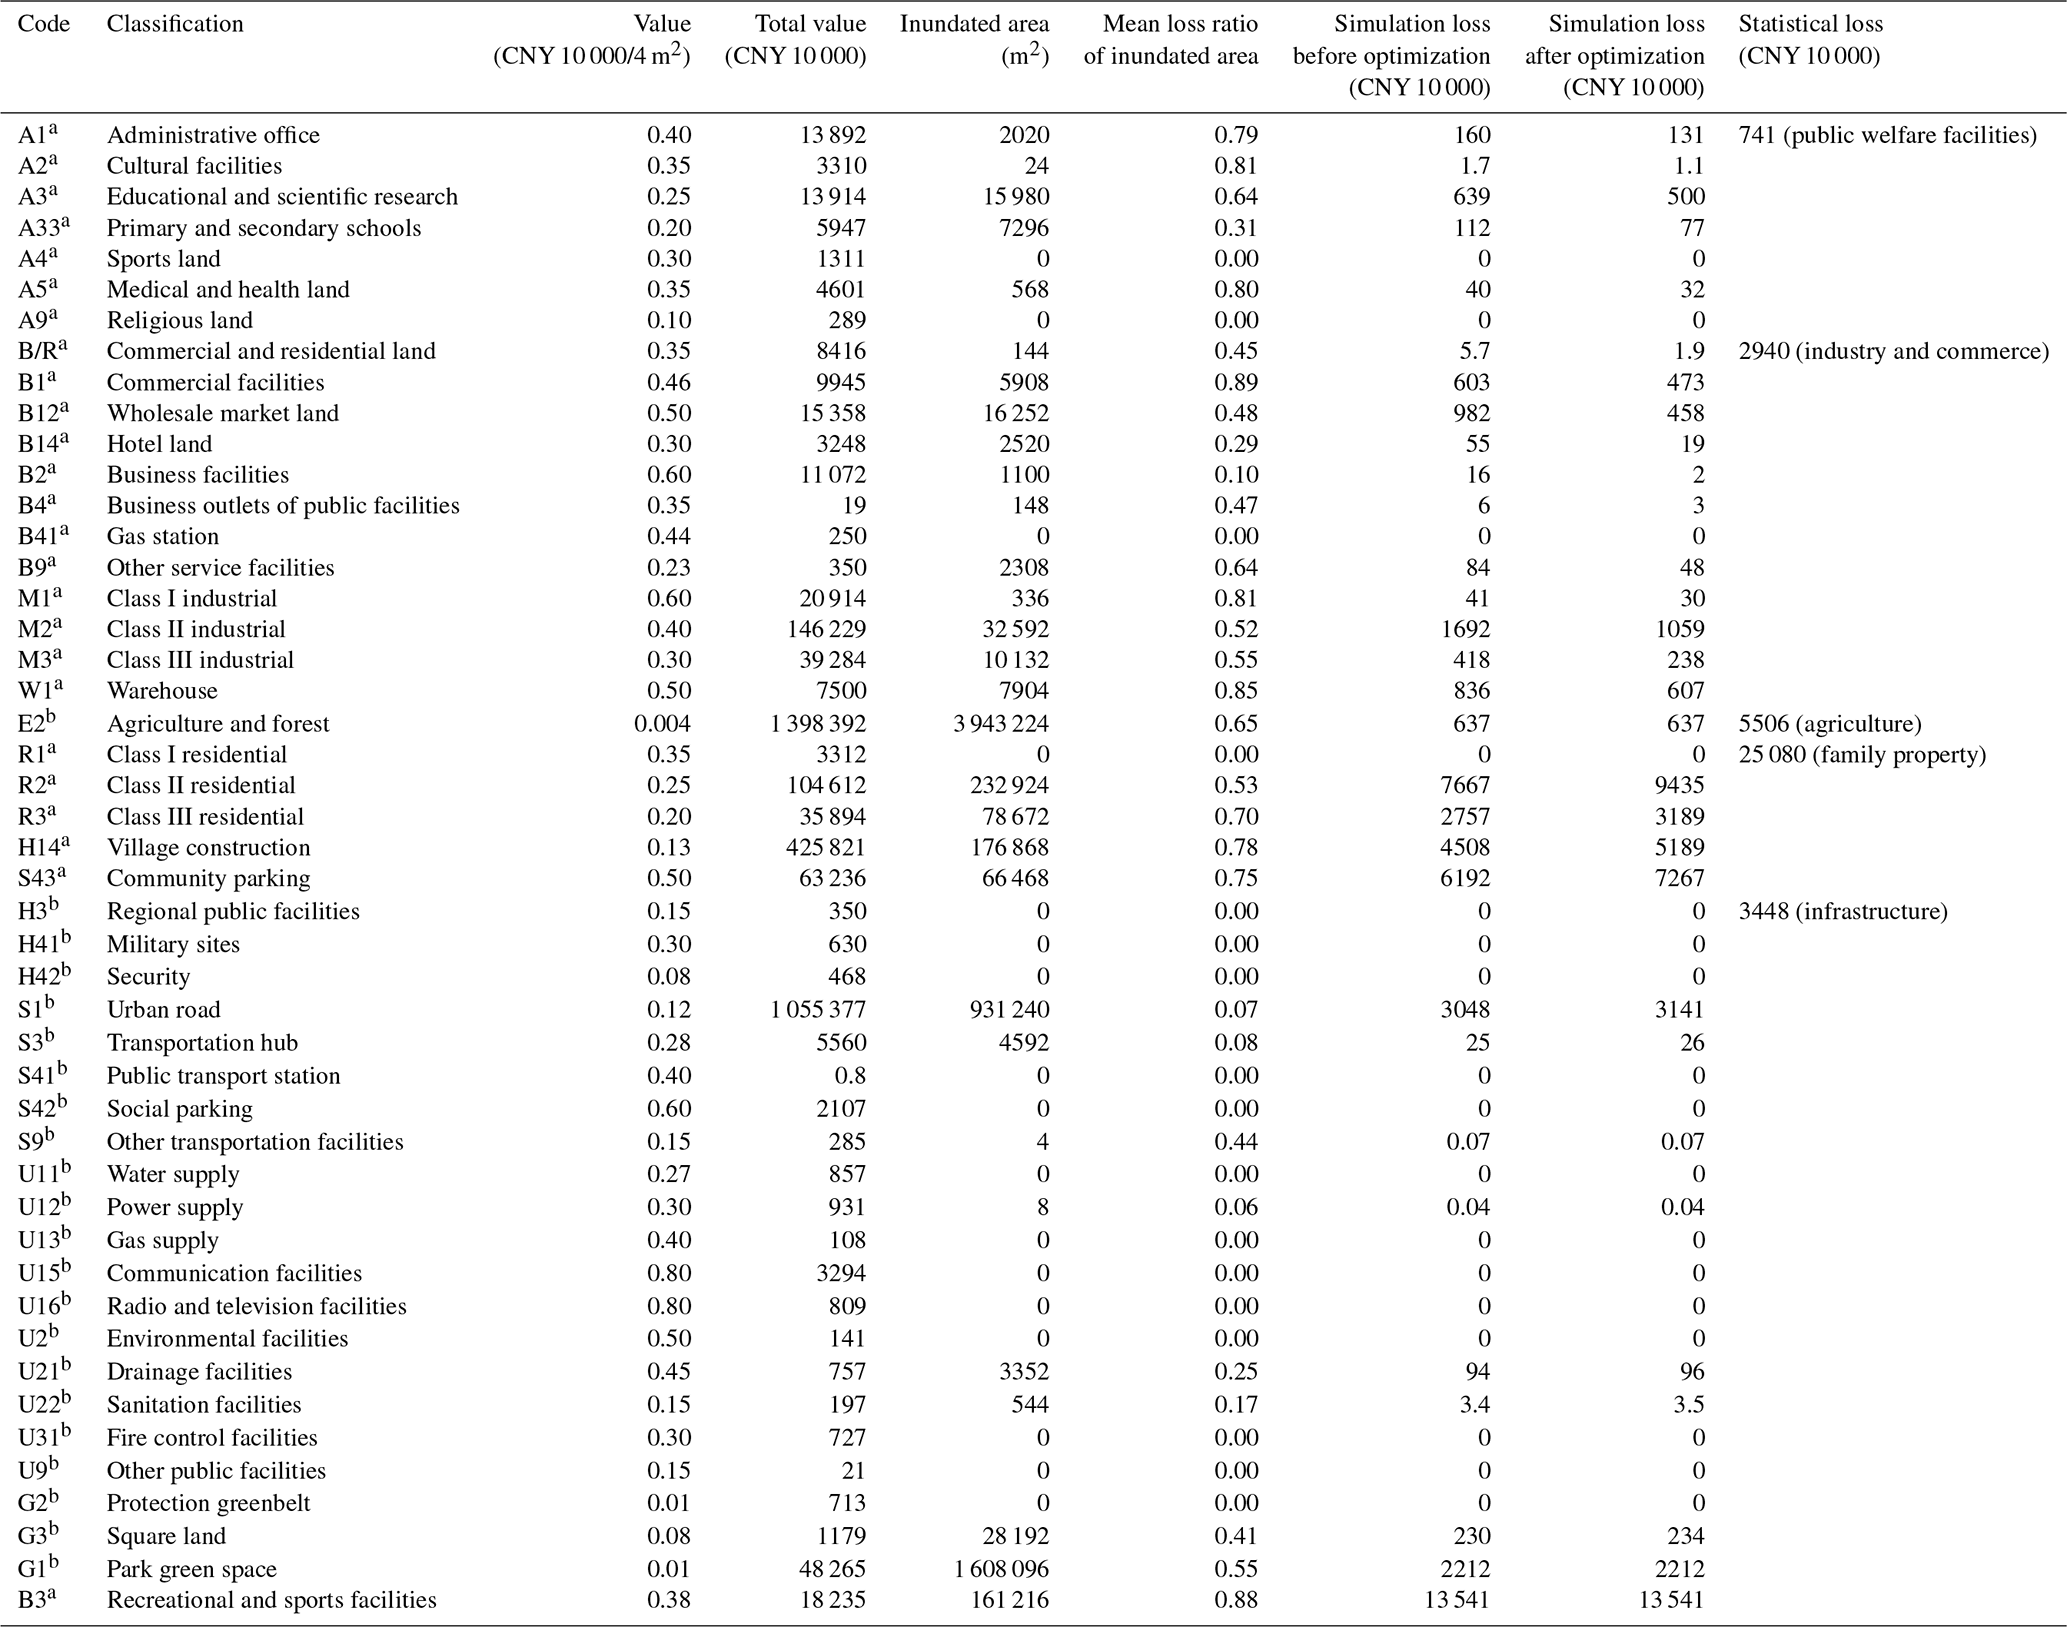
a The estimated exposure value is the indoor property value. b The estimated value is the value or cost per unit area.
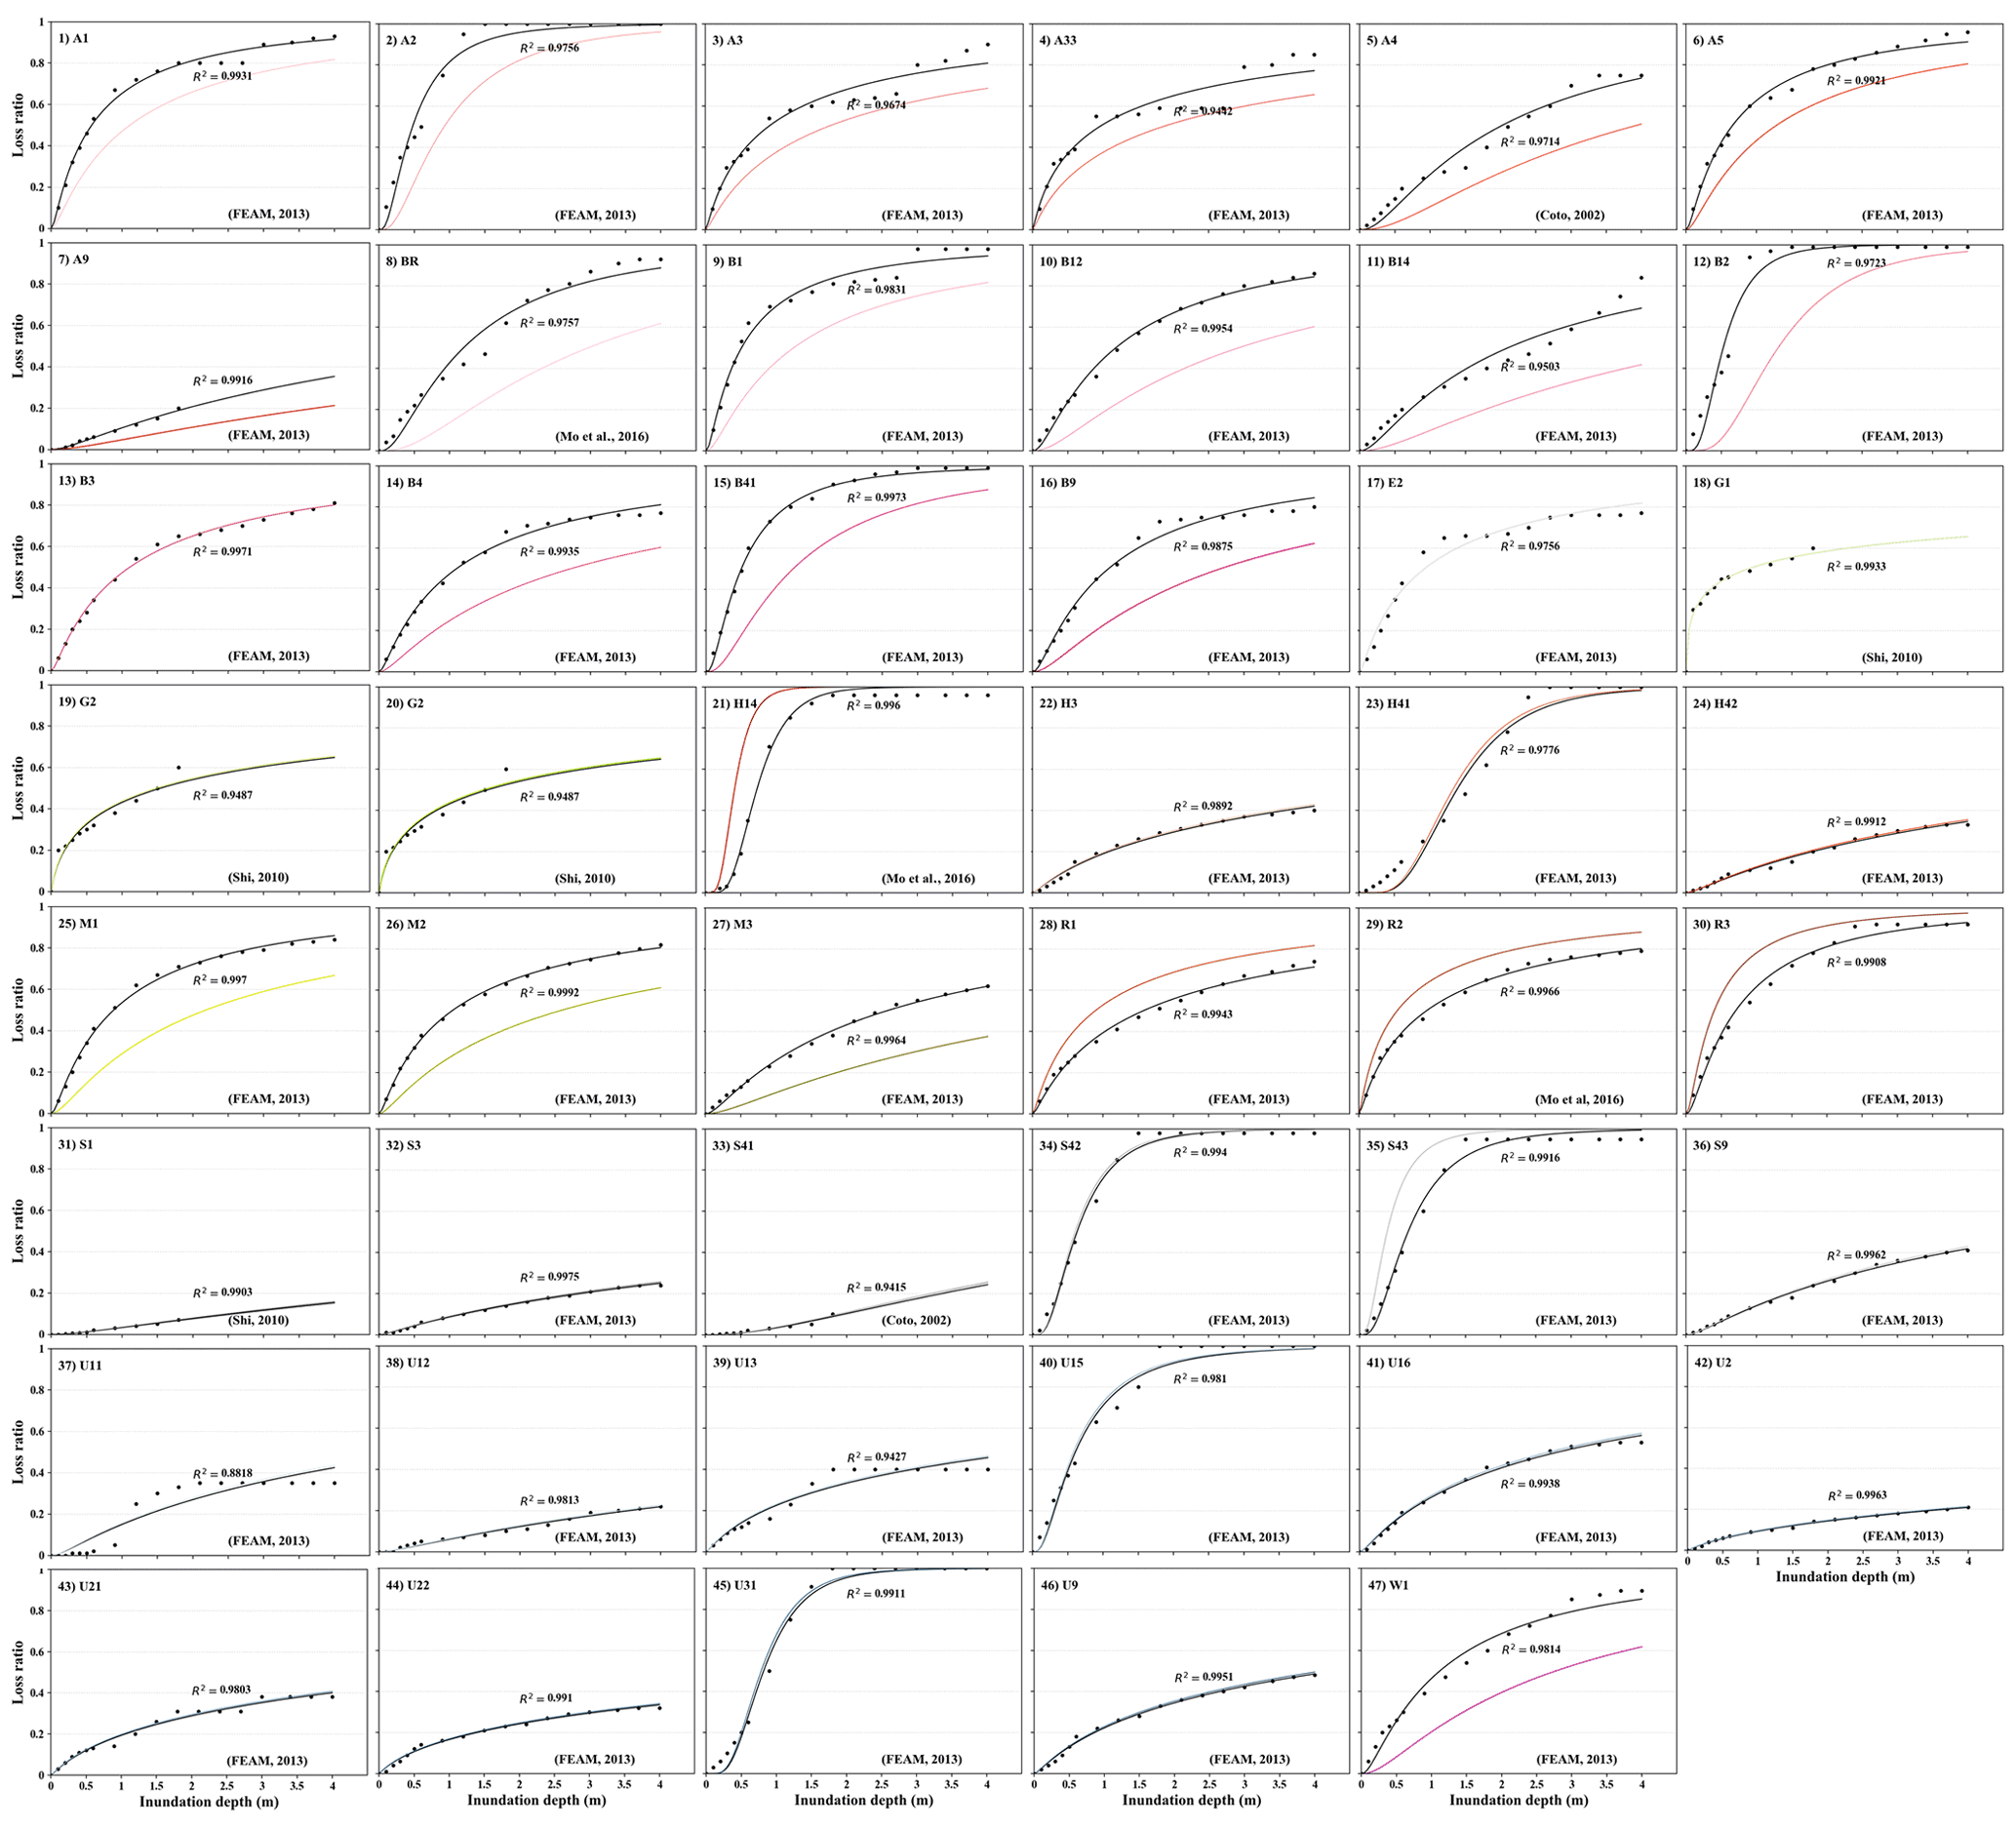
Figure 6Fitting and optimization of vulnerability curves of land use in Liandu district (the black dots refer to the inundation depth and loss ratio based on the reference, the black curve is the fitting result of the black dots by the lognormal cumulative distribution function (CDF), and the color curve is the optimized result based on the disaster loss reporting).
The loss ratios of residential, industrial, commercial, warehousing, public management and public service land are very high, mainly due to indoor properties being soaked or washed away by floods. As the inundation depth increases, the loss ratio increases rapidly. When the depth is higher than 3 m, the increase in loss ratio is not obvious.
The direct impact of floods on public facilities and roads is relatively small, and the loss ratio is generally low. However, the indirect loss caused by the suspension of roads, communications and electricity is relatively large but is not calculated in this study. Green space and square land are less affected by floods, and the loss ratio is relatively low.
The scale parameters of the vulnerability curve of the land use type corresponding to each statistical indicator in the disaster report selected the same optimization coefficient, and the coefficient was obtained by solving the nonlinear equation. The vulnerability curve of family property is stretched; that of infrastructure is stretched slightly; and those of public welfare facilities, industry, and commerce shrink. This comparison shows that the simulated loss after optimization is consistent with the disaster loss reporting, and the optimization effect is good (Table 2).
4.4 Distributions of the loss ratio and loss value
Based on the land use type and value data, the inundation depth distribution, and the optimized vulnerability functions of the land use, the distribution of loss ratio (Fig. 7a) and loss value (Fig. 7b) of Liandu district were estimated by the method in step 3 of Sect. 3.3.
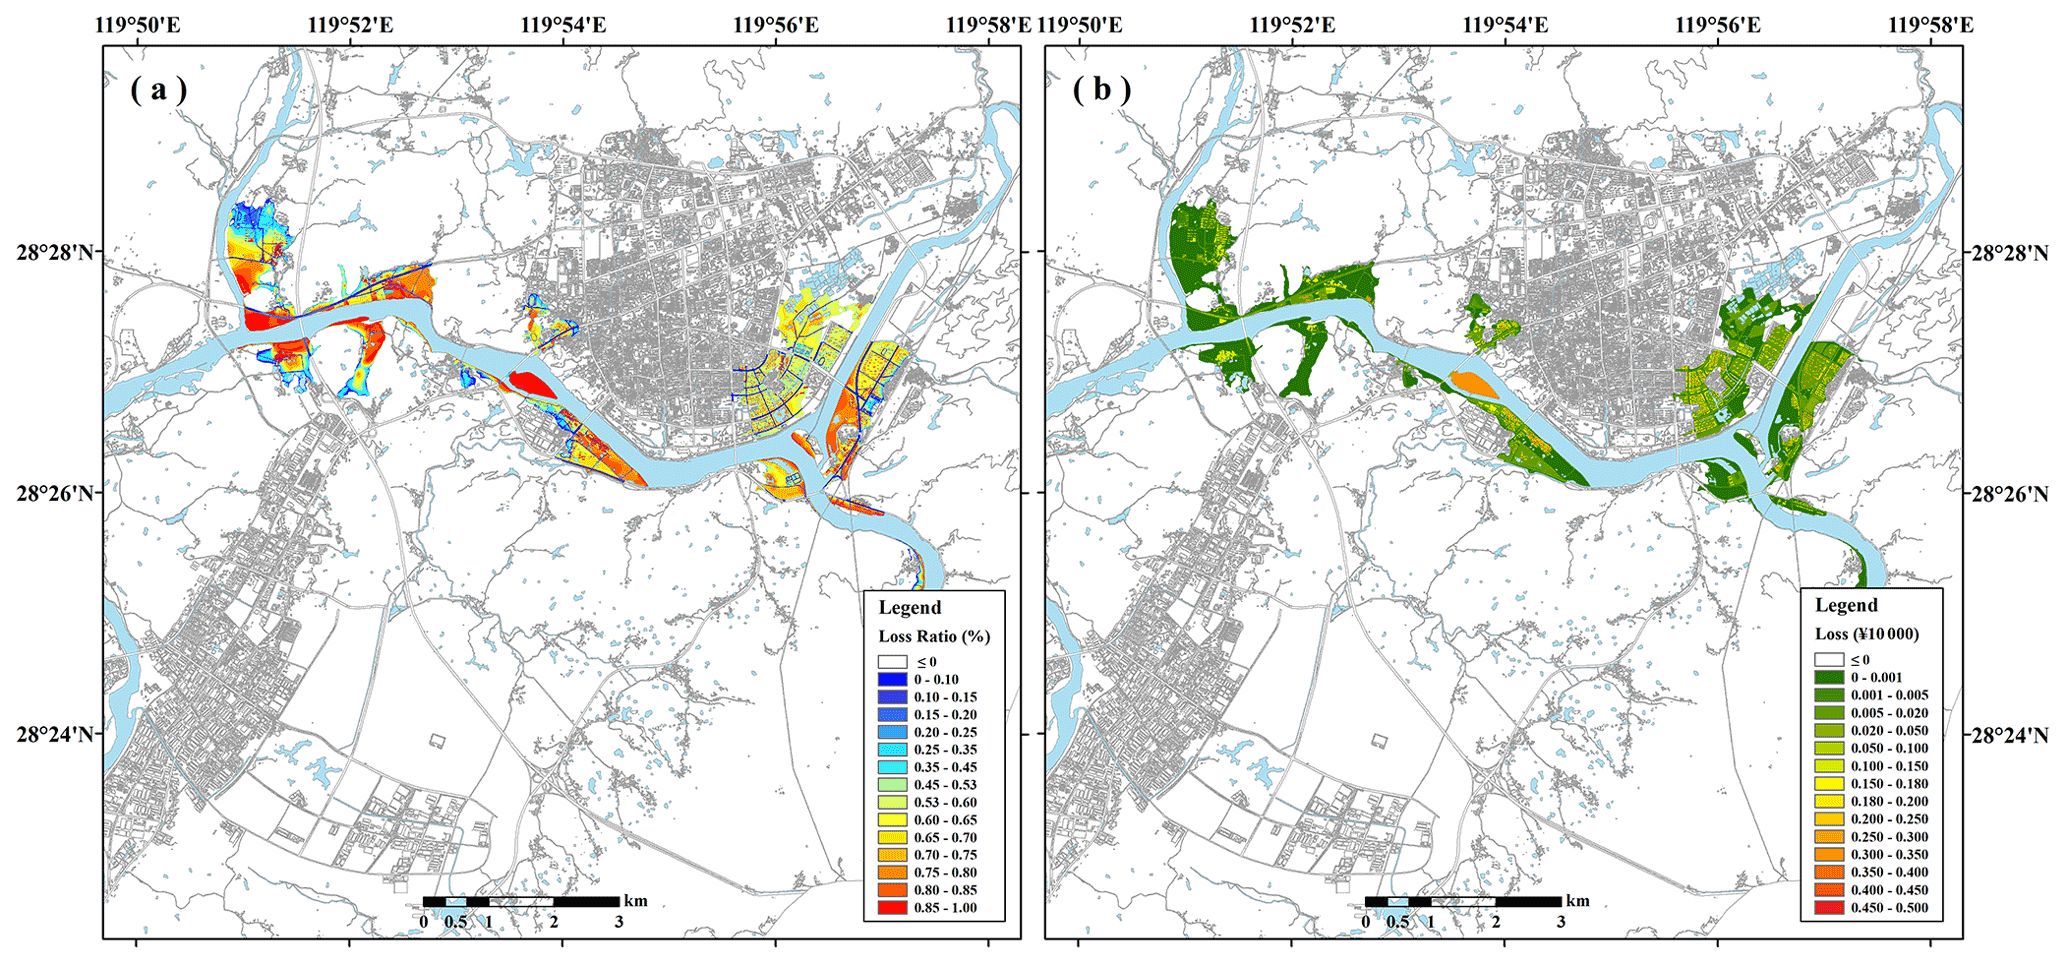
Figure 7Spatial distribution of the flood loss ratio (a) and loss values (b) in the central urban area of Liandu district in 2014.
Due to the high inundation depth at the river confluence and both sides of the river as well as the wide distribution of agricultural land in the area, the mean loss ratio of these areas is approximately 0.63. The inundation depth of the island is more than 7 m, and there are entertainment facilities on it, so the loss ratio is more than 0.6. In addition, the inundation depth on both sides of the Hao River is more than 1 m. The west side of the river is mainly residential land, and the east side is the Lishui railway station, so the indoor property loss ratio is high. However, traffic land is less directly affected by floods, so the loss ratio is less than 0.2 (Fig. 7a).
The loss value of a flood disaster is affected by the unit value and loss ratio of the land use. Therefore, the distribution characteristics of the loss ratio and loss value are different. The loss ratio of this flood is relatively high, but due to the wide distribution of agricultural land in the submerged area, the loss value per unit area is low. The loss ratio and unit area value of recreational and sports facilities, residential, industrial, commercial, public management, and public service facilities are high, so the loss values are also high. The loss ratio of traffic facilities is very low, yet the loss value is relatively high due to the high construction cost (Fig. 7b).
Liandu district is surrounded by high mountains, and the overland flow, affected by the topography, was formed by rainfall flowing into the Da River through the rivers in the north. The occurrences of heavy rainfall in the middle and upper reaches of the Oujiang River are similar, causing the whole basin to experience the flood peak period at the same time, which is not conducive to flood diversion efforts. To relieve the flood pressure on the basin, the Jinshuitan Reservoir was opened twice. At the same time, rapid urbanization has brought about great changes in the morphology of river channels and waters. These factors caused the river's water level to rise rapidly, overtopping the flood dike and submerging low-lying areas along the riverbed. In addition, due to the high population density and highly concentrated economy in the northern area of Liandu district, serious economic losses will inevitably occur when floods exceed the fortification standard of the dike.
The research and verification of the refined assessment of single-flood disaster loss were carried out by utilizing the refined types and values of land use and quantitative vulnerability curves, and the main conclusions are as follows.
The 47 types of land use data obtained by the fusion of vector and raster data overcome the limitations of the original data. This procedure not only refines the data into detailed urban land use types but also has a high spatial resolution. In addition, in the absence of a comprehensive and detailed survey of exposure data, the unit area costs or asset values obtained through the collection of written materials and expert questionnaires can reflect the overall distribution of the value of the exposure data to a certain extent. The types and values of land use developed by the above methods provide precise and reasonable exposure data for the refined assessment of disaster losses.
Based on lognormal cumulative distribution function fitting and scale parameter optimization, the vulnerability curves of 47 land use types accurately reflect the characteristics of land use loss ratio varying with the inundation depth in Liandu district and provide a reliable depth–damage function curve for refined loss assessment. Among these land use types, residential, industrial, commercial, public management and storage land are seriously affected by flooding. Other land uses are relatively less affected, and the loss ratio increases slowly. In the absence of a large number of post-disaster field survey data, the method proposed in this study can be used to construct vulnerability curves in accordance with the regional situation.
A refined assessment model of the direct economic loss of a single flood disaster is developed in accordance with the regional characteristics based on the refined research and verification of each link in the disaster loss assessment. The estimated spatial distributions of the loss ratio and loss value of the flood disaster accurately reflect the intensity and spatial pattern of disaster loss, which is conducive to the government's rational deployment of rescue forces and effective emergency assistance, especially in areas with severe disasters, to increase rescue forces and evacuate the people in time to reduce losses to a certain extent. Except for park green space, recreational and sports facilities, and agricultural and forestry land, the total loss of other land use types after optimization is CNY 322.6 million, which is CNY 510 000 higher than the loss report data. The error between the two is relatively small, indicating that the loss assessment model of this study can be effectively applied to this area.
The loss assessment model developed in this study can be used to estimate flood disaster losses under various climate change and socioeconomic scenarios, providing a basis for flood risk assessment and management in small- and medium-sized cities. This, in turn, will help the government formulate reasonable climate adaptation policies and sponge city planning (MHURD, 2014).
In this study, only the inundation and disaster loss reporting of one precipitation event are collected, thereby affecting, to a certain extent, the optimization results of the vulnerability curves. In the future, the data of several precipitation events will be collected to better calibrate the vulnerability curves and render the final optimized vulnerability curves more suitable for the region. Furthermore, the flood disaster caused serious direct economic losses to Liandu district. The disaster also stimulated a large amount of disaster relief investment, even as it disrupted public services and traffic, caused production losses for companies outside the flooded area, reduced agricultural production, and affected related industries (Jonkman et al., 2008). Therefore, it is necessary to carry out further research regarding the refined assessment of the indirect economic losses of flood disasters.
The data used in the study are available at https://github.com/Haixia-Zhang/Flood-loss-assessment/releases/tag/data (last access: 12 October 2021, https://doi.org/10.5281/zenodo.5562650, Zhang, 2021).
WF and HaiZ conceived the research framework and developed the methodology. HaiZ was responsible for the code compilation, data analysis, graphic visualization and first-draft writing. WF managed the implementation of research activities and revised the manuscript following reviewers’ suggestions. HuaZ and LY participated in the data collection and data curation of this study. All authors discussed the results and contributed to the final version of the paper.
The contact author has declared that neither they nor their co-authors have any competing interests.
Publisher’s note: Copernicus Publications remains neutral with regard to jurisdictional claims in published maps and institutional affiliations.
This article is part of the special issue “Advances in flood forecasting and early warning”. It is not associated with a conference.
This work was mainly supported by the National Key Research and Development Program of China (grant nos. 2018YFC1508803 and 2017YFA0604903) and jointly supported by the Key Special Project for Introduced Talents Team of the Southern Marine Science and Engineering Guangdong Laboratory (Guangzhou) (grant no. GML2019ZD0601) and the Deutsche Gesellschaft für Internationale Zusammenarbeit (GIZ) GmbH. The authors would like to acknowledge Kang Ying and Lin Song of the Zhejiang Design Institute of Water Conservancy and Hydroelectric Power for providing the flood inundation data in Liandu district.
This research has been supported by the National Key Research and Development Program of China (grant nos. 2018YFC1508803 and 2017YFA0604903), the Key Special Project for Introduced Talents Team of the Southern Marine Science and Engineering Guangdong Laboratory (Guangzhou) (grant no. GML2019ZD0601), and the Deutsche Gesellschaft für Internationale Zusammenarbeit (GIZ) GmbH.
This paper was edited by Jie Yin and reviewed by Jean-Paul Pinelli and one anonymous referee.
Albano, R., Sole, A., Adamowski, J., Perrone, A., and Inam, A.: Using FloodRisk GIS freeware for uncertainty analysis of direct economic flood damages in Italy, Int. J. Appl. Earth Obs., 73, 220–229, https://doi.org/10.1016/j.jag.2018.06.019, 2018.
Alfieri, L., Feyen, L., and Di Baldassarre, G.: Increasing flood risk under climate change: a pan-European assessment of the benefits of four adaptation strategies, Clim. Change, 136, 507–521, https://doi.org/10.1007/s10584-016-1641-1, 2016.
Amadio, M., Mysiak, J., Carrera, L., and Koks, E.: Improving flood damage assessment models in Italy, Nat. Hazards, 82, 2075–2088, https://doi.org/10.1007/s11069-016-2286-0, 2016.
Büchele, B., Kreibich, H., Kron, A., Thieken, A., Ihringer, J., Oberle, P., Merz, B., and Nestmann, F.: Flood-risk mapping: contributions towards an enhanced assessment of extreme events and associated risks, Nat. Hazards Earth Syst. Sci., 6, 485–503, https://doi.org/10.5194/nhess-6-485-2006, 2006.
Cao, S., Fang, W., and Tan, J.: Vulnerability of building contents to coastal flooding based on questionnaire survey in Hainan after typhoon Rammasun and Kalmeagi, J. Catastrophology, 31, 188–195, https://doi.org/10.3969/j.issn.1000-811X.2016.02.036, 2016.
Carisi, F., Schröter, K., Domeneghetti, A., Kreibich, H., and Castellarin, A.: Development and assessment of uni- and multivariable flood loss models for Emilia-Romagna (Italy), Nat. Hazards Earth Syst. Sci., 18, 2057–2079, https://doi.org/10.5194/nhess-18-2057-2018, 2018.
Coto, E. B.: Flood hazard, vulnerability and risk assessment in the city of Turrialba, Costa Rica, International Institute for Geo-information Science and Earth Observation(ITC), Enschede, the Netherlands, available at: http://www.itc.nl/library/Papers/msc_2002/ereg/badilla_coto.pdf (last access: 11 October 2021), 2002.
Custer, R. and Nishijima, K.: Flood vulnerability assessment of residential buildings by explicit damage process modelling, Springer, the Netherlands, 2015.
Dutta, D., Herath, S., and Musiake, K.: A mathematical model for flood loss estimation, J. Hydrol., 277, 24–49, https://doi.org/10.1016/S0022-1694(03)00084-2, 2003.
Elkhrachy, I.: Flash Flood Hazard Mapping Using Satellite Images and GIS Tools: A case study of Najran City, Kingdom of Saudi Arabia (KSA), Egypt, J. Remote Sens. Sp. Sci., 18, 261–278, https://doi.org/10.1016/j.ejrs.2015.06.007, 2015.
EMA: Disaster loss assessment guidelines, Part III, Emergency management practice, Volume 3, guidelines, Canberra, Emergency Management Australia (EMA), available at: https://doms.csu.edu.au/csu/file/78a6c5d7-fd8b-ff7e-fff3-2ffb78764ebe/1/resources/manuals/Manual-27.pdf (last access: 11 October 2021), 2002.
Falter, D., Schröter, K., Dung, N. V., Vorogushyn, S., Kreibich, H., Hundecha, Y., Apel, H., and Merz, B.: Spatially coherent flood risk assessment based on long-term continuous simulation with a coupled model chain, J. Hydrol., 524, 182–193, https://doi.org/10.1016/j.jhydrol.2015.02.021, 2015.
FEMA (Federal Emergency Management Agency): Multi-hazard loss estimation methodology, HAZUS-MH flood model technical manual, available at: https://www.fema.gov/sites/default/files/2020-09/fema_hazus_flood-model_technical-manual_2.1.pdf (last access: 11 October 2021), 2013.
Gerl, T., Kreibich, H., Franco, G., Marechal, D., and Schröter, K.: A review of flood loss models as basis for harmonization and benchmarking, PLoS One, 11, 1–22, https://doi.org/10.1371/journal.pone.0159791, 2016.
Hasanzadeh Nafari, R., Ngo, T., and Lehman, W.: Calibration and validation of FLFArs – a new flood loss function for Australian residential structures, Nat. Hazards Earth Syst. Sci., 16, 15–27, https://doi.org/10.5194/nhess-16-15-2016, 2016a.
Hasanzadeh Nafari, R., Ngo, T., and Lehman, W.: Development and evaluation of FLFAcs – A new Flood Loss Function for Australian commercial structures, Int. J. Disast. Risk Re., 17, 13–23, https://doi.org/10.1016/j.ijdrr.2016.03.007, 2016b.
Hsu, W., Huang, P., Chang, C., Chen, C., Hung, D., and Chiang, W.: An integrated flood risk assessment model for property insurance industry in Taiwan, Nat. Hazards, 58, 1295–1309, https://doi.org/10.1007/s11069-011-9732-9, 2011.
Jonkman, S. N., Bočkarjova, M., Kok, M., and Bernardini, P.: Integrated hydrodynamic and economic modelling of flood damage in the Netherlands, Ecol. Econ., 66, 77–90, https://doi.org/10.1016/j.ecolecon.2007.12.022, 2008.
Kang, Y. and Chen, Z.: Simulation model of water resources allocation in plain river network area, Water Resour. Prot., 23, 31–34, https://doi.org/10.3969/j.issn.1004-6933.2007.05.009, 2007.
Koks, E. E., Jongman, B., Husby, T. G., and Botzen, W. J. W.: Combining hazard, exposure and social vulnerability to provide lessons for flood risk management, Environ. Sci. Policy, 47, 42–52, https://doi.org/10.1016/j.envsci.2014.10.013, 2015.
Komolafe, A. A., Herath, S., and Avtar, R.: Development of generalized loss functions for rapid estimation of flood damages: a case study in Kelani River basin, Sri Lanka, Appl. Geomatics, 10, 13–30, https://doi.org/10.1007/s12518-017-0200-4, 2018.
Li, K., Wu, S., Dai, E., and Xu, Z.: Flood loss analysis and quantitative risk assessment in China, Nat. Hazards, 63, 737–760, https://doi.org/10.1007/s11069-012-0180-y, 2012.
Li, N., Zhang, Z., Chen, X., and Feng, J.: Importance of economic loss evaluation in natural hazard and disaster research, Prog. Geogr., 36, 256–263, https://doi.org/10.18306/dlkxjz.2017.02.011, 2017.
Limpert, E., Stahel, W. A., and Abbt, M.: Log-normal distributions across the sciences: Keys and clues, Bioscience, 51, 341–352, https://doi.org/10.1641/0006-3568(2001)051[0341:LNDATS]2.0.CO;2, 2001.
Merz, B., Kreibich, H., Thieken, A., and Schmidtke, R.: Estimation uncertainty of direct monetary flood damage to buildings, Nat. Hazards Earth Syst. Sci., 4, 153–163, https://doi.org/10.5194/nhess-4-153-2004, 2004.
Merz, B., Kreibich, H., Schwarze, R., and Thieken, A.: Review article “Assessment of economic flood damage”, Nat. Hazards Earth Syst. Sci., 10, 1697–1724, https://doi.org/10.5194/nhess-10-1697-2010, 2010.
Ministry of Housing and Urban-Rural Development (MHURD): Code for classification of urban land use and planning standards of development land, China, available at: https://www.antpedia.com/standard/6194830-1.html (last access: 11 October 2021), 2011.
Ministry of Housing and Urban-Rural Development (MHURD): Technical guide for sponge cities-water system construction of low impact development, available at: http://jst.jl.gov.cn/csjs/wjxx/201412/P020141222565834965487.pdf (last access: 11 October 2021), 2014.
Mo, W. and Fang, W.: Empirical vulnerability functions of building contents to flood based on post-typhoon (Fitow, 201323) questionnaire survey in Yuyao, Zhejiang, Trop. Geogr., 36, 633–641, https://doi.org/10.13284/j.cnki.rddl.002828, 2016.
NRC: Federal Flood Mapping Framework, Version 2.0, Canada, Natural Resources Canada, Public Safety Canada, available at: https://publications.gc.ca/collections/collection_2019/rncan-nrcan/M113-3-1-2018-eng.pdf (last access: 13 October 2021), 2017.
Penning-Rowsell, E. C., Yanyan, W., Watkinson, A. R., Jiang, J., and Thorne, C.: Socioeconomic scenarios and flood damage assessment methodologies for the Taihu Basin, China, J. Flood Risk Manag., 6, 23–32, https://doi.org/10.1111/j.1753-318X.2012.01168.x, 2013.
Pinelli, J. P., Da Cruz, J., Gurley, K., Paleo-Torres, A. S., Baradaranshoraka, M., Cocke, S., and Shin, D.: Uncertainty reduction through data management in the development, validation, calibration, and operation of a hurricane vulnerability model, Int. J. Disast. Risk Sc., 11, 790–806, https://doi.org/10.1007/s13753-020-00316-4, 2020.
Qie, Z. and Rong, L.: An integrated relative risk assessment model for urban disaster loss in view of disaster system theory, Nat. Hazards, 88, 165–190, https://doi.org/10.1007/s11069-017-2861-z, 2017.
Scawthorn, C., Asce, F., Flores, P., Blais, N., Seligson, H., Tate, E., Chang, S., Mifflin, E., Thomas, W., Murphy, J., Jones, C., and Lawrence, M.: HAZUS-MH Flood Loss Estimation Methodology. II. Damage and Loss Assessment, Nat. Hazards Rev., 7, 72–81, https://doi.org/10.1061/(ASCE)1527-6988(2006)7:2(72), 2006.
Shen, Y., Zhao, P., Pan, Y., and Yu, J.: A high spatiotemporal gauge-satellite merged precipitation analysis over China, J. Geophys. Res.-Atmos., 119, 3063–3075, https://doi.org/10.1002/2013JD020686, 2014.
Shi, Y.: Research on vulnerability assessment of cities on the disaster scenario: A case study of Shanghai city, PhD thesis, East China Normal University, China, 238 pp., 2010.
Stephenson, V. and D'Ayala, D.: A new approach to flood vulnerability assessment for historic buildings in England, Nat. Hazards Earth Syst. Sci., 14, 1035–1048, https://doi.org/10.5194/nhess-14-1035-2014, 2014.
UNISDR: The Pocket GAR 2015 Making Development Sustainable: The Future of Disaster Risk Management, Geneva, Switzerland: United Nations Office for Disaster Risk Reduction (UNISDR), available at: https://www.preventionweb.net/english/hyogo/gar/2015/en/gar-pdf/GAR15_Pocket_EN.pdf (last access: 11 October 2021), 2015.
USACE (United States Army Corps of Engineers): Depth-damage relationships for structures, contents, and vehicles and content-to-structure value ratios (CSVR) in support of the Donaldsonville to the Gulf, Louisiana, feasibility study, New Orleans District, Louisiana, available at: https://www.mvn.usace.army.mil/Portals/56/docs/PD/Donaldsv-Gulf.pdf (last access: 11 October 2021), 2006.
Wehner, M., Canterford, S., Corby, N., Edwards, M., and Juskevics, V.: Vulnerability of Australian houses to riverine inundation: analytical and empirical vulnerability curves, Canberra: Geoscience Australia, https://doi.org/10.11636/Record.2017.010, 2017.
Yu, K., Li, D., Yuan, H., Fu, W., Qiao, Q., and Wang, S.: “Sponge City”: theory and practice, City Plan. Rev., 39, 26–36, https://doi.org/10.11819/cpr20150605a, 2015.
Zhang, H.: Haixia-Zhang/Flood-loss-assessment/releases/tag/data, Zenodo [data set], https://doi.org/10.5281/zenodo.5562650, 2021.
Zhao, Y., Gong, Z., Wang, W., and Luo, K.: The comprehensive risk evaluation on rainstorm and flood disaster losses in China mainland from 2004 to 2009: Based on the triangular gray correlation theory, Nat. Hazards, 71, 1001–1016, https://doi.org/10.1007/s11069-013-0698-7, 2014.
Zhou, Y., Lu, G., Jin, J., Tong, F., and Zhou, P.: A high precision comprehensive evaluation method for flood disaster loss based on improved genetic programming, J. Ocean Univ. China, 5, 322–326, https://doi.org/10.1007/s11802-006-0023-0, 2006.