the Creative Commons Attribution 4.0 License.
the Creative Commons Attribution 4.0 License.
 | 14 Sep 2021
Longitudinal survey data for diversifying temporal dynamics in flood risk modelling
Anna Scolobig
Marco Borga
Giuliano Di Baldassarre
Scholars have unravelled the complexities and underlying uncertainties in coupled human and water systems in various fields and disciplines. These complexities, however, are not always reflected in the way in which the dynamics of human–water systems are modelled. One reason is the lack of social data time series, which may be provided by longitudinal surveys. Here, we show the value of collecting longitudinal survey data to enrich sociohydrological modelling of flood risk. To illustrate, we compare and contrast two different approaches (repeated cross-sectional and panel) for collecting longitudinal data and explore changes in flood risk awareness and preparedness in a municipality hit by a flash flood in 2018. We found that risk awareness has not changed significantly in the timeframe under study (1 year). Perceived preparedness increased only among those respondents who suffered low damage during the flood event. We also found gender differences across both approaches for most of the variables explored. Lastly, we argue that results that are consistent across the two approaches can be used for the parametrisation of sociohydrological models. We posit that there is a need to enhance the representation of socio-demographic heterogeneity in modelling human–water systems in order to better support risk management.
- Article
(551 KB) - Full-text XML
-
Supplement
(944 KB) - BibTeX
- EndNote


Over the past decades, numerous scholars have engaged with the study of coupled human and water systems in various research fields and disciplines, including environmental history, sociology, and philosophy as well as ecological economics, philosophy of science, socio-ecological systems, and sociohydrology (e.g. Aldrete, 2007; Di Baldassarre et al., 2019; Folke et al., 2005; Hoffmann et al., 2020; Kallis and Norgaard, 2010; Liu et al., 2007; Ostrom, 2009; Schlüter et al., 2012; Sivapalan et al., 2012). Many of these studies adopt a system thinking approach to embrace the complexities and underlying uncertainties in natural systems and the way in which human systems affect and are affected by them (Checkland, 2000; Checkland and Poulter, 2006).
Falling under the bigger umbrella of socio-ecological systems (SESs; Redman et al., 2004), sociohydrology also proposes a system thinking approach for explaining risk, opportunities, and phenomena generated by the complex interactions between water and society. Recently, sociohydrological models have emerged as useful tools to explain risks generated by feedback mechanisms between human and water systems and thus support the policy-making processes (Blair and Buytaert, 2016). Many scholars have developed sociohydrological models of flood risk, using system dynamics (e.g. Barendrecht et al., 2019; Di Baldassarre et al., 2013; Liu et al., 2017; Viglione et al., 2014) or agent-based (e.g. Haer et al., 2019; Michaelis et al., 2020) approaches. The former often schematises human systems as lumped by using average values to describe the way in which individuals act, think, and perceive risk (e.g. Barendrecht et al., 2019; Di Baldassarre et al., 2013; Liu et al., 2017; Viglione et al., 2014). Instead, the latter explicitly considers the heterogeneity of human systems by using multiple agents (e.g. Haer et al., 2019; Michaelis et al., 2020). These models include social parameters describing for example attitudes and behaviours towards risk. Yet, the inclusion of complex social dynamics may increase structural uncertainty and open up questions about the reliability of modelling (De Marchi, 2020; Saltelli and Funtowicz, 2015).
One of the IPCC reports (Metz et al., 2007) argued that structural uncertainty is reduced when (a) convergent results are obtained using different methods, and (b) results rely on empirical data rather than calculations. Hence, to make sure that sociohydrological models serve their purpose, they must employ different types of data. While time series concerning physical aspects, such as precipitation, runoff, and flood water levels, are often available, data availability is limited when it comes to time series concerning social parameters, such as changes in flood risk awareness and preparedness over time (Barendrecht et al., 2019; Mondino et al., 2020a). Sociohydrological models of flood risk use changes in awareness as primary mechanisms explaining the emergence of unintended consequences, such as the safe-development paradox (e.g. Barendrecht et al., 2019; Di Baldassarre et al., 2013; Liu et al., 2017; Viglione et al., 2014). Thus, the empirical social data with the greatest contribution potential are longitudinal survey data (Bubeck et al., 2020; Hudson et al., 2020; Siegrist, 2013, 2014; Sivapalan, 2015). Indeed, the availability and use of longitudinal psychological and behavioural data are key to reducing structural uncertainty within sociohydrological modelling (Di Baldassarre et al., 2016).
Specifically, longitudinal survey data on risk awareness and preparedness are required to explore how a human–water system evolves over time in the presence or absence of hydrological extremes (e.g. floods or droughts) as such data represent potential drivers of behavioural change. Knowing if and how people's awareness of risk changes over time and how people may or may not be prepared for a disastrous event, e.g. by adopting private protection measures or by supporting the implementation of structural or non-structural risk reduction measures, is fundamental to better understand human impacts on the water system. Moreover, and most importantly, a better understanding of preparedness dynamics can save lives. In fact, this knowledge may, among other things, uncover potentially heterogeneous adaptation trajectories and contribute to identifying social data proxies to evaluate the long-term effectiveness of risk awareness and communication campaigns. In turn, this can help in overcoming the oversimplified representation of a community as a lumped system.
Barendrecht et al. (2019) used empirical data to estimate the parameters of a sociohydrological flood risk model by means of Bayesian inference. The longitudinal survey data were collected in Dresden, Germany, after the flood events of 2002, 2006, and 2013 (more information in Kreibich et al., 2005; Kreibich and Thieken, 2009; Thieken et al., 2016). They argue that, while both sociohydrological models and empirical studies have their own limitations, the combination of the two may help bring out their pros while mitigating their cons. In their study, they conducted a sensitivity analysis to unravel the influence of a number of variables on a simple sociohydrological model. They found that when risk awareness data are absent, most of the parameter estimations are biased, and, even more worrying, the modelled dynamics between the water and the human system over time are wrong. Concerning preparedness, their analysis shows that a lack of preparedness data does not have an impact as serious as the lack of awareness data because it does not influence the estimation of other parameters. They also add that in the absence of such data the dynamics of preparedness itself may be biased. On the one hand, this may be due to how preparedness was defined in their model (a ratio of protection measures taken by a household versus the total amount of protection measures available). On the other, this undoubtedly shows the paramount importance of collecting longitudinal data on risk awareness and preparedness, especially within the field of flood risk, to avoid modelling errors and biases that would be otherwise difficult to identify. An effort in this direction was recently made by Ridolfi et al. (2020), who explored the influence of collective flood memory on flood losses, even though the empirical data consisted of proxy information about flood memory, i.e. archaeological data about the average vertical distance of human settlements from the river rather than longitudinal surveys.
Moreover, despite the need for empirical longitudinal data per se (Siegrist, 2013), there is a need for reliable and robust data on attitude and behavioural dynamics, such as how risk awareness and preparedness change over time. The general assumption in the literature is that, after the occurrence of a flood and in the absence of consequent flood events, risk awareness decreases over time. This assumption finds its roots in the fact that sociohydrological models of flood risk often use memory as a proxy for risk awareness (Di Baldassarre et al., 2013; Viglione et al., 2014). Besides the fading of memory itself, the use of memory is inevitably connected to cognitive processes (e.g. the availability heuristic; Tversky and Kahneman, 1973), asserting that people tend to judge the probability and consequences of an event based on the ease with which it comes to mind. Following this reasoning, after the occurrence of a flood and in the absence of consequent flood events, risk awareness should decrease. Recently, Bubeck et al. (2020) and Mondino et al. (2020a) provided evidence of the decreasing rate of risk awareness and perceived preparedness in the aftermath of a flood event with empirical survey data. However, these studies are just one step forward, and more evidence is needed in terms of attitude and behavioural dynamics. For instance, risk awareness may even take different trajectories over time depending on certain characteristics of the individual, such as gender or severity of the experience with the hazard. These two factors have previously been shown to greatly influence our perception of risk. Women in general tend to be more concerned than men not only when it comes to floods (Cvetković et al., 2018) but also for other hazards such as road accidents (Cordellieri et al., 2016) or health risks (Galasso et al., 2020; Kim et al., 2018). In the literature, this has been described as the white male effect (Finucane et al., 2010). In this sense, differences are not biological (or at least not entirely) but may lie in socio-political factors such as power and status. Previous experience with the hazard influences our perception of risk positively or negatively depending on its severity, with people more harshly affected showing a higher risk awareness (Mondino et al., 2020b; Wachinger et al., 2013). The effect of experience can also be counterintuitive and result in the risk perception paradox, whereby people who experienced the hazard with negligible consequences show a lower risk awareness (Wachinger et al., 2013). We thus hypothesise that these individual characteristics play a role not only in the perception of risk itself but also in how it evolves over time.
This paper therefore aims at providing a methodological contribution to the literature by presenting and comparing two methods to collect longitudinal data:
- i.
the repeated cross-sectional approach, consisting of conducting cross-sectional surveys two (or more) times over the years in the same area;
- ii.
the panel approach, consisting of surveying exactly the same individuals two (or more) times over the years.
This procedure allows us to stress test the variables of interest using different methodologies, with the goal of reducing structural uncertainty. We argue that consistent results about the change (or lack thereof) in risk awareness and perceived preparedness will not only provide additional evidence to be employed in sociohydrology but also inform disaster risk communication strategies and policies. We also argue that human–water system models benefit from either one or the other approach depending on the purpose of the model itself. We illustrate the two approaches with a case study of a village in north-eastern Italy that was hit by a flash flood in 2018. Two survey rounds were conducted, the first one in February 2019 and the second one in February 2020, 6 and 18 months after the flood event, respectively.
Depending on the information we are interested in, survey data can be collected in two different ways: via a cross-sectional approach or via a longitudinal approach. A cross-sectional design can be defined as a picture or a snapshot that provides us with information about a certain variable at a specific point in time and space and thus consists of just one sample surveyed at one point in time. Cross-sectional studies are optimal when the researcher is not interested in detecting a change. However, the snapshot approach is not always informative of a process that is ongoing and constantly changing. Things that happened in the past shape current behaviours, and they must be taken into account. To this end, it would be optimal to have a research approach that provides us with a “video” of the process, but since this is obviously not feasible, the best option is to take multiple pictures over time and detect potential differences. This is what a longitudinal design does (Payne and Payne, 2011). Longitudinal studies consist of surveying either two or more different samples collected at two or more points in time (repeated cross-sectional) or the same sample at two or more points in time (panel). Therefore, a longitudinal design helps not only spot changes in comparison to previously recorded perceptions and behaviours but also recognise any correlation between variables as well as avoid misleading conclusions (Siegrist, 2013). In fact, potentially misleading results from cross-sectional studies could end up in wrong policy recommendations. In light of these characteristics, the need for longitudinal data has been highlighted by a number of scholars in the natural hazards field (Babcicky and Seebauer, 2017; Di Baldassarre et al., 2018b; Fielding, 2012; Lindell and Perry, 2000; Spence et al., 2011; Terpstra, 2011; van Duinen et al., 2015). However, even though a large majority of scholars within sociohydrology acknowledge this lack of longitudinal data, the majority of empirical studies within the flood risk domain adopt a cross-sectional approach (a review in Kellens et al., 2013), and empirical studies that adopt a longitudinal approach are still rather scarce (Barendrecht et al., 2019; Hudson et al., 2020).
The following sections will go through the two main types of longitudinal studies, repeated cross-sectional and panel studies. The difference between the two lies mostly in the sampling procedure and the individuals who are sampled, but this significantly influences the type of statistical analysis that can be conducted on the respective data and the pros and cons of each approach.
2.1 Repeated cross-sectional studies
A repeated cross-sectional study (RCS) consists of repeating the same survey over time without necessarily involving the same respondents. This is similar to a cohort study, which consists of sampling individuals with a shared characteristic, which makes them part of a “cohort”, e.g. being born in the same year, living in the same town, having experienced a certain event. Therefore, the two (or more) samples taken over time contain different individuals at different points in time. There are studies adopting a mixed sampling; i.e. the two samples may contain some of the same individuals but not all (Kienzler et al., 2015). However, if not properly accounted for, this may lead to issues in the statistical analysis. If we sample inhabitants of a town in 2019 and then we sample other inhabitants of the same town in 2020, we are adopting a repeated cross-sectional approach. This approach allows the sample to keep its size over time as there is no need to recruit the same individuals in the consecutive survey rounds. This makes the approach rather resource-friendly. As a consequence, by adopting this approach, the possibility of following the evolution of an individual over time is lost, and comparisons can only be made between clusters of individuals. Thus, changes can only be analysed at the societal level. An example of this approach is presented in Mondino et al. (2020a), who studied changes in risk awareness and preparedness in two municipalities in the north-eastern Italian Alps. Salvati et al. (2014) conducted a similar study in Italy but at the national level, where they explored risk perception for a number of natural and technological hazards (among which were floods). They conducted two rounds of surveys in 2012 and 2013 and found a slight decrease in the percentage of respondents with a high flood risk perception, but no statistical significance was reported. RCS studies are also often conducted at the international level to assess differences among countries regarding certain indicators. An example is the Labour Force Survey (Eurostat, 2021), which is conducted in various countries and aims at collecting data on the labour market, such as the unemployment rate.
2.2 Panel studies
A panel study investigates a sample composed of the same individuals over time, e.g. 100 people who agree to take part in certain research and be assayed multiple times in a 15-year time span. If we want to adopt a longitudinal approach, following the previous example we must interview in 2020 the same individuals whom we interviewed in 2019, provided that they accept to partake in the survey again. This approach is optimal when we are interested in following the evolution of an individual over time. It also allows for more in-depth statistical analyses as it is possible to introduce the random effect of the individual into regression models. On the other hand, maintaining a longitudinal panel is resource-intense as the panellists' interest declines over time, especially when it comes to flood risk. This is because the initial sample is smaller than in other cases, given that floods are usually locally confined (Hudson et al., 2020). The loss of panellists over time is known as the attrition rate. If the panellists drop out non-randomly (i.e. they share certain characteristics), then we incur an attrition bias (however, there is little evidence of that in the flood risk domain; Hudson et al., 2020). When the attrition rate is considerably high, we incur a retention bias; i.e. the number of observations is so small that any statistical analysis loses significance.
Hudson et al. (2020) discussed the challenges of longitudinal surveys in the flood risk domain. In their review, they collected all studies that adopted a panel approach within the flood risk domain and then explored the potential for attrition rate, bias, and retention bias. They then explored the same in a panel study conducted in Germany after the flood event in 2013. They found little evidence for attrition bias. As for the attrition rate, this varies greatly among studies. The average in their literature review was 38 %, while in their panel study in Germany it had an average per wave of 60 %. In general, they found that studies using pre-existing panels (e.g. the Swiss Household Panel study, FORS) have a much lower attrition rate compared to panels specifically developed to investigate a flood-affected population.
In their review, Hudson et al. (2020) found only seven empirical studies in addition to their own that followed a panel approach within the flood risk domain up to 2018 (Calvo et al., 2015; Fay-Ramirez et al., 2015; Fothergill, 2003; Ginexi et al., 2000; Kaniasty and Norris, 2008; Lin et al., 2017; Osberghaus, 2017). Since 2018, we found four other studies that adopted such an approach in the flood risk domain. Bodoque et al. (2019) investigated changes in risk perception after introducing a risk communication strategy 8 months after the first survey round in a municipality hit by a flash flood in Spain. After conducting a second survey round 1 month after the implementation of the strategy, they found that those respondents who were exposed to risk communication activities had a slightly higher risk awareness but only when thinking about the town as a whole. The effect of risk communication strategies in promoting mitigation behaviour was also explored by Osberghaus and Hinrichs (2020), but they did not investigate changes in risk awareness itself. Bubeck et al. (2020), using the same dataset employed in Hudson et al. (2020), investigated dynamics of human behaviour in response to flooding, following individuals over three survey rounds 9, 18, and 45 months after the 2013 flood in Germany. They only detected a decrease in risk perception in terms of perceived probability between the second and third wave. Seebauer and Babcicky (2020) explored causal relationships within the protection motivation theory in Austria, but they did not detect any statistically significant difference in risk perception between the two survey rounds (15 months apart).
Following the effort of Hudson et al. (2020), we here explore the differences in results yielded by panel and repeated cross-sectional data, collected with the same survey in a single study area. No study so far has investigated this difference on the basis of empirical data within the flood risk domain. The next section describes in detail the sampling procedures.
3.1 Study area
The municipality of Negrar, located in the Veneto Prealps north of Verona, served as a case study. The administrative area ranges from 70 to 860 m a.s.l. Three main streams (locally known as progni) flow through the municipality and merge with the Adige river downstream. Negrar is further divided into smaller urban conglomerates, mainly located in the floodplains in the southern part of the municipality. Its population steadily increased in the last years and reached 16 850 units as of 2020.
On 1 September 2018, one of the small urban conglomerates (Arbizzano–Santa Maria was hit by a flash flood. Heavy rainfall accumulated more than 180 mm in less than 3 h, and the progno di Novare overflowed, flooding the nearby buildings with a peak discharge that reached 20 m3 s−1. Because of its intensity, this flash flood – characterised by a 100-year return period – caused severe economic damage (EUR ∼10 million) and affected more than 3000 people (although no casualties were reported). The Civil Protection did not have a pre-eminent role during the unfolding of the event but was rather involved in the recovery phase, especially when it came to the distribution of funds for reconstruction and cleaning activities. Data collection was thus focused on Arbizzano–Santa Maria (4000 inhabitants). Previously, the only other flood event that caused extensive damage occurred in 1935. The Piano di Assetto Idrogeologico dell'Adige, which contains flood risk maps used to evaluate the potential for flood risk in the Adige basin, does not identify any flood risk in the area. However, such maps have a rather low resolution, not sufficient to capture flood risk in small river basins (such as the Novare one, ∼2 km2; Weyrich et al., 2020). New maps that will be able to capture the risk in smaller basins are currently being developed. Further information on the hydrology of the area is presented in Weyrich et al. (2020) and Mondino et al. (2020b), while comprehensive hydrological data and their collection are presented in Amponsah et al. (2018) and Borga et al. (2019).
3.2 Data collection
Data collection was based on a questionnaire survey carried out twice face-to-face in February 2019 and February 2020. Between the two surveys, the local administration organised a number of events to inform the residents of various aspects of the 2018 flood. In one event, a local meteorological association explained the potential causes that led to the flooding. In another event, the municipality hosted one of the authors of this paper to present the results following the first round of interviews (presented in Weyrich et al., 2020, and Mondino et al., 2020b). In addition to increasing the maintenance of the smaller streams running through the town (which overflowed, causing the 2018 flooding), the municipality also undertook the construction of a flood diversion channel to redirect the water coming from the streams towards a larger stream that eventually flows into the Adige river. This way, the amount of water in the smaller streams is reduced and so is the probability of overflow during heavy-rain periods.
In the first survey round, we favoured a stratified sample of residents based on quotas (Stockemer, 2019) over a random sample, which might have resulted in the exclusion or underrepresentation of those residents living in the most risky areas and the households most affected by the 2018 flood. The sample was stratified according to age and gender (based on Italian National Census data). Each interviewer (six in total) was provided with a grid containing the target distribution of interviewees to reflect the statistical distribution of these variables in the local population. The demographic data were provided by the Civil Registry of Negrar, and the administration also provided a list of residents that were affected by the flash flood who agreed to be interviewed. The interviewers were then instructed to first contact the people on the list via phone calls to set appointments for the interviews, a fundamental preliminary step to establish trust in the local community. In turn, the residents who were interviewed first helped the interviewers establish trust with neighbours in order to facilitate the interviewing process in households affected by the 2018 flood and avoid unnecessary nuisance. In addition, the interviewers received a map of the study area and were instructed to contact each household on each and every street; to maximise randomisation; and, at the same time, to meet the quotas that were required for age and gender. The unit of analysis was the individual, and interviewees were instructed to interview only one person per household. The restriction to one person per household was due to the presence of questions relating to the adoption of protection measures within the household, which are not discussed in the present paper but are extensively presented in Weyrich et al. (2020). Thus, interviewing more than one person per household would have led to duplicates for the questions about the adoption of protection measures.
Data in the first survey round were collected between 18 February and 1 March 2019, approximately 6 months after the flood event. Local authorities approved the survey. Participants received no incentive to complete the survey, which took them on average 30 min to complete. At the end of the interview, respondents were asked whether they agreed to being contacted again a year later to fill out the same questionnaire. If they agreed, they were asked to provide a contact (phone number or email address) so that they could be contacted again.
Data in the second survey round were collected between 17 February and 1 March 2020. Here, we drew two samples. The first sample was drawn in the same way as the original sample, e.g. stratified sample based on quotas and representative of the local population in terms of age and gender. Interviewers were instructed not to include in this sample those respondents who completed the survey in the first round. This sample, together with the original, constitutes the RCS dataset. The second sample consisted exclusively of individuals who participated in the first survey round and who accepted to participate again. This second sample, together with the original one, constitutes the panel dataset.
Summary statistics for all three samples are presented in Table 1. In all of them, the majority of respondents hold a high school diploma or higher (round 1: 44.5 % high school diploma, 29.5 % university degree or higher; round 2 – RCS: 40.7 %, 36.9 %; round 2 – panel: 47.6 %, 36.9 %) and perceive their household income to be enough to satisfy their family's needs (i.e. answered 3 or above on a scale from 1 to 5 (1 being minimum and 5 being maximum); round 1: 86 %; round 2 – RCS: 89 %; round 2 – panel: 93 %).
Table 1Summary statistics of the three samples collected.
∗ This question was not asked in the first survey round.
3.3 Variables assayed
While this paper does not aim to test a specific theory, our survey questions are partly based on the protection motivation theory (PMT; Rogers and Prentice-Dunn, 1997) in an effort to improve comparability with previous (and future) studies. The PMT distinguishes between two different perceptual processes, threat appraisal (i.e. risk perception) and coping appraisal (i.e. the individual's perceived ability to cope with the hazard; Grothmann and Reusswig, 2006). Here, two variables were used as a proxy for threat appraisal, perceived threat posed by floods and expected future damage, while perceived preparedness was used as a proxy for coping appraisal. Perceived preparedness here is meant as a general self-assessment of one's own preparedness to face a potential future flood event. In addition, the survey explored the general feeling of safety, severity of the experience with the flood (specifically, flood damage suffered during the 2018 event), knowledge about the hazard, and trust in authorities. In round 2 only, respondents were also asked whether they adopted any structural protection measures and an insurance (specifying whether they did this before or after the event) to potentially justify changes in perceived preparedness. Because the municipality undertook the construction of structural protection works, in round 2 respondents were also asked to what extent they agreed with the following statements: (a) “protection works eliminate the possibility of severe damage”, (b) “protection works are too costly compared to their benefits”, and (c) “protection works give a feeling of safety to people living in the town” (on a scale from 1 (not at all) to 5 (completely agree)). The survey also included the collection of socio-demographic indicators such as age, gender, education, and income. The variables, related questions, and available answers are listed in Table 2, and the complete survey questionnaire can be found in the Supplement.
Table 2Main variables employed in the analysis.

∗ “I don't know” answers were categorised as not applicable and excluded from the analysis.
Regarding the damage suffered during the 2018 flood, to facilitate the analysis respondents were divided into three groups: those who did not experience any damage (i.e. 1 on a scale from 1 to 5 (1 being minimum and 5 being maximum)), those who experienced low damage (i.e. 2–3 on the scale), and those who experienced high damage (i.e. 4–5 on the scale). This also allowed us to investigate the potential presence of the risk perception paradox mentioned earlier.
The statistical analysis conducted on the RCS dataset consisted of single regressions using cumulative link models (CLMs). Because the panel approach consists of following the individual respondent over time, giving us an insight into how differently or similarly the same person replied to the same questions posed to them, the statistical analysis conducted on the panel dataset consists of single regressions using cumulative link mixed models (CLMMs), which allow for the introduction of random effects (in this case, the individual respondent). Both analyses were conducted with the R software for statistical computing (version 3.5.2) using the package “ordinal” (Christensen, 2019). We adopted a 90 % confidence interval.
Before presenting the results of the analysis concerning changes in risk awareness and perceived preparedness, the following section discusses the potential for attrition bias and retention bias in the panel dataset.
3.4 Attrition bias and retention bias
In the first survey round, 86 % of the respondents (N=125) agreed to be contacted again, but only 58 % of them (N=84) actually repeated the survey in the second round, leading to a 42 % attrition rate. This is in line with the average 40 % attrition rate reported in other studies using specifically developed surveys (Hudson et al., 2020). While this percentage is not particularly high per se, when considering the relatively small size of the first sample it may create some issues regarding the statistical significance of the analysis conducted; i.e. there is potential for retention bias, and this must be taken into account when interpreting the results. Table 3 reports summary statistics for the group of respondents who dropped out.
Table 3Summary statistics for the respondents who dropped out between round 1 and round 2.
In addition, we ran an ordinal logistic regression to assess the probability of a respondent moving from survey round 1 to round 2 depending on the main variables connected to our research question (changes in flood risk awareness and perceived preparedness). This allowed for exposing any potential attrition bias due to data missing at random (MAR; van Buuren, 2018), i.e. when missing data (respondents who drop out) are connected to observed factors. This is just one of the ways to test for attrition bias. Other methods are used in the econometric literature (see e.g. Alderman et al., 2001; Little and Rubin, 2019).
Table 4 shows that only few of the variables that are important for our research question affect the probability of a respondent to move to the next survey round. The variables age and age squared show a non-linear relationship, meaning that as the age increases participation in the next round tends to increase but at a decreasing rate. The same result was also reported by Hudson et al. (2020). Concerning the perceived threat posed to the town by floods, participants who replied on the higher end of the scale in the first round are more likely to participate in the second. Perceived preparedness, on the other hand, has the opposite effect: respondents who reported low levels of perceived preparedness in the first round are more likely to participate again in the second.
Table 4Logit regression model of the probability of a respondent moving from round 1 to round 2.
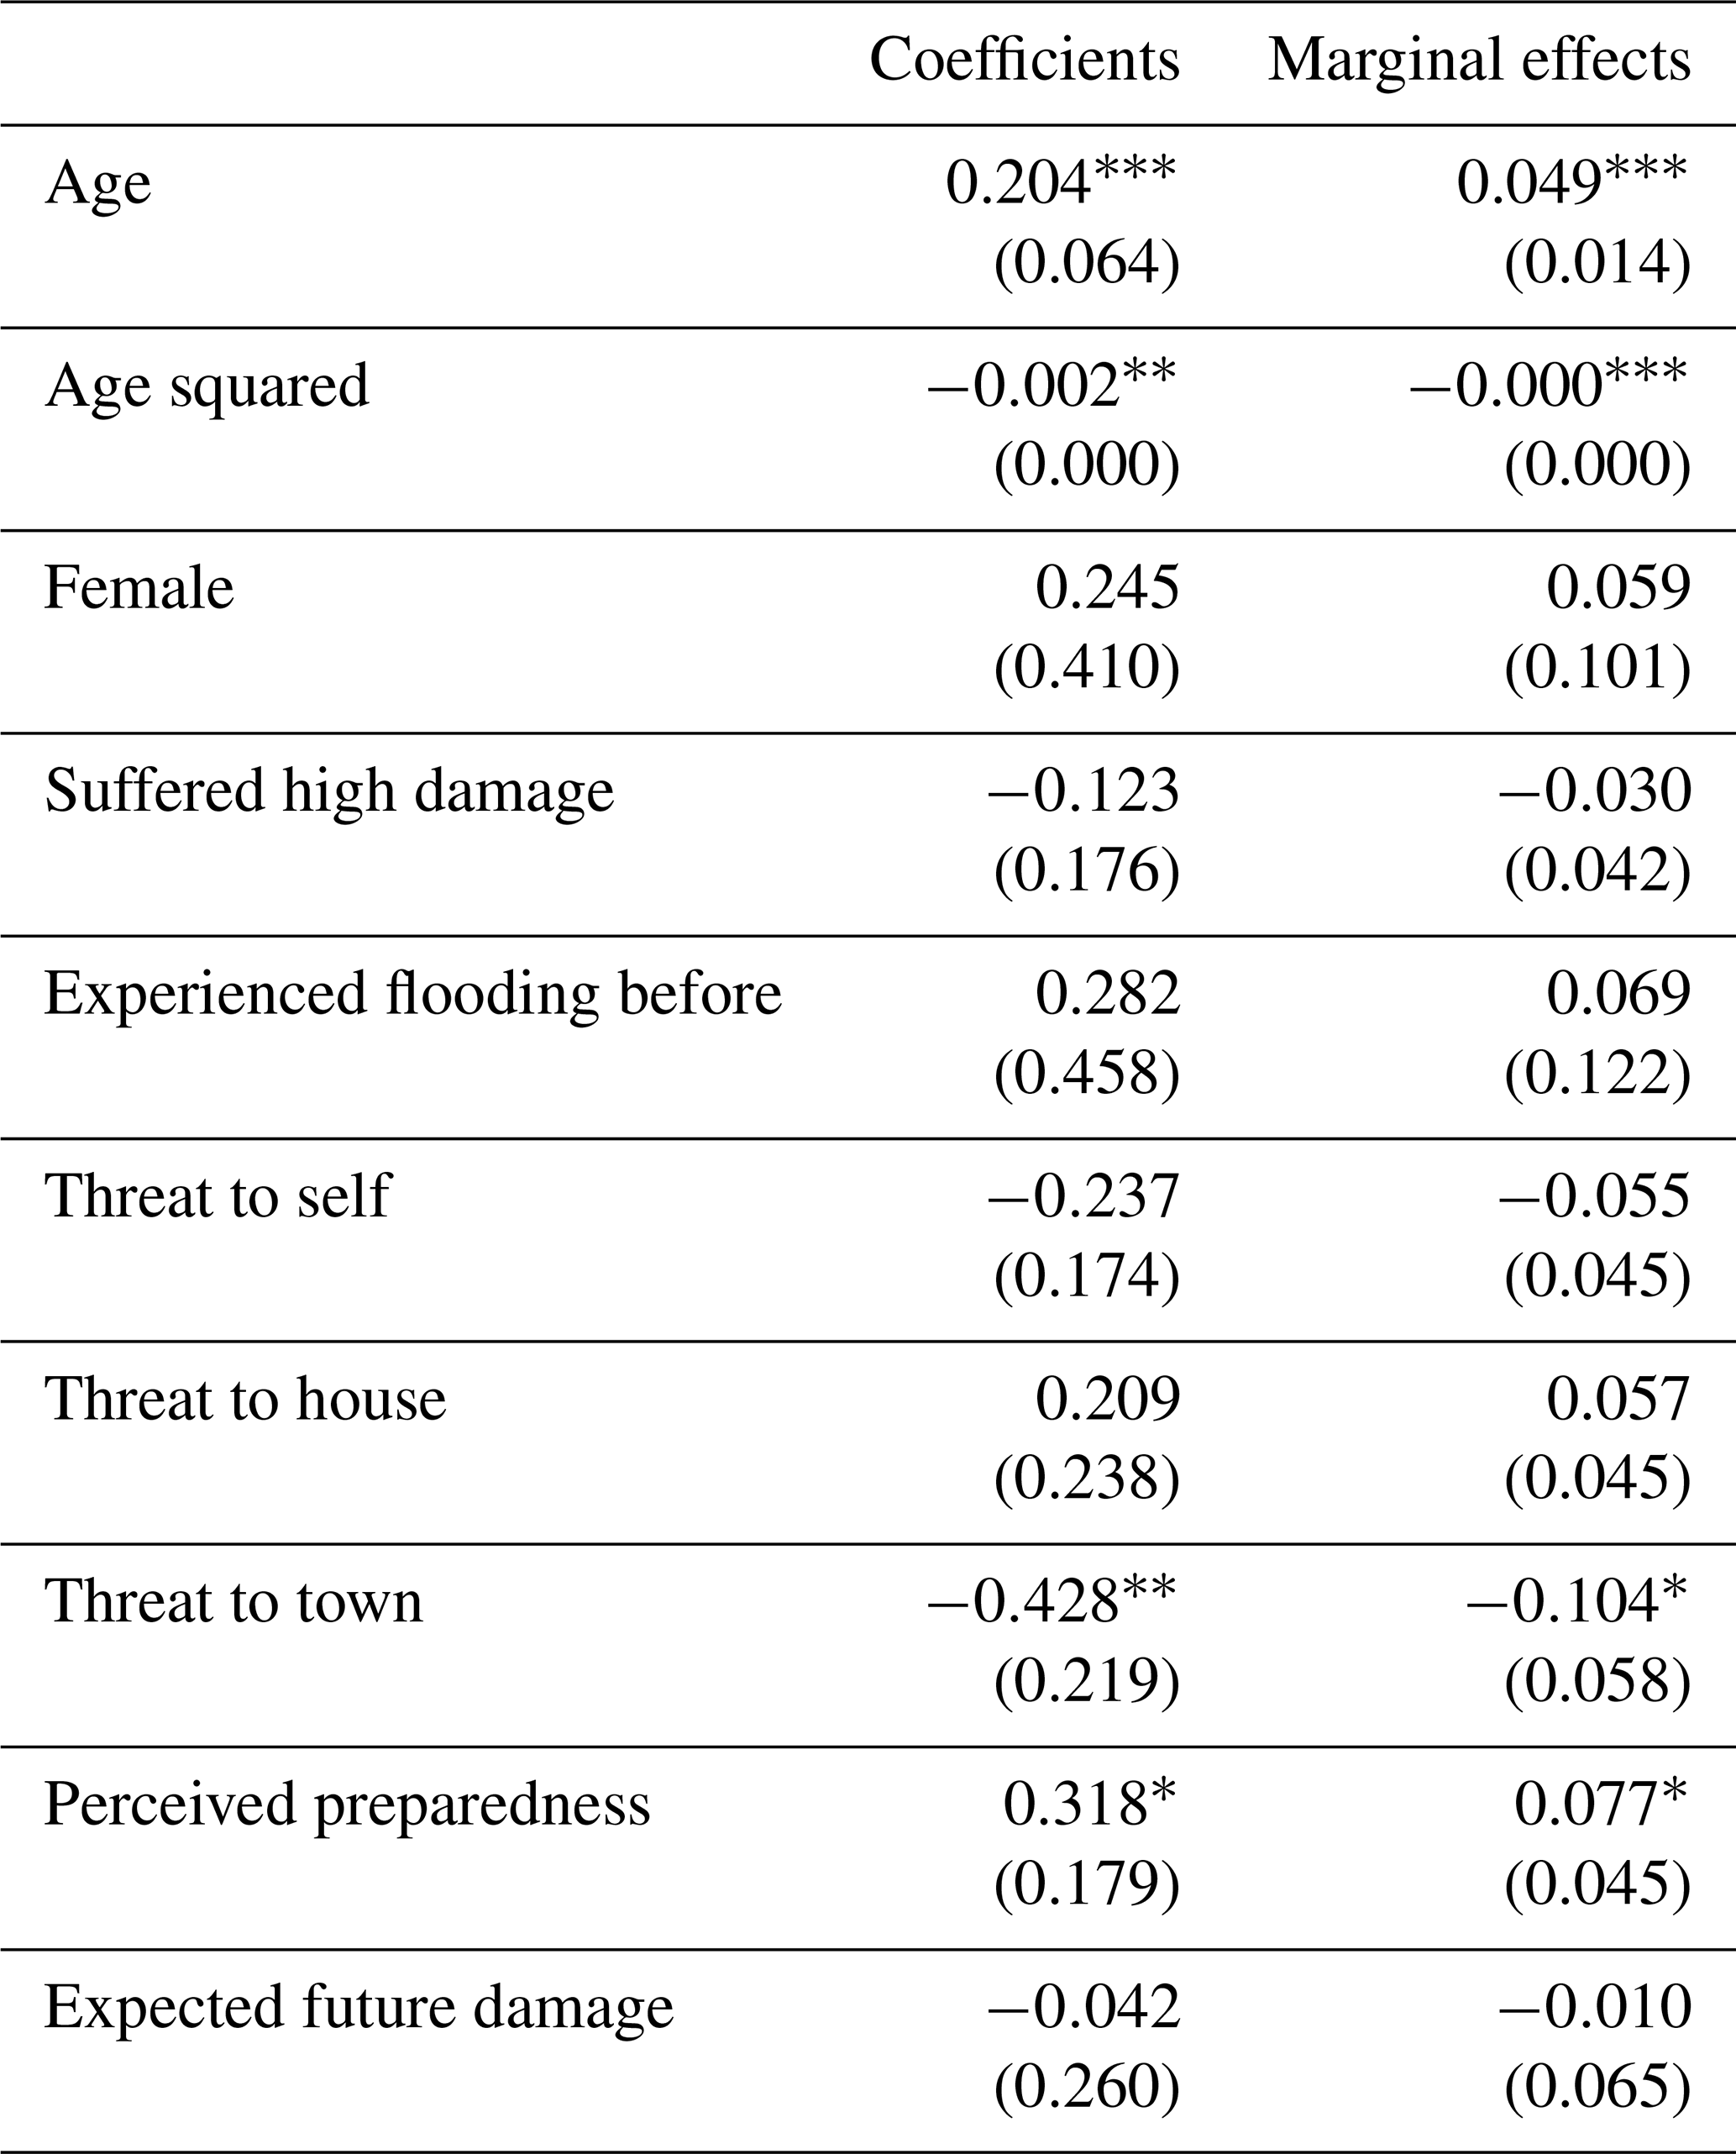
N=146. Robust standard errors in brackets. p<0.01. p<0.05. * p<0.1.
In order to correct for the potential bias due to attrition, we conducted an inverse probability of attrition weighting (IPAW; Hernán and Robins, 2020). This procedure assigns weights to respondents depending on their probability of moving to the next survey round on the basis of the main variables of interest (those shown in Table 4). Respondents who share similar characteristics with those who dropped out after the first survey round are assigned a heavier weight, thus compensating for the loss of respondents. The weights are assigned only to respondents in round 2 as respondents in round 1 all have the same weight.
3.5 Limitations
Limitations of this study are mainly related to sample size and data collection. Due to attrition rate, the sample size of the panel study in round 2 is rather small. While surveying residents face-to-face is a way of establishing trust, and it is essential (considering data privacy regulations) for targeting households on the basis of hazard assessment and risk exposure, it is highly resource- and time-consuming. One way to minimise these issues is to conduct computer-assisted telephone interviews (CATIs) or online surveys repeated over time. Among other things, this can help to reduce attrition and retention bias by starting off with much larger sample sizes and to collect reliable data about temporal dynamics of risk awareness and preparedness.
A comparison of the panel analysis with and without IPAWs showed that the differences in results were negligible. Hence, the following section reports the results following the analysis without IPAWs to reduce post hoc data manipulation to the minimum. The analysis conducted using IPAWs is reported in Table S1 in the Supplement.
Figure 1 shows the different effect of time on the variables of interest, as resulted from the CLMs and CLMMs. The RCS approach shows that the general feeling of safety about living in the area decreased but only for women (odd ratio, OR=0.61, confidence interval90 %, CI90 %=0.38–0.99). The panel approach shows no change over time. Respondents feel safe living in the area, with 72 % of them replying with 4 or above on a scale from 1 to 5 (1 being minimum and 5 being maximum) in round 1, 67 % in round 2 – RCS, and 76 % in round 2 – panel.
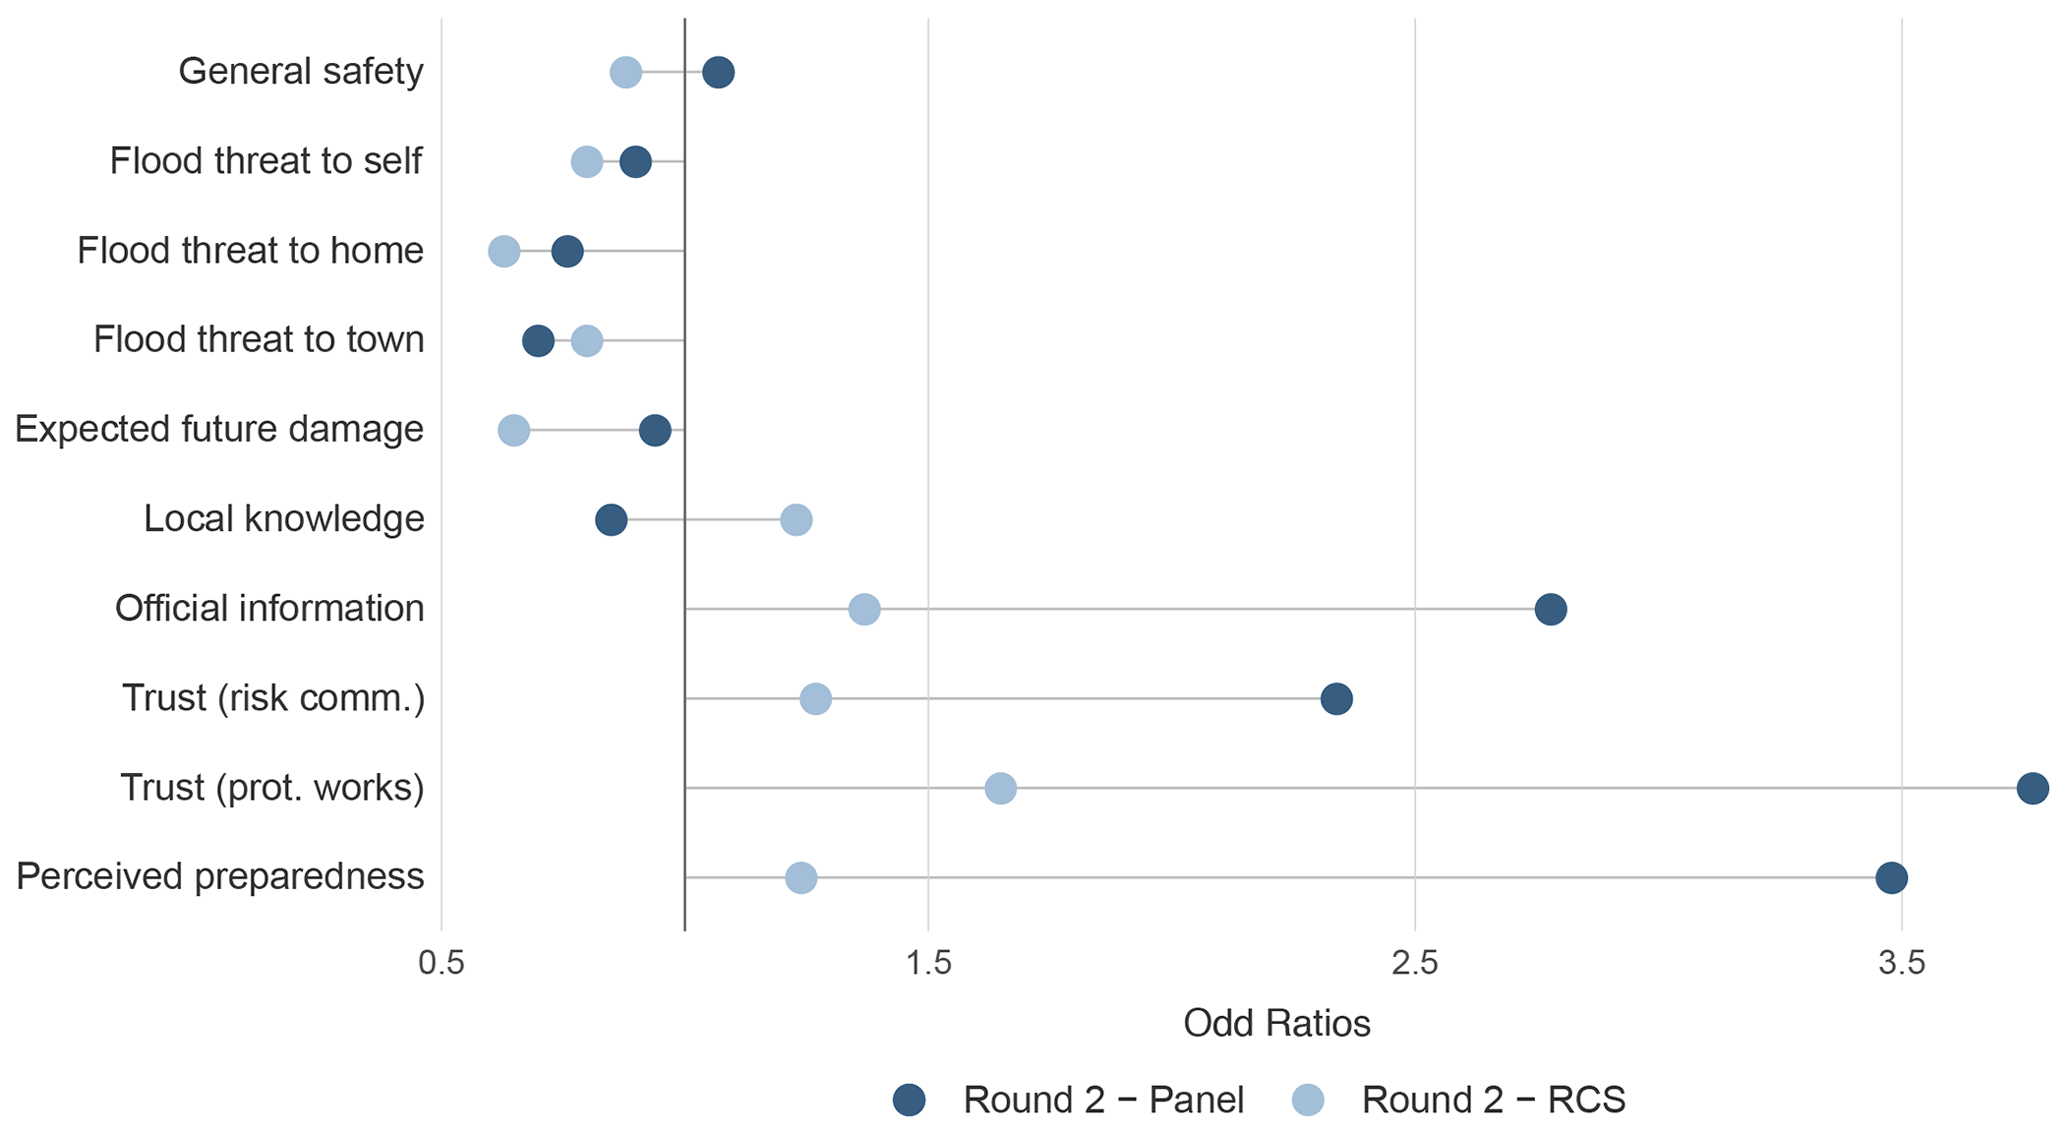
Figure 1Comparison of results from the two approaches on the effect of time on the variables of interest.
4.1 Perceived threat posed by floods
The perceived threat posed by floods to oneself, one's home, and the town as a whole shows inconsistent changes over time across the two approaches. When it comes to the perceived threat posed by floods to oneself, both approaches show no change over time. However, when breaking down the sample, the RCS shows that it actually significantly increased for those respondents who suffered high damage during the 2018 flood (OR=5.23, CI90 %=1.99–13.9), but it decreased for those who did not suffer any damage (OR=0.46; CI90 %=0.27–0.77). This difference was not found in the panel study. As for the perceived threat to the home, in round 2 – RCS fewer women are concerned compared to round 1 (OR=0.61, CI90 %=0.38–0.99), while the panel approach shows no change over time. The threat to the town as a whole did not seem to change over the entire sample in both approaches, but when breaking down the sample, the panel shows that it actually decreased for women (OR=0.50, CI90 %=0.27–0.93). The panel also shows that women were more concerned than men in round 1 (OR=2.61, CI90 %=1.57–4.38), but this difference is lost in round 2 due to the decrease in perceived threat for women. Respondents with a higher income are also less concerned for themselves in both years (RCS: OR=0.69, CI90 %=0.55–0.86; panel: OR=0.62, CI90 %=0.45–0.84). Age was not found to affect any of the threat variables in either the RCS or in the panel approach. Education was found to play a role only in the RCS dataset, with more educated respondents showing a lower perceived threat to themselves and the town (self: OR=0.22, CI90 %=0.65–0.73; town: OR=0.17, CI90 %=0.03–0.65).
Concerning the expected future damage caused by floods, results are inconsistent too. The RCS approach shows a decrease over time (RCS: OR=0.65, CI90 %=0.46–0.91), while the panel does not show any change. In both rounds, respondents who experienced some sort of damage during the 2018 flood were more likely to report higher expected future damage compared to those who did not experience any damage (panel: OR=10.30, CI90 %=5.53–19.21; RCS: OR=4.86, CI90 %=2.94–8.11).
4.2 Knowledge and trust
Results about changes in knowledge are somewhat inconsistent across the two approaches. In round 2, the RCS shows that more male respondents feel like local knowledge (i.e. knowledge and information coming from relatives or friends) contributed to their knowledge of floods compared to round 1 (OR=1.86, CI90 %=1.11–3.14), while the panel approach shows no difference over time. When it comes to knowledge deriving from official information, the RCS shows that it did not change over time, and this could be due to the fact that only a small fraction of respondents in the second round (9 %) took part in the informative events hosted by the municipality. A possible explanation of such a low turnout is that the respondents in the second round had not been interviewed the year before and thus may have been less aware of the municipality's activities in relation to the flood event. On the other hand, the panel approach shows that respondents' knowledge of floods thanks to information received from official sources increased in the second round (OR=2.78, CI90 %=1.73–4.46). This may explain the lack of changes in perceived threat posed by floods in the panel dataset, and two factors support this hypothesis. First, respondents who participated in the informative events organised by the local administration (24 %) are more likely to report higher levels of knowledge because of having received official information (OR=9.18, CI90 %=3.93–22.44). Second, panel respondents in the second round tend to trust the local administration more. Panel respondents' trust in terms of the administration's risk communication is higher in the second round (OR=2.34, CI90 %=1.48–3.68). In particular, (a) respondents who suffered low damage and (b) older respondents show an increase in trust in the administration's risk communication (a: OR=3.54, CI90 %=1.22–10.23; b: OR=1.03, CI90 %=1.00–1.06). In the second round, panel respondents who participated in the informative events organised by the local administration show a higher level of trust than those who did not (OR=3.02, CI90 %=1.37–6.83). No age differences were found in the panel dataset in terms of knowledge.
Contrary to knowledge, trust shows consistent trends over time across the two approaches. Panel respondents' trust in the local administration concerning flood protection also increased (OR=3.77, CI90 %=2.27–6.26). It increased especially for those who suffered low damage during the 2018 flood (OR=5.94, CI90 %=2.73–12.94) and more in women compared to men (OR=3.12, CI90 %=1.15–8.48). However, because in the first round they had a lower level of trust than men in the local administration concerning flood protection (OR=0.58, CI90 %=0.35–0.96), we can say that it now is almost equally high for men and women. Similarly to the panel, the RCS approach also shows that the trust of women and respondents who suffered low damage in the local administration when it comes to flood protection increased compared to round 1 (women: OR=1.81, CI90 %=1.12–2.92; low damage: OR=2.00, CI90 %=1.13–3.58). RCS respondents' trust in the local administration's risk communication does not seem to change over time, but if we break the sample down according to damage suffered during the 2018 flood, we notice that it actually increased but only for those who suffered low damage (OR=1.81, CI90 %=1.04–3.15). RCS respondents who experienced high damage during the 2018 flood (4 or 5 on a scale from 1 to 5 (1 being minimum and 5 being maximum)) were more likely to participate in the informative events (OR=8.38, CI90 %=2.50–32.28). They were also more likely to report a higher perceived threat to their house in both years (OR=23.02, CI90 %=10.30–55.27), which may indicate why they participated in the informative events.
4.3 Perceived preparedness
At a first glance, changes in perceived preparedness seem to be inconsistent across the two different longitudinal approaches. In the RCS, no changes in perceived preparedness were detected over time, while the panel results show a general increase in perceived preparedness (OR=3.48, CI90 %=2.09–5.80). However, if time and amount of damage suffered in the 2018 flood interact in the ordinal logistic regression, we see that in the RCS perceived preparedness actually increased only for those who experienced low damage (OR=2.50, CI90 %=1.40–4.54) and in the panel for those who experienced no and low damage (no damage: OR=2.64, CI90 %=1.23–5.67; low damage: OR=5.73, CI90 %=2.42–13.61). This common result brings further evidence to the fact that experiencing a flood with a low impact may promote a (sometimes false) sense of preparedness in the individual. We then tested whether the panel respondents who experienced no or low damage were overrepresented in the group of respondents who adopted structural protection measures or an insurance as this could partly explain why they now feel more prepared (see Fig. 3). Given the categorical nature of the two variables, we ran Chi-squared tests to check for statistically significant differences between groups. Respondents who experienced high damage replied differently when asked about the adoption of structural protection measures compared to those who did not experience damage (X2=20.95, p<0.001) and to those who experienced low damage (X2=9.60, p<0.01); i.e. significantly more of them adopted protection measures after the event compared to the other two groups. Similarly, respondents who experienced high damage replied differently when asked about the stipulation of an insurance compared to those who did not experience damage (X2=11.33, p<0.01); i.e. significantly more of them adopted an insurance after the event. Panel respondents who adopted private structural protection measures before or after the event report a higher individual preparedness than those who did not (panel: OR=0.32, CI90 %=0.15–0.64; RCS: OR=0.25, CI90 %=0.14–0.43), but no such effect was found for those who stipulated an insurance. To further explore changes in awareness from round 1 to round 2, we analysed respondents' knowledge and attitudes towards the structural protection works undertaken by the municipality.
The panel results show that the majority of respondents (60 %) know about their existence, while this is true for only close to half of the respondents in the RCS (48 %). In both, the majority found out about them on their own, e.g. driving by on their way to work (49 % in the panel and 74 % in the RCS). In the panel, an additional 29 % found out through the local administration, while this was true for only 8 % in the RCS. This difference may be due to the low participation rate in informative events of respondents in the RCS. Despite this, both RCS and panel respondents in round 2 show a positive attitude towards public structural flood protection, as shown in Fig. 2. This may additionally explain why respondents' risk awareness did not change significantly compared to the first round.
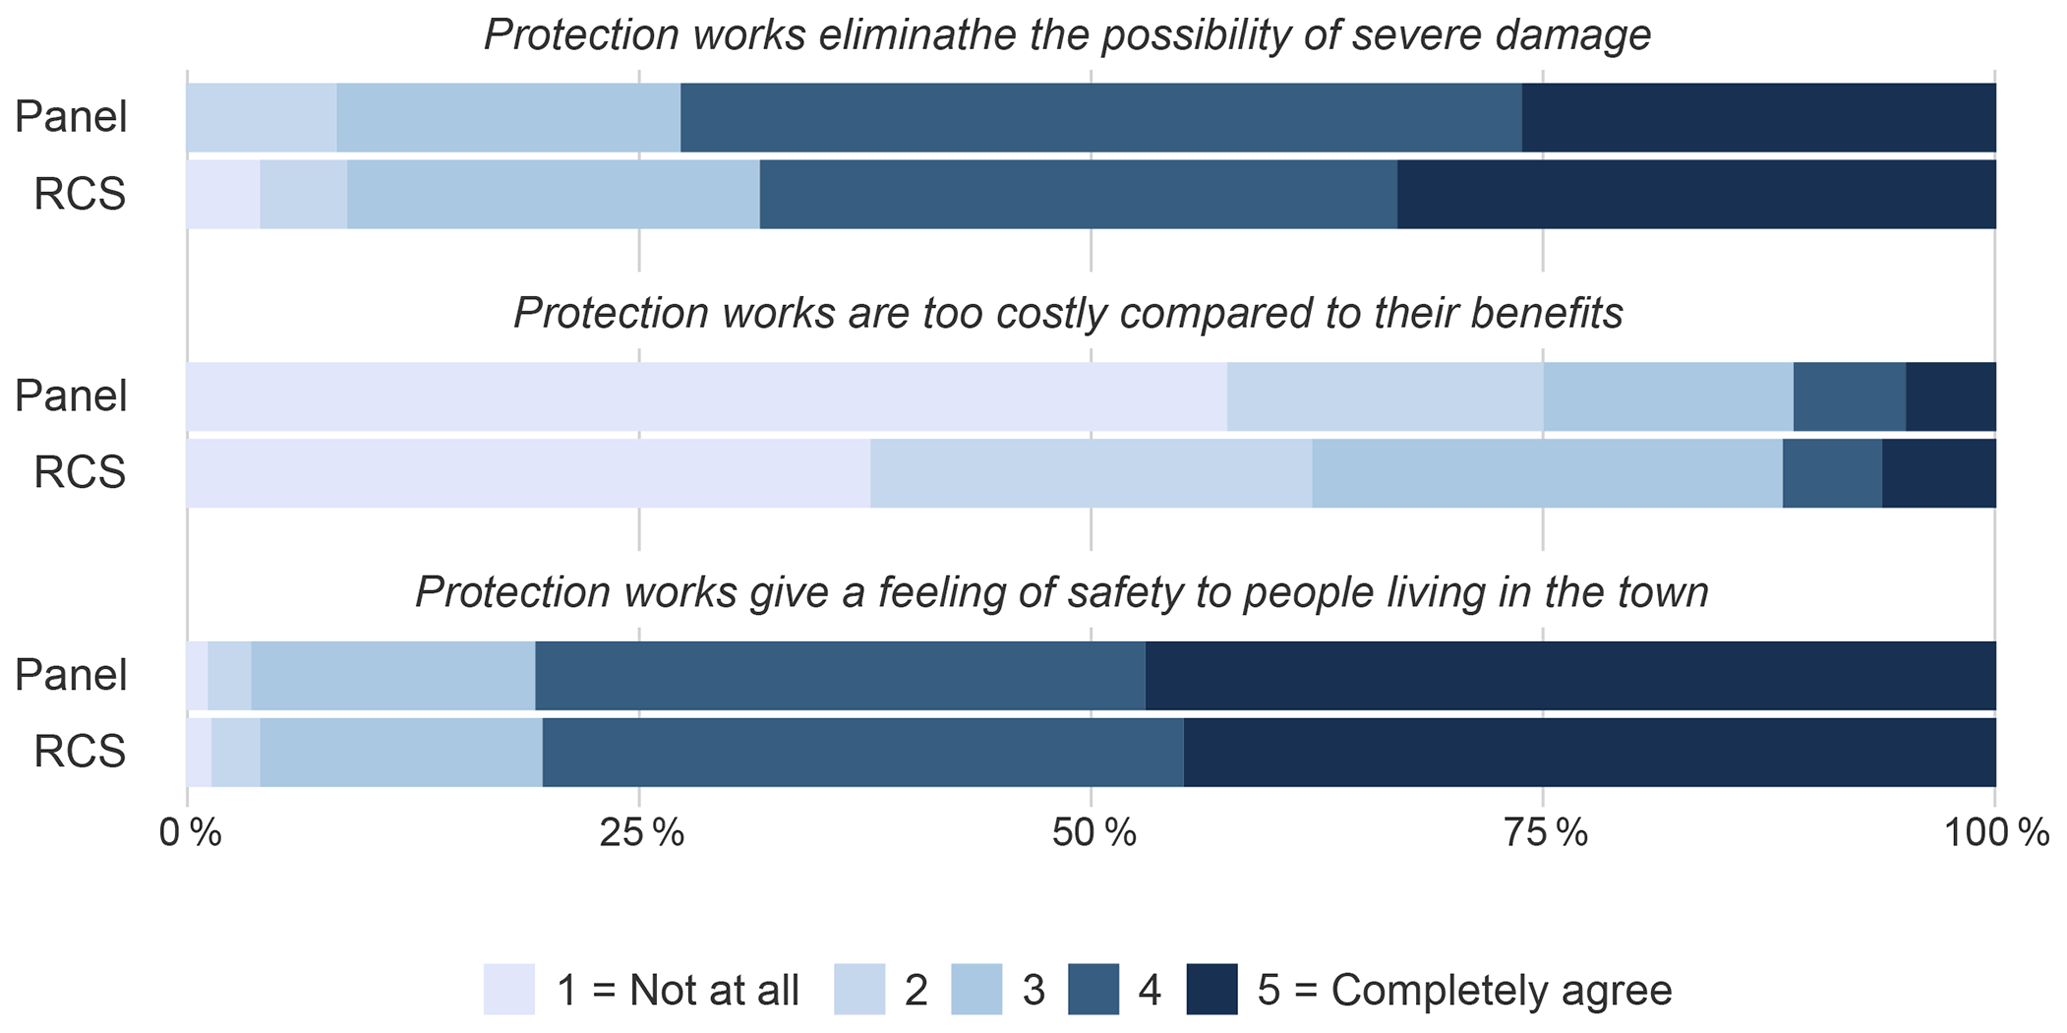
Figure 2Survey results from the second round on public structural flood protection undertaken by the municipality.
4.4 Self-assessing changes in risk awareness and perceived preparedness
In the second round, respondents were asked to self-assess how their risk awareness changed compared to the year before. In the panel dataset, half of respondents indicated an increase (49 %), and the other half indicated no change (48 %), while only 3 % indicated a decrease. However, the self-assessment does not always match with the actual registered change in the answer given (see Fig. 3). This often sharp contrast may be due to the respondents not remembering their answer in the first round and potentially interpreting the scale differently in the second round. However, with no evidence in this regard, it is nearly impossible to determine the exact reason. Concerning the self-assessed change in perceived preparedness, in the panel 51 % of respondents report an increase, 3 % report a decrease, and 46 % report no changes. This is the variable with the smaller gap between actual and self-assessed change, and it may be due to the ease with which one can assess their own preparedness compared to a more abstract concept such as awareness.
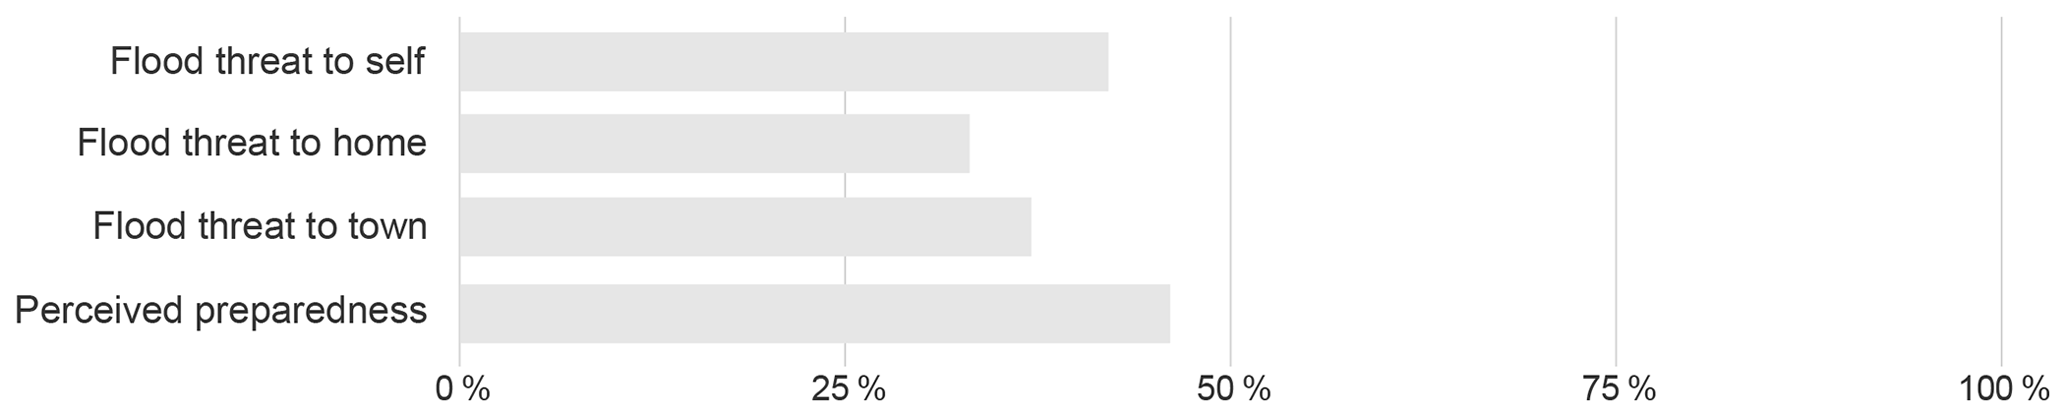
Figure 3Percentage of panel respondents for whom the perceived change matches the actual change.
In the RCS, the majority (66 %) indicate an increase in their risk awareness, 33 % indicate no change, and only 1 % indicate a decrease. As for perceived preparedness, the majority (59 %) indicate no change, 37 % think their preparedness increased, and 4 % think it decreased. However, the respondents in the two rounds being different, it is not possible here to confront this result with any actual change in responses concerning risk awareness or perceived preparedness.
In the previous sections, we present two methods to collect longitudinal data, i.e. with an RCS approach and with a panel approach, and the respective results. Here we argue that consistent results about the change (or lack thereof) in risk awareness and perceived preparedness provide robust data to be employed in human–water system modelling as well as in policy decision support.
5.1 Temporal dynamics comparison
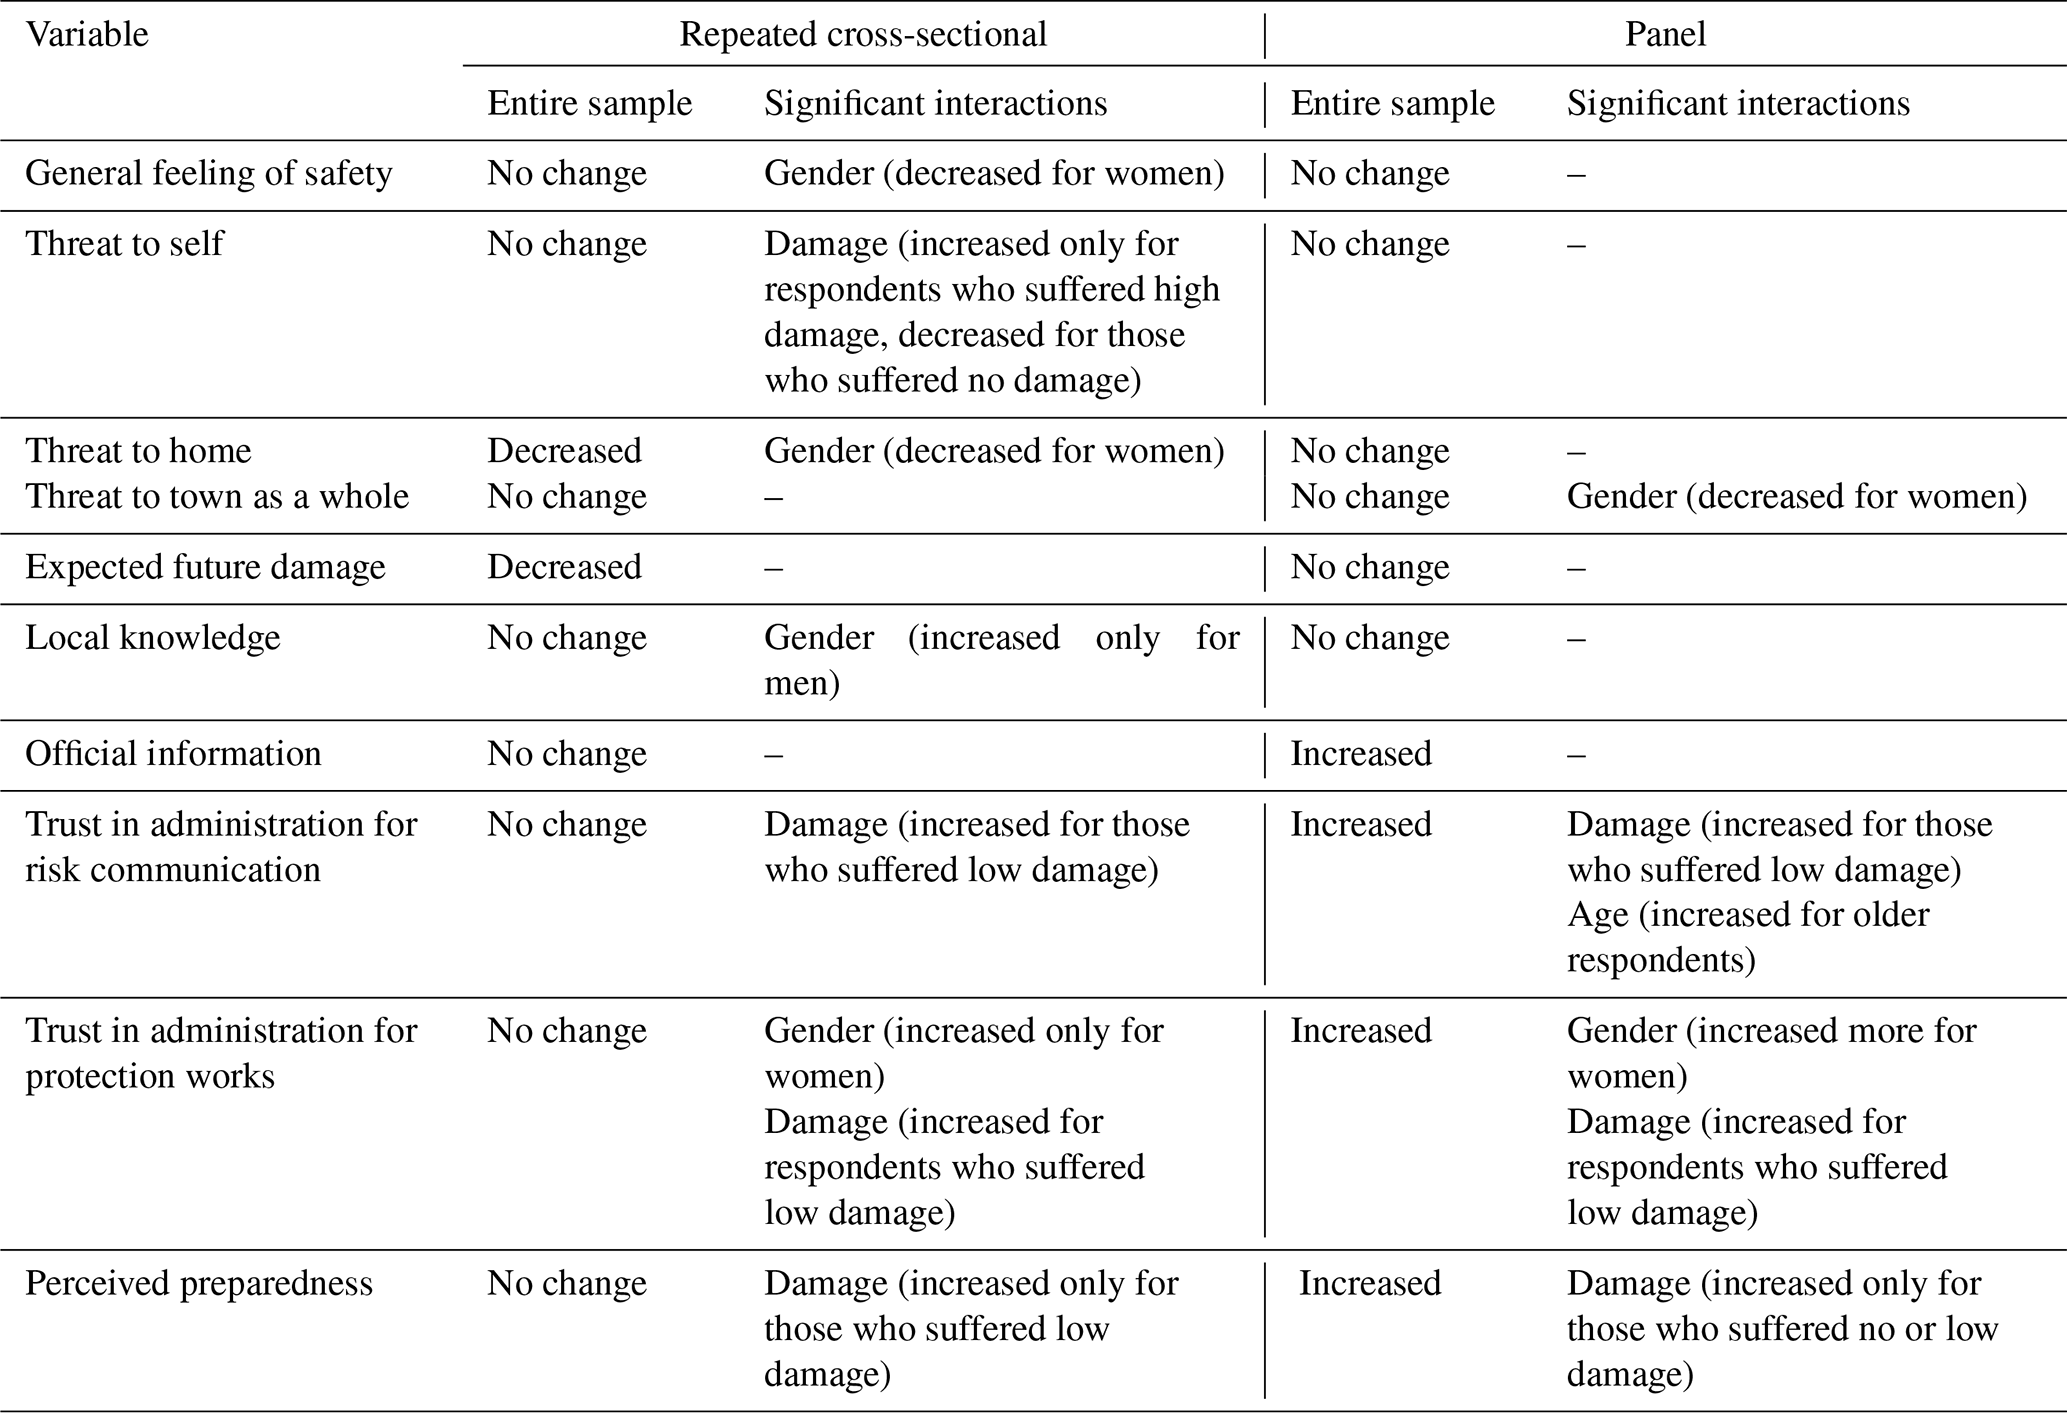
Table 5 shows a summarised comparison of the two methods in terms of results. It is particularly relevant that both approaches show that, in the first survey round, women are more concerned than men when it comes to perceived threat to oneself and the town. This is in line with previous studies on risk awareness and risk perception, where women were found in general to be more concerned than men not only when it comes to floods (Cvetković et al., 2018) but also for other hazards (see e.g. Cordellieri et al., 2016; Galasso et al., 2020; Kim et al., 2018), here too, confirming the presence of a white male effect (Finucane et al., 2010). Results on the expected future damage are not consistent across the two methods, but the panel approach provides useful insights into the matter. While in the first round there were statistically significant differences between those who experienced damage and those who did not in how they perceived potential future damage, these differences disappeared in the second round. This shows that risk awareness might change differently depending on damage suffered. When it comes to knowledge, results are not consistent across the two methods either. However, concerning trust, both approaches show that, in the second round, women seem to trust the local administration more compared to the first round, and the same is valid for respondents who suffered low damage. When it comes to perceived preparedness, a first general glance at the two samples shows inconsistent results across the two methods. However, if we break down the respondents according to the severity of damage suffered, both approaches show that the perceived preparedness of respondents who experienced low damage in 2018 increased in the second round.
Table 5Summary of the main results. The column “Entire sample” shows the results from the linear regressions without interactions. The column “Significant interactions” shows the results from the linear regressions with interaction terms (gender or damage suffered).
In general, risk awareness does not show significant changes over time, and this result is rather consistent across the two methods. However, when breaking down the sample to account for differences in terms of, for example, gender or damage suffered, we see that certain variables evolve differently for different groups of individuals. For instance, women tend to have a higher perceived threat compared to men few months after the event in round 1, but then their threat perception decreases over time, while men remain rather stable. Decreasing awareness in women is associated with their increasing trust in the local administration and flood protection works. This was previously hypothesised by Viglione et al. (2014). In general, the lack of changes in risk awareness can be explained by three aspects: (a) the majority of respondents in the panel dataset participated in informative events organised by the municipality, (b) respondents in both the panel and the RCS dataset show positive attitudes towards the public structural flood protection undertaken by the municipality, and (c) relatively short time elapsed between the two survey rounds (i.e. 12 months).
The first point, besides shedding light on why risk awareness did not change, brings evidence in favour of effective risk communication strategies and community engagement, as was previously shown by Bodoque et al. (2019). They too found that respondents who were exposed to risk communication activities maintained a rather stable level of risk awareness. An effective risk communication strategy may provide a realistic view of the risk, where the awareness does not decrease because the person is kept aware of the potential threat in terms of magnitude and likelihood, and it does not increase because the person is provided with tools to deal with it in the future.
The second point touches upon the feeling of safety derived from the presence of public structural flood protection. This theme has been widely discussed in the literature (Burby, 2006; De Marchi and Scolobig, 2012; Di Baldassarre et al., 2018a; Ludy and Kondolf, 2012; Scolobig and De Marchi, 2009; Tobin, 1995; White, 1945) and is commonly referred to as the safe-development paradox (Kates et al., 2006). The presence of public structural flood protection may give the residents a false sense of security and often promotes urban development in areas at risk. In this instance, 73 % of respondents in the panel and 68 % in the RCS dataset either agree or strongly agree with the statement “public structural flood protection eliminates the possibility of severe damage”. Such a positive attitude towards the newly built public structural flood protection may further explain why in the panel study awareness did not decrease, but perceived preparedness increased.
The third and last point provides additional insights into the time factor when it comes to risk awareness decay. Previous studies adopting a longitudinal approach with longer time spans between survey rounds (e.g. Bubeck et al., 2020) could capture more changes in awareness than our study. Moreover, other research results suggest that the decay of flood risk awareness over time may range between a few years (Di Baldassarre et al., 2017) and a couple of generations (Fanta et al., 2019). These results are, however, based on proxy data. Di Baldassarre et al. (2017) used flood insurance coverage in California (Hanak et al., 2011), peaking after the 1997 Central Valley flooding, while Fanta et al. (2019) used archaeological information about human settlements in the Czech Republic and changes in their vertical distance from the river before and after major flood events.
Finally, our analysis shows a stable awareness and an increase in perceived preparedness (which can be interpreted as an increase in the PMT's coping appraisal) in respondents who experienced low damage during the 2018 flood, both in the panel and in the RCS. This result indirectly supports the risk perception paradox, described by Wachinger et al. (2013). The paradox, as briefly reported in the introduction, lies in the fact that people who experienced a flood event with negligible consequences tend to have a lower risk awareness than those who did not experience an event or experienced it with severe consequences and was previously reported in a number of other studies (Deeming, 2008; Green et al., 1991; Mileti and O'Brien, 1993; Wachinger and Renn, 2010). Here, while awareness did not decrease, perceived preparedness did increase, thus showing that the paradox concept is still valid.
5.2 Methodological comparison
The results from the two longitudinal approaches should be additionally discussed in light of the intrinsic differences between the two methods and their respective strengths and weaknesses. Six main areas are here identified as being worthy of attention when selecting a particular longitudinal technique: nature of the studied population, attrition rate, time between survey rounds, theory testing, statistical power, and time and cost effectiveness. While populations change to some extent everywhere, populations in certain areas are rather static, meaning that they change at a lower rate compared to other, more dynamic populations (Yee and Niemeier, 1996). For instance, the population composition of smaller, provincial areas tends to be more static than bigger urban conglomerates, which see a regular reshuffle of residents. In this sense, an RCS approach would be better fitted to explore changes in areas where the population is more dynamic as the independent samples created in each survey round would be an updated version of the current population composition. When adopting a panel approach, in contrast, the study is stuck with the same initial sample. This may not be an issue for static populations, but it can quickly turn into one for dynamic ones as it would lose representativeness. By including the individuals sampled initially only, the study may incur high attrition rates, resulting in the attrition bias and retention bias previously discussed. Thus, an RCS approach – which does not have attrition issues – may also be more appropriate when a lot of time passes between survey rounds as the risk of people dropping out is higher over time (Hudson et al., 2020), while a panel approach has higher chances of performing better over shorter time spans. For instance, considering the results of the panel study presented here, we can assert that an optimal time frame for conducting panel studies to explore changes in flood risk awareness would be up to 1 year after the flood event for the first survey round and at least 2 years between consecutive survey rounds. In the absence of consequent flood events, this set-up allows for capturing changes over time by avoiding excessively zooming in or out. A similar time frame was also recently proposed by Seebauer and Babcicky (2020), who argue for at least 1.5 years between survey rounds. However, these are just indicative time frames, and the specific context of the study area should always be considered. If a risk communication strategy is implemented, or another event occurs, the time frame should be adjusted accordingly. An RCS approach may also be more reasonable when the initial sample is small as the loss of respondents that may happen with a panel approach may hinder the reliability of the analysis.
The selection of one longitudinal approach over the other depends on the purpose. For instance, if the aim of the study is to test a theory, choosing a panel approach is preferable in that it allows us to investigate the influence of individual characteristics on the variables of interest. An RCS approach does not allow for such an analysis and is instead more appropriate if the investigator is more interested in general trends or trends tied to demographic characteristics (such as age or gender). Indeed, the statistical power of the analyses that can be conducted with the two approaches also differs. Panel datasets allow for lower standard errors than RCS ones, hence their better suitability for theory testing, which often requires a more in-depth and refined analysis of the data.
Concretely, the choice to adopt a certain longitudinal approach is not exclusively based on which one is the best approach from a theoretical point of view, but it is also often constrained by available resources. In this sense, RCS is a more cost-effective alternative to a panel approach as there is no need for time and monetary resources to keep respondents in the panel and no need to take care of storing sensitive data (such as respondents' telephone numbers or addresses) as they will not be needed in the following survey rounds.
The arguments presented above have implications in terms of transferability of results as well as their use and integration into human–water system models. Results from RCS studies are more likely to be transferable to other areas with similar socio-economic, socio-cultural, and demographic contexts as they are not relating to specific individuals. This makes RCS results better suited for models aimed at generalising human–water system dynamics. Panel studies, in contrast, limited to specific respondents are generally less transferable as certain emerging dynamics could be specific for those individuals. However, the resulting datasets are much better suited for testing theories (e.g. PMT) where there are hypothesised connections between variables relating to a single individual. If, however, both an RCS and a panel study are conducted in the same area, as presented in this paper, converging results can be used to develop ad hoc models (i.e. models developed for a specific area) that can support risk communication strategies, for instance by showing how different risk attitudes would influence different risk scenarios. Longitudinal survey data such as those presented here can be used to evaluate the explanatory value of the model by comparing the model outcomes with the results of the survey, e.g. in terms of risk awareness.
Additionally, the longitudinal data presented in this study point us in the direction of improving the representation of socio-demographic heterogeneity in sociohydrological flood risk models. The longitudinal data presented here show that perceptions change differently over time not only in men and women but also depending on the severity of damage suffered in the past. Grouping individuals in sociohydrological models depending on certain characteristics, such as gender or previous experiences, constitutes a middle ground between a system dynamics (e.g. Liu et al., 2017; Viglione et al., 2014) and an agent-based modelling ABM approach (e.g. Haer et al., 2019; Michaelis et al., 2020). Indeed, it allows for embracing – at least partially – social diversity while not completely losing the lumped approach, which makes models generalisable and user-friendly. In fact, such a compromise would make sociohydrological models appealing for policymakers because it would point out macro-scale differences within the community, thus highlighting potential weak links of existing risk communication strategies. While in general an RCS approach provides data that can be employed in the classical system dynamics modelling using a lumped society, a panel approach yields valuable data to be employed in more case-specific modelling techniques, such as ABMs. However, if results from the two approaches are consistent, they can be employed for a more robust parameter estimation in both modelling techniques.
This study provides insights not only about attitudes and behavioural change over time but also about the use of these data for flood risk modelling. Our analysis shows a limited change in the case of short analytical time frames and in the absence of events. Risk awareness remained stable for men but tended to decrease for women. Perceived preparedness, on the other hand, only increased for those respondents who suffered low damage in the 2018 flood. In terms of methodological comparison, this study shows (a) the need to enhance the representation of social diversity and processes in modelling human–water systems in general and (b) that different types of longitudinal data should be used as model outcomes' benchmark depending on the model's purpose. Longitudinal panel data can also be used to test the effectiveness of behavioural theories, such as the PMT. This type of testing requires a higher statistical power, which is ensured by surveying the same individuals over time (i.e. following the individual's attitudes or behaviour). RCS data, on the other hand, perform better when the aim of the study is to investigate general trends, which is often the case when modelling human–water systems. These data only allow for studying changes on average over the entire sample (or at the most over smaller subsamples); thus they are less dependent on the single participant and are more transferable.
Because limitations of this study include a rather small sample size and the focus on only one flood type, future studies on the subject should aim for a bigger initial sample size (so as to reduce attrition rate) and potentially include different types of flood events. This way, it would also be possible to understand whether different flood types influence perceptions and behaviour differently. Longitudinal studies should be conducted and promoted to better understand changes in the long term as well as the impacts of flood occurrences. Moreover, multi-risk comparative longitudinal studies can provide robust evidence to support new theoretical developments.
The datasets supporting this research are stored open-access as .CSV files on Zenodo (https://doi.org/10.5281/zenodo.4286099; Mondino et al., 2021) together with the survey forms (the original, in Italian, and the English translation) and an .xlsx metadata file that provides additional information on all the variables in the datasets.
The supplement related to this article is available online at: https://doi.org/10.5194/nhess-21-2811-2021-supplement.
EM, AS, MB, and GdB conceptualised the study; GdB, EM, and MB acquired funding; EM collected the data; EM conducted the formal analysis; GdB and AS supervised; EM produced the figures; EM wrote the original draft; EM, AS, MB, and GdB reviewed and edited the final draft.
The authors declare that they have no conflict of interest.
Publisher's note: Copernicus Publications remains neutral with regard to jurisdictional claims in published maps and institutional affiliations.
The Liljewalchs Travel Scholarship and the CNDS Interdisciplinary Grant partly funded the 2020 field trip. Some survey questions have been developed in the FLOODsite, 2004–2008 project funded by the EC Sixth Framework Programme (http://www.floodsite.net, last access: 9 September 2021; contract no. GOCE-CT-2004-505420). At the time of the FLOODsite research project, Anna Scolobig was associated with the ISIG (Institute of International Sociology of Gorizia, Italy), one of the FLOODsite partners. We wish to deeply thank the – at the time of FLOODsite research – leader of the Mass Emergency Programme at the ISIG, Bruna De Marchi, for having considerably contributed to the survey design. The same is true for Giovanni Delli Zotti and Maura Del Zotto, two of the other ISIG team members. We also thank all the other colleagues who provided us with professional advice and collaboration and the interviewers who helped conduct the survey, Mattia Balestra, Giacomo Bernello, Giulia Bisoffi, Viviana Bort, Giovanna Caramuta, Fiorella Coco, Tania Di Mascia, Antonio Pica, Elena Poli, Luca Pressi, Federico Professione, and Niki Rigo. We also want to acknowledge the municipality of Negrar for their collaboration and for providing demographic data, especially Lorenzo Calabria, who considerably helped in bridging the interviewers with the residents. Finally, we want to acknowledge Elena Raffetti for her support and advice concerning the statistical analysis.
This research has been supported by the European Commission, Horizon 2020 Framework Programme (grant no. HydroSocialExtremes 771678).
This paper was edited by Margreth Keiler and reviewed by three anonymous referees.
Alderman, H., Behrman, J., Watkins, S., Kohler, H.-P., and Maluccio, J. A.: Attrition in Longitudinal Household Survey Data, Demogr. Res., 5, 79–124, https://doi.org/10.4054/demres.2001.5.4, 2001.
Aldrete, G. S.: Floods of the Tiber in Ancient Rome, The John Hopkins University Press, Baltimore, MD, 2007.
Amponsah, W., Ayral, P.-A., Boudevillain, B., Bouvier, C., Braud, I., Brunet, P., Delrieu, G., Didon-Lescot, J.-F., Gaume, E., Lebouc, L., Marchi, L., Marra, F., Morin, E., Nord, G., Payrastre, O., Zoccatelli, D., and Borga, M.: Integrated high-resolution dataset of high-intensity European and Mediterranean flash floods, Earth Syst. Sci. Data, 10, 1783–1794, https://doi.org/10.5194/essd-10-1783-2018, 2018.
Babcicky, P. and Seebauer, S.: The two faces of social capital in private flood mitigation: opposing effects on risk perception, self-efficacy and coping capacity, J. Risk Res., 20, 1017–1037, https://doi.org/10.1080/13669877.2016.1147489, 2017.
Barendrecht, M. H., Viglione, A., Kreibich, H., Merz, B., Vorogushyn, S., and Blöschl, G.: The Value of Empirical Data for Estimating the Parameters of a Sociohydrological Flood Risk Model, Water Resour. Res., 55, 1312–1336, https://doi.org/10.1029/2018WR024128, 2019.
Blair, P. and Buytaert, W.: Socio-hydrological modelling: a review asking “why, what and how?”, Hydrol. Earth Syst. Sci., 20, 443–478, https://doi.org/10.5194/hess-20-443-2016, 2016.
Bodoque, J. M., Díez-Herrero, A., Amerigo, M., García, J. A., and Olcina, J.: Enhancing flash flood risk perception and awareness of mitigation actions through risk communication: A pre-post survey design, J. Hydrol., 568, 769–779, https://doi.org/10.1016/j.jhydrol.2018.11.007, 2019.
Borga, M., Comiti, F., Ruin, I., and Marra, F.: Forensic analysis of flash flood response, WIREs Water, 6, 1–9, https://doi.org/10.1002/wat2.1338, 2019.
Bubeck, P., Berghäuser, L., Hudson, P., and Thieken, A. H.: Using Panel Data to Understand the Dynamics of Human Behavior in Response to Flooding, Risk Anal., 40, 2340–2359, https://doi.org/10.1111/risa.13548, 2020.
Burby, R. J.: Hurricane Katrina and the Paradoxes of Government Disaster Policy: Bringing About Wise Governmental Decisions for Hazardous Areas, Ann. Am. Acad. Polit. SS., 604, 171–191, https://doi.org/10.1177/0002716205284676, 2006.
Calvo, R., Arcaya, M., Baum, C. F., Lowe, S. R., and Waters, M. C.: Happily Ever After? Pre-and-Post Disaster Determinants of Happiness Among Survivors of Hurricane Katrina, J. Happiness Stud., 16, 427–442, https://doi.org/10.1007/s10902-014-9516-5, 2015.
Checkland, P.: Soft Systems Methodology: A Thirty Year Retrospective, Syst. Res. Behav. Sci., 17, 11–58, https://doi.org/10.2307/254200, 2000.
Checkland, P. and Poulter, J.: Learning For Action: A Short Definitive Account of Soft Systems Methodology, and its use for Practitioners, Teachers and Students, John Wiley and Sons Ltd., Chichester, 2006.
Christensen, R. H. B. C.: ordinal: Regression Models for Ordinal Data. R package version 2019.12-10, available at: https://cran.r-project.org/package=ordinal (last access: 9 September 2021), 2019.
Cordellieri, P., Baralla, F., Ferlazzo, F., Sgalla, R., Piccardi, L., and Giannini, A. M.: Gender Effects in Young Road Users on Road Safety Attitudes, Behaviors and Risk Perception, Front. Psychol., 7, 1412, https://doi.org/10.3389/fpsyg.2016.01412, 2016.
Cvetković, V., Roder, G., Öcal, A., Tarolli, P., and Dragićević, S.: The Role of Gender in Preparedness and Response Behaviors towards Flood Risk in Serbia, Int. J. Env. Res. Pub. He., 15, 2761, https://doi.org/10.3390/ijerph15122761, 2018.
De Marchi, B.: Societal Vulnerability and Resilience in the COVID-19 Crisis, Cult. e Stud. Del Soc., 5, 163–174, 2020.
De Marchi, B. and Scolobig, A.: The views of experts and residents on social vulnerability to flash floods in an Alpine region of Italy, Disasters, 36, 316–337, https://doi.org/10.1111/j.1467-7717.2011.01252.x, 2012.
Deeming, H.: Increasing resilience to storm surge flooding: Risks, social networks and local champions, in: Flood Risk Management: Research and Practice, edited by: Samuels, P., Huntington, S., Allsop, W., and Harrop, J., CRC Press, London, 945–955, 2008.
Di Baldassarre, G., Viglione, A., Carr, G., Kuil, L., Salinas, J. L., and Blöschl, G.: Socio-hydrology: conceptualising human-flood interactions, Hydrol. Earth Syst. Sci., 17, 3295–3303, https://doi.org/10.5194/hess-17-3295-2013, 2013.
Di Baldassarre, G., Brandimarte, L., and Beven, K.: The seventh facet of uncertainty: Wrong assumptions, unknowns and surprises in the dynamics of human–water systems, Hydrol. Sci. J., 61, 1748–1758, https://doi.org/10.1080/02626667.2015.1091460, 2016.
Di Baldassarre, G., Martinez, F., Kalantari, Z., and Viglione, A.: Drought and flood in the Anthropocene: feedback mechanisms in reservoir operation, Earth Syst. Dynam., 8, 225–233, https://doi.org/10.5194/esd-8-225-2017, 2017.
Di Baldassarre, G., Kreibich, H., Vorogushyn, S., Aerts, J., Arnbjerg-Nielsen, K., Barendrecht, M., Bates, P., Borga, M., Botzen, W., Bubeck, P., De Marchi, B., Llasat, C., Mazzoleni, M., Molinari, D., Mondino, E., Mård, J., Petrucci, O., Scolobig, A., Viglione, A., and Ward, P. J.: Hess Opinions: An interdisciplinary research agenda to explore the unintended consequences of structural flood protection, Hydrol. Earth Syst. Sci., 22, 5629–5637, https://doi.org/10.5194/hess-22-5629-2018, 2018a.
Di Baldassarre, G., Nohrstedt, D., Mård, J., Burchardt, S., Albin, C., Bondesson, S., Breinl, K., Deegan, F. M., Fuentes, D., Lopez, M. G., Granberg, M., Nyberg, L., Nyman, M. R., Rhodes, E., Troll, V., Young, S., Walch, C., and Parker, C. F.: An Integrative Research Framework to Unravel the Interplay of Natural Hazards and Vulnerabilities, Earth's Futur., 6, 305–310, https://doi.org/10.1002/2017EF000764, 2018b.
Di Baldassarre, G., Sivapalan, M., Rusca, M., Cudennec, C., Garcia, M., Kreibich, H., Konar, M., Mondino, E., Mård, J., Pande, S., Sanderson, M. R., Tian, F., Viglione, A., Wei, J., Wei, Y., Yu, D. J., Srinivasan, V., and Blöschl, G.: Sociohydrology: Scientific Challenges in Addressing the Sustainable Development Goals, Water Resour. Res., 55, 6327–6355, https://doi.org/10.1029/2018WR023901, 2019.
Eurostat: Labour Force Survey, available at: https://ec.europa.eu/eurostat/web/microdata/labour-force-survey, last access: 12 November 2020.
Fanta, V., Šálek, M., and Sklenicka, P.: How long do floods throughout the millennium remain in the collective memory?, Nat. Commun., 10, 1–9, https://doi.org/10.1038/s41467-019-09102-3, 2019.
Fay-Ramirez, S., Antrobus, E., and Piquero, A. R.: Assessing the effect of the Queensland “Summer of Disasters” on perceptions of collective efficacy, Soc. Sci. Res., 54, 21–35, https://doi.org/10.1016/j.ssresearch.2015.06.017, 2015.
Fielding, J. L.: Inequalities in exposure and awareness of flood risk in England and Wales, Disasters, 36, 477–494, 2012.
Finucane, M. L., Slovic, P., Mertz, C. K., Flynn, J., and Satterfield, T. A.: Gender, race, and perceived risk: The “white male” effect, Health Risk Soc., 2, 159–172, https://doi.org/10.1080/713670162, 2010.
Folke, C., Hahn, T., Olsson, P., and Norberg, J.: Adaptive Governance of Social-Ecological Systems, Annu. Rev. Env. Resour., 30, 441–473, https://doi.org/10.1146/annurev.energy.30.050504.144511, 2005.
FORS: Swiss Household Panel | FORS, available at: https://forscenter.ch/projects/swiss-household-panel/ (last access: 12 November 2020), n.d.
Fothergill, A.: The Stigma of Charity: Gender, Class, and Disaster Assistance, Sociol. Quart., 44, 659–680, https://doi.org/10.1111/j.1533-8525.2003.tb00530.x, 2003.
Galasso, V., Pons, V., Profeta, P., Becher, M., Brouard, S., and Foucault, M.: Gender differences in COVID-19 attitudes and behavior: Panel evidence from eight countries, P. Natl. Acad. Sci. USA, https://doi.org/10.1073/pnas.2012520117, 2020.
Ginexi, E. M., Weihs, K., Simmens, S. J., and Hoyt, D. R.: Natural disaster and depression: A prospective investigation of reactions to the 1993 Midwest Floods, Am. J. Commun. Psychol., 28, 495–518, https://doi.org/10.1023/A:1005188515149, 2000.
Green, C. H., Tunstall, S. M., and Fordham, M. H.: The risks from flooding: Which risks and whose perception?, Disasters, 15, 227–236, 1991.
Grothmann, T. and Reusswig, F.: People at risk of flooding: Why some residents take precautionary action while others do not, Nat. Hazards, 38, 101–120, https://doi.org/10.1007/s11069-005-8604-6, 2006.
Haer, T., Botzen, W. J. W., and Aerts, J. C. J. H.: Advancing disaster policies by integrating dynamic adaptive behaviour in risk assessments using an agent-based modelling approach, Environ. Res. Lett., 14, 1–9, https://doi.org/10.1088/1748-9326/ab0770, 2019.
Hanak, E., Lund, J., Dinar, A., Gray, B., Howitt, R., Mount, J., Moyle, P., and Thompson, B.: Managing California's Water: From Conflict to Reconciliation – Ellen Hanak – Google Books, Public Policy Institute of California, available at: https://books.google.se/books?hl=en&lr=&id=90hLp8aGrgIC&oi=fnd&pg=PR10&dq=Hanak+et+al.,+2011&ots=IHUGWNGP9R&sig=70cbgHX3bi8hiB7UETDgTaJHwgM&redir_esc=y#v=onepage&q = Hanak et al.%2C 2011&f = false (last access: 9 September 2021), 2011.
Hernán, M. A. and Robins, J. M. Causal Inference: What If, available at: https://www.hsph.harvard.edu/miguel-hernan/causal-inference-book/ (last access: 9 September 2021), 2020.
Hoffmann, S., Feldmann, U., Bach, P. M., Binz, C., Farrelly, M., Frantzeskaki, N., Hiessl, H., Inauen, J., Larsen, T. A., Lienert, J., Londong, J., Lüthi, C., Maurer, M., Mitchell, C., Morgenroth, E., Nelson, K. L., Scholten, L., Truffer, B., and Udert, K. M.: A Research Agenda for the Future of Urban Water Management: Exploring the Potential of Nongrid, Small-Grid, and Hybrid Solutions, Environ. Sci. Technol., 54, 5312–5322, https://doi.org/10.1021/acs.est.9b05222, 2020.
Hudson, P., Thieken, A. H., and Bubeck, P.: The challenges of longitudinal surveys in the flood risk domain, J. Risk Res., 23, 642–663, https://doi.org/10.1080/13669877.2019.1617339, 2020.
Kallis, G. and Norgaard, R. B.: Coevolutionary ecological economics, Ecol. Econ., 69, 690–699, https://doi.org/10.1016/j.ecolecon.2009.09.017, 2010.
Kaniasty, K. and Norris, F. H.: Longitudinal linkages between perceived social support and posttraumatic stress symptoms: Sequential roles of social causation and social selection, J. Trauma. Stress, 21, 274–281, https://doi.org/10.1002/jts.20334, 2008.
Kates, R. W., Colten, C. E., Laska, S., and Leatherman, S. P.: Reconstruction of New Orleans after Hurricane Katrina: A research perspective, P. Natl. Acad. Sci. USA, 103, 14653–14660, https://doi.org/10.1073/pnas.0605726103, 2006.
Kellens, W., Terpstra, T., and De Maeyer, P.: Perception and Communication of Flood Risks: A Systematic Review of Empirical Research, Risk Anal., 33, 24–49, https://doi.org/10.1111/j.1539-6924.2012.01844.x, 2013.
Kienzler, S., Pech, I., Kreibich, H., Müller, M., and Thieken, A. H.: After the extreme flood in 2002: changes in preparedness, response and recovery of flood-affected residents in Germany between 2005 and 2011, Nat. Hazards Earth Syst. Sci., 15, 505–526, https://doi.org/10.5194/nhess-15-505-2015, 2015.
Kim, Y., Park, I., and Kang, S.: Age and Gender Differences in Health Risk Perception, Cent. Eur. J. Publ. Heal., 26, 54–59, https://doi.org/10.21101/cejph.a4920, 2018.
Kreibich, H. and Thieken, A. H.: Coping with floods in the city of Dresden, Germany, Nat. Hazards, 51, 423–436, https://doi.org/10.1007/s11069-007-9200-8, 2009.
Kreibich, H., Thieken, A. H., Petrow, Th., Müller, M., and Merz, B.: Flood loss reduction of private households due to building precautionary measures – lessons learned from the Elbe flood in August 2002, Nat. Hazards Earth Syst. Sci., 5, 117–126, https://doi.org/10.5194/nhess-5-117-2005, 2005.
Lin, K. H. E., Lee, H. C., and Lin, T. H.: How does resilience matter? An empirical verification of the relationships between resilience and vulnerability, Nat. Hazards, 88, 1229–1250, https://doi.org/10.1007/s11069-017-2916-1, 2017.
Lindell, M. K. and Perry, R. W.: Household Adjustment To Earthquake Hazard – A Review of Research, Environ. Behav., 32, 461–501, 2000.
Little, R. J. A. and Rubin, D. B.: Statistical Analysis with Missing Data, Wiley Series in Probability and Statistics, 3rd edition, Wiley, Hoboken, NJ, 2019.
Liu, J., Dietz, T., Carpenter, S. R., Alberti, M., Folke, C., Moran, E., Pell, A. N., Deadman, P., Kratz, T., Lubchenco, J., Ostrom, E., Ouyang, Z., Provencher, W., Redman, C. L., Schneider, S. H., and Taylor, W. W.: Complexity of coupled human and natural systems, Science, 317, 1513–1516, https://doi.org/10.1126/science.1144004, 2007.
Liu, J. J. W., Reed, M., and Girard, T. A.: Advancing resilience: An integrative, multi-system model of resilience, Pers. Indiv. Differ., 111, 111–118, https://doi.org/10.1016/j.paid.2017.02.007, 2017.
Ludy, J. and Kondolf, G. M.: Flood risk perception in lands “protected” by 100 year levees, Nat. Hazards, 61, 829–842, https://doi.org/10.1007/s11069-011-0072-6, 2012.
Metz, B., Davidson, O., Bosch, P., Dave, R., and Meyer, L.: Mitigation of Climate Change, in: Fourth Assessment Report of the IPCC, Cambridge University Press, Cambridge, https://doi.org/10.1017/CBO9780511546013, 2007.
Michaelis, T., Brandimarte, L., and Mazzoleni, M.: Capturing flood-risk dynamics with a coupled agent-based and hydraulic modelling framework, Hydrol. Sci. J., 65, 1458–1473, https://doi.org/10.1080/02626667.2020.1750617, 2020.
Mileti, D. S. and O'Brien, P.: Public response to aftershock warnings, Colorado State University, Fort Collins, CO, 1993.
Mondino, E., Scolobig, A., Borga, M., Albrecht, F., Mård, J., Weyrich, P., and Di Baldassarre, G.: Exploring changes in hydrogeological risk awareness and preparedness over time: a case study in northeastern Italy, Hydrol. Sci. J., 65, 1049–1059, https://doi.org/10.1080/02626667.2020.1729361, 2020a.
Mondino, E., Scolobig, A., Borga, M., and Di Baldassarre, G.: The Role of Experience and Different Sources of Knowledge in Shaping Flood Risk Awareness, Water, 12, 2130, https://doi.org/10.3390/w12082130, 2020b.
Mondino, E., Scolobig, A., Borga, M., and Di Baldassarre, G.: Longitudinal data to explore changes in flood risk awareness and preparedness, Zenodo [data set], https://doi.org/10.5281/zenodo.4286099, 2021.
Osberghaus, D.: The effect of flood experience on household mitigation – Evidence from longitudinal and insurance data, Global Environ. Chang., 43, 126–136, https://doi.org/10.1016/j.gloenvcha.2017.02.003, 2017.
Osberghaus, D. and Hinrichs, H.: The Effectiveness of a Large-Scale Flood Risk Awareness Campaign: Evidence from Two Panel Data Sets, Risk Anal., 41, 944–957, https://doi.org/10.1111/risa.13601, 2020.
Ostrom, E.: A general framework for analyzing sustainability of social-ecological systems, Science, 325, 419–422, https://doi.org/10.1126/science.1172133, 2009.
Payne, G. and Payne, J.: Longitudinal and Cross-sectional Studies, in: Key Concepts in Social Research, SAGE Publications, London, 144–148, https://doi.org/10.4135/9781849209397, 2011.
Redman, C. L., Grove, J. M., and Kuby, L. H.: Integrating social science into the Long-Term Ecological Research (LTER) Network: Social dimensions of ecological change and ecological dimensions of social change, Ecosystems, 7, 161–171, https://doi.org/10.1007/s10021-003-0215-z, 2004.
Ridolfi, E., Mondino, E., and Di Baldassarre, G.: Hydrological risk: modeling flood memory and human proximity to rivers, Hydrol. Res., 52, 241–252, https://doi.org/10.2166/nh.2020.195, 2020.
Rogers, R. W. and Prentice-Dunn, S.: Protection motivation theory, in: Handbook of Health Behavior Research. I: Personal and Social Determinants, edited by: Gochman, D. S., Plenum, New York, NY, 113–132, 1997.
Saltelli, A. and Funtowicz, S.: Evidence-based policy at the end of the Cartesian dream. The case of mathematical modelling, in: Science philosophy and sustainability: The end of the Cartesian dream, edited by: Pereira, Â. and Funtowicz, S., Routledge, London, 147–162, 2015.
Salvati, P., Bianchi, C., Fiorucci, F., Giostrella, P., Marchesini, I., and Guzzetti, F.: Perception of flood and landslide risk in Italy: a preliminary analysis, Nat. Hazards Earth Syst. Sci., 14, 2589–2603, https://doi.org/10.5194/nhess-14-2589-2014, 2014.
Schlüter, M., McAllister, R. R. J., Arlinghaus, R., Bunnefeld, N., Eisenack, K., Hölker, F., Milner-Gulland, E. J., Müller, B., Nicholson, E., Quaas, M., and Stöven, M.: New horizons for managing the environment: A review of coupled social-ecological systems modeling, Nat. Resour. Model., 25, 219–272, https://doi.org/10.1111/j.1939-7445.2011.00108.x, 2012.
Scolobig, A. and De Marchi, B.: Dilemmas in land use planning in flood prone areas, in: Flood Risk Management: Research and Practice, edited by: Samuels, P., Huntington, S., Allsop, W., and Harrop, J., Taylor & Francis Group, London, 2009.
Seebauer, S. and Babcicky, P.: (Almost) all Quiet Over One and a Half Years: A Longitudinal Study on Causality Between Key Determinants of Private Flood Mitigation, Risk Anal., 41, 958–975, https://doi.org/10.1111/risa.13598, 2020.
Siegrist, M.: The Necessity for Longitudinal Studies in Risk Perception Research, Risk Anal., 33, 50–51, https://doi.org/10.1111/j.1539-6924.2012.01941.x, 2013.
Siegrist, M.: Longitudinal Studies on Risk Research, Risk Anal., 34, 1376–1377, https://doi.org/10.1111/risa.12249, 2014.
Sivapalan, M.: Debates-Perspectives on socio-hydrology: Changing water systems and the “tyranny of small problems”-Socio-hydrology, Water Resour. Res., 51, 4795–4805, https://doi.org/10.1002/2015WR017080, 2015.
Sivapalan, M., Savenije, H. H. G., and Blöschl, G.: Socio-hydrology: A new science of people and water, Hydrol. Process., 26, 1270–1276, https://doi.org/10.1002/hyp.8426, 2012.
Spence, A., Poortinga, W., Butler, C., and Pidgeon, N. F.: Perceptions of climate change and willingness to save energy related to flood experience, Nat. Clim. Chang., 1, 46–49, https://doi.org/10.1038/nclimate1059, 2011.
Stockemer, D.: Quantitative Methods for the Social Sciences – A Practical Introduction with Examples in SPSS and Stata, 1st edition, Springer International Publishing, Cham, https://doi.org/10.1007/978-3-319-99118-4, 2019.
Terpstra, T.: Emotions, Trust, and Perceived Risk: Affective and Cognitive Routes to Flood Preparedness Behavior, Risk Anal., 31, 1658–1675, https://doi.org/10.1111/j.1539-6924.2011.01616.x, 2011.
Thieken, A. H., Bessel, T., Kienzler, S., Kreibich, H., Müller, M., Pisi, S., and Schröter, K.: The flood of June 2013 in Germany: how much do we know about its impacts?, Nat. Hazards Earth Syst. Sci., 16, 1519–1540, https://doi.org/10.5194/nhess-16-1519-2016, 2016.
Tobin, G. A.: The Levee Love Affair: A Stormy Relationship?, J. Am. Water Resour. As., 31, 359–367, https://doi.org/10.1111/j.1752-1688.1995.tb04025.x, 1995.
Tversky, A. and Kahneman, D.: Availability: A heuristic for judging frequency and probability, Cognitive Psychol., 5, 207–232, https://doi.org/10.1016/0010-0285(73)90033-9, 1973.
van Buuren, S.: Flexible Imputation of Missing Data, 2nd edition, Chapman & Hall/CRC, London, available at: https://books.google.se/books?id=lzb3DwAAQBAJ&source = gbs_navlinks_s (last access: 9 September 2021), 2018.
van Duinen, R., Filatova, T., Geurts, P., and van der Veen, A.: Empirical Analysis of Farmers' Drought Risk Perception: Objective Factors, Personal Circumstances, and Social Influence, Risk Anal., 35, 741–755, https://doi.org/10.1111/risa.12299, 2015.
Viglione, A., Di Baldassarre, G., Brandimarte, L., Kuil, L., Carr, G., Salinas, J. L., Scolobig, A., and Blöschl, G.: Insights from socio-hydrology modelling on dealing with flood risk – Roles of collective memory, risk-taking attitude and trust, J. Hydrol., 518, 71–82, https://doi.org/10.1016/j.jhydrol.2014.01.018, 2014.
Wachinger, G. and Renn, O.: Risk perception and natural hazards, in: CapHaz-Net WP3 Report, available at: https://giam.zrc-sazu.si/sites/default/files/caphaz-net_wp3_risk-perception2.pdf (last access: 9 September 2021), 2010.
Wachinger, G., Renn, O., Begg, C., and Kuhlicke, C.: The risk perception paradox – Implications for governance and communication of natural hazards, Risk Anal., 33, 1049–1065, https://doi.org/10.1111/j.1539-6924.2012.01942.x, 2013.
Weyrich, P., Mondino, E., Borga, M., Di Baldassarre, G., Patt, A., and Scolobig, A.: A flood-risk-oriented, dynamic protection motivation framework to explain risk reduction behaviours, Nat. Hazards Earth Syst. Sci., 20, 287–298, https://doi.org/10.5194/nhess-20-287-2020, 2020.
White, G. F.: Human adjustiment to flooding: A geographical approach to the flood problem in the United States, The University of Chicago, Chicago, Illinois, https://doi.org/10.1146/annurev.energy.30.050504.144352, 1945.
Yee, J. L. and Niemeier, D.: Advantages and Disadvantages: Longitudinal vs. Repeated Cross-Section Surveys, United States. Federal Highway Administration, available at: https://rosap.ntl.bts.gov/view/dot/13793 (last access: 9 September 2021), 1996.