the Creative Commons Attribution 4.0 License.
the Creative Commons Attribution 4.0 License.
 | 18 Aug 2021
Performance of the Adriatic early warning system during the multi-meteotsunami event of 11–19 May 2020: an assessment using energy banners
Cléa Denamiel
Ivica Vilibić
This study quantifies the performance of the Croatian meteotsunami early warning system (CMeEWS) composed of a network of air pressure and sea level observations, a high-resolution atmosphere–ocean modelling suite, and a stochastic surrogate model. The CMeEWS, which is not operational due to a lack of numerical resources, is used retroactively to reproduce the multiple events observed in the eastern Adriatic between 11 and 19 May 2020. The performances of the CMeEWS deterministic models are then assessed with an innovative method using energy banners based on temporal and spatial spectral analysis of the high-pass-filtered air pressure and sea level fields. It is found that deterministic simulations largely fail to forecast these extreme events at endangered locations along the Croatian coast, mostly due to a systematic northwestward shift of the atmospheric disturbances. Additionally, the use of combined ocean and atmospheric model results, instead of atmospheric model results only, is not found to improve the selection of the transects used to extract the atmospheric parameters feeding the stochastic meteotsunami surrogate model. Finally, in operational mode, the stochastic surrogate model would have triggered the warnings for most of the observed events but also set off some false alarms. Due to the uncertainties associated with operational modelling of meteotsunamigenic disturbances, the stochastic approach has thus proven to overcome the failures of the deterministic forecasts and should be further developed.
- Article
(16464 KB) - Full-text XML
-
Supplement
(2431 KB) - BibTeX
- EndNote


Atmospherically driven extreme sea levels (e.g. wind storms, hurricanes), associated with flooding producing substantial damage to houses, goods, and infrastructure, are among the main hazards impacting coastal communities (Nicholls and Cazenave, 2010; Neumann et al., al., 2015). As such, meteorological tsunamis (commonly referred to as meteotsunamis) are sea level oscillations with characteristics similar to seismic or landslide tsunamis but generated by atmospheric gravity waves, frontal passages, pressure jumps, or squalls, for example, though a multi-resonant mechanism (Monserrat et al., 2006). The principal generation mechanisms are open-ocean resonance occurring between the ocean and the air pressure oscillations at timescales ranging from a few minutes to a few hours (e.g. Proudman, 1929) and coastal amplification that also includes so-called harbour resonance (Miles and Munk, 1961; Rabinovich, 2009). Locally they can be destructive, not only due to extreme sea levels (Hibiya and Kajiura, 1982; Salaree et al., 2018), but also to dangerous currents in constrictions or in coastal zones (Ewing et al., 1954; Vilibić et al., 2004; Linares et al., 2019). The strongest meteotsunami on record in the Mediterranean Sea hit Vela Luka, Croatia, in June 1978, with a wave height of 6 m (crest to trough) and a period of 18 min. The meteotsunami lasted several hours and caused USD 7 million in damage (Vučetić et al., 2009; Orlić et al., 2010).
In certain locations around the world, due to a combination of weather patterns, geography, and bathymetry, meteotsunamis can be a regularly occurring phenomenon. The Balearic Islands and Croatian coastline in the Mediterranean Sea, a few of Japan's gulfs and bays, the Great Lakes and the US East Coast, and the western Australian coastline are good examples (Pattiaratchi and Wijeratne, 2015; Rabinovich, 2020). For all these locations, despite varying intensities, meteotsunami events have the potential to generate structural damage and sometimes even human casualties. Meteotsunami early warning systems, helping the local population to prepare for these destructive events, are thus important for the coastal communities living in such places. Vilibić et al. (2016) pointed out that meteotsunami early warning systems can be created based on four approaches: (1) identification of tsunamigenic atmospheric synoptic conditions, (2) real-time detection of tsunamigenic atmospheric disturbances using a microbarograph network, (3) measurement and tracking of high-frequency sea level oscillations by high-resolution digital tide gauges, and (4) numerical simulation of meteotsunamis based on coupling of atmosphere–ocean numerical models. As it stands today, the only fully operational meteotsunami early warning system in the world is located in the Balearic Islands. It is based on forecasts given at a qualitative level with the identification of favourable synoptic conditions a few days ahead (Jansà et al., 2007; Jansà and Ramis, 2020) and with the deterministic results of the operational BRIFS (Balearic Rissaga Forecasting System, http://www.socib.eu, last access: 16 August 2021) model (Renault et al., 2011). In the Balearic Islands, probabilistic approaches have also been tested recently to narrow down the uncertainties of the meteotsunami forecasts (Vich and Romero, 2020; Mourre et al., 2020). In the US, meteotsunami early warning systems are still under development by NOAA (National Oceanic and Atmospheric Administration) and will be based on high-resolution air pressure measurements combined with forecast models (Anderson et al., 2020). Finally, the recently developed Croatian meteotsunami early warning system (CMeEWS) is based on an observational network of pressure sensors and tide gauges, as well as on the deterministic AdriSC modelling suite (Denamiel et al., 2019a) and the stochastic meteotsunami surrogate model (Denamiel et al., 2019b, 2020). It provides meteotsunami hazard assessments depending on forecasted and measured air pressure disturbances but has unfortunately not been used operationally since November 2019 due to a lack of high-performance computing resources needed to execute such a numerically demanding suite in real time.
However, the CMeEWS applications to recent meteotsunami events may surely be used to better quantify its reliability and to improve its performance. Recently, an exceptional multi-meteotsunami event, which lasted for a week between 11 and 19 May 2020, occurred in the Croatian cities of Vela Luka (VL), Stari Grad (SG), and Vrboska (Vr), located along the coasts of the Dalmatian islands in the Adriatic Sea (Fig. 1). Therefore, the deterministic and stochastic AdriSC models have been run retroactively in operational (hindcast) mode (i.e. in the exact same conditions that the daily meteotsunami forecasts would have been produced operationally) for this 11–19 May 2020 period. As quoted by Denamiel et al. (2020), forecasting the right speed and frequency (period) of the travelling atmospheric disturbances is crucial for meteotsunami hazard assessments in the harbours of Vela Luka, Stari Grad, and Vrboska. Therefore, unlike previous studies on the performances of the CMeEWS operational models, this analysis introduces the novelty of using energy banners – based on the spectral analysis of the high-pass-filtered air pressure and sea level fields – as a tool to evaluate the capacity of the AdriSC deterministic model to reproduce the frequency of the meteotsunamigenic disturbances measured during the 11–19 May 2020 period. Hereafter, the CMeEWS (including the AdriSC modelling suite, the stochastic surrogate model, and the observational network) and the methods used in the study are first presented in Sect. 2. Then, Sect. 3 describes the 11–19 May 2020 multi-meteotsunami event using eyewitness reports, available observations, and reanalysis products. The verification of the AdriSC deterministic atmospheric model is undertaken in Sect. 4, while Sect. 5 presents the main results of the study – i.e. the meteotsunami energy banners used to detect the strongest atmospheric disturbances. Finally, the stochastic meteotsunami hazard assessments, based on parameters extracted from transects selected along the energy banners, are discussed in Sect. 6, and the findings of this study are summarized in Sect. 7.
The Croatian meteotsunami early warning system (CMeEWS) receives three different kinds of data: (1) high-resolution atmospheric and ocean model results provided by the Adriatic Sea and Coast (AdriSC) modelling suite (Denamiel et al., 2019a), (2) high-frequency air pressure and sea level measurements along the Adriatic coast, and (3) meteotsunami hazard assessments based on the stochastically estimated maximum elevation distributions derived from a meteotsunami surrogate model (Denamiel et al., 2019b, 2020). The following subsections describe the different components of the CMeEWS and the methods used in this article to improve the detection and extraction of the modelled meteotsunamigenic disturbances in the atmosphere.

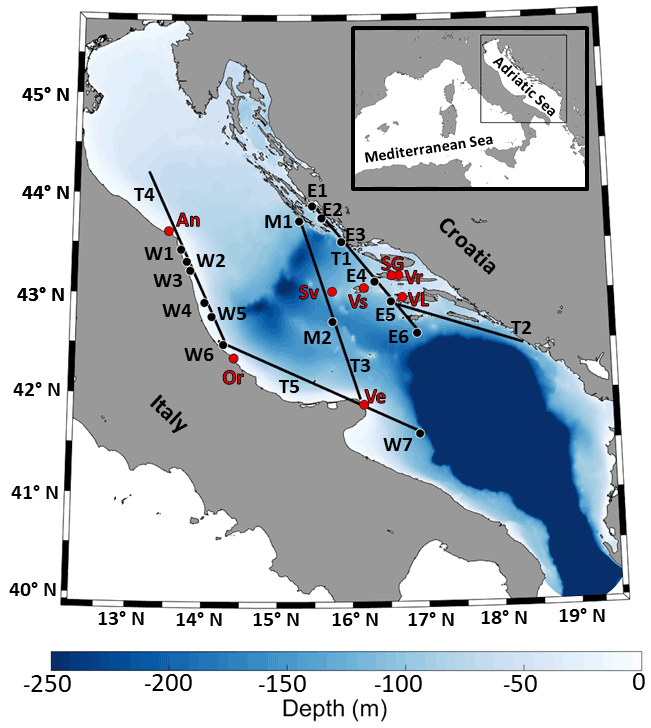
Figure 1Bathymetry of the Adriatic Sea with positions of microbarographs and tide gauges (red circles). Black circles denote model grid points along transects T1 to T5 (black lines) on which the highest energy is reproduced within selected meteotsunami energy banners in the eastern (E1 to E6), middle (M1 and M2), and western (W1 to W7) Adriatic.
2.1 AdriSC modelling suite
The AdriSC modelling suite is composed of a basic module providing kilometre-scale atmospheric and ocean circulation over the entire Adriatic region, forcing a dedicated meteotsunami module (Denamiel et al., 2019a).
The basic module uses a modified version of the Coupled Ocean–Atmosphere–Wave–Sediment–Transport (COAWST) modelling system developed by Warner et al. (2010), built around the Model Coupling Toolkit (MCT), which exchanges data fields and dynamically couples the Weather Research and Forecasting (WRF) atmospheric model, the Regional Ocean Modeling System (ROMS), and the Simulating WAves Nearshore (SWAN) model. The basic module is set up with (1) two different nested grids of 15 and 3 km resolution used in the WRF model respectively covering the central Mediterranean area and the Adriatic–Ionian region and (2) two different nested grids of 3 and 1 km resolution used for both ROMS and SWAN models respectively covering the Adriatic–Ionian region (similar to the WRF 3 km grid) and the Adriatic Sea only.
The dedicated meteotsunami module offline couples the Weather Research and Forecasting (WRF) model (Skamarock et al., 2005) at 1.5 km of resolution with the unstructured ADCIRC–SWAN model (Dietrich et al., 2012), coupling the 2DDI (i.e. two-dimensional depth-integrated) ADvanced CIRCulation (ADCIRC) model and the SWAN model with a mesh of up to 10 m resolution in the areas sensitive to the meteotsunami hazard. In more detail, (1) the hourly results from the WRF 3 km grid obtained with the basic module are first downscaled to a WRF 1.5 km grid covering the Adriatic Sea; (2) the hourly sea surface elevation from the ROMS 1 km grid, the 10 min spectral wave results from the SWAN 1 km grid, and finally the 1 min results from the WRF 1.5 km grid are then used to force the unstructured mesh of the ADCIRC–SWAN model. In this operational configuration, the ADCIRC model is forced every minute by the WRF 1.5 km wind and pressure fields and every hour by the basic module sea level fields (including tides) at the open-sea boundary (south of the Strait of Otranto).
In operational mode (Denamiel et al., 2019a, 2019b) the AdriSC modelling suite runs every day with the basic module initial state and boundary conditions provided by (1) an analysis based on the previous day at 12:00 UTC of the ECMWF 10 d forecast model (HRES at 0.1∘ resolution; Zsótér et al., 2014) for the atmosphere and (2) the Mediterranean Forecasting System (MFS/MEDSEA at ∘ resolution; Pinardi et al., 2003) for the ocean.
2.2 Observational network
The observational network (called MESSI, http://www.izor.hr/messi, last access: 16 August 2021) consists of nine microbarographs, eight of which are used in this study, measuring air pressure with a Väisälä PTB330 sensor with an accuracy of ±0.01 hPa, and three tide gauges, two of which are used in this study, measuring sea level with an OTT radar-level sensor (RLS) with an accuracy of ±1 mm. All instruments are set up with a 1 min sampling rate and listed in Table 1. Microbarographs are installed in areas where either the generation or the amplification of meteotsunamis is known to occur (red circles, Fig. 1): Ancona (An), Ortona (Or), and Vieste (Ve) located along the western Adriatic coast, Vis (Vs) and Svetac (Sv) in the middle of the Adriatic Sea, and Vela Luka (VL), Stari Grad (SG), and Vrboska (Vr) on the eastern Adriatic coast. Tide gauges are located in Vela Luka (VL) and Stari Grad (SG), which are known to be harbours sensitive to meteotsunamis (red circles, Fig. 1). However, one should be aware that the tide gauges are located not at the tops of the bays that are normally most affected by meteotsunamis, but about 2 km from the tops; thus, the observed high-frequency sea level oscillations at tide gauges are 2 to 3 times lower than reported by eyewitnesses at the bays' tops.
2.3 Stochastic surrogate model
Uncertainties linked to the deterministic forecast of the location, direction, amplitude, speed, period, and width of the atmospheric disturbances driving meteotsunami events in the Adriatic Sea are known to be quite large (Belušić et al., 2007; Šepić et al., 2009; Denamiel et al., 2019a). In other words, it is unlikely for atmospheric deterministic models to forecast meteotsunamigenic disturbances with proper speed and period and at the right location. Consequently, deterministic ocean models often fail to reproduce or underestimate the meteotsunami events in sensitive harbours (e.g. Vela Luka, Stari Grad, and Vrboska). In order to improve the meteotsunami hazard assessments in the Adriatic, the meteotsunami stochastic surrogate model, used to propagate the uncertainties of the atmospheric disturbance parameters extracted from the WRF 1.5 km model to the maximum amplitudes of the meteotsunami waves, was developed within the CMeEWS (Denamiel et al., 2019b, 2020). This model optimizes a great number of ADCIRC simulations via a generalized polynomial chaos expansion (gPCE) method (Xiu and Karniadakis, 2002; Soize and Ghanem, 2004), whereby a particular simulation is forced by synthetic air pressure fields depending on six stochastic parameters: start location (y0), direction (θ), speed (c), period (T), amplitude (PA), and width (d) of the disturbance (Denamiel et al., 2018). These six parameters are assumed to have uniform distributions and are adapted to the middle Adriatic meteotsunamis on the following intervals: N, 43.65∘ N], , c∈[15 m s−1, 40 m s−1], T∈[300 s, 1800 s], PA ∈[0.5 hPa, 4 hPa], and d∈[30 km, 150 km].
Within the CMeEWS, the ranges of the stochastic parameters used as input to the surrogate model are extracted manually from the forecasted WRF 1.5 km high-pass-filtered air pressure results, adding the uncertainty of ±0.24∘ N for latitude of origin, ±0.26 rad for direction of propagation, ±0.35 hPa for amplitude, ±150 s for period, and ±12 km for width, following the values determined by Denamiel et al. (2019b). For each sensitive location along the Croatian coast, the output of the surrogate model consists of the distribution of maximum elevations produced with 20 000 random combinations of the input parameters selected within the defined ranges. Additionally, to provide a meteotsunami hazard assessment derived from the surrogate model, Denamiel et al. (2019b) prescribed a flooding threshold – defined as the maximum elevation above which flooding would occur – considering the resilience of the coastline at the different sensitive locations. For Vela Luka, Stari Grad, and Vrboska, these thresholds are defined as 1.05, 0.45, and 0.55 m, respectively. In operational mode, the meteotsunami warning is triggered when the probability of crossing the flooding threshold (derived from the maximum elevation distributions provided as the surrogate model output) is above or equal to 10 %.
2.4 Methods
In order to evaluate the capacity of the CMeEWS to provide meaningful meteotsunami hazard assessments, the AdriSC modelling suite is run in operational (hindcast) mode after the 11–19 May 2020 multi-meteotsunami event took place. This means that the 10 d forecasts derived with the ECMWF HRES and MEDSEA/MSF models on 8–16 May 2020 are used to hindcast the meteotsunamigenic conditions of 11–19 May 2020. The model is set up to run for short periods of 3 d in the basic module and 1.5 d in the extreme event module, with only the last 24 h hourly results – extracted from the WRF 1.5 km model in the atmosphere and the ADCIRC unstructured model in the ocean – used in the following analyses. Within the CMeEWS, the meteotsunamigenic disturbances reproduced with the AdriSC WRF 1.5 km model are automatically detected if the maximum temporal rate of change (i.e. pressure difference calculated over a 4 min interval) of the high-pass-filtered air pressure derived at each WRF 1.5 km grid sea point is above 20 Pa min−1 over at least 5 % of the sea domain. Such a condition has been proven to be efficient for the detection of meteotsunamigenic disturbances (Vilibić et al., 2016; Denamiel et al., 2019b). The event mode of the system (i.e. meteotsunamis may occur) is thus triggered without human intervention for the studied 11–19 May 2020 period.
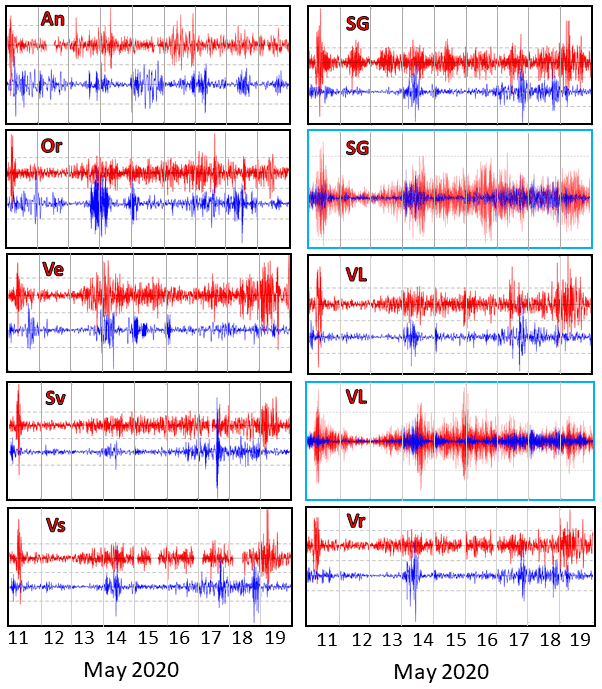
Figure 2Observed (in red) and modelled (in blue) high-pass-filtered time series of air pressure (black rectangles) and sea level (blue rectangles) during the 11–19 May 2020 period. The distance between adjacent horizontal grid lines (dashed) stands for 1.0 hPa in air pressure and 0.5 m in sea level for Stari Grad and Vela Luka.
Hereafter, air pressure and sea level data both derived with the AdriSC modelling suite and collected from the stations listed in Table 1 are filtered using a 2 h Kaiser–Bessel filter to extract high-frequency pressure and sea level oscillations characteristic for meteotsunamis. At a very basic level, a direct comparison of modelled (blue lines, Fig. 2) and measured (red lines, Fig. 2) high-pass-filtered air pressure and sea level time series is used in Sect. 3 to assess the capacity of the AdriSC deterministic model to reproduce the meteotsunami events at the locations of interest during the middle Adriatic multi-meteotsunami event of 11–19 May 2020.
Since the failure of deterministic models to reproduce the small-scale atmospheric disturbances at the right locations is a known problem, the verification of the AdriSC WRF 1.5 km results presented in Sect. 4 tracks the locations where the highest daily spectral energies occur in both the model and the observations. In other words, the performance of the AdriSC WRF 1.5 km model is derived with fast Fourier transform (FFT) analyses (Cooley and Tukey, 1965) of the high-pass-filtered air pressure observed and modelled results calculated every 30 min with a 3 h window at selected locations for each day of the reproduced multi-meteotsunami event. First, as the meteotsunamigenic disturbances are known to propagate from the western to the eastern Adriatic (Vilibić and Šepić, 2009; Denamiel et al., 2020), five transects are selected to track the modelled atmospheric disturbances: two transects along the Italian coast in the western Adriatic (T4 and T5), one in the middle Adriatic (T3), and two transects along the Croatian coast in the eastern Adriatic (T1 and T2). Then, for each day of the multi-meteotsunami event, the AdriSC WRF 1.5 km results are extracted at the actual microbarograph locations and in additional model grid points (black dots, Fig. 1) selected where the highest daily spectral energies are reproduced by the model along the western (selected points W1 to W7), middle (selected points M1 and M2), and eastern Adriatic (selected points E1 to E6) transects. The measurements at the microbarograph location where the meteotsunami was best observed – i.e. the highest spectral energy along the western Adriatic transect for Ancona, Ortona, and Vieste microbarographs, along the middle Adriatic transect for Vis and Svetac microbarographs, and along the eastern Adriatic transect for Vrboska, Stari Grad, and Vela Luka microbarographs – are also extracted. Finally, the time evolutions of the spectra derived from the observations (at the selected stations) are compared with the time evolutions of the spectra derived from the WRF 1.5 km results at the point at which the highest energy was reproduced (including microbarograph locations). At the end, for the entire duration of the multi-meteotsunami event, composites of frequency–time spectrograms of high-pass-filtered air pressure observed and modelled data for the western, middle, and eastern Adriatic regions are created (Figs. 4–6).
The analyses performed in Sect. 5 are done in two steps and aim to better track the propagation of the modelled meteotsunamigenic disturbances across the Adriatic Sea in order to improve the extraction of the atmospheric parameters needed to run the stochastic surrogate model. In the first step, two different transect sampling criteria are used to select the transects along which the atmospheric disturbances, and hence the meteotsunami waves, propagate in the model: one based solely on the atmospheric results (already used operationally) and a new one also taking into account the ocean results (tested in this study). For the operational sampling criterion, the time variances of the WRF 1.5 km high-pass-filtered air pressure results are calculated on a 3 h interval (i.e. eight time windows per day) over the entire model domain. For each event occurring during the 11–19 May 2020 period, the transects presented in this study are manually selected across the Adriatic Sea following the paths of highest atmospheric variances for the most energetic time windows. Since the number of time windows and paths with high air pressure variances varies between the events, the number of transects for each day varies too. For the new sampling criterion, the variances of the high-pass-filtered air pressure and sea level model results estimated on a 3 h interval are multiplied. This criterion thus tends to zero when the atmospheric forcing does not trigger any ocean response, i.e. when no resonant transfer of energy from the atmosphere to the sea is occurring. It should be noted that such a criterion could not be directly derived from the sea level variances, which provide a noisy and mostly untraceable signal due to the numerous interactions of ocean waves with the bathymetry including, for example, reflection and refraction around the islands. Hereafter, the new transect sampling criterion is compared with the operational one in order to determine whether or not it would have improved the transect selection. In the second step, meteotsunami energy banners defined as the spectrograms of the modelled high-pass-filtered air pressure and sea level results are spatially calculated with FFT along the selected transects for the 3 h time window corresponding to the operational transect sampling criterion. As speed remains a difficult parameter to extract from the observed and modelled meteotsunamigenic disturbances, speeds of the tracked atmospheric disturbances along the transects are also visually determined by analysing the propagation along the transects of the strongest WRF 1.5 km high-pass-filtered air pressure peaks. The locations where Proudman resonance is likely to occur along the transects are then derived by calculating where the Froude number ( ranges from 0.9 and 1.1 (i.e. where the speed of the atmospheric disturbances U matches the speed of the long ocean waves , with g the gravitational acceleration and H the local depth). The analyses from Sect. 5 are presented with one transect (plotted from west to east following the propagation of the meteotsunami events) per event in the article (Transect 1, Figs. 7–11) selected during the peak of the modelled daily event and in the Supplement for the other transects (Figs. S2–S15 in the Supplement) in order to keep a reasonable article length.
Finally, for each day of the multi-meteotsunami event, the input parameters of the stochastic surrogate model are then manually extracted from the AdriSC WRF 1.5 km modelled atmospheric disturbances along the transects selected in Sect. 5. The probabilities of the maximum elevation surpassing the flooding thresholds in the Vela Luka, Stari Grad, and Vrboska harbours, where flooding occur during the 11–19 May 2020 period, are then determined and the meteotsunami hazards assessed for each separate event.
This long-lasting meteotsunami event was reported by the media, in particular by eyewitnesses in Vrboska with two YouTube videos (https://www.youtube.com/watch?v=vz9G5E9ravc, last access: 16 August 2021; https://www.youtube.com/watch?v=-aD9q4QMANE, last access: 16 August 2021), and by local web portals in Vela Luka and Stari Grad. In particular, Dalmacija danas (https://www.dalmacijadanas.hr/, last access: 16 August 2021) wrote on 14 May: “Changes in air pressure have a pronounced effect on the sea level in the Adriatic, which is most noticeable on the Dalmatian islands in the last two days. There is a constant change in sea level throughout the day, and today it was most pronounced in the afternoon in Vela Luka. […] the sea level fluctuated in the range of about 70 cm. The sea rose and flooded the waterfront, then receded abruptly, leaving the boats dry. The phenomenon was also recorded on Hvar, for example in Stari Grad, but it was less pronounced.” On 16 May another local web portal, Morski.hr, published an article titled Meteotsunami in Vela Luka: The sea is pouring into shops and cafes. This has been going on for three days now! The following is the testimony of a local, Ljubo Padovan. “This is something we haven't had in years and it has been going on for full three days. The sea got into some shops and cafes again. When the sea recedes, one can walk from one side of the bay to the other. The sea flooded everything again last night. The situation is not calming down even after three days; that is very unusual.”
Concerning the observations (Fig. 2), on 11 May intense high-frequency sea level oscillations reached up to 80 cm of height (crest to trough) and a 16 min period at 09:40 UTC in Vela Luka as well as 53 cm of height and a 18 min period at 11:07 UTC in Stari Grad. Additionally, all microbarographs recorded an intensification of the air pressure oscillations, with a maximum high-frequency amplitude of 3.1 hPa and a period of 13 min documented for Vela Luka. Air pressure oscillations calmed down on 12 and 13 May but, following reported flooding, increased again on 14 May, especially in Ancona and Vieste. On this day, in Vela Luka, air pressure oscillations were about 2 times weaker than on 11 May, but the height of sea level oscillations almost reached 80 cm with a 15 min period. However, in Stari Grad, sea levels oscillated between −25 and 25 cm from 08:00 to 16:00 UTC. Even though the sea level oscillations in Stari Grad harbour were 2 times smaller than during 11 May, flooding still occurred, probably due to the additional effects of tidal elevation and/or storm surge. Lower-intensity oscillations of both air pressure and sea level followed on the next days until around midnight on 16 May, when another meteotsunami event took place. For this event, air pressure oscillations were unusually low, even in Ancona, which recorded the strongest ones. However, in Vela Luka the height of the sea level oscillations went up to 80 cm with a 13 min period. Despite the reports of flooding in Stari Grad, identically to 14 May, the sea levels only oscillated between −25 and 25 cm.
The pressure oscillations did not completely vanish in the following days, and on 19 May strong air pressure disturbances with heights above 2.5 hPa occurred in Svetac, Vieste, Vis, Vrboska, and Vela Luka. However, no flooding is recorded in Vela Luka or Stari Grad where the recorded sea level oscillations did not surpass 30 and 20 cm, respectively.
The synoptic conditions over Europe derived from ERA5 reanalysis (Hersbach et al., 2020) – temperature at 850 hPa, winds at 500 hPa, and mean sea level air pressure (Fig. 3) – are extracted at times close to the flooding of Vela Luka, Stari Grad, and Vrboska harbours: in the morning on 11 May, around midday on 14 May, and around midnight on 16 May. For all the flooding events, the conditions show the advection of warm air from the Sahara towards the Adriatic at 850 hPa, associated with strong southwesterly winds at 500 hPa with speeds over 30 m s−1. Additionally, the mean sea level air pressure over the Adriatic indicates either a trough stretching from northern Europe, as on 11 May, or a cyclone that was deeper on 14 May and quite weak on 16 May. These synoptic conditions are known to occur during Mediterranean meteotsunamis (Jansá et al., 2007; Vilibić et al., 2008; Šepić et al., 2016) when atmospheric disturbances (particularly atmospheric gravity waves) can be generated along the strong frontal gradients of the jet streams, as seen in Fig. 3, and propagate over long distances in the form of so-called ducted waves (Lindzen and Tung, 1976; Monserrat and Thorpe, 1996).
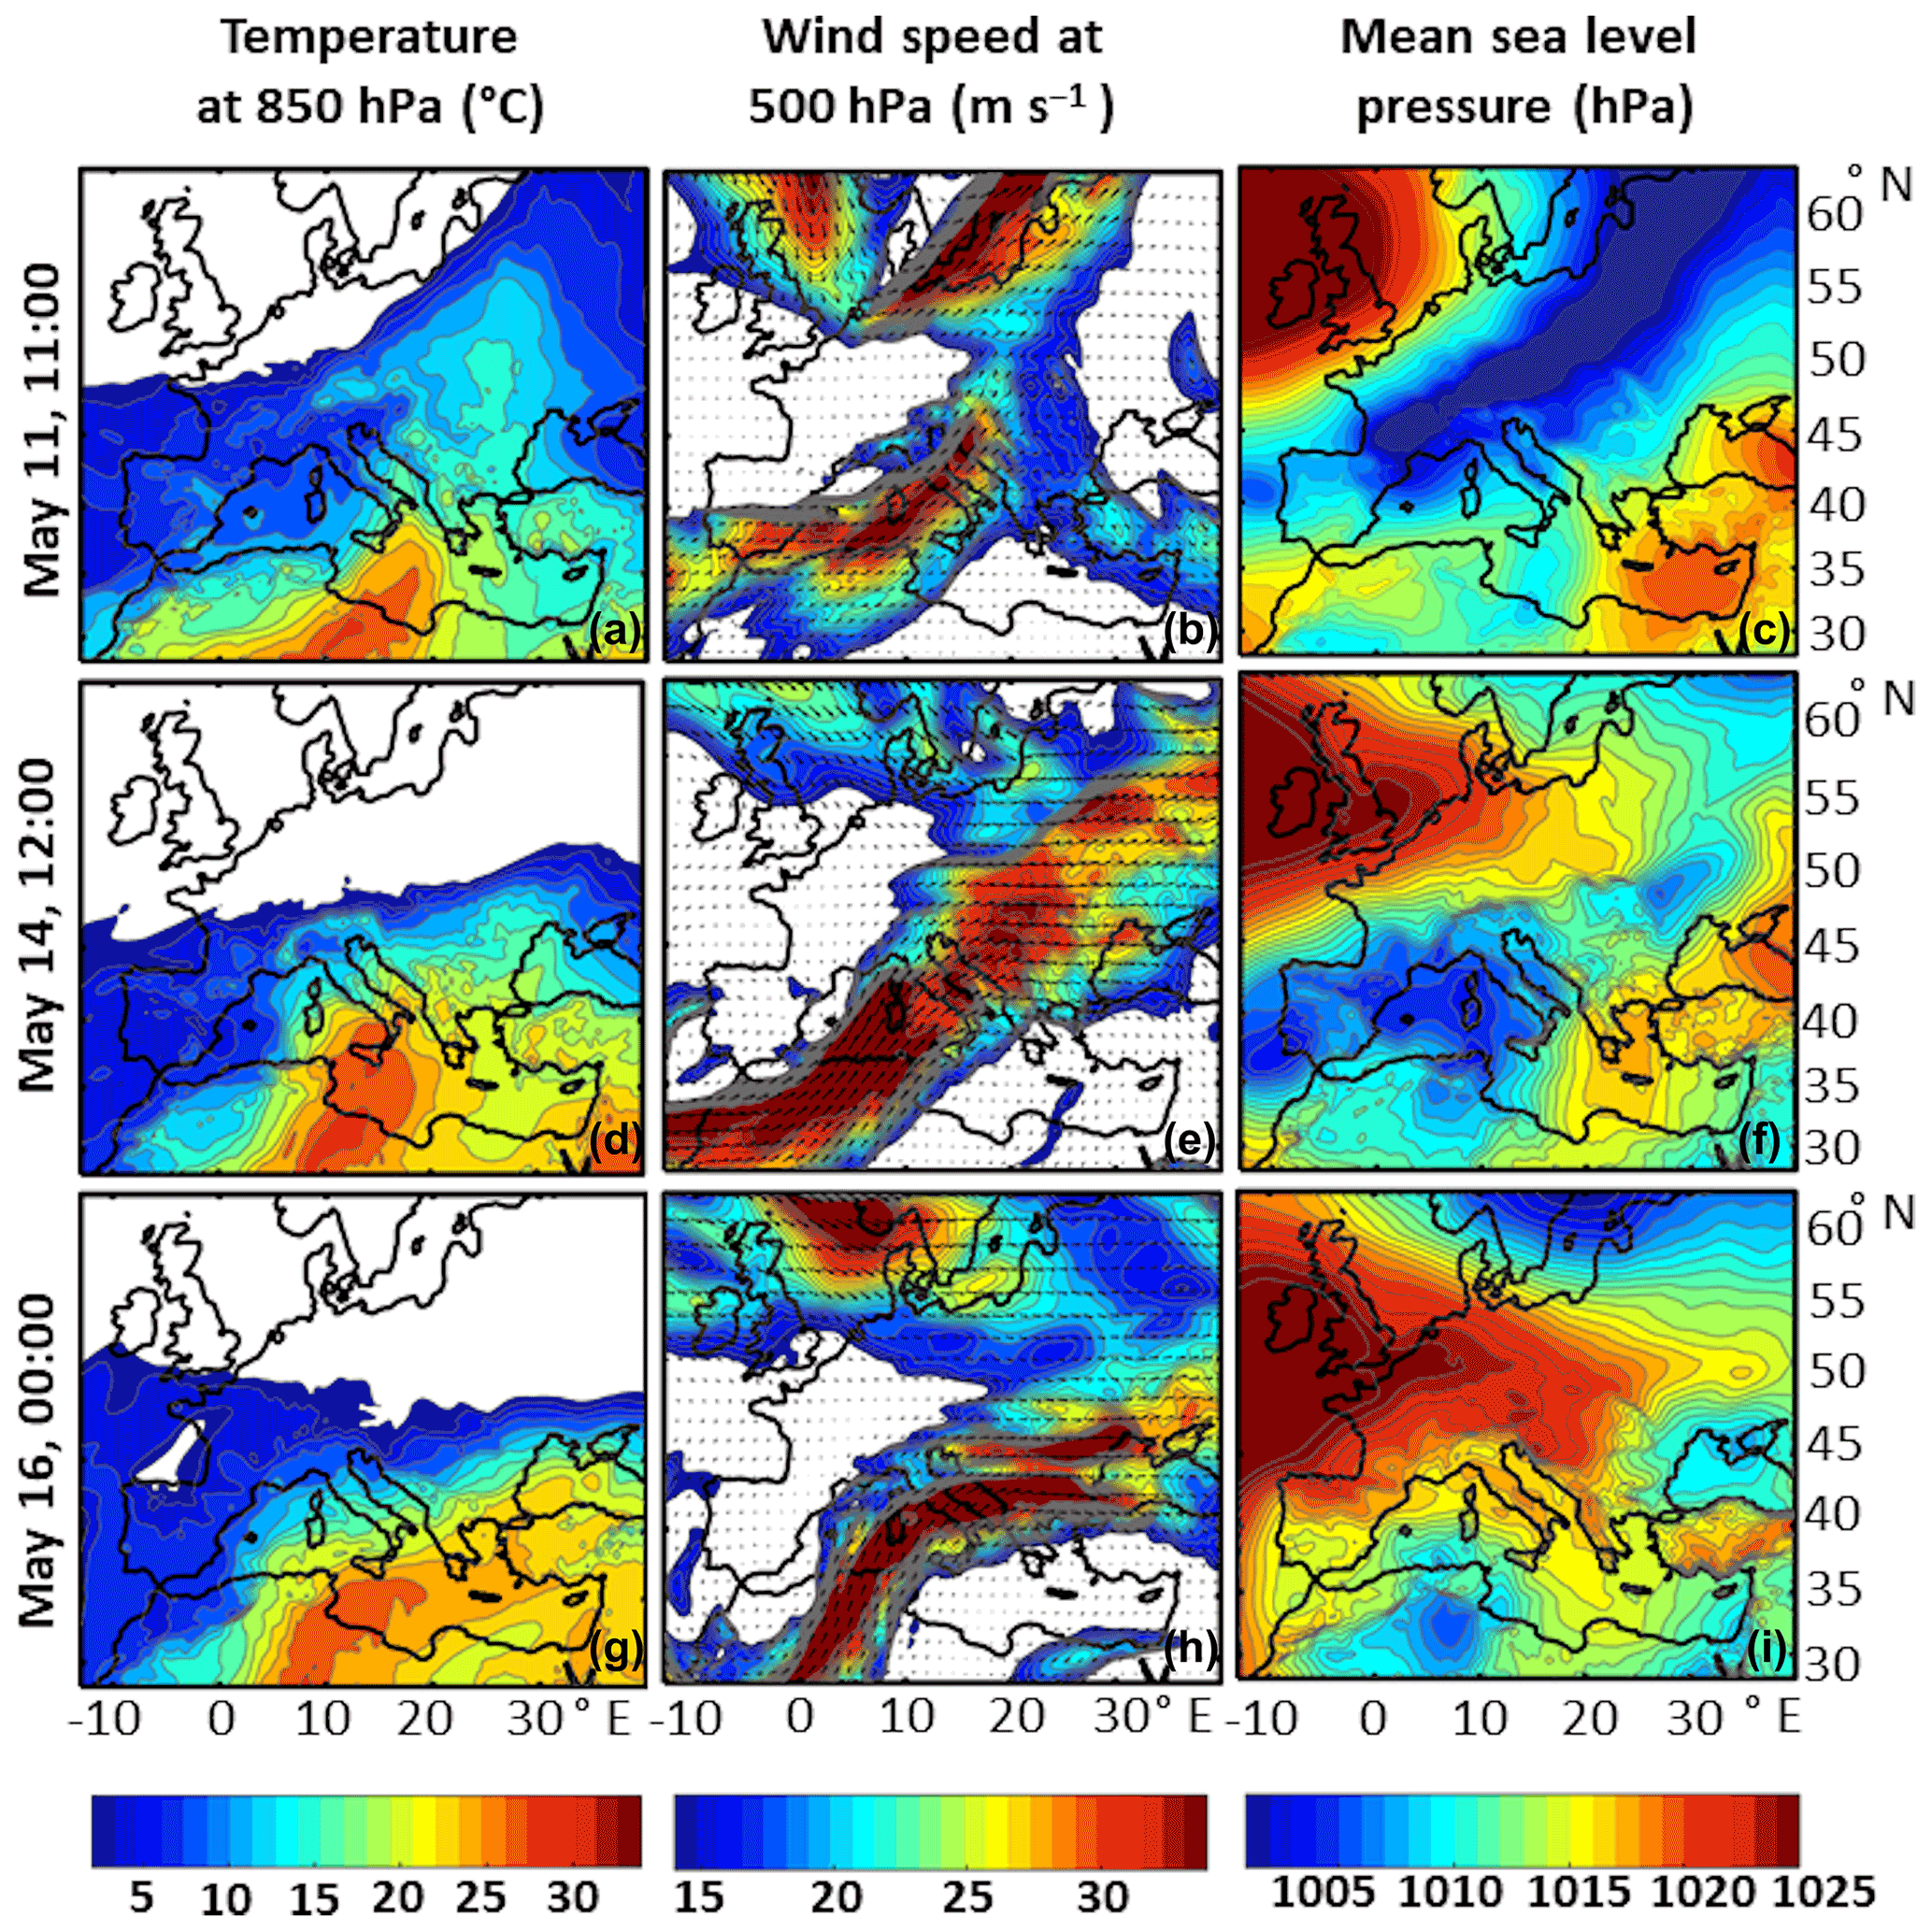
Figure 3Synoptic settings over Europe – temperature at 850 hPa (left panels), winds at 500 hPa (middle panels), and mean sea level pressure (right panels) – extracted from ERA5 reanalysis at times closest to the flooding in Vela Luka, Stari Grad, and Vrboska harbours.
The capacity of the AdriSC WRF 1.5 km and ADCIRC models to reproduce the meteotsunami events during the 11–19 May 2020 period is first assessed qualitatively by comparing the observed (in red) and modelled (in blue) time series presented in Fig. 2. It shows that the events on 11 and 16 May are completely missed by both the WRF 1.5 km and ADCIRC models. However, the meteotsunami event of 14 May is partially captured by the AdriSC model. Air pressure oscillations are indeed simulated in Vieste, Vis, Stari Grad, Vela Luka, and Vrboska, along with weaker than measured sea level oscillations in Stari Grad and Vela Luka. AdriSC model results for 12 and 13 May are generally in accordance with the measurements, with no strong oscillations of pressure and sea level, but with slightly underestimated pressure and sea level oscillations in Ancona, Vieste, and Stari Grad and overestimated pressure oscillations in Ortona. The model results for 17 May are also generally in accordance with the measurements, with underestimated pressure and sea level oscillations in Ortona, Stari Grad, and Vela Luka and overestimated pressure oscillations in Svetac. Even though the deterministic AdriSC model fails to forecast two of the three observed meteotsunami events, the event mode of the CMeEWS is triggered for all the days of the 11–19 May 2020 period except for 12 and 13 May for which no false alarms would have been triggered (Fig. S1 in the Supplement).
Measured and modelled composites of air pressure frequency–time spectrograms in the eastern, middle, and western Adriatic Sea (Figs. 4–6) are thus used to quantitatively compare the energy content of the meteotsunamigenic disturbances as observed by the microbarographs and forecasted with the WRF 1.5 km model at grid points W1–W7, M1–M2, and E1–E6, in addition to grid points next to microbarograph stations as described in Sect. 2. Overall, no pronounced energy peaks are found in the spectrograms, which is typical for spectra of air pressure characterized by a number of oscillatory movements with no dominant period (Monserrat and Thorpe, 1992; Zemunik et al., 2020). Additionally, in operational mode, the CMeEWS would have provided warnings for a full day (next 30 h period including night hours past midnight) and not for a precise time. It may thus be noticed that, despite this analysis being temporal, discussions about the differences between modelled and measured timing of the meteotsunami events are not relevant for the model verification.
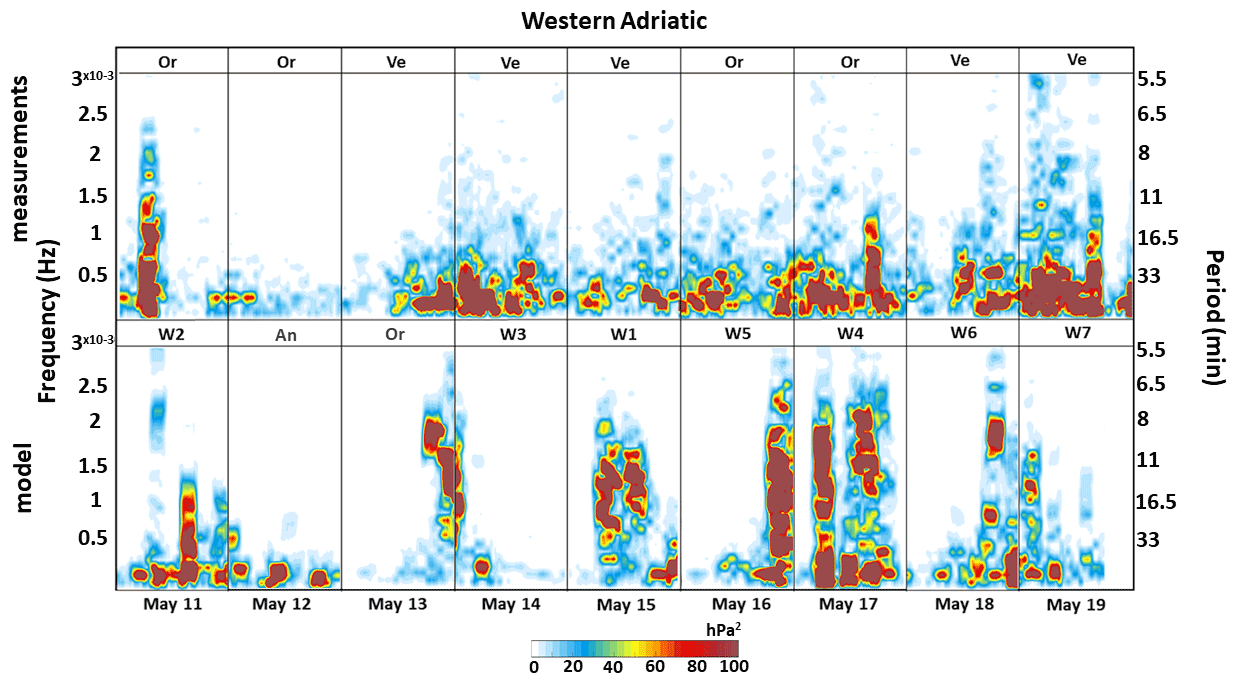
Figure 4Modelled and measured composites of high-pass-filtered air pressure frequency–time spectrograms for the western Adriatic region. Maximum daily energies measured by the microbarographs (observed composite) and modelled at one WRF 1.5 km model grid point (modelled composite) are collocated.
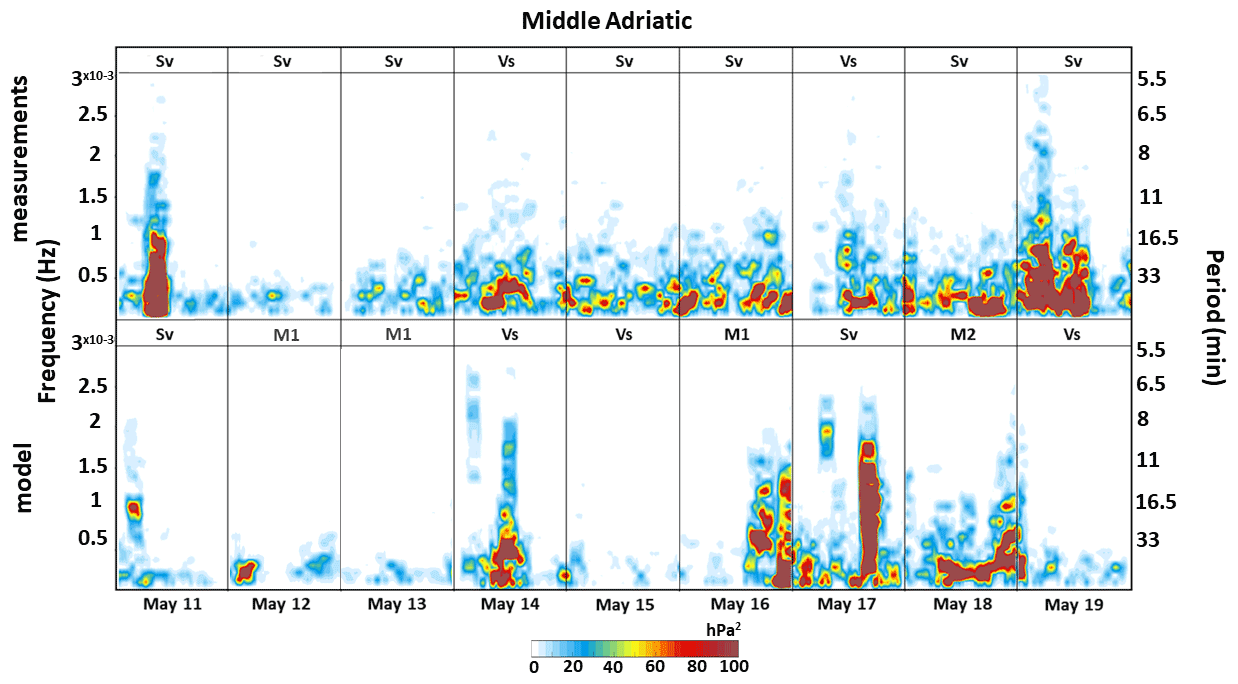
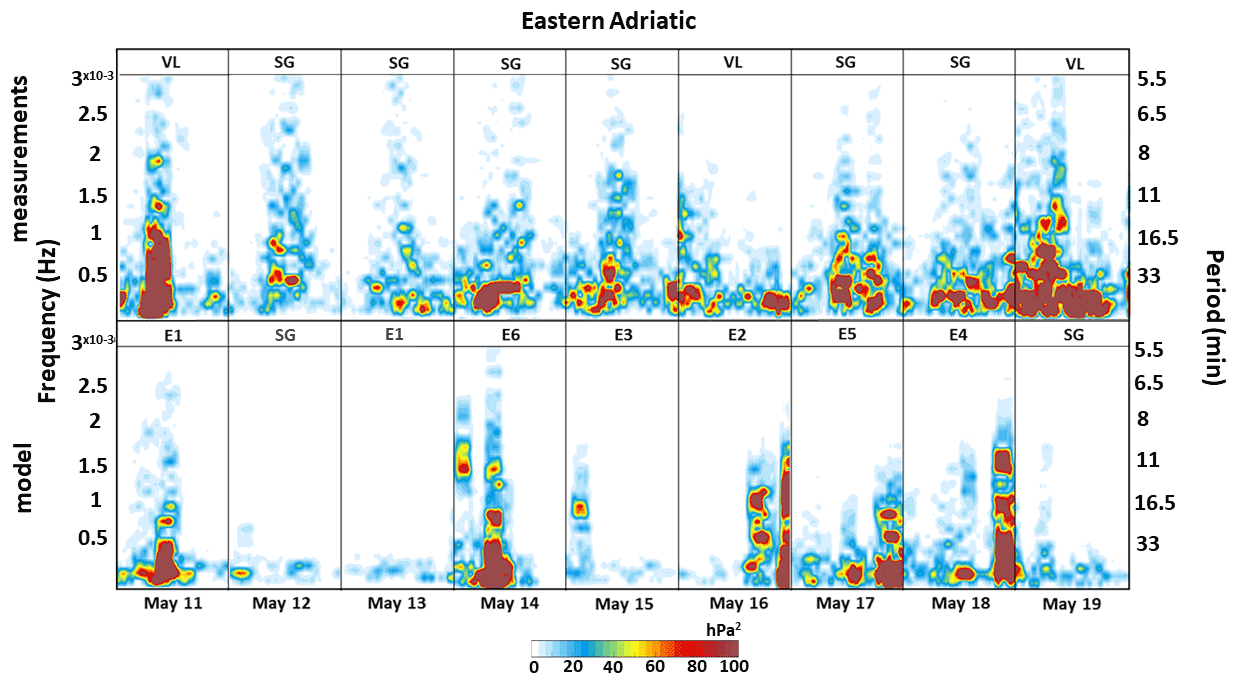
For 11 May, the highest energies from the observed composite are located at Ortona with frequencies below Hz (11 min period) and around Hz (9.25 min period) for the western Adriatic region, at Svetac with frequencies below Hz (16.5 min period) for the middle Adriatic region, and at Vela Luka with frequencies below Hz (15 min period) as well as with Hz (12 min) and Hz (8.8 min) frequencies for the eastern Adriatic region. For this event, the WRF 1.5 km model produces substantially lower energies at the same frequencies as the observed composite at E1, located far northwest from Vela Luka, but with high energies at frequencies up to Hz (15 min period) in the western Adriatic, up to Hz (20.8 min period) in the middle Adriatic, and at Hz (16.5 min period). This implies that the modelled atmospheric disturbances are less energetic and located further north compared to the observed ones.
During the calm period between 12 and 13 May, the energy of the observed spectrograms is much lower than during the meteotsunami events. The model produces extremely low energies for both days in all regions, with high energies at frequencies up to Hz only in Ortona, in the western Adriatic region, on the evening of 13 May.
However, on 14 May, the highest energy values from the observed composite are found at Vieste with frequencies below Hz (24 min period) for the western Adriatic region, at Vis with frequencies below Hz (30 min period) for the middle Adriatic region, and at Stari Grad with frequencies below Hz (33 min period) for the eastern Adriatic region. The highest energies simulated by the model are located at W3 with frequencies up to Hz (9.25 min period) for the western Adriatic region, at Vis with frequencies up to Hz (15 min period) for the middle Adriatic region, and at E6 located south from Stari Grad with frequencies up to Hz (11 min period) for the eastern Adriatic region. It is unlikely that the modelled atmospheric disturbance can travel from W3 to E6 by diagonally crossing the middle Adriatic region. The results are thus probably coming from more than one atmospheric disturbance that occurred during 14 May and changed energies when crossing the Adriatic.
For 15 and 16 May, the energies of the observed composite are higher than during the calm background period (between 12 and 13 May) but lower than during the meteotsunami events. For 15 May, the model produces high energies at frequencies up to Hz (8 min period) at W1 in the western Adriatic region. However, this disturbance does not propagate to the east as the spectrograms in the middle and eastern Adriatic regions have extremely low energy. Energy in the model for 16 May is negligible in the western Adriatic region, but for the middle and eastern Adriatic regions high energies at frequencies below Hz are found at M1 and E2, respectively. In other words, even though the meteotsunami event of 16 May is missed by the AdriSC model (Fig. 2), the WRF 1.5 km model simulates a strong meteotsunamigenic disturbance shifted northwestward compared to the observations.
On 17 May the highest energies from the observed composite are located at Ortona for the western Adriatic region, at Vis for the middle Adriatic region, and at Stari Grad for the eastern Adriatic region. High energies are also found in the modelled composite at up to Hz (7.5 min period) at W4 for the western Adriatic region, up to Hz (9 min) at Svetac for the middle Adriatic region, and up to Hz (16.5 min period) at E5 for the eastern Adriatic region. The spatial layout of the highest-energy points again illustrates the limitations of the applied methodology when multiple disturbances are simulated. Nevertheless, obtained results imply that the different disturbances in the model are more energetic than the ones observed by the microbarographs.
More energy is found in the observed spectrograms for 18 May than during the calm background period but less than during the meteotsunami events. The model, however, produces high energies at high frequencies of about Hz (8 min period) at W6 for the western Adriatic region and Hz (9.5 min period) at E4 for the eastern Adriatic region. The atmospheric disturbance energy at M2 is higher for the middle Adriatic region than for the western and eastern Adriatic regions, particularly for lower frequencies.
Conditions were again more energetic on 19 May, with the highest energies in the observed composite at frequencies up to Hz (11 min period) at Vieste and Vela Luka and up to Hz (13 min period) at Svetac. The model fails to reproduce these disturbances and only simulates high energies at W7, at the southernmost point of the studied area.
Briefly, periods between 10 and 20 min – typical of meteotsunamigenic disturbances – are found to often occur in the analysis of the frequency–time spectrogram composites (Figs. 4 to 6). Additionally, systematic biases exist in the forecasted atmospheric disturbances, as they are often simulated further northwest than the observed ones. Finally, this analysis has demonstrated that the Adriatic high-frequency sea level oscillations of 11–19 May 2020 were induced by atmospheric forcing of diverse spatial and temporal characteristics.
Given the lack of reliability of the deterministic AdriSC model to properly forecast spatial and temporal characteristics of the multi-meteotsunami event during the 11–19 May 2020 period, the warnings released by the CMeEWS would have fully relied on the results of the stochastic surrogate model forced with input parameters extracted from the WRF 1.5 km simulations. The values of the six stochastic parameters – which serve as input for the stochastic surrogate model – are derived from the modelled meteotsunamigenic disturbances. The meteotsunami energy banners, including their impact on the ocean, are thus documented along the selected transects where these parameters are extracted. As described in Sect. 2, the operational sampling criterion (hereafter referred as air pressure variance), the new transect sampling criterion, the atmospheric and ocean spectrograms, and the Proudman resonance along the most energetic transects are displayed in Figs. 7–11 and in the Supplement (Figs. S2–S15) for each day of the multi-meteotsunami event.
For 11 May, the modelled air pressure variances (Figs. 7, S2, and S3, top left panel) and the associated new transect sampling criterion (Figs. 7, S2, and S3, top right panel) indicate maximum meteotsunami energy banners located too far northwest from Vela Luka, Vrboska, and Stari Grad harbours, where the meteotsunami event is observed. Nevertheless, the atmosphere over the two selected transects is highly energetic and the pronounced disturbances travel with a speed between 12.5 and 33.32 m s−1 over relatively shallow areas. Despite the Proudman resonance being possible over a large section of the transects, the energy transferred to the ocean is not substantial anywhere but near the coast.
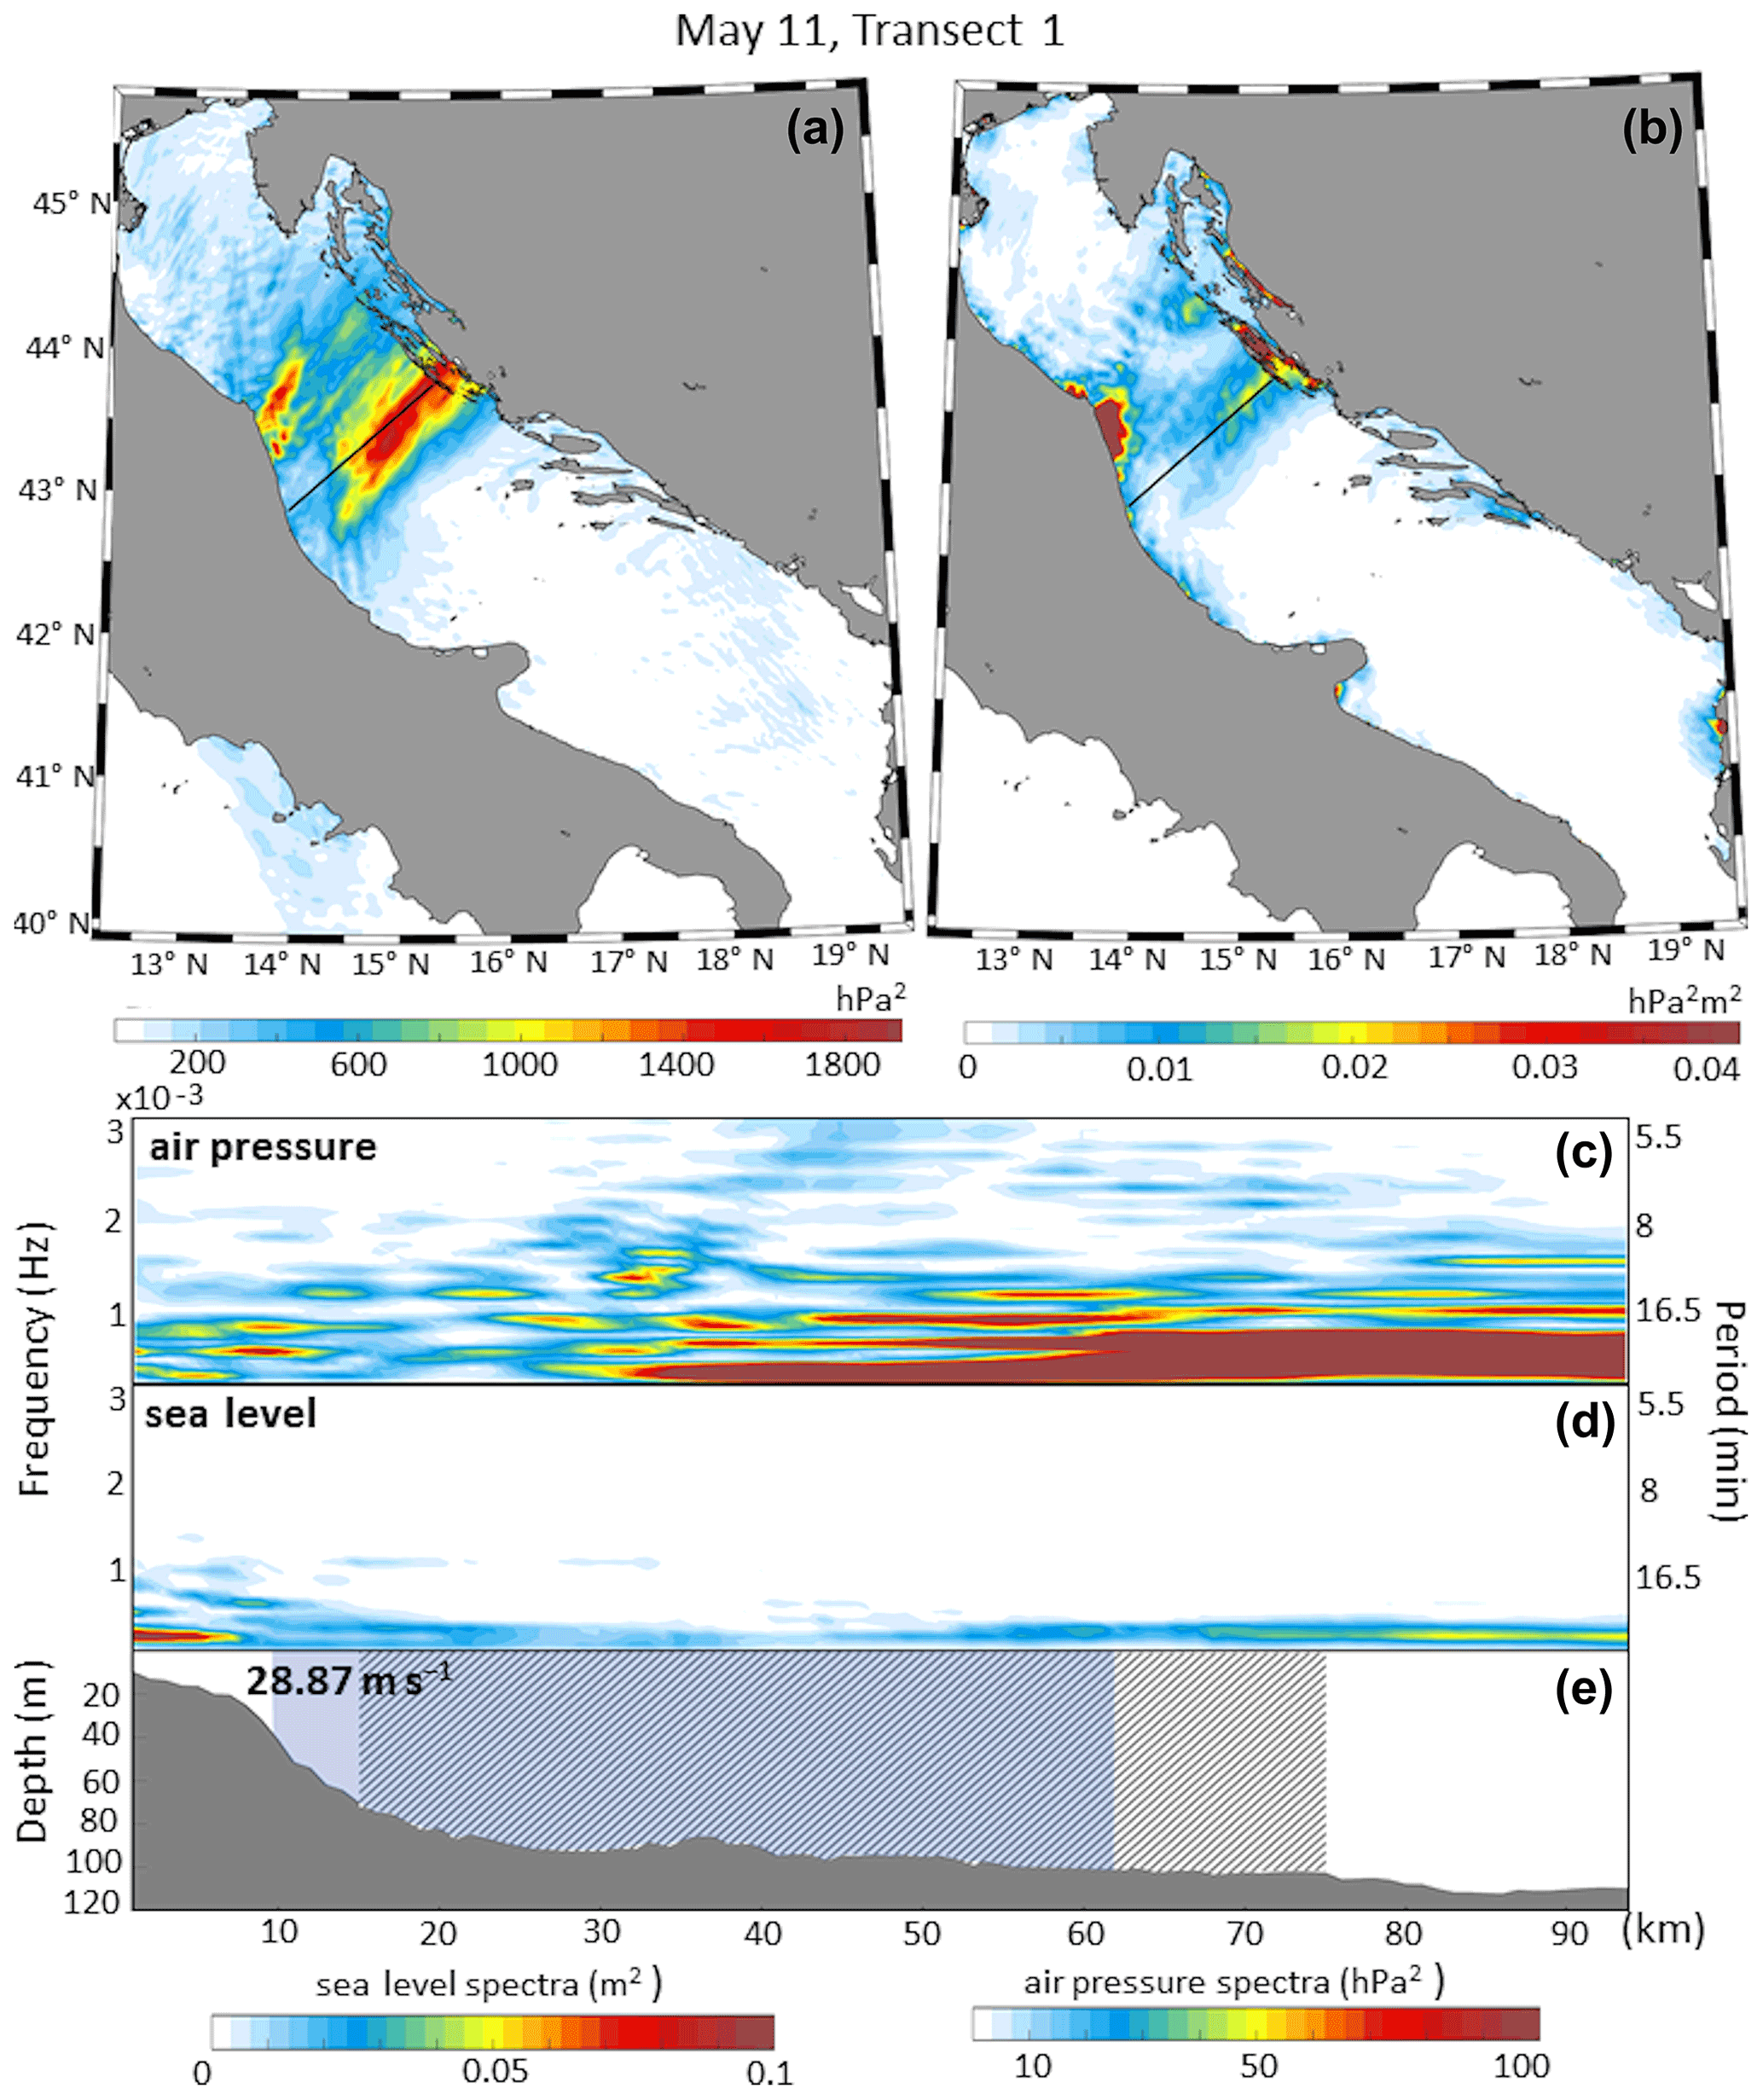
Figure 7Meteotsunamigenic disturbance of 11 May 2020 along Transect 1. The air pressure spatial variance (a) and new transect sampling criterion (b) have a mark on the selected transect containing a meteotsunami energy banner (solid black line). Spectrograms of high-pass-filtered mean sea level air pressure (air pressure) and sea level along the selected transect (c, d) are conjoined by sections of the associated depth profile (e) where the Proudman resonance is likely to occur (shaded with diagonal stripes) and where the speed of the disturbance is calculated (in blue).
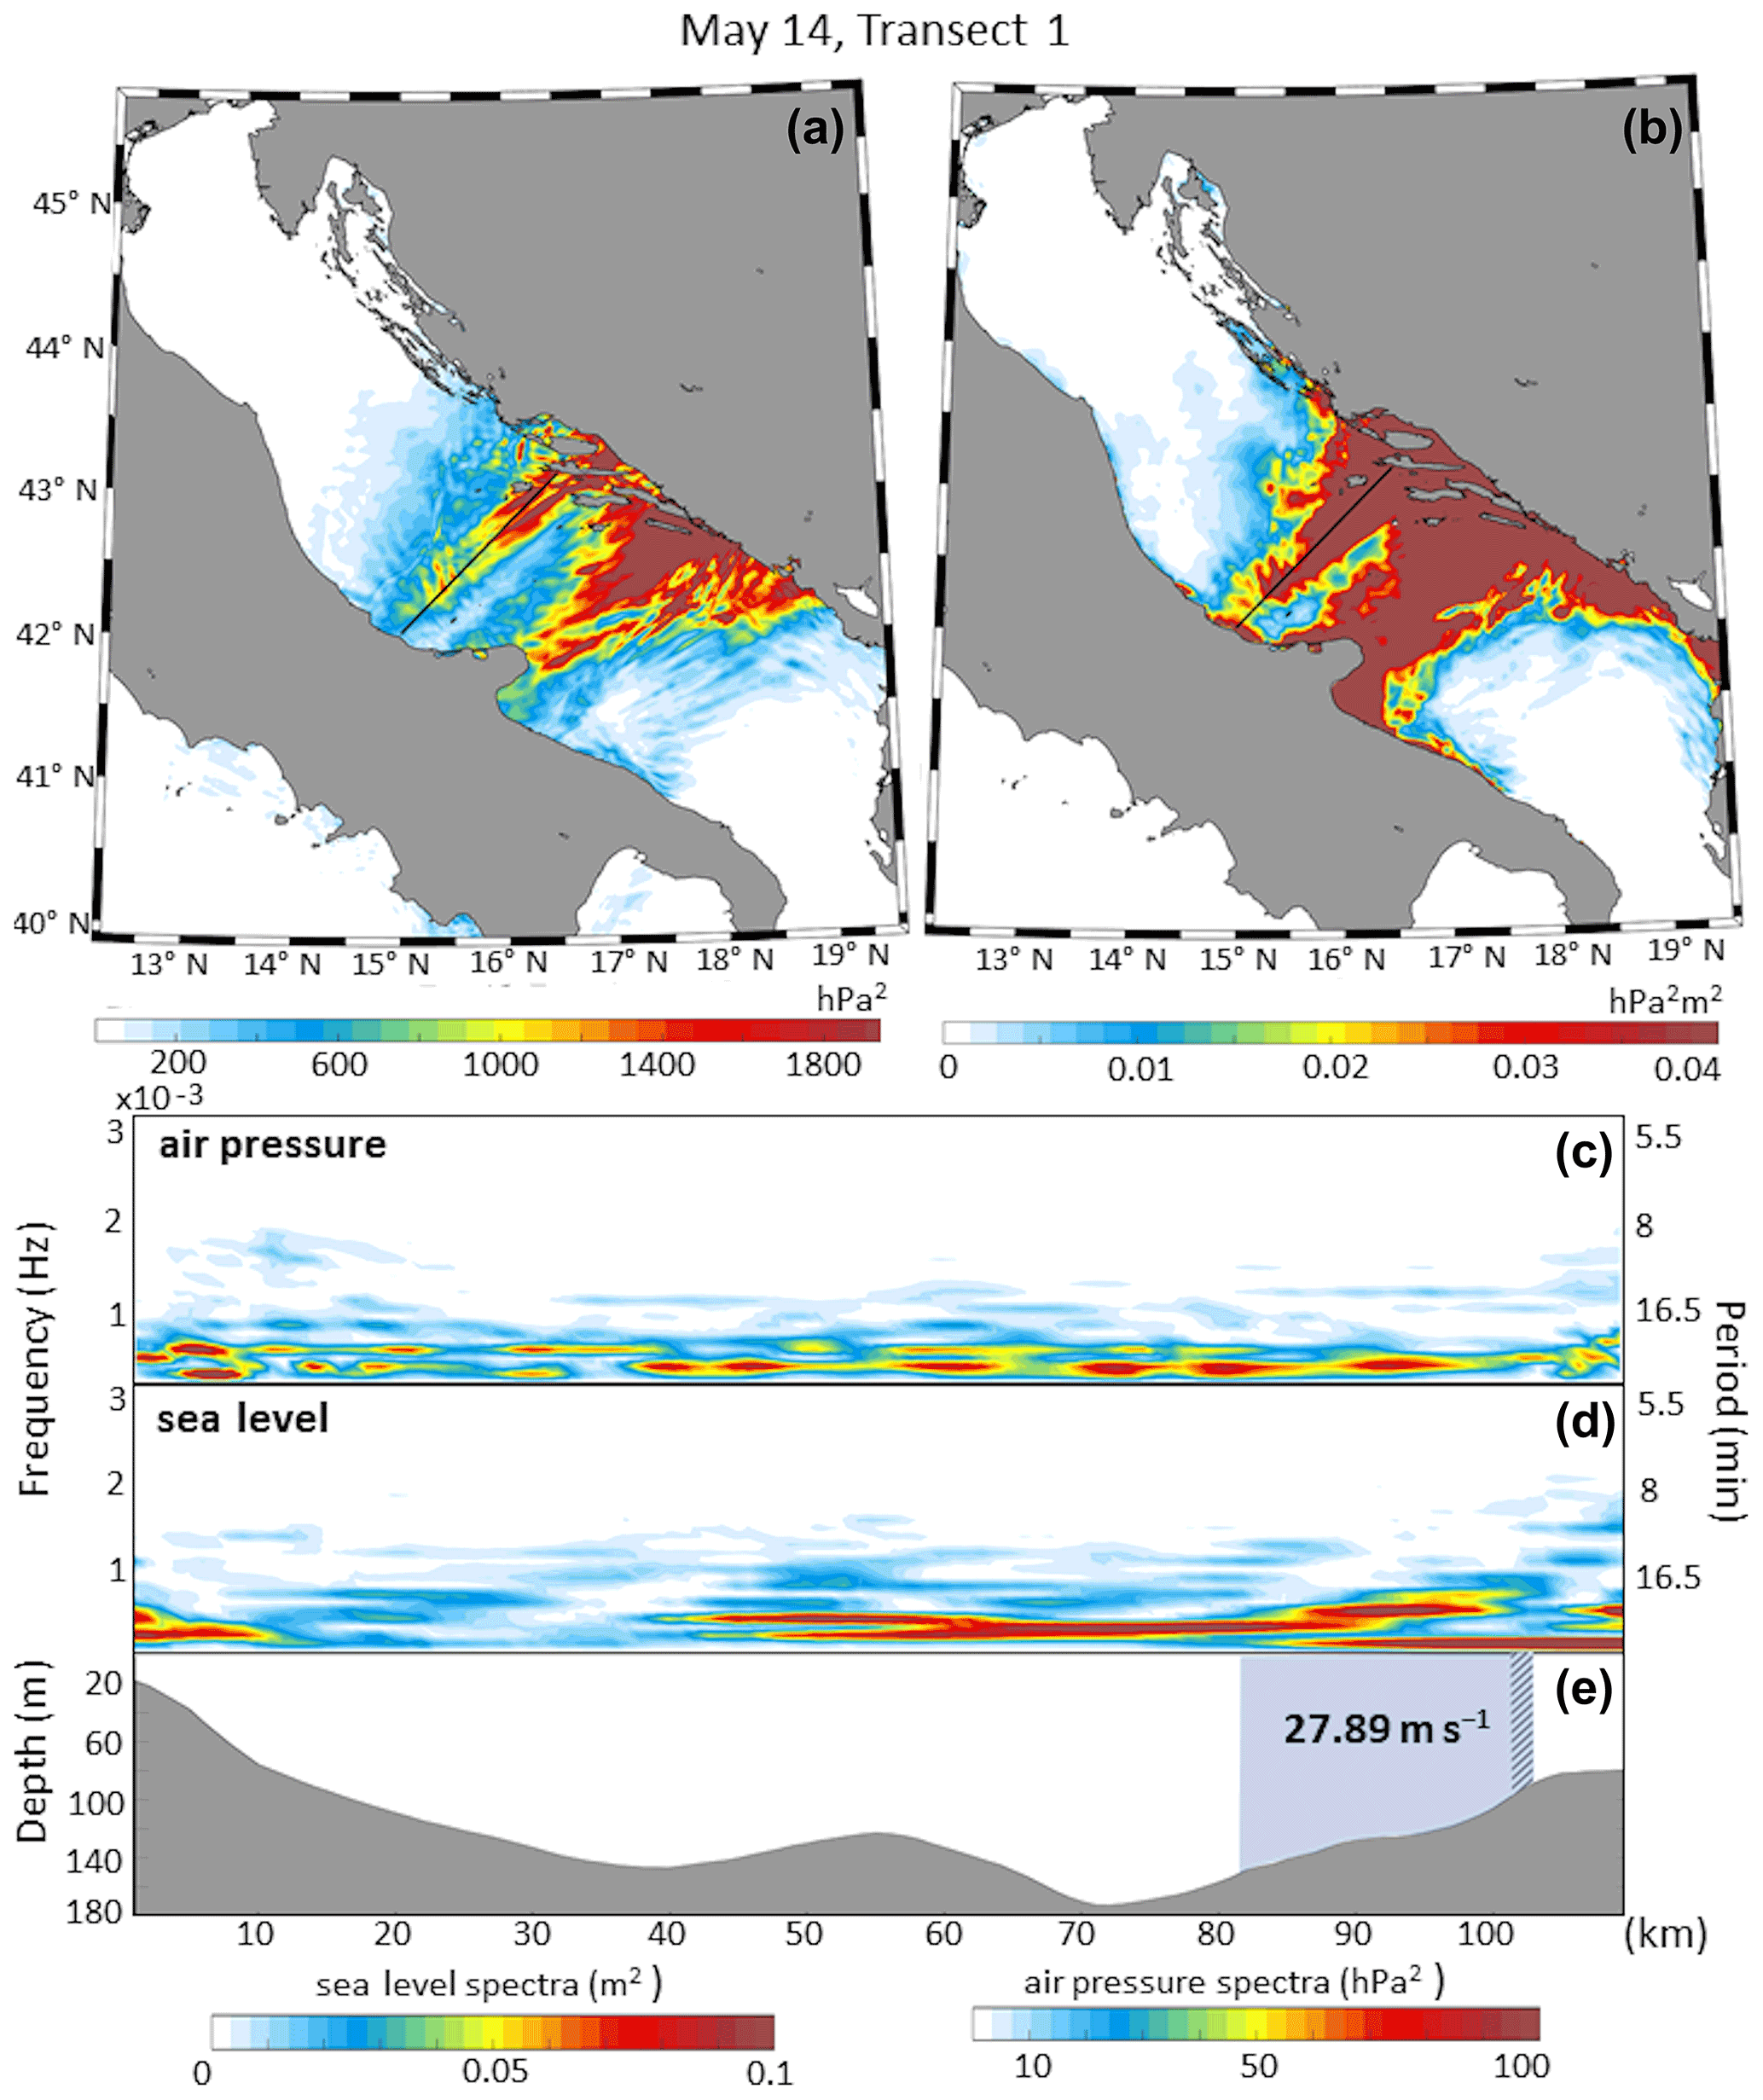
Figure 8As in Fig. 7, but for the meteotsunamigenic disturbance of 14 May 2020 along Transect 1.
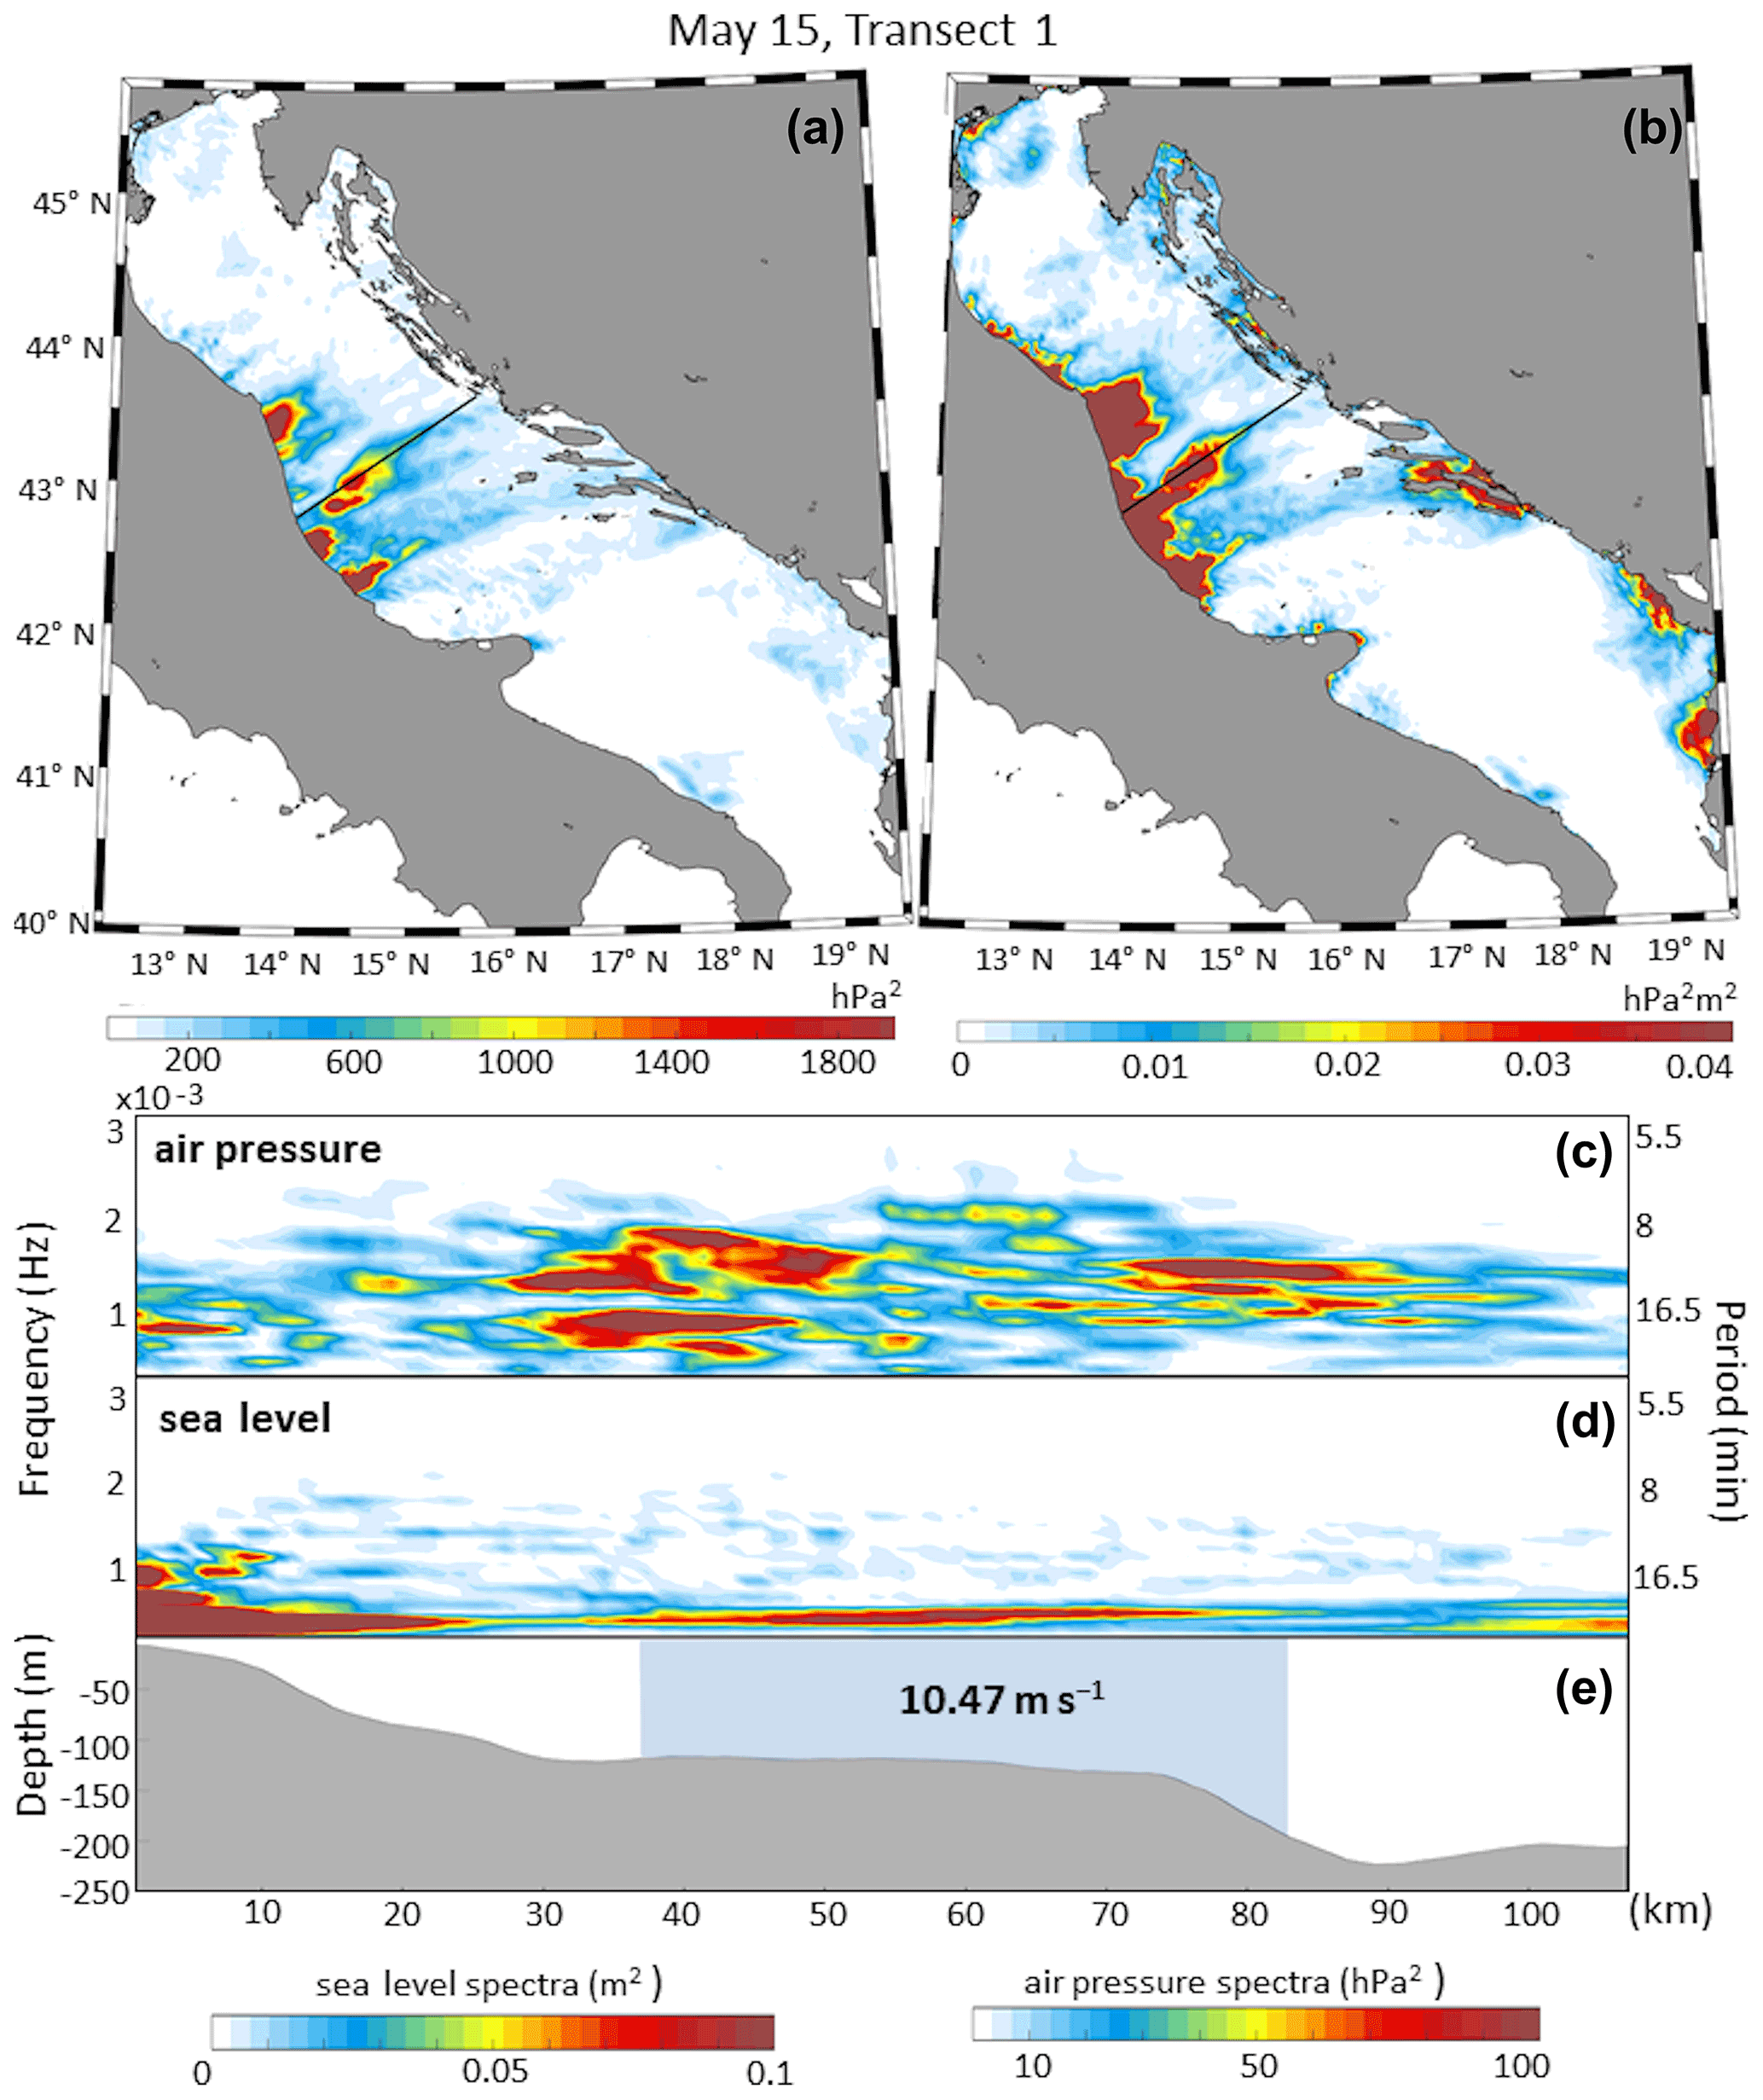
Figure 9As in Fig. 7, but for the meteotsunamigenic disturbance of 15 May 2020 along Transect 1.
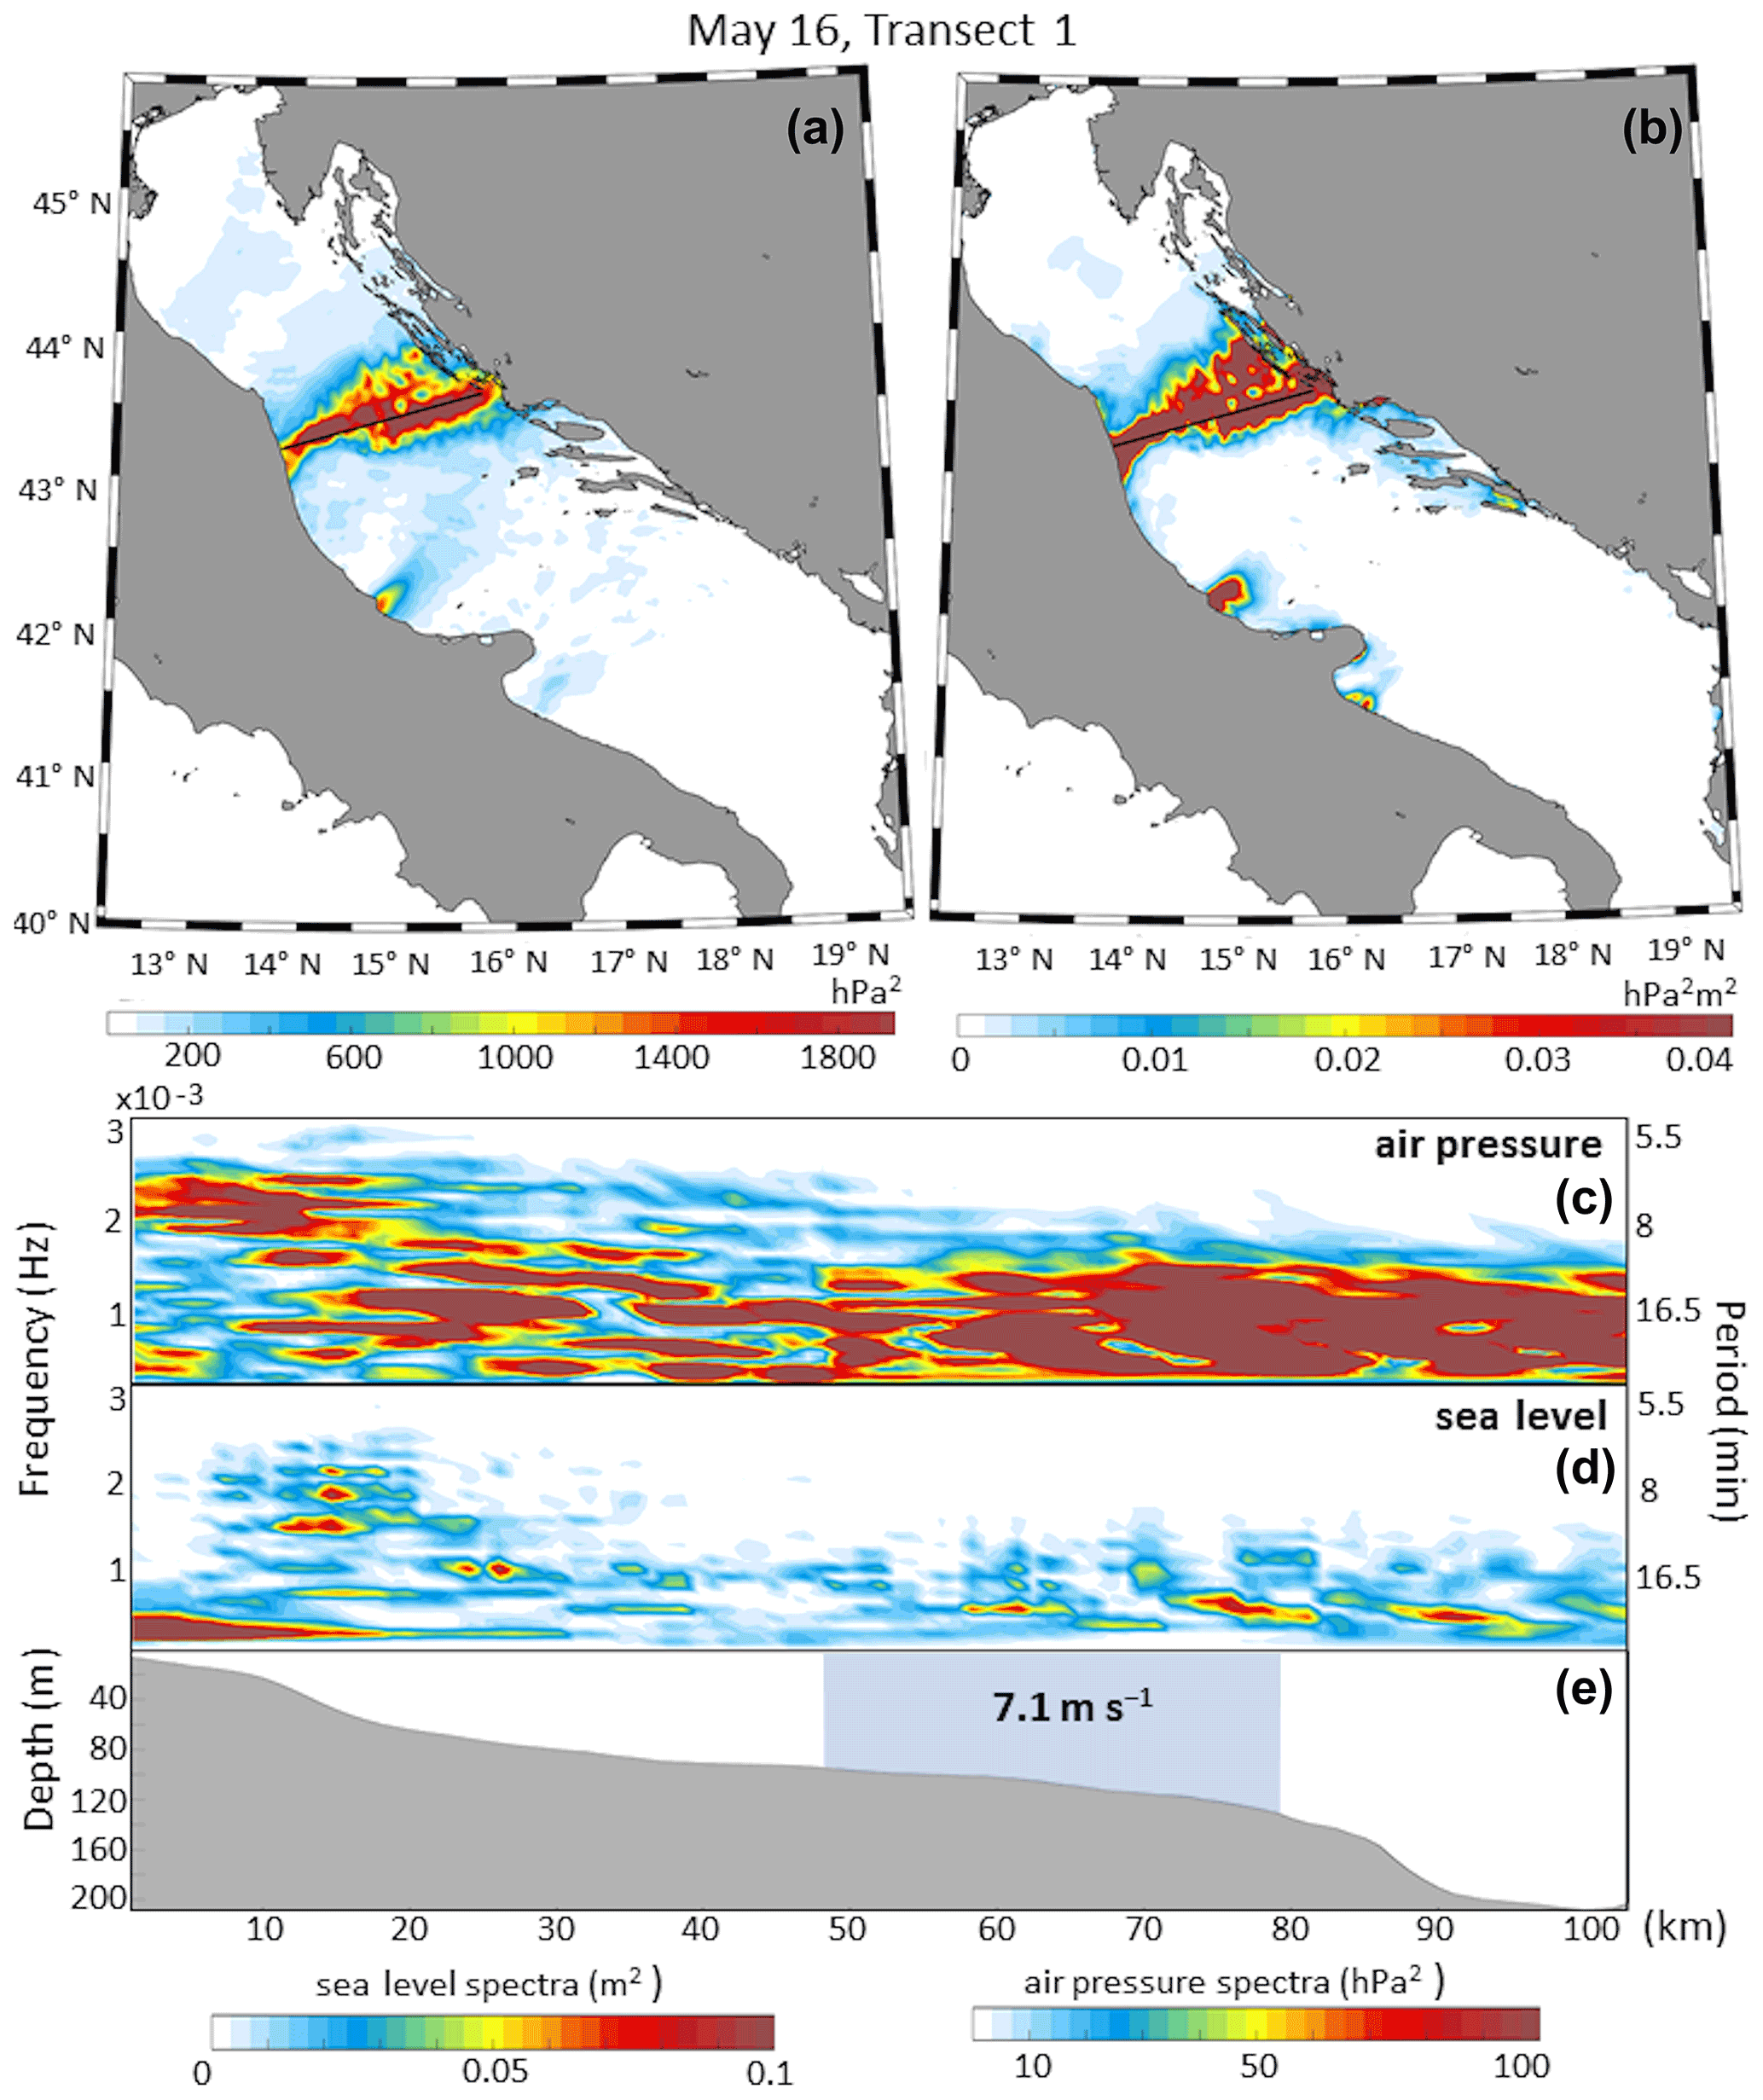
Figure 10As in Fig. 7, but for the meteotsunamigenic disturbance of 16 May 2020 along Transect 1.
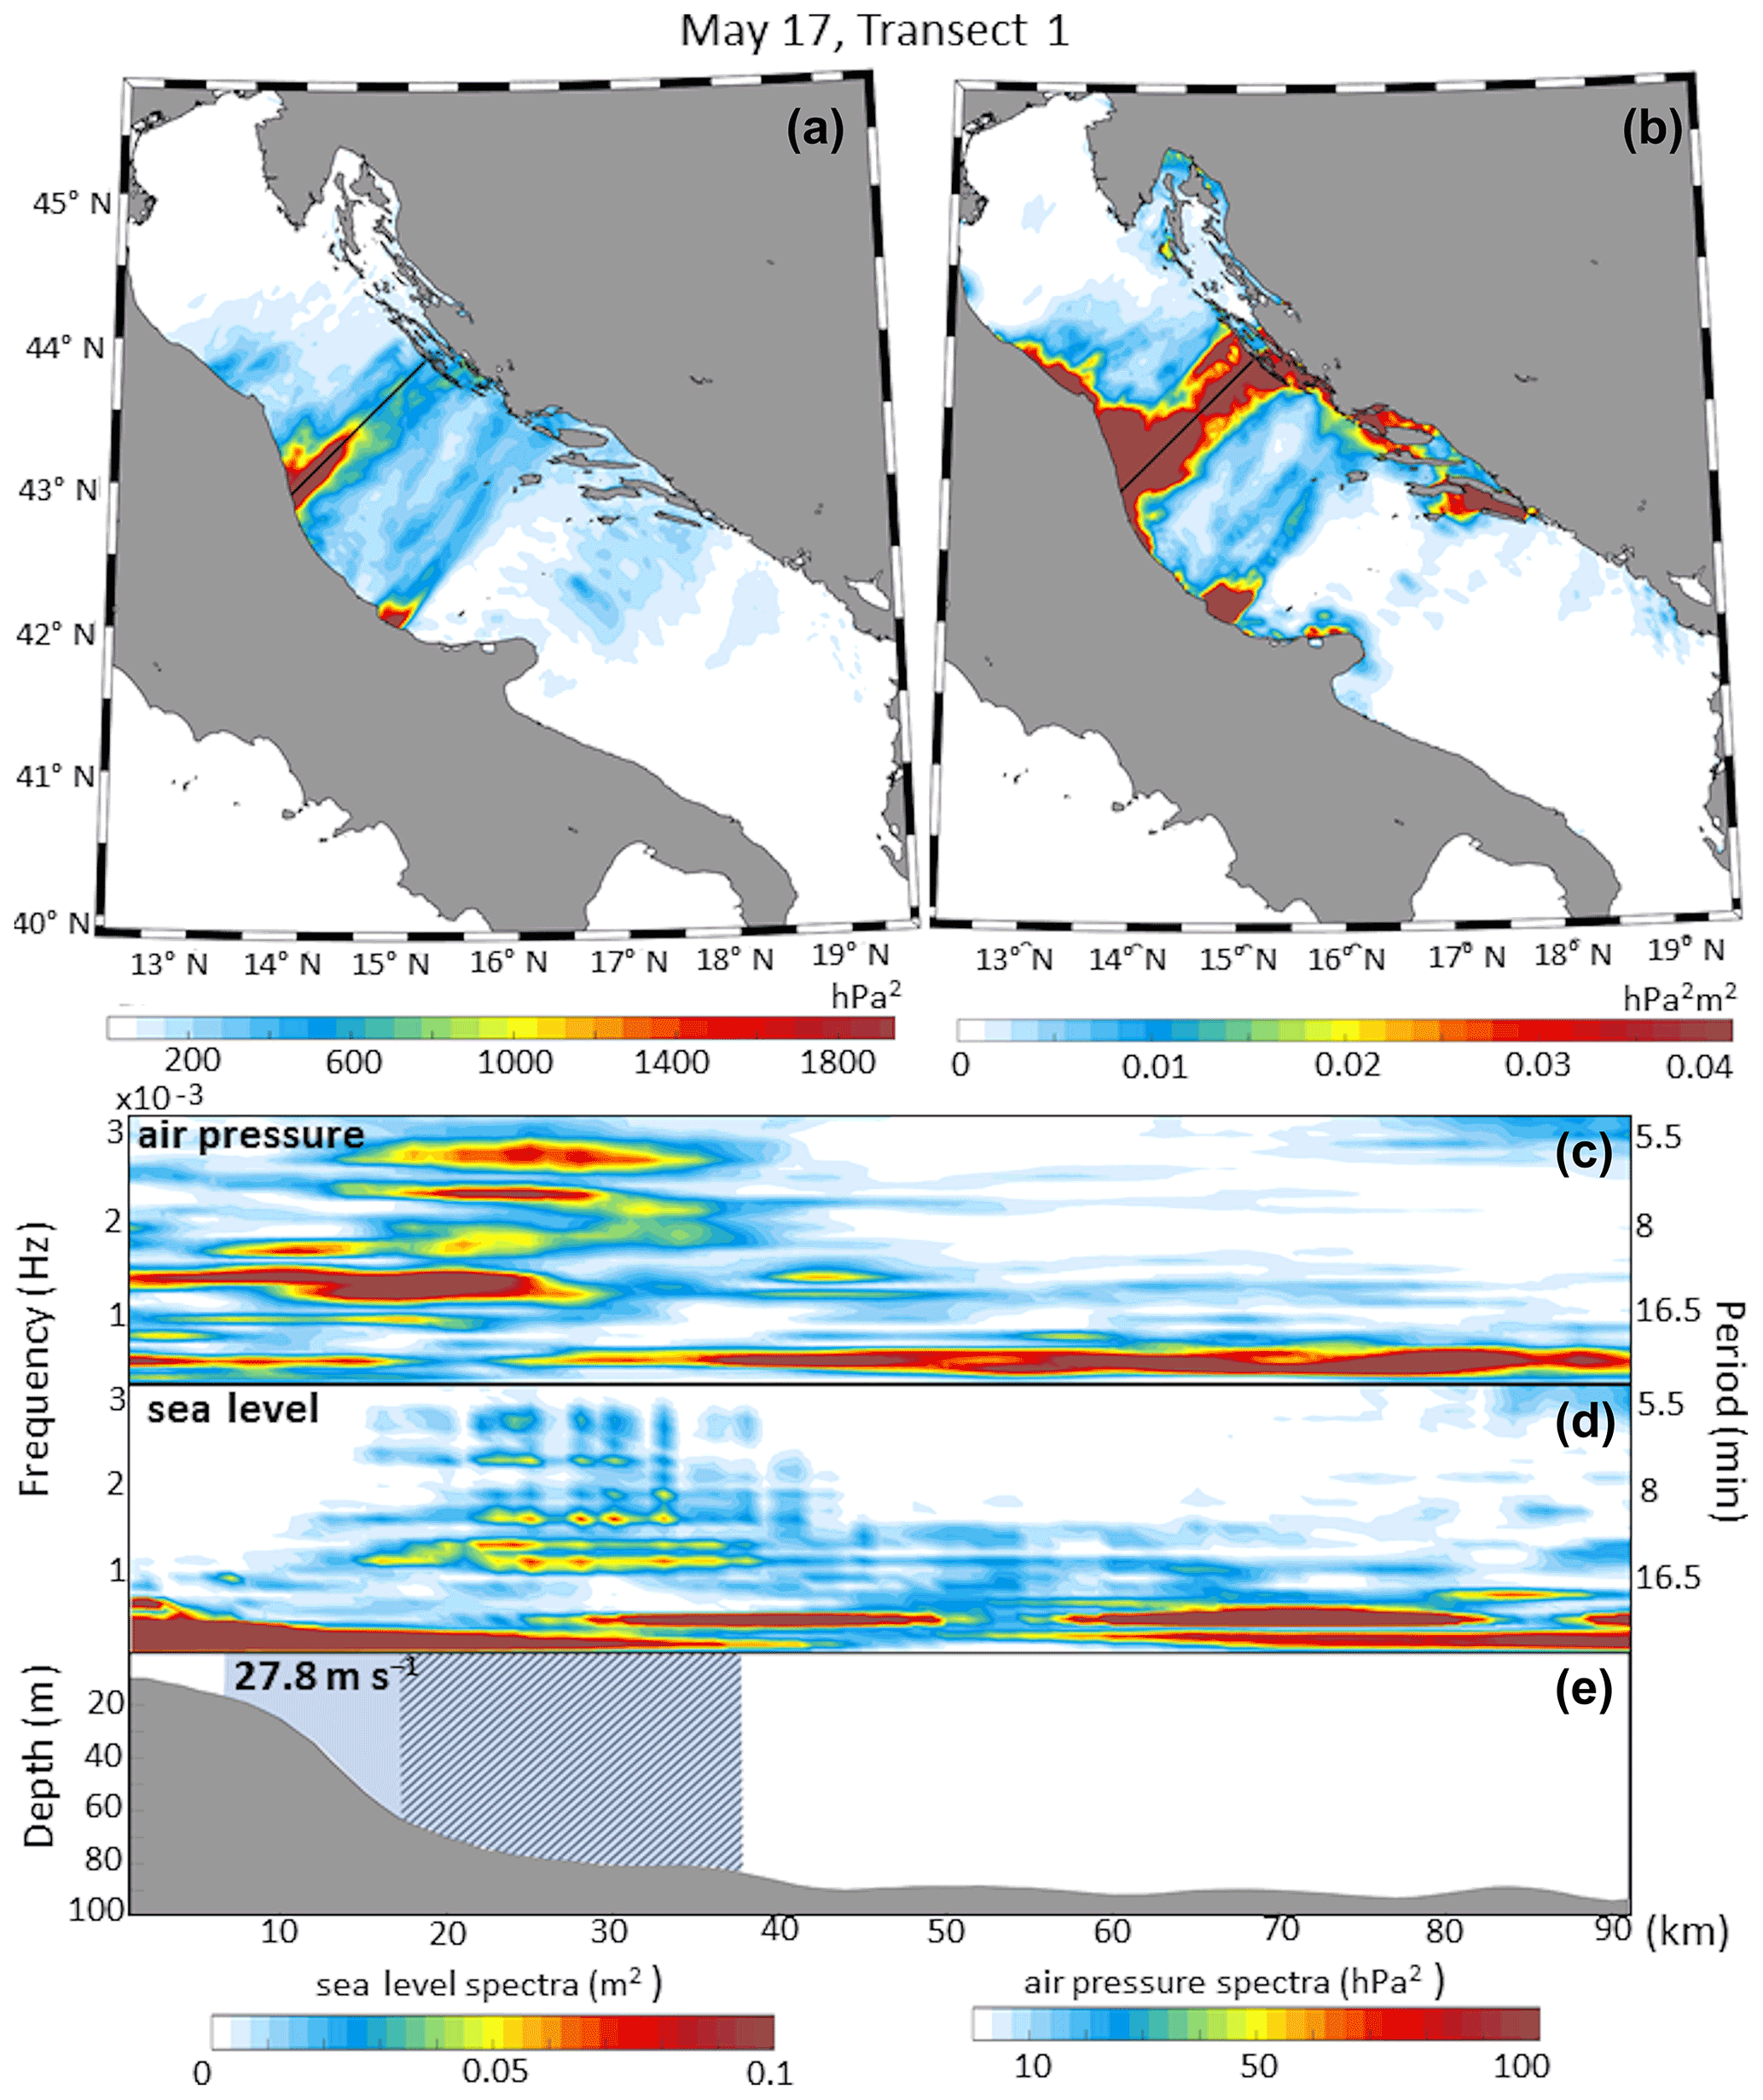
Figure 11As in Fig. 7, but for the meteotsunamigenic disturbance of 17 May 2020 along Transect 1.
For 14 May, several modelled atmospheric disturbances are located in the middle Adriatic region (Figs. 8 and S4–S6 in the Supplement, top left panel). The location of the highest air pressure variances and the associated new transect sampling criterion (top panels, Fig. 8), as well as the speed of the tracked most energetic disturbance of 27.9 m s−1, make this disturbance a good candidate for causing the meteotsunamis that flooded Vela Luka, Vrboska, and Stari Grad harbours on this day. Nevertheless, the transect is in deep water with changing bathymetry, and therefore the Proudman resonance is only likely to happen over a small part of the transect, while other effects, including edge waves, strong topographical enhancement, and refractions on the islands in the pathway of atmospheric disturbances, may be important for the generation of meteotsunami waves in the middle Adriatic (Šepić et al., 2016). Higher energies in the atmosphere, but not in the ocean, can be found on spectrograms of transects in Figs. S4 and S6. These disturbances are located too south or too north of the domain to cause meteotsunamis in the harbours of interest. Also, the speeds of the tracked disturbances in Figs. S4 and S5 are not within the range of speeds of meteotsunamigenic disturbances.
Two atmospheric disturbances are tracked for 15 May and presented in Figs. 9 and S7 in the Supplement. The maximum air pressure variance (Fig. 9, top left panel) and the associated maximum in the new transect sampling criterion (Fig. 9, top right panel) are located too northwest to have caused the Vela Luka and Stari Grad flooding on the night of 15 to 16 May. Also, despite the high energies in the atmosphere, no transfer to the sea can be seen along the transect, being restricted just near the coast. This is probably due to the low speed of the disturbance (i.e. 10.5 m s−1) and the depth (i.e. over 100 m) along the transect. Spectrograms in Fig. S7 display high energies and a strong ocean response at the beginning of the transect but negligibly small energy values on the rest of the transect, which is a good example of a dissipating disturbance. The low speed of the atmospheric disturbance of only 11.6 m s−1 and the lack of flat seabed could explain such behaviour.
Three disturbances are analysed for 16 May and presented in Figs. 10, S8, and S9. Two northwestwardly shifted atmospheric disturbances (Figs. 10 and S8) are extremely energetic, and the transfer of energy to the sea is strong at the beginning of the transects. Speeds of the disturbances, of 7.1 and 11.3 m s−1, are low compared to the normal speeds for meteotsunamigenic disturbances. The southern disturbance (Fig. S9) has a greater speed of 25 m s−1, but the atmosphere is not highly energetic and the transfer of energy to the sea is not strong anywhere but near the coast. This is displayed in the top panels and in spectrograms of Fig. S9. It should be noticed that the air–sea interaction is the strongest over the area where Proudman resonance is likely to happen.
For 17 May, two of three modelled atmospheric disturbances (Figs. S10 and S11) are located where they could have caused meteotsunamis along the eastern Adriatic coastline. However, the speeds of these disturbances, ranging from 10.3 to 12.1 m s−1, are too low and the atmosphere and the sea are not as energetic as they are over the transect analysed in Fig. 11. The atmosphere is extremely energetic over the selected transect and, since energy is well transferred to the ocean, high energies occurred for high frequencies in the ocean too. Spectrograms in Fig. 11 show that ocean's response to atmospheric disturbance is pronounced over the whole transect, but it is the strongest over the section which satisfied the Proudman resonance conditions. The disturbance travelled at 27.8 m s−1, but as seen in the top panels, it is again located in the northern part of the middle Adriatic.
For 18 May, the modelled atmospheric disturbances (Figs. S12–S14) cross the middle Adriatic from southwest to northeast, over the common path of meteotsunamigenic disturbances. Speeds of the tracked disturbances vary from 20.2 to 30.3 m s−1. Even though the atmosphere is energetic for the transects presented in Figs. S12 and S14, the energy of the sea is not significantly higher than for the transect in Fig. S13, with low energy in the atmosphere. Therefore, despite the appropriate speeds and locations of the meteotsunamigenic disturbances, the energy is not well transferred from the atmosphere to the sea and no meteotsunami event is modelled.
For 19 May there is only one modelled disturbance, travelling at 19.4 m s−1 far south of the analysed region (Fig. S15). The energy content of both the atmosphere and the sea is low for the selected transect, but some air–sea interactions take place at the eastern end of the transect (top right panel, Fig. S15).
Averaged air pressure variance and the averaged new transect sampling criterion derived from all the extracted transects between 11 and 19 May 2020 are presented in Fig. 12, together with the selected transects. The transects are classified into four different categories emphasizing the strength of the atmospheric disturbances as well as the energy transfer from the atmosphere to the ocean. The most intense atmospheric activity and air–sea interactions are located across the middle Adriatic region. Additionally, despite relatively low averaged air pressure variances, the averaged values of the new transect sampling criterion are the highest along the Dalmatian islands and the middle Adriatic Italian coastline. These results thus confirm that the intensity of the atmospheric disturbances is less important than the resonance – i.e. appropriate speed, period, and depth along the transects (Denamiel et al., 2020) – and, of course, the bathymetry.
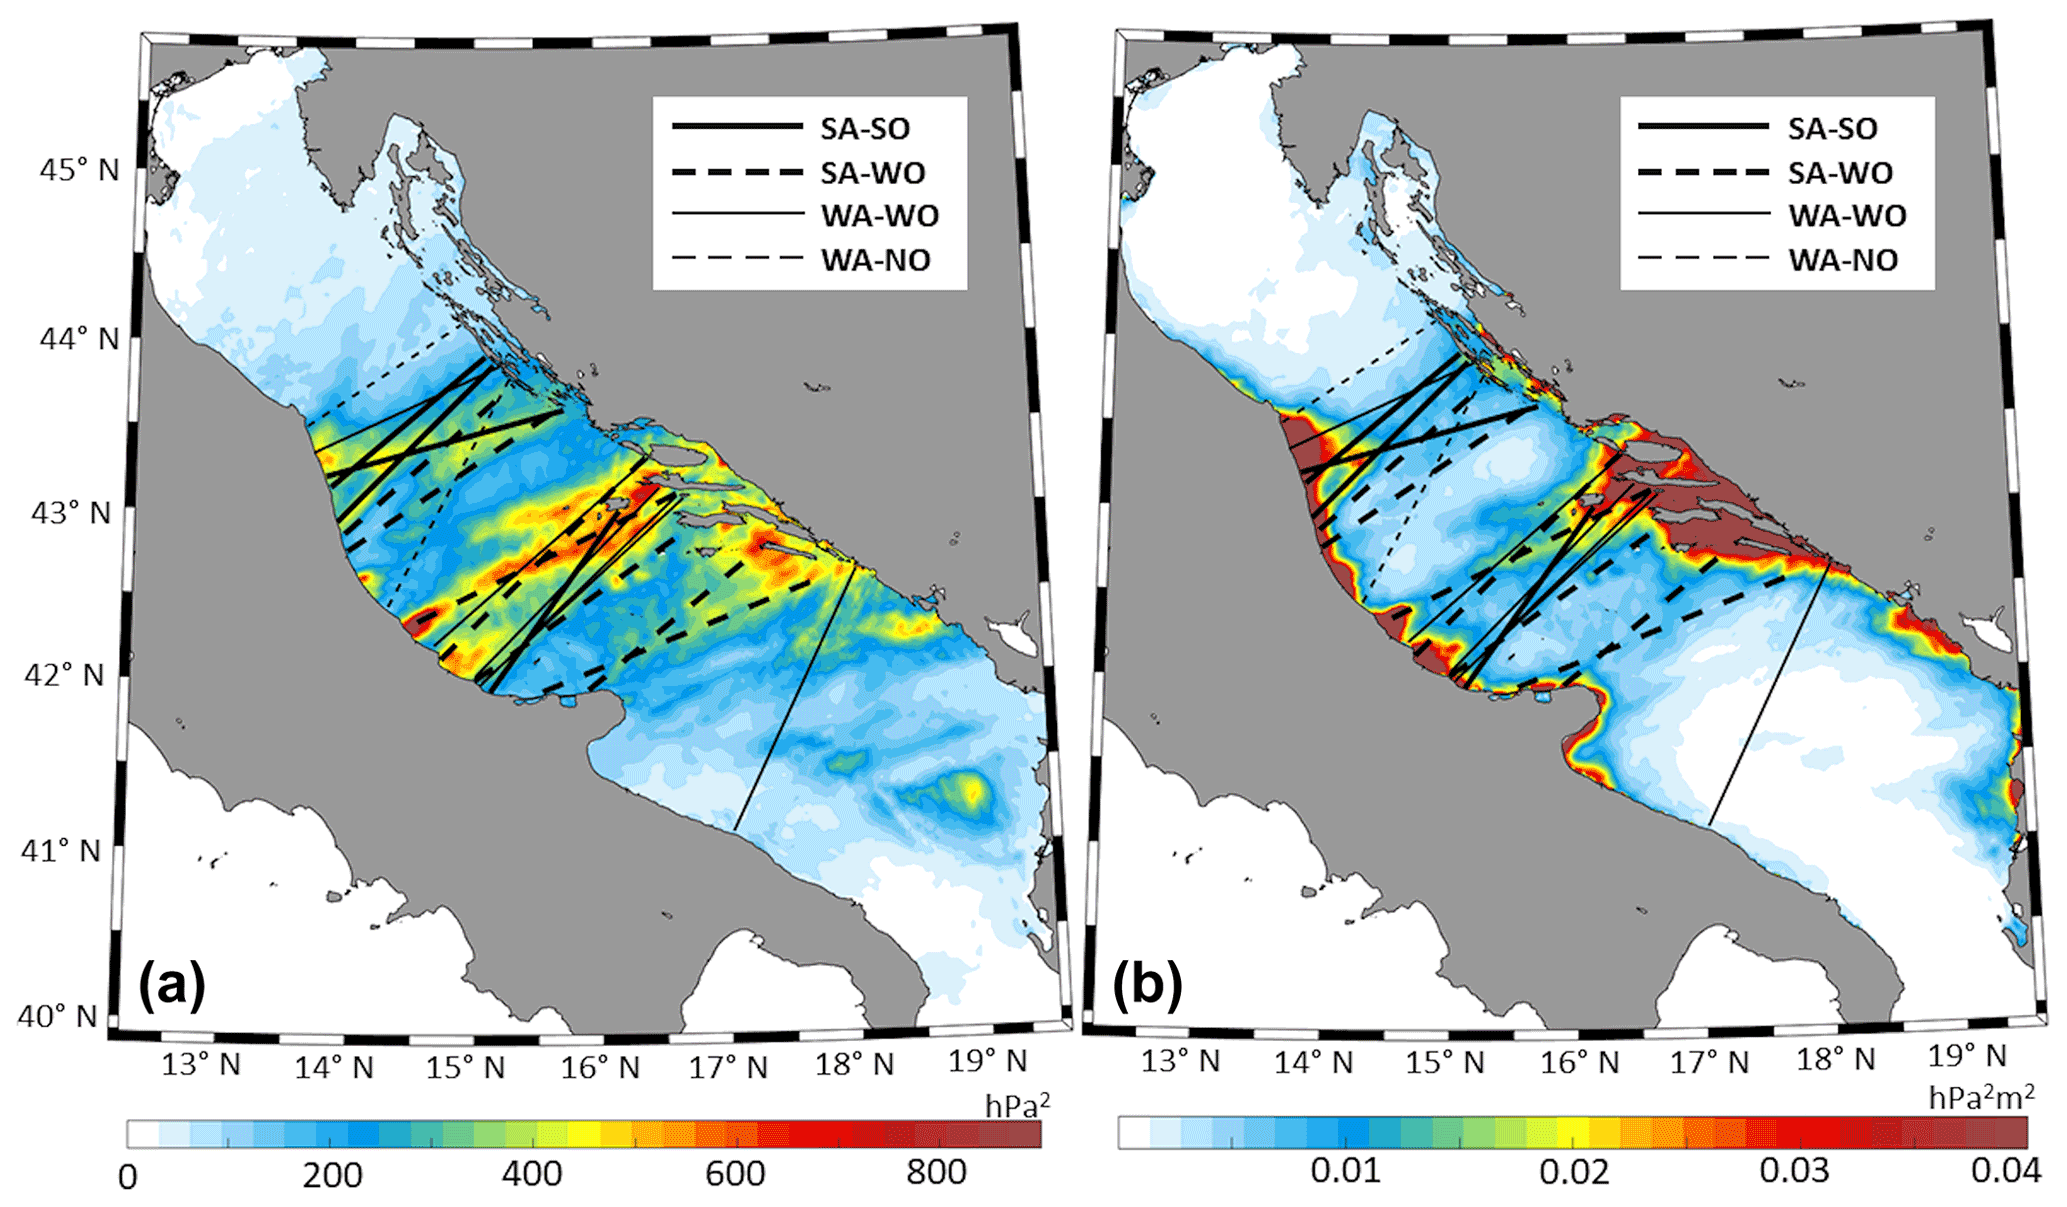
Figure 12Averaged air pressure variances (a) and averaged new transect sampling criterion (b) estimated for the ensemble of transects extracted between 11 and 19 May 2020. The modelled disturbances (black lines) are categorized depending on the strength of the atmospheric signal (SA for strong and WA for weak) and the ocean response (SO for strong, WO for weak, NO for none).
Briefly, the presented results of the travelling air–sea meteotsunami energy banners show that the ocean model response to the atmospheric forcing highly depends on both the location and the frequency of the meteotsunamigenic disturbances, which are in our study often modelled too northwest of the most affected locations. Finally, the introduced new transect sampling criterion does not seem to overall facilitate the decision-making process in terms of the transect selection, since all the transects selected by this criterion would have also been selected following the highest values of air pressure variances only. Even though for some events (e.g. Figs. 9–11) the new criterion highlights the strength of the air–sea interactions, these interactions are located along the same transects as captured by the highest values of the air pressure variance. As efficiency is important in an early warning system, it can thus be concluded that the use of the ocean model results to better select the transect with maximum meteotsunami generation is not necessary in operational mode, since it would be more time-consuming with no significant value added to the process of the transect selection.
Table 2Meteotsunami hazard assessment derived with the stochastic surrogate model and provided as the probability of maximum sea elevation crossing the flooding thresholds in Vela Luka, Stari Grad, and Vrboska during the 11–19 May 2020 period.

Note: when the probabilities are above or equal to 10 % (highlighted in bold), the meteotsunami warning is triggered. In addition, probabilities at locations at which flooding was reported by eyewitnesses during the events are highlighted in italics.
The analysis presented in previous sections has proven that the operational deterministic AdriSC model is not capable of properly reproducing the meteotsunami events of the 11–19 May 2020 period. However, parameters like location, amplitude, direction, speed, period, and width can be extracted from the atmospheric disturbances produced by the WRF 1.5 km model and used as inputs for the stochastic surrogate model. For the 11–19 May 2020 period (with the exception of 12 and 13 May), the stochastic surrogate model is thus run for Vela Luka, Stari Grad, and Vrboska with input variables from the atmospheric disturbances selected for each day along the transects presented in the previous section. The probabilities of the maximum elevation surpassing the flooding threshold are presented in Table 2.
For the 11–19 May 2020 period when flooding and strong sea oscillations were reported for Vela Luka, Stari Grad, and Vrboska (in italics, Table 2), the meteotsunami warning would have been triggered in Vela Luka and Vrboska for all the events, but only for 11 May in Stari Grad. The results found in Stari Grad are, however, in good agreement with the moderate oscillations (amplitude of 25–30 cm) of the high-pass-filtered sea levels extracted between 14 and 16 May at the tide gauge location. Additionally, the meteotsunami warning would have been wrongly triggered on 17 and 19 May in Vela Luka and 15, 16, 17, and 19 May in Vrboska when no flooding was reported. It is worth noticing that, for 17 and 19 May 2020, the forecasted meteotsunamigenic conditions capable of triggering the event mode of the CMeEWS are, in fact, in good agreement with the strong air pressure oscillations observed along the western Adriatic coast (Fig. 2). Additionally, as already shown in Denamiel et al. (2019b), false alarms are easily triggered in Vrboska. This may be linked to either the poor representation of the Vrboska geomorphology within the ADCIRC model used to create the surrogate model or the choice of the flooding threshold and should therefore be further investigated.
In the Adriatic Sea, recurrent meteotsunami events are known to strongly impact the way of life of the coastal communities, particularly in the Dalmatian islands where they can generate serious flooding. In this study, the capacity of the Croatian meteotsunami early warning system (CMeEWS), which provides meteotsunami hazard assessments depending on the deterministically forecasted and measured air pressure disturbances and the stochastically deduced maximum elevation distributions derived with the surrogate model, is examined. As it is no longer operational, the capacity of the CMeEWS is evaluated retroactively for the multi-event of 11–19 May 2020. This event is of particular interest because meteotsunamigenic synoptic patterns over the Adriatic were present during a prolonged period of about 5 to 10 d, which was not previously observed for any meteotsunami. During this period, intense high-frequency air pressure and sea level oscillations were observed and recorded in the middle Adriatic, with maximum sea levels reached on 11, 14, and 16 May in Vela Luka, Stari Grad, and Vrboska.
One of the main originalities of this study is that the performances of the CMeEWS operational models – i.e. the WRF 1.5 km atmospheric model and the ADCIRC ocean model from the AdriSC modelling suite – are assessed via energy banners. Analysis of composites of frequency–time spectrograms has shown that the deterministic models are generally not capable of reproducing the meteotsunami events in affected bays but can produce strong meteotsunamigenic disturbances often shifted northwestward from them. It was demonstrated that, even though the strongest atmospheric activity was modelled in the middle Adriatic along common air pressure disturbance pathways, the meteotsunami events were always missed by the ADCIRC ocean model at Vela Luka and Stari Grad during the 11–19 May 2020 period due to a shift in location of the modelled atmospheric disturbances. This most probably indicates that the frequency of the air pressure disturbances is not properly reproduced by the WRF 1.5 km model, posing the question of the appropriateness of state-of-the-art atmospheric models in terms of their resolution and set-up (Horvath and Vilibić, 2014). Finally, this study also highlighted the fact that using the ocean model results in combination with the atmospheric model results with the so-called new transect sampling criterion does not help to improve the selection of atmospheric conditions needed to feed the stochastic meteotsunami surrogate model. However, due to the systematic error link to the shift of the disturbances towards the north, it may be envisioned in the future to apply a correction concerning the starting point location before using the surrogate model.
Given these results, the following question can be raised: should the ADCIRC ocean model be run in operational mode within the CMeEWS, or should the meteotsunami hazard assessments be derived solely with the stochastic surrogate model? In the presented case, as the deterministic ocean model fails for all events due to a shift in the location of the modelled atmospheric disturbances, the question is easily answered. And, in general, due to the uncertainties associated with operational modelling of meteotsunamigenic disturbances, the stochastic approach has proven to be an optimal option. Nevertheless, the ADCIRC ocean model can still be used for other hazards, such as extreme storm surges associated with wind waves, and not only for meteotsunami events.
Concerning the evaluation of the stochastic model fed by the extracted meteotsunamigenic air pressure conditions along the selected transects, in most of the cases and despite some false alarms, the coastal communities of Vela Luka, Stari Grad, and Vrboska would have been warned of potential meteotsunami events if the CMeEWS had been operational. Even though warning effectiveness highly depends on resident trust, which can be easily eroded due to false alarms and/or missed events, the uncertainty faced by the Croatian coastal communities during the 11–19 May 2020 period and reported by several local newspapers is probably far worse. The meteotsunami surrogate model, even if not perfect due to not including the storm surges in Stari Grad, for example, has thus proven to be extremely useful and reliable for this multi-meteotsunami event.
The complexity of forecasting the precise location, intensity, and speed of the atmospheric disturbances triggering the most extreme sea level events around the world is one of the biggest issues faced by the meteotsunami community. In consequence, different approaches have been recently implemented within the two existing meteotsunami early warning systems in the Mediterranean Sea (Denamiel et al., 2019, Mourre et al., 2020, Romero et al., 2020). To conclude, as operational models often fail to properly forecast extreme events, the continuous development of stochastic approaches – such as the meteotsunami surrogate model within the CMeEWS – described in Denamiel et al. (2021) should be an avenue explored by the extreme sea level community in order to improve early warning systems.
Codes of the COAWST, WRF, and ADCIRC models can be obtained via the following links: https://www.usgs.gov/software/coupled-ocean-atmosphere-wave-sediment-transport-coawst-modeling-system, (Warner, 2021) https://www2.mmm.ucar.edu/wrf/users/download/get_source.html (NCAR, 2021), and http://adcirc.org/ (University of North Carolina of Chapel Hill, 2021).
The model results and the measurements used to produce this article can be obtained under the Open Science Framework (OSF) through the FAIR data repository at https://doi.org/10.17605/OSF.IO/24M8E (Tojčić, 2020).
The supplement related to this article is available online at: https://doi.org/10.5194/nhess-21-2427-2021-supplement.
IV and CD defined the concept and design of the study. Material preparation was done by CD and IT. Set-up of the model and simulations was performed by CD and IT. Production of the figures was done by CD and IT. Analysis of the results was performed by IV, CD, and IT. The first draft of the paper was written by IT. All authors were engaged in commenting on, revising, and polishing the paper. All authors read and approved the final paper.
The authors declare that they have no conflict of interest.
Publisher's note: Copernicus Publications remains neutral with regard to jurisdictional claims in published maps and institutional affiliations.
Special thanks are given for the support of the European Centre for Medium-Range Weather Forecasts (ECMWF) staff, in particular Xavier Abellan and Carsten Maass, as well as for the ECMWF computing and archive facilities used in this research.
This work has been supported by the ADIOS project (Croatian Science Foundation grant IP-2016-06-1955), the BivACME project (Croatian Science Foundation grant IP-2019-04-8542), CHANGE WE CARE (Interreg Croatia–Italy programme), and three ECMWF special projects (The Adriatic decadal and inter-annual oscillations: modelling component; Numerical modelling of the Adriatic–Ionian decadal and inter-annual oscillations: from realistic simulations to process-oriented experiments; and Using stochastic surrogate methods for advancing towards reliable meteotsunami early warning).
This paper was edited by Piero Lionello and reviewed by two anonymous referees.
Anderson, E. J. and Mann, G. E.: A high-amplitude atmospheric inertia–gravity wave-induced meteotsunami in Lake Michigan, Nat. Hazards, 106, 1489–1501, https://doi.org/10.1007/s11069-020-04195-2, 2020.
Belušić, D., Grisogono, B., and Klaić, Z. B.: Atmospheric origin of the devastating coupled air–sea event in the east Adriatic, J. Geophys. Res.-Atmos., 112, D17111. https://doi.org/10.1029/2006JD008204, 2007.
Cooley, J. W. and Tukey, J. W.: An algorithm for the machine calculation of complex fourier series, Math. Comput., 19, 297–301, 1965.
Denamiel, C., Šepić, J., and Vilibić, I.: Impact of geomorphological changes to harbour resonance during meteotsunamis: The Vela Luka Bay test case, Pure Appl. Geophys., 175, 3839–3859, https://doi.org/10.1007/s00024-018-1862-5, 2018.
Denamiel, C., Šepić, J., Ivanković, D., and Vilibić, I.: The Adriatic Sea and Coast modelling suite: Evaluation of the meteotsunami forecast component, Ocean Model., 135, 71–93, https://doi.org/10.1016/j.ocemod.2019.02.003, 2019a.
Denamiel, C., Šepić, J., Huan, X., Bolzer, C., and Vilibić, I.: Stochastic surrogate model for meteotsunami early warning system in the eastern Adriatic Sea, J. Geophys. Res.-Oceans, 124, 8485–8499, https://doi.org/10.1029/2019JC015574, 2019b.
Denamiel, C., Huan, X., Šepić, J., and Vilibić, I.: Uncertainty propagation using polynomial chaos expansions for extreme sea-level hazard assessment: The case of the eastern Adriatic meteotsunamis, J. Phys. Oceanogr., 50, 1005–1021, https://doi.org/10.1175/JPO-D-19-0147.1, 2020.
Denamiel, C., Huan, X., and Vilibić, I.: Conceptual Design of Extreme Sea-Level Early Warning Systems Based on Uncertainty Quantification and Engineering Optimization Methods, Front. Mar. Sci., 8, 562, https://doi.org/10.3389/fmars.2021.650279, 2021.
Dietrich, J. C., Tanaka, S., Westerink, J. J., Dawson, C. N., Luettich, Jr R. A., Zijlema, M., Holthuijsen, L. H., Smith, J. M., Westerink, J. G., and Westerink, H. J.: Performance of the Unstructured-Mesh, SWAN+ADCIRC Model in computing hurricane waves and surge, J. Sci. Comput., 52, 468–497, https://doi.org/10.1007/s10915-011-9555-6, 2012.
Ewing, M., Press, F., and Donn, W. L.: An explanation of the Lake Michigan wave of 26 June 1954, Science, 120, 684–686, https://doi.org/10.1126/science.120.3122.684, 1954.
Hersbach, H., Bell, B., Berrisford, P., Hirahara, S., Horányi, A., Muñoz-Sabater, J., Nicolas, J., Peubey, C., Radu, R., Schepers, D., Simmons, A., Soci, C., Abdalla, S., Abellan, X., Balsamo, G., Bechtold, P., Biavati, G., Bidlot, J., Bonavita, M., De Chiara, G., Dahlgren, P., Dee, D., Diamantakis, M., Dragani, R., Flemming, J., Forbes, R., Fuentes, M., Geer, A., Haimberger, L., Healy, S., Hogan, R. J., Hólm, E., Janisková, M., Keeley, S., Laloyaux, P., Lopez, P., Lupu, C., Radnoti, G., de Rosnay, P., Rozum, I., Vamborg, F., Villaume, S., and Thépaut, J.-N.: The ERA5 Global Reanalysis, Q. J. Roy. Meteor. Soc., 146, 1999–2049, https://doi.org/10.1002/qj.3803, 2020.
Hibiya, T. and Kajiura, K.: Origin of the Abiki phenomenon (a kind of seiche) in Nagasaki Bay, J. Oceanogr. Soc. Jpn., 38, 172–182, https://doi.org/10.1007/BF02110288, 1982.
Horvath, K. and Vilibić, I.: Atmospheric mesoscale conditions during the Boothbay meteotsunami: a numerical sensitivity study using a high-resolution mesoscale model, Nat. Hazards, 74, 55–74, https://doi.org/10.1007/s11069-014-1055-1, 2014.
Jansà, A. and Ramis, C.: The Balearic rissaga: from pioneering research to present-day knowledge, Nat. Hazards, 106, 1269–1297, https://doi.org/10.1007/s11069-020-04221-3, 2020.
Jansa, A., Monserrat, S., and Gomis, D.: The rissaga of 15 June 2006 in Ciutadella (Menorca), a meteorological tsunami, Adv. Geosci., 12, 1–4, https://doi.org/10.5194/adgeo-12-1-2007, 2007.
Linares, A., Wu, C. H., Bechle, A. J., Anderson, E. J., and Kristovich, D. A. R.: Unexpected rip currents induced by a meteotsunami, Sci. Rep., 9, 2105, https://doi.org/10.1038/s41598-019-38716-2, 2019.
Lindzen, R. S. and Tung K.-K.: Banded convective activity and ducted gravity waves, Mon. Weather Rev., 104, 1602–1617, https://doi.org/10.1029/2018JD029523 1976.
Miles, J. and Munk, W.: Harbor Paradox, Journal of the Waterways and Harbors Division, ASCE, 87, 111–130, 1961
Monserrat, S. and Thorpe, A. J.: Gravity-wave observations using an array of microbarographs in the Balearic Islands, Q. J. Roy. Meteor. Soc., 118, 259–282, https://doi.org/10.1002/qj.49711850405, 1992.
Monserrat, S. and Thorpe, A. J.: Use of ducting theory in an observed case of gravity waves, J. Atmos. Sci., 53, 1724–1736, https://doi.org/10.1175/1520-0469(1996)053<1724:UODTIA>2.0.CO;2, 1996.
Monserrat, S., Vilibić, I., and Rabinovich, A. B.: Meteotsunamis: atmospherically induced destructive ocean waves in the tsunami frequency band, Nat. Hazards Earth Syst. Sci., 6, 1035–1051, https://doi.org/10.5194/nhess-6-1035-2006, 2006.
Mourre, B., Santana, A., Buils, A., Gautreau, L., Ličer, M., Jansà, A., Casas, B., Amengual, B., and Tintoré, J.: On the potential of ensemble forecasting for the prediction of meteotsunamis in the Balearic Islands: sensitivity to atmospheric model parameterizations, Nat. Hazards, 106, 1315–1336, https://doi.org/10.1007/s11069-020-03908-x, 2020.
NCAR: WRF Source Code, available at: https://www2.mmm.ucar.edu/wrf/users/download/get_source.html, last access: 16 August 2021.
Neumann, B., Vafeidis, A. T., Zimmermann, J., and Nicholls, R. J.: Future coastal population growth and exposure to sea-level rise and coastal flooding – A global assessment, PLoS ONE, 10, e0118571, https://doi.org/10.1371/journal.pone.0118571, 2015.
Nicholls, R. J. and Cazenave, A.: Sea-level rise and its impact on coastal zones, Science, 328, 1517–1520, https://doi.org/10.1126/science.1185782, 2010.
Orlić, M., Belušić, D., Janeković, I., and Pasarić, M.: Fresh evidence relating the great Adriatic surge of 21 June 1978 to mesoscale atmospheric forcing, J. Geophys. Res.-Oceans, 115, C06011, https://doi.org/10.1029/2009JC005777, 2010.
Pattiaratchi, C. B. and Wijeratne, E. M. S.: Are meteotsunamis an underrated hazard?, Philos. T. Roy. Soc. A, 373, 20140377. https://doi.org/10.1098/rsta.2014.0377, 2015.
Pinardi, N., Allen, I., Demirov, E., De Mey, P., Korres, G., Lascaratos, A., Le Traon, P.-Y., Maillard, C., Manzella, G., and Tziavos, C.: The Mediterranean ocean forecasting system: first phase of implementation (1998–2001), Ann. Geophys., 21, 3–20, https://doi.org/10.5194/angeo-21-3-2003, 2003.
Proudman, J.: The effects on the sea of changes in atmospheric pressure, Mon. Not. R. Astron. Soc. Geophys. Suppl., 2, 197–209, https://doi.org/10.1111/j.1365-246X.1929.tb05408.x, 1929.
Rabinovich, A. B.: Seiches and harbour oscillations. In: Kim YC (eds) Handbook of coastal and ocean engineering, pp 193–236. World Scientific, Singapore, https://doi.org/10.1142/9789812819307_0009, 2009.
Rabinovich, A. B.: Twenty-seven years of progress in the science of meteorological tsunamis following the 1992 Daytona Beach event, Pure Appl. Geophys., 177, 1193–1230, https://doi.org/10.1007/s00024-019-02349-3, 2020.
Renault, L., Vizoso, G., Jansà, A., Wilkin, J., and Tintoré, J.: Toward the predictability of meteotsunamis in the Balearic Sea using regional nested atmosphere and ocean models, Geophys. Res. Lett., 38, L10601, https://doi.org/10.1029/2011gl047361, 2011.
Salaree, A., Mansouri, R., and Okal, E. A.: The intriguing tsunami of 19 March 2017 at Bandar Dayyer, Iran: field survey and simulations, Nat. Hazards, 90, 1277–1307, https://doi.org/10.1007/s11069-017-3119-5, 2018.
Soize, C. and Ghanem, R. G.: Physical systems with random uncertainties: Chaos representations with arbitrary probability measure, SIAM J. Sci. Comput., 26, 395–410, https://doi.org/10.1137/S1064827503424505, 2004.
Šepić, J., Vilibić, I., and Belušić, D.: The source of the 2007 Ist meteotsunami (Adriatic Sea), J. Geophys. Res.-Oceans, 114, C03016, https://doi.org/10.1029/2008JC005092, 2009.
Šepić, J., Međugorac, I., Janeković, I., Dunić, N., and Vilibić, I.: Multi-meteotsunami event in the Adriatic Sea generated by atmospheric disturbances of 25–26 June 2014, Pure Appl. Geophys., 173, 4117–4138, https://doi.org/10.1007/s00024-016-1249-4, 2016.
Skamarock, W. C., Klemp, J. B., Dudhia, J., Gill, D. O., Barker, D. M., Wang, W., and Powers, J. G.: A Description of the Advanced Research WRF Version 2, NCAR Technical Note NCAR/TN-468+STR, University Corporation for Atmospheric Research, Boulder, CO, USA, https://doi.org/10.5065/D6DZ069T, 2005.
Tojčić, I.: Performance of the Adriatic Early Warning System during the Multi-Meteotsunami Event of 11–19 May 2020: An Assessment Using Energy Banners, OSF [data set], https://doi.org/10.17605/OSF.IO/24M8E, 2020.
University of North Carolina of Chapel Hill: ADCIRC user guide, available at: http://adcirc.org/, last access: 16 August 2021.
Vich, M. d. M. and Romero, R.: Forecasting meteotsunamis with neural networks: the case of Ciutadella harbour (Balearic Islands), Nat. Hazards, 106, 1299–1314, https://doi.org/10.1007/s11069-020-04041-5, 2020.
Vilibić, I. and Šepić, J.: Destructive meteotsunamis along the eastern Adriatic coast: overview, Phys. Chem. Earth, 34, 904–917, https://doi.org/10.1016/j.pce.2009.08.004, 2009.
Vilibić, I., Domijan, N., Orlić, M., Leder, N., and Pasarić, M.: Resonant coupling of a traveling air-pressure disturbance with the east Adriatic coastal waters, J. Geophys. Res.-Oceans, 109, C10001, https://doi.org/10.1029/2004JC002279, 2004.
Vilibić, I., Monserrat, S., Rabinovich, A., and Mihanović, H.: Numerical modelling of the destructive meteotsunami of 15 June 2006 on the coast of the Balearic Islands, Pure Appl. Geophys., 165, 2169–2195, https://doi.org/10.1007/s00024-008-0426-5, 2008.
Vilibić, I., Šepić, J., Rabinovich, A. B., and Monserrat, S.: Modern approaches in meteotsunami research and early warning, Front. Mar. Sci., 3, 57, https://doi.org/10.3389/fmars.2016.00057, 2016.
Vučetić, T., Vilibić, I., Tinti, S., and Maramai, A.: The Great Adriatic flood of 21 June 1978 revisited: An overview of the reports, Phys. Chem. Earth, 34, 894–903, https://doi.org/10.1016/j.pce.2009.08.005, 2009.
Warner, J. C.: Coupled Ocean-Atmosphere-Wave-Sediment Transport (COAWST) modeling system, available at: https://www.usgs.gov/software/coupled-ocean-atmosphere-wave-sediment-transport-coawst-modeling-system, last access: 16 August 2021.
Warner, J. C., Armstrong, B., He, R., and Zambon, J. B.: Development of a Coupled Ocean-Atmosphere-Wave-Sediment Transport (COAWST) modeling system, Ocean Model., 35, 230–244, https://doi.org/10.1016/j.ocemod.2010.07.010, 2010.
Xiu, D. and Karniadakis, G. E.: The Wiener–Askey polynomial chaos for stochastic differential equations, SIAM J. Sci. Comput., 24, 619–644, https://doi.org/10.1137/S1064827501387826, 2002.
Zemunik, P., Bonanno, A., Mazzola, S., Giacalone, G., Fontana, I., Genovese, S., Basilone, G., Candela, J., Šepić, J., Vilibić, I., and Aronica, S.: Observing meteotsunamis (“Marrobbio”) in the southwestern coast of Sicily, Nat. Hazards, 106, 1337–1363, https://doi.org/10.1007/s11069-020-04303-2, 2020.
Zsótér, E., Pappenberger, F., and Richardson, D.: Sensitivity of model climate to sampling configurations and the impact on the Extreme Forecast Index, Meteorol. Appl., 22, 236–257, https://doi.org/10.1002/met.1447, 2014.
- Abstract
- Introduction
- Model, data, and methods
- Description of the event and background analysis
- Measured and modelled meteotsunamigenic disturbances
- Meteotsunami energy banners
- Stochastic hazard assessment
- Summary and conclusions
- Code availability
- Data availability
- Author contributions
- Competing interests
- Disclaimer
- Acknowledgements
- Financial support
- Review statement
- References
- Supplement