the Creative Commons Attribution 4.0 License.
the Creative Commons Attribution 4.0 License.
 | 17 Aug 2021
Social sensing of high-impact rainfall events worldwide: a benchmark comparison against manually curated impact observations
Rudy Arthur
Joanne Robbins
Hywel T. P. Williams
Impact-based weather forecasting and warnings create the need for reliable sources of impact data to generate and evaluate models and forecasts. Here we compare outputs from social sensing – analysis of unsolicited social media data, in this case from Twitter – against a manually curated impact database created by the Met Office. The study focuses on high-impact rainfall events across the globe between January–June 2017.
Social sensing successfully identifies most high-impact rainfall events present in the manually curated database, with an overall accuracy of 95 %. Performance varies by location, with some areas of the world achieving 100 % accuracy. Performance is best for severe events and events in English-speaking countries, but good performance is also seen for less severe events and in countries speaking other languages. Social sensing detects a number of additional high-impact rainfall events that are not recorded in the Met Office database, suggesting that social sensing can usefully extend current impact data collection methods and offer more complete coverage.
This work provides a novel methodology for the curation of impact data that can be used to support the evaluation of impact-based weather forecasts.
- Article
(4806 KB) - Full-text XML
- BibTeX
- EndNote


Impact-based weather forecasts are increasingly used by national meteorological and hydrological services to provide advice and warnings about both the likelihood and potential impacts of weather events (Campbell et al., 2018). However, methods to evaluate these forecasts are currently limited due to a lack of reliable, quality-controlled and sustainable sources of impact data. Meteorological agencies have long-established systems to measure and monitor weather variables, which have allowed weather forecasting to develop to its current high level of performance. But evaluating weather impacts depends on measurements of social activities, health and wellbeing, socioeconomic processes and other “human factors”; this kind of measurement lies beyond the scope of traditional meteorology. In this paper, we compare two approaches to the evaluation of weather impacts, i.e. manual curation of impact databases based on news media and direct reporting and “social sensing” of impacts based on social media.
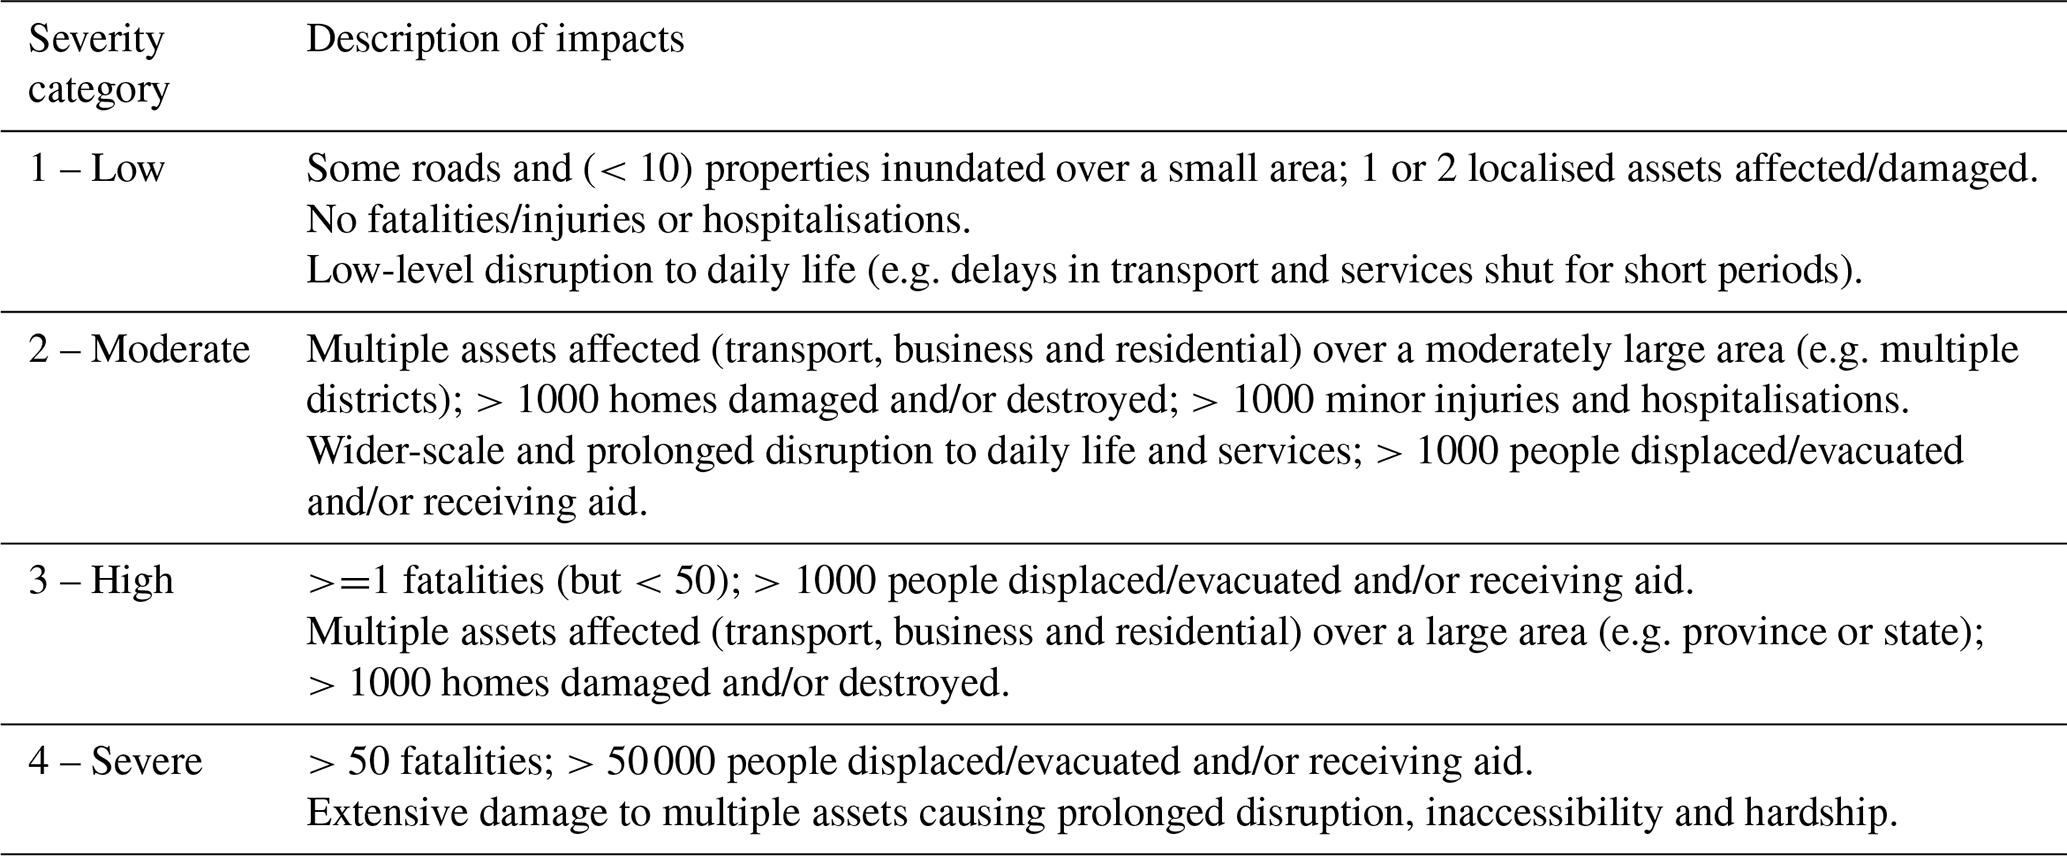
Robbins and Titley (2018) made some initial steps to develop an impact-based evaluation methodology by collating information of global socioeconomic impacts related to heavy rainfall events. These impacts represent the direct and tangible impacts of high-impact weather (e.g. damage to property, loss of life, evacuation and injury and restricted or delayed access to essential services). The community impact database was developed to enable the evaluation of high-impact weather forecasts that are available from the Met Office global hazard map (GHM). The Met Office is the national meteorological service for the UK, providing weather services and contributing to climate science research worldwide (https://www.metoffice.gov.uk/about-us/who, last access: 17 December 2020). The GHM summarises the risk of high-impact weather across the globe for the next 7 d (i.e. weather which can result in significant impacts on safety, property or socioeconomic activity). The community impact database includes information on when and where an impactful rainfall event occurred, as well as a description of the impacts observed, with each event then assigned to an impact severity category. The impact severity category ranges from 1 to 4, where 4 is the most impactful and 1 is the least impactful. There are certain criteria that the impacts of the event must meet for each severity category. Data contained within the database are obtained from a range of online sources across the world, including news, humanitarian and natural hazard websites, in the English language. Collation of the database was labour intensive and required a significant level of manual inspection to extract the relevant temporal, spatial and impact information for each weather event. The data were standardised so that the impact information could be compared with the high-impact weather forecasts provided by the GHM in an automated way. Despite the labour-intensive nature of the process, the authors found the database a good solution to enable impact-based evaluation of high-impact weather forecasts.
There are limited options available for other global databases containing weather impacts against which to compare our methodology. There are databases, such as NatCatSERVICE, produced to record insurance loss as a result of natural catastrophes. However, we would like to consider impacts of extreme weather (i.e. disruption to daily life), which do not necessarily lead to financial loss and which could be missing from this kind of record. ReliefWeb, which is a humanitarian information source on global crises and disasters, is another possible database against which to compare our results; however, this is filtered for disaster events which are most relevant to global humanitarian workers and decision-makers rather than all impactful events. Other available databases relying on citizen input (e.g. the European Severe Weather Database – ESWD) may be limited to certain geographical areas and are unlikely to contain the same level of rigour as the community impact database in terms of criteria for inclusion. Considering the options available to us, the community impact database therefore provides the most comprehensive database against which to compare our methodology.
Related work
A number of studies have explored the use of social media as a source of information about the impacts of extreme weather. Social sensing is an approach developed in recent years to analyse unsolicited social media data to detect real-world events of interest.
While social sensing is not specific to natural hazards and can be applied in a variety of contexts (Liu et al., 2015; Wang et al., 2012, 2019), social sensing has demonstrated usefulness for natural hazard events.
Twitter data were used by Sakaki et al. (2010) to detect earthquakes in Japan, with reports arriving in some locations before the shock had been detected by conventional seismography. Many studies have followed, using a number of different approaches to explore the use of social media as an information source during and following natural hazard events. Some studies have focused on the use of social media to better understand risk communication during an extreme natural hazard event. For example, Stewart and Gail Wilson (2016) explore the use of social media throughout the crisis life cycle during Hurricane Sandy in the USA, building the STREMII model to better understand crisis communication during an extreme weather event; Rainear et al. (2018) used Twitter data collected during Hurricane Joaquin to explore the types of information communicated by state emergency management accounts to better understand the flow of risk communication during a crisis; Bossu et al. (2020) explored the use of crowdsourced information, along with Twitter data, in a bespoke application during the 2019 earthquake in Albania, finding that engagement of users with the app provided much more information about the damage caused as a result of the earthquake than was available using conventional methods.
Other studies have explored the use of social media to better understand the impacts of extreme weather events. Many studies focus on individual events. For example, Fang et al. (2019) use data from the Chinese social media platform, Sina Weibo, during the 2016 Beijing rainstorm, and find a positive correlation between social media activity and precipitation intensity; Sit et al. (2019) examine Twitter data collected during Hurricane Irma, using geo-located tweets to identify locations with a high density of affected individuals and infrastructure damage; and Han and Wang (2019) use data from Sina Weibo during the 2018 Shouguang flood to analyse the changes in the sentiment of social media users during the different development stages of the flood. Further examples of other studies examining the impacts of individual weather events at one particular location include studies relating to specific hurricanes in the USA (Guan and Chen, 2014; Kim and Hastak, 2018; Lachlan et al., 2014; Morss et al., 2017; Niles et al., 2019; Wu and Cui, 2018; Zou et al., 2018) and specific flooding events around the world (Aisha et al., 2015; Brouwer et al., 2017; Cervone et al., 2016; Kankanamge et al., 2020; Li et al., 2018; Rossi et al., 2018).
Some authors have begun to explore the use of Twitter for more wide-scale, specific weather event detection. Arthur et al. (2018) use Twitter data to detect and locate flood events in the UK to produce maps of flood activity. De Bruijn et al. (2019) compare Twitter activity relating to flooding and hydrological information with flood events in the NatCatSERVICE disaster database, finding a good comparison between these data sources. Boulton et al. (2016) use Twitter data collected during several time periods to detect and locate wildfires in the USA. Cowie et al. (2018) find that user reports on Twitter during the year can help to locate peaks in hay fever symptoms as a result of pollen levels in the UK. Furthermore, Spruce et al. (2020) examine Twitter data relating to named storms, wind and precipitation in the UK, finding that it is possible to identify tweets which can be used to assess the impact of storms both temporally and spatially.
In social sensing, each individual in a social network acts as a sensor, and their posts provide pieces of sensor data which can be used to better understand what is happening to or near that individual at a given place and time. Filtering and grouping this information by topic, time or location provides a better understanding of an event through the eyes of a social network. In the context of weather, social sensing can, therefore, be used to determine where, when and how individuals are being impacted by a specific weather event.
This study seeks to build on and expand the scope of previous work to determine if high-impact weather events can be detected without prior knowledge of when or where an event happened. We use the social media platform Twitter to extract tweets from across the world containing key words relating to heavy rainfall and its secondary hazards (e.g. flooding or landslides). We then examine peaks in Twitter activity (relative to the normal level of tweet activity for each location) relating to mentions of heavy rain, flooding or landslides. This is then compared with the Met Office community impact database (Robbins and Titley, 2018), for the same period and hazard focus, to assess the value of socially sensed tweets for impact database development. Rainfall, and its associated secondary hazards, is a good weather type for this kind of evaluation because it occurs in many places across the globe with relatively high frequency. In comparison with other hazards, rainfall-related impacts are generally more widely documented (Robbins and Titley, 2018).
The paper is split into several sections. Section 2 gives detail of social sensing methods used, followed by Sect. 3, which compares outputs of social sensing to the manually curated Met Office database. Section 4 gives some interpretation of the findings and places the work in a broader context.
Most social sensing studies have made use of Twitter data, and we follow this pattern here. Twitter is an online social networking service that enables users to send short, 280-character messages called tweets. It is currently one of the leading social media platforms worldwide, based on active users (Clement, 2020). It provides a platform for users to share and exchange information and news about current events as they unfold in a faster way than traditional media sources (Wu and Cui, 2018). It also encourages the use of text in messages, and data are made freely available via the Twitter developer application programming interface (API). There are still some countries where the use of the internet is not as widespread or where social media is limited to certain platforms. Despite this limitation, however, Twitter is still one of the most prevalent social media platforms across the world and, therefore, is likely to be a good source of information for understanding where people are being affected by extreme weather, and how they are being impacted by it.
The methods used in this paper to gather, filter and locate the Twitter data follow a similar approach to those used in previous social sensing studies (Arthur et al., 2018; Cowie et al., 2018; Spruce et al., 2020). New methods were developed to compare the results of the social sensing of Twitter data with the Met Office community impact data.
2.1 Data collection
2.1.1 Met Office community impact database
The extract of the Met Office community impact database provided for this study included records of high-impact rainfall events from 1 January–30 June 2017. The database was provided as an Excel spreadsheet, which included the following information about each event: impact record date, country in which the impact occurred, along with the nominal location (state and/or province) provided by latitude/longitude, description of impacts observed and media source of information. Additional information was provided where known, including the start and end dates for heavy rainfall events, higher-resolution location (lower administrative division) provided by latitude/longitude and additional hazard information. Each event was also assigned an impact severity category from 1 to 4 to reflect the severity of impacts experienced during the event. Table 1 provides a breakdown of the criteria used for each severity category. As described by Robbins and Titley (2018), the information contained in the database was predominantly obtained from online news and social media, personal correspondence with National Meteorological and Hydrological Services and existing hazard and impact databases. These included specific known sources (e.g. http://floodlist.com, last access: 17 December 2020) and news/social media via internet searches, including terms such as “heavy rainfall”, “flooding”, “landslide”, etc. The data set used in this study contained 519 entries (135 unique events) in the period January–June 2017. Unique events refers to the fact that a single rainfall event can lead to impacts in multiple locations.
Table 1Descriptions of impacts required for each impact severity category related to a heavy rainfall event (adapted from Robbins and Titley, 2018).
2.1.2 Twitter data
To gather the tweet data, English language key words relating to rainfall and the impacts of heavy rainfall were used to query the Twitter streaming API. This API returns all tweets containing the key words from the query, up to a limit of 1 % of the total volume of tweets worldwide at any point in time. The key words used to identify and download relevant tweets using the API were “rain”, “rainfall”, “raining”, “rainstorm”, “flood”, “flooding” and “landslide”. It is unlikely that tweets using these keywords will have reached the global API limit, since rainfall events tend to be widely dispersed in time and space. Based on these considerations and the absence of any obvious artefacts in our time series, we are confident that the API rate limit does not affect our collection (Morstatter et al., 2013).
Tweets were collected during the period 1 January to 30 June 2017 in line with the time period of the sample of the Met Office Impact Database data used for comparison in this study. Each tweet was saved as a JavaScript Object Notation (JSON) object containing the tweet text and a number of metadata fields relating to each tweet (e.g. timestamp, username, user location, geotag, retweet status, etc). The Twitter streaming API searches the whole of the tweet metadata for the search terms requested in the search including tweet text, URLs and usernames. Therefore, collected tweets were filtered to extract only those with one or more of the selected keywords in the tweet text and to remove any duplicate tweet IDs. In total, 44.7 million tweets were collected using this method.
2.2 Filtering Twitter data
Once all tweet data collected using the API for the study period had been extracted, the raw unfiltered data were then passed through a number of filtering steps to remove irrelevant data. Filters were applied in the following order.
2.2.1 Retweets and quotes
Tweets that were duplicates of an original tweet authored by another user and redistributed to their own followers (retweets) and tweets which were posted as a quote from another user's tweet (quotes) were removed using tweet metadata relating to “retweeted status” or “quoted status”. These tweets do not represent original observations; therefore, removing them from the data set prevents any bias in the volume of tweet activity because of secondary public interest in a specific event or location. Though retweets and quotes could provide additional information, their frequency is controlled to a large extent by social network effects, which will be different in different regions, depending on local popularity and differences in the use of Twitter. This filter removed 20.7 million tweets (46 %) from the raw unfiltered collection, leaving 24 million tweets to be passed to the next stage of filtering.
2.2.2 Bot filter
Twitter has many automated user accounts (bots) which are set up to perform a particular function. For example, to collate and post content from a set of sources outside of Twitter, to deliver advertising or to promote a particular issue. These types of tweets are unlikely to contain information relating to the impacts that users have experienced from heavy rainfall and may therefore distort the data set. Therefore, where possible, bot content was removed from the data set. As bot accounts tend to create many more tweets than human users, simple bot filtering was achieved by identifying user accounts which had a disproportionately high number of tweets (using a threshold of >1 % of the total number of tweets in the data set). Any tweet in the data set which was posted by an identified bot account was removed. Manual inspection of tweets during the development of the filtering process identified a number of other bot accounts, which were also removed. The bot filter removed 2.7 million tweets (6 % of the total unfiltered data set), leaving 21.3 million tweets to be passed to the next stage of filtering.
2.2.3 Weather station filter
As the tweet collection in this study is focused on weather-related terms, a high number of weather station tweets were also present in the data set. Some amateur weather stations are set up to automatically post observations to Twitter. As for Twitter bots, weather station tweets, while containing information on the weather conditions at a particular location and time (such as the amount of rainfall), are unlikely to provide any relevant information on the impacts from heavy rainfall (e.g. damage or disruption). Therefore, any weather station tweets not picked up by the bot filter described above required an additional weather station filter to remove them from the data set. Many of these tweets follow a fixed structure (for example, “06:30 AM Temp: 53.0 ∘F (12 ∘C) Hum: 91 % Wind: 7.0 mph (11 kph) N Bar: 29.530 in (1013 mb) Rain: 0.09 in (2.3 mm)”), and therefore, the majority can be identified by searching for multiple occurrences of meteorological terms and units. Any tweet with three or more of any combination of weather terms and/or units was therefore removed from the data set. A randomised sample of tweets removed using this filter was checked to ensure that no tweets that were not weather stations were removed using this filter. The weather station filter removed 4.7 million tweets (11 % of the total unfiltered data set), leaving 16.6 million tweets to be passed to the next stage of filtering.
2.2.4 Phrase filter
Another issue with the collection of tweets containing weather-related keywords is the use of weather terms in phrases and figures of speech which are not related to the weather. For example, “floods of tears”, “rain check”, “raining offers”, “winning by a landslide”, etc. Other terms found to be present in irrelevant tweets are also removed. These are generally political in nature and include terms such as “election”, “vote”, “trump”, “labour”, “migration”, etc. Song titles containing the key words were also removed, for example Purple Rain, Singing in the Rain, etc. Applying the phrase filter removed 1.3 million tweets (3 % of the total unfiltered data set), leaving 15.3 million tweets to be passed to the final stage of filtering.
2.2.5 Machine learning filter
Although the previous stages of filtering removed many irrelevant tweets, manual inspection of remaining tweets found that there were still a large number that contained the keywords but that were not relevant to rainfall or the impacts of heavy rainfall. These included warnings about forecasts of rainfall, business advertising, links to articles on other topics and various other irrelevant content. Therefore a naïve Bayes classifier, found to be successful in other studies (Arthur et al., 2018; Cowie et al., 2018; Spruce et al., 2020) for the filtering of tweet content, was employed.
A set of 5434 tweets were randomly selected from the filtered data set of tweets remaining after the phrase filter (Sect. 2.2.4). Each tweet in this random set of tweets was manually inspected and labelled as relevant or irrelevant. A tweet was marked as relevant based on the criteria that the tweet had to relate to rainfall that was currently happening, had happened recently or was about the impacts of rainfall experienced recently. Everything else was marked as irrelevant. For example, “Rain destroys 60 buildings in Ondo” would be marked as relevant whereas “Rain expected in Ondo tomorrow” would be marked as irrelevant. In total, there were 1316 tweets marked as relevant and 4118 tweets marked as irrelevant.
The labelled data set was then used as training data for a multinomial naïve Bayes classifier. As a first validation test for this approach, 25 % of the data were held back as a validation set, and a classifier was trained on the remaining 75 % of cases; this classifier had an accuracy (i.e. correctly identified the relevance/irrelevance) of 90 % on the held-back validation tweets, with an F1 score of 0.88. As a second test, to confirm the robustness of the approach, the same training/validation test was repeated with sixfold cross-validation. The results of each test were combined to give an overall mean F1 score of 0.89, and the summed confusion matrix (also known as “contingency table”) is shown below (where True is relevant, and False is irrelevant), as follows:
This confusion matrix shows an overall accuracy of 95 %, with most tweets in the filtered data set classified as not relevant. Accuracy was higher for the False class ( %) than the True class ( %). This could be attributed to the training data set being unbalanced and biased towards irrelevant tweets. Overall, the results of the machine learning filter testing indicate good performance.
The machine learning filter removed 10.4 million tweets (23 % of the total unfiltered data set), leaving 4.9 million tweets (11 % of the total unfiltered data set) for further analysis.
2.3 Location inference
Typically, only ∼1 % of tweets collected using the Twitter developer API using keywords contain the geo-coordinates needed to determine the specific location of a tweet, while a further 2 %–3 % contain specific place coordinates (Dredze et al., 2013). Therefore, even after filtering for relevance, determining the location of a tweet collected in this way requires further processing to determine where in the world it originated from, or relates to, in a process of location inference.
The 4.9 million tweets remaining after the relevance filtering stages were further processed to see if location could be identified using information contained within the tweet. The location of the tweet is important in understanding where in the world the rainfall event had taken place or was taking place. We chose to work at a geographic resolution of GADM (the database of global administrative areas) level 1 units, which are sub-national administrative regions (e.g. USA states, UK countries and Australian states). This choice is a balance between fine-scale resolution and having enough tweet data in each unit to give meaningful outputs; it is also the resolution at which the Met Office impact database was aggregated for evaluation against weather forecasts.
We found that 2 % of tweets contained specific geo-coordinates of the tweet origination (geotag) and a further 5 % contained the coordinates for the place a user designated in the Twitter application when posting the tweet (place). However, this left 3.7 million tweets without specific location coordinates. As these tweets would very likely contain relevant information relating to the impacts of a rainfall event, it was important to try to determine the location of the tweet so that the information contained within the tweet could be used. Therefore, a location inference process was used for each remaining tweet to see if location could be determined either from the location given in the user profile (user location) or place name detected in the tweet text. The steps taken in the location inference process are as follows.
2.3.1 Country filter
Place names alone, without any other information, such as a country or state name can often apply to more than one country. For example York (UK and Canada), London (UK and Canada), Pasco (USA and Peru), etc. Therefore, an initial filter was created to identify the country associated with a place name. For some countries, place names in the text commonly follow a specific pattern or use certain abbreviations. For example, in the USA, Canada and Australia, users often put a place name followed by a 2 – character or 3 – character abbreviation for the state (e.g. Los Angeles, CA; Vancouver, BC; Sydney, NSW). Text scanning for place names was extended to look for the “place name, state abbreviation” template and the names/abbreviations of states and/or country name for USA, Canada or Australia. Where a country or state could be identified in this way, any further location inference steps only checked for place names in that particular country. This disambiguation step gave much better location performance overall and computational efficiency benefits.
2.3.2 Gazetteer look-up
This filter checked the tweet to determine if a discernible place name could be detected from the user location and/or the tweet text using gazetteers, including GeoNames (GeoNames, 2020) and DBpedia (DBpedia, 2020). The following methodology was applied to each tweet which did not contain geo or place coordinates as described in Sect. 2.3 above.
-
GeoNames was used as our primary source of gazetted features as it is a geographical database with information about all countries with over 8 million places, such as cities and points of interest. Where there was no match found in the GeoNames database, the DBpedia database was used.
-
Where a match to a place name is found, a set of co-ordinates or bounding boxes from the gazetteer database is returned.
-
Where locations were found in both the user profile and tweet text, place names in the tweet text are preferred, as they are more likely to relate to the subject of the tweet.
-
In a small number of cases, the user profile location and tweet text locations may differ; in that case, the place determined from the tweet text is given more weight during the location inference process.
-
Where multiple matches to a place name were found in GeoNames (i.e. where a place name exists in more than one country), if there was no reference to the country elsewhere in the tweet or the country had not already been determined by the country filter described in Sect. 2.3.1 above, then the place with the largest population (which has been found in previous studies to be the most likely location for the tweet (Arthur et al., 2018; Schulz et al., 2013) was logged and the coordinates returned.
-
In addition, where multiple place names are determined from a tweet, to infer the most probable location, areas of overlap between the matching location polygons are detected before a final coordinate or bounding box is returned. This assumes that polygon overlaps are the highest likelihood locations.
Since some place names are also commonly used to denote something other than a location (Liu et al., 2011), a database of words which are also places was used to remove apparent locations which were more likely to be a word than a place (e.g. dew, aka, var, etc.).
2.3.3 Validation
The method described above is based on the location inference method validated by Schulz et al. (2013), who found 92 % accuracy when the inferred location from a user location/place name mentioned in tweet was compared against tweets for which a geotag was known. The method was also used successfully by Arthur et al. (2018) and Spruce et al. (2020).
To validate the location inference approach for this study, a random sample of 100 tweets, including the tweet metadata, was taken after the filtering and location inference stage had taken place from the whole data set for all dates. Each tweet's metadata was examined for location references, and this was cross-referenced with the GADM level 1 location(s) that the tweet was assigned to using the social sensing location inference method. We found that 93 out of 100 tweets in this sample were assigned to the correct location(s), which shows that the location inference method was working well. This is also in line with previous studies' validation of this location inference approach. Applying this location inference approach on a global scale carries more potential for place names used in multiple countries being misassigned by their geographical coordinates than if working with tweets for a single country. Therefore, locating tweets with a 93 % accuracy in this study is considered a good success rate given the potential ambiguities.
2.3.4 Matching to GADM level 1
Once a place is identified, it is matched to the GADM level 1 administrative area polygon that contains it. If a tweet's location spans multiple GADM level 1 areas, then the contribution of that tweet to the total count is split proportionally between each area. After processing the location for all tweets, the overall counts of tweets within each GADM level 1 are then collated for each day within the period of study (1 January–30 June 2017).
2.4 Metrics for comparison of social sensing and Met Office community impact database
The number of relevant tweets in each GADM level 1 area for each day was used to calculate a ranking for all days in the study period for each location, given as a tweet count percentile e.g. day X is in the Yth percentile of tweet counts at location Z. This metric tells us how the number of tweets on a specific day in that location compares with “normal” tweet activity in that place. We use percentiles in preference to absolute counts of tweets to account for varying prevalence of tweets in different locations due to either the size of the population or the propensity of the local population for using Twitter. If the number of tweets in a particular location on a particular day is low for that location, the percentile will be low; if the number of tweets is high for that location, the percentile will be high. We are interested in locations and days where the percentile of tweets is particularly high as this indicates that there is an unusually high level of Twitter discussion about rainfall on that particular day, which in turn suggests that there is more likely to be a rainfall event taking place. We might also infer that the higher the percentile (i.e. the more extreme the number of tweets for that place), the more impactful the event.
To test our theory that a higher percentile of rainfall-related tweets in a location implies that a rainfall event or the impacts of a rainfall event are being experienced, we compare our percentile calculations with the events logged in the Met Office community impact database. For each day in the study period and location included in the Met Office database, we compare the percentile of tweets with whether or not an event is logged in the database on that day, in that place. As we do not currently know the percentile threshold that implies an impactful rainfall event is taking place, we repeat this comparison for different tweet percentile thresholds between the 65th and 99th percentiles. Where a rainfall event spans multiple days in the database, we compare the percentile of tweets for each day of the event. The results of these comparisons are discussed below.
It is also worth noting the limitations of the Met Office impact database as a validation source for our Twitter data. As noted by Robbins and Titley (2018), the methods used to create the records in the Met Office database use manual searches of news and social media sources written in English, which does not necessarily lead to an exhaustive list of all high-impact rainfall events that have occurred across the world. This means that this study is not necessarily a validation of ground truth event detection using Twitter but, instead, is a triangulation between identified impact events using Twitter and the Met Office impact database. In the results that follow, we present outcomes as if the Met Office data were ground truth, i.e. where we find a false negative it indicates a case where social sensing does not find an event that is found in the Met Office data. The true number of false negatives (events that occurred in reality but are not detected by social sensing OR by Met Office data) is unknown.
In this section, we first analyse the coverage of the two data sets (social sensing and manually curated Met Office database). Then we present some illustrative examples to show the properties of the two data sources, before giving a sensitivity analysis on factors affecting the performance of social sensing, assuming that the Met Office data represents the ground truth (note that this is not necessarily the case; we return to this assumption in Sect. 4). The final set of results shown is an assessment of local/global performance of the social sensing method.
3.1 Data coverage
Figure 1 shows a time series of the number of tweets collected per day and the number of tweets retained after filtering the raw data set for relevance. There was unfortunately some server downtime between 16 and 18 March 2017, resulting in missing tweets for this time period (grey bar in Fig. 1). These dates are therefore excluded from all further analysis and comparisons between the Twitter data and the Met Office database.
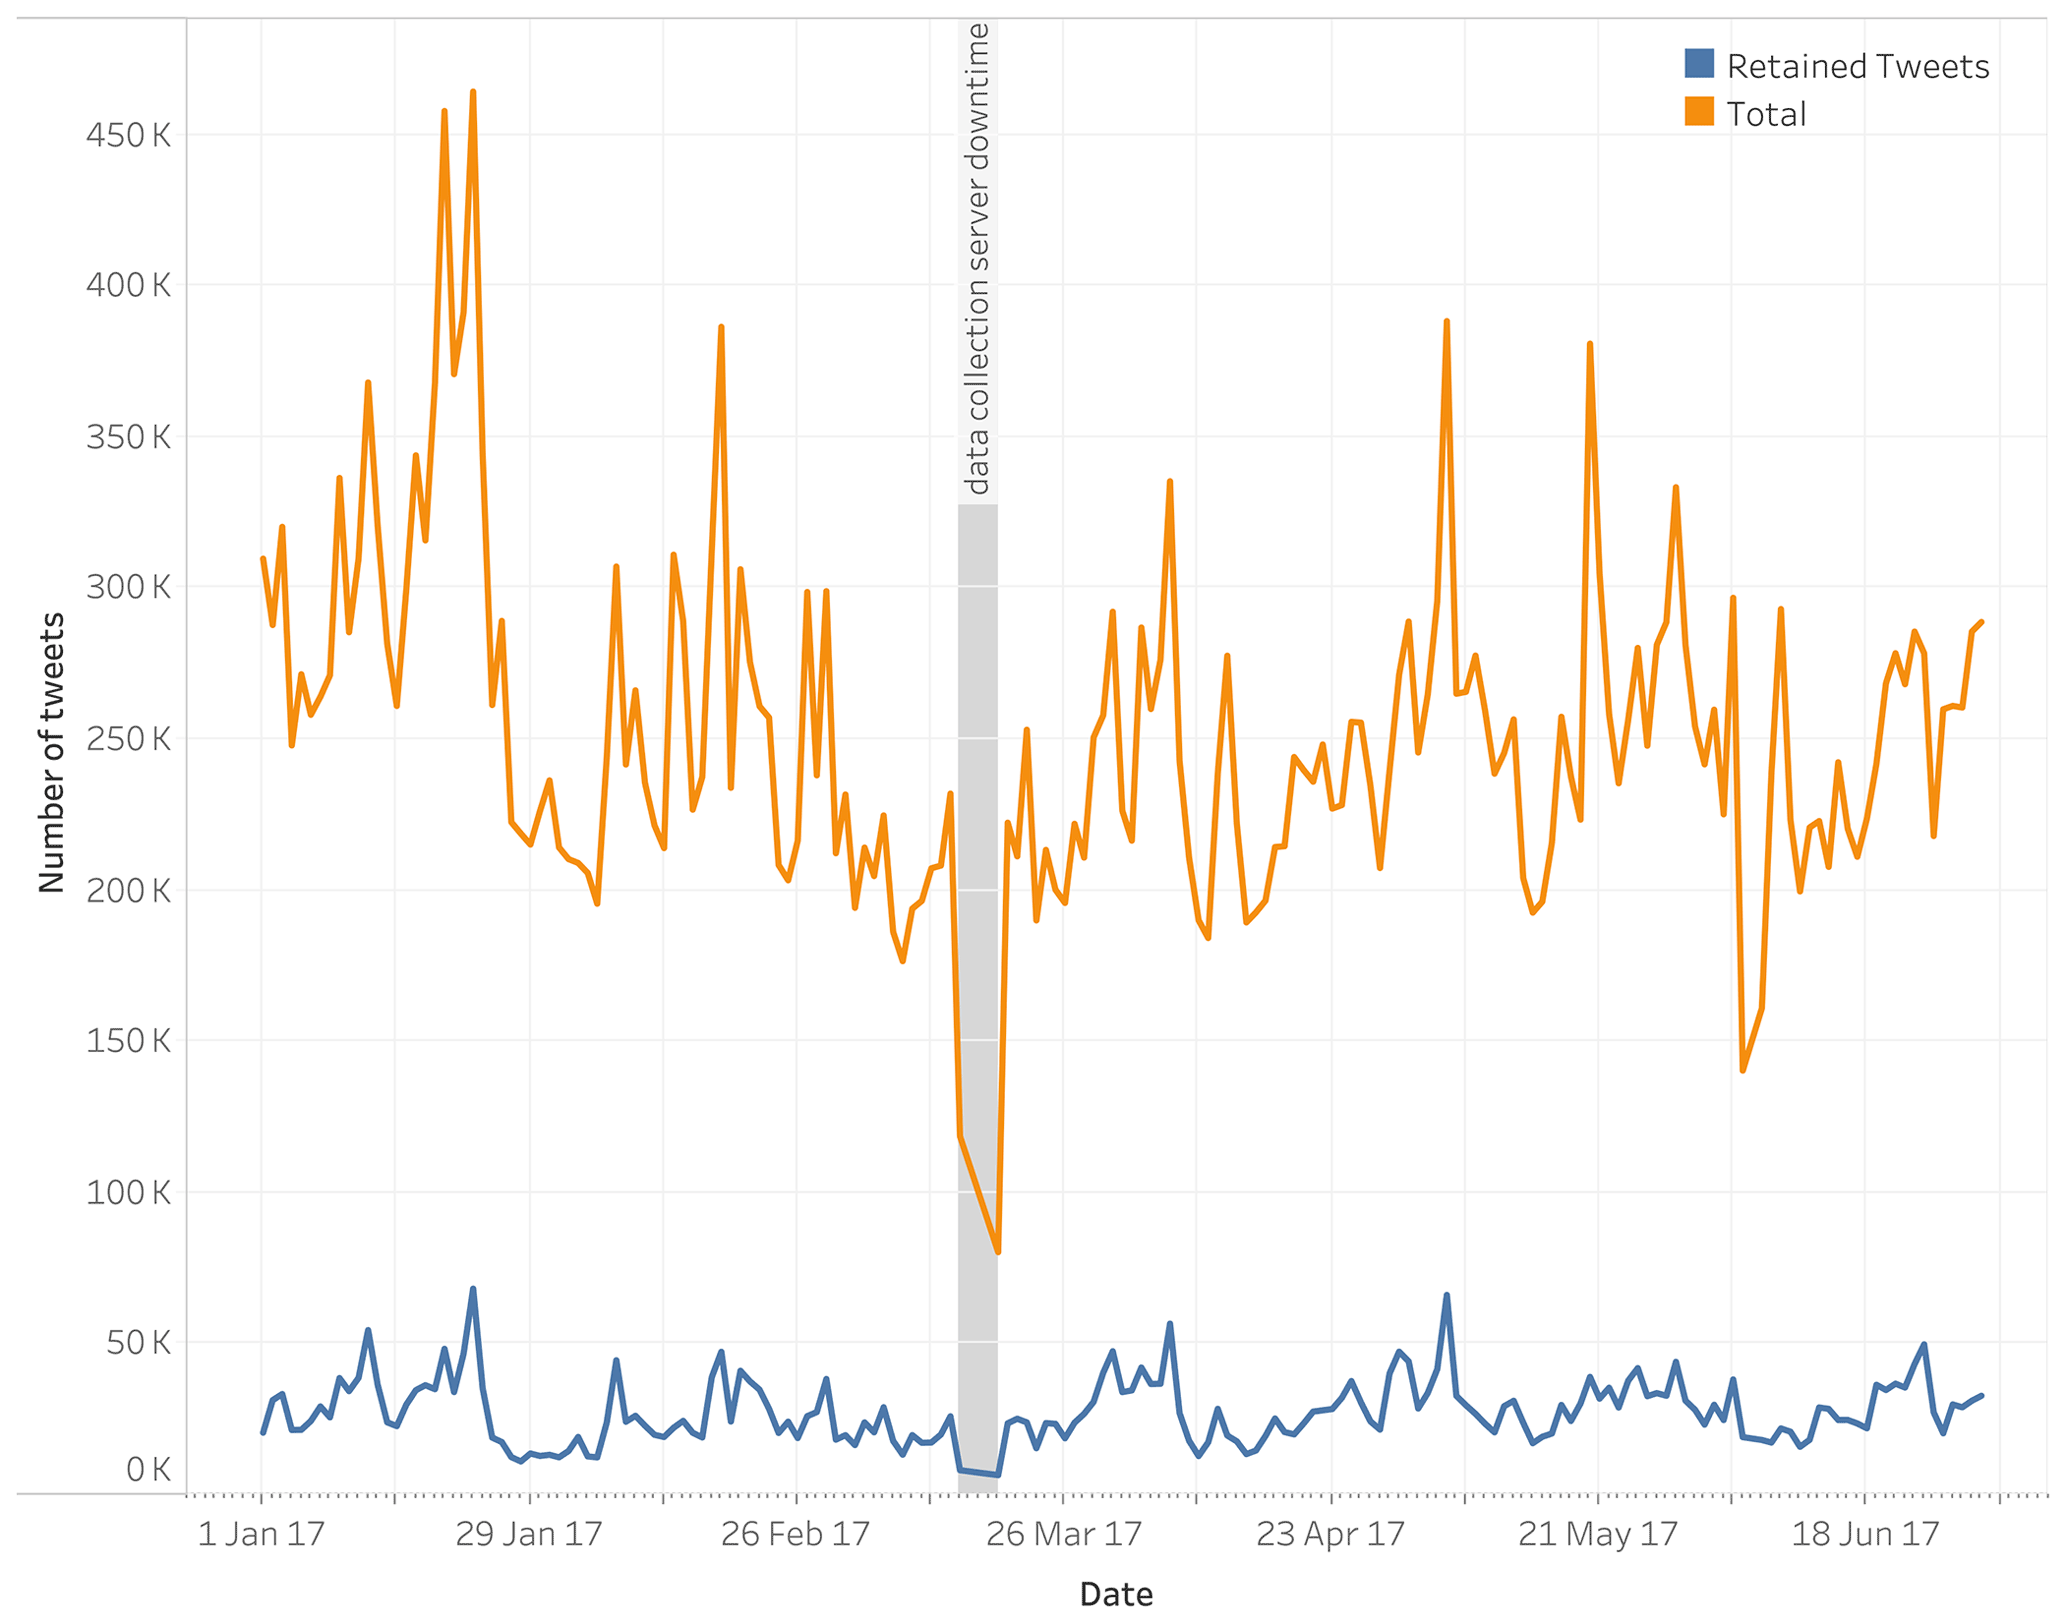
Figure 1Number of tweets collected per day between 1 January and 30 June 2017. Data shown for both the total number of tweets collected (top line) and the number of tweets retained after filtering for relevance (bottom line). The period where the tweet collection failed (16–18 March 2017) is shown by a grey bar.
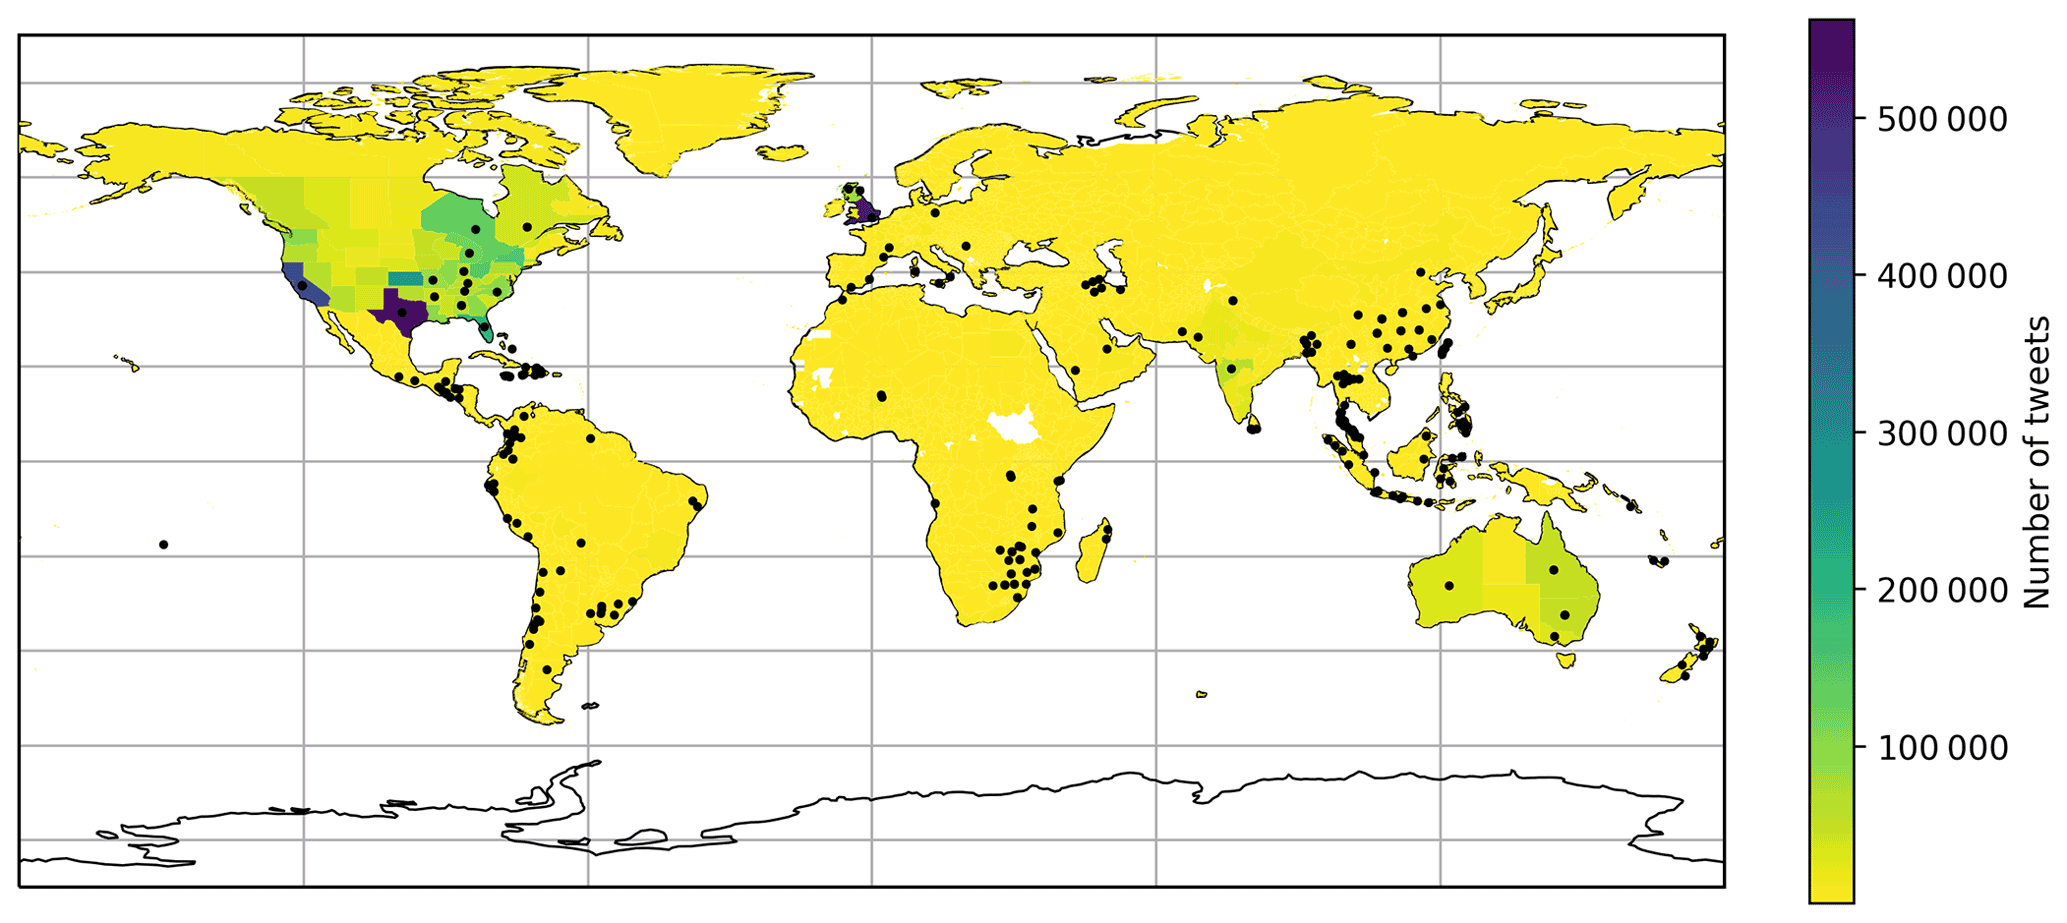
Figure 2Global map showing the number of filtered heavy rainfall tweets located in each GADM level 1 administrative area during the period of study (1 January–30 June 2017). Areas with white shading had no located tweets during the period of study; shaded areas had at least one tweet. Locations of impact events recorded in the Met Office database are shown by black points.
Figure 2 shows the number of tweets in each GADM level 1 area across the world for the whole study period. The majority of tweets are located within the USA, UK and Australia. This is not surprising given that we have collected tweets containing English language terms, and these are English-speaking countries with a very large number of Twitter users. Any areas without any tweets during the study period are shaded white on the map. The figure shows that we have good global coverage of discussion about rainfall on Twitter, with at least some tweets in most areas.
Figure 2 also shows the locations of high-impact rainfall events recorded in the Met Office database. Again, there is a good global spread of events both in English-speaking countries and countries with speakers of other languages. The relevance filters are likely to remove tweets from other languages.
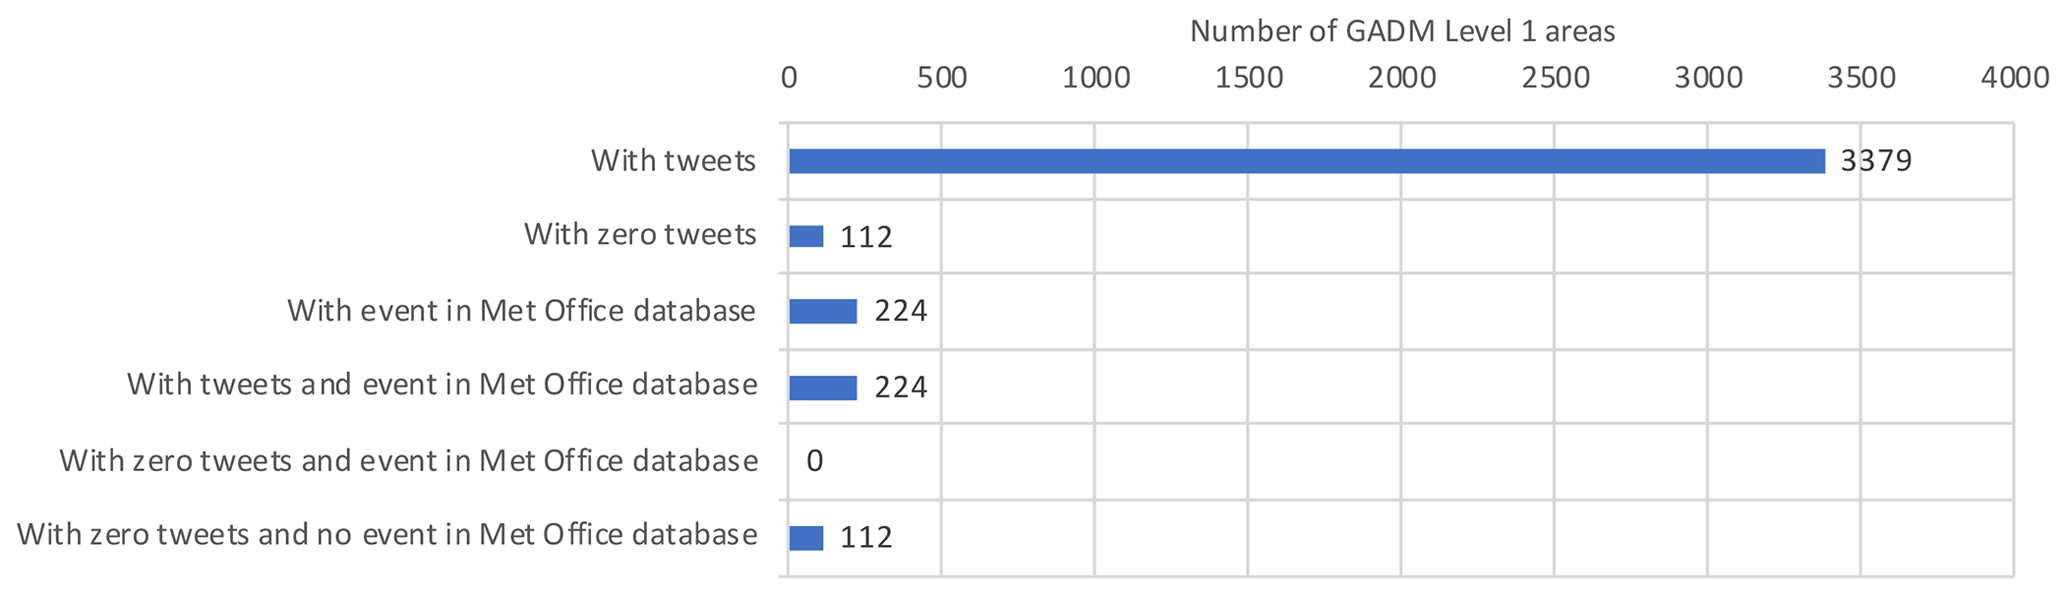
Figure 3Bar chart showing the number of GADM level 1 areas (from a total of 3491 areas) with tweets and without tweets, compared with the number of areas with at least one event in the Met Office database.
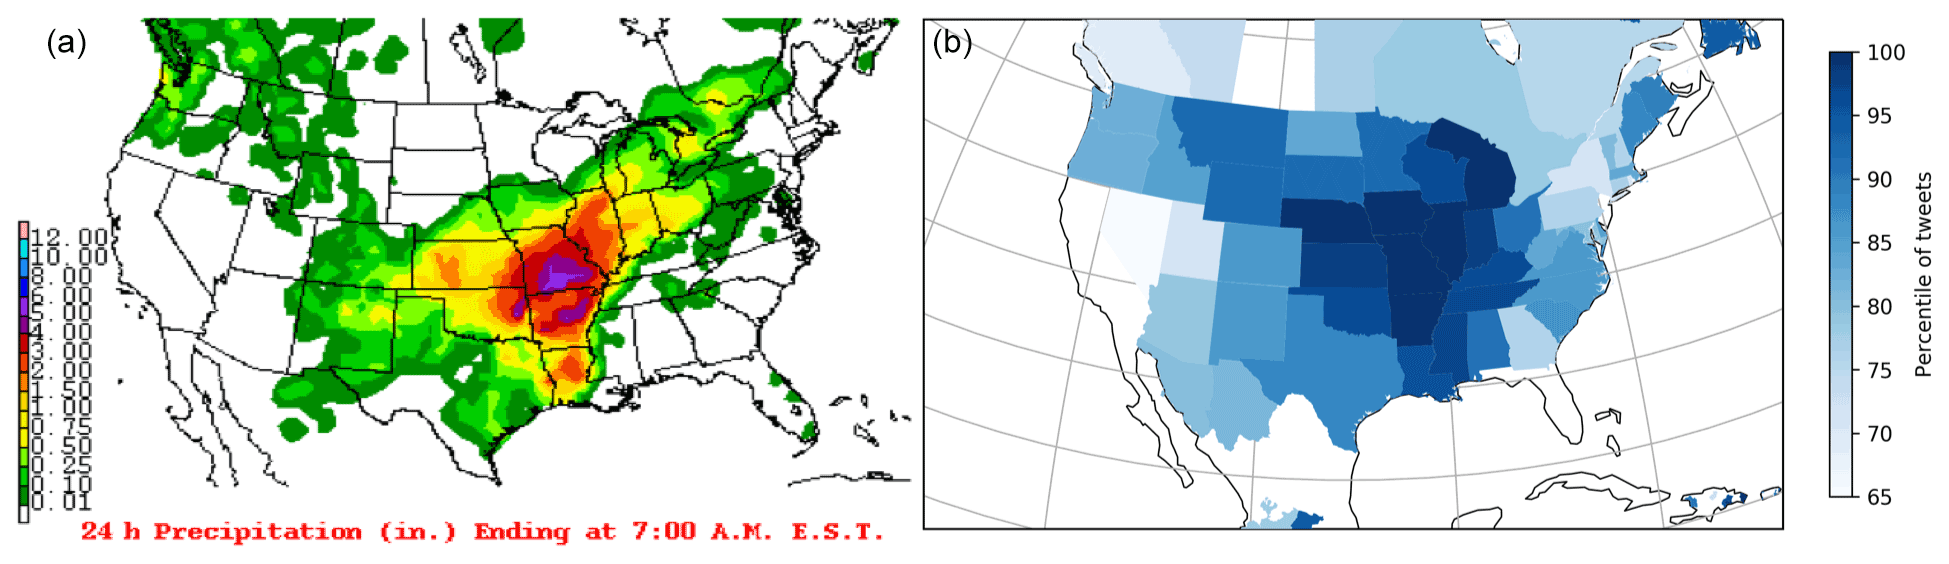
Figure 4(a)The 24 h precipitation (inches; ranging from 0 to 305 mm) for USA on 30 April 2017 (http://www.wpc.ncep.noaa.gov, last access: 17 December 2020). (b) Map of North America showing the percentile of tweet activity for each GADM level 1 administrative area on 30 April 2017.
Figure 3 shows the number of GADM level 1 areas which had at least one tweet recorded in the filtered data set ( areas) and the number without tweets ( areas). GADM areas without tweets were found to be predominantly areas within countries with a low population density (e.g. Angola, Laos and Norway) or island nations (e.g. the Bahamas, Nauru, Seychelles and Vanuatu). The areas with and without tweets are also compared with the number of GADM level 1 areas with an event in the Met Office database ( areas). All GADM level 1 areas with an event in the Met Office database had tweets recorded. None of the areas with zero tweets recorded had an event in the Met Office database. It is striking how many GADM level 1 regions have some tweets recorded that talk about extreme rainfall or flooding, compared to the number that have verified high-impact rainfall events (floods and landslides) recorded in the Met Office database. We will return to the reasons for this disparity in the discussion.
3.2 Comparison between social sensing and the Met Office database
The following are illustrative examples that demonstrate the properties of the two data sources.
3.2.1 Spatial correspondence between social sensing outputs and precipitation observations
For each day in the study period, the percentile of tweets for each GADM level 1 area was mapped. A visual inspection of each map identified a number of examples of peaks in Twitter activity that correlate with observed rainfall. Figure 4 shows an example of a particularly impactful rainfall event in the USA on 30 April 2017. The areas with the highest percentile of tweets appear to correlate well with areas of significant rainfall. This provides some confidence that the spatial distribution of peaks in Twitter data correspond to areas of observed rainfall.
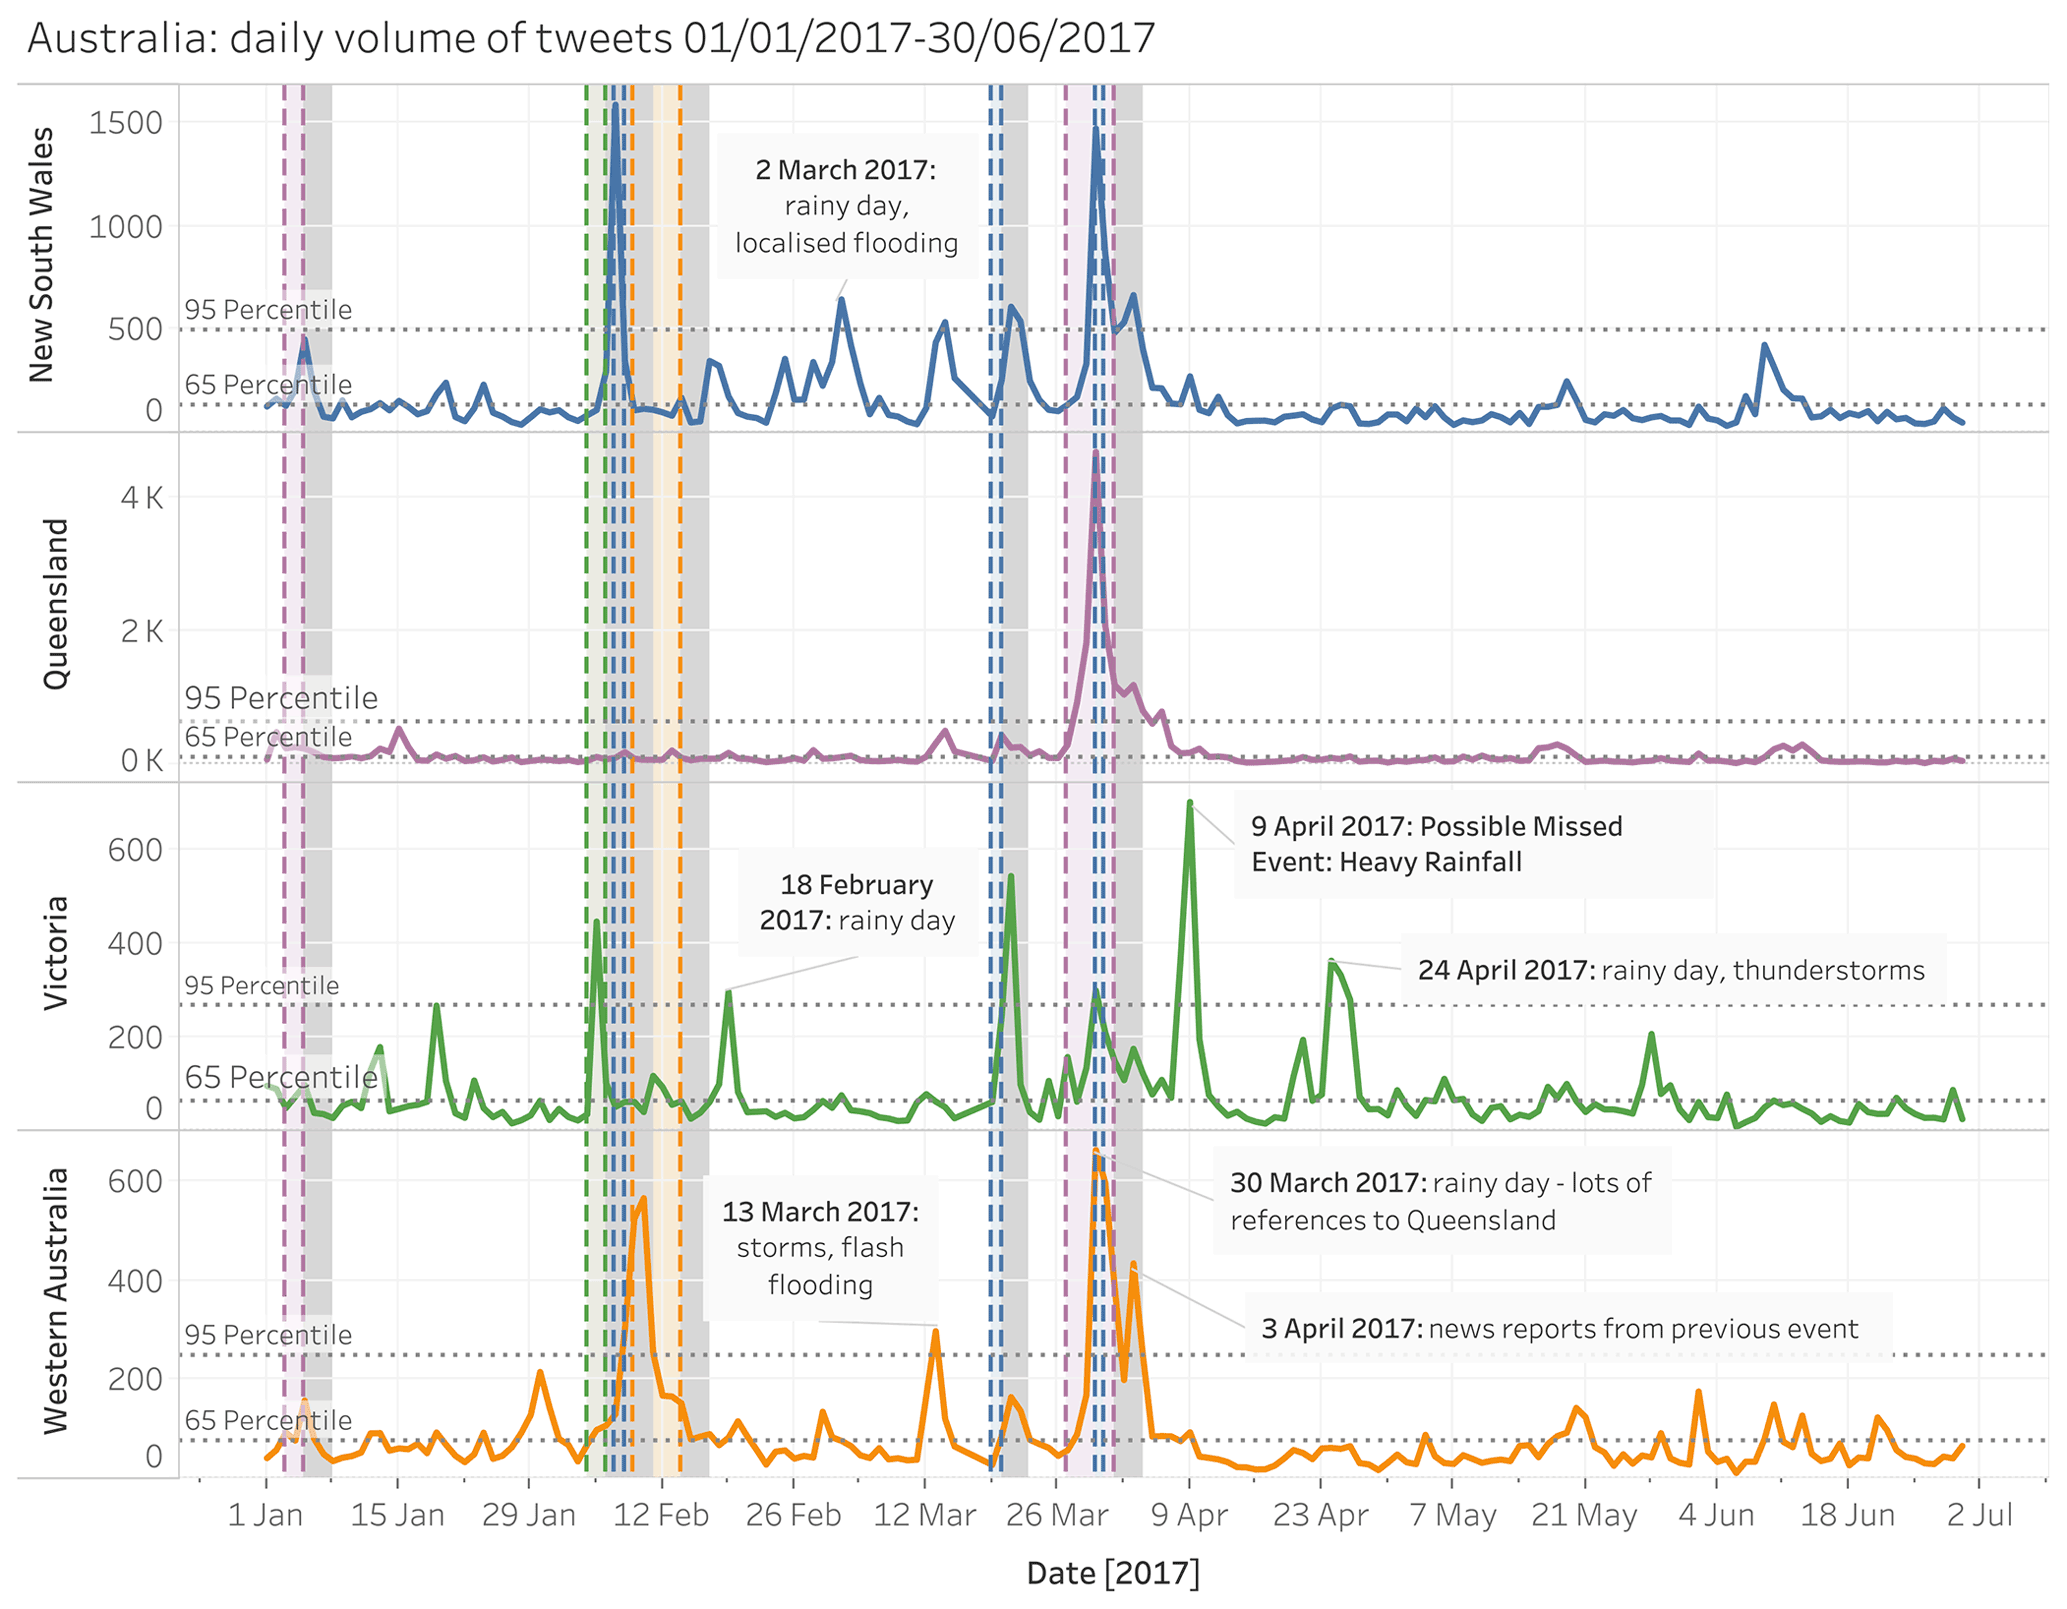
Figure 5Time series of filtered tweet counts per day for each of the Australian administrative areas with events in the Met Office database. The period of each heavy rainfall event in the Met Office database is shown by a shaded bar colour coded to the administrative area. The 3 d after each event is shown by a grey shaded bar. Social sensing events that are not present in the Met Office database are labelled.
3.2.2 Temporal correspondence between social sensing and event database outputs
Time series of the volume of tweets for each GADM level 1 area which had an event recorded in the Met Office database were examined to determine whether spikes of Twitter activity correspond to event dates in the Met Office database. Figure 5 shows an example of this for GADM level 1 areas in Australia. Events in the Met Office database largely correspond with peaks in tweet activity for these regions. It also appears that there may be at least one high-impact rainfall event detected by social sensing that is not included in the Met Office database. Looking at 9 April 2017, there is a significantly high number of tweets in Victoria which do not correspond to an event in the Met Office database. Investigation of news articles and weather reports for this date identified that there was a significant rainfall event on this date that would have met the criteria for inclusion in the Met Office database. Therefore, this provides an example of where the use of social sensing could aid with impact event detection and provide an additional source of impact information. Other peaks in tweet activity where the volume of tweets is above the 95th percentile for the region are also labelled as possible high-impact events which might have met the criteria for inclusion in the Met Office impact database but were missed in the original creation.
Figure 6 shows a similar plot to Fig. 5, but for the United Kingdom (UK). In this example, there are greater disparities between events identified in the Met Office database and those identified using the social sensing method.
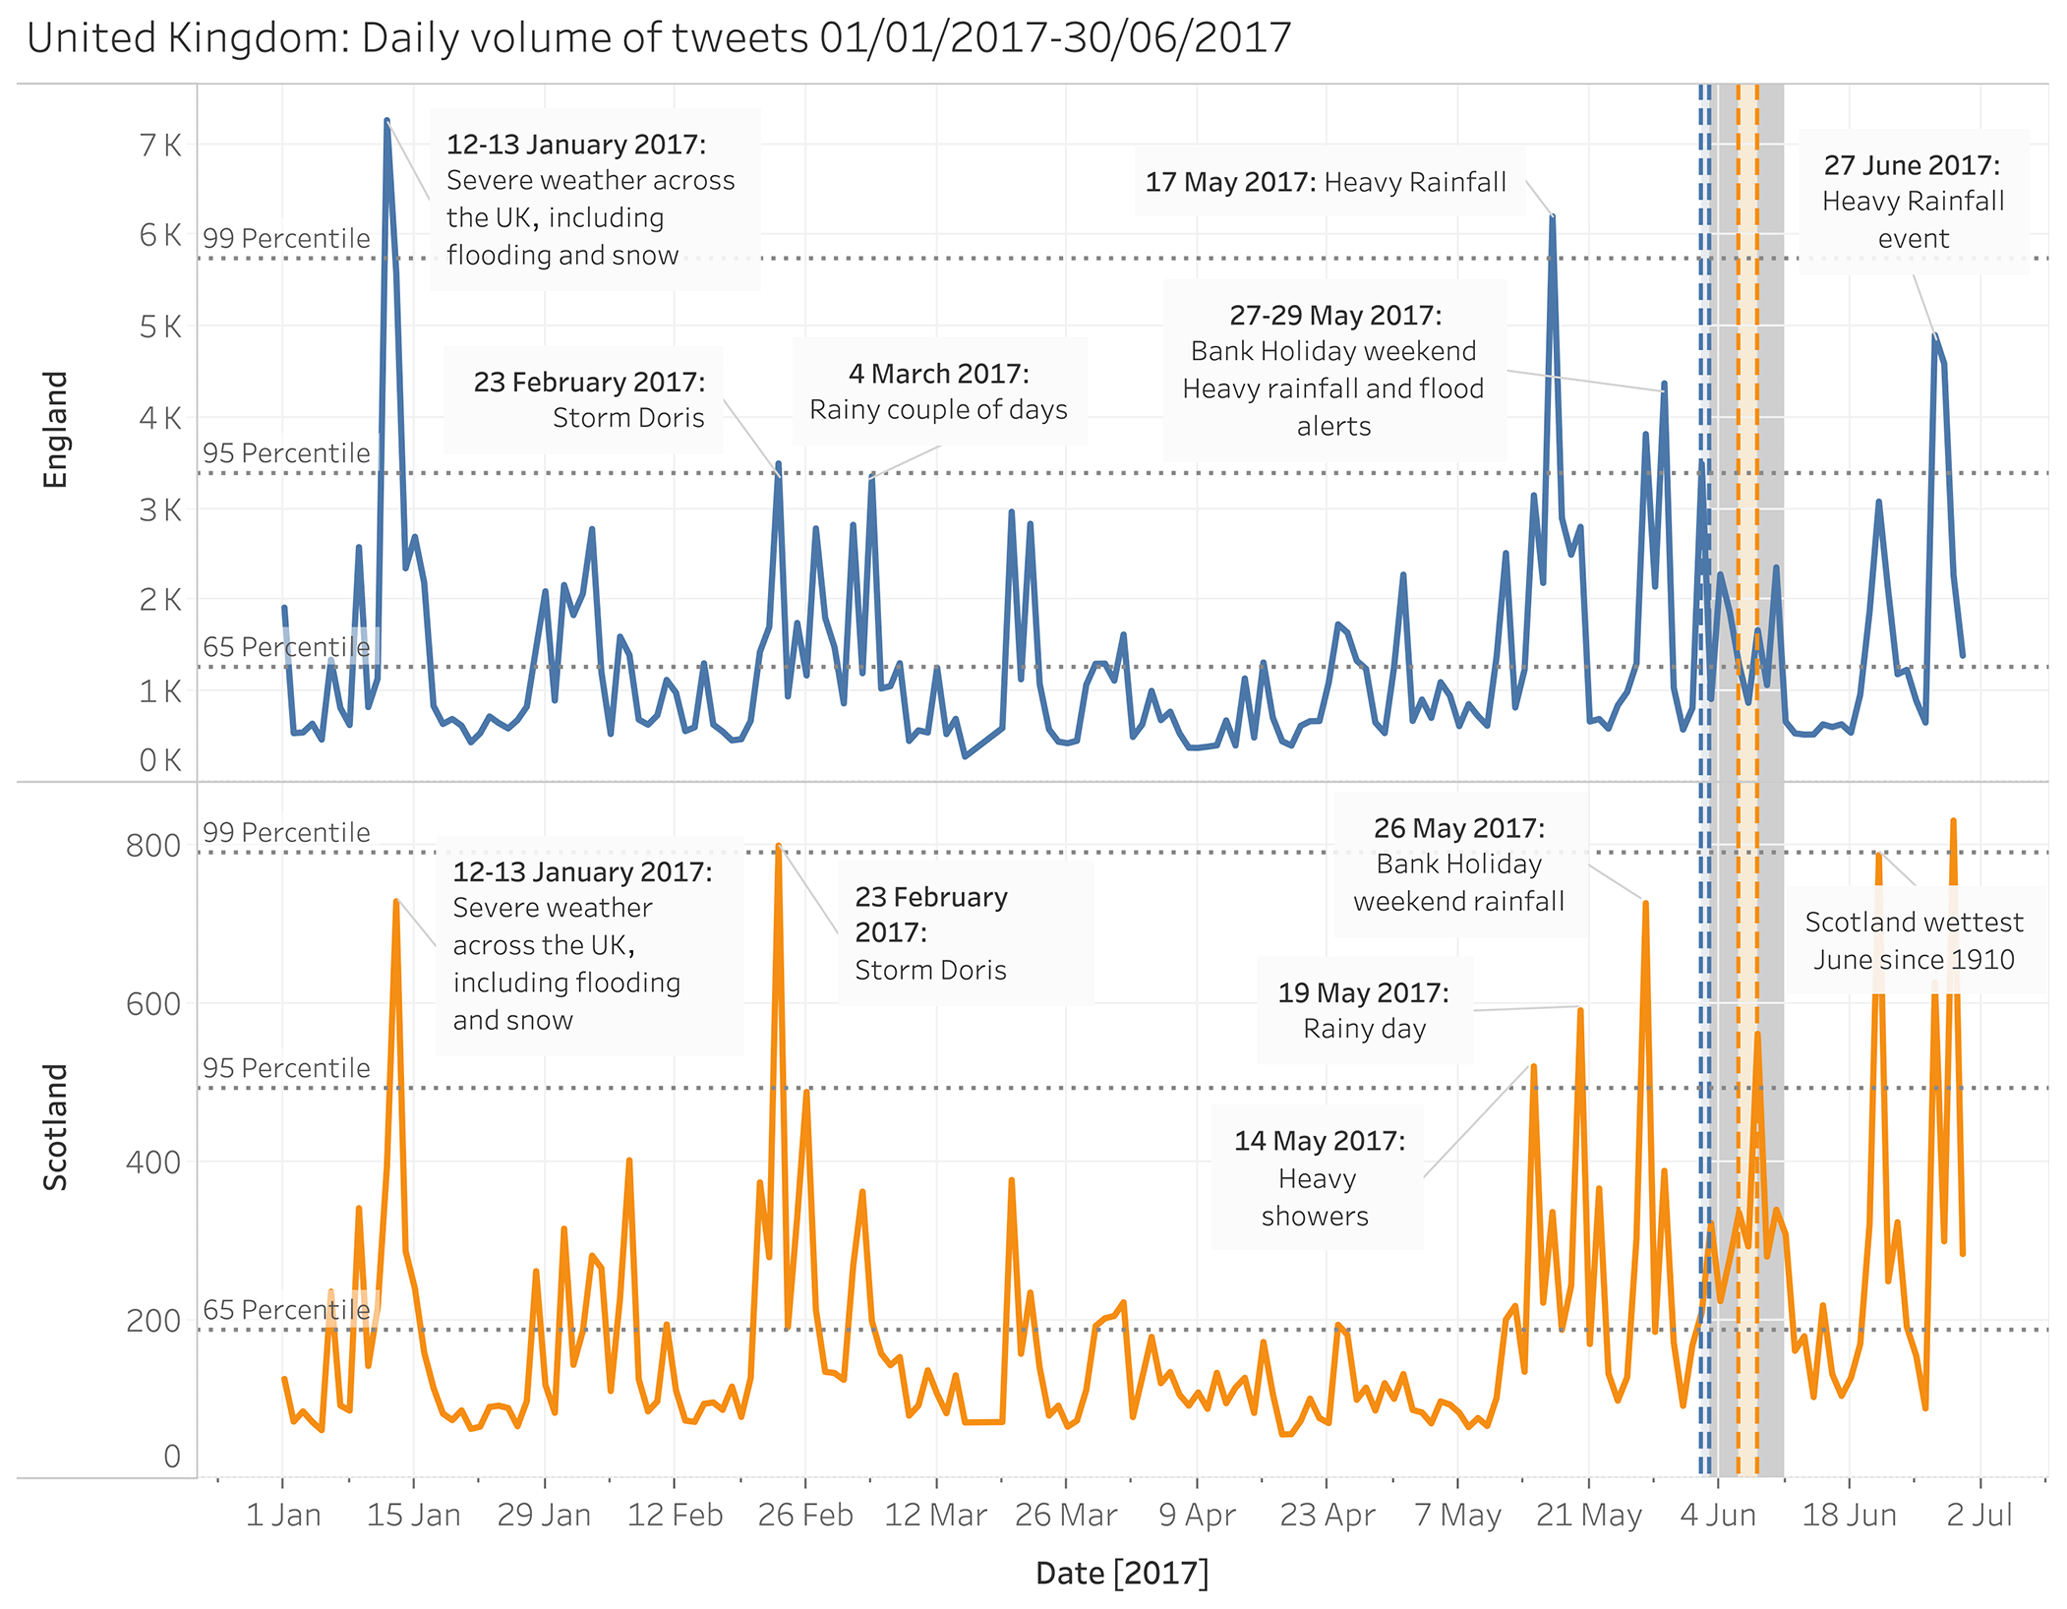
Figure 6Time series of filtered tweets per day for each of the UK administrative areas with events in the Met Office database. The period of each heavy rainfall event in the Met Office database is shown by a shaded bar colour coded to the administrative area. The 3 d after each event is shown by a grey shaded bar. Potential missed events in the Met Office database, which are identified in the Twitter data, are labelled.
There are a number of rainfall events identifiable from the tweet time series in Fig. 6 which are absent from the Met Office database, namely 12–13 January, 23 February, 17 May, and 27 June 2017. A significant peak in tweet activity (above the 95th percentile) is noted for each of these dates, and further investigation of news media and weather reports shows that there were rainfall impacts in the UK on or around these dates. However, not all of the peaks in tweet activity can be attributed to genuine high-impact rainfall events. For example, the peak in tweet activity seen around the 27–29 May 2017 coincided with a bank holiday weekend in the UK with a weather forecast for bad weather. This generated a large amount of news and social media discussion on cancelled events and holiday plans, as well as some travel disruption, not all of which was related to the weather. This provides an example of where social sensing can provide a false positive result. False positives could occur for a number of reasons; for example, do smaller, less impactful rainfall events in the UK generate more discussion than in other countries given that rainfall is quite common there? Or, being a relatively small country, impacts due to the weather have the potential to be more localised, affect fewer people and are, therefore, not as highly severe on the global impact scale used for the curation of the Met Office database. In this particular example, there is also a question regarding the relevance of a bank holiday in affecting people's perception of risk and impact.
Examining the illustrative examples above and the time series for other areas (not shown), we found there was a good match between areas with recorded heavy rainfall events and a high percentile of tweet activity relating to rain and the impacts of rain. We also found a good match between peaks in tweet activity and events in the Met Office database for some areas (e.g. Australia, some parts of the USA, Malaysia, Saudi Arabia and Angola) and a poorer match for others (e.g. UK, India and Haiti). Investigating peaks in tweet activity which do not correspond to a recorded event in the Met Office database, we found that most of these peaks refer to genuine high-impact rainfall events. These findings suggest that social sensing of rainfall events can be a useful addition to current manual methods of impact data collection, helping to identify a wider variety and greater number of high-impact events.
3.3 Factors affecting social sensing performance
3.3.1 Performance metrics
To understand how the social sensing method is working in terms of links between peaks in Twitter activity (i.e. percentile of tweets for a particular area) and events logged in the Met Office database, we tested the social sensing method as an event detector, assuming that the Met Office events database represents ground truth. To quantify performance and account for the various methodological factors (for example, the tweet activity percentile threshold used to decide when an event had occurred), we plotted precision/recall curves.
Recall is used to show the ability of a model to find all of the relevant cases in a data set (Koehrsen, 2018). In this study, calculating recall indicates how well the social sensing method finds events in the Met Office database. Recall is calculated by taking the number of true positives divided by the number of true positives plus the number of false negatives (Eq. 2). For each day in the study period, a true positive would be counted if there is an event in the Met Office database and the percentile of tweets is greater than or equal to the chosen percentile threshold (meaning the social sensing method correctly detects the event). A false negative would be counted if there is an event in the Met Office database but the percentile of tweets is less than the chosen percentile threshold (i.e. the event was not detected using tweets).
Precision is used to show the proportion of data points a model says are relevant compared to those which are actually relevant (Koehrsen, 2018). In this study, precision shows how accurately the social sensing method finds events in the Met Office database; i.e. if there is a peak in Twitter activity in a particular place on a particular day, does this correspond to an event in the Met Office database? Precision is calculated by taking the number of true positives divided by the number of true positives plus the number of false positives (Eq. 3). For each day in the study period, a true positive would be counted as described for recall above, whereas a false positive would be counted where the percentile of tweets is greater than or equal to a given percentile threshold but there is not an event in the Met Office database (event detected but not actually an event).
Plotting precision and recall against each other shows how well (or not) the social sensing method is replicating the Met Office database of recorded events. Recall and precision were therefore calculated for each GADM level 1 administrative areas with an event in the Met Office database. As we do not know the optimum percentile threshold that would achieve the best social sensing performance, recall and precision were calculated using tweet percentile thresholds between the 65th and 99th percentiles. This will help to determine which percentile threshold is optimal for signalling that an impactful rainfall event is occurring.
Further to precision and recall, we also calculated the f score – a metric which takes both precision and recall into account. This is a single score that indicates how well the social sensing method is working and can be used to find the optimal percentile threshold to signal that a rainfall event is occurring. The F1 score is defined as the harmonic mean of precision and recall and aids in tuning a model to be optimised for both of these metrics (Koehrsen, 2018). In this study, we calculate a variation of the F1 score, the F2 score, which gives a higher weight to recall in its calculation (Eq. 4).
For reference, F2 scores fall in the range [0, 1], with a score of 1 being perfect recall and perfect precision. As used here, we are interested mainly in the change in F2, as different parameters are varied, rather than its absolute value.
We choose to favour recall here as we are most interested in how well the social sensing method detects events in the Met Office database; furthermore, calculations of precision are somewhat less reliable due to the lack of genuine ground truth data. While the accuracy of the event detection is important, we prefer to detect as many events as possible and tolerate occasional peaks in Twitter activity that do not match an event in the Met Office database. As previously noted, the Met Office database does not provide a definitive list of all high-impact rainfall (and secondary hazard) events that have occurred, and there may well be events missing from this database that Twitter can help us detect. In other words, neither data set is perfect, but utilising the positive attributes of both methods could lead to an enhanced approach for sustainable and robust impact data collection.
3.3.2 Sensitivity of social sensing performance to event detection window
Figure 7 shows precision and recall calculated for all GADM level 1 areas where an event was recorded in the Met Office database. Each plotted point shows precision and recall for a given tweet percentile threshold for event detection. Initially, precision and recall were calculated requiring that a peak in tweet activity must exactly match the day of the heavy rainfall event (day 0). However, as identified by Robbins and Titley (2018), there can sometimes be a time lag between a rainfall event and impacts of the event being experienced or reported. Therefore precision and recall calculations were repeated for event detection windows of varying duration, i.e. day 0 only, day 0 + day 1 (day + 1), day 0 + day 1 + day 2 (day + 2) and day 0 + day 1 + day 2 + day 3 (day + 3). Longer time windows were trialled in preliminary work, but showed no additional benefit; also, longer time windows reduce the ability to locate events in time. Figure 7 shows precision/recall curves for each of these scenarios, showing that the 3 d window (day + 3) yields the best results.
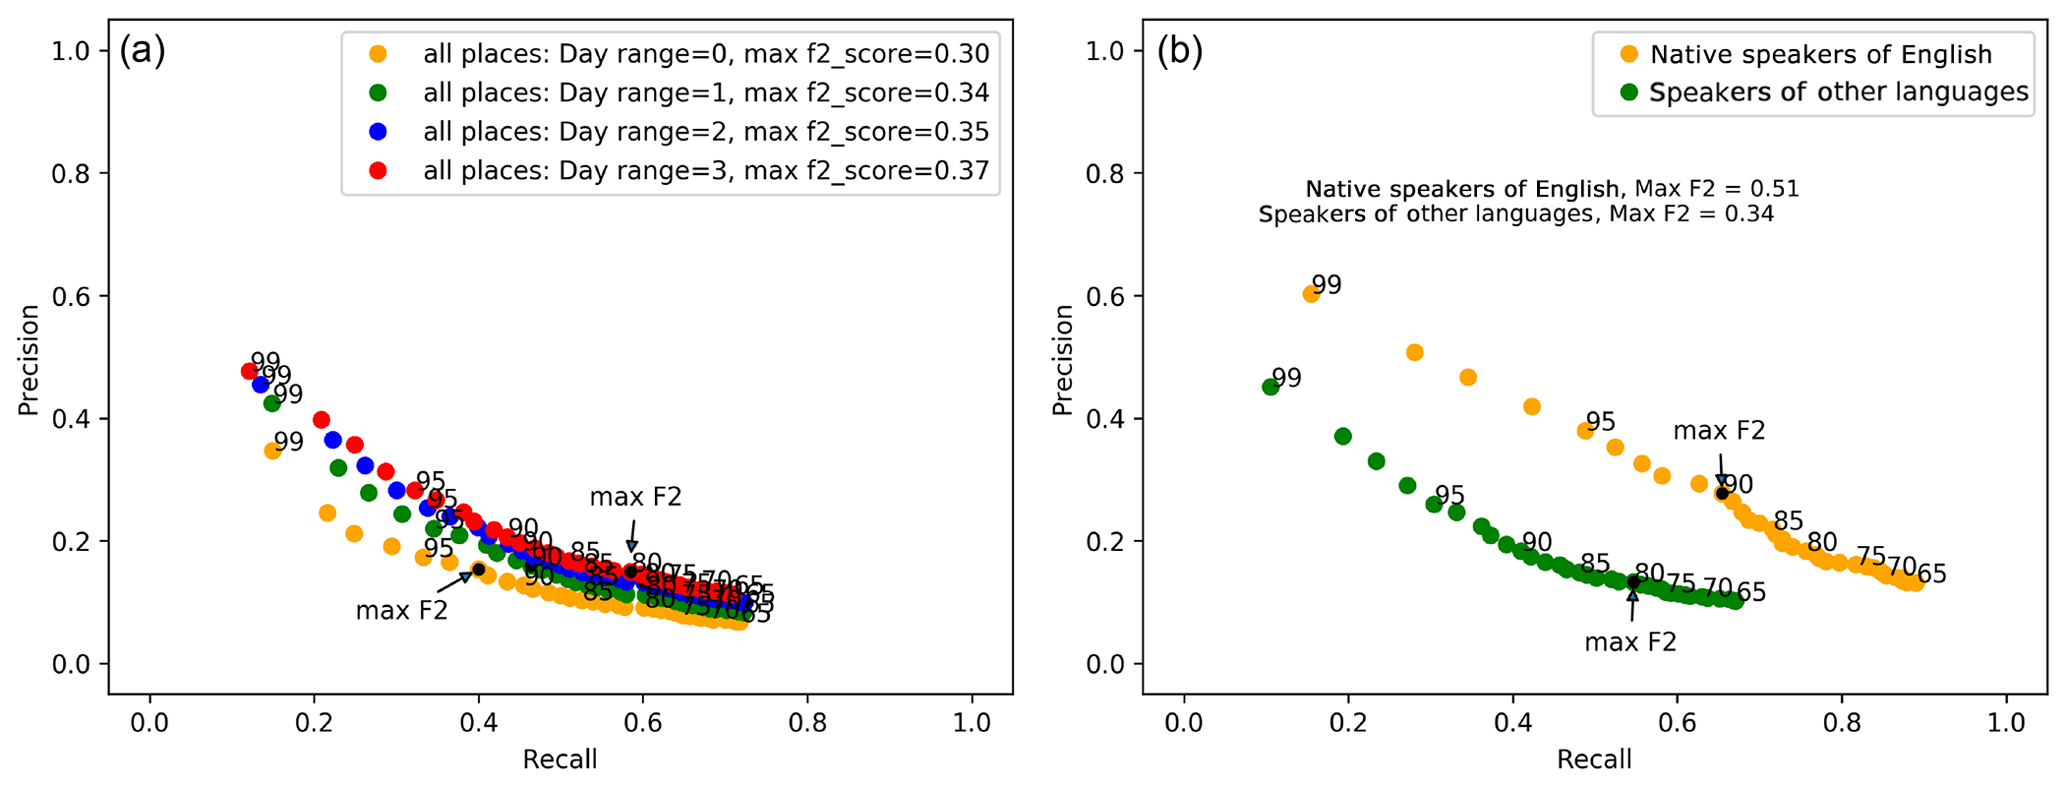
Figure 7(a) Precision and recall values when comparing tweet data with the Met Office impact database for day 0 only, day + 1, day + 2 and day + 3 from the impact event date. Each point represents the tweet percentile threshold used to signal true and false positive values for an event taking place in the Twitter data. Tweet percentile thresholds tested the range from the 65th percentile to the 99th percentile (step size 1). (b) Precision vs. recall plot for matches (within 3 d of event) to Met Office impact event database vs. tweet percentile thresholds 65–99 (step size 1) for countries with native speakers of English countries vs. countries with speakers of other languages.
3.3.3 Social sensing performance in English-speaking countries and countries with speakers of other languages
As the tweets collected were in the English language only, we are also interested in whether the social sensing method works better for countries with native speakers of English. Using the precision/recall calculations described above and for day range + 3, a precision/recall curve was plotted for tweets from native English-speaking countries versus other countries with speakers of other languages. Figure 7 shows the results of this comparison and that the social sensing method yields much better results for countries with native speakers of English with a maximum F2 score of 0.51 compared with 0.34 for countries with speakers of other languages. The difference in performance is perhaps not surprising given that tweets were collected with English language keywords, but it is interesting to note that reasonable performance is still achieved in countries with speakers of other languages.
3.3.4 Social sensing performance at different event impact levels
A further consideration for impact-based forecast evaluation is the severity of impacts associated with different (in this case, hydrometeorological) events. Each event logged in the Met Office impact database is assigned a category from 1 (least severe) to 4 (most severe; Table 1). To see how effective the social sensing method is for events with different levels of impact, we plot recall (the number of events in the Met Office database that are matched by peaks in Twitter activity) for different impact severity categories. Figure 8 shows recall across a range of percentile thresholds for each impact severity category. This shows that events with the most severe impacts (severity category 4) are more likely to be picked up by the social sensing method. Surprisingly, the least impactful events (severity category 1) achieve the next-best recall. This plot also shows us that as the percentile threshold is increased, recall decreases (i.e. more events are missed at the higher percentile thresholds). More on finding the optimum tweet percentile threshold for the social sensing method will be discussed later in Sect. 3.4.
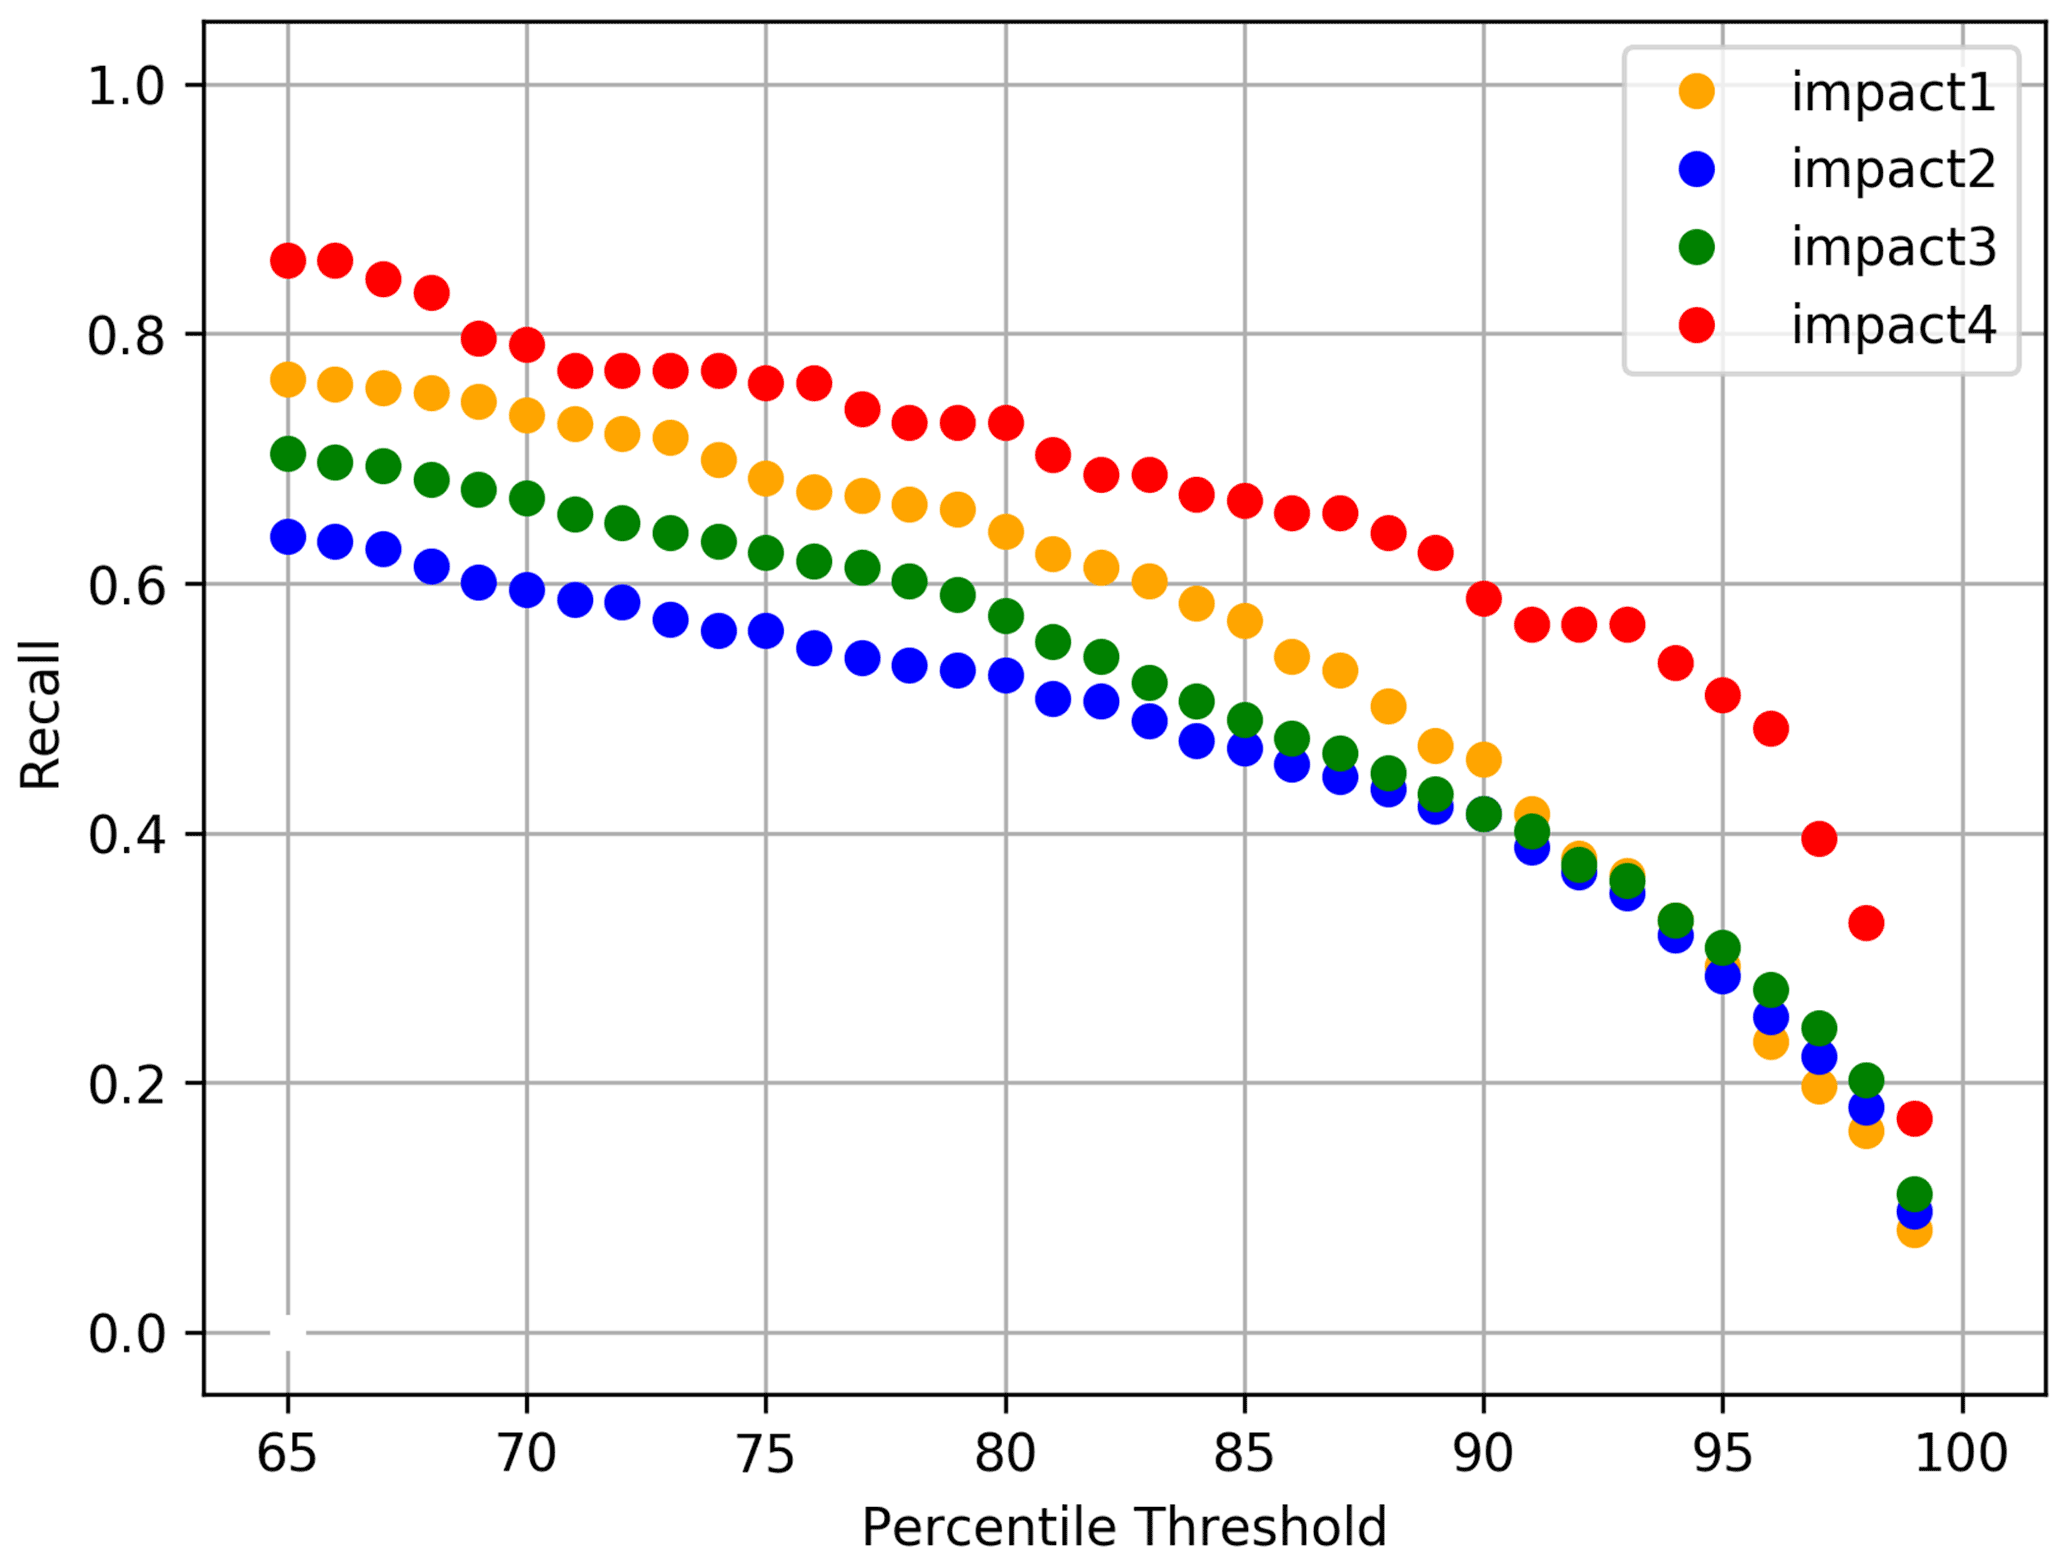
Figure 8Recall versus tweet percentile threshold for matches (within 3 d of event) to the Met Office impact event database for each category of impact severity (where impact severity category 4 represents the most impactful events).
3.4 Social sensing performance around the world
Having considered some of the factors which affect the performance of the social sensing methodology, we now examine how well social sensing performs in different geographic regions around the world. To do this, we first look at the choice of percentile threshold for different places, then the dependence of social sensing on tweet volumes, before finally examining performance in different GADM level 1 regions. Again, we assume that the manually curated Met Office impact database is a ground truth, while acknowledging that the actual ground truth is unknown.
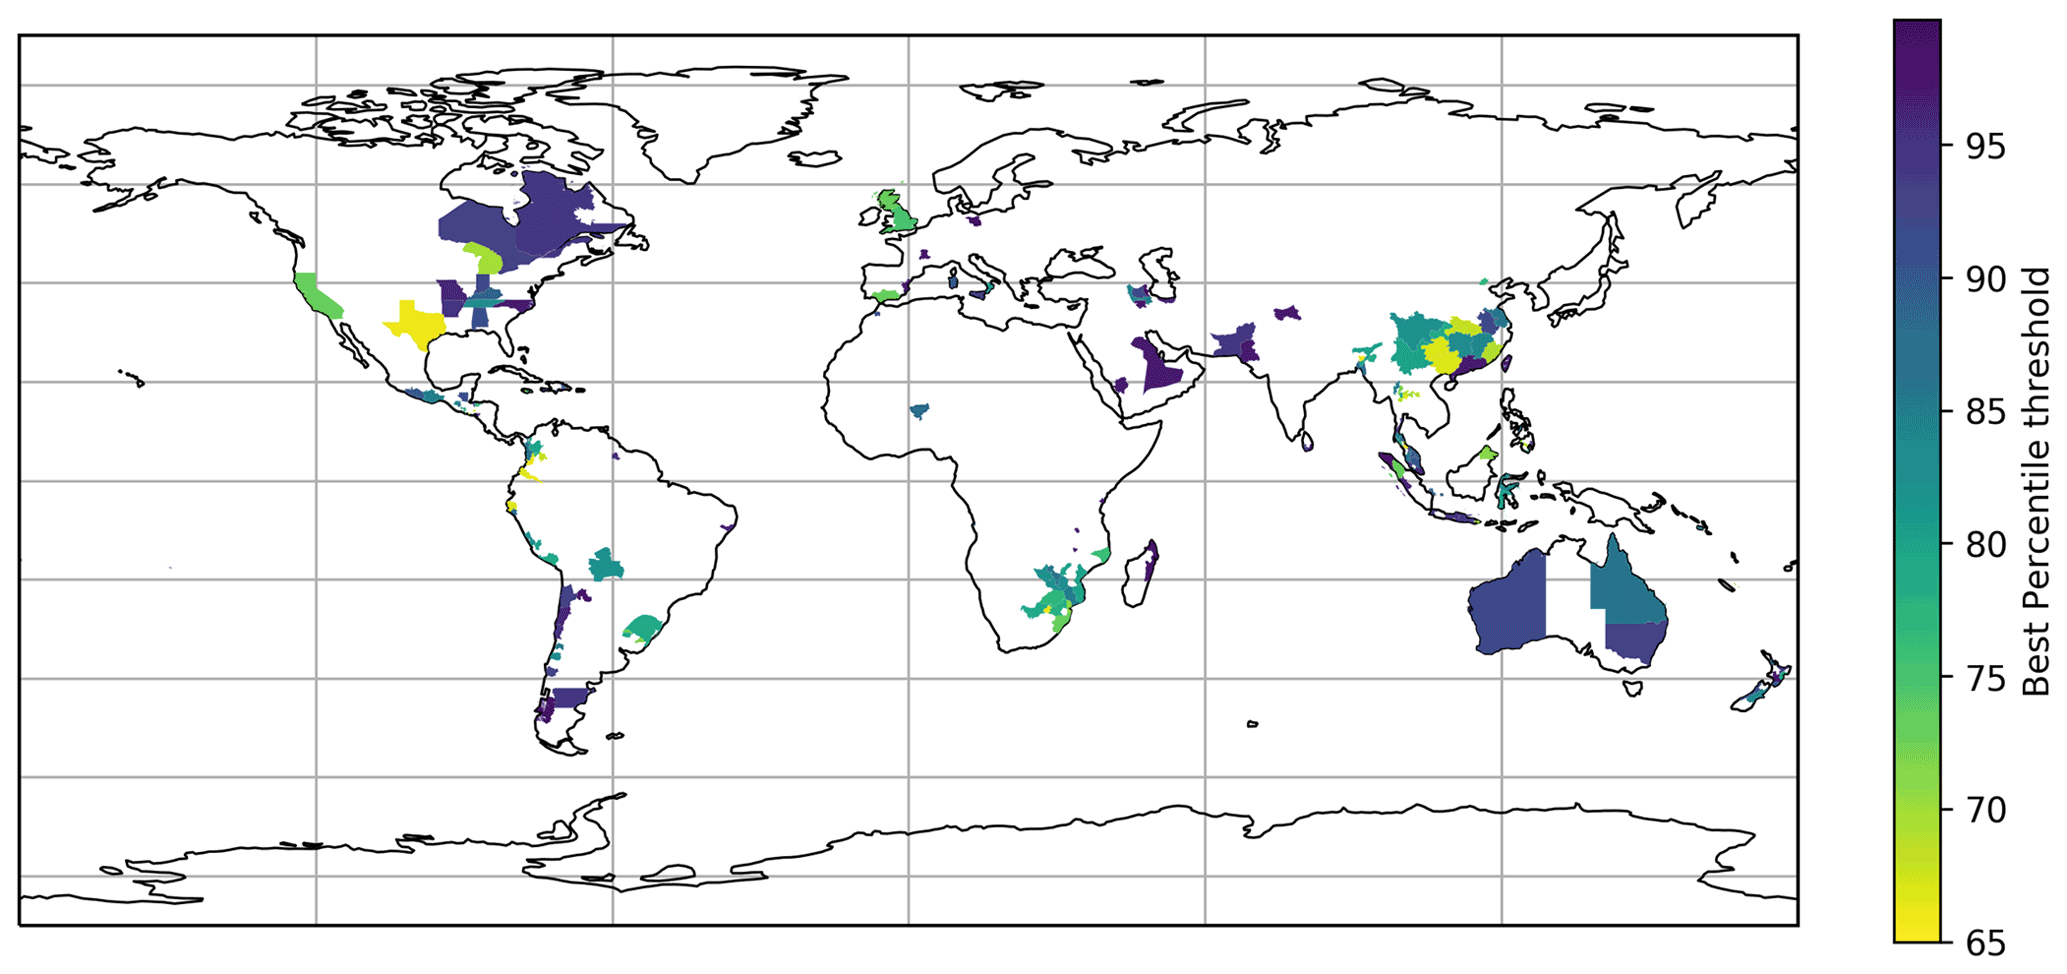
Figure 9Global map showing the tweet percentile threshold which yielded the highest F2 score of precision/recall between filtered heavy rainfall tweet activity and events in the Met Office impact database for each GADM level 1 administrative area with an event recorded in the Met Office database during the study period.
3.4.1 Choice of percentile threshold
The optimal tweet percentile threshold overall (yielding the highest F2 score) was found to be around the 80th percentile; however, this varies by location. Figure 9 plots the optimal tweet percentile threshold for every GADM level 1 region in which a Met Office impact event was recorded. Where the plot is white in colour, no events were recorded; these regions are not considered in our analysis. The plot shows that the optimal percentile threshold for social sensing performance varies by country (at least, in terms of recovering the known events recorded in the Met Office database). Therefore, the social sensing method may need to use a different percentile threshold for different locations to achieve its best performance.
3.4.2 Dependence on tweet volume
It is reasonable to assume that the volume of tweet activity might affect social sensing performance. This leads to an expectation that social sensing will work best in locations with large user populations and resulting large data volumes. To test this assumption, we examined the relationship between F2 scores and tweet volumes for each GADM level 1 region for which an event was recorded in the Met Office database. Figure 10 plots the average tweet count and the maximum F2 score for each location with an event recorded in the Met Office database. The plot shows no obvious relationship between the two variables; this is confirmed by a weak correlation (Pearson's r=0.11; p=0.10). This finding demonstrates that (perhaps unexpectedly) a greater number of tweets does not necessarily mean that the social sensing method will be more accurate. Good performance can be achieved with any volume of tweets as long as there is temporal variation in the volume driven by rainfall events.
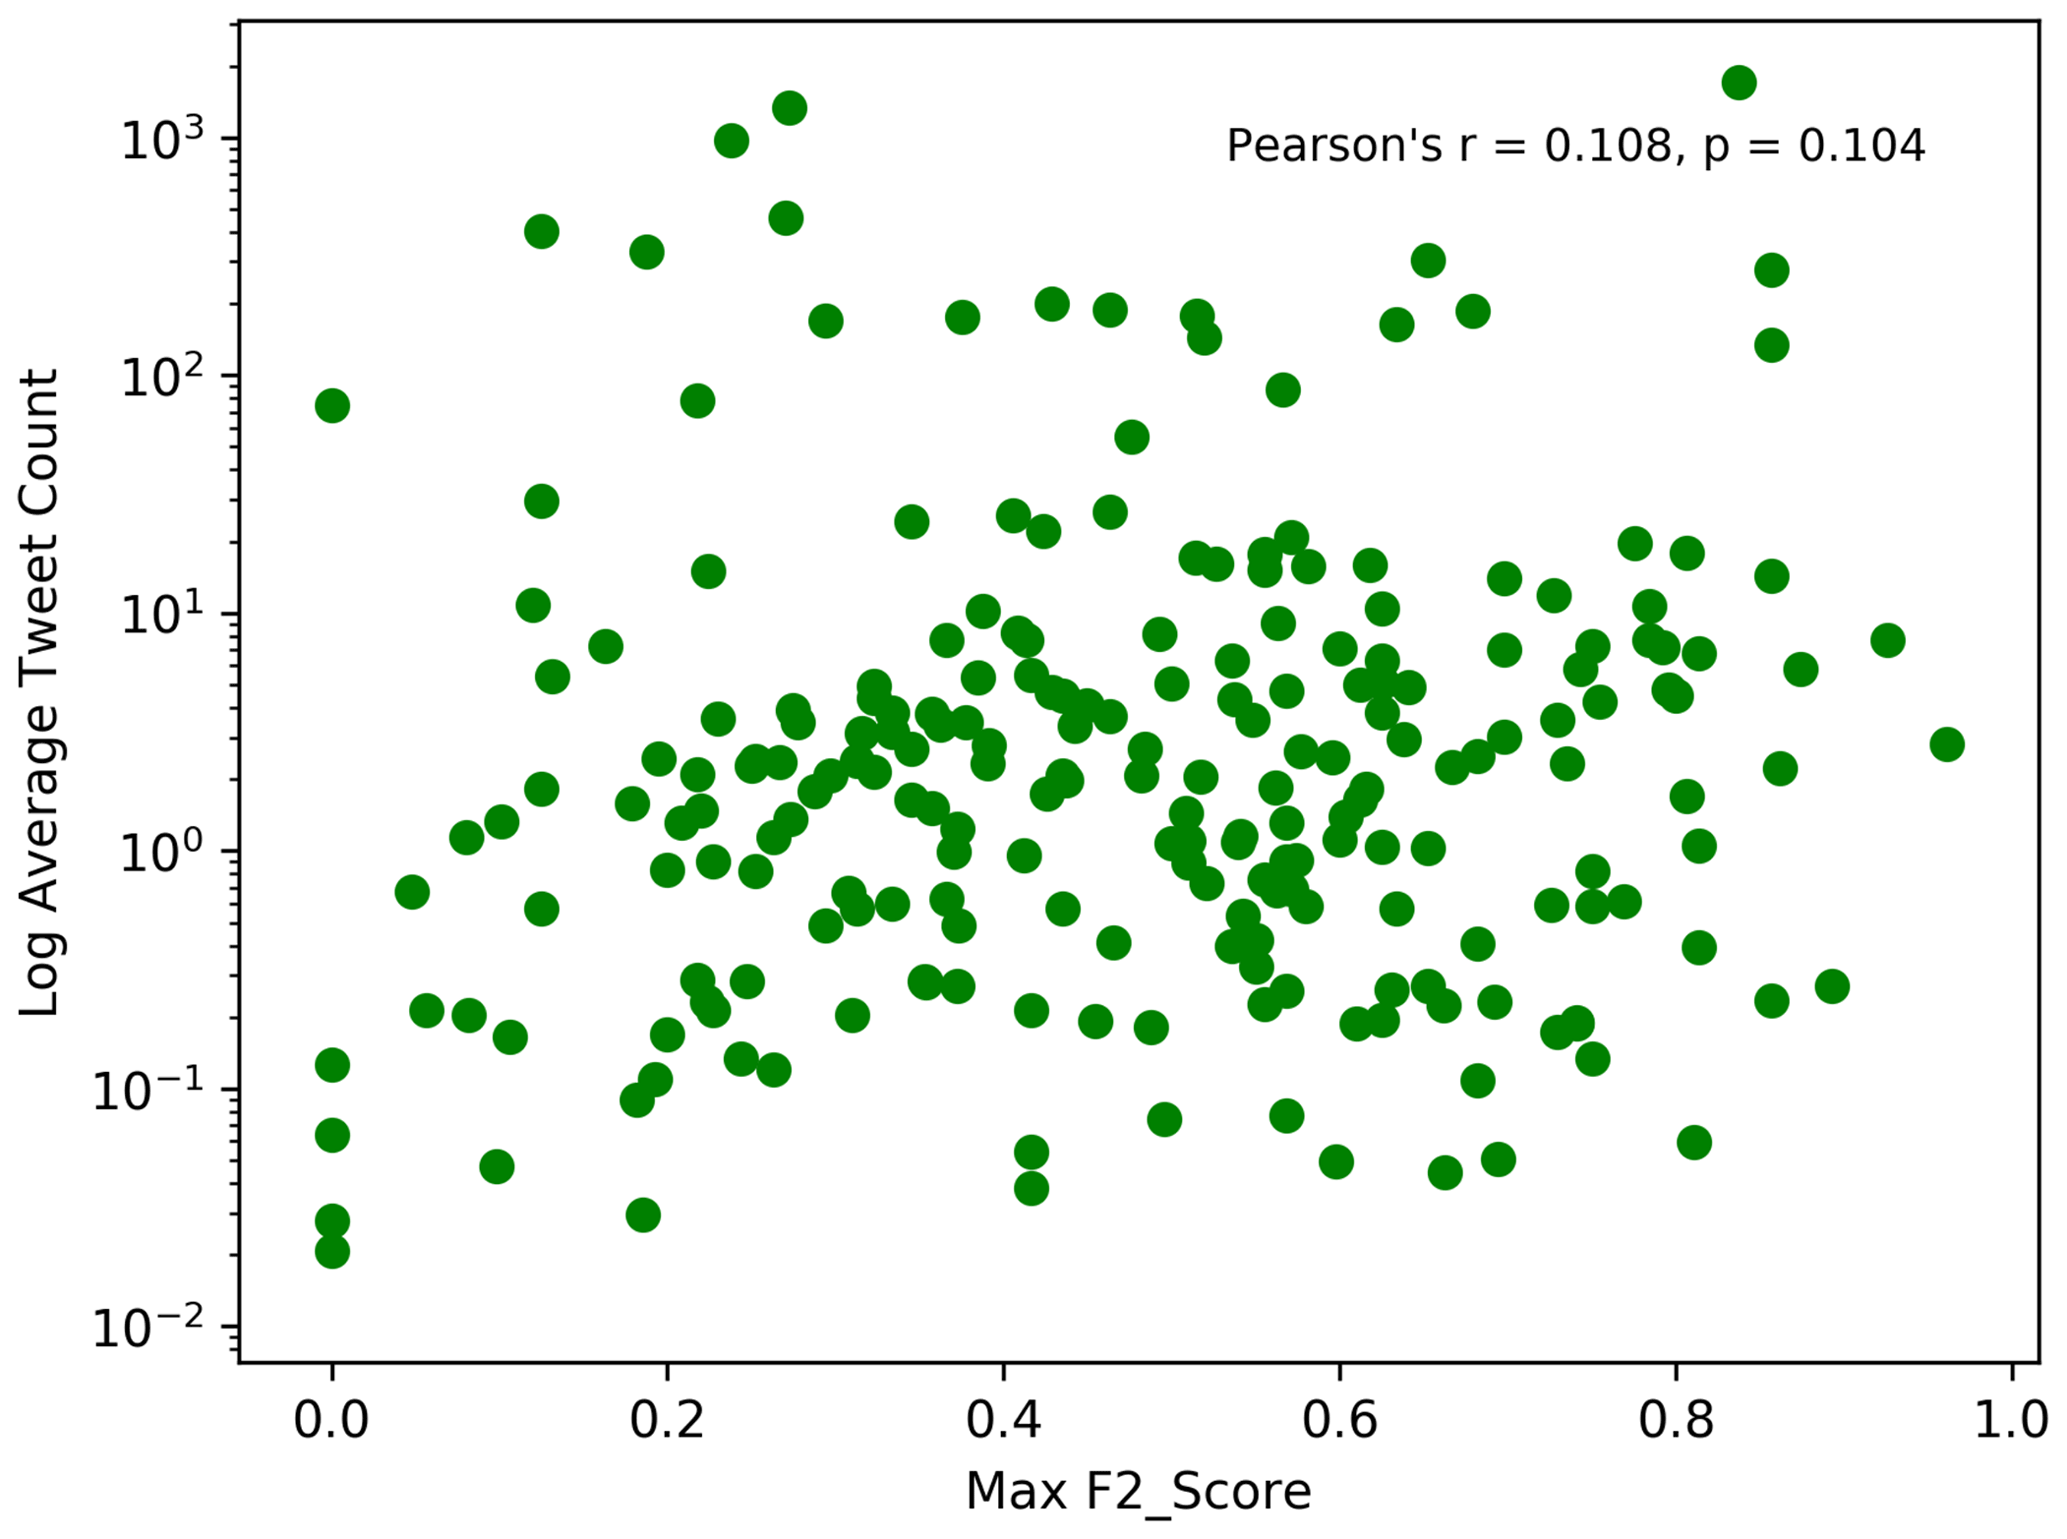
Figure 10Log average number of tweets versus the maximum F2 score for each location with an event in the Met Office database.
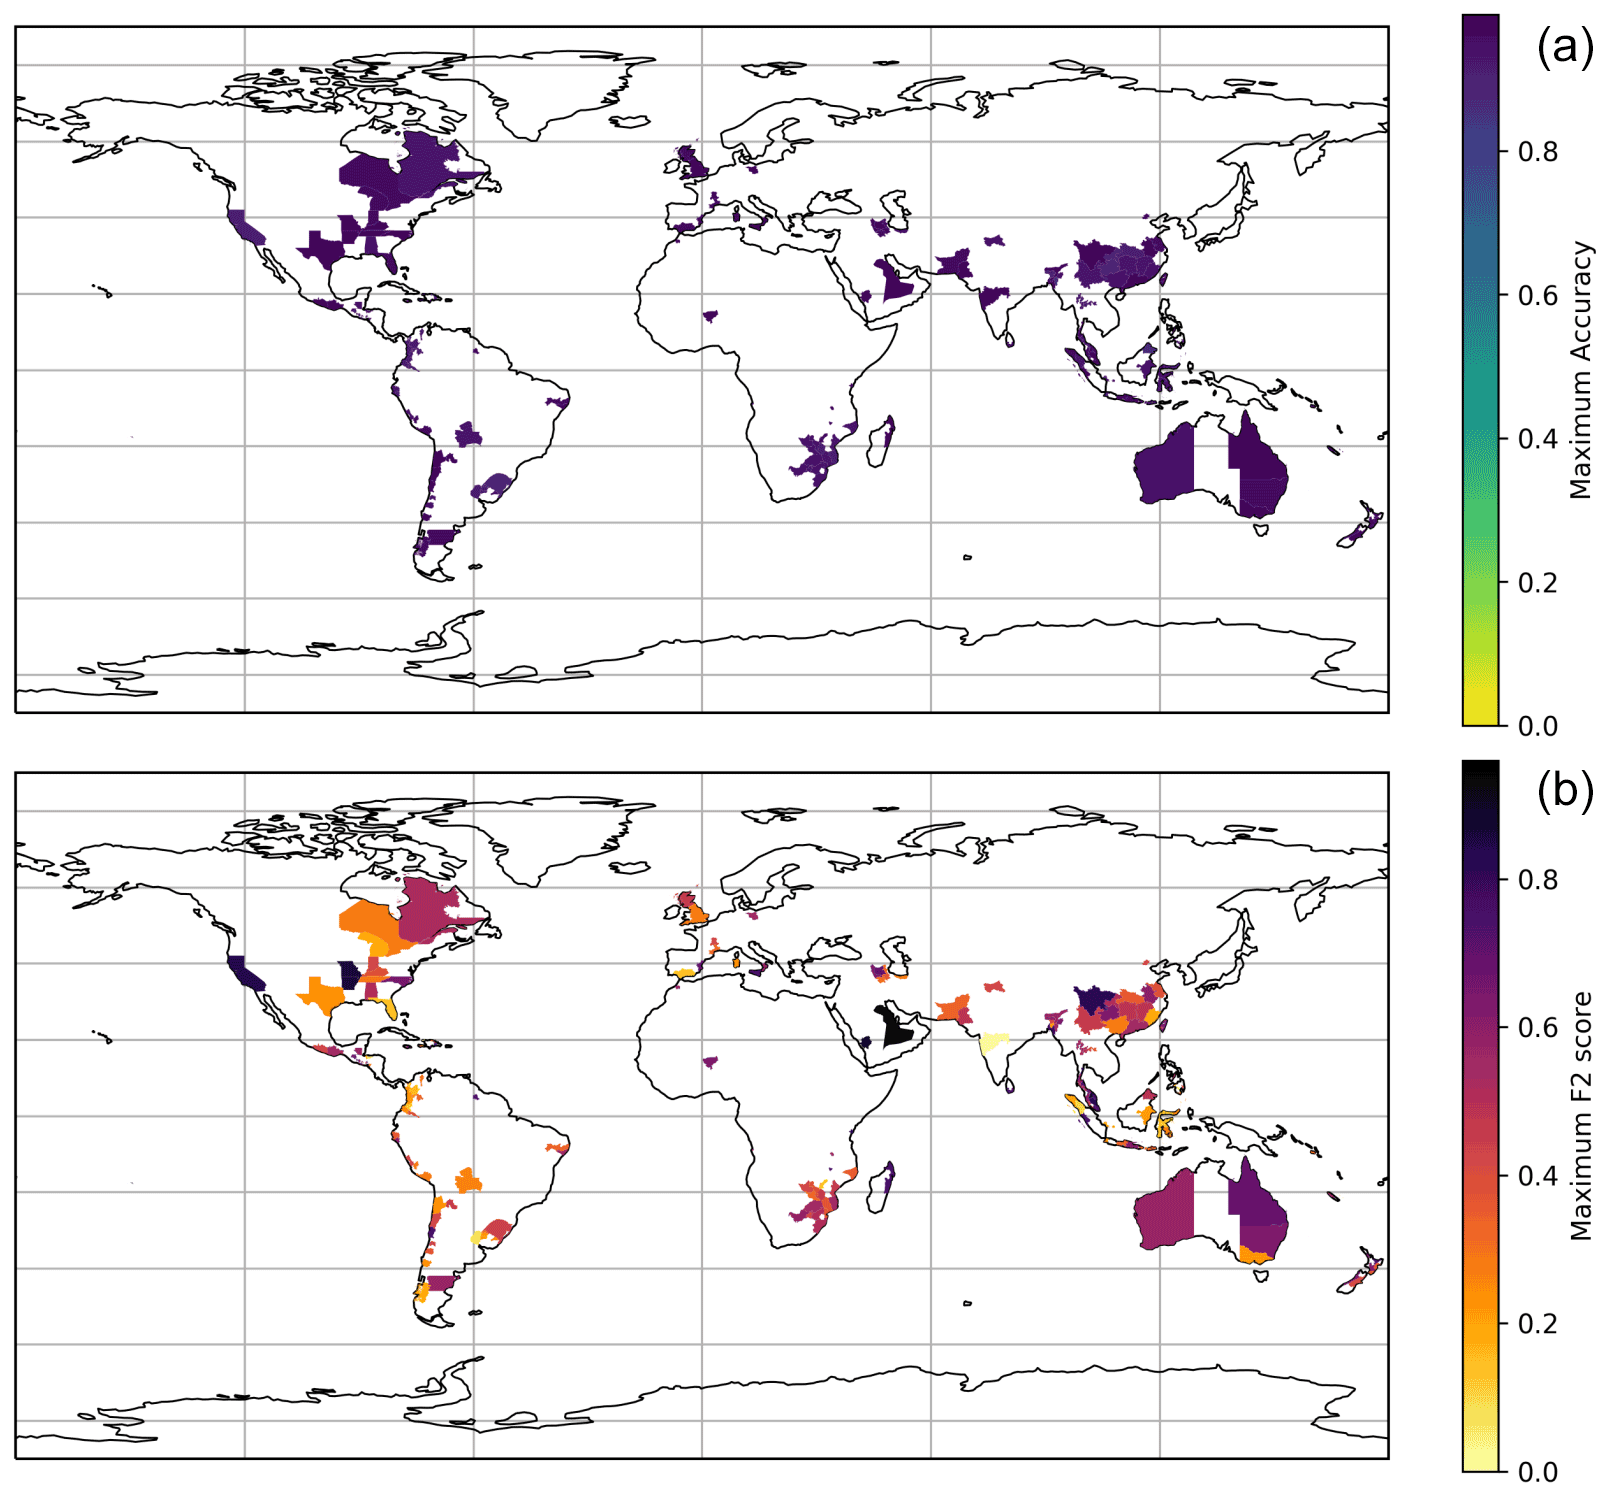
Figure 11(a) Global map showing the average accuracy of true positives between filtered heavy rainfall tweet activity and events in the Met Office impact database for each GADM level 1 administrative area with an event recorded in the Met Office database during the period. (b) Global map showing the maximum F2 score of precision/recall between filtered heavy rainfall tweet activity and events in the Met Office impact database for each GADM level 1 administrative area with an event recorded in the Met Office database during the period.
3.4.3 Performance of social sensing around the world
The performance of social sensing in different locations across the world was also examined. Figure 11 shows the maximum accuracy for each GADM level 1 administrative area with an event recorded in the Met Office database. Accuracy is calculated based on the proportion of true results among the total number of cases examined, with 1 being 100 % accuracy, i.e. no false positive or negatives, and 0 being 0 % accuracy, i.e. no true events found. Figure 11 shows how the accuracy is high for all areas where social sensing was compared to the Met Office database. The maximum accuracy achieved for each area ranges from 86 % to 99 %. The high accuracy achieved suggests that the social sensing method detected almost all events in the Met Office database. However, as we are also interested in how well our social sensing method detects high-impact rainfall events which are not in the Met Office database, the F2 score (which also takes this into account) is likely to provide a more realistic measure of how well, or otherwise, the social sensing method detected events in the database.
Figure 11 also shows the maximum F2 score for the GADM level 1 administrative areas with an event recorded in the Met Office database. It is clear from this figure that there are some places where the method works particularly well (e.g. Australia, some parts of the USA and Saudi Arabia) and others where the method does not work as well (e.g. Europe and India). This may be in part due to language limitations, as only English language tweets were analysed. It may also be due to some parts of the world where rainfall is more common or the time frame of the study being only 6 months, meaning some areas' heavy rainfall (e.g. Indian monsoon) are not included.
This study has shown the potential of the social sensing of Twitter data to identify and locate high-impact rainfall events across the world. Social sensing can help to support the curation of impact data following extreme weather events, which may in turn support better evaluation of impact-based forecasts and the development of new impact models. The process used to generate the Met Office impact database can produce high-quality and detailed records, with few, if any, false positives. However, manual collection is extremely laborious, resource intensive and ultimately unsustainable for many meteorological services. This could be improved by developing automated procedures which accomplish the same goal. Social sensing is one automated approach which could be used to automatically identify events breaching a predetermined threshold. We have seen that social sensing achieves high coverage (few false negatives); thus, the addition of a social sensing tool to enhance impact data collection as part of a semi-automated process is very promising and would allow high-quality impact data to be collected with significantly reduced manual work.
Comparison of social sensing results with the Met Office impact database identified a number of surprising results, which may highlight both limitations in the design of the Met Office database and also opportunities for the two approaches to complement one another. In particular, we found that there were a number of events identified in the Twitter data which were not included in the Met Office database. While recorded as false positives when calculating the precision and recall of the social sensing approach, many of these peaks in tweet activity were found to be true events after further investigation. On closer inspection, these events would have met the criteria for being assigned an impact severity category and are therefore genuine omissions from the Met Office database. There are a number of possible reasons for this disparity. First, we speculate that there are a number of high-impact rainfall events that occurred but were not captured by Met Office data collection methods, e.g. due to the focus on English language news sources or because they did not meet the inclusion criteria of that database. The Met Office database does not include news reports which did not make clear reference to the cause of the impacts. For example, if flooding and associated impacts were reported but did not make clear reference to heavy rainfall as the trigger, then the report would not have been included in the Met Office database. There were also temporal and spatial constraints on report inclusion into the Met Office database so that flood events associated with groundwater or significant fluvial flooding (caused by long-term rainfall over a season, for example) were not included. This was because the Met Office global hazard map (GHM) focuses on forecasting daily heavy rainfall events, and therefore, the impact database was generated with an evaluation of those forecasts in mind. By contrast, in the Twitter data an event would be inferred by the volume of discussion about rainfall/flooding alone, without this context. Therefore, differences between the two data sets in this case would be expected. Second, there is a difference in style of reporting between Twitter, which typically provides an individual's identification of a single high-impact event based on their own experience and subjective perception of impact, compared with the dominant sources used to produce the Met Office impact database, which typically try to be objective and tend to aggregate impacts (e.g. news media often report aggregated impacts associated with an event). This means that Twitter data may pick up a greater number of smaller-scale, localised impacts which are often missed in broader, aggregated sources (e.g. FloodList). Third, we note that the presence of tweets relating to rainfall in a region does not indicate that a major rainfall event occurred. It is likely that many tweets are written in reference to minor or normal rainfall and not in response to an extreme event. However, the disparity in coverage between Met Office data and Twitter data does suggest that the social sensing approach may facilitate more effective wide-scale observation of high-impact rainfall events.
It was also found that events in the Met Office impact database were more likely to correlate with events detected using social sensing for English-speaking countries. This is not surprising given that the data collected from Twitter was in the English language, and the methods used to collate the records of impact events in the Met Office database also relied on news and media sources in English. While the limitations on language would lead to a clear English language bias in terms of performance, it was encouraging to find that social sensing with English tweets does still work well in some countries speaking other languages and also that the number of tweets in a location does not adversely affect the social sensing method.
The most impactful events in the Met Office database (impact severity category 4) also returned better success using the social sensing approach than the lower severity categories, which is not an unexpected result given that events of this magnitude are likely to generate more interest in social media channels. What was surprising, however, was that events in severity category 1 had better recall than severity categories 2 or 3. One possible reason for the strong performance of severity category 1 events is because of the style of reporting by Twitter users. Category 1 includes localised impacts and low-level disruption (i.e. disruption to daily life, delays and short-term inaccessibility to services). Given the individualistic nature of Twitter reporting, it is likely that these types of impacts are registered more routinely, while such events have to reach an undetermined significance (in terms of interest) threshold to be reported in the media or in other aggregated data sources. It should also be noted that the frequency of events in each severity category, within the Met Office database, is uneven, with events assigned to severity category 3 far outweighing the number of category 4 events.
Limitations and further work
The main limitation to studies of this type is the lack of data to confirm the absolute truth for validating our findings. In this case, there is no definitive list of all impactful heavy rainfall events across the world that we can refer to. While the Met Office database was laborious and time consuming to collect, it is very useful because it pulls information from a wide range of sources, it includes all events found, regardless of location in the world, and it has clear and consistent criteria for events to be included within it. We have also shown that Twitter is a good source of data for event detection. Therefore, what has been presented in this study is a comparison of two data sets, which, if combined together, could help to provide a more holistic view of heavy rainfall impacts across the world.
Another limitation for this study is that only 6 months of data were examined. This means that locations which experience high rainfall at different times of the year to the period of this study (e.g. the Indian monsoon season) would have been underrepresented. Any further work in this area should consider extending the timeframe to include all likely weather extremes across the year. This would be important as it will support improved understanding of tweet behaviour between wet and dry seasons where these occur. The underlying tweet counts which were used to calculate percentiles would also benefit from being calculated for a longer time frame (e.g. 3–5 years) rather than just the period of this study. This would likely yield better results in terms of identifying peaks in Twitter data.
Tweaks to the underlying method may also benefit the performance of social sensing for both similar studies to this one and other studies comparing Twitter data with other data sets. In relation to this study, the terms included in the Twitter API search could be extended to be wholly in line with terms used to find news and media sources for the Met Office database. For example, the tweet collection only included the word “landslide”; however, the Met Office database would have also included other terms such as “mudslide” and “land slip” in searches for news reports. The development of libraries of suitable search terms can be considered somewhat easier for hazards, which often have well-defined usage, compared with terms that aim to identify socioeconomic impacts. This work has focussed on identifying impacts based on the occurrence of tweets with specific hazard phrases rather than socioeconomic impact phrases. Further analysis of tweet text from filtered tweets to extract information about the types of impacts being experienced by Twitter users would be an obvious next step. This could then be used to further classify the events in line with the Met Office impact severity category criteria or to help to refine impact severity categorisation. It is likely that a combination approach could yield additional insights into the details of high-impact events, but further work would be required to fully establish the utility of Twitter for providing detailed impact assessment.
Extending this study to investigate if tweet activity relating to heavy rainfall (or other weather types) could be monitored globally in real time would greatly add weight to its long-term utility as a source of impact data. One of the primary limitations of our method is the exclusive use of English. We have demonstrated in Sect. 3.1 that we achieve good global coverage despite this restriction, but as shown in Fig. 7, our ability to detect events is lower in countries where English is not a native language. Applying this methodology in real time and as a source of impact data on a global scale would require a similar list of key words to be generated in a number of other major languages, especially those popular on Twitter. The subsequent location inference and relevance filtering steps would also have to be optimised to be language agnostic. Though English is the most popular language on Twitter (Mocanu et al., 2013), the majority of tweets are in other languages, with Spanish, Malay and Indonesian making up a significant proportion. We have demonstrated that there is significant benefit to this methodology working with English tweets only, but we must keep this bias in mind and look to add other major languages in future work.
Despite the acknowledged limitations and the recommendations for further methodological work, this study shows that it is possible to use Twitter data to identify high-impact rainfall events and their impacts globally. Furthermore, the type of record that Twitter provides (i.e. eyewitness accounts and individual reports of events taking place) is different in nature to the aggregated sources that the Met Office database and other similar databases use. Therefore, Twitter data can be used as a “first pass” event detection tool, largely automating the difficult manual curation task. Prototyping this methodology in real time to generate an automated Twitter-based impact database would be the next step. It would also be interesting to repeat the impact-based evaluation methodology described in Robbins and Titley (2018) using a Twitter-based impact database. Based on the findings from this work, we believe that a method that utilises the strengths of both methods (social sensing methodology and media/aggregated data collection from trusted sources) could lead to an enhanced approach for sustainable and robust impact data collection. The generation of a framework to bring these data together would allow the impact-based evaluation method to migrate away from its original, semi-automated approach to a fully automated impact-based evaluation methodology.
In this study, data were collected from Twitter in the first half of 2017 relating to mentions of rainfall and the impacts of rainfall across the world. These data were analysed and compared with a manually curated database of global rainfall events that caused socioeconomic impacts collated by the Met Office for the same period of time. The aim was to assess the potential of using Twitter as a source of impact data following a significant weather event. A social sensing methodology was used to apply various computational techniques to filter and extract only those tweets from the data set of relevance to the impacts of a heavy rainfall event. Tweets without geo-located coordinates were then further processed to infer the location of the tweet, or event mentioned in the tweet, so that the location of the rainfall event could also be determined. Using the percentile of the number of tweets for a particular day and location as a proxy for the likelihood of an impactful event taking place, this accounted for the prevalence of tweets in each location. Comparison of these spikes of activity within the filtered Twitter data with the Met Office database of high-impact rainfall events finds that the majority of events recorded by the Met Office were also detected using social sensing. Interestingly, the social sensing approach also found additional impactful rainfall events within the Twitter data which were not recorded in the Met Office database. It was also encouraging to find that social sensing with English tweets still worked well in some countries speaking other languages and also that the number of tweets in a location does not adversely affect the social sensing method. This suggests that social sensing of Twitter data would be a useful addition to current impact data collection processes.
The Python code is available on request in a private GitHub repository (https://github.com/seda-lab/social_sensing, last access: 17 December 2020) (Seda-lab, 2020), which can be made available on request.
Data used in this study were collected using the Twitter API. Due to Twitter's policy on redistributing Twitter content (https://developer.twitter.com/en/developer-terms/more-on-restricted-use-cases, last access: 17 December 2020) (Twitter, 2020), the tweet data cannot be made publicly available but can be provided on request in the form of tweet IDs which can be rehydrated with the tweet content by the requester using the Twitter API.
All authors collaborated on the conceptualisation of the study, with MDS taking the lead in writing the paper. The social sensing methodology was developed by RA and MDS, with formal analysis for this study carried out by MDS. The Met Office database was provided by JR. All authors assisted with writing the paper.
The authors declare that they have no conflict of interest.
No funding body influenced the content or publication of this study.
Publisher's note: Copernicus Publications remains neutral with regard to jurisdictional claims in published maps and institutional affiliations.
Michelle D. Spruce is funded by a doctoral studentship from the UK Engineering and Physical Sciences Research Council. Hywel T. P. Williams acknowledges funding from UK Natural Environment Research Council, as detailed below.
This research has been supported by the UK Natural Environment Research Council (grant no. NE/P017436/1).
This paper was edited by Olga Petrucci and reviewed by two anonymous referees.
Aisha, T. S., Wok, S., Manaf, A. M. A., and Ismail, R.: Exploring the Use of Social Media During the 2014 Flood in Malaysia, Procedia - Soc. Behav. Sci., 211, 931–937, https://doi.org/10.1016/J.SBSPRO.2015.11.123, 2015.
Arthur, R., Boulton, C. A., Shotton, H., and Williams, H. T. P.: Social sensing of floods in the UK, available at: https://journals.plos.org/plosone/article?id=10.1371/journal.pone.0189327 (last access: 17 December 2020), 2018.
Bossu, R., Fallou, L., Landès, M., Roussel, F., Julien-Laferrière, S., Roch, J., and Steed, R.: Rapid Public Information and Situational Awareness After the November 26, 2019, Albania Earthquake: Lessons Learned From the LastQuake System, Front. Earth Sci., 8, 235, https://doi.org/10.3389/feart.2020.00235, 2020.
Boulton, C. A., Shotton, H., and Williams, H. T. P.: Using social media to detect and locate wildfires, in Tenth International AAAI Conference on Web and Social Media, AAAI, available at: https://www.aaai.org/ocs/index.php/ICWSM/ICWSM16/paper/view/13204 (last access: 14 October 2019), 2016.
Brouwer, T., Eilander, D., van Loenen, A., Booij, M. J., Wijnberg, K. M., Verkade, J. S., and Wagemaker, J.: Probabilistic flood extent estimates from social media flood observations, Nat. Hazards Earth Syst. Sci., 17, 735–747, https://doi.org/10.5194/nhess-17-735-2017, 2017.
Campbell, R., Beardsley, D., and Sezin, T.: Impact-based Forecasting and Warning: Weather Ready Nations, World Meteorological Organization, available at: https://public.wmo.int/en/resources/bulletin/impact-based-forecasting-and-warning-weather-ready-nations (last access: 19 January 2020), 2018.
Cervone, G., Sava, E., Huang, Q., Schnebele, E., Harrison, J., and Waters, N.: Using Twitter for tasking remote-sensing data collection and damage assessment: 2013 Boulder flood case study, Int. J. Remote Sens., 37, 100–124, https://doi.org/10.1080/01431161.2015.1117684, 2016.
Clement, J.: Twitter – Statistics & Facts, Statista, available at: https://www.statista.com/topics/737/twitter/, last access: 19 March 2020.
Cowie, S., Arthur, R., and Williams, H. T. P.: @choo: Tracking Pollen and Hayfever in the UK Using Social Media, Sensors, 18, 4434, https://doi.org/10.3390/s18124434, 2018.
DBpedia: A Public Data Infrastructure for a Large, Multilingual, Semantic Knowledge Graph, available at: https://wiki.dbpedia.org/, last access: 13 October 2020.
de Bruijn, J. A., de Moel, H., Jongman, B., de Ruiter, M. C., Wagemaker, J., and Aerts, J. C. J. H.: A global database of historic and real-time flood events based on social media, Sci. Data, 6, 311, https://doi.org/10.1038/s41597-019-0326-9, 2019.
Dredze, M., Paul, M. J., Bergsma, S., and Tran, H.: Carmen: A Twitter Geolocation System with Applications to Public Health, available at: https://pdfs.semanticscholar.org/9bc4/6fb12f2c7fae0e9e56e734e6efb9ca07fd98.pdf (last access: 17 December 2020), 2013.
Fang, J., Hu, J., Shi, X., and Zhao, L.: Assessing disaster impacts and response using social media data in China: A case study of 2016 Wuhan rainstorm, Int. J. Disast. Risk Reduct., 34, 275–282, https://doi.org/10.1016/j.ijdrr.2018.11.027, 2019.
Geonames: GeoNames, available at: https://www.geonames.org/, last access: 11 June 2020.
Guan, X. and Chen, C.: Using social media data to understand and assess disasters, Nat. Hazards, 74, 837–850, https://doi.org/10.1007/s11069-014-1217-1, 2014.
Han, X. and Wang, J.: Using social media to mine and analyze public sentiment during a disaster: A case study of the 2018 Shouguang city flood in china, ISPRS Int. J. Geo-Information, available at: https://www.mdpi.com/2220-9964/8/4/185 (last access: 17 December 2020), 2019.
Kankanamge, N., Yigitcanlar, T., Goonetilleke, A., and Kamruzzaman, M.: Determining disaster severity through social media analysis: Testing the methodology with South East Queensland Flood tweets, Int. J. Disast. Risk Reduct., 42, 101360, https://doi.org/10.1016/j.ijdrr.2019.101360, 2020.
Kim, J. and Hastak, M.: Social network analysis: Characteristics of online social networks after a disaster, Int. J. Inf. Manage., 38, 86–96, https://doi.org/10.1016/J.IJINFOMGT.2017.08.003, 2018.
Koehrsen, W.: Beyond Accuracy: Precision and Recall, by Will Koehrsen, Towards Data Science, Towar. Data Sci., available at: https://towardsdatascience.com/beyond-accuracy-precision-and-recall-3da06bea9f6c (last access: 2 October 2020), 2018.
Lachlan, K. A., Spence, P. R., Lin, X., and Del Greco, M.: Screaming into the Wind: Examining the Volume and Content of Tweets Associated with Hurricane Sandy, Commun. Stud., 65, 500–518, https://doi.org/10.1080/10510974.2014.956941, 2014.
Li, Z., Wang, C., Emrich, C. T., and Guo, D.: A novel approach to leveraging social media for rapid flood mapping: a case study of the 2015 South Carolina floods, Cartogr. Geogr. Inf. Sci., 45, 97–110, https://doi.org/10.1080/15230406.2016.1271356, 2018.
Liu, X., Zhang, S., Wei, F., and Zhou, M.: Recognizing Named Entities in Tweets, Association for Computational Linguistics, available at: http://sourceforge.net/projects/opennlp/ (last access: 19 May 2020), 2011.
Liu, Y., Liu, X., Gao, S., Gong, L., Kang, C., Zhi, Y., Chi, G., and Shi, L.: Social Sensing: A New Approach to Understanding Our Socioeconomic Environments, Ann. Assoc. Am. Geogr., 105, 512–530, https://doi.org/10.1080/00045608.2015.1018773, 2015.
Mocanu, D., Baronchelli, A., Perra, N., Gonçalves, B., Zhang, Q., and Vespignani, A.: The Twitter of Babel: Mapping World Languages through Microblogging Platforms, PLoS One, 8, 61981, https://doi.org/10.1371/journal.pone.0061981, 2013.
Morss, R. E., Demuth, J. L., Lazrus, H., Palen, L., Barton, C. M., Davis, C. A., Snyder, C., Wilhelmi, O. V., Anderson, K. M., Ahijevych, D. A., Anderson, J., Bica, M., Fossell, K. R., Henderson, J., Kogan, M., Stowe, K., Watts, J., Morss, R. E., Demuth, J. L., Lazrus, H., Palen, L., Barton, C. M., Davis, C. A., Snyder, C., Wilhelmi, O. V., Anderson, K. M., Ahijevych, D. A., Anderson, J., Bica, M., Fossell, K. R., Henderson, J., Kogan, M., Stowe, K., and Watts, J.: Hazardous Weather Prediction and Communication in the Modern Information Environment, B. Am. Meteorol. Soc., 98, 2653–2674, https://doi.org/10.1175/BAMS-D-16-0058.1, 2017.
Morstatter, F., Pfeffer, J., Liu, H., and Carley, K. M.: Is the Sample Good Enough? Comparing Data from Twitter's Streaming API with Twitter's Firehose, in: Proceedings of the 7th International Conference on Weblogs and Social Media, ICWSM 2013, AAAI Press, 400–408, arxiv: preprint, available at: http://arxiv.org/abs/1306.5204 (last access: 14 October 2019), 2013.
Niles, M. T., Emery, B. F., Reagan, A. J., Dodds, P. S., and Danforth, C. M.: Social media usage patterns during natural hazards, edited by: Lozano, S., PLoS One, 14, e0210484, https://doi.org/10.1371/journal.pone.0210484, 2019.
Rainear, A. M., Lachlan, K. A., Oeldorf-Hirsch, A., and DeVoss, C. L.: Examining twitter content of state emergency management during Hurricane Joaquin, Commun. Res. Rep., 35, 325–334, https://doi.org/10.1080/08824096.2018.1503945, 2018.
Robbins, J. C. and Titley, H. A.: Evaluating high-impact precipitation forecasts from the Met Office Global Hazard Map (GHM) using a global impact database, Meteorol. Appl., 25, 548–560, https://doi.org/10.1002/met.1720, 2018.
Rossi, C., Acerbo, F. S., Ylinen, K., Juga, I., Nurmi, P., Bosca, A., Tarasconi, F., Cristoforetti, M., and Alikadic, A.: Early detection and information extraction for weather-induced floods using social media streams, Int. J. Disast. Risk Reduct., 30, 145–157, https://doi.org/10.1016/j.ijdrr.2018.03.002, 2018.
Sakaki, T., Okazaki, M., and Matsuo, Y.: Earthquake shakes Twitter users, in: Proceedings of the 19th international conference on World wide web – WWW '10, ACM Press, New York, USA, p. 851, 2010.
Schulz, A., Hadjakos, A., Paulheim, H., Nachtwey, J., and Uhlhäuser, M.: A Multi-Indicator Approach for Geolocalization of Tweets, in: Proceedings of the 7th International Conference on Weblogs and Social Media, ICWSM 2013, AAAI Press, 573–582, available at: https://www.aaai.org/ocs/index.php/ICWSM/ICWSM13/paper/viewFile/6063/6397 (last access: 17 December 2020), 2013.
Seda-lab: Social_Sensing, available on request at: https://github.com/seda-lab/social_sensing, last access: 17 December 2020.
Sit, M. A., Koylu, C., and Demir, I.: Identifying disaster-related tweets and their semantic, spatial and temporal context using deep learning, natural language processing and spatial analysis: a case study of Hurricane Irma, Int. J. Digit. Earth, 12, 1205–1229, https://doi.org/10.1080/17538947.2018.1563219, 2019.
Spruce, M., Arthur, R., and Williams, H. T. P.: Using social media to measure impacts of named storm events in the United Kingdom and Ireland, Meteorol. Appl., 27, e1887, https://doi.org/10.1002/met.1887, 2020.
Stewart, M. C. and Gail Wilson, B.: The dynamic role of social media during Hurricane #Sandy: An introduction of the STREMII model to weather the storm of the crisis lifecycle, Comput. Human Behav., 54, 639–646, https://doi.org/10.1016/J.CHB.2015.07.009, 2016.
Twitter: More on Restricted Use Cases, available at: https://developer.twitter.com/en/developer-terms/more-on-restricted-use-cases, last access: 17 December 2020.
Wang, D., Kaplan, L., Le, H., and Abdelzaher, T.: On truth discovery in social sensing: A maximum likelihood estimation approach, in: IPSN'12 – Proceedings of the 11th International Conference on Information Processing in Sensor Networks, ACM Press, New York, USA, 233–244, 2012.
Wang, D., Szymanski, B. K., Abdelzaher, T., Ji, H., and Kaplan, L.: The age of social sensing, Computer (Long. Beach. Calif)., 52, 36–45, https://doi.org/10.1109/MC.2018.2890173, 2019.
Wu, D. and Cui, Y.: Disaster early warning and damage assessment analysis using social media data and geo-location information, Decis. Support Syst., 111, 48–59, https://doi.org/10.1016/j.dss.2018.04.005, 2018.
Zou, L., Lam, N. S. N., Cai, H., and Qiang, Y.: Mining Twitter Data for Improved Understanding of Disaster Resilience, Ann. Am. Assoc. Geogr., 108, 1422–1441, https://doi.org/10.1080/24694452.2017.1421897, 2018.