the Creative Commons Attribution 4.0 License.
the Creative Commons Attribution 4.0 License.
 | 03 Aug 2021
Spatial and temporal subsidence characteristics in Wuhan (China), during 2015–2019, inferred from Sentinel-1 synthetic aperture radar (SAR) interferometry
Shaocheng Zhang
Mi Jiang
Yuanyuan Pei
Tengteng Qu
Chen Yang
Ground subsidence is regarded as one of the most common geohazards, accompanied with the rapid urban expansion in recent years. In the last 2 decades, Wuhan, located in the alluvial Jianghan Plain, has experienced great urban expansion with increased subsidence issues, i.e., soft foundation subsidence and karst collapse. Here we investigated subsidence rates in Wuhan with 2015–2019 Sentinel-1 synthetic aperture radar (SAR) images. We found that the overall subsidence over the Wuhan region is significantly correlated with the distribution of engineering geological subregions (EGSs). We further validated the interferometric SAR (InSAR) measurements with better than 5 mm accuracy by comparing with leveling measurements. Subsidence centers in Qingling–Jiangdi, Houhu, Qingshan, and Dongxihu were identified with displacement rates of approximately 30 mm/yr. Our results demonstrated that the dominant driving factor is ongoing construction, and the fact that the subsidence centers shifted with construction intensities. The Qingling–Jiangdi area in our study is a well-known site of karst collapse. We find that the nonlinear subsidence of this area is correlated with the seasonal rainfall.
- Article
(31730 KB) - Full-text XML
-
Supplement
(1190 KB) - BibTeX
- EndNote


Nowadays, land subsidence has become a serious problem, along with the rapid urban expansion (Xue et al., 2005). Land subsidence events have been reported in major cities all over the world (e.g., Shanghai – see Perissin et al., 2012; Beijing – see Hu et al., 2019, and Zhou et al., 2019; Seville – see Ruiz-Constán et al., 2017; Texas – see Kim et al., 2019; Hanoi – see Dang et al., 2014; Jakarta – see Ng et al., 2012, and Chaussard et al., 2013). Over 50 cities in China have been suffering from land subsidence due to various factors (Yin et al., 2005). The major factors causing urban land subsidence are extensive pumping of groundwater (Xue et al., 2005; Yin et al., 2005), ground fissures (Zhao et al., 2018), and tectonic faults (Xue et al., 2005; Hu et al., 2019), which threat the normal operation of urban systems and people's daily lives. The approximately accumulated economic losses caused by land subsidence reached up to CNY 450–500 billion during 1949–2005 in China (Yin et al., 2005). Therefore, great efforts need to be made to monitor and reduce the risks induced by land subsidence and related issues.
As the largest city in central China, Wuhan has experienced significant urban expansion in the last 2 decades (Tan et al., 2014). The ongoing construction of high-rise buildings and metro lines all over the metropolitan area have induced serious subsidence (Zhou et al., 2017). As a result, the subsidence areas in Wuhan have extended remarkably. In recent years, more than 40 communities in Jiang'an, Jianghan, Qiaokou, and Wuchang districts in Wuhan have experienced ground subsidence, resulting in cracks in buildings and municipal roads in varying degrees (Guan et al., 2016). Although over 300 benchmarks have been set to understand the subsidence trends (Zhou et al., 2017), the coverage of the benchmarks is too sparse to capture the global picture of deformation patterns. Thus, the time series synthetic aperture radar interferometry (InSAR) techniques (e.g., Bai et al., 2016; Costantini et al., 2016; Jiang et al., 2021) making use of the stable pixels in synthetic aperture radar (SAR) images can make up for this limitation. High-resolution TerraSAR-X and COSMO (COnstellation of small Satellites for the Mediterranean basin Observation)-SkyMed SAR images are used to investigate the spatial and temporal subsidence of the Wuhan urban area during 2009–2010 (Bai et al., 2016), 2013–2014 (Costantini et al., 2016), 2013–2015 (Bai et al., 2019), and 2012–2019 (Jiang et al., 2021). They found that the subsidence velocity in Houhu area reached over −70 mm/yr and is mainly correlated with construction activities on quaternary soft clay and carbonate rocks areas (Costantini et al., 2016; Bai et al., 2019). Similar results were also obtained by the Envisat Advanced Synthetic Aperture Radar (ASAR; 2008–2010), ALOS PALSAR (Advanced Land Observing Satellite Phased Array type L-band Synthetic Aperture Radar; 2007–2010), and Sentinel-1 (2015–2019) small baseline subset (SBAS) InSAR analysis (Han et al., 2020), RADARSAT-2 SBAS interferometric SAR (InSAR) analysis from 2015–2018 (Zhang et al., 2019), medium-resolution Sentinel-1 images persistent scatterer interferometry (PSI; Benattou et al., 2018), and SBAS InSAR (Zhou et al., 2017) analysis from 2015–2017. According to geological investigations (Guan et al., 2016; Li et al., 2019), the subsidence might be correlated to engineering geological zones which are seldom studied.
In this study, 113 Sentinel-1 SAR images from April 2015 to September 2019, covering the Wuhan metropolitan area, are analyzed with the SBAS InSAR method to investigate the distribution of potential risks. Comparison between InSAR and leveling measurements are conducted to validate the reliability of our measurements. We found that spatial subsidence patterns are correlated with the distribution of engineering geological zones in the first terrace in Wuhan. Relationships between time series subsidence and rainfall and river level are also discussed.
2.1 The Wuhan metropolitan area
Wuhan, the capital city of Hubei province, plays an important role in industry, science, education, and transportation in China. It is located east of the alluvial Jianghan Plain formed by Yangtze river and its largest tributary, the Han River. The rivers and scattered lakes occupy one-quarter of Wuhan's urban area, as shown in Fig. 1a. Since the launch of “The Rise of Central China” to accelerate the development of central China, including Shanxi, Henan, Anhui, Hubei, Hunan, and Jiangxi in 2004, Wuhan has experienced rapid economic growth and urban sprawl. The annual urban expansion velocity reached 46.75 %, and the urban areas increased from 4.19×10⁴ ha in 1988 to 49.29×10⁴ ha in 2011 (Tan et al., 2014). Figure 1a shows the built-up area in 2015 derived from 1:250 000 national basic geographic database (https://www.webmap.cn/main.do?method=index, last access: 23 July 2020) released by the National Geomatics Center of China.
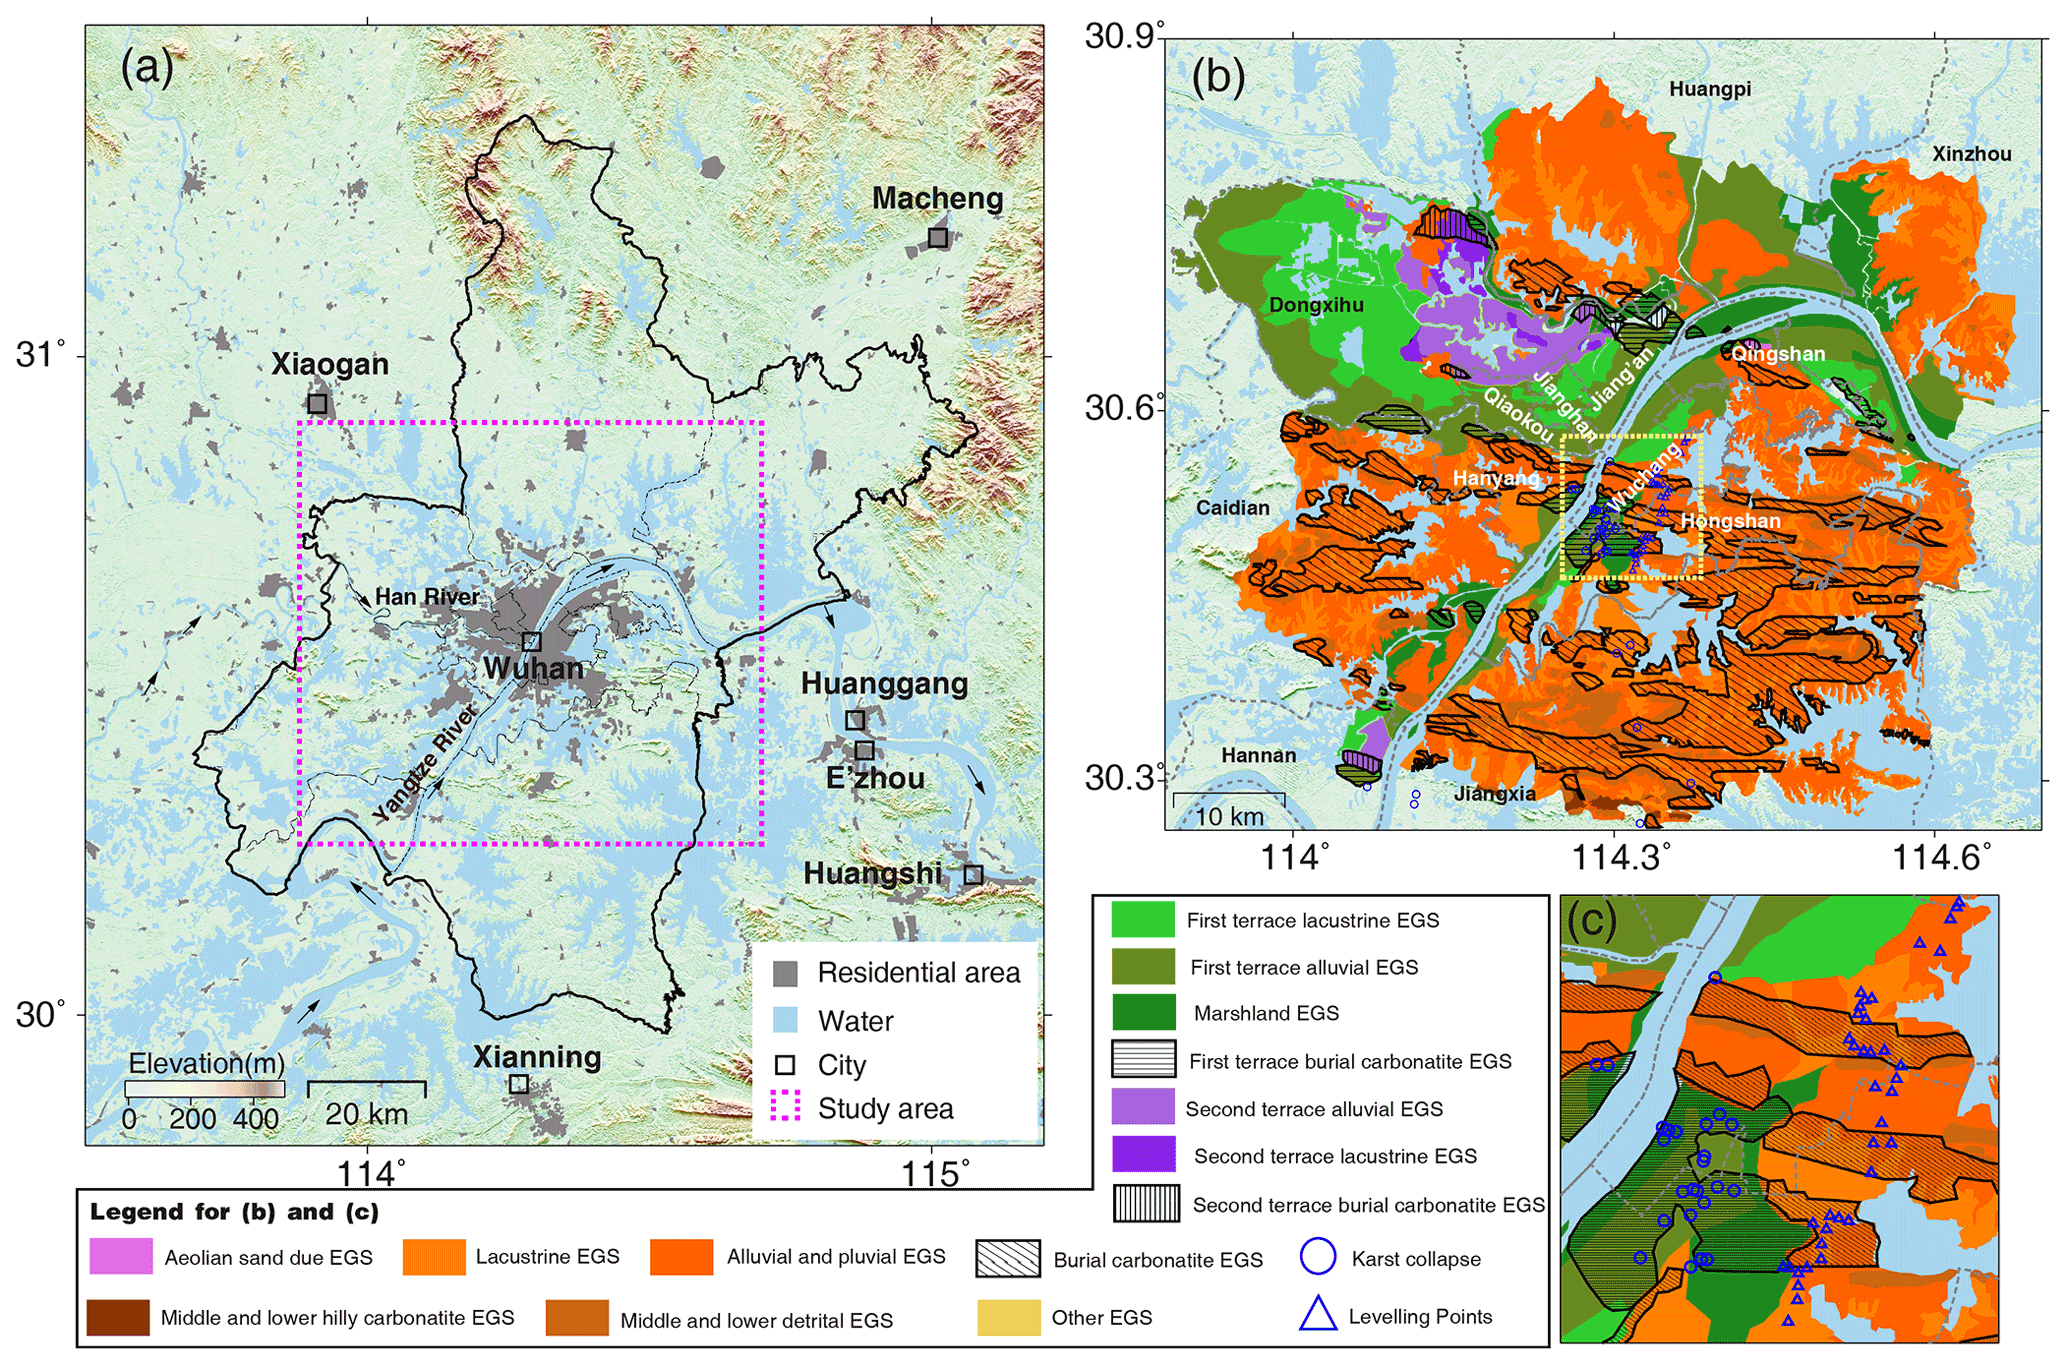
Figure 1(a) Topography of our study area. (b) Engineering geological subregions (EGSs) over the Wuhan metropolitan area, and the distribution of historical karst collapse. (Modified from Li et al., 2019, and Zheng et al., 2019.) (c) Magnified view of the yellow rectangle in (b), showing the locations of historical karst collapses and leveling points.
Our study area covers the Wuhan metropolitan area, as indicated by the dashed rectangle in Fig. 1a. The terrain is low and flat, with maximum a elevation of 240 m. Over 95 % of our study area is covered by Quaternary layers (Deng et al., 1991; Xu, 2016; Li et al., 2019) with diverse lithology, including gravel, sand (coarse sand, fine sand, and silt), sub-sand, sub-clay, clay, muck, etc. (Table S1). Moreover, the area of burial or covered dissolution carbonate rocks (i.e., karst) is 1091.51 km2, accounting for 12.85 % of the total area of Wuhan (Tu et al., 2019; Zheng et al., 2019), as shown in Fig. 1b. In total, 38 karst collapses (i.e., sinkholes; marked with blue circles in Fig. 1b and c) were recorded in Wuhan between 1931–2018 and were caused by anthropogenic activities and natural forces (Tu et al., 2019). A total of 27 of the karst collapses occurred after 2005 and only two of them were caused by natural factors (Tu et al., 2019). Geological investigations are conducted to understand the engineering conditions for urban construction or subsidence mechanisms (Li et al., 2019; Zheng et al., 2019). They divided the metropolitan area into four engineering geological zones (EGZs) and 13 sub-regions by considering the geomorphologic characteristics, Quaternary geological characteristics (e.g., stratum, genesis, lithology, etc.), and the engineering geological properties of soils.
The engineering geological map of Wuhan metropolitan area is shown in Fig. 1b. The four EGZs are first terrace EGZ, second terrace EGZ, wavy hillocky EGZ, and denuded hilly EGZ, which account for approximately 30.27 %, 4.39 %, 60.09 %, and 4.71 % of the Wuhan metropolitan area. The detailed description of 13 engineering geological subregions (EGSs) is given in Table S1. We should note that soft soil is a general term for muck and muck soil. It has the characteristics of high water content, large void ratio, high compressibility, low shear strength, poor bearing capacity, small consolidation coefficient, long consolidation time, poor water permeability, etc. The thickness of soft soil in the first terrace generally ranges from 1–18.5 m, and the maximum value reaches 37 m, while the thicknesses of soft soils is relatively low in the other EGSs ranging from 1–15 m (Wuhan Bureau of Natural Resources and Planning, 2018).
2.2 Data sets
The Sentinel-1 satellite constellation conducted by the European Space Agency (ESA) is composed of Sentinel-1A (launched on 3 April 2014) and Sentinel-1B (launched on 25 April 2016). It is the first sensor utilizing the interferometric wide (IW) swath mode as the main acquisition mode characterized by 5 × 20 m resolution, with a swath width of 250 km. There were 113 ascending track Sentinel-1A IW SAR images acquired between 11 April 2015 and 29 September 2019, as shown in Fig. 2. The ALOS World 3D 30 m (AW3D30) digital surface model (DSM) released by the Japan Aerospace Exploration Agency (JAXA; Takaku et al., 2016) is used for co-registration, differential interferogram generation, and geocoding. Measurements from 38 leveling points (marked with triangles in Fig. 1b), obtained on 10 September 2016, 10 March 2017, 10 October 2017, and 10 May 2018, are used to validate our InSAR measurements.
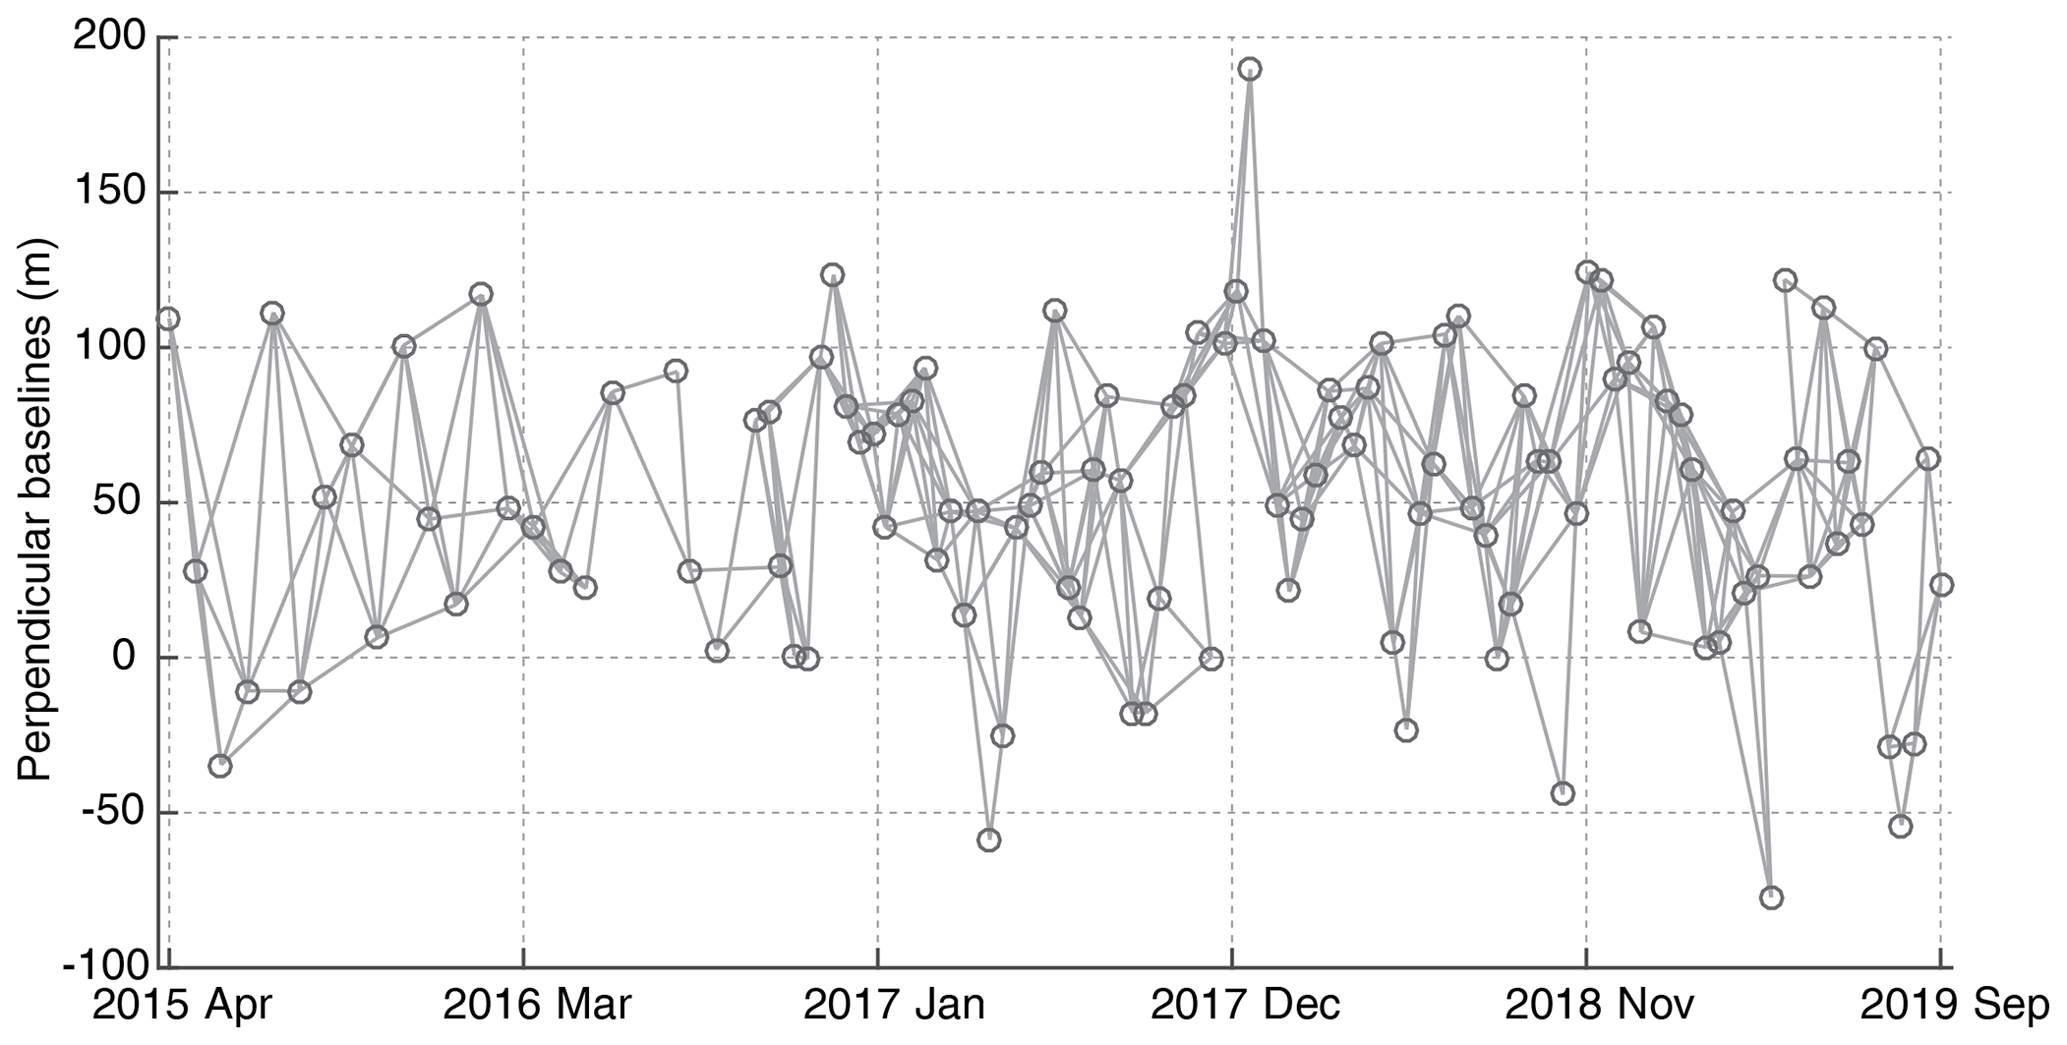
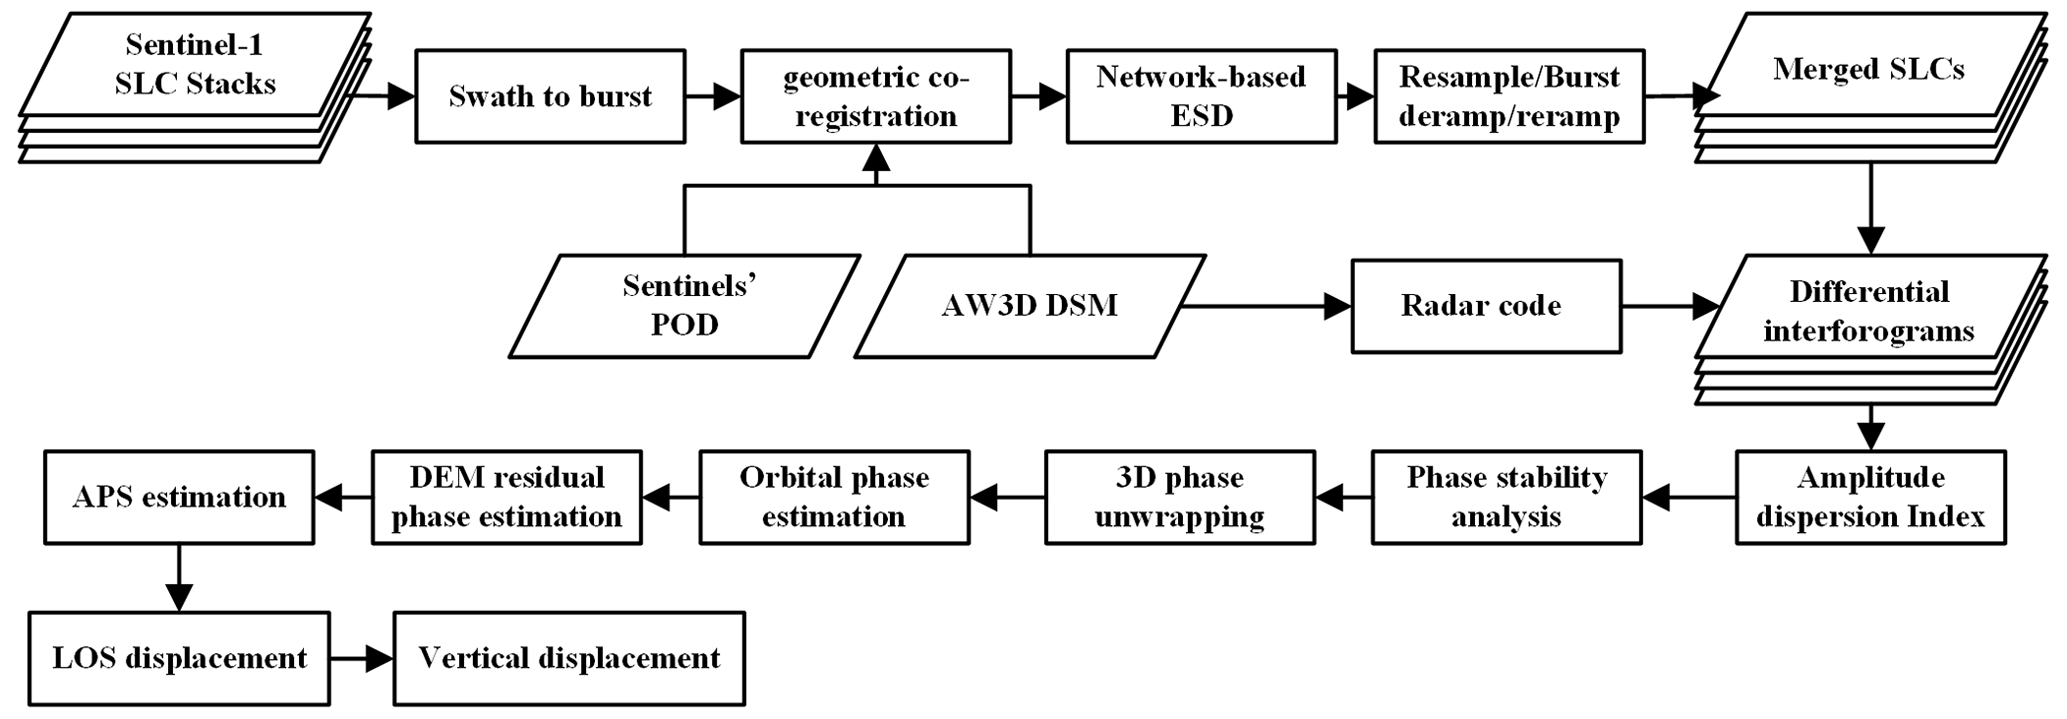
Figure 3Workflow of our study.
3.1 Interferometric processing
Due to the significant variations in Doppler centroid frequency in the burst, high-level co-registration accuracy with better than 0.001 pixels are required for the interferometric analysis (Jiang, 2020). In our study, the image obtained on 26 November 2017 was selected as the primary image. A graphics processing unit (GPU)-accelerated interferometric SAR processor (Yu et al., 2019) was used to process the Sentinel-1 data set. An AW3D30 DSM and Sentinels' Precise Orbit Determination (POD) service were first used for geometric co-registration between consecutive bursts. Then, a network-based enhanced spectral diversity approach was employed to estimate time series azimuth shifts (Jiang, 2020). Burst de-ramping, re-ramping, and resampling were then carried out to resample bursts. Individual bursts can then be merged into seamless single look complexes (SLCs). Images with a temporal baseline of less than 60 d are combined to generate 368 differential interferograms, as shown in Fig. 2.
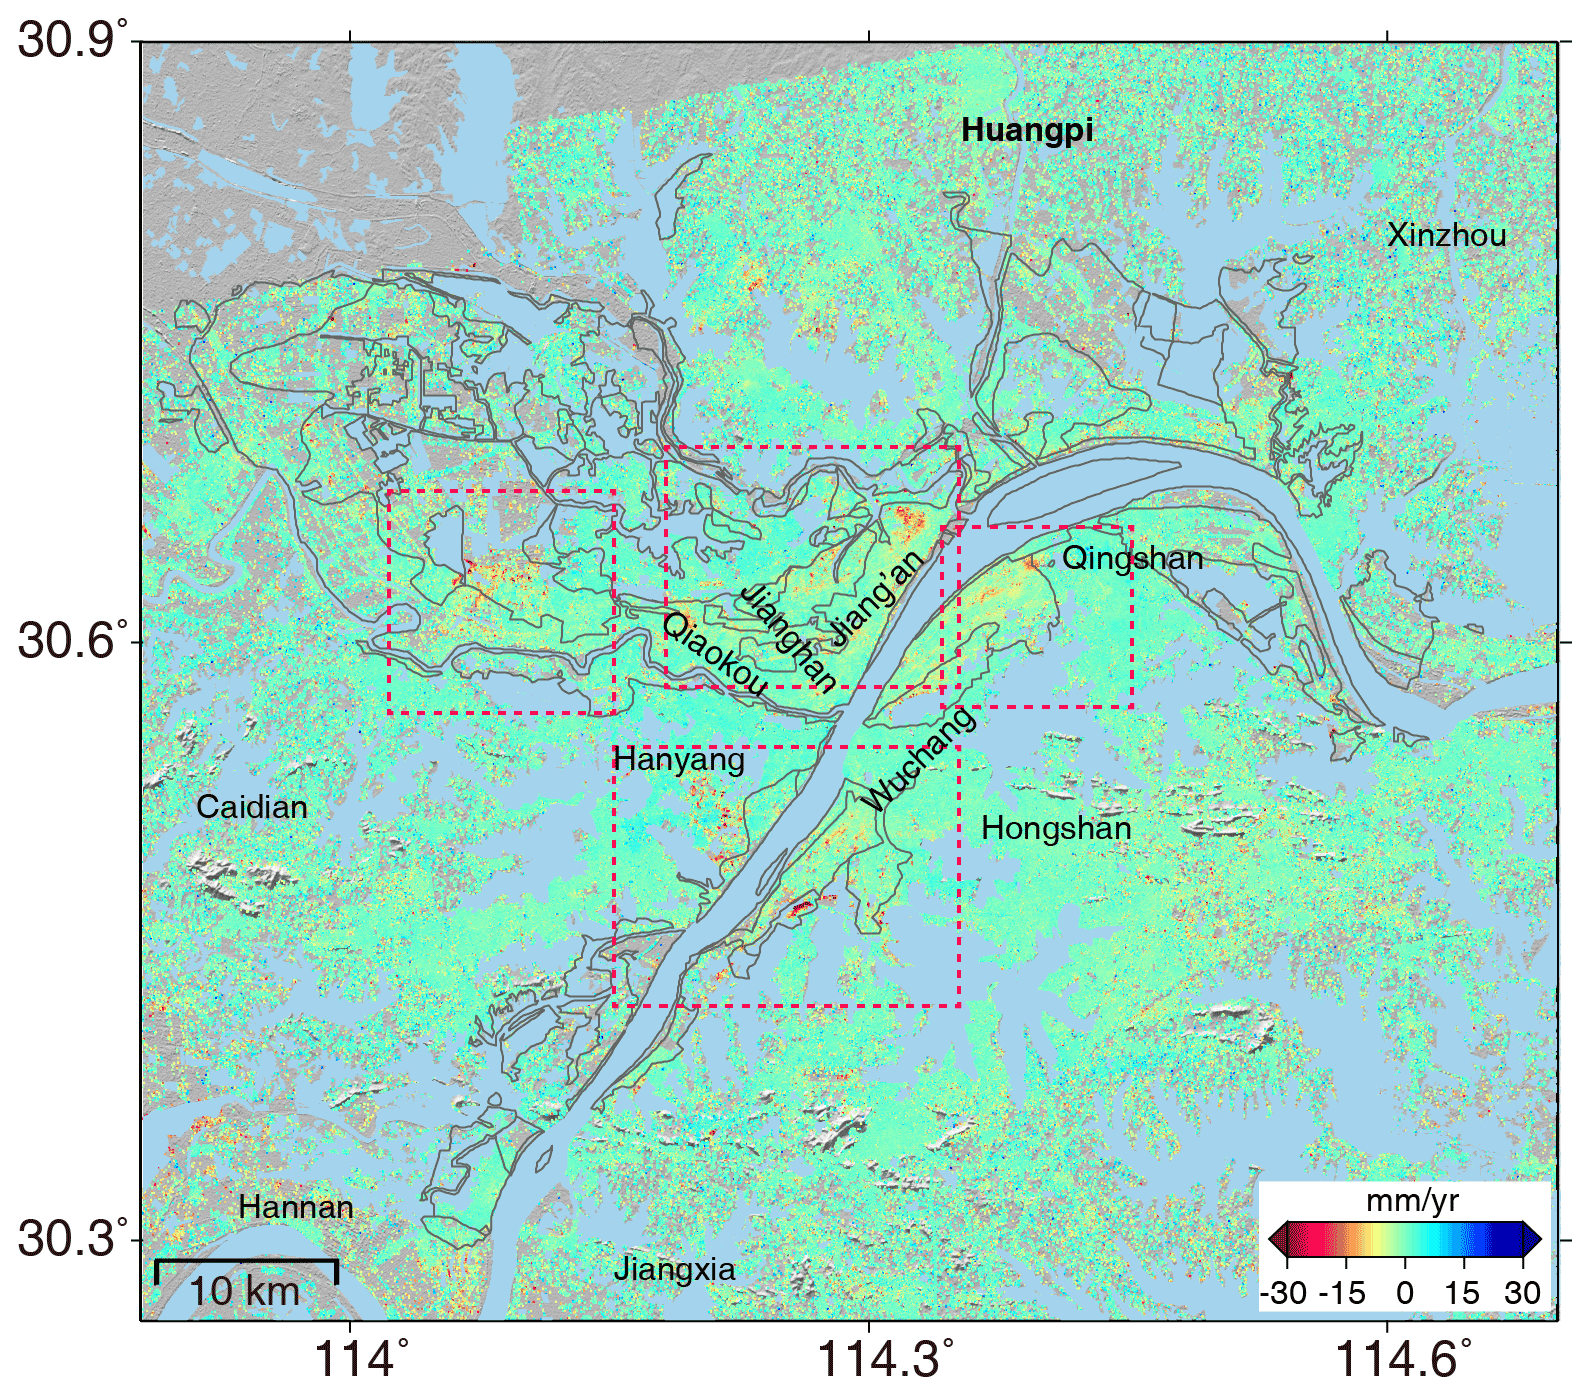
Figure 4Subsidence rate over Wuhan metropolitan area between 2015 and 2019. The boundaries of the first terrace EGZ and second terrace EGZ are indicated by gray lines. The background is hill-shaded AW3D30 DSM.
3.2 Time series displacement retrieval
The SBAS InSAR makes use of point-like targets, which retain high level of coherence over a long temporal period, or slow decorrelated pixels, which will remain coherent in a short period (Hooper, 2008; Jiang and Guarnieri, 2020). Amplitude dispersion value was used to initially select the candidates that can be used to extract useful signals (Ferretti et al., 2001). Phase stability analysis was performed on these candidates first. The final pixels used for the displacement rate estimation were determined by a temporal coherence threshold with 0.3. Then, 3D phase unwrapping was further performed to retrieve continuous phase in the spatial and temporal dimension (Hooper and Zebker, 2007). Generally, there are orbital phase ramps, digital elevation model (DEM) residual phase, atmospheric phase, and deformation phase signals in the unwrapped phase. In this paper, the phase ramps were estimated with a bilinear model (Shi et al., 2016). The DEM residual phase was estimated by the linear relationship between topographic error and baseline. Temporally high-pass and spatially low-pass filters were employed to remove the atmospheric phase. Once sources of errors are mitigated, the subsidence rate and time series displacement history were retrieved by a least-squares adjustment. We converted the LOS (line of sight) displacement to the vertical direction by means of dividing by the cosine of the incidence angle, as Zhou et al. (2017) did in a previous study. The workflow of our study is given in Fig. 3.
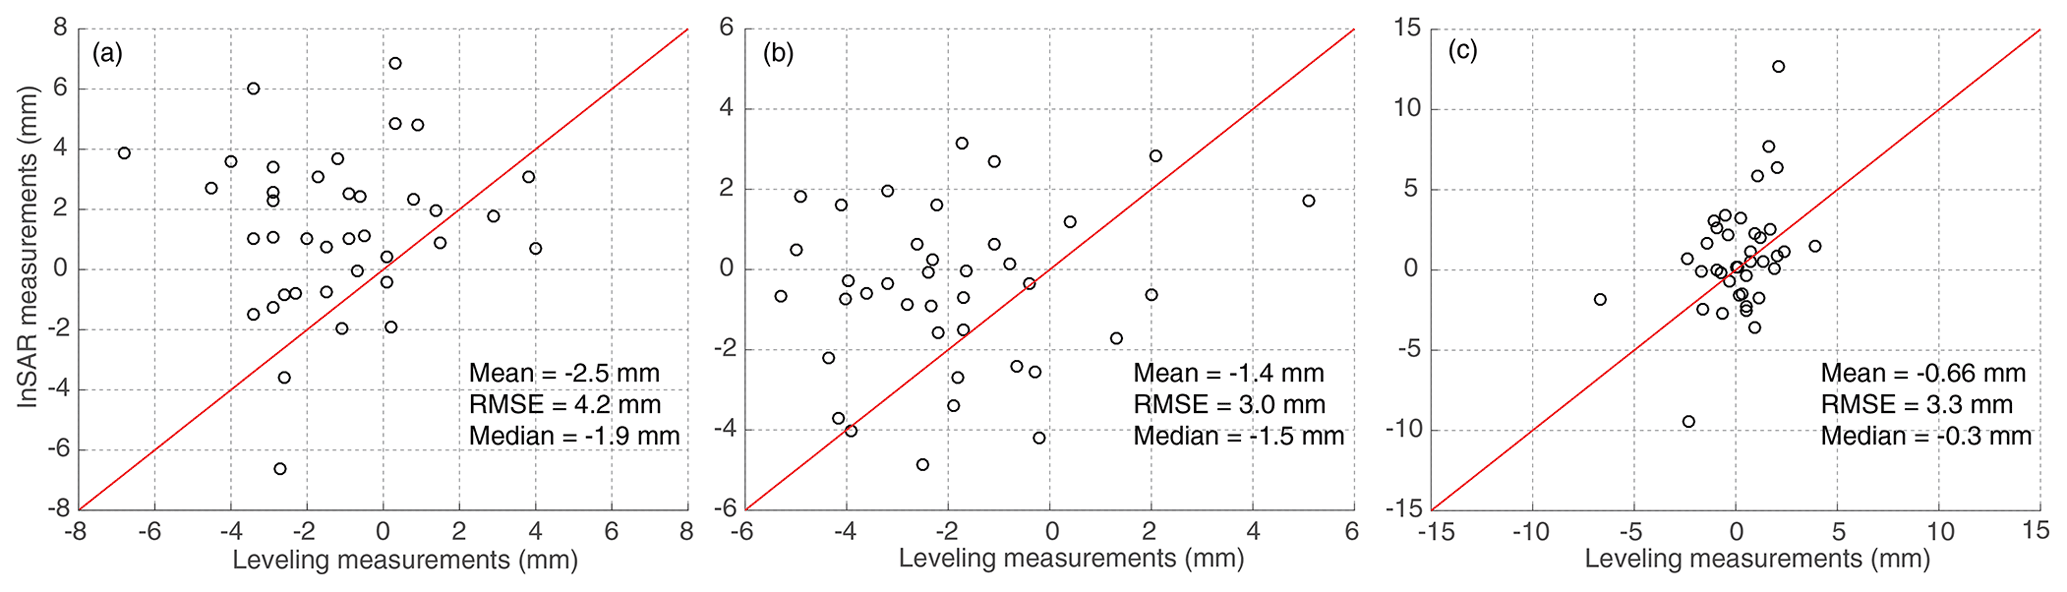
Figure 5InSAR measurements versus leveling measurements, respectively, for (a) 27 August 2016–9 March 2017 and 10 September 2016–10 March 2017, (b) 9 March 2017–9 October 2017 and 9 March–10 October 2017, and (c) 9 October 2017–13 May 2018 and 10 October 2017–10 May 2018.
4.1 Mean subsidence velocity map
Figure 4 shows the subsidence rate derived from the Sentinel-1 SAR data. Given the dense artificial objects with stable backscattering signals over long time periods over urban scenarios, a total of 8 628 652 coherent pixels are selected. The maximum displacement rate is about 40 mm/yr. There are many factors (e.g., city constructions, karst landforms, and soft soils) that cause ground subsidence in Wuhan. We can notice that the positions of subsidence in the Wuhan metropolitan area are mainly distributed within EGSs that are composed of compressible soft soils in the first and second terrace (shown in Fig. 1b). We find the new localized subsidence centers have emerged and old subsidence centers identified by previous studies have stabilized with the decreased displacement rate. For example, the uplift areas on the right bank of Yangtze river and the subsidence center in the Jianghan and Qiaokou district caused by construction of metro lines 1 and 2 during 2009–2010 (Bai et al., 2016) have almost stabilized in this study. Localized subsidence centers in Jiang'an, Qingshan, Hongshan, Wuchang, Hanyang, and Dongxihu are identified, which are mostly caused by intense anthropogenic activities, such as construction of metro lines and new buildings (Bai et al., 2019).
4.2 Comparison between InSAR and leveling measurements
To quantify the results, we further compared InSAR with leveling measurements. We divided the leveling data into three time periods and compared them with InSAR data measured at closest dates (as shown in Fig. 5). The leveling points are mainly distributed in the wavy hillocky EGZ (as shown in Fig. 1c), with low displacement rates which agree with InSAR measurements. The mean, root mean square error (RMSE), and median of the difference between InSAR and leveling measurements indicated that our InSAR results reached millimeter accuracy. The statistical metrics in Fig. 5a, which are slightly larger than these in Fig. 5b and c, might be caused by longer time coverage of InSAR than by leveling.
4.3 Qingling–Jiangdi area
Karst collapse is listed as one of the most serious geological disasters in Wuhan (Wuhan Bureau of Natural Resources and Planning, 2018). With the intensive anthropogenic activities in recent years, the occurrence of karst collapse or sinkholes in Wuhan has dramatically increased (Zheng et al., 2019). Figure 6a gives the subsidence rate over the Qingling–Jiangdi area including the town of Qingling in the Hongshan district, the town of Jiangdi in the Hanyang district, and Baishazhou and Zhangjiawan in Wuchang district. In contrast with Fig. 6b, 23 of the aforementioned 38 historical karst collapses occurred in this area. The subsidence is identified at all the EGSs in the first terrace and the second terrace lacustrine EGS. The deformation of QL1 was correlated with karst subsidence (Bai et al., 2016), with maximum subsidence rate of 15 mm/yr. Anthropogenic activities are the main cause of subsidence in the Qingling–Jiangdi area, e.g., QL2, QL3 and QL4. Figure 6c and d are the optical images covering point QL3, obtained on 16 August 2013 and 9 December 2017, respectively. Construction of the metro line 6 depot (QL3) induced serious deformation, with subsidence velocity over −30 mm/yr. The accumulative deformations of QL2, QL3, and QL4 reached over 160 mm from April 2015 to September 2019, as shown in Fig. 7.
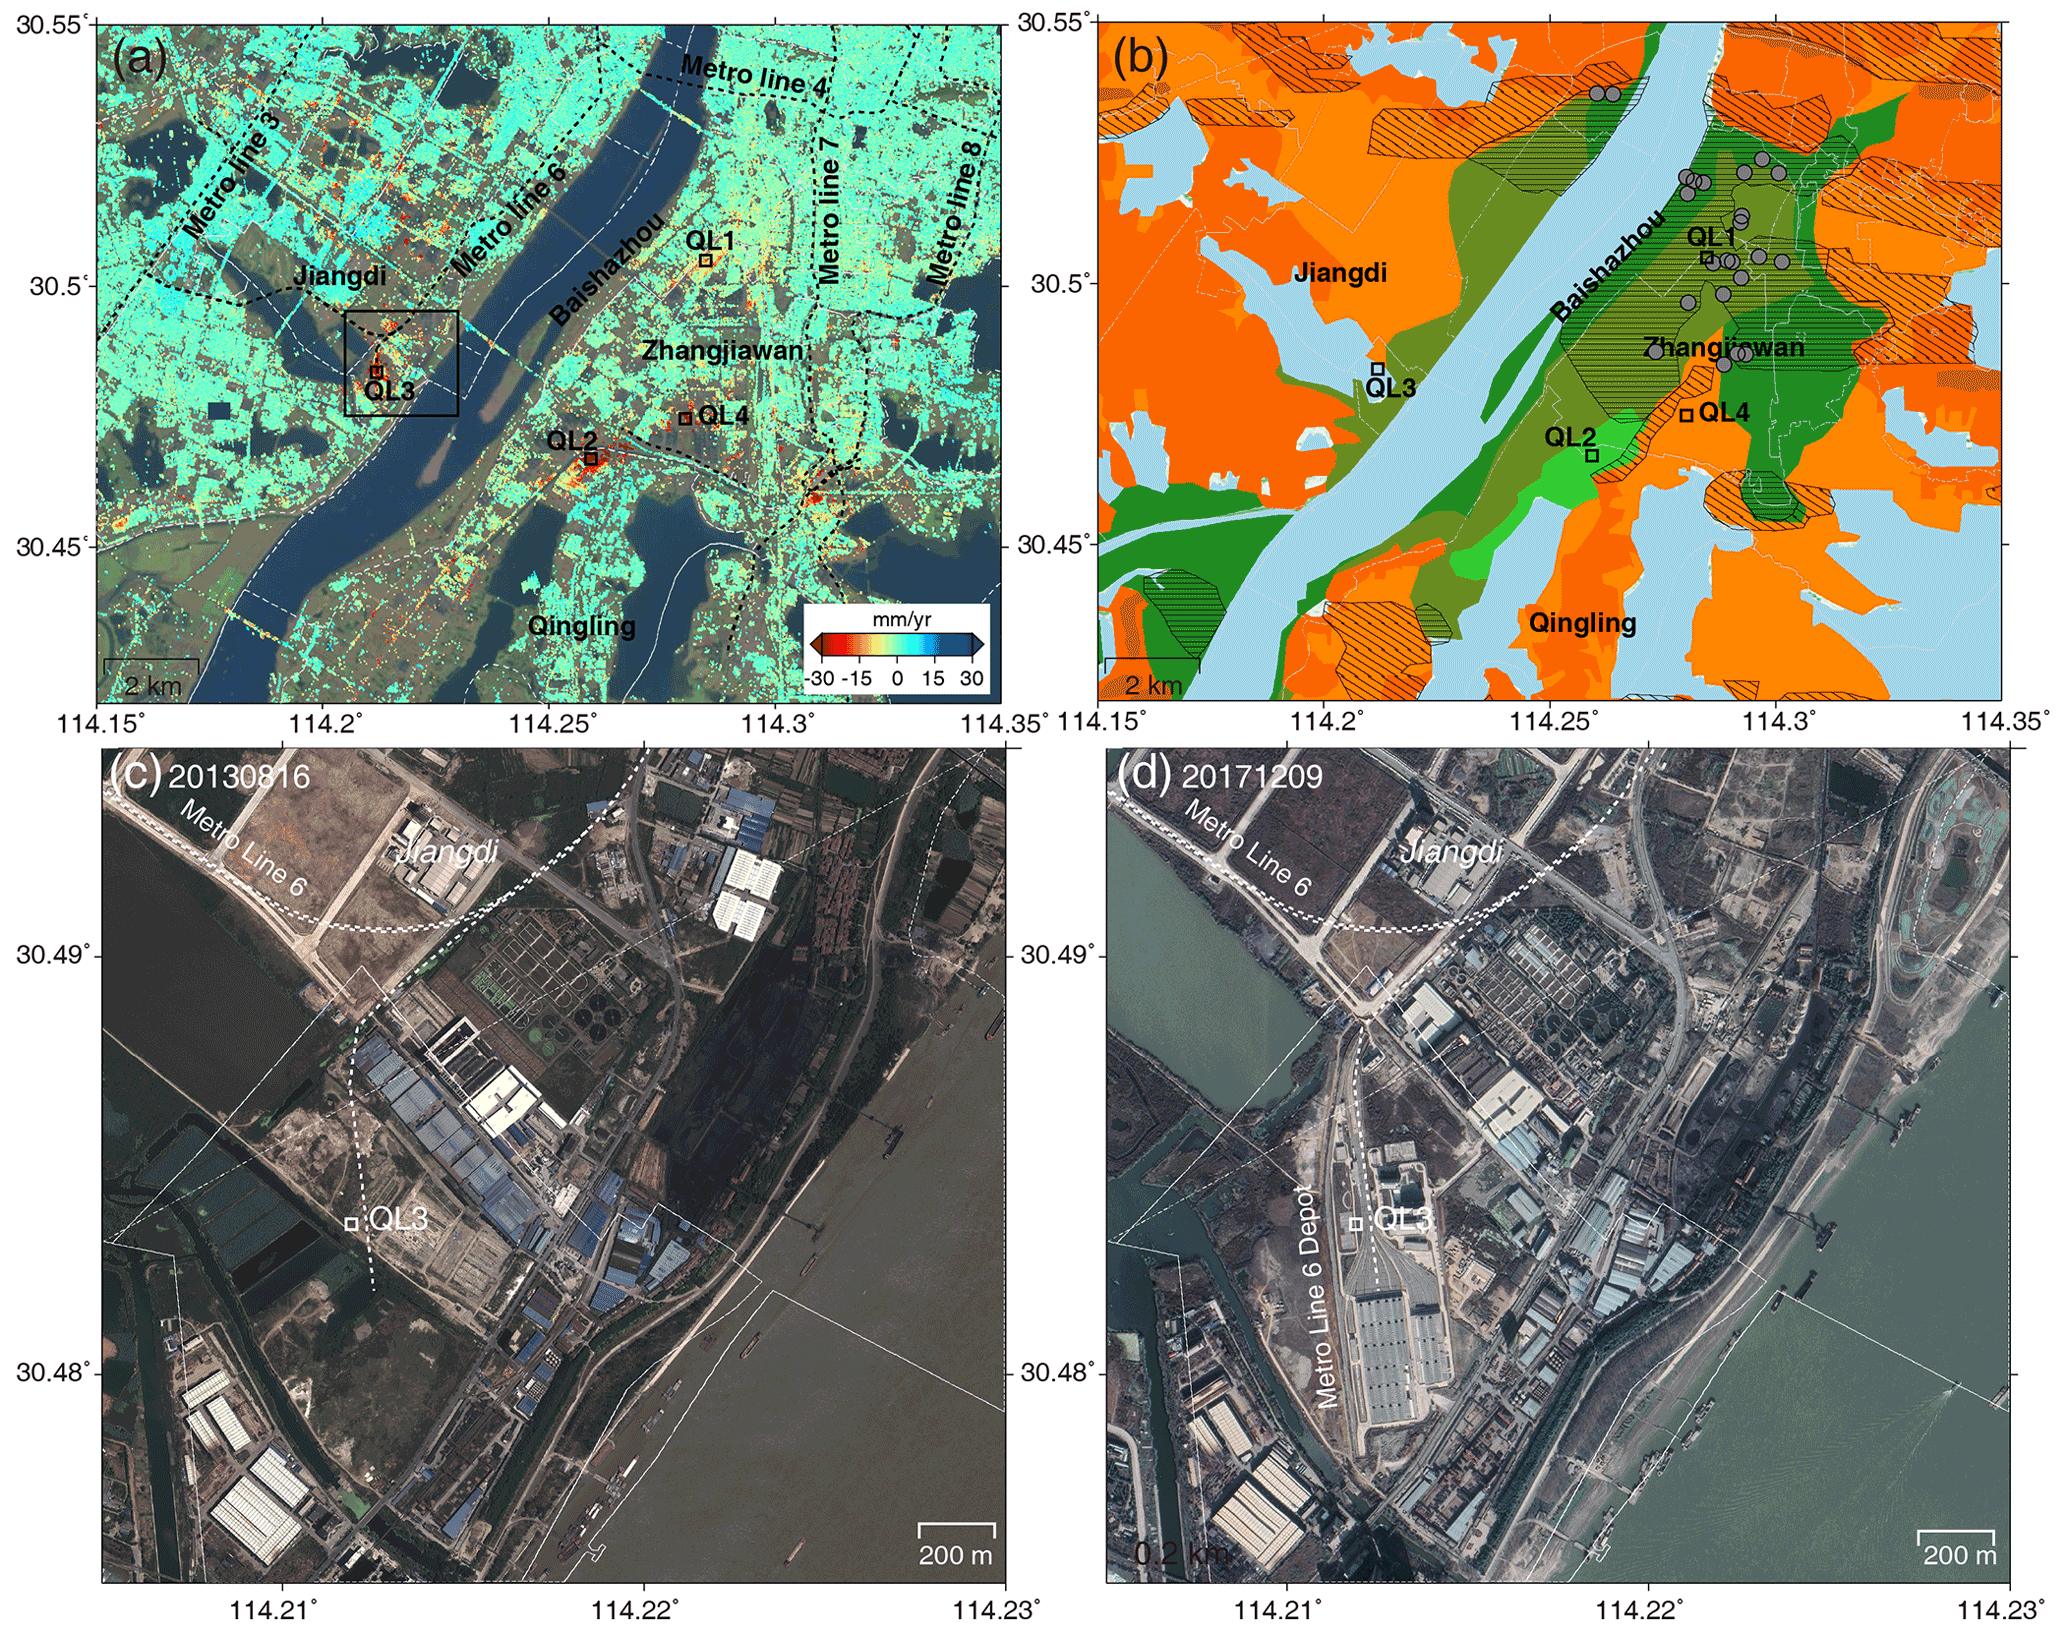
Figure 6(a) Subsidence velocity of the Jiangdi–Qingling area during 2015–2019. The rectangle represents the location of panels (c) and (d). Panel (b) is the corresponding EGS map. The legend is the same as in Fig. 1b, while the gray circles are the historical karst collapses. The distribution of metro lines is freely available from © OpenStreetMap (2021; distributed under the Open Data Commons Open Database License (ODbL) v1.0.). Panels (c) and (d) are © Google Earth™ images covering point QL3, acquired in August 2013 and December 2019.
4.4 Houhu area
Houhu area was originally a lake or lake beach with underlying layers composed of highly compacted muck or muck soil, with a thickness ranging from 10 to 30 m (Sun et al., 2019). Due to activities such as ponds filling and the construction of embankments, the surface was covered by soft artificial fill. Serious subsidence has occurred in this area due to the urban development in recent years (Wuhan Bureau of Natural Resources and Planning, 2018). Long-term analysis of high-resolution COSMO-SkyMed SAR images indicated that the Houhu area experienced serious subsidence from 2012 to 2019, with a maximum rate of 100 mm/yr (Jiang et al., 2021). Cracks shown in Fig. S1a are very widely identified in newly constructed buildings in the Houhu area. The subsidence of the Houhu area, located in the Jiang'an district, is very subtle during 2009–2010, with a subsidence rate of −5–5 mm/yr (Bai et al., 2016), while a maximum subsidence rate of 86 mm/yr (centered at longitude 114.30∘ and latitude 30.6∘) was detected in 2013–2015 due to the construction of metro line 3 (Bai et al., 2019). However, the current velocity decreased to ∼10 mm/yr during 2015–2019, indicated by HH3, and a new subsidence center, where HH1 is located, with a displacement velocity of ∼30 mm/yr was identified, which coincided with a previous study by Han et al. (2020; as shown in Fig. 8a). The localized subsidence centers shift with the urbanization progress. Figure 8c and d show the © Google Earth™ images acquired in April 2012 and October 2019. The white polygons indicate the newly built-up areas with a maximum subsidence velocity of 20–30 mm/yr. The accumulative subsidence of HH1–HH4 is given in Fig. 9. The subsidence trends are all nonlinear, which might closely correlate with the construction activities in the surrounding areas. The most serious accumulative subsidence occurred at HH1, which exceeded 100 mm during April 2015 to September 2019.
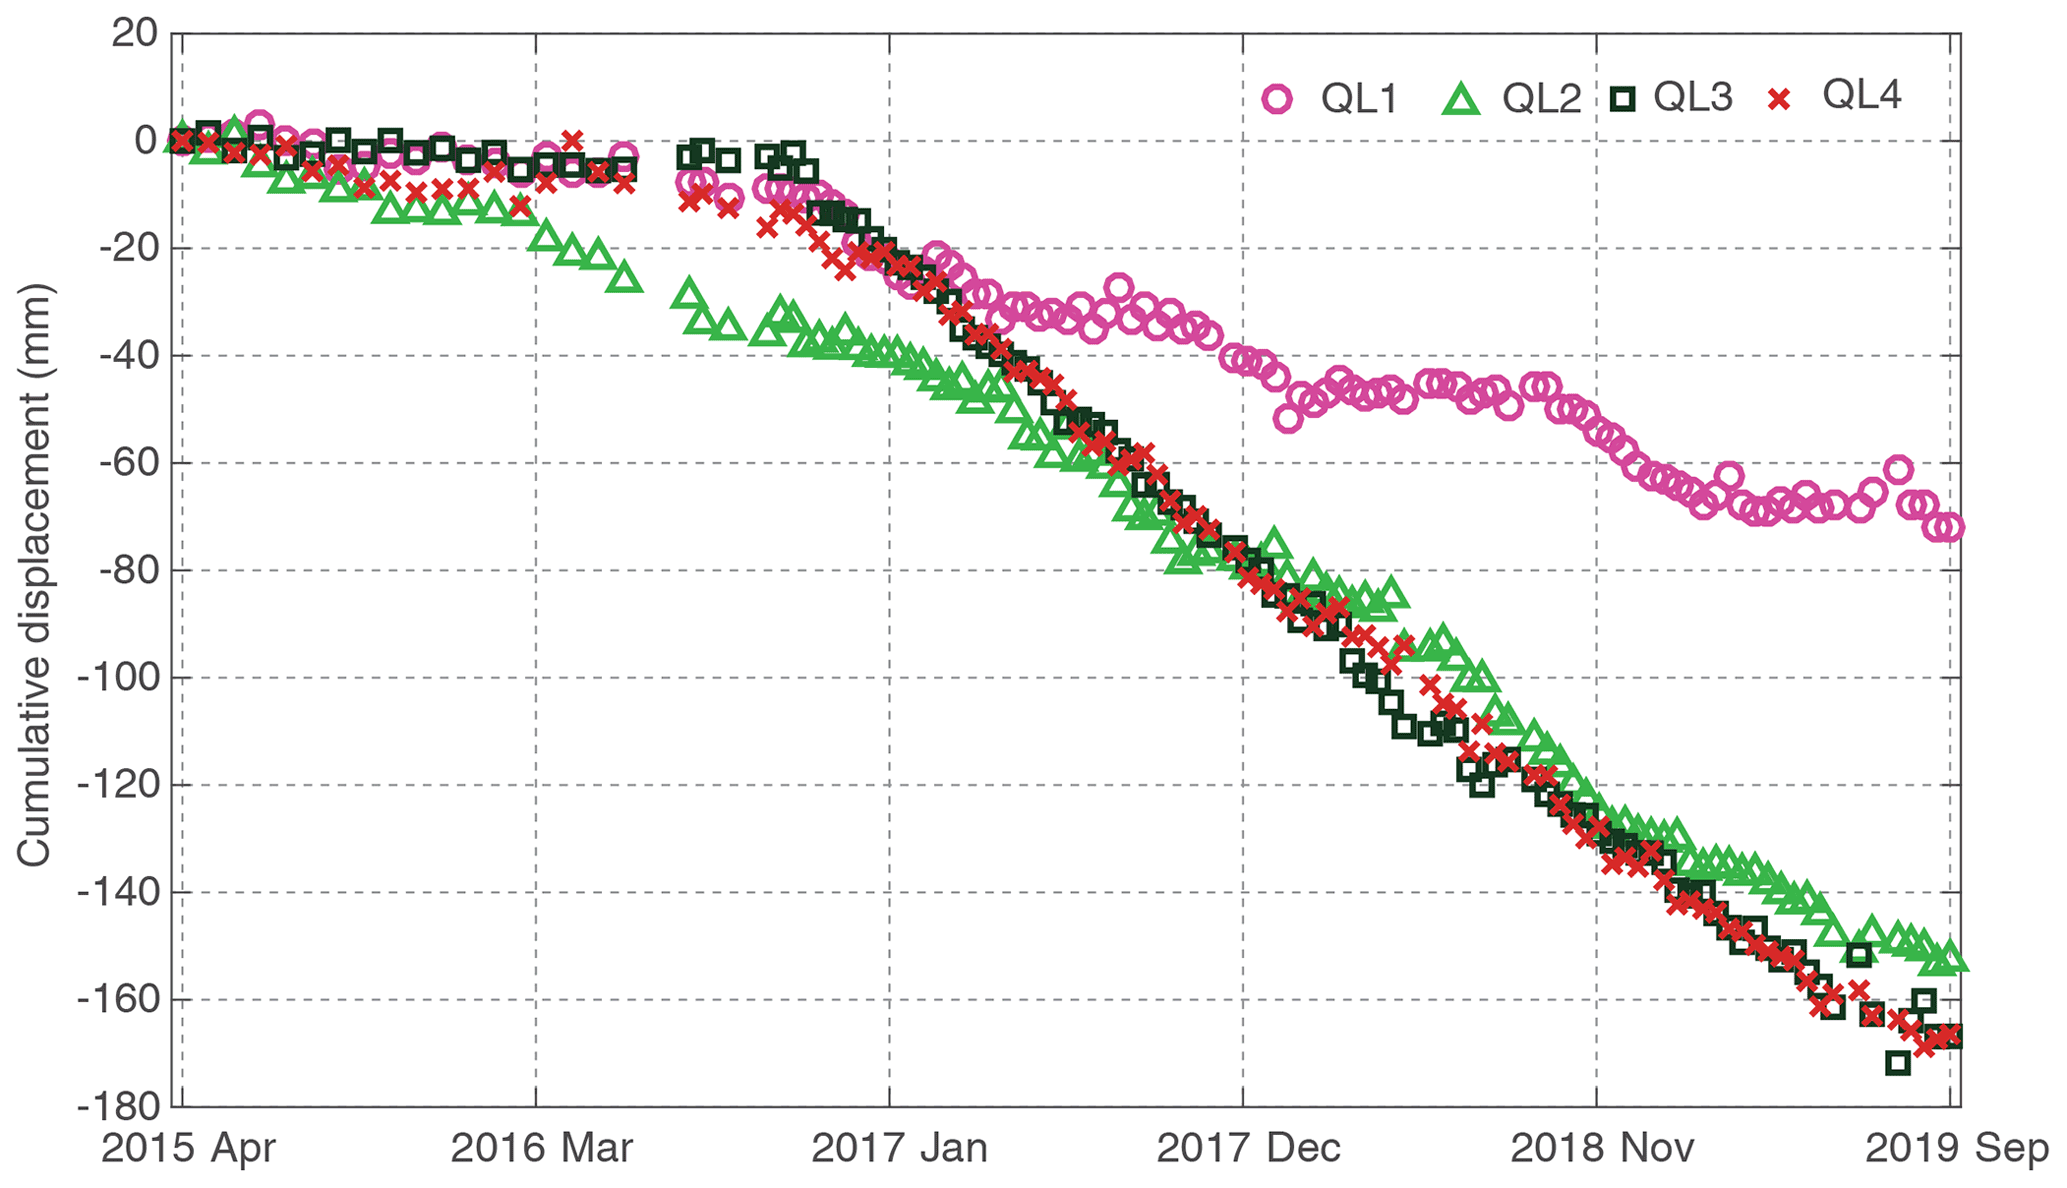
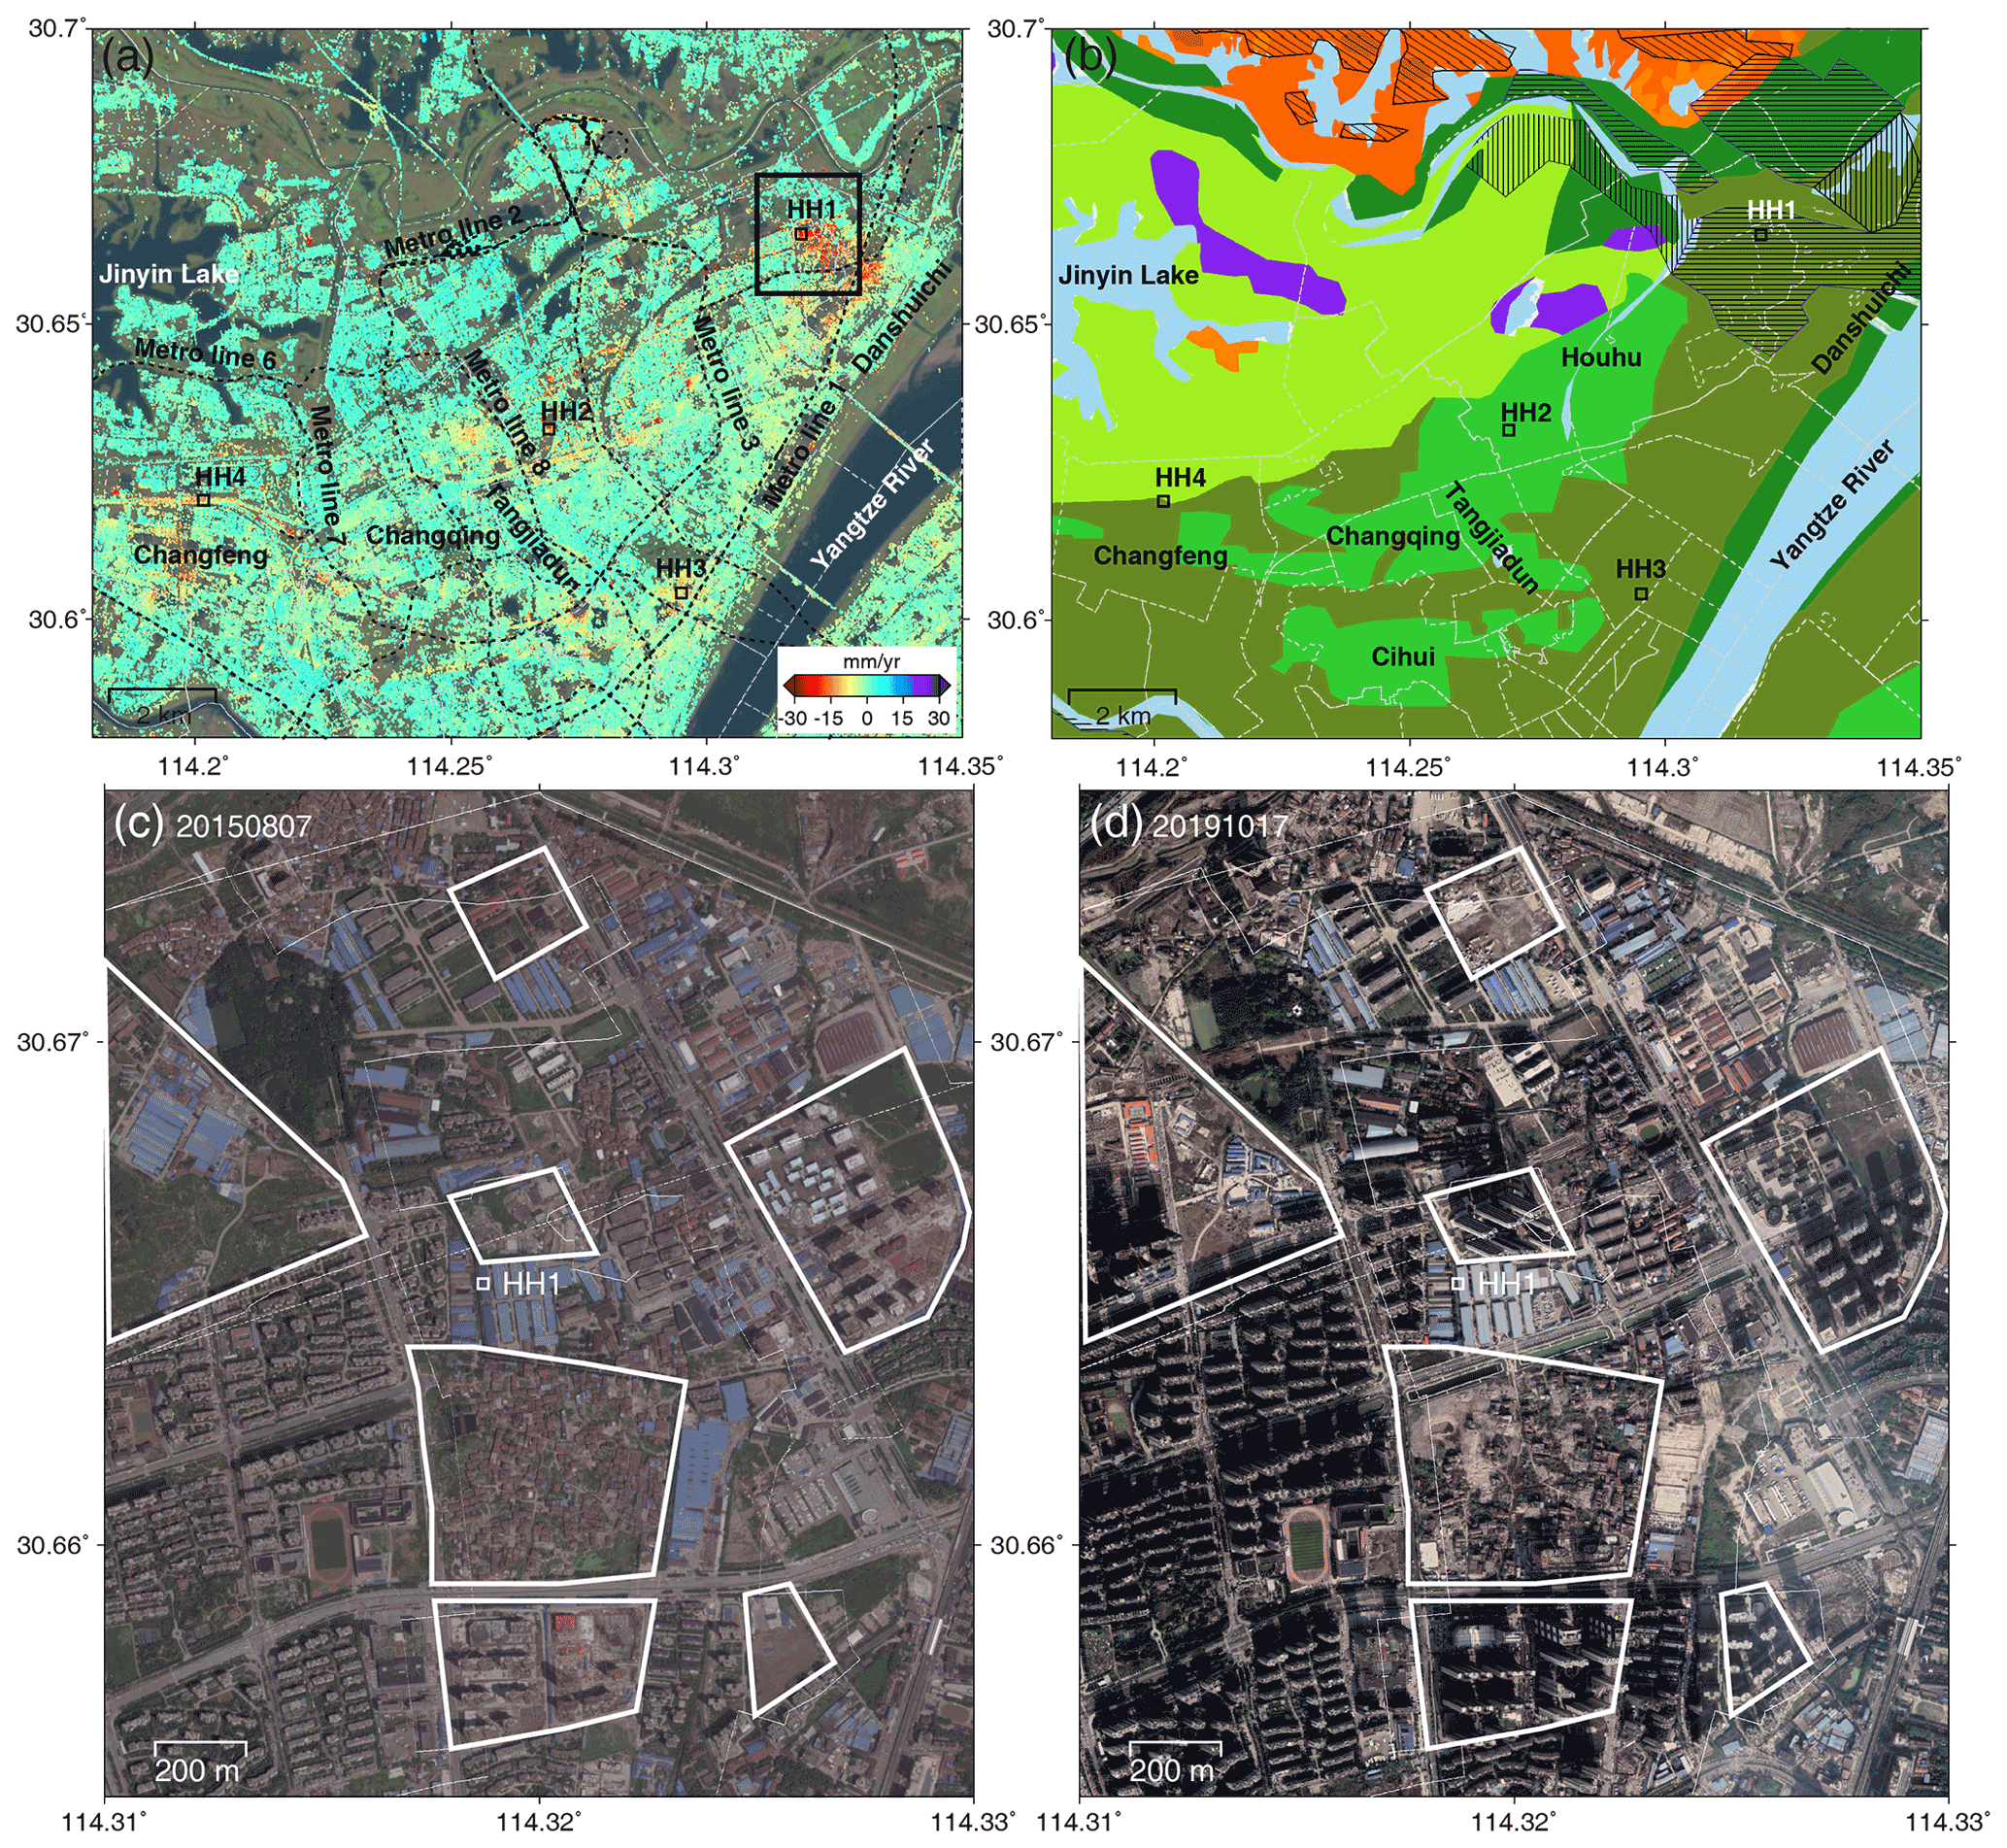
Figure 8(a) Subsidence velocity of the Houhu area during 2015–2019. The rectangle represents the location of panels (c) and (d). Panel (b) is the corresponding EGS map. The legend is the same as in Fig. 1b. Panels (c) and (d) are © Google Earth™ images covering point HH1, acquired in April 2012 and October 2019. The white polygons mark the newly built-up areas.
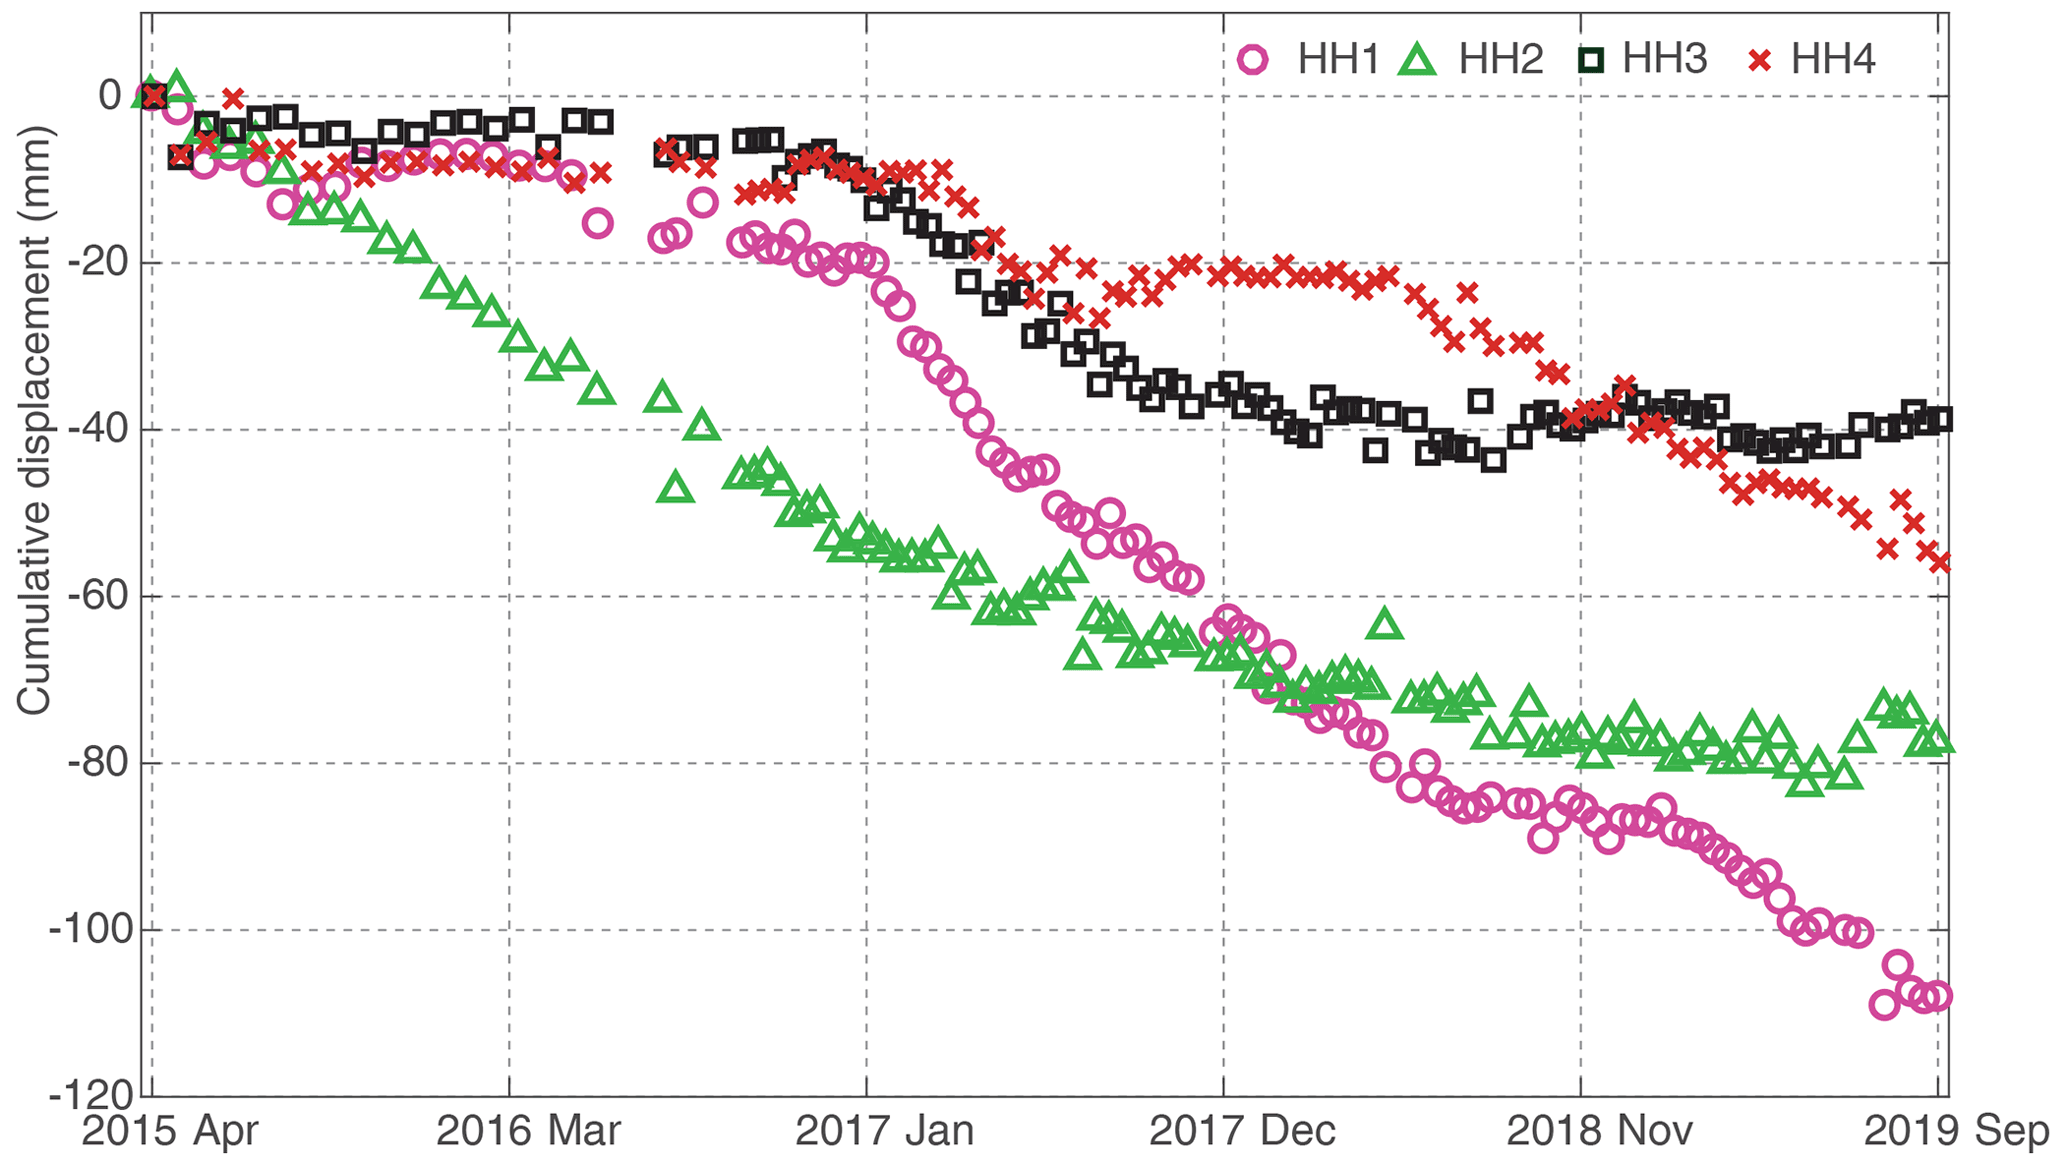
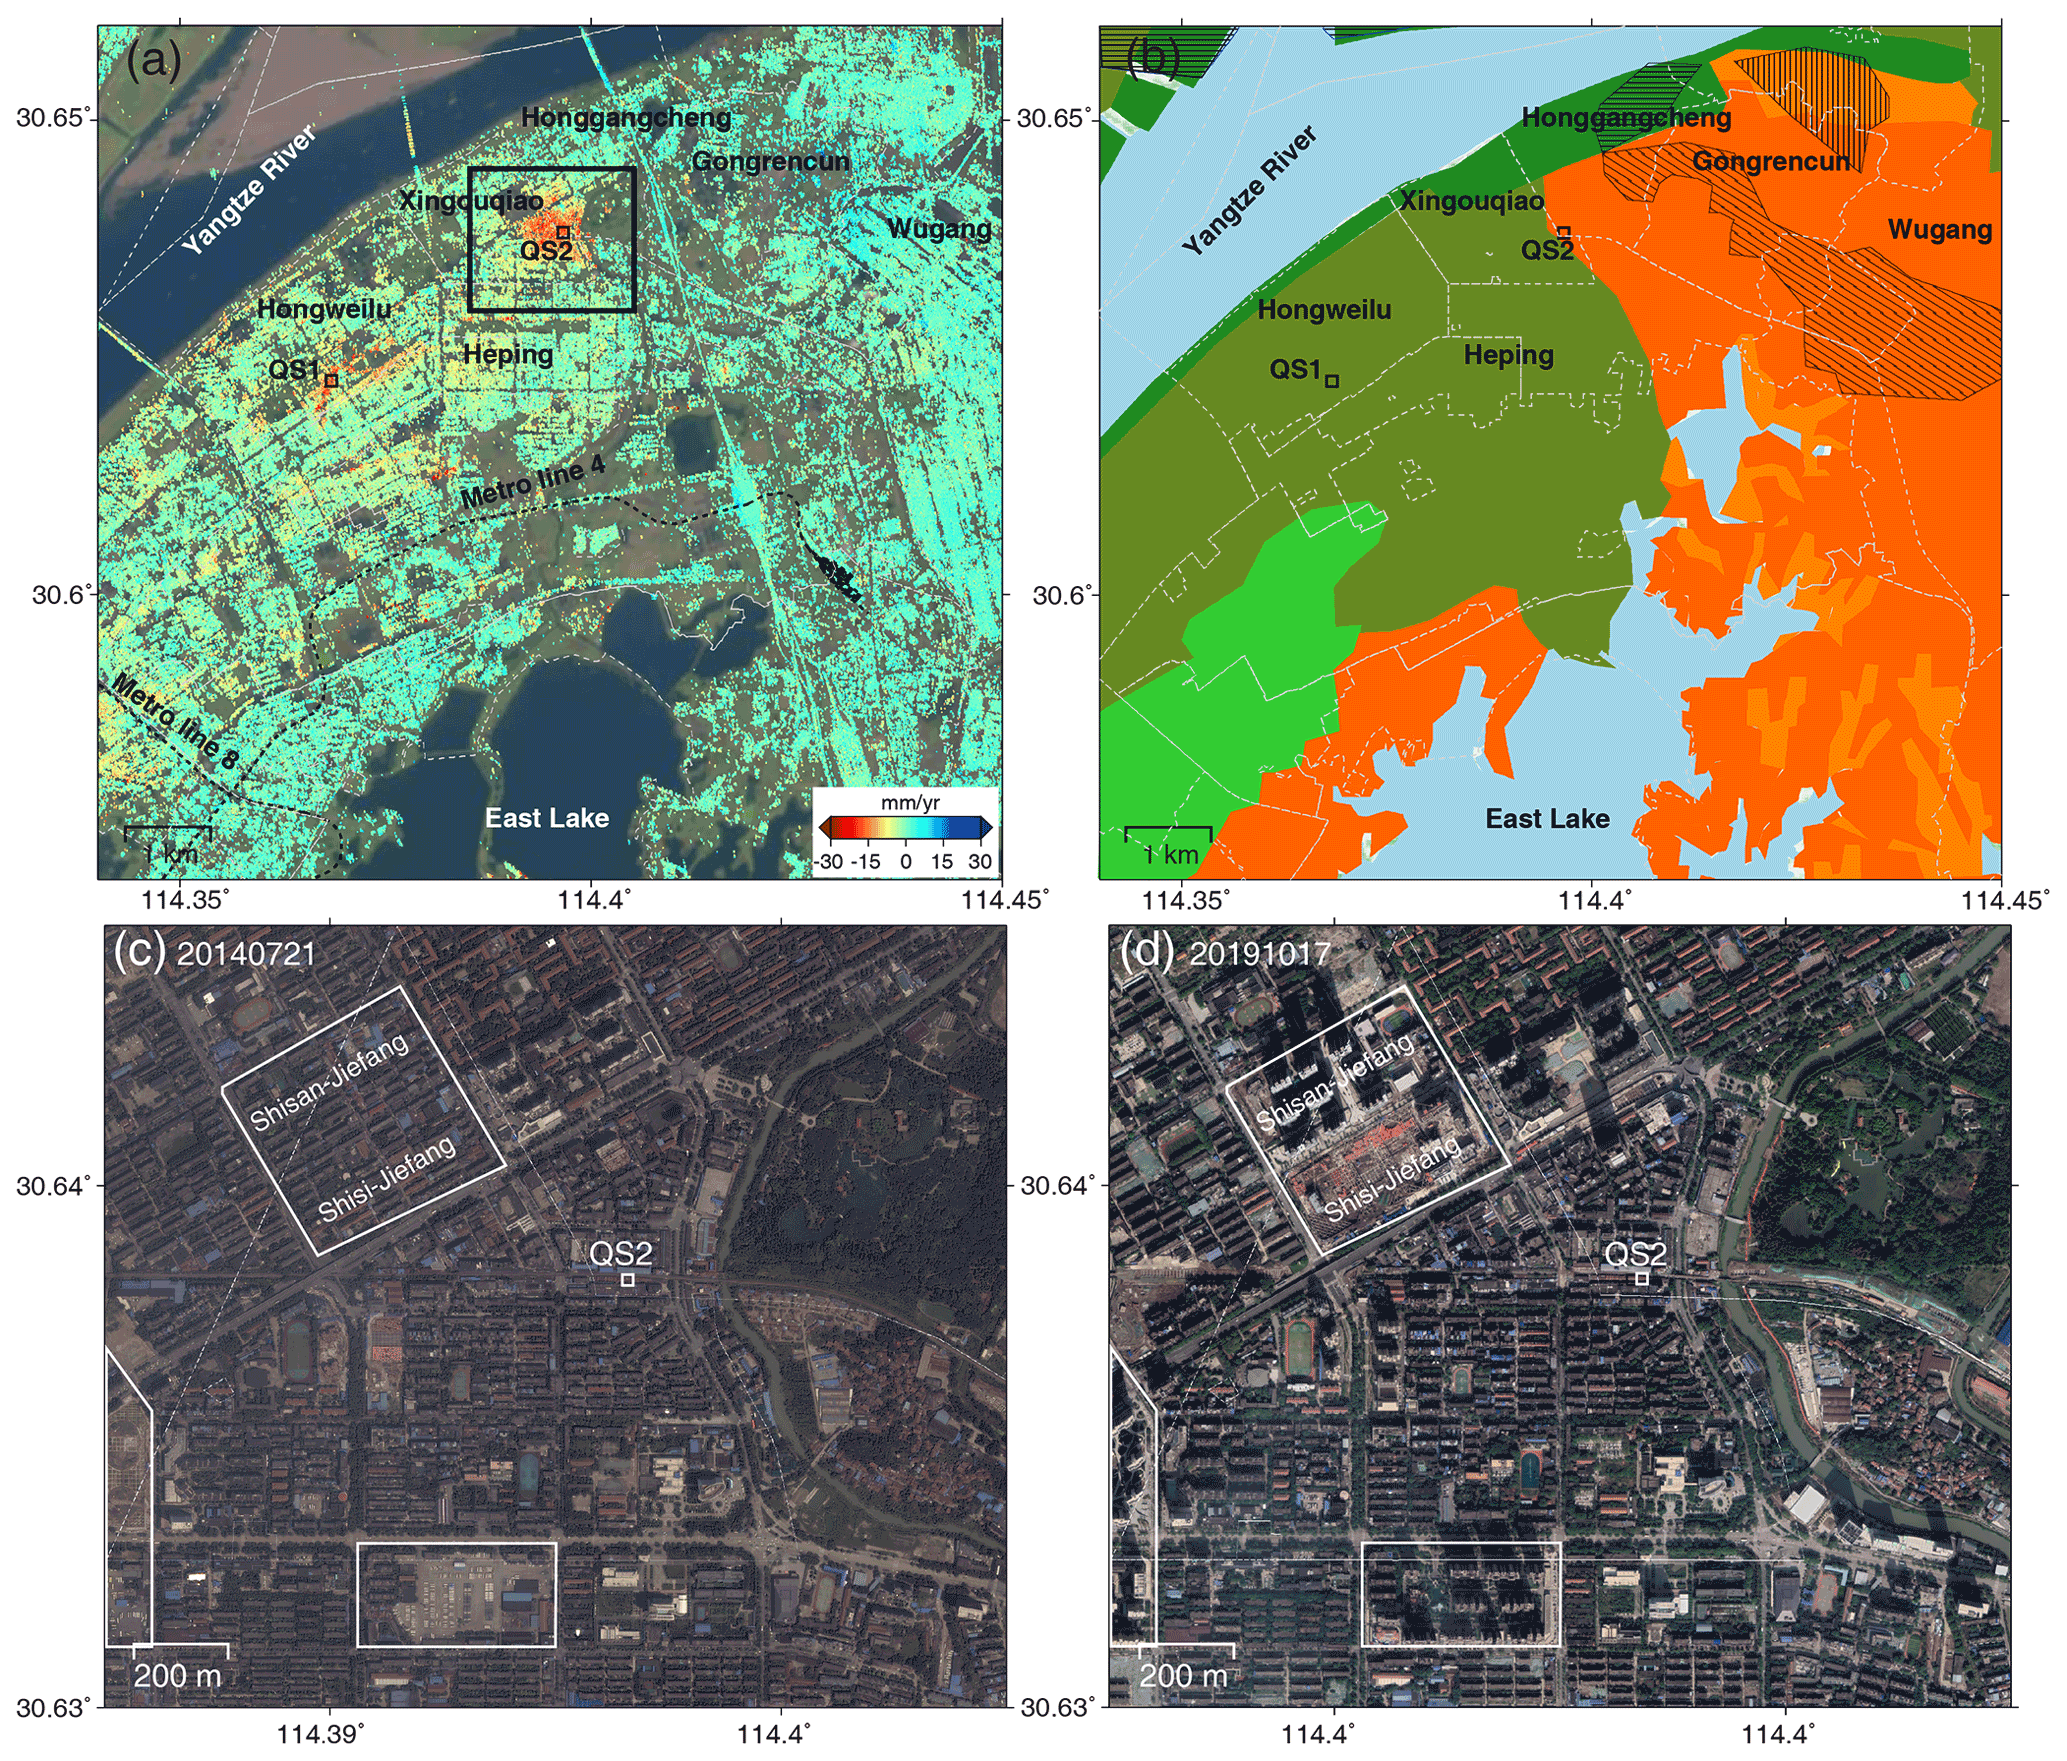
Figure 10(a) Subsidence velocity of the Qingshan area. The rectangle represents the location of panels (c) and (d). Panel (b) is the corresponding EGS map. The legend is the same as in Fig. 1b. Panels (c) and (d) are © Google Earth™ images covering point QS2, acquired in July 2014 and October 2019. The white rectangles show the newly built-up areas.
4.5 Qingshan area
The subsidence rate and corresponding EGS map over the Qingshan area are shown in Fig. 10a and b. The maximum subsidence rate in this area reached over 20 mm/yr. It is clear that the subsidence is mainly distributed in the EGSs covered by muck soil or soft clay. The subsidence center located in QS1 agrees with a previous study that used RADARSAT-2 images from 2015 to 2018 (Zhang et al., 2019). The subsidence center (QS2) detected in our study is also identified from the results with TerraSAR-X data sets during 2013–2015 (Bai et al., 2019). Field investigations identified cracks in buildings in this area (as shown in Fig. S1b). Figure 10c and d show the © Google Earth™ images of QS2 acquired in July 2014 and October 2019, respectively, in which the white rectangles highlight the newly constructed areas. The construction activities in the surrounding areas of QS2 might induce the subsidence, which is also the same for QS1 in Fig. S2a and b. The accumulative subsidence in QS1 and QS2 presents significant nonlinear subsidence trends in Fig. 11. The subsidence rate might be affected by the construction intensities. Meanwhile, we also notice that burial carbonatite EGSs can be found over the Qingshan area, which are mainly composed of dolomitic limestone and argillaceous limestone, with a high content of magnesium carbonate and argillaceous limestone, and are difficult to dissolve (Xu, 2016). The subsidence rate is around 5 mm/yr. Meanwhile, the susceptibility of karst collapse is considered to be low (Wuhan Bureau of Natural Resources and Planning, 2018).
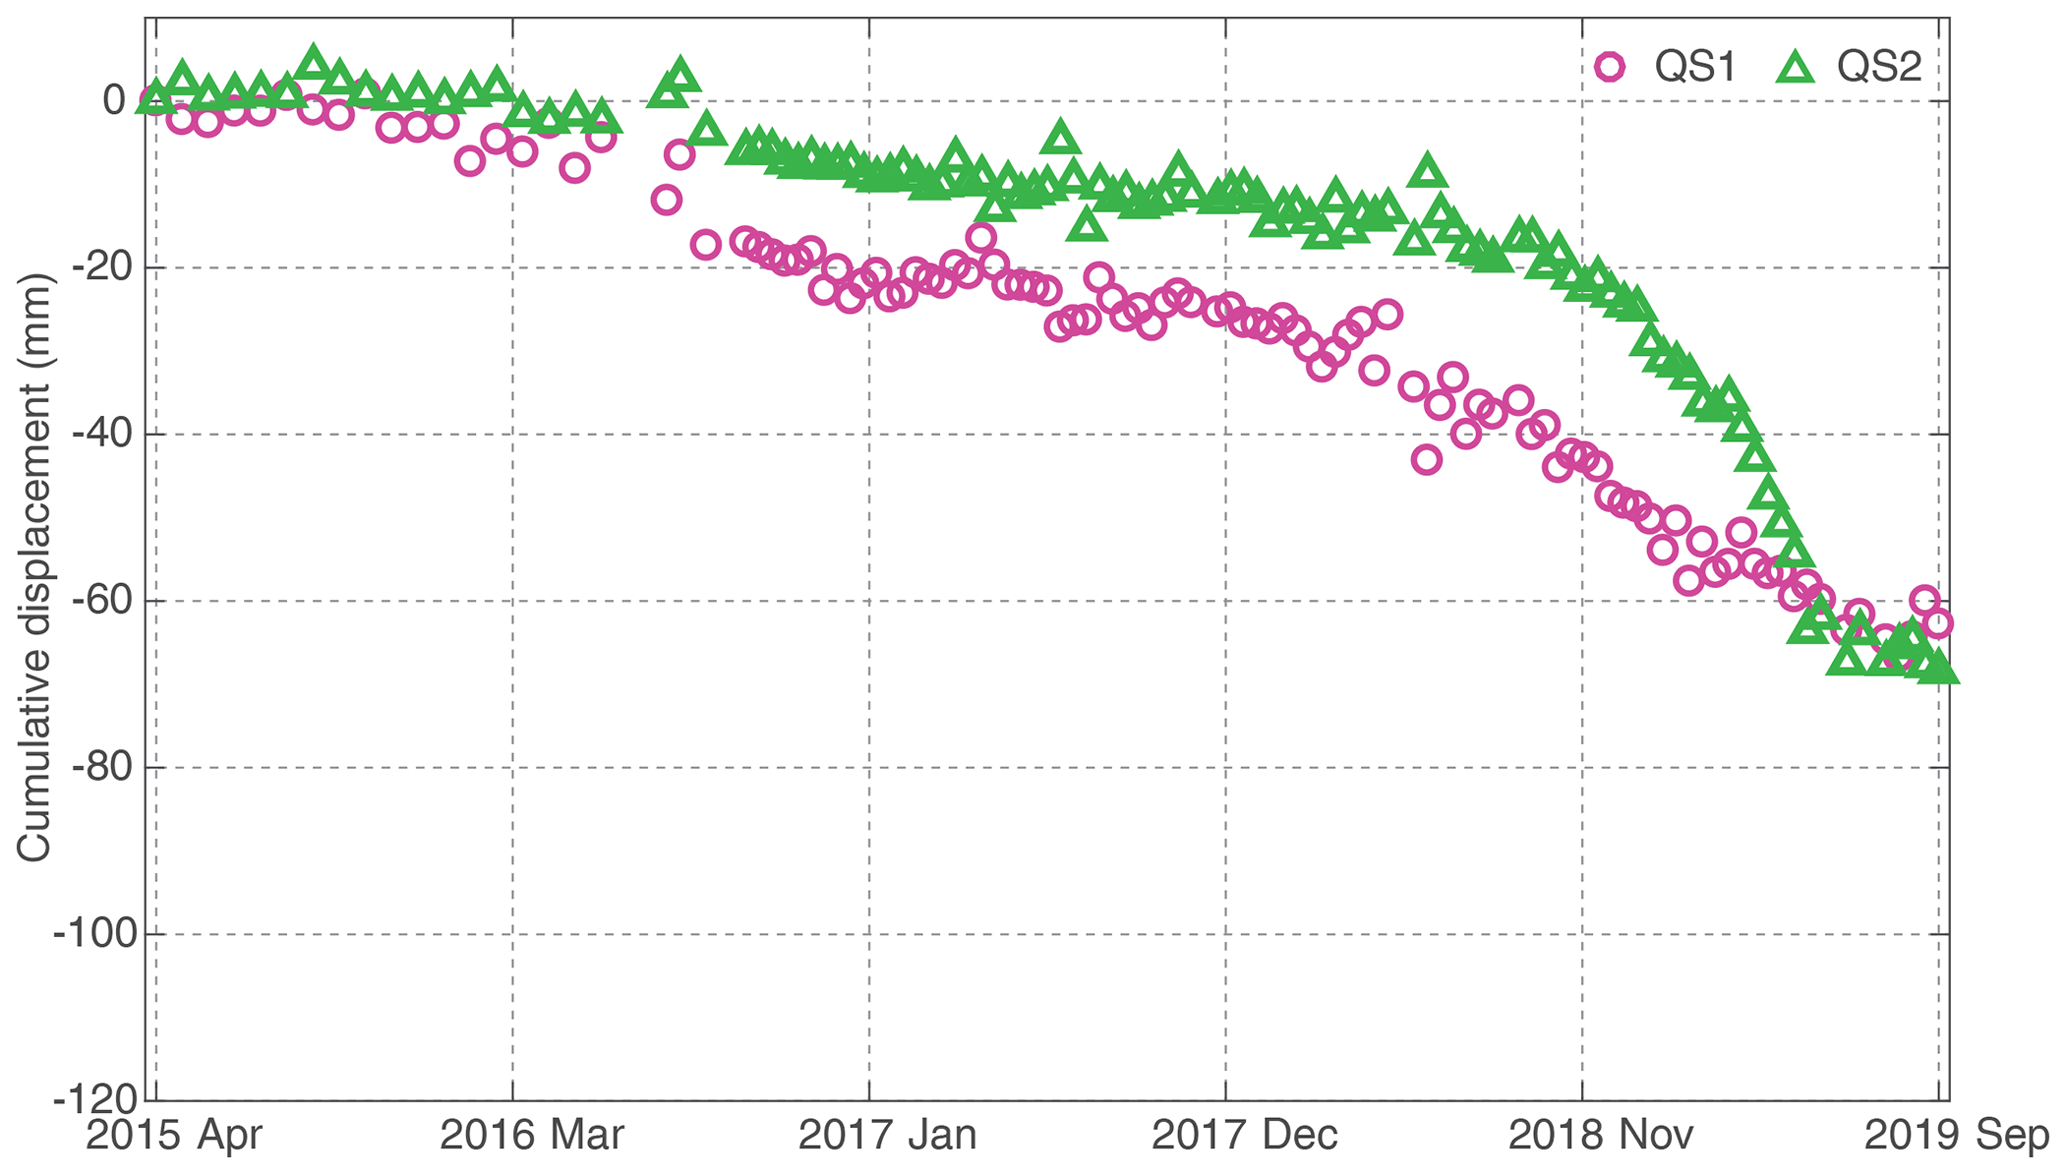
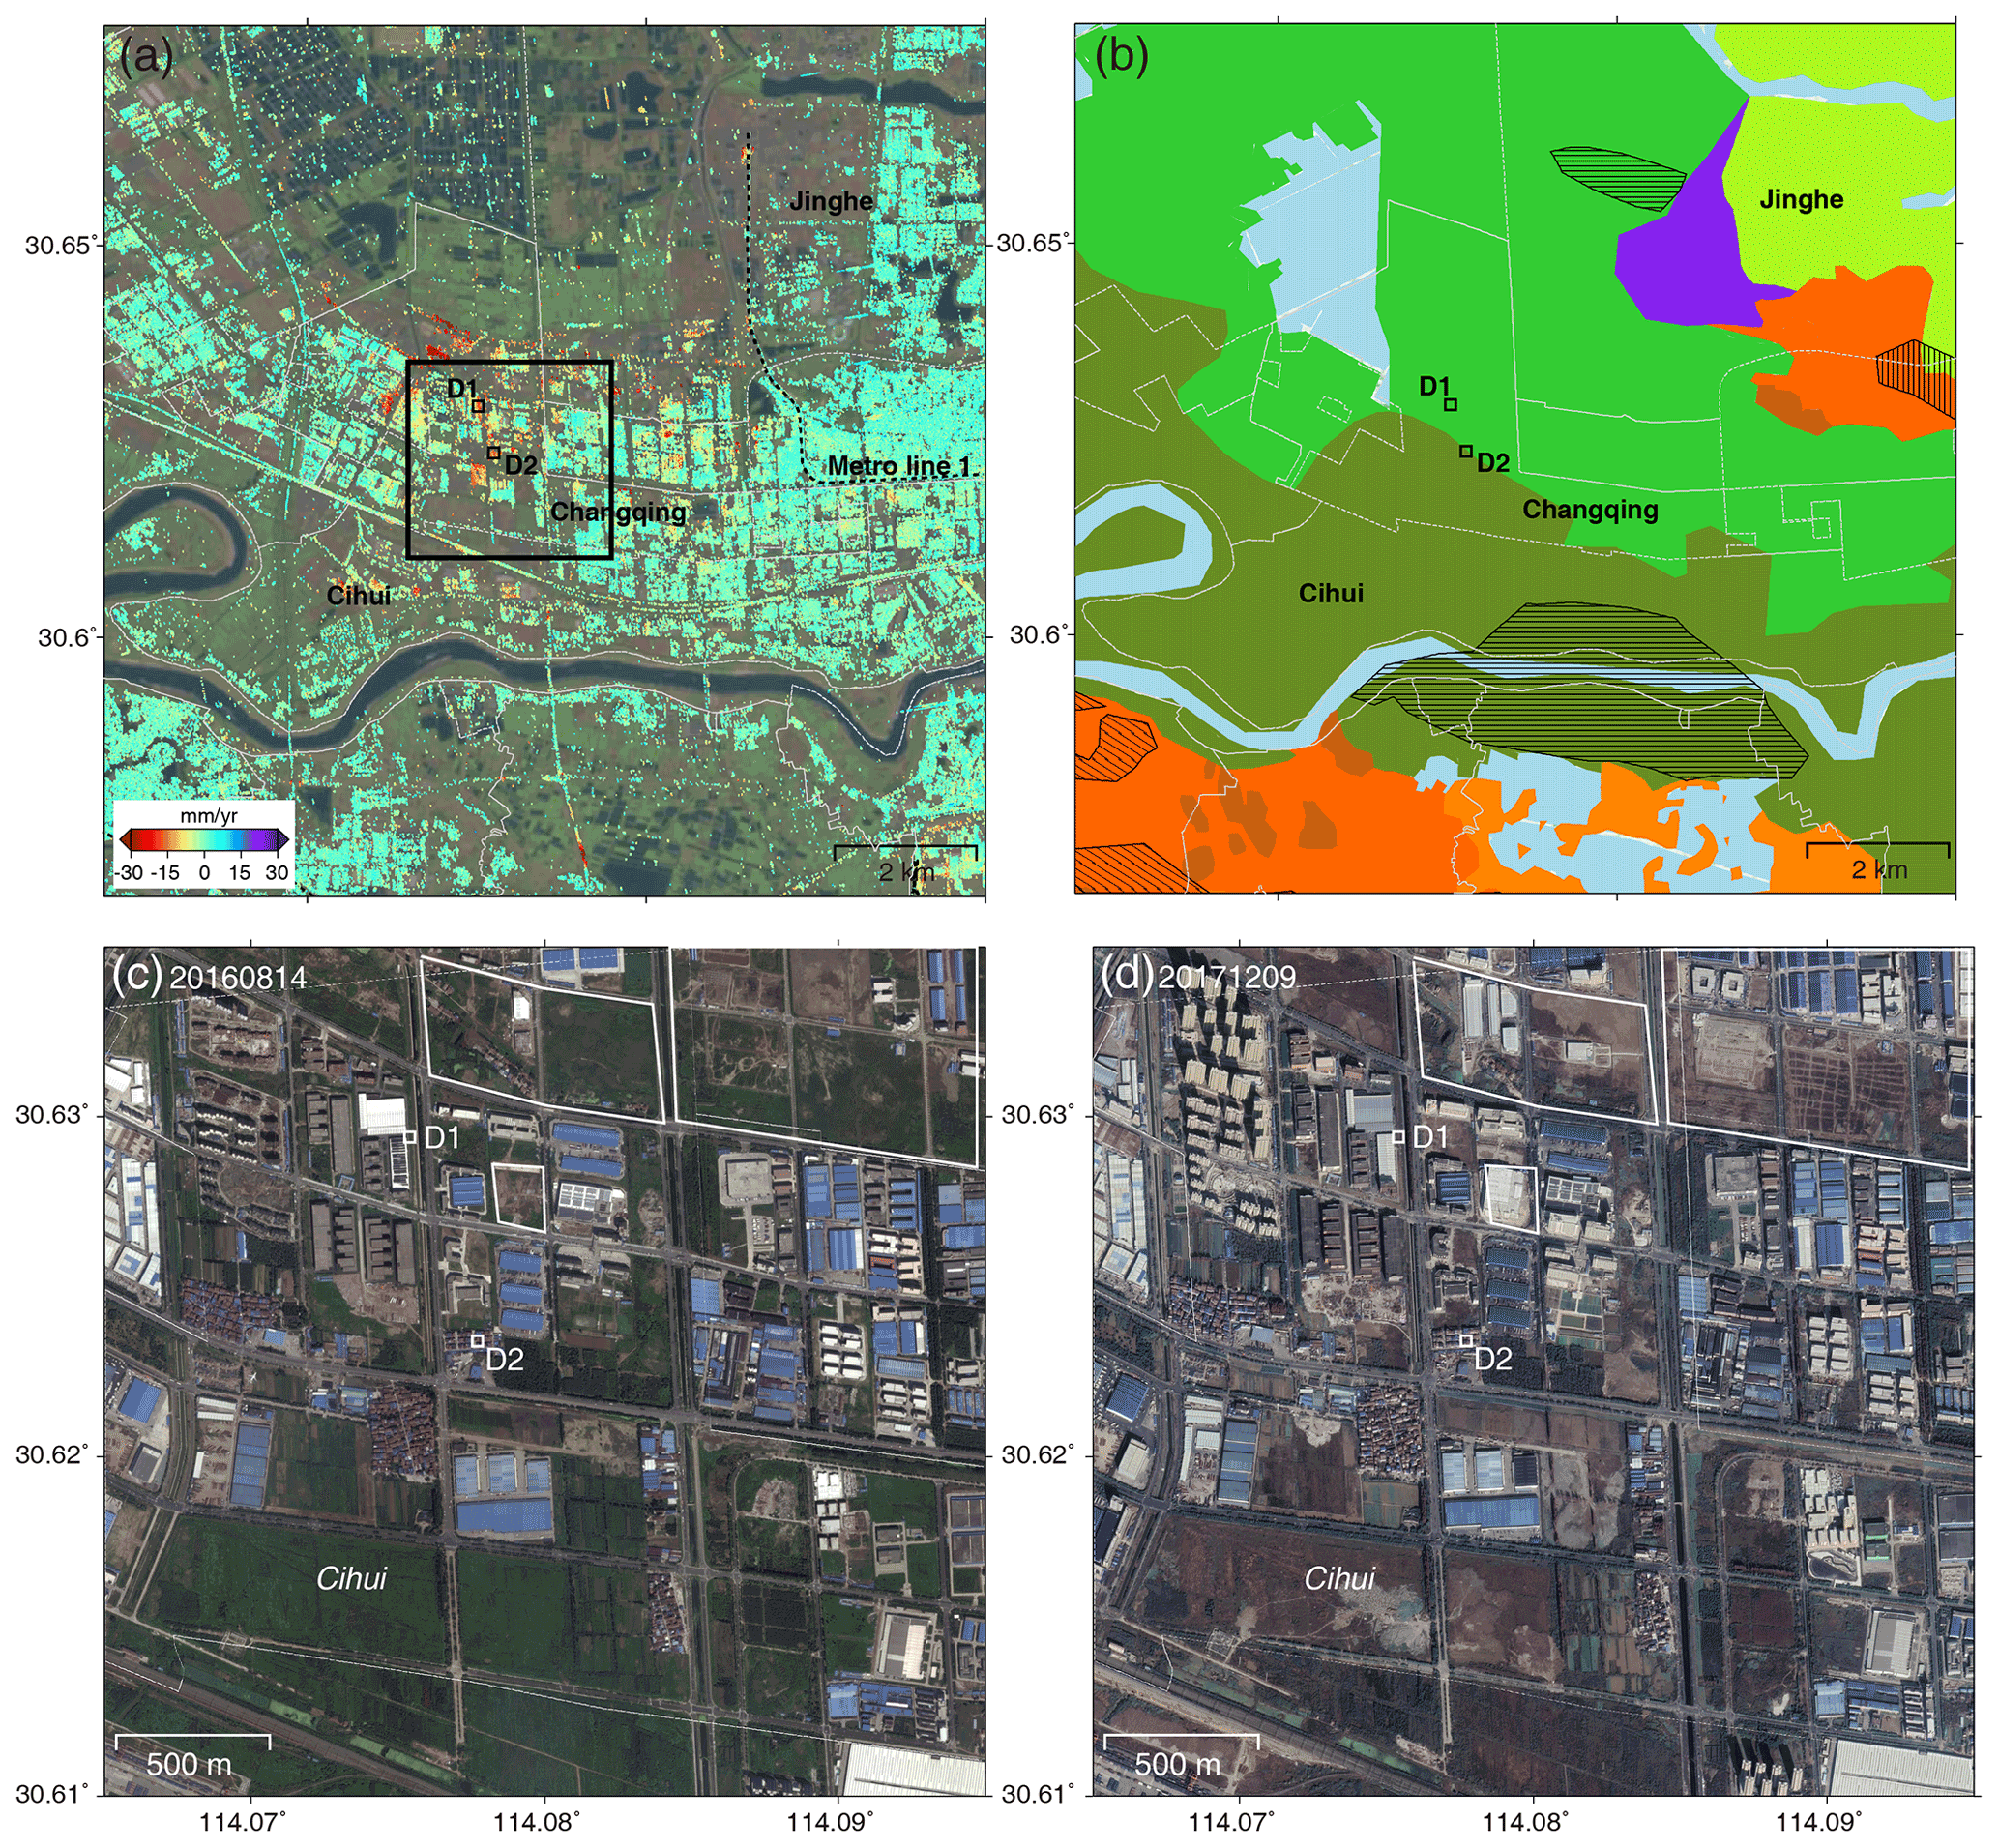
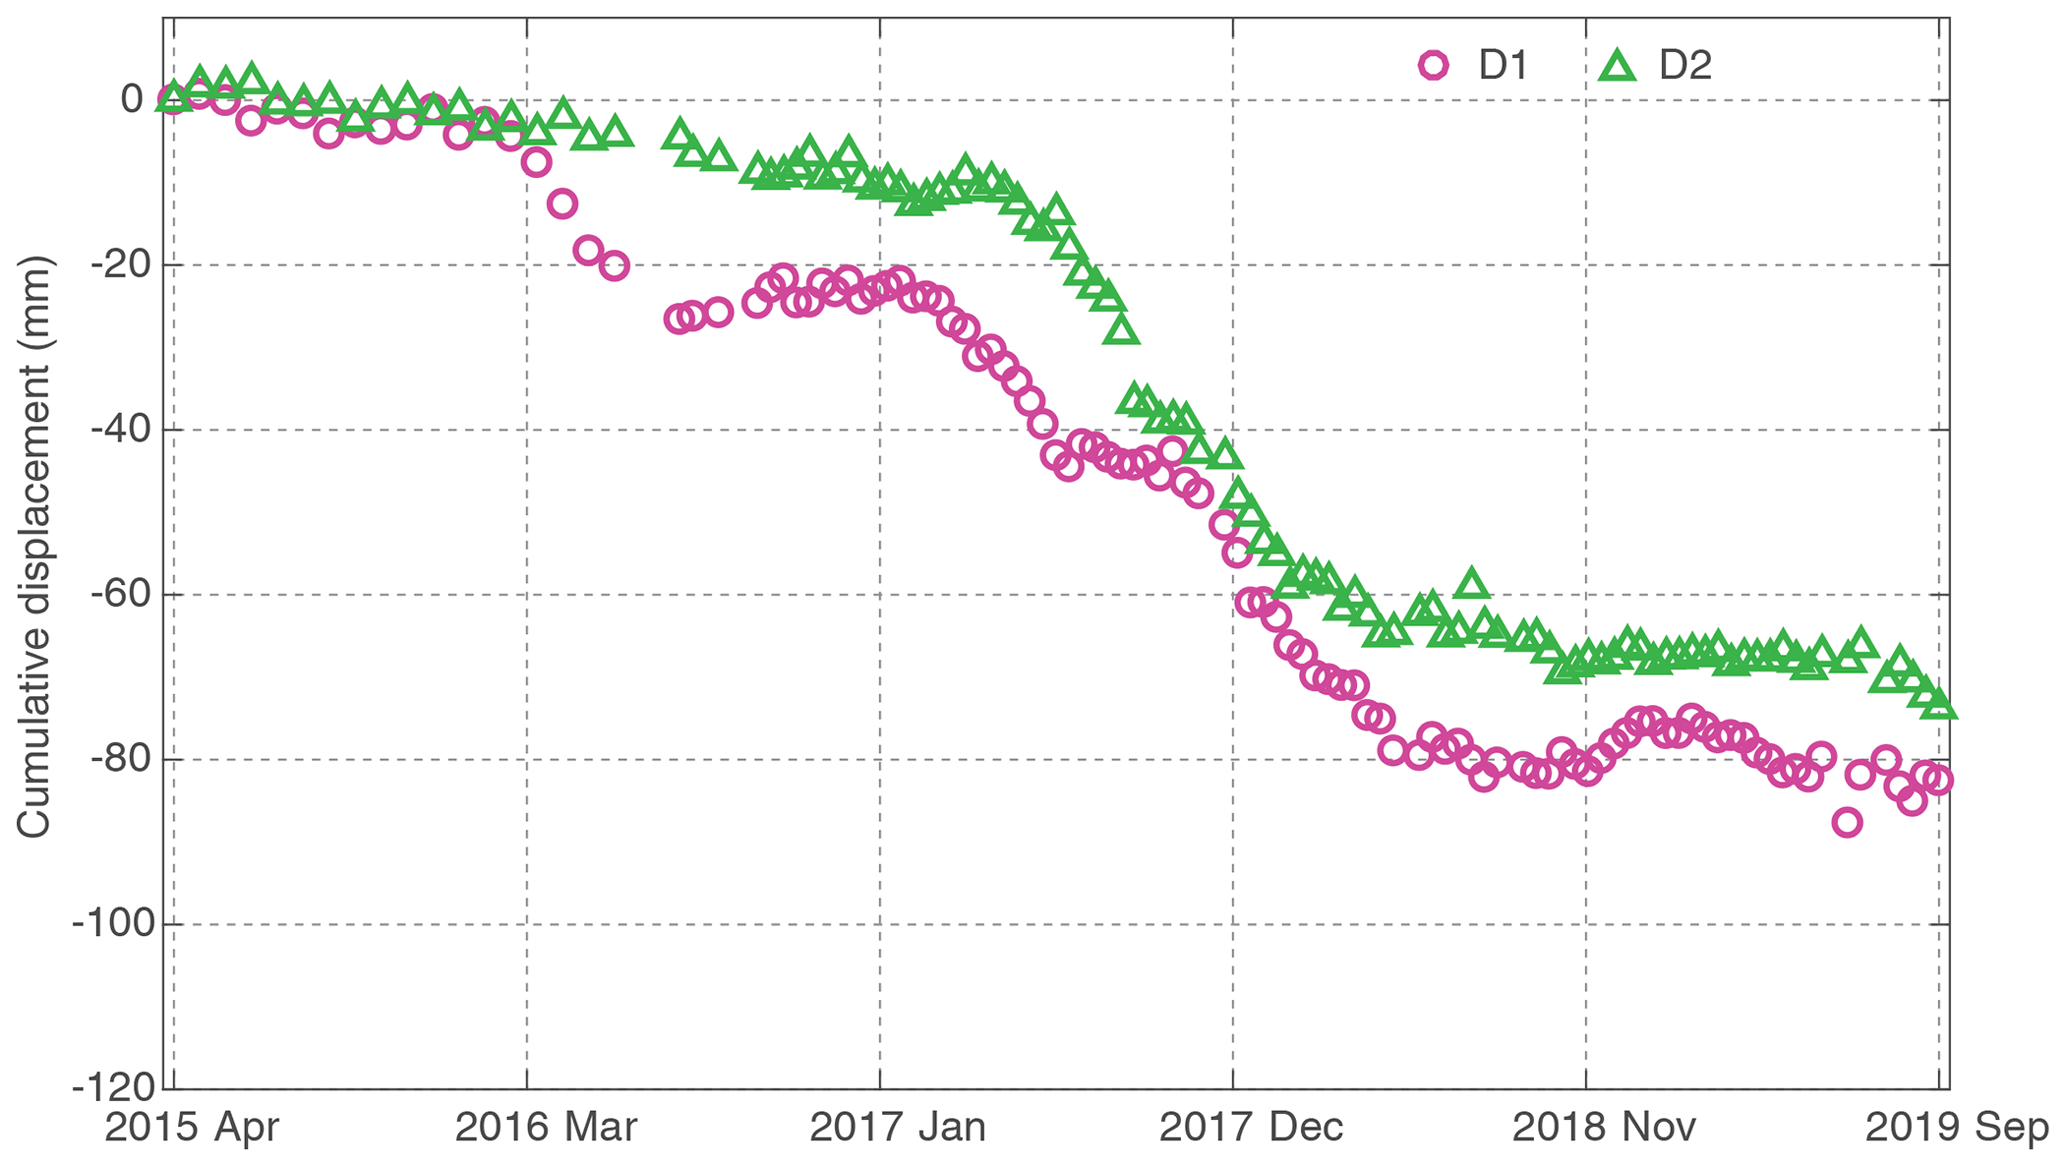
Figure 12(a) Subsidence rate of Dongxihu area during 2015–2019. The rectangle represents the location of panels (c) and (d). Panel (b) is the corresponding EGS map, and the legend is the same as in Fig. 1b. Panels (c) and (d) are © Google Earth™ images of points D1 and D2, acquired in August 2017 and December 2017. The white polygons mark the changes over this period.
4.6 Dongxihu area
The subsidence rate over the Dongxihu area is shown in Fig. 12, where displacements are mainly distributed over the first terrace lacustrine EGS and first terrace alluvial EGS with flat terrain. The maximum displacement is up to ∼30 mm/yr. The subsidence of the carbonatite EGSs in this area was less than 10 mm/yr. The accumulative subsidence of D1 and D2 shows nonlinear displacement behaviors and reaches approximately 80 mm between 2015 and 2019 (Fig. 13). The ongoing construction, together with the artificial loading, is responsible for subsidence over this region. Figure 12c and d show the © Google Earth™ images covering D1 and D2 acquired on August 2017 and December 2017. We labeled the ground changes over this period with white polygons. We can see that three land cover conversions occur in the surrounding area of D1 and D2. The acceleration occurring in D1 and D2 after January 2017 might correspond to the land conversions in Fig. 12c and d.
5.1 Groundwater-pumping-induced subsidence
Uneven settlements caused by excessive pumping of groundwater are a common phenomenon in rapidly developing cities (Chaussard et al., 2013; Wuhan Bureau of Natural Resources and Planning, 2018). Thus, the groundwater extractions have been restricted in Wuhan since 2013 (Chen, 2016). However, the dewatering process is generally carried out during the construction of deep foundation pits (Li et al., 2013; Cui et al., 2018). As a result, the groundwater level might gradually decline in the surrounding areas, and subsidence occurs in the meantime. During 2014, there were approximately 10 473 building sites and 539 municipal infrastructure construction sites in Wuhan (Xu, 2016). As shown in Figs. 6, 8, 10, and 12, subsidence caused by construction activities is widely distributed in Wuhan. Taking QS1 as an example, it is about 150 m away from the Baoye Center, which has been constructed since November 2015 (Fig. S2a). Signs of construction were observed from the optical image acquired in February 2016 (Fig. S2b). Acceleration from the time series subsidence was also observed in Fig. 11. Similar behavior can also be observed for QS2, which is about 500 m away from the Shisan–Jiefang and Shisi–Jiefang. Based on our interpretation of the optical image acquired in May 2017 (Fig. S2c), the housing demolition is almost finished. Construction started in May 2018 and buildings are identified at Shisan–Jiefang from the optical image acquired in October 2018 (Fig. S2d). Accelerations can be clearly observed by InSAR measurements (Fig. 11) during the deep foundation pit dewatering. Meanwhile, the first terrace and second terrace EGSs are composed of typical binary structural stratums (Table S1), which are soft clay or muck soil in the upper part and sandy soil or sandy gravel in the lower part. The groundwater level is highly correlated with the river levels of the Yangtze or Han rivers, especially in the first terrace (Li et al., 2013; Chen, 2016). Water-level-correlated displacement was also observed in the first terrace in previous studies using TerraSAR-X data (Bai et al., 2016).
5.2 Impact factors of karst subsidence
Natural factors (e.g., groundwater level variations and extreme rainfall) and anthropogenic activities will cause karst collapse (Wang et al., 2020; Tu et al., 2019). The groundwater level variations induced by river level or rainfall may create negative pressure in fissures near the bedrock surface of the karst caves. In general, the groundwater in the karst area can be divided into perched water, pore-confined water, fracture karst water, and fracture water from the top to the bottom layers (Wang et al., 2020). The perched water and pore-confined water are directly connected with the river level (Tu et al., 2019). In statistics, karst collapse directly induced by pumping of groundwater has not occurred since 2001 due to the strict control by the government (Xu, 2016). However, anthropogenic engineering activities, e.g., foundation engineering or drilling, frequently cause karst collapse to occur (Zheng et al., 2019). Also, the karst collapses are closely correlated with the Yangtze or Han rivers' water level fluctuation (Chen, 2016).
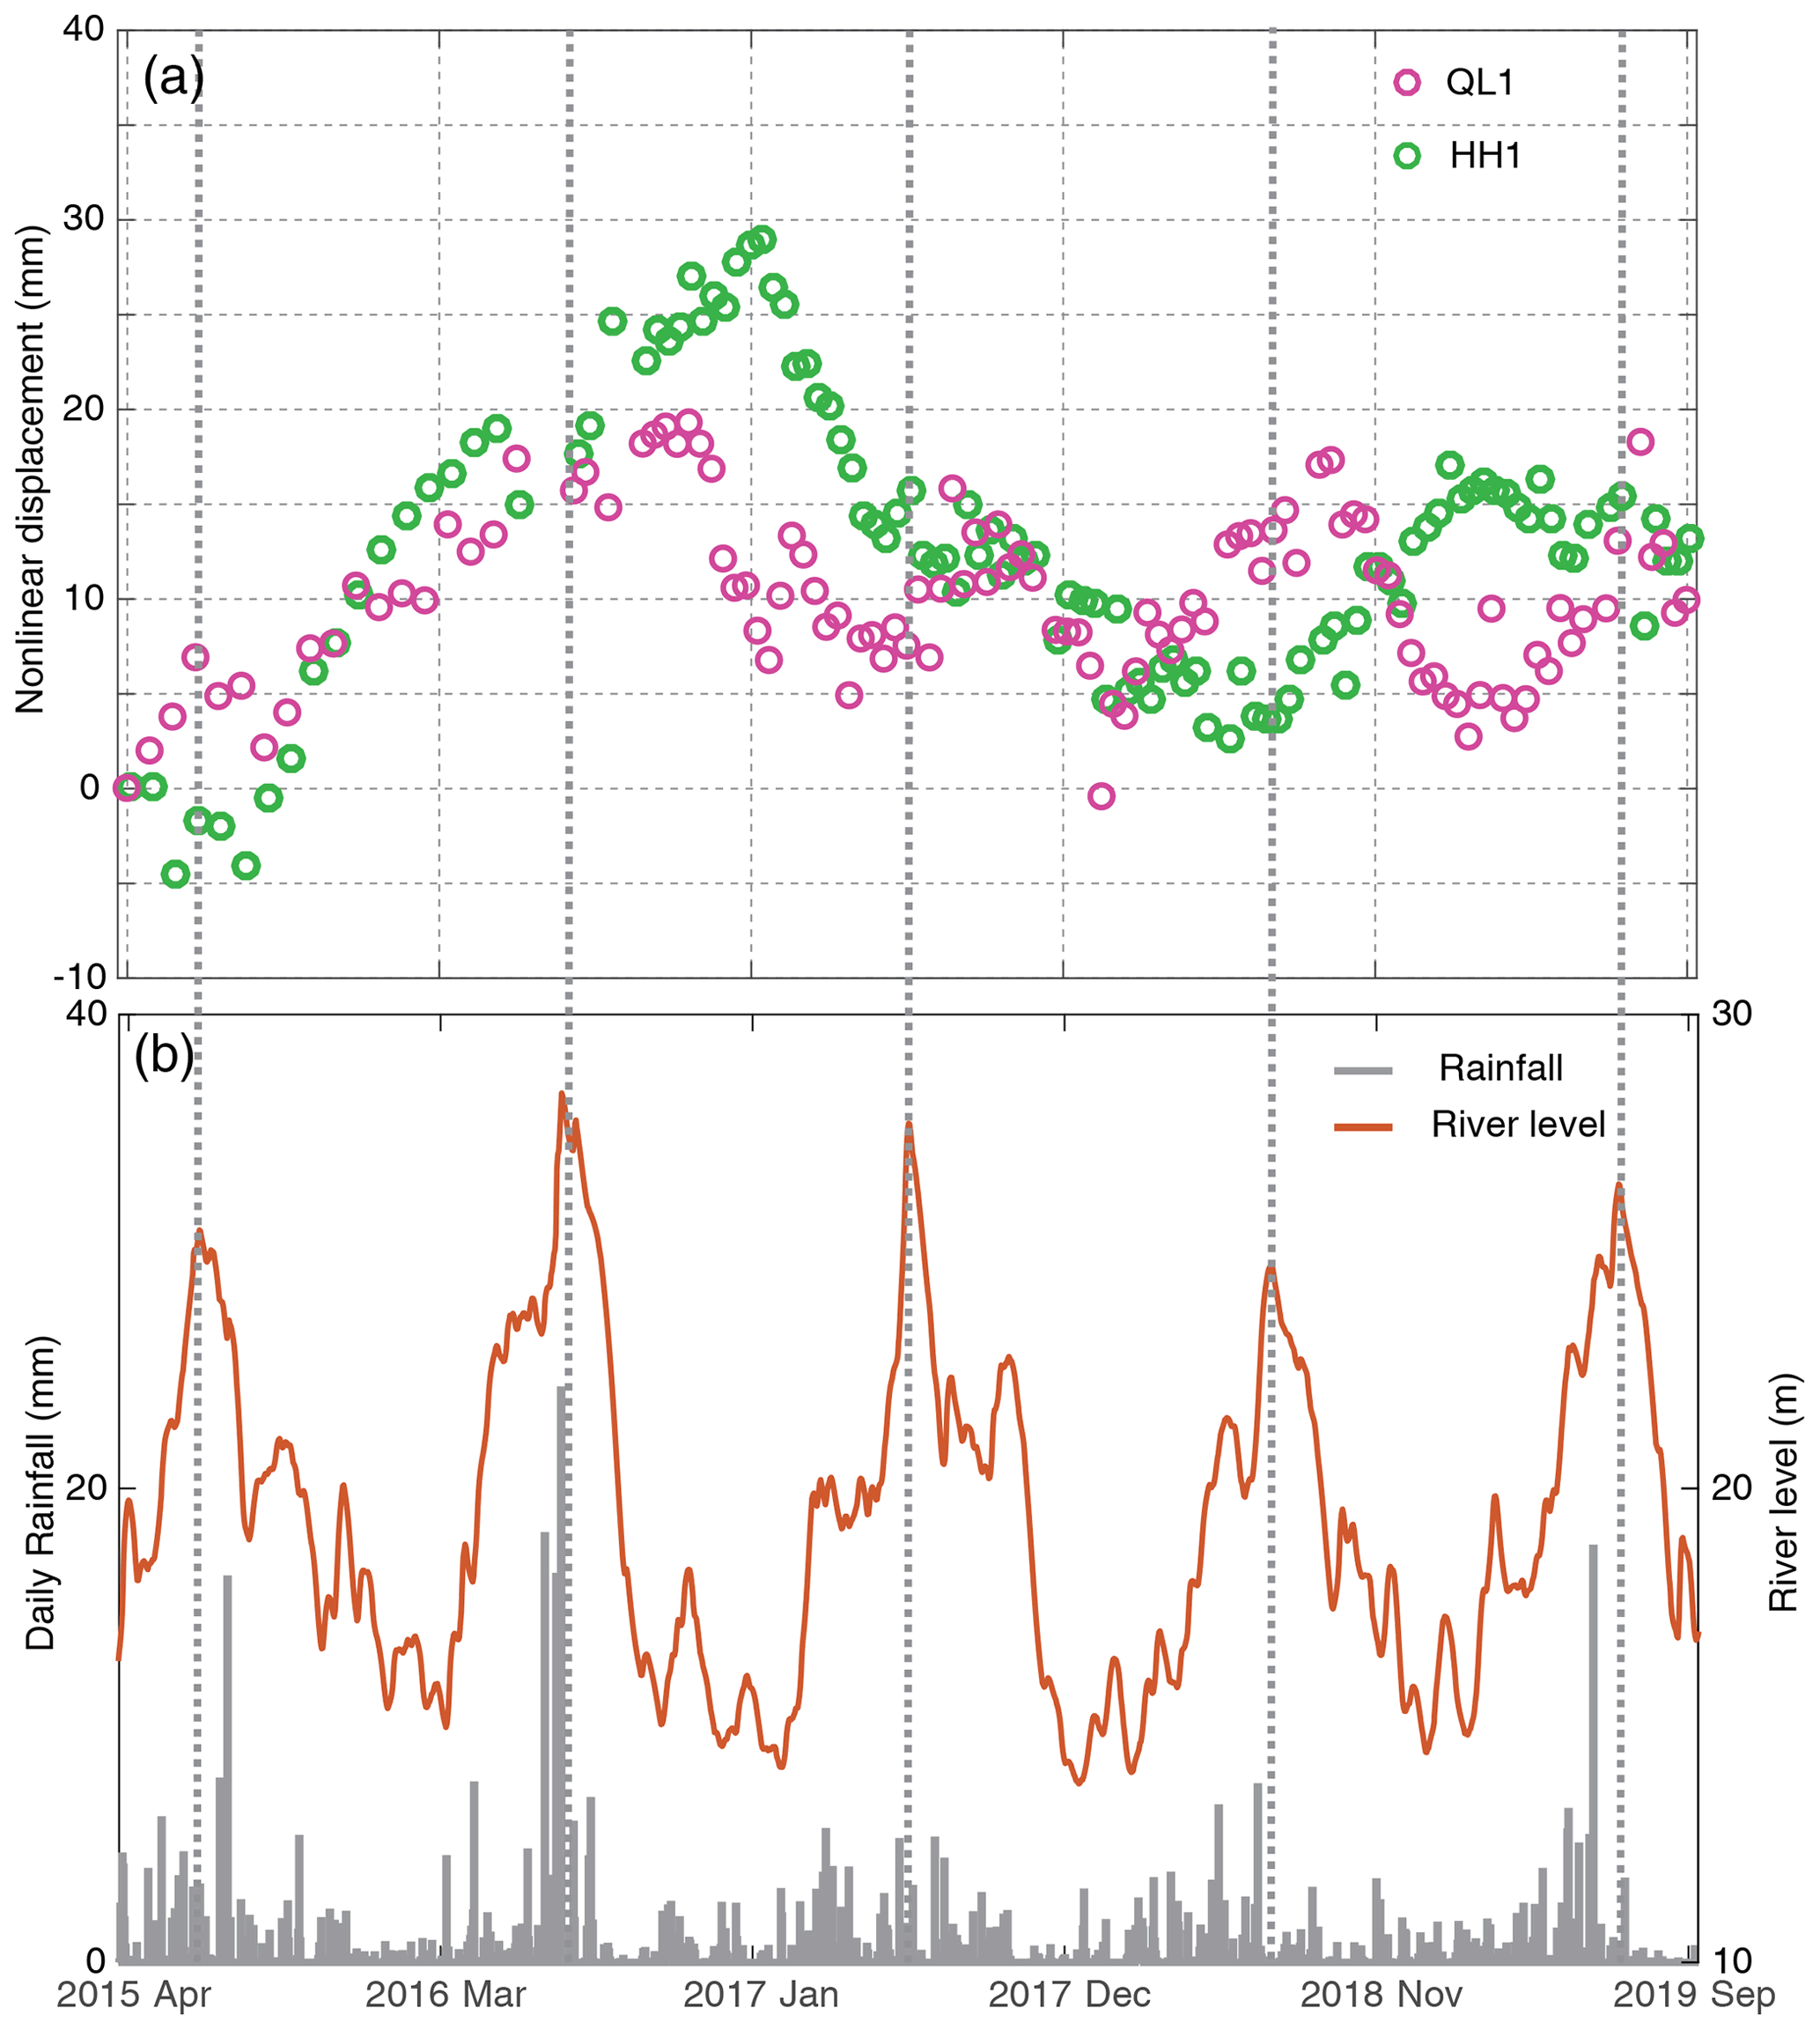
Figure 14(a) Nonlinear subsidence of HH1 and QL1. (b) Water level of Yangtze river and rainfall.
QL1, in the Qingling–Jiangdi area, and HH1, in the Houhu area, are located in carbonatite EGSs in this study. To analyze the impact of water level or rainfall, we removed the linear displacement components from both points. The nonlinear part of the time series subsidence, together with the rainfall and water level, are depicted in Fig. 14. It can be seen, from Fig. 14b, that the river level is correlated with the rainfall to some extent. Although a large variation in water level occurred during April 2015 and March 2013, QL1 is almost stable during this period, as we can infer from Fig. 7. Optical images from July 2015 to December 2017 (Fig. S3) indicated that the land conversions during this period can almost be neglected. The extremely rainfall in July 2016 might have triggered the initial acceleration. Since then, the nonlinear subsidence of QL1 has been highly correlated with the rainfall. Although river level might also be correlated with karst subsidence (Fig. 14), rainfall might play a dominant role in QL1. Moreover, it is worth noting that there are lags between subsidence and rainfall, which caused rainfall seepages. On the contrary, the interaction between rainfall/river level changes and subsidence is not remarkable at point HH1. We found that the dissolution degree of the bedrock of the karst caves at Qingling–Jiangdi is high, while it is low for Houhu and Qingshan (Xu, 2016). The subsidence of HH1 was caused mostly by the deep foundation pit dewatering. Construction activities were observed at the area marked by the red rectangle located extremely near HH1 during February 2016 and December 2017 in Fig. S4. Although we do not know the exact date of the construction activities, acceleration, which was almost in pace with the construction, was observed at HH1.
We obtained the subsidence rate map over the Wuhan region from Sentinel-1 imagery acquired from 2015 to 2019. Our results were validated with leveling measurements with an accuracy better than 5 mm, indicating that InSAR is an effective tool for monitoring ground subsidence with dense measurement points in urban areas. Our study revealed that the overall subsidence trends agree well with the distribution of EGSs covered by soft soils. Rapid urban development is the dominant impact factor of subsidence. The dewatering process of deep foundation pits and the corresponding consolidation lead to serious subsidence, e.g., Qingling–Jiangdi in Fig. 6, Houhu in Fig.8, and Qingshan in Fig. 10. The subsidence centers shift with the intensity of urban constructions. Furthermore, we found that Qingling–Jiangdi, located in the first terrace, is suffering from karst subsidence with a velocity from 20 to 30 mm/yr, which brings great threats to peoples' daily lives. Based on comparison with precipitation and water level data, the karst subsidence might have been triggered by the extreme rainfall in July 2016, and the nonlinear characteristic subsidence is highly correlated with the rainfall with lags since then. Nowadays, the advent of the European Space Agency's Copernicus program and the upcoming NASA–ISRO (Indian Space Research Organization) SAR mission provides unprecedented opportunities for continuous radar mapping of the Earth, with enhanced revisit frequency, which will help us understand the underlying driving factors and detect anomalies in subsidence as a result of urban sprawl. Automatic near-real-time InSAR processing and anomaly detecting methods should be developed to identify the potential risks in a timely manner.
The Copernicus Sentinel-1 data are provided by European Space Agency (ESA) through the Alaska Satellite Facility (ASF). The precipitation data are provided by the China Meteorological Data Service Center. The water level data of Yangtze river is collected from the Hefei flood and drought information network.
The supplement related to this article is available online at: https://doi.org/10.5194/nhess-21-2285-2021-supplement.
XS, SZ, MJ, and YP conceived and designed the experiments. XS performed the experiments. XS, TQ, JX, and CY analyzed the results. XS wrote the original paper, with input from all the co-authors.
The authors declare that they have no conflict of interest.
Publisher's note: Copernicus Publications remains neutral with regard to jurisdictional claims in published maps and institutional affiliations.
We thank Deodato Tapete and the two anonymous referees, for the thoughtful comments. We acknowledge Paolo Tarolli for handling the paper.
This work was financially supported by the National Natural Science Foundation of China (grant no. 41702376) and the Key Research Program of Department of Education of Anhui Province, China (grant no. KJ2018A0503).
This paper was edited by Paolo Tarolli and reviewed by two anonymous referees.
Bai, L., Jiang, L., Wang, H., and Sun, Q.: Spatiotemporal Characterization of Land Subsidence and Uplift (2009–2010) over Wuhan in Central China Revealed by TerraSAR-X InSAR Analysis, Remote Sensing, 8, 350, https://doi.org/10.3390/rs8040350, 2016.
Bai, L., Jiang, L., and Wang, H.: Monitoring Ground Subsidence in Wuhan City with High-Resolution TerraSAR-X Images from 2013 to 2015, Journal of Geodesy and Geodynamics, 39, 832–836, 2019.
Benattou, M. M., Balz, T., and Liao, M.: MEASURING SURFACE SUBSIDENCE IN WUHAN, CHINA WITH SENTINEL-1 DATA USING PSINSAR, Int. Arch. Photogramm. Remote Sens. Spatial Inf. Sci., XLII-3, 73–77, https://doi.org/10.5194/isprs-archives-XLII-3-73-2018, 2018.
Chaussard, E., Amelung, F., Abidin, H., and Hong, S.-H.: Sinking cities in Indonesia: ALOS PALSAR detects rapid subsidence due to groundwater and gas extraction, Remote Sens. Environ., 128, 150–161, https://doi.org/10.1016/j.rse.2012.10.015, 2013.
Chen, D.: Study on mechhanism and numerical simulation of Karst collapse in Qingling Town Wuhan City, PhD thesis, China University of Geosciences, Wuhan, China, 2016.
Costantini, M., Bai, J., Malvarosa, F., Minati, F., Vecchioli, F., Wang, R., Hu, Q., Xiao, J., and Li, J.: Ground deformations and building stability monitoring by COSMO-SkyMed PSP SAR interferometry: Results and validation with field measurements and surveys, 2016 IEEE International Geoscience and Remote Sensing Symposium (IGARSS), 6847–6850, 2016.
Cui, X., Liu, Q., Zhang, C., Huang, Y., Fan, Y., and Wang, H.: Land subsidence due to groundwater pumping and recharge: considering the particle-deposition effect in ground-source heat-pump engineering, Hydrogeol. J., 26, 789–802, https://doi.org/10.1007/s10040-018-1723-4, 2018.
Dang, V. K., Doubre, C., Weber, C., Gourmelen, N., and Masson, F.: Recent land subsidence caused by the rapid urban development in the Hanoi region (Vietnam) using ALOS InSAR data, Nat. Hazards Earth Syst. Sci., 14, 657–674, https://doi.org/10.5194/nhess-14-657-2014, 2014.
Ferretti, A., Prati, C., and Rocca, F.: Permanent scatterers in SAR interferometry, IEEE T. Geosci. Remote, 39, 8–20, https://doi.org/10.1109/36.898661, 2001.
Deng, J., Wu, W., and Qin, Z.: The Division of the Quanternary System of Wuhan, Journal of Hubei University (Natural Science Edition), 13, 178–183, 1991.
Guan, S., Zhu, R., Pang, S., and Jiang, D.: The Study for Engineering Geological Zonation of Metropolitan Development Area in Wuhan, Urban Geotechnical Investigation and Surveying, 172–176, 2016.
Han, Y., Zou, J., Lu, Z., Qu, F., Kang, Y., and Li, J.: Ground Deformation of Wuhan, China, Revealed by Multi-Temporal InSAR Analysis, Remote Sensing, 12, 3788, https://doi.org/10.3390/rs12223788, 2020.
Hooper, A.: A multi-temporal InSAR method incorporating both persistent scatterer and small baseline approaches, Geophys. Res. Lett., 35, L16302, https://doi.org/10.1029/2008GL034654, 2008.
Hooper, A. and Zebker, H. A.: Phase unwrapping in three dimensions with application to InSAR time series, J. Opt. Soc. Am. A, 24, 2737–2747, 2007.
Hu, L., Dai, K., Xing, C., Li, Z., Tomás, R., Clark, B., Shi, X., Chen, M., Zhang, R., Qiu, Q., and Lu, Y.: Land subsidence in Beijing and its relationship with geological faults revealed by Sentinel-1 InSAR observations, Int. J. Appl. Earth Obs., 82, 101886, https://doi.org/10.1016/j.jag.2019.05.019, 2019.
Jiang, H., Balz, T., Cigna, F., and Tapete, D.: Land Subsidence in Wuhan Revealed Using a Non-Linear PSInSAR Approach with Long Time Series of COSMO-SkyMed SAR Data, Remote Sensing, 13, 1256, https://doi.org/10.3390/rs13071256, 2021.
Jiang, M.: Sentinel-1 TOPS co-registration over low-coherence areas and its application to velocity estimation using the all pairs shortest path algorithm, J. Geodesy, 94, 95, https://doi.org/10.1007/s00190-020-01432-1, 2020.
Jiang, M. and Guarnieri, A. M.: Distributed Scatterer Interferometry With the Refinement of Spatiotemporal Coherence, IEEE T. Geosci. Remote, 58, 3977–3987, https://doi.org/10.1109/TGRS.2019.2960007, 2020.
Kim, J.-W., Lu, Z., and Kaufmann, J.: Evolution of sinkholes over Wink, Texas, observed by high-resolution optical and SAR imagery, Remote Sens. Environ., 222, 119–132, https://doi.org/10.1016/j.rse.2018.12.028, 2019.
Li, C., Zhang, Y., Pang, S., and Guan, S.: Study on engineeering geological zonging: base on geomorphic units – case study of the Wuhan metropolitan development development area, Geological Review, 65, 645–652, 2019.
Li, Y., He, Z. Z., Yan, G. H., and Han, F. Y.: Foundation Pit Dewatering and Ground Subsidence in Binary Structural Stratum of Wuhan, Adv. Mater. Res., 639–640, 694–699, 2013.
Ng, A. H.-M., Ge, L., Li, X., Abidin, H. Z., Andreas, H., and Zhang, K.: Mapping land subsidence in Jakarta, Indonesia using persistent scatterer interferometry (PSI) technique with ALOS PALSAR, Int. J. Appl. Earth Obs., 18, 232–242, 2012.
Perissin, D., Wang, Z., and Lin, H.: Shanghai subway tunnels and highways monitoring through Cosmo-SkyMed Persistent Scatterers, ISPRS J. Photogramm., 73, 58–67, https://doi.org/10.1016/j.isprsjprs.2012.07.002, 2012.
Ruiz-Constán, A., Ruiz-Armenteros, A. M., Galindo-Zaldívar, J., Lamas-Fernández, F., Sousa, J. J., Galdeano, C. S. D., Pedrera, A., Martos-Rosillo, S., Cuenca, M. C., and Delgado, J. M.: Factors determining subsidence in urbanized floodplains: evidences from MT-InSAR in Seville (Southern Spain), Earth Surf. Proc. Land., 42, 2484–2497, 2017.
Shi, X., Liao, M., Li, M., Zhang, L., and Cunningham, C.: Wide-Area Landslide Deformation Mapping with Multi-Path ALOS PALSAR Data Stacks: A Case Study of Three Gorges Area, China, Remote Sensing, 8, 136, https://doi.org/10.3390/rs8020136, 2016.
Sun, W., Li, J., Bai, J., and Tong, X.: Using the PS-InSAR Technique to Monitor Wuhan Urban District Land Subsidence, Urban Geotechnical Investigation and Surveying, 120–125, 2019.
Takaku, J., Tadono, T., Tsutsui, K., and Ichikawa, M.: VALIDATION OF “AW3D” GLOBAL DSM GENERATED FROM ALOS PRISM, ISPRS Ann. Photogramm. Remote Sens. Spatial Inf. Sci., III-4, 25–31, https://doi.org/10.5194/isprs-annals-III-4-25-2016, 2016.
Tan, R., Liu, Y., Liu, Y., He, Q., Ming, L., and Tang, S.: Urban growth and its determinants across the Wuhan urban agglomeration, central China, Habitat Int., 44, 268–281, https://doi.org/10.1016/j.habitatint.2014.07.005, 2014.
Tu, J., Wei, R., Yang, G., Liu, C., Jin, X., and Li, H.: Analysis on spatial and temporal distribution characteristics of karst, The Chinese Journal of Geological Hazard and Control, 30, 68–73, 2019.
Wang, X., Lai, J., He, S., Garnes, R. S., and Zhang, Y.: Karst geology and mitigation measures for hazards during metro system construction in Wuhan, China, Nat. Hazards, 103, 2905–2927, https://doi.org/10.1007/s11069-020-04108-3, 2020.
Wuhan Bureau of Natural Resources and Planning: Geological disaster prevention and control plan of Wuhan City (2016–2020), available at: http://zrzyhgh.wuhan.gov.cn/zwgk_18/fdzdgk/ghjh/zzqgh/202001/t20200107_602757.shtml (last access: 12 July 2020), 2018.
Xu, G.: Mechanism and Hazard Assessment of Covered Karst Sink- holes in Wuhan City, China, PhD thesis, China University of Geosciences, Wuhan, China, 2016.
Xue, Y.-Q., Zhang, Y., Ye, S.-J., Wu, J.-C., and Li, Q.-F.: Land subsidence in China, Environ. Geol., 48, 713–720, https://doi.org/10.1007/s00254-005-0010-6, 2005.
Yin, Y., Zhang, Z., and Zhang, K.: Land subsidence and countermeasures for its prevention in China, The Chinese Journal of Geological Hazard and Control, 16, 1–8, 2005.
Yu, Y., Balz, T., Luo, H., Liao, M., and Zhang, L.: GPU accelerated interferometric SAR processing for Sentinel-1 TOPS data, Comput. Geosci., 129, 12–25, 2019.
Zhang, Y., Liu, Y., Jin, M., Jing, Y., Liu, Y., Liu, Y., Sun, W., Wei, J., and Chen, Y.: Monitoring Land Subsidence in Wuhan City (China) using the SBAS-InSAR Method with Radarsat-2 Imagery Data, Sensors, 19, 743, https://doi.org/10.3390/s19030743, 2019.
Zhao, C., Liu, C., Zhang, Q., Lu, Z., and Yang, C.: Deformation of Linfen-Yuncheng Basin (China) and its mechanisms revealed by Π-RATE InSAR technique, Remote Sens. Environ., 218, 221–230, https://doi.org/10.1016/j.rse.2018.09.021, 2018.
Zheng, X., Jin, X., Chen, B., Liu, P., Yang, G., Li, H., and Yang, T.: Mechanism and modes of karst collapes in Wuhan city, China, The Chinese Journal of Geological Hazard and Control, 30, 75–82, 2019.
Zhou, C., Gong, H., Chen, B., Li, X., Li, J., Wang, X., Gao, M., Si, Y., Guo, L., Shi, M., and Duan, G.: Quantifying the contribution of multiple factors to land subsidence in the Beijing Plain, China with machine learning technology, Geomorphology, 335, 48–61, https://doi.org/10.1016/j.geomorph.2019.03.017, 2019.
Zhou, L., Guo, J., Hu, J., Li, J., Xu, Y., Pan, Y., and Shi, M.: Wuhan Surface Subsidence Analysis in 2015–2016 Based on Sentinel-1A Data by SBAS-InSAR, Remote Sensing, 9, 982, https://doi.org/10.3390/rs9100982, 2017.