the Creative Commons Attribution 4.0 License.
the Creative Commons Attribution 4.0 License.
 | 02 Jul 2021
Implementation of WRF-Hydro at two drainage basins in the region of Attica, Greece, for operational flood forecasting
Elissavet Galanaki
Konstantinos Lagouvardos
Vassiliki Kotroni
Theodore Giannaros
Christos Giannaros
An integrated modeling approach for forecasting flood events is presented in the current study. An advanced flood forecasting model, which is based on the coupling of hydrological and atmospheric components, was used for a twofold objective: first to investigate the potential of a coupled hydrometeorological model to be used for flood forecasting at two medium-size drainage basins in the area of Attica (Greece) and second to investigate the influence of the use of the coupled hydrometeorological model on the precipitation forecast skill. For this reason, we used precipitation and hydrometric in situ data for six flood events at two selected drainage regions of Attica. The simulations were carried out with the Weather Research and Forecasting (WRF) model (WRF-only) and the WRF-Hydro system in a fully coupled mode, under which surface, subsurface, and channel hydrological processes were parameterized at a fine-resolution grid of 95 m approximately. Results showed that the coupled WRF-Hydro system was capable of producing the observed discharge during the flood episodes, after the adequate calibration method applied at the studied basins. This outcome provides confidence that the model configuration under the two-way atmospheric–hydrological coupling is robust and, thus, can be used for operational flood forecasting purposes in the area of Attica. In addition, the WRF-Hydro model showed a tendency to slightly improve the simulated precipitation in comparison to the precipitation produced by the atmospheric-only version of the model (WRF), demonstrating the capability of the coupled WRF-Hydro model to enhance the precipitation forecast skill for operational flood predictions.
- Article
(1581 KB) - Full-text XML
- BibTeX
- EndNote


Floods are among the most common natural disasters related to deaths, destruction, and economic losses. Worldwide, 500 000 deaths due to floods have been reported from 1980 to 2009, with more than 2.8 billion people being affected (Doocy et al., 2013). Petrucci et al. (2018), who developed a flood mortality database in five study areas in the Mediterranean (including Greece) for the period 1980–2015, have found an increasing trend of flood fatalities during the studied period. In Greece and especially in its capital, Athens, flooding events were responsible for 182 deaths from 1880 to 2010 (Diakakis et al., 2013). Papagiannaki et al. (2013), who developed a database of high-impact weather events over Greece for the period 2001–2011, which has been continuously updated since then, showed that flash floods constitute the most common weather-related phenomenon with damages in Greece. Recently, a devastating flash flood, which affected Mandra (in the western Attica region) on 15 November 2017, resulted in 24 deaths and great economic losses, highlighting the consequences of urbanization, uncontrolled construction, and changes in land use. Hydrological regimes are affected by climate change. In particular, an increase in the intensity and the frequency of floods, due to human-induced climate modifications, has been reported in the literature (Falter et al., 2015; Wu et al., 2014; Romang et al., 2011; Milly et al., 2002; White et al., 2001).
Given the rapid urbanization, the land-use changes, and the human-induced climate change, the risk from future floods is significant, and, thus, reliable and accurate flood forecast systems applied over vulnerable areas are urgently needed. Flood forecasting strengthens the preparedness phases of disaster management, providing a reduction of the impacts of severe rain events. A reliable and effective flood forecasting system should provide an accurate reproduction of both rainfall and hydrological response inside the targeted drainage areas. In this direction, simulating the land–atmosphere interactions through coupling of hydrological and atmospheric models, in order to consider the channel and terrain routing of the surface and subsurface water flows, plays an important role (Larsen et al., 2016; Hauck et al., 2011). The terrestrial hydrological processes affect soil moisture, a variable that is crucial for the computation of the sensible and latent heat fluxes, which in turn affect the atmospheric response (Seneviratne et al., 2010; Maxwell et al., 2007; Etalhir, 1998). Several studies have shown that an improvement, although not always significant, on the forecasting of the spatiotemporal distribution of extreme synoptic and convective precipitation is provided through the use of coupled hydrometeorological models (e.g., Pal et al., 2020; Wehbe et al., 2019; Senatore et al., 2015; Shrestha et al., 2014; Maxwell et al., 2007). Although the mechanisms of the land–atmosphere and hydrology coupling that influence the forecast skill of precipitation are still under investigation, it is well accepted that coupled hydrometeorological models show a significant potential for effective flood forecasting (e.g., Givati et al., 2016). WRF-Hydro, an enhanced version of the Weather Research and Forecasting (WRF; Skamarock et al., 2005) model, is one of the various modeling systems that provides a two-way coupling between the hydrological and land–atmosphere processes. More specifically, it parameterizes overland and river flow routing and subsurface routing in the 2 m soil column, while it also includes a groundwater bucket model, thus providing a feedback between terrestrial hydrology and land–atmosphere interactions in the WRF system. The WRF-Hydro model has been used in numerous flood-related research applications (Senatore et al., 2020; Papaioannou et al., 2019; Varlas et al., 2019; Avolio et al., 2019; Lin et al., 2018; Silver et al., 2017; Xiang et al., 2017; Arnault et al., 2016; Givati et al., 2016; Wagner et al., 2016; Senatore et al., 2015; Yucel et al., 2015) and for operational flood forecasting in the United States (Krajewski et al., 2017; NOAA, 2016) and Israel (Givati and Sapir, 2014). In particular, in the Mediterranean area, Senatore et al. (2020) implemented WRF-Hydro in a catchment of Italy in order to highlight the impact of sea surface temperature (SST) in operational forecasts. Avolio et al. (2019) showed that WRF-Hydro was capable of simulating the hydro-meteorological impact of a high-intensity rainfall event in Italy. Senatore et al. (2015) studied the impact of the fully coupled WRF-Hydro model in the forecasting precipitation and showed that the coupled model provides improved simulation precipitation compared to those provided by WRF-only simulations. Furnari et al. (2020) showed that the implementation of WRF-Hydro has the potential to improve the precipitation forecasts over a small catchment area in Italy by up to 200 %. Camera et al. (2020) have implemented WRF-Hydro in small catchment areas in Cyprus and shown how the accuracy of the input precipitation can strongly affect the hydrological simulation. Furthermore, Varlas et al. (2019) and Papaioannou et al. (2019) have shown that WRF-Hydro demonstrates adequate skill in reproducing two past flood events in Greece.
Considering the increased risk and impacts of flooding (Papagiannaki et al., 2013; Diakakis, 2012), a reliable flood forecasting system serving operational needs constitutes an urgent need in Attica, where 36 % of the total population lives, while changes in land use and high rates of urbanization are major problems (from 1961 to 2001, the city of Athens increased in size by 82 %). This need motivated the present study, which has a twofold objective. Firstly, we investigate the ability of a two-way coupled hydrometeorological model (WRF-Hydro) to be used for flood forecasting purposes at two drainage basins in the area of Attica after adequate calibration and validation. Secondly, we examine the influence of the use of the WRF-Hydro model on the precipitation forecasts compared to the simulations performed with the WRF model.
The next sections of this paper are structured as follows: Sect. 2 provides a detailed presentation of the methodology followed by the model calibration and the datasets used, Sect. 3 discusses the results, and finally Sect. 4 hosts the conclusions and the future prospects of this study.
2.1 Study area and data
The study area is the greater area of Attica basin where the capital and largest city of Greece, Athens, and the largest port of the country, Piraeus, are located. Attica basin has an area of 450 km2 and is characterized by a complex geomorphology (Fig. 1a). It is a triangular peninsula with the Cithaeron mountain range to the north acting as a physical division from Boeotia. The population of Attica is ∼3.8 million people (about 36 % of the national total) and includes a great part of the national financial and commercial activities.
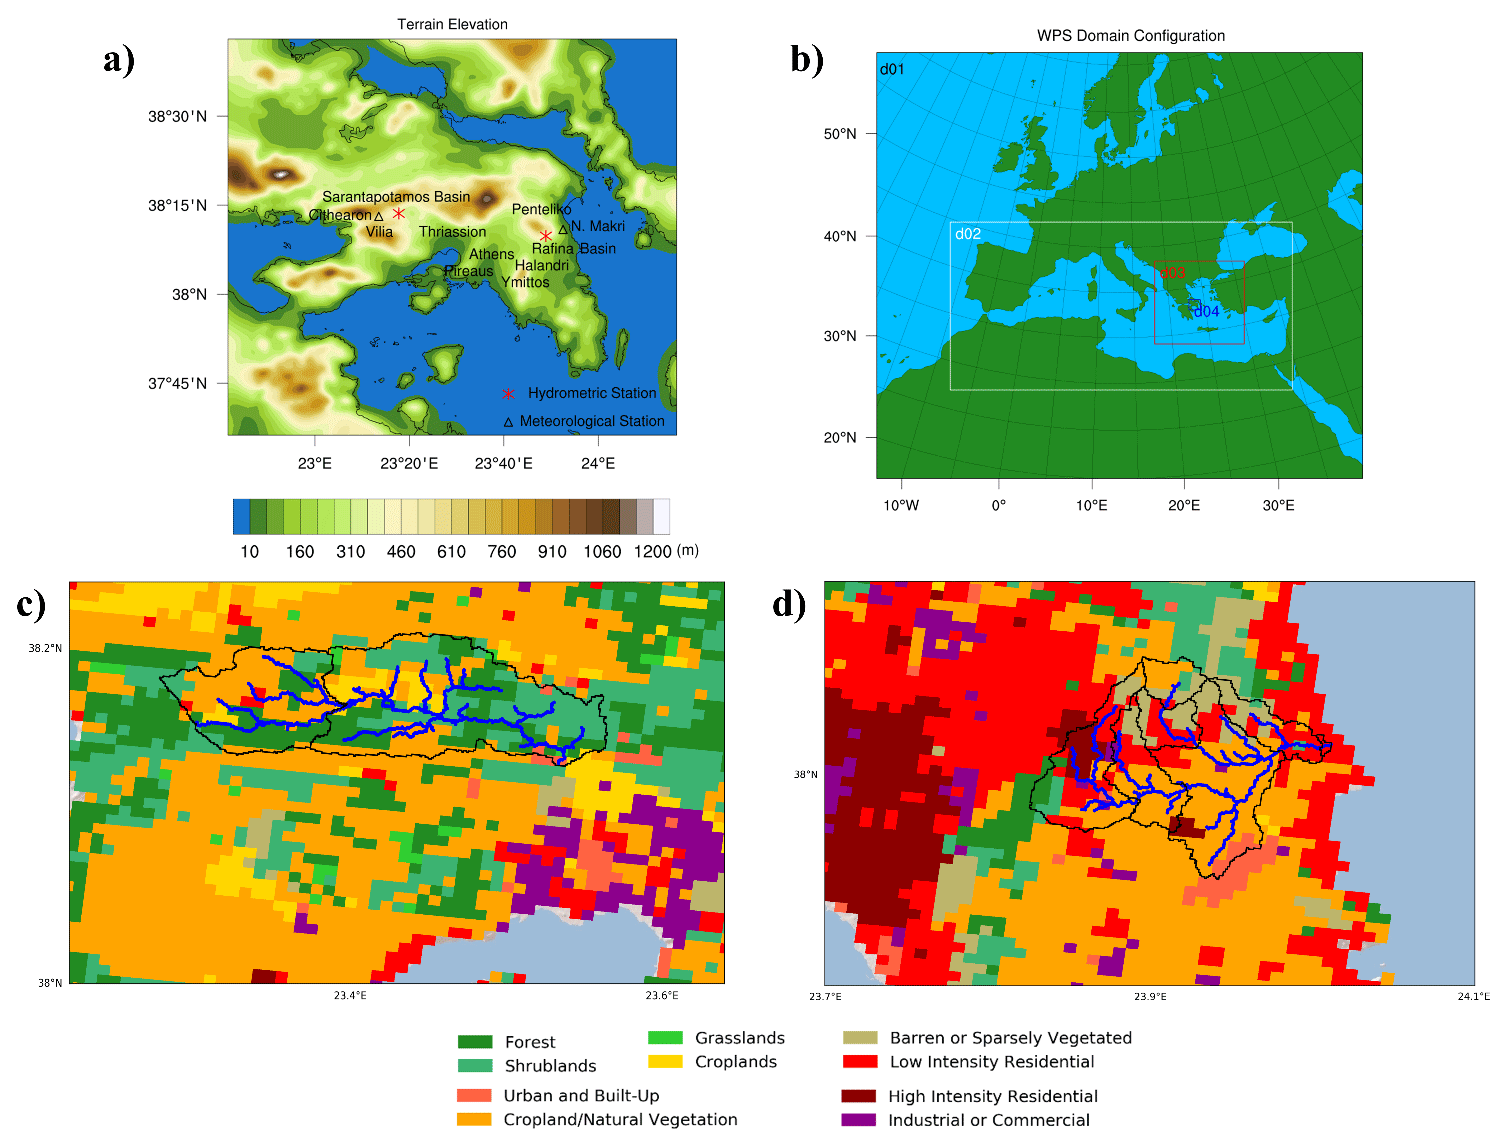
Figure 1(a) Terrain elevation of the studied domain (obtained by MODIS-IGBP global land cover data) along with two channel networks and the positions of the meteorological (triangle marker) and hydrometric stations (star marker). (b) Modeling domains. The borders of analyzed catchments along with the land cover for (c) Sarantapotamos and (d) Rafina basins.
Papagiannaki et al. (2013) and Diakakis (2012) provided evidence that Attica is the most affected area in Greece concerning weather-related hazards and particularly flash floods. Flash-flood events in Attica have been studied from the meteorological point of view (Lagouvardos et al., 1996; among others), the climatological aspect (Galanaki et al., 2016, 2018), flood risk (Lasda et al., 2010; Kandilioti and Makropoulos, 2012), and vulnerability (Papagiannaki et al., 2015, 2017). Papagiannaki et al. (2015), in particular, found that impacts of floods increase significantly when 24 h accumulated rainfall exceeds 60 mm.
In the current study, we focus on two drainage areas of the flood-prone Attica region. The first one is the Sarantapotamos basin (Fig. 1a and c) that drains an area of 310 km2 and is responsible for flooding events in the urbanized broader area of Thriassion plain, located in west Attica, Greece. Among the most important natural flood causes in the area are the geomorphological characteristics of the drainage network, the intense rainfall, and the increasing urbanization, which is deprived of integrated flood defense measures. In particular when heavy rainfall occurs, the relatively mild slopes result in a decrease in the surface runoff velocity, accumulating a large volume of water in short times (Zigoura et al., 2014).
The second study area is the Rafina basin, in eastern Attica (Fig. 1a and d). It drains an area of almost 120 km2 (Karympalis et al., 2005) bounded to the north and northeast by Penteliko Mountain and to the west and southwest by Ymittos Mountain. The area of Rafina was characterized by a rapid residential development over the last decades. In addition, the recent fires, which have burned a significant part of the catchment area, combined with the deflection of Halandri's stream (during the construction of the “Attiki Odos” highway), have intensified and increased the frequency of floods in the region (Papathanasiou et al., 2015). It is important to note that both the studied basins are medium-size catchments (<310 km2), which makes the hydrological simulation challenging.
The data for stage and discharge for Sarantapotamos basin were provided at 15 min intervals from the hydrometric stations of the Deucalion project (Fig. 1a; http://deucalionproject.itia.ntua.gr, last access: 28 December 2019), while the data for Rafina basin were derived from the Hydrological Observatory of Athens of the National Technical University of Athens. For the meteorological evaluation of the conducted simulations, 10 min precipitation measurements were obtained from the network of surface meteorological stations operated by the National Observatory of Athens (NOA; Lagouvardos et al., 2017). The nearest meteorological stations to the hydrometric stations used are located in Vilia and N. Makri in Sarantapotamos and Rafina (Fig. 1a).
Table 1Simulation periods of each event and hydrometeorological characteristics.
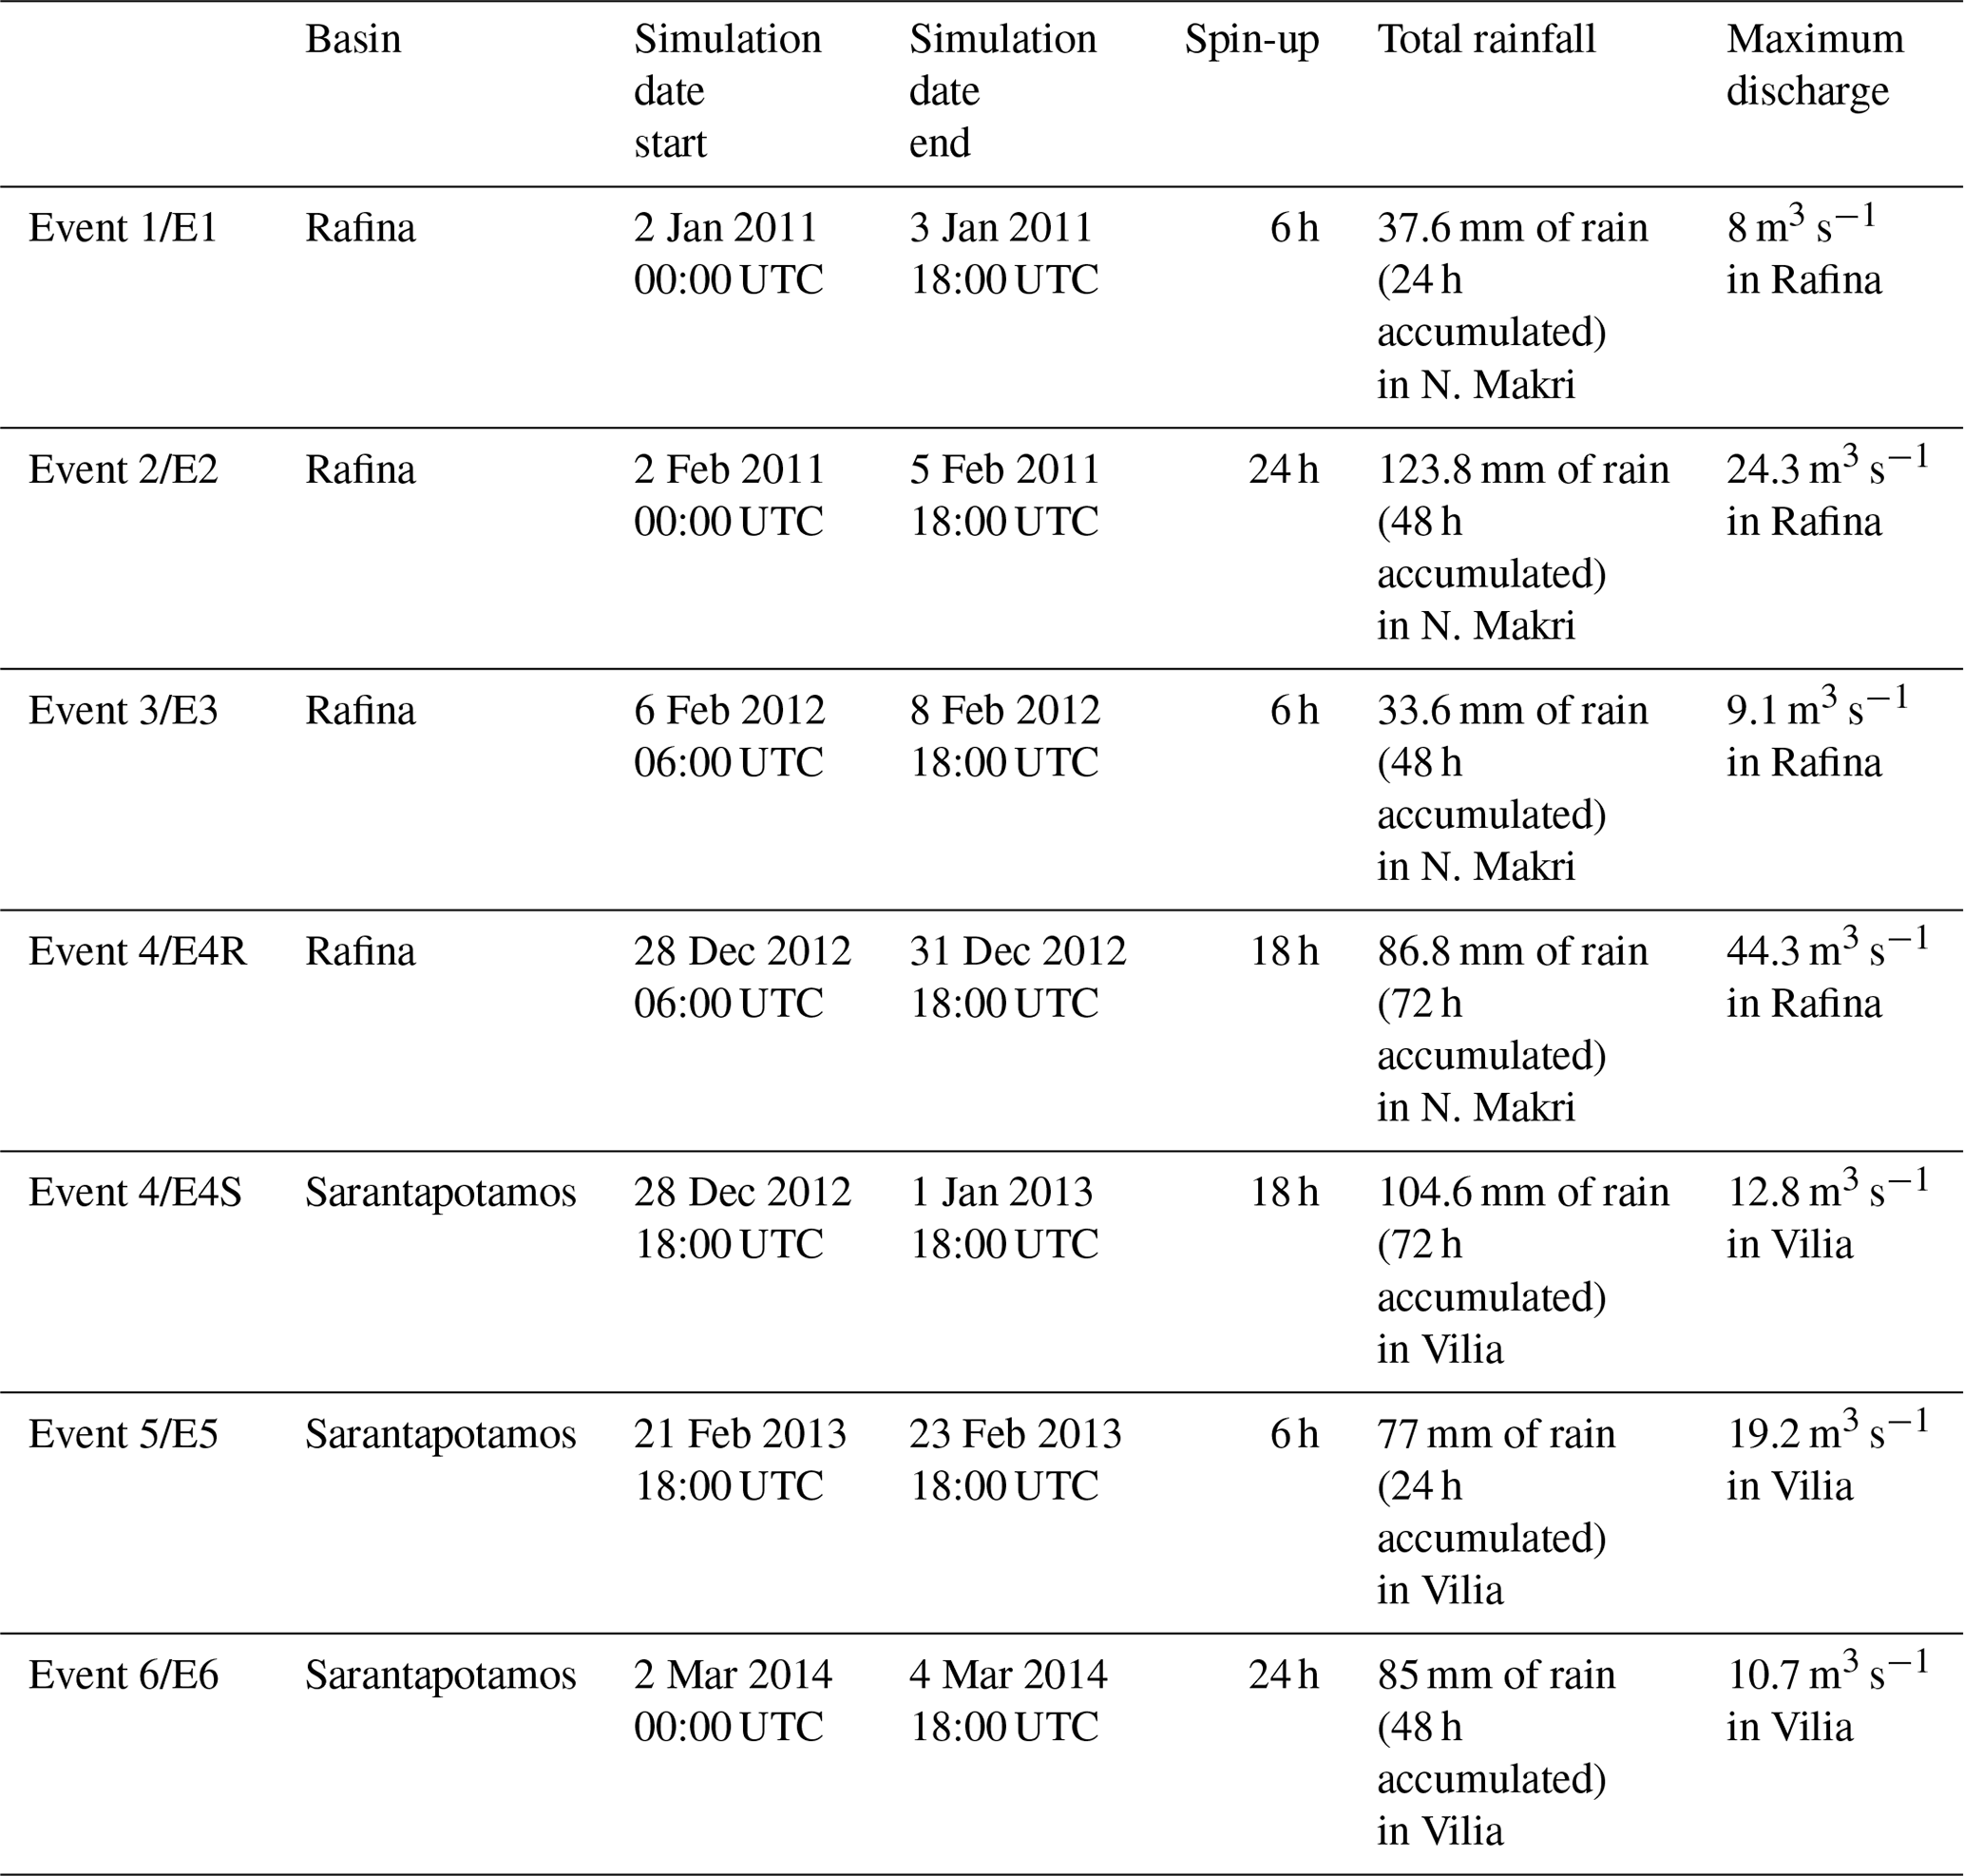
Six flood events have been considered for the analysis. Table 1 includes the simulation periods of each event, which were selected after spin-up sensitivity experiments (Sect. 2.2.1), and their observed total rainfall and maximum discharge as they have been recorded at the meteorological and hydrometric stations. All examined episodes were associated with synoptic atmospheric circulation, driven by low-pressure systems, which, in most cases, were combined with 500 hPa troughs and cut-off lows. In particular, surface low-pressure systems, found west of Greece, affected the country in combination with upper-level cut-off lows on 6 February 2012 (event 3) and 29 December 2012 (event 4). In the course of events 1 and 6, the atmospheric circulation was characterized by troughs in the middle troposphere over Greece, associated with surface cyclones located west of north Italy (event 6) and in the Ionian Sea (event 1). The systems induced considerable precipitation in Greece during the above episodes, resulting in noticeable impacts over the examined basins (Giannaros et al., 2020). The higher impacts in the Sarantapotamos catchment were reported in Vilia in the night between 21 and 22 February 2013 (event 5), when 24 h precipitation and maximum discharge reached up to 77 mm and 19.2 m3 s−1, respectively. During this episode, a very deep surface low crossed the Mediterranean Sea towards Greece. The system was associated with an upper-level trough having a negatively tilted axis (Giannaros et al., 2020). Between 2 and 5 February 2011 (event 2), exceptional atmospheric conditions affected Greece (Giannaros et al., 2020). Significant impacts were evident in the Rafina catchment, where the total 48 h rainfall surpassed 123 mm in N. Makri, and the maximum discharge exceeded 24 m3 s−1 in Rafina. As highlighted above, events 2 and 5 affected the examined areas more severely and were the most devastating for the whole area of Attica, where floods, deaths, destruction, and great economic losses were induced. More details on the hydrometeorological and socio-economic characteristics of events 2 and 5 can be found in Giannaros et al. (2020).
2.2 The fully coupled modeling system
2.2.1 Advanced research WRF
The Advanced Research Weather Research and Forecasting model version 3.9.1.1 was used in this study (Skamarock et al., 2008) for the land–atmosphere simulations which were carried out using four two-way nested grids (Fig. 1b): d01, d02, d03, and d04 with 18 km (325×285 grid points), 6 km (685×337 grid points), 2 km (538×499 grid points), and 667 m (208×184 grid points) grid increments, respectively. The coarse domain (d01) encompasses the area of Europe. The higher-resolution domains cover the area of the Mediterranean (d02) and Greece (d03), while the finest-resolution grid covers the area of Attica. Each domain has 40 unevenly spaced full sigma layers in the vertical direction, and the model top was set at 50 hPa. For domains 1–3, the 30 arcsec spatial resolution United States Geological Survey (USGS) GTOPO30 terrestrial data and the 30 arcsec spatial resolution Moderate Resolution Imaging Spectroradiometer – International Geosphere-Biosphere Project (MODIS-IGBP) global land cover data have been used. Despite the high spatial resolution of the MODIS-IGBP dataset, it only includes one category for the urban areas. The latter datasets are considered to be inadequate for ultrahigh-resolution (<1 km) modeling (Giannaros et al., 2018; Nunalee et al., 2015), which is necessary for hydrometeorological forecasting (e.g., Verri et al., 2017). Thus, the high-resolution Shuttle Radar Topography Mission (SRTM) 90 m × 90 m topography data and the 3 arcsec resolution Corine Land Cover (CLC) dataset were used for a better land use and topography representation in the innermost d04 domain.
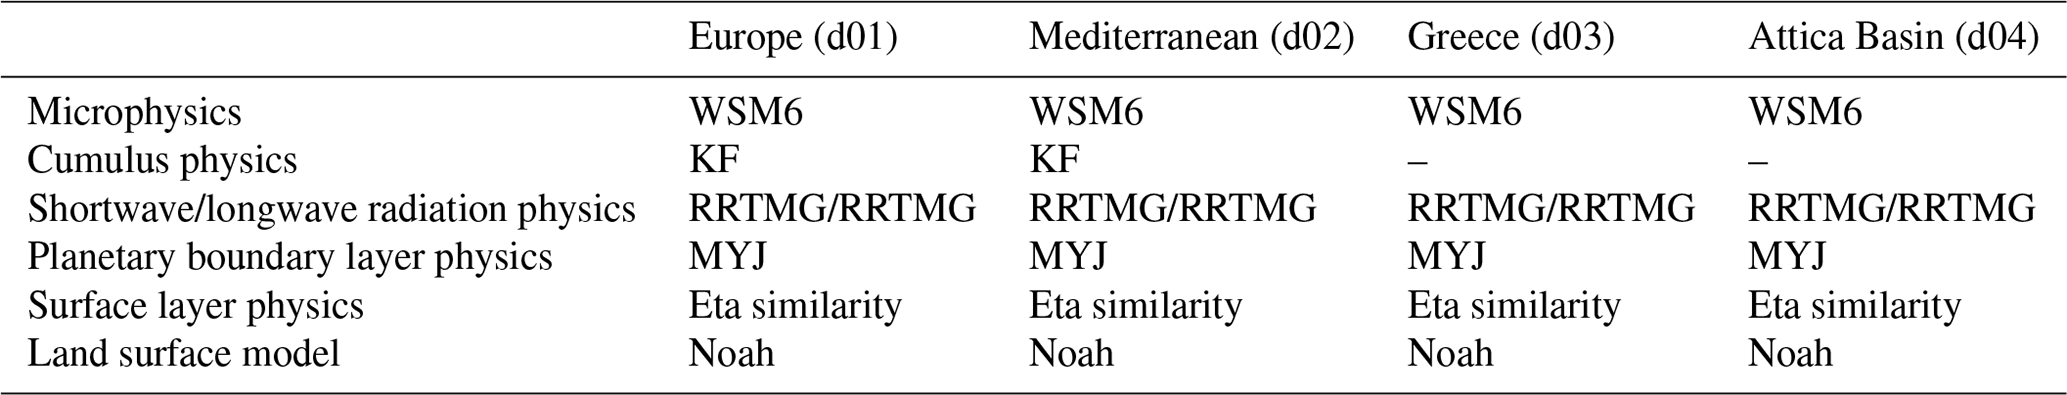
The WRF parametrization schemes used for the simulations are given in Table 2. The selection of the physics schemes was based on sensitivity tests conducted for the exploration of the best-performing schemes in terms of precipitation forecasting in the framework of setting up the model for operational forecasting in Greece. For the cloud microphysics processes, the WRF Single-Moment 6-Class Microphysics scheme (WSM6; Hong and Lim, 2006) was used, which has also been implemented in other studies over Greece (e.g., Emmanouil et al., 2020; Politi et al., 2018; Giannaros et al., 2016; Pytharoulis et al., 2016). The shortwave and longwave radiation fluxes were parameterized with the Dudhia (1989) and the Rapid Radiative Transfer Model (RRTM; Mlawer et al., 1997) schemes. For the surface layer parameterization the Eta geophysical fluid dynamics laboratory (GFDL) scheme (Schwarzkopf and Fels, 1991) was adopted. The Noah land surface model scheme (Chen and Dudhia, 2001) and Mellor–Yamada–Janjić (MYJ) parameterization (Janjic, 2002) were chosen as land surface and planetary boundary layer schemes, respectively. Noah-MP introduces multiple options and tunable parameters to simulate the land surface processes. However, the default values of these options and parameters are not suitable for every study area (e.g., Giannaros et al., 2019). In contrast, the Noah Land Surface Model (LSM) has been tested and applied successfully in several studies focusing on Greece (e.g., Varlas et al., 2019; Papaioannou et al., 2019; Giannaros et al., 2020). In addition, the MYJ parameterization scheme has been successfully implemented in other studies over Greece (e.g., Emmanouil et al., 2020; Politi et al., 2018). Cumulus parameterization, namely the Kain–Fritsch scheme (Kain and Fritsch, 1992), was activated only for d01 and d02.
The simulations were initialized and forced at its lateral boundaries by meteorological data derived from ERA5 reanalysis data (Hersbach and Dee, 2016) provided by the European Center for Medium-Range Weather Forecasts (ECMWF). The reanalysis data have a spatial resolution of , having 37 pressure levels in the vertical direction, and are provided at 6 h intervals. It should be noted that the use of ERA5 reanalysis data was preferred instead of the operational Global Forecast System (GFS) data, as the on-line availability of the GFS forecasts is limited for historical periods. GFS initialization data could be ordered for the investigated events but at a high spatial resolution of , which was not considered adequate for forcing the WRF simulations having a coarse domain (do1) resolution of 18 km. Furthermore, the ERA5 reanalysis dataset has been proven reliable for hydrological modeling applications (Alves et al., 2020; Crossett et al., 2020; Martens et al., 2020; Tarek et al., 2020).
Using the aforementioned setup, a series of sensitivity tests were performed in order to explore the best spin-up time for each event. More precisely, four numerical simulations were conducted for each event, starting at 24, 18, 12, and 6 h before the initiation of the rainfall. The choice of the best spin-up time for each simulation was made by comparing the temporal evolution of precipitation produced by the WRF model with the observed precipitation at the rain gauge station at Vilia for the basin of Sarantapotamos and at the rain gauge station at N. Makri for the Rafina basin. An example of the temporal evolution of the rainfall in Vilia for event 5 is given in Fig. 2.
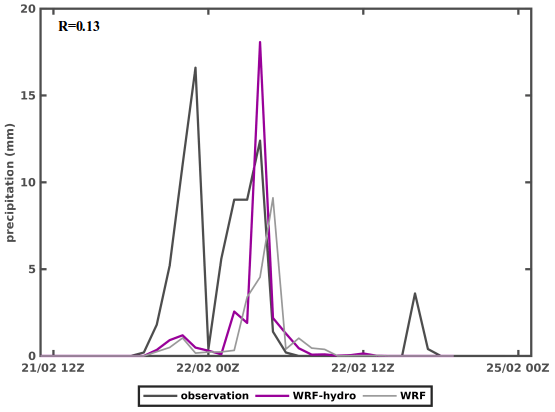
Figure 2The temporal evolution of the precipitation at the rain gauge station at Vilia for event 5.
2.2.2 WRF-Hydro
The WRF-Hydro modeling system, version 3.0, was used for this study under a fully coupled mode. WRF-Hydro is a distributed hydrometeorological modeling system which is two-way coupled with WRF, providing multiple physics options for surface overland flow, saturated subsurface flow, channel routing, and base-flow processes (Gochis et al., 2015). The main advantage of WRF-Hydro is the ability to simulate the specialized components of water cycle such as soil moisture and groundwater, considering the routing processes of the infiltration capacity excess and the saturated subsurface water.
In the present study, WRF-Hydro was configured for the d04 domain, in a coupled manner with physics options of surface flow, sub-surface flow, and channel routing activated. The catchments' routing grids were computed based on SRTM 90 m topography data using the WRF-Hydro GIS pre-processing toolkit. In order to exploit this high-resolution input dataset, avoiding interpolation to a coarser grid (Verri et al., 2017; Gochis and Chen, 2003), a ∼95 m spatial resolution WRF-Hydro domain was configured over the WRF innermost domain. Thus, the ratio between the high-resolution terrain routing grid and the WRF land surface model (aggregation factor; AGGFACTRT) was set to 7. The soil water infiltration and redistribution was computed in four layers (0–10, 10–40, 40–100, and 100–200 cm) in the fine-resolution grid and then was aggregated in the coarser grid of d04.
Subsurface lateral flow of soil was calculated by applying the methodology proposed by Wigmosta et al. (1994) and Wigmosta and Lettenmaier (1999) prior to the routing of overland flow, allowing the exfiltration from fully saturated grid cells to be added to the surface flow of the coarser grid. The effects of topography and the saturation depth of soil were included in the calculation of subsurface flow. Thus, when the depth of ponded water on a grid cell exceeded a threshold, the overland flow was solved with a diffusive wave formulation adapted from Julien et al. (1995) and Ogden (1997).
2.3 Calibration method
The aim of the WRF-Hydro calibration is to improve the spatial resolution of parameters that control the total water volume and the shape of the predicted hydrograph. Generally, the calibration processes for WRF-Hydro can be divided into three categories: the manual step-wise process (e.g., Li et al., 2017), the automated calibration process, and mixed calibration approaches combining manual and automated calibration (e.g., Verri et al., 2017). The step-wise approach of calibration is widely applied in order to minimize the high number of model runs that are required for the automated calibration approach.
WRF-Hydro has numerous tabulated parameters that influence the simulated hydrological processes and the output discharge. Yucel et al. (2015) showed that four parameters are the most critical for the simulated hydrograph. Thus, in this study, calibration procedure was based on the stepwise method suggested by Yucel et al. (2015) and also implemented by other authors (e.g., Wang et al., 2020). The stepwise calibration was performed in two basic steps: firstly, we defined the parameters that influence the total water volume, and then we calibrated the parameters controlling the shape of the hydrograph. The parameters that control the total water volume are the runoff infiltration factor (REFKDT) and the surface retention depth (RETDEPRTFAC). The REFKDT parameter controls the amount of water that flows into the channel network, while the RETDEPRTFAC influences the surface slope and thus the accumulation of the water.
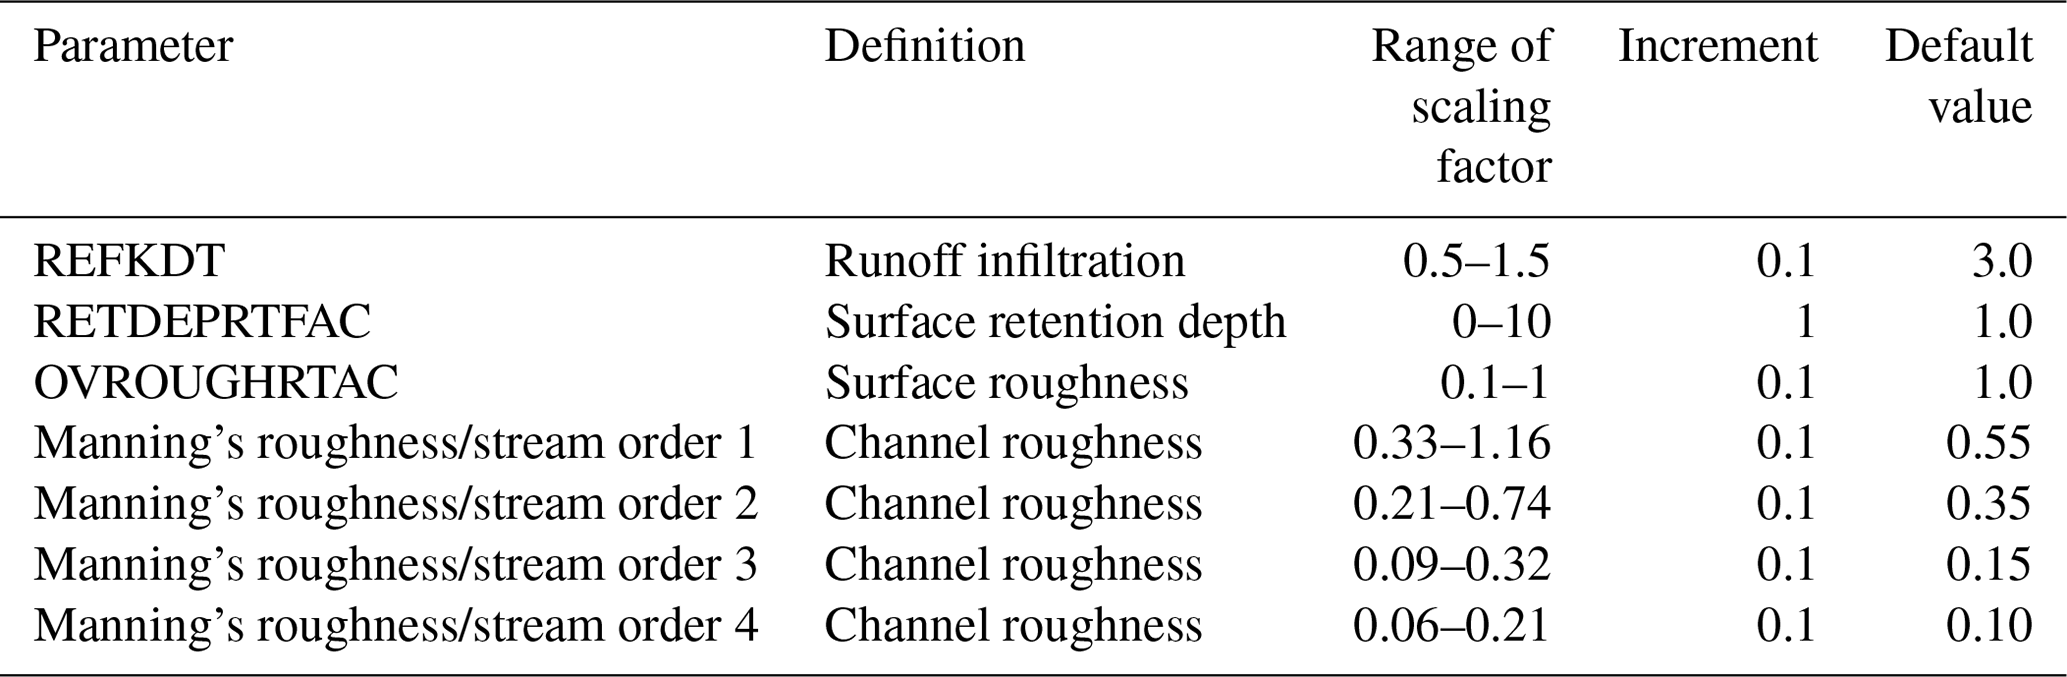
The parameters that control the shape of the hydrograph are related to the surface (OVROUGHRT) and channel roughness (Manning's roughness, MannN). Thus, the parameters were calibrated in the following order: REFKDT, RETDEPRTFAC, OVROUGHRTAC, and MannN. The parameters are abbreviated following the nomenclature of the WRF-Hydro name list. The calibrated values for each parameter are shown in Table 3, along with the default values. The MannN parameter is defined for each stream order in the drainage area. The ArcGIS pre-processing tool, used for the reproduction of the hydrological features of the studied catchments, resulted in four Strahler stream orders (Strahler, 1957) in both Sarantapotamos and Rafina. Thus, MannN values in Table 3 are shown for the first four stream orders. In the stepwise calibration method, sensitivity tests were performed for each parameter, and when a parameter was calibrated its optimum value was kept constant when the sensitivity tests for the next parameter were performed. Further details on the calibration of the aforementioned parameters for each basin (Sarantapotamos & Rafina) are given in the following section. The calibration of the WRF-Hydro model was performed using the WRF atmospheric forcing, including the precipitation fields, following the same approach of forcing the model with WRF data from previous studies (e.g., Li et al., 2017, 2020; Liu et al., 2021).
3.1 Sarantapotamos basin
3.1.1 Calibration of Sarantapotamos basin
Due to limited availability of streamflow data, the calibration process was performed only for event 5 at the basin of Sarantapotamos, while the rest of the events were used to evaluate the performance of the calibration process. Figure 3 shows the evolution of the discharge (observed and simulated) for each calibrated parameter. The choice of the optimum value for each parameter was based on the selected objective criteria, namely the Nash–Sutcliffe efficiency and the correlation coefficient (R), between simulated and observed discharges.
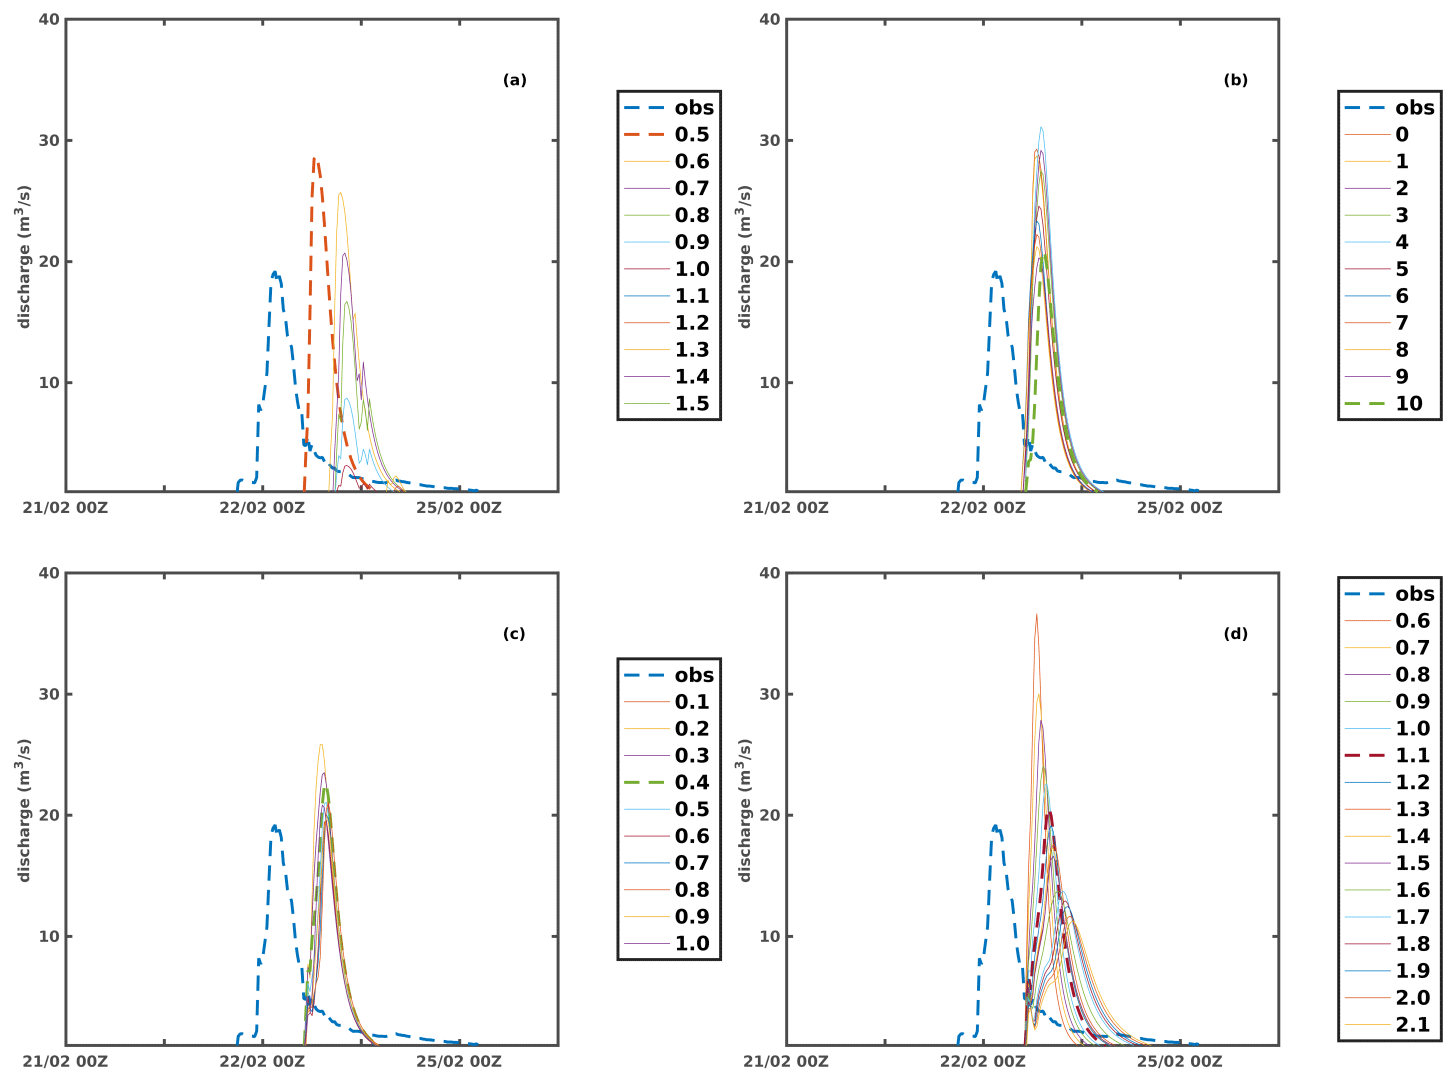
Figure 3The evolution of the discharge (observed and simulated) for event 5 for (a) REFKDT, (b) RETDEPRTFAC, (c) OVROUGHRTAC, and (d) MannN parameter.
Figure 3a shows the results for the first parameter of the step-wise calibration method (REFKDT). As possible values for the REFKDT parameter range from 0.5 to 5, we firstly performed several simulations for possible REFKDT's values of 1, 2, 3, 4, and 5 (not shown) in order to find the appropriate range of the scaling factor. Thus, the appropriate range of REFKDT was found to be from 0.5 to 1.5, and then additional simulations were performed within this range with increments of 0.1. Figure 3a shows that the discharge decreases as the REFKDT's values increase. For the selection of the optimum value of each parameter, we implemented two basic steps. Firstly, a visual comparison of the simulated and observed discharge was performed. Secondly, we applied statistical analysis tests. More precisely, the statistical analysis included the computation of correlation coefficient and the Nash–Sutcliffe coefficient between the observed and simulated discharge calculated per 15 min for each possible value of REFKDT (Fig. 4). Thus, the value which has the best correlation for the Nash–Sutcliffe coefficient was chosen as the optimum value, after the visual comparison of the simulated and observed discharge. Namely, the value of 0.5 for REFKDT parameter was selected. Table 4 shows the correlation and the Nash–Sutcliffe coefficient for the optimum value for each parameter.
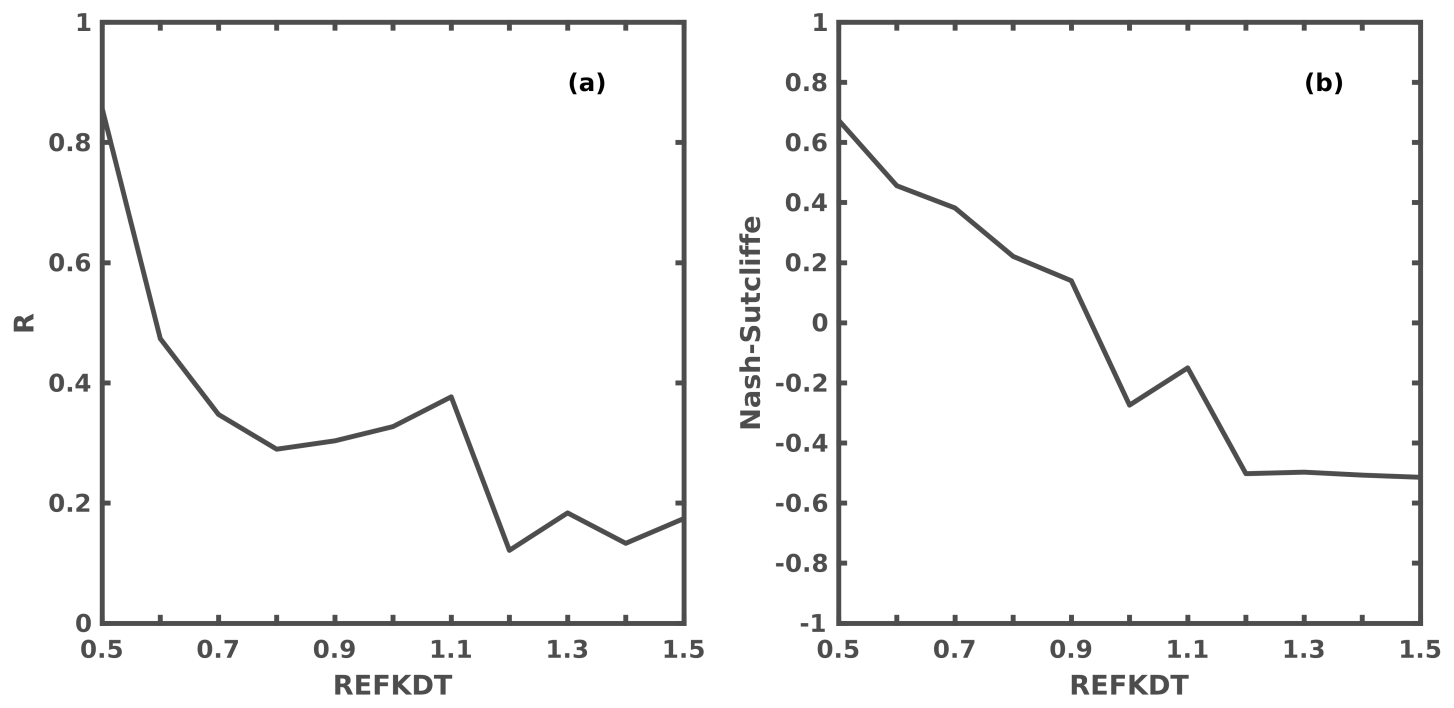
Figure 4(a) The correlation and (b) the Nash–Sutcliffe coefficient between the observed and simulated discharge for each possible value of REFKDT for Sarantapotamos basin, after the 5 h displacement of the temporal evolution of the simulated discharge.
Table 4The correlation coefficient and the Nash–Sutcliffe test between the observed hydrograph and the simulations for the optimum values of each parameter for Sarantapotamos basin, after the 5 h displacement of the temporal evolution of the simulated discharge.

It is noted that there is a lag at the time of maximum discharge between the observations and the model results. This discrepancy is attributed to the time lag between the simulated and observed temporal evolution of precipitation at Vilia station (Fig. 2). After the implementation of cross correlation analysis, it was found that the maximum correlation between the simulated and the observed temporal evolution of precipitation is achieved with a delay of 5 h. It must be noted that the results of the statistical analysis presented in Table 4 are computed after the displacement of the temporal evolution of the simulated discharge. This displacement of 5 h was necessary in order to derive the optimum value of each parameter. For instance, if we do not take into account the 5 h gap, the correlation and the Nash–Sutcliffe coefficients are not in the acceptable limits; thus the choice of the optimum value for each parameter cannot be determined.
Figure 3b shows the temporal evolution of discharge for the possible RETDEPRTFAC values. The possible values of RETDEPRTFAC range from 0 to 10, while an increment of 1 was used for the simulations. The RETDEPRTFAC is related to the retention depth of water from the surface. Thus, if the RETDEPRTFAC value is 0, there is no accumulation of water in the area. Figure 3b shows that the simulated discharge decreases with increasing values of RETDEPRTFAC. The value of 10 for the RETDEPRTFAC parameter was selected based on visual comparison of the model and observed discharge and on the statistical analysis, following the aforementioned procedure for the selection of REFKDT (not shown). It should be noted that the optimal parameters for REFKDT and RETDEPRTFAC hit the lower and calibration limits, respectively. Relaxing their constraints may result in better calibration results.
Figure 3c and d show the temporal evolution of discharge for the parameters which control the hydrograph shape (OVROUGHRTAC and Manning's roughness). The OVROUGHRTAC parameter is related to the surface roughness of the channel and was calibrated for values between 0.1 and 1.0 with 0.1 increments (Fig. 3c). Finally, a scaling factor value of 0.4 for the OVROUGHRTAC parameter was selected.
As Manning coefficient values are based on textbook values for each stream order, Yucel et al. (2015) suggested multiplying the default MannN coefficient parameter with a scaling factor. Figure 3d shows the temporal evolution of discharge for the possible values of MannN scaling factors ranging from 0.6 to 2.1 with increments of 0.1. Finally, the value of 1.1 was selected as optimum for the MannN parameter.
3.1.2 Validation of the calibration of Sarantapotamos basin
After the calibration of WRF-Hydro over Sarantapotamos basin based on event 5, the four parameters defined above were validated for events 4 and 6 of Sarantapotamos basin. Figure 5b and d show the comparison of the temporal distribution of the observed and simulated discharges for events 4 and 6, respectively. For event 4, the simulated temporal distribution of the discharge shows similarity to the observed one (Fig. 5b), as the time that the maximum discharge occurred almost coincides while the two temporal distributions do not show similar maximum values of discharge (the observed discharge is 12.8 m3 s−1 and the simulated is 5.7 m3 s−1).
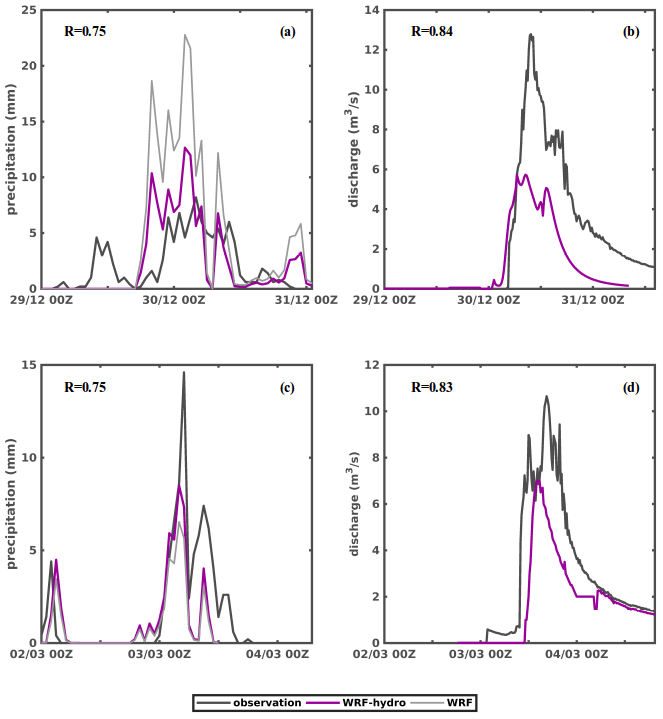
Figure 5The temporal distribution of the observed and simulated (a) precipitation and (b) discharge for event 4S and the same variables (c, d) for event 6.
The correlation coefficient of the two temporal distributions is 0.83. For event 6, the simulated and observed temporal distributions of the discharges show similarity in the occurrence time of the maximum discharge values, but the simulated discharge underestimates the observed one throughout the duration of the event (Fig. 5d), as the maximum value of the simulated discharge is 10.6 m3 s−1 while the observed one is 7 m3 s−1. This is due to the underestimation of the simulated rainfall at the station of Vilia compared to the observed one (Fig. 5c). The correlation coefficient between the simulated and observed discharges is 0.84.
3.2 Rafina basin
3.2.1 Calibration of Rafina basin
The stepwise calibration method suggested above was implemented for the calibration of Rafina basin using event 2. Figure 6 shows the temporal distribution of the precipitation as observed at the station of N. Makri and simulated using WRF atmospheric-only simulations and WRF-Hydro coupled simulations, while Fig. 7 shows the temporal evolution of the observed and simulated discharges for the possible values of each calibrated parameter. The observed and simulated precipitation values (provided by WRF-Hydro) are highly correlated (correlation coefficient: 0.83) while quantitatively they also compare very well (Fig. 6). The choice of the optimum values for each parameter was based on the visual comparison of the simulated and observed discharge (Fig. 7) and statistical analysis (Table 5), as was explained for Sarantapotamos basin.
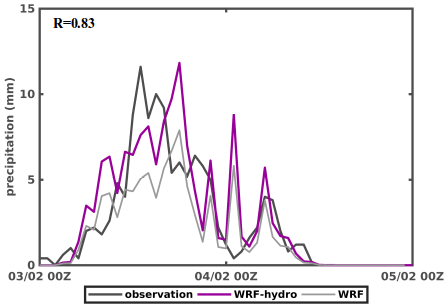
Figure 6The temporal evolution of the precipitation at the rain gauge station at N. Makri for event 2.
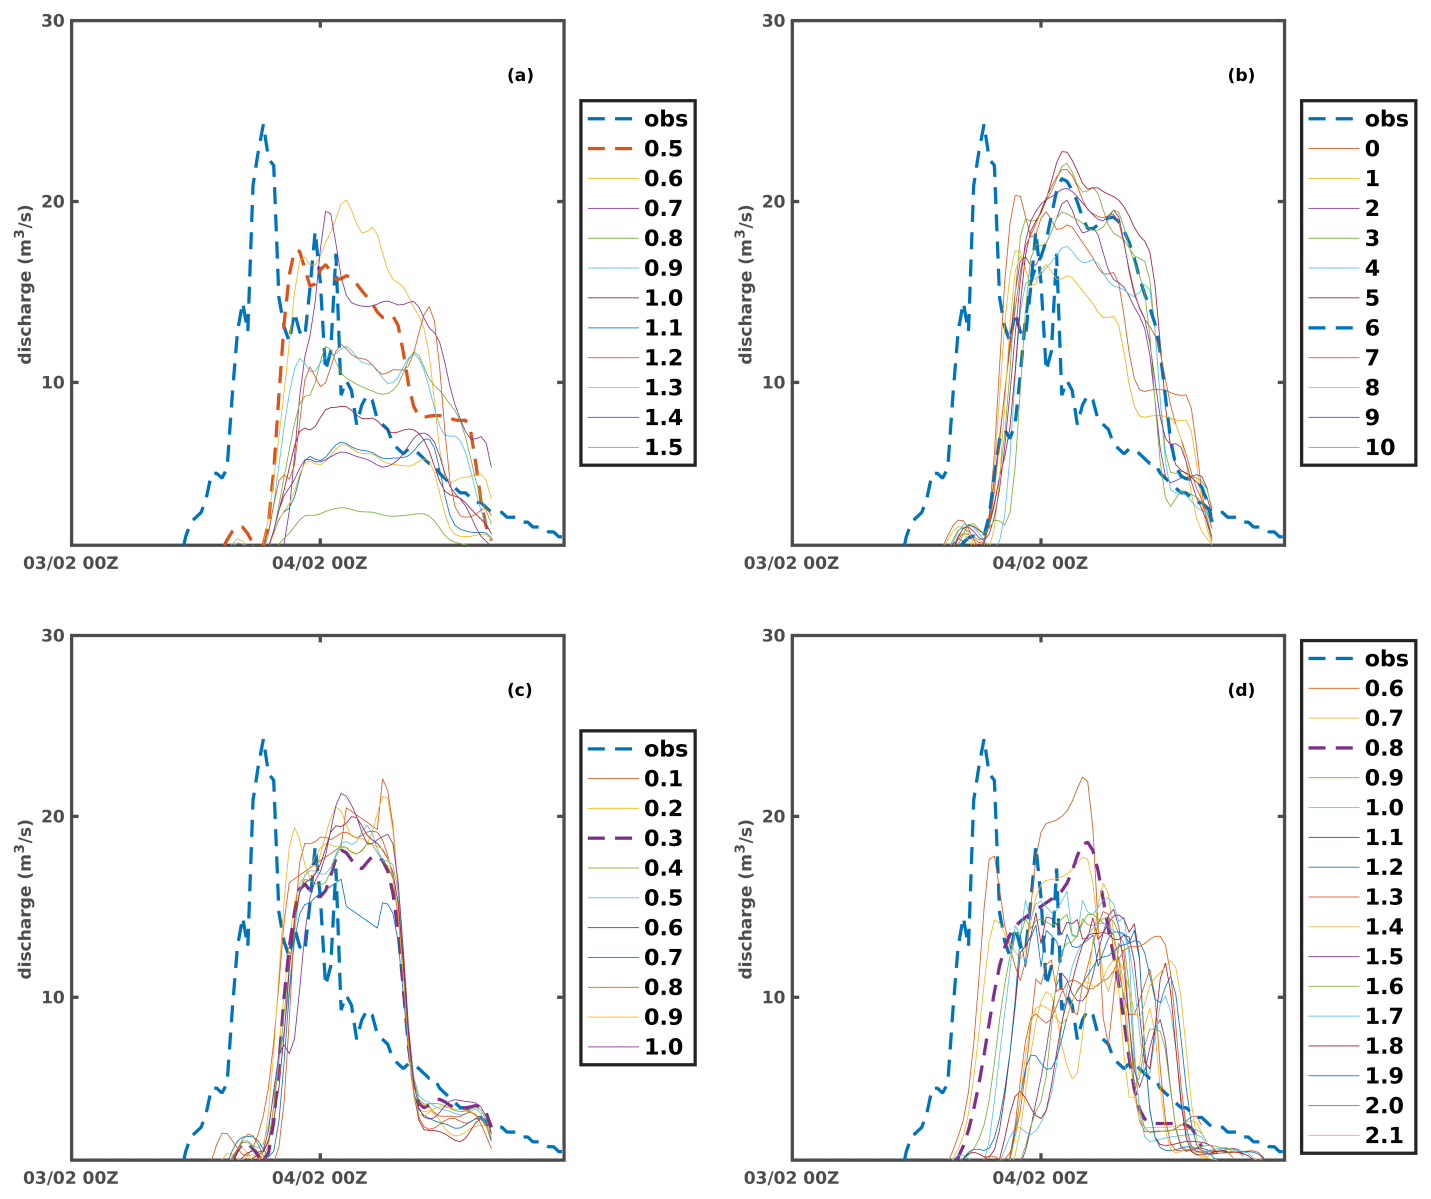
Figure 7The evolution of the discharge (observed and simulated) for event 2 for the (a) REFKDT, (b) RETDEPRTFAC, (c) OVROUGHRTAC, and (d) MannN parameters.
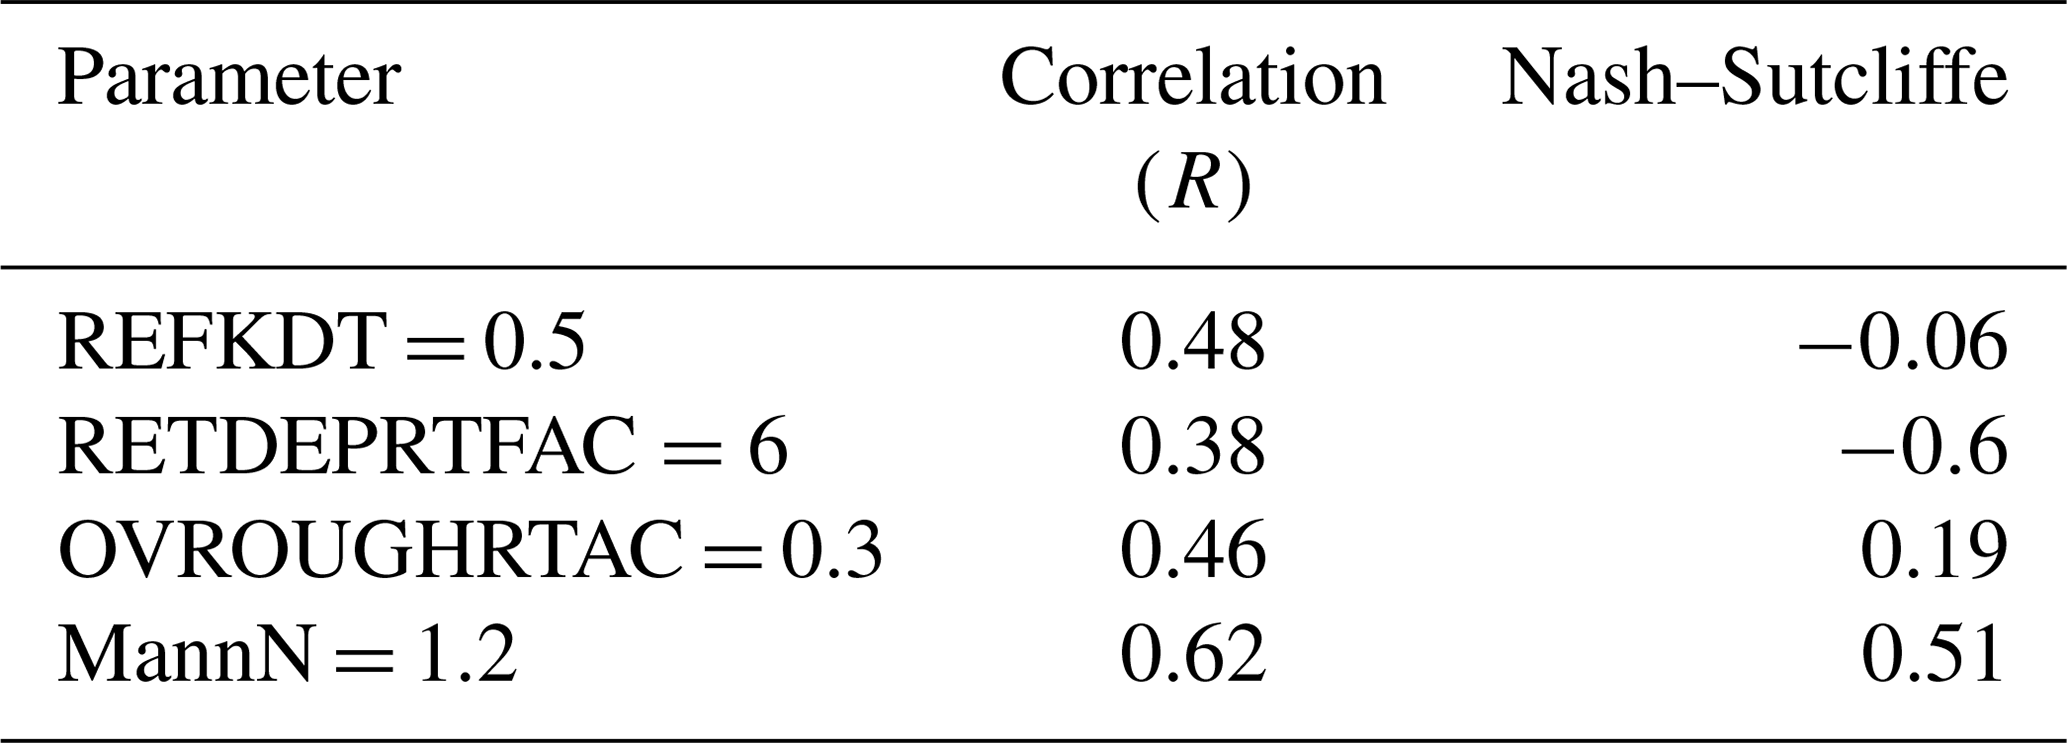
Table 5The correlation coefficient and the Nash–Sutcliffe test between the observed hydrograph and the simulations for the optimum values of each parameter for Rafina basin.
In consistency to the calibration of Sarantapotamos, we firstly performed several simulations for possible REFKDT values between 1 and 5, and we also found that the appropriate range of the scaling factor is from 0.5 to 1.5. Thus, the additional simulations were performed within this range with increments of 0.1, and the value of 0.5 was selected as the optimum value for the REFKDT parameter. As in the case of Sarantapotamos, the optimum value for REFKDT reaches the lower calibration limit. For the needs of this study the range of 0.5 to 1.5 was used as this same range was proposed in the literature by previous studies (Kerandi et al., 2018; Naabil et al., 2017; Givati et al., 2016; Yucel et al., 2015). However lower values than the lower boundary of 0.5 might provide improved results, and this issue deserves further investigation in the future. The simulations for RETDEPRTFAC were performed within the range from 0 to 10, with increments of 1. As in the case of Sarantapotamos, the simulated discharge decreases with increasing values of RETDEPRTFAC (Fig. 7b). After the comparison of the aforementioned statistical criteria, the selected optimum value for the RETDEPRTFAC parameter was 6.
Regarding the parameters controlling the shape of the hydrograph, 10 (from 0.1 to 1.0 with increments of 0.1) and 1.6 (from 0.6 to 2.1 with increments of 0.1) simulations performed for the parameters related to the surface and channel roughness. After the computation of correlation coefficient and Nash–Sutcliffe parameter for each simulation, the optimum values of 0.3 and 1.2 for the OVROUGHRTAC and MannN parameters were selected. At the end of the calibration procedure, the two temporal distributions (observed and discharge) have a correlation coefficient of 0.62, while the Nash–Sutcliffe parameter is close to 0.5 (Table 5).
3.2.2 Validation of the calibration of Rafina basin
The validation of the calibration process of Rafina basin was held by comparing the temporal distributions of simulated and observed discharges of events 1, 3, and 4 (Fig. 8b, d and e), using the optimum values of the calibration's parameters. The correlation coefficients between the simulated and observed discharges are 0.77, 0.86, and 0.62, respectively. Therefore, it is obvious that WRF-Hydro is capable of forecasting the discharge after the calibration process. The simulated discharge is dependent on the simulated precipitation; thus a possible underestimation of the simulated discharge is influenced by a possible underestimation of the precipitation. For instance, at event 1, the maximum simulated discharge is 5.0 m3 s−1 while the observed one is 8.0 m3 s−1 (Fig. 8b). This is attributed to the underestimation of the total precipitation, as the total simulated precipitation is 27.6 mm while the observed is 37.0 mm. In addition, the lag between the observed and simulated discharges is attributed to the lag of the observed and simulated precipitation (Fig. 8a).
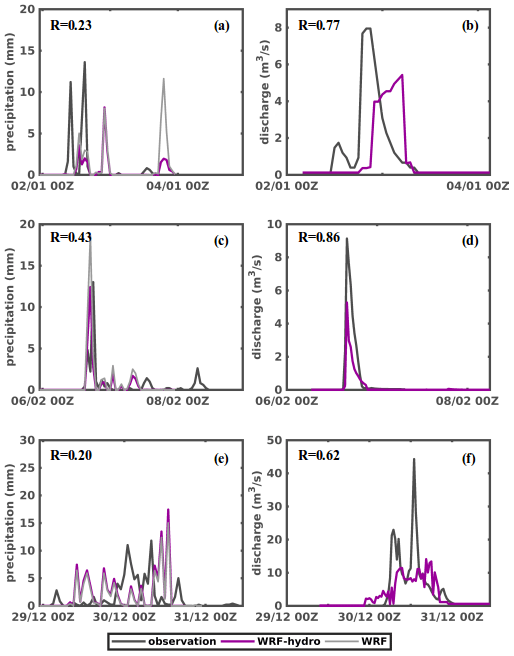
Figure 8The temporal distribution of the observed and simulated (a) precipitation and (b) discharge for event 1 and the same variables for event 3 (c, d) and event 4R (e, f).
3.3 Precipitation
In this section the influence of the use of the coupled model (WRF-Hydro) on the precipitation forecast skill compared to the atmosphere-only simulations performed with the WRF model will be investigated. Namely, WRF-Hydro contributes to a better simulation of the soil moisture content, due to the computation of the lateral redistribution and re-infiltration of the water (Gochis et al., 2013). The improved simulation of the soil moisture affects the computation of the sensible and latent heat fluxes, which influence humidity and temperature in the lower atmosphere and consequently precipitation (Seneviratne et al., 2010). Therefore, the physical process of the coupling of land–atmosphere is expected to improve the forecast skill of precipitation.
Figures 2; 5a, c; 6; 8a, c, and f show the temporal distribution of the precipitation observed and simulated by WRF only and WRF-Hydro for each studied event observed in Sarantapotamos and Rafina basins, for the gauge stations in Vilia and N. Makri, respectively. In all cases, the precipitation reproduced by WRF-Hydro has differences compared to WRF (atmospheric-only) simulations. The temporal distribution of WRF-Hydro and WRF follows the same pattern as is reflected in the same calculated correlation coefficients shown in Table 6. WRF-Hydro performs better than the WRF in terms of quantitative precipitation forecasting, and this is reflected to the lower calculated root-mean-square errors and the lower mean absolute error (MAE), which have been computed based on the hourly values of precipitation (Table 6). It must be noted that for events 1 and 4 despite the fact that the correlation coefficient is low, due to the lag between simulated and observed discharge (Fig. 8b and f), the values of total amount of the simulated and observed precipitation are similar. Also, the low correlation coefficient and the high MAE at event 5 are attributed to the time lag between the simulated and observed temporal evolution of precipitation (Fig. 2).
Table 6Comparison of total amount of observed precipitation to WRF-Hydro and WRF-only simulated precipitation for each event for the gauge stations in Vilia and N. Makri. RMSE, R, and MAE are calculated on hourly values of precipitation.

Figure 9 shows the difference between the total amount of precipitation observed and the total amount of precipitation simulated by (a) WRF-Hydro and (b) WRF-only for each event. Therefore, values close to zero mean that the total amount of precipitation simulated is close to the observed one. For each case, the difference between the total amount of observed and simulated precipitation by WRF-Hydro is smaller, pointing out that WRF-Hydro has the tendency to improve the total amount of precipitation, consistent with the results provided by Givati et al. (2016) and Wang et al. (2020).
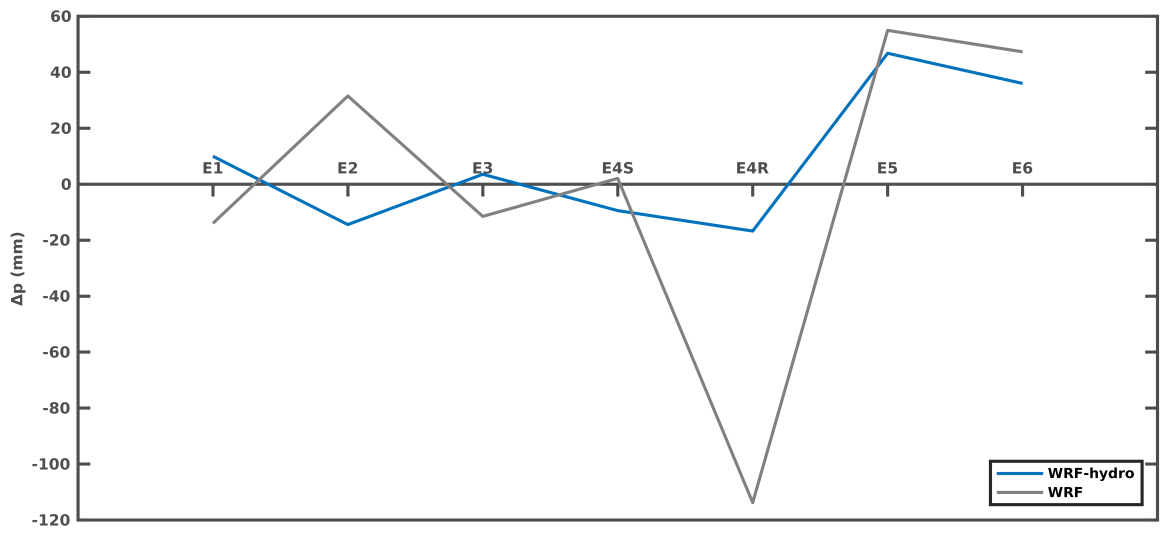
Figure 9The difference between observed and simulated (WRF-Hydro and WRF) total amount of precipitation per event for gauge stations of Vilia and N. Makri.
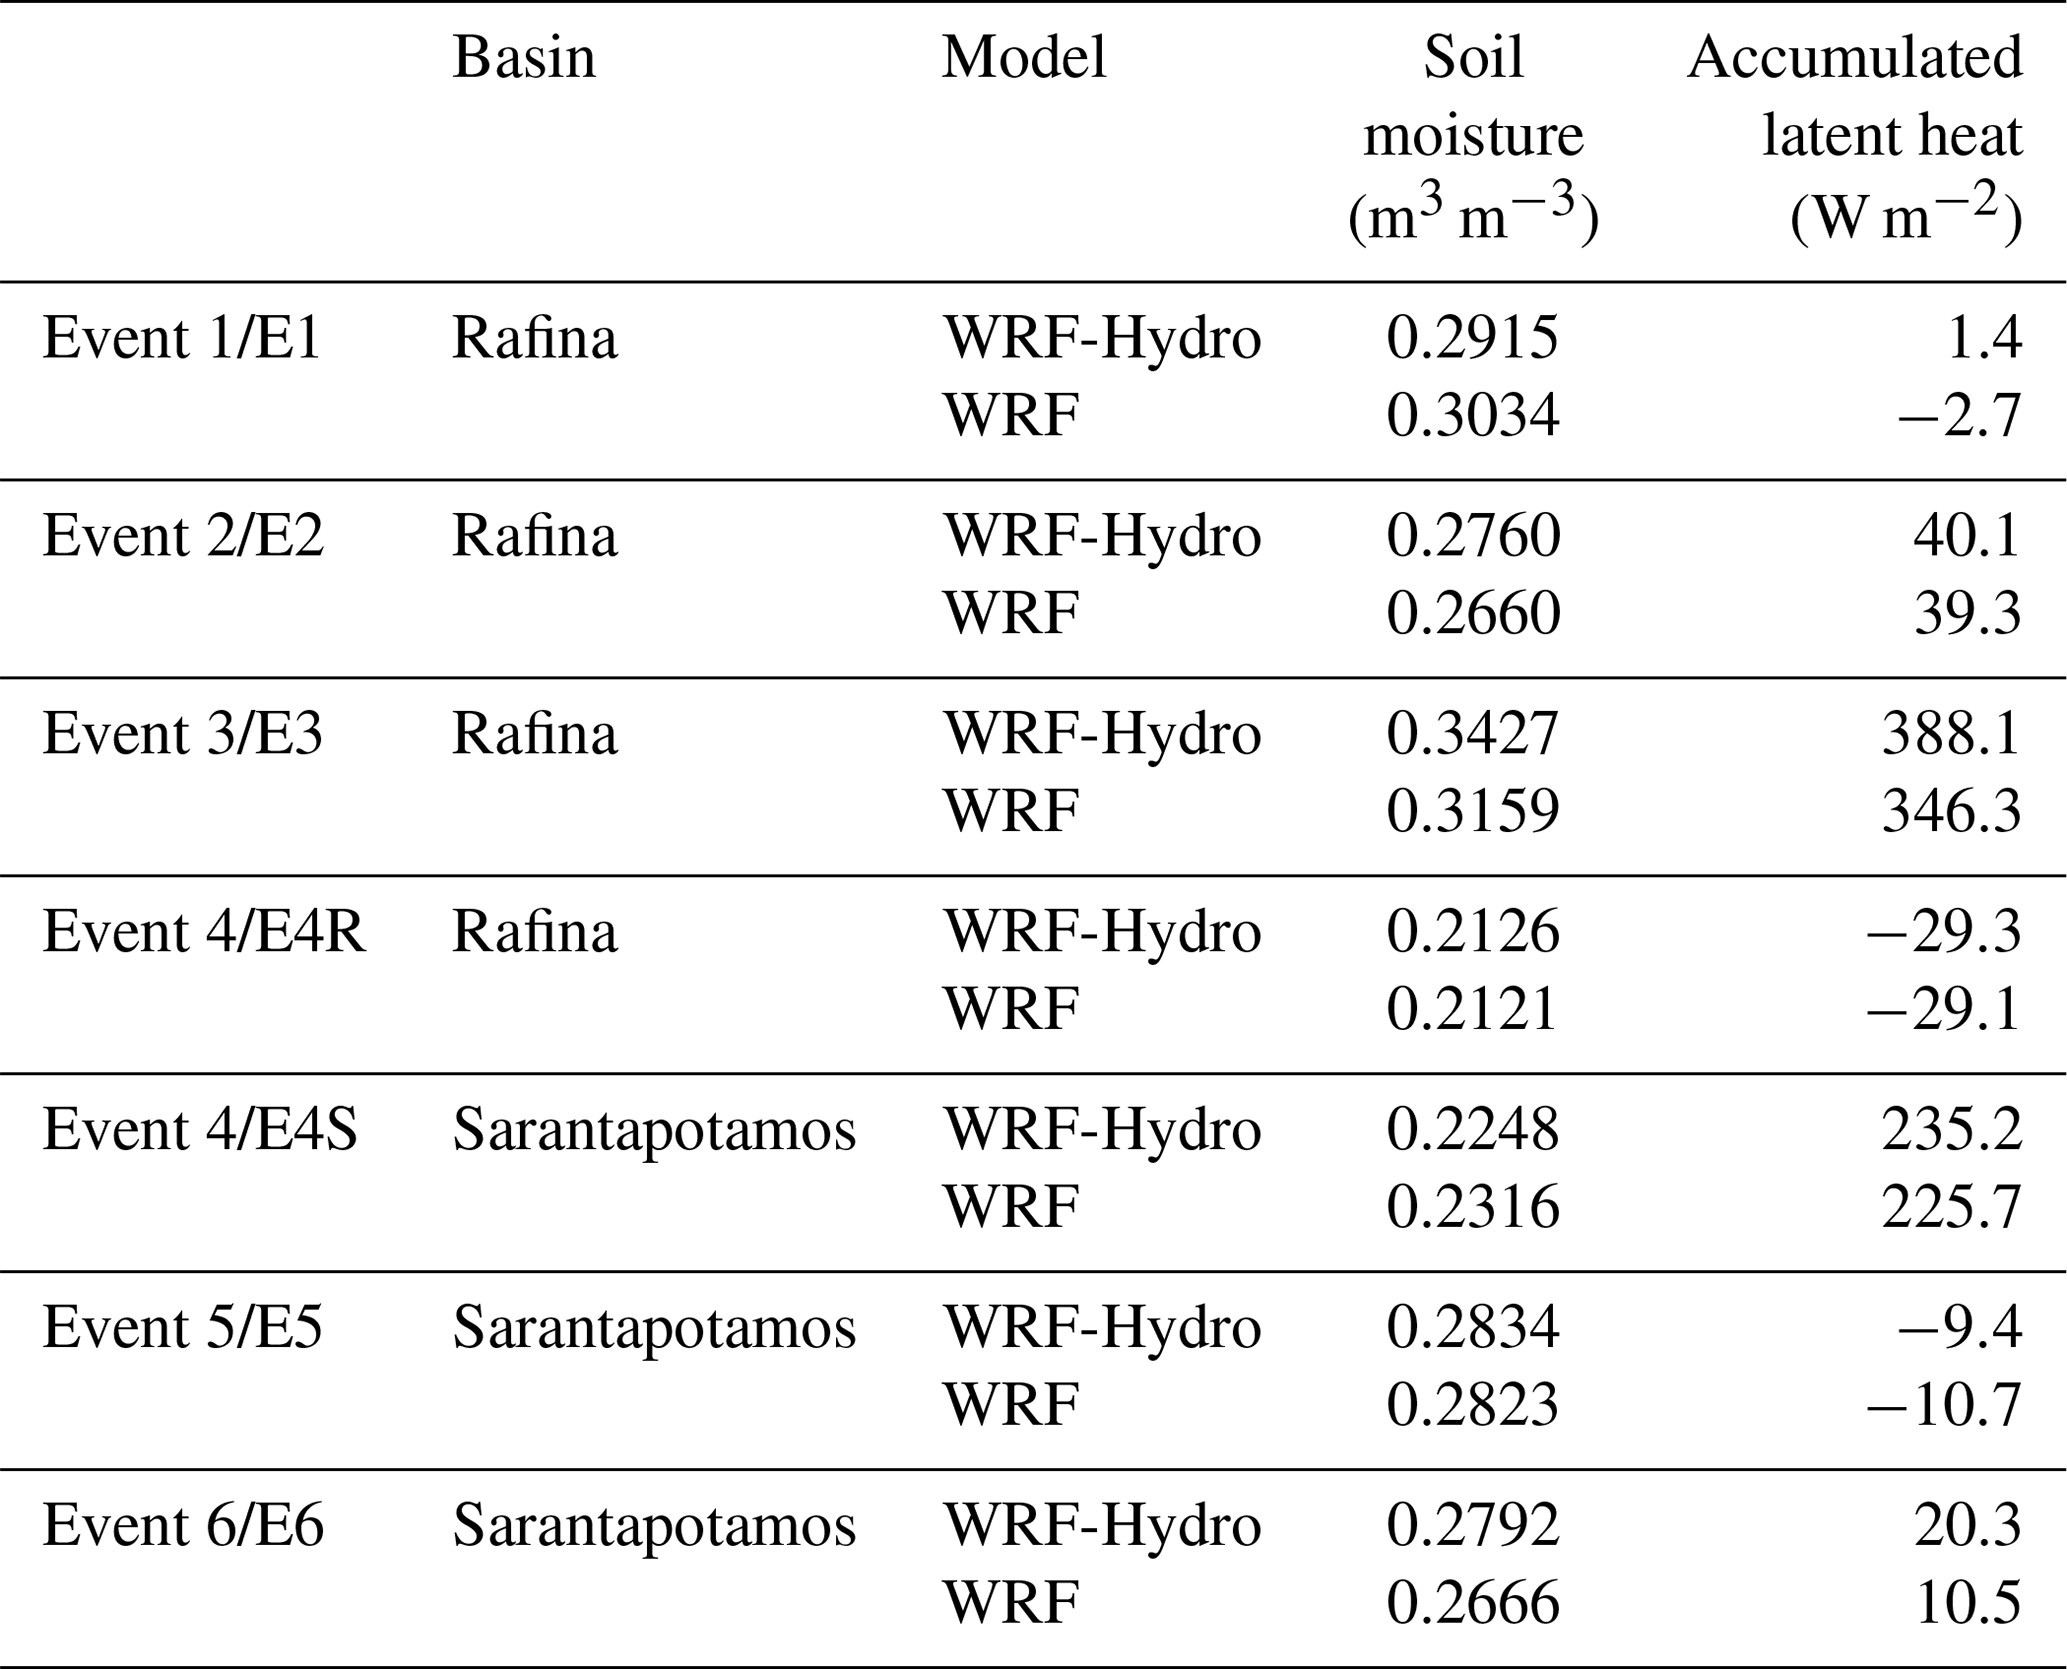
Table 7 shows the basin average soil moisture (at the first level) and 6 h accumulated latent heat flux simulated by the WRF-Hydro and WRF-only models, at the time before the beginning of the examined storm events. As can be seen the soil moisture differences between the models range from 0.005 to 0.027 m3 m−3, and accumulated latent heat flux differences span from 4.1 to 41.8 W m−2. These differences simulated by the two models provide an indication that the most accurate replication of the observed precipitation provided by the WRF-Hydro model compared to the WRF-only model is related to the physical process associated with the coupling of land–atmosphere and hydrological routing in the WRF-Hydro model. In particular, WRF-Hydro affects the soil moisture content, due to the computation of the lateral redistribution and reinfiltration of the water (Gochis et al., 2013), which in turn influences the computation of the sensible and latent heat fluxes. These fluxes are associated with humidity and temperature in the lower atmosphere and consequently precipitation (Seneviratne et al., 2010). However, it should be noted that the effects of soil moisture on precipitation fields are more evident and valid in long-term simulations when the land surface variables reach a steady state (Fersch et al., 2020; Senatore et al., 2015). Furthermore, the soil moisture is strongly dependent to the sea–atmosphere interactions (Avolio et al., 2019; Senatore et al., 2015) and the synoptic-scale circulation.
Table 7Comparison of the basin average soil moisture (at the first level) and 6 h accumulated latent heat flux simulated by the WRF-Hydro and WRF-only models, at the time before the beginning of the events.
Despite flash flooding being one of the most costly weather-related natural hazards in Greece (Papagiannaki et al., 2013), less effort has been made in the field of evaluating tools to predict floods. The current paper addresses this issue by presenting an integrated modeling approach for simulating flood episodes in Attica, Greece, in medium-catchment-size basins. The objective of this study was twofold: to investigate the ability of WRF-Hydro to simulate selected cases of flood occurrence in the area of Attica (Greece) and to study the influence of land–atmosphere interactions on the precipitation forecasting. For that purpose, we first calibrated and validated WRF-Hydro at two drainage basins (Sarantapotamos basin and Rafina basin) in the area of Attica. Then, we investigated the relation between WRF-Hydro and WRF-only precipitation forecast skill. For this reason, we used an enhanced version of WRF, the WRF-Hydro model (version 3.0), in a fully coupled mode, which is complemented with the land–atmosphere interaction schemes through the coupling of hydrological and atmospheric models. The configuration of WRF-Hydro was applied in a fine-resolution grid (666 m) where the surface and subsurface flow were computed at a grid interval of 95 m.
Three flooding events at Sarantapotamos basin and four flooding events at Rafina basin have been analyzed. The calibration procedure was based on the manual stepwise method proposed by Yucel et al. (2015) defining the parameters REFKDT, RETDEPRTFAC, OVROUGHRTAC, and MannN, which influence the total water volume and the shape of the hydrograph. Results showed that the correlation coefficient between the observed and simulated discharges after the calibration was higher than 0.7 for all events. Thus, WRF-Hydro is capable of forecasting observed discharge at the studied regions, after implementation of a successful calibration process. This outcome is important because WRF-Hydro is implemented under calibration with ground-truth observations for the first time in Greece, contributing in this way to the better modeling and understanding of flooding mechanisms in the study areas. Additionally, these calibrated parameters could be used from every scientific team that wants to study past and future flooding events in the area of Attica, enhancing the research community's understanding of the physical effects of flash flooding.
To investigate the influence of the use of WRF-Hydro on the precipitation forecast skill, we compare the simulations produced by WRF-Hydro and WRF-only models, configured with the same microphysics schemes for all events. The resulting simulations were verified against observed precipitation in two gauge stations: at Vilia (for the basin of Sarantapotamos) and N. Makri (for the basin of Rafina). Thus, we compared the simulated against observed precipitation in terms of both temporal distribution and total amount of precipitation. We found that the temporal distribution of WRF-Hydro simulations has the same correlation coefficient, but it has lower root-mean-square errors than the simulation of WRF only. Although it was shown that WRF-Hydro tends to slightly improve the total amount of forecasted precipitation, the overall results indicate that the components of terrestrial hydrological models are contributing but not decisive factors in the simulation of precipitation. A preliminary analysis of key water budget components indicated that the precipitation simulation improvement provided by the WRF-Hydro system may be related to the feedback of the terrestrial hydrology parameterization on the modeled atmosphere. A follow up study could focus on the further investigation of impact of the more detailed representation of the interaction between the land surface and hydrology processes to the surface energy budget under the WRF-Hydro coupling scheme by applying long-term simulations and validating the results against ground-based or satellite observation, considering limitations arising from internal model variability (Bassett et al., 2020) and domain size (Fersch et al., 2020; Arnault et al., 2018). Also, the incorporation of the SST update into the model will be considered, as previous studies show a positive feedback to simulations (Avolio et al., 2019; Senatore et al., 2015). Even though a more detailed analysis is required to explore the sensitivity of the simulated precipitation to the coupling between hydrological and land–atmosphere processes, the current study demonstrates that the coupled WRF-Hydro model has the potential to enhance precipitation forecast skill for operational flood predictions.
For an operational point of view, the application of a coupled WRF-Hydro model to exploit its beneficial impact in simulating precipitation is partially limited due to the additional computational time needed for the execution of the WRF-Hydro model. In particular, in our case, a 3 d coupled WRF-Hydro forecast considering a prior 12 h spin-up under the investigated configuration requires ×1.35 time compared to WRF-only implementation in 140 computing nodes. It should be noted that the extra computational time depends on the WRF-Hydro configuration and the computing resources for which the model is applied.
It is in our prospects to further enhance the performance of WRF-Hydro in the study areas and expand the applied modeling approach in other drainage basins throughout Greece, with the aim of building an operational flood forecasting system based on coupled hydrological and atmospheric models. Thus, this work is a preliminary effort in order to develop a prototype flood forecasting system, based on the state-of-the-art hydrometeorological modeling tool WRF-Hydro and establish efficient dissemination tools promoting flood risk awareness. A follow-up study could focus on evaluating the performance of the model initialized by GFS data during a pre-operational application covering a whole hydrological year. Such a study could enhance our knowledge about the added value of the WRF-Hydro coupled mode and shed light on the performance of the model using GFS operational data. The utmost goal is to provide citizens and stakeholders with reliable information and warnings in order to enhance flood risk awareness and protect lives and properties.
Data from this research are not publicly available. Interested researchers can contact the corresponding author of this article.
The study was conceptualized by all authors; EG carried out the simulations and wrote the original draft. KL, VK, TG, and CG provided comments on the results and reviewed and edited the manuscript.
The authors declare that they have no conflict of interest.
Publisher's note: Copernicus Publications remains neutral with regard to jurisdictional claims in published maps and institutional affiliations.
The data for stage and discharge for Sarantapotamos basin were provided by the hydrometric stations of the Deucalion project (http://deucalionproject.itia.ntua.gr, last access: 28 December 2019), while the data for Rafina basin were provided by the Hydrological Observatory of Athens of the National Technical University of Athens, kindly provided by Evangelos Baltas.
This research was funded by the project Cyprus Flood Forecasting System – POST-DOC/0718/0040, which is co-funded by the Republic of Cyprus and the European Regional Development Fund (through the “DIDAKTOR” RESTART 2016–2020 Program for Research, Technological Development and Innovation).
This paper was edited by Gregor C. Leckebusch and reviewed by two anonymous referees.
Alves, M., Nadeau, D. F., Music, B., Anctil, F., and Parajuli, A.: On the performance of the Canadian Land Surface Scheme driven by the ERA5 reanalysis over the Canadian boreal forest, J. Hydrometeorol., 21, 1383–1404, 2020.
Arnault, J., Wagner, S., Rummler, T., Fersch, B., Bliefernicht, J., Andresen, S., and Kunstmann, H.: Role of runoff-infiltration partitioning and resolved overland flow on land-atmosphere feedbacks: a case-study with the WRF-Hydro coupled modeling system for West Africa, J. Hydrometeorol., 17, 1489–1516, https://doi.org/10.1175/JHM-D-15-0089.1, 2016.
Arnault, J., Rummler, T., Baur, F., Lerch, S., Wagner, S., Fersch, B., Zhang, Z., Kerandi, N., Keil, C., and Kunstmann, H.: Precipitation Sensitivity to the Uncertainty of Terrestrial Water Flow in WRF-Hydro: An Ensemble Analysis for Central Europe, J. Hydrometeorol., 19, 1007–1025, https://doi.org/10.1175/JHM-D-17-0042.1, 2018.
Avolio, E., Cavalcanti, O., Furnari, L., Senatore, A., and Mendicino, G.: Brief communication: Preliminary hydro-meteorological analysis of the flash flood of 20 August 2018 in Raganello Gorge, southern Italy, Nat. Hazards Earth Syst. Sci., 19, 1619–1627, https://doi.org/10.5194/nhess-19-1619-2019, 2019.
Bassett, R., Young, P. J., Blair, G. S., Samreen, F., and Simm, W.: A large ensemble approach to quantifying internal model variability within the WRF numerical model, J. Geophys. Res.-Atmos., 125, e2019JD031286, https://doi.org/10.1029/2019JD031286, 2020.
Camera, C., Bruggeman, A., Zittis, G., Sofokleous, I., and Arnault, J.: Simulation of extreme rainfall and streamflow events in small Mediterranean watersheds with a one-way-coupled atmospheric–hydrologic modelling system, Nat. Hazards Earth Syst. Sci., 20, 2791–2810, https://doi.org/10.5194/nhess-20-2791-2020, 2020.
Chen, F. and Dudhia, J.: Coupling an advanced land surface hydrology model with the Penn State-NCAR MM5 modeling system, Part I: Model implementation and sensitivity, Mon. Weather Rev., 129, 569–585, 2001.
Crossett, C. C., Betts, A. K., Dupigny-Giroux, L.-A. L., and Bomblies, A.: Evaluation of Daily Precipitation from the ERA5 Global Reanalysis against GHCN Observations in the Northeastern United States, Climate, 8, 148, https://doi.org/10.3390/cli8120148, 2020.
Diakakis, M.: Rainfall thresholds for flood triggering: The case of Marathonas in Greece, Nat. Hazards, 60, 789–800, https://doi.org/10.1007/s11069-011-9904-7, 2012.
Diakakis, M., Katsetsiadou, K., and Pallikarakis, A.: Flood fatalities in Athens, Greece: 1880-2010, in: Bulletin of the Geological Society of Greece, vol. XLVII 2013, Proceedings of the 13th International Congress, September 2013, Chania, 2013.
Doocy, S., Daniels, A., Murray, S., and Kirsch, T. D.: The human impact of floods: A historical review of events 1980–2009 and systematic literature review, PLOS Curr. Disast., 2013, 1, https://doi.org/10.1371/currents.dis.f4deb457904936b07c09daa98ee8171a, 2013.
Dudhia, J.: Numerical study of convection observed during the winter monsoon experiment using a mesoscale two-dimensional model, J. Atmos. Sci., 46, 3077–3107, 1989.
Eltahir, E. A.: A soil moisture–rainfall feedback mechanism: 1. Theory and observations, Water Resour. Res., 34, 765–776, 1998.
Emmanouil, G., Vlachogiannis, D., and Sfetsos, A.: Exploring the ability of the WRF-ARW atmospheric model to simulate different meteorological conditions in Greece, Atmos. Res., 247, 105–226, https://doi.org/10.1016/j.atmosres.2020.105226, 2020.
Falter, D., Schröter, K., Dung, N. V., Vorogushyn, S., Kreibich, H., Hundecha, Y., Apel, H., and Merz, B.: Spatially coherent flood risk assessment based on long-term continuous simulation with a coupled model chain, J. Hydrol., 524, 182–193, 2015.
Fersch, B., Senatore, A., Adler, B., Arnault, J., Mauder, M., Schneider, K., Völksch, I., and Kunstmann, H.: High-resolution fully coupled atmospheric–hydrological modeling: a cross-compartment regional water and energy cycle evaluation, Hydrol. Earth Syst. Sci., 24, 2457–2481, https://doi.org/10.5194/hess-24-2457-2020, 2020.
Furnari, L., Mendicino, G., and Senatore, A.: Hydrometeorological Ensemble Forecast of a Highly Localized Convective Event in the Mediterranean, Water, 12, 1545, https://doi.org/10.3390/w12061545, 2020.
Galanaki, E., Flaounas, E., Kotroni, V., Lagouvardos, K., and Argiriou, A.: Lightning activity in the Mediterranean: quantification of cyclones contribution and relation to their intensity, Atmos. Sci. Lett., 17, 510–516, https://doi.org/10.1002/asl.685, 2016.
Galanaki, E., Lagouvardos, K., Kotroni, V., Flaounas, E., and Argiriou, A.: Thunderstorm climatology in the Mediterranean using cloud-to-ground lightning observations, Atmos. Res., 207, 136–144, https://doi.org/10.1016/j.atmosres.2018.03.004, 2018.
Giannaros, C., Kotroni, V., Lagouvardos, K., Oikonomou, C., Haralambous, H., and Papagiannaki, K.: Hydrometeorological and Socio-Economic Impact Assessment of Stream Flooding in Southeast Mediterranean: The Case of Rafina Catchment (Attica, Greece), Water, 12, 2426, https://doi.org/10.3390/w12092426, 2020.
Giannaros, T., Melas, D., and Ziomas, I.: Performance evaluation of the Weather Research and Forecasting (WRF) model for assessing wind resource in Greece, Renew. Energy, 102, 190–198, https://doi.org/10.1016/j.renene.2016.10.033, 2016.
Giannaros, C., Nenes, A., Giannaros, T. M., Kourtidis, K., and Melas, D.: A comprehensive approach for the simulation of the Urban Heat Island effect with the WRF/SLUCM modeling system: The case of Athens (Greece), Atmos. Res., 201, 86–101, https://doi.org/10.1016/j.atmosres.2017.10.015, 2018.
Giannaros, C., Melas, D., and Giannaros, T. M.: On the short-term simulation of heat waves in the Southeast Mediterranean: Sensitivity of the WRF model to various physics schemes, Atmos. Res., 218, 99–116, https://doi.org/10.1016/j.atmosres.2018.11.015, 2019.
Giannaros, C., Kotroni, V., Lagouvardos, K., Giannaros, T. M., and Pikridas, C.: Assessing the Impact of GNSS ZTD Data Assimilation into the WRF Modeling System during High-Impact Rainfall Events over Greece, Remote Sens., 12, 383, https://doi.org/10.3390/rs12030383, 2020.
Givati, A. and Sapir, G.: Simulating 1 % Probability Hydrograph at the Ayalon Basin Using the HEC-HMS, Special Hydrological Report, Israel Hydrological Service, Jerusalem, Israel, 2014.
Givati, A., Gochis, D., Rummler, T., and Kunstmann, H.: Comparing one-way and two-way coupled hydrometeorological forecasting systems for flood forecasting in the mediterranean region, Hydrology. 3, 19, https://doi.org/10.3390/hydrology3020019, 2016.
Gochis, D., Yu, W., and Yates, D.: The WRF-Hydro model technical description and user's guide, version 3.0, NCAR Technical Document, 120 pp., available at: https://ral.ucar.edu/sites/default/files/public/images/project/WRF_Hydro_User_Guide_v3.0.pdf (last access: 28 December 2019), 2015.
Gochis, D. J. and Chen, F.: Hydrological Enhancements to the Community Noah Land Surface Model (No. NCAR/TN-454+STR), University Corporation for Atmospheric Research, https://doi.org/10.5065/D60P0X00, 2003.
Gochis, D. J., Yu, W., and Yates, D. N.: The WRF-Hydro Model Technical Description and User's Guide, Version 1.0, NCAR Technical Document, NCAR, Boulder, Colorado, 120 pp., available at: http://www.ral.ucar.edu/projects/wrf_hydro/ (last access: 28 December 2019), 2013.
Hauck C., Barthlott, C., Krauss, L., and Kalthoff, N.: Soil moisture variability and its influence on convective precipitation over complex terrain, Q. J. Roy. Meteorol. Soc., 137, 42–56, 2011.
Hersbach, H. and Dee, D.: ERA5 reanalysis is in production, ECMWF Newsletter 147, ECMWF, available at: https://www.ecmwf.int/en/newsletter/147/news/era5-reanalysis-production (last access: 28 December 2019), 2016.
Hong, S. Y. and Lim, J. O.: The WRF Single-Moment 6-ClassMicrophysics Scheme (WSM6), J. Korean Meteorol. Soc., 42, 129–151, 2006.
Janjic, Z. I.: Nonsingular Implementation of the Mellor-Yamada Level 2.5 Scheme in the NCEP Meso Model, NCEP Office Note No. 437, National Oceanic and Atmospheric Administration, USA, p. 61, available at: https://repository.library.noaa.gov/view/noaa/11409 (last access: 28 December 2019), 2002.
Julien, P., Saghafian, B., and Ogden, F.: Raster-based hydrological modeling of spatially-varied surface runoff, Water Resour. Bull., 31, 523–536, 1995.
Kain, J. S. and Fritsch, J. M.: Convective parameterization for mesoscale models: the Kain-Fritsch scheme, in: vol. 46, The Representation of Cumulus Convection in Numerical Models, Meteor. Monogr., Am. Meteorol. Soc., 165–170, 1992.
Kandilioti, G. and Makropoulos, C.: Preliminary flood risk assessment: the case of Athens, Nat. Hazards, 61, 441–468, https://doi.org/10.1007/s11069-011-9930-5, 2012.
Karympalis, E., Gaki-Papanastasiou, K., and Maroukian, M.: Contribution of geomorphological features of the darinage network of Megalo rema (Rafina) and human interference in occurrence of flood events, Bull. Geol. Soc. Greece, 38, 171–181, https://doi.org/10.12681/bgsg.18436, 2005.
Kerandi, N., Arnault, J., Laux, P., Wagner, S., Kitheka, J., and Kunstmann, H.: Joint atmospheric-terrestrial water balances for East Africa: a WRF-Hydro case study for the upper Tana River basin, Theor. Appl. Climatol., 131, 1337, https://doi.org/10.1007/s00704-017-2050-8, 2018.
Krajewski, W. F., Ceynar, D., Demir, I., Goska, R., Kruger, A., Langel, C., Mantilla, R., Niemeier, J., Quintero, F., Seo, B., Small, S. J., Weber, L. J., and Young, N. C.: Real-Time Flood Forecasting and Information System for the State of Iowa, B. Am. Meteorol. Soc., 98, 539–554, https://doi.org/10.1175/BAMS-D-15-00243.1, 2017.
Lagouvardos, K., Kotroni, V., Dobricic, S., Nickovic, S., and Kallos, G.: The storm of October 21–22, 1994, over Greece: Observations and model results, J. Geophys. Res.-Atmos., 101, 26217–26226, https://doi.org/10.1029/96jd01385, 1996.
Lagouvardos, K., Kotroni, V., Bezes, A., Koletsis, I., Kopania, T., Lykoudis, S., Mazarakis, N., Papagiannaki, K., and Vougioukas, S.: The Automatic Weather Stations Network of the National Observatory of Athens: Operation and Database, Geosci. Data J., 4, 4–16, https://doi.org/10.1002/gdj3.44, 2017.
Larsen, M. A. D., Refsgaard, J. C., Jensen, K. H., Butts, M. B., Stisen, S., and Mollerup, M.: Calibration of a distributed hydrology and land surface model using energy flux measurements, Agr. Forest Meteorol., 217, 74–88, https://doi.org/10.1016/j.agrformet.2015.11.012, 2016.
Lasda, O., Dikou, A., and Papapanagiotou, E.,: Flash flooding in Attika, Greece: Climatic change or urbanization?, Ambio, 39, 608–611, https://doi.org/10.1007/s13280-010-0050-3, 2010.
Li, L., Gochis, D. J., Sobolowski, S., and Mesquita, M. D. S.: Evaluating the present annual water budget of a Himalayan headwater river basin using a high-resolution atmosphere-hydrology model, J. Geophys. Res.-Atmos., 122, 4786–4807, https://doi.org/10.1002/2016JD026279, 2017.
Li, L., Pontoppidan, M., Sobolowski, S., and Senatore, A.: The impact of initial conditions on convection-permitting simulations of a flood event over complex mountainous terrain, Hydrol. Earth Syst. Sci., 24, 771–791, https://doi.org/10.5194/hess-24-771-2020, 2020.
Lin, P. , Yang, Z., Gochis, D. J., Yu, W., Maidment, D. R., Somos-Valenzuela, M. A., and David, C. H.: Implementation of a vector-based river network routing scheme in the community WRF-Hydro modeling framework for flood discharge simulation, Environ. Model. Softw., 107, 1–11, https://doi.org/10.1016/j.envsoft.2018.05.018, 2018.
Liu, Y., Liu, J., Li, C., Yu, F., Wang, W., and Qiu, Q.: Parameter Sensitivity Analysis of the WRF-Hydro Modeling System for Streamflow Simulation: a Case Study in Semi-Humid and Semi-Arid Catchments of Northern China, Asia-Pacific J. Atmos. Sci., 57, 451–466, https://doi.org/10.1007/s13143-020-00205-2, 2021.
Martens, B., Schumacher, D. L., Wouters, H., Muñoz-Sabater, J., Verhoest, N. E. C., and Miralles, D. G.: Evaluating the land-surface energy partitioning in ERA5, Geosci. Model Dev., 13, 4159–4181, https://doi.org/10.5194/gmd-13-4159-2020, 2020.
Maxwell, R. M., Chow, F. K., and Kollet, S. J.: The groundwater–land-surface–atmosphere connection: Soil moisture effects on the atmospheric boundary layer in fully-coupled simulations, Adv. Water Resour., 30, 2447–2466, https://doi.org/10.1016/j.advwatres.2007.05.018, 2007.
Milly P. C. D., Wetherald, R. T., Dunne, K. A., and Delworth, T. L.: Increasing risk of great floods in a changing climate, Nature, 415, 514–517, https://doi.org/10.1038/415514a, 2002.
Mlawer E., Taubman, S., Brown, P., Iacono, M., and Clough, S.: Radiative transfer for inhomogeneous atmospheres: RRTM, a validated correlated-k model for the longwave, J. Geophys. Res., 102, 16663–16682, 1997.
Naabil, E., Lamptey, B. L., Arnault, J., Olufayo, A., and Kunstmann, H.: Water resources management using the WRF-Hydro modelling system: Case-study of the Tono dam in West Africa, J. Hydrol.: Reg. Stud., 12, 196–209, https://doi.org/10.1016/j.ejrh.2017.05.010, 2017.
NOAA: National Water Model, available at: https://water.noaa.gov/documents/wrn-national-water-model.pdf (last access: 28 December 2019), 2016.
Nunalee, C. G., Horváth, Á., and Basu, S.: High-resolution numerical modeling of mesoscale island wakes and sensitivity to static topographic relief data, Geosci. Model Dev., 8, 2645–2653, https://doi.org/10.5194/gmd-8-2645-2015, 2015.
Ogden, F. L.: CASC2D Reference Manual, Dept. of Civil & Env. Engr., U-37, University of Connecticut, Storrs, 106 pp., 1997.
Pal, S., Dominguez, F., Dillon, M. E., Alvarez, J., Garcia, C. M., Nesbitt, S. W., and Gochis, D.: Hydrometeorological Observations and Modeling of an Extreme Rainfall Event using WRF and WRF-Hydro during the RELAMPAGO Field Campaign in Argentina, J. Hydrometeorol., 22, 331–351, https://doi.org/10.1175/JHM-D-20-0133.1, 2020.
Papagiannaki, K., Lagouvardos,K., and Kotroni, V.: A database of high-impact weather events in Greece: A descriptive impact analysis for the period 2001–2011, Nat. Hazards Earth Syst. Sci., 13, 727–736, https://doi.org/10.5194/nhess-13-727-2013, 2013.
Papagiannaki, K., Lagouvardos, K., Kotroni, V., and Bezes, A.: Flash flood occurrence and relation to the rainfall hazard in a highly urbanized area, Nat. Hazards Earth Syst. Sci., 15, 1859–1871, https://doi.org/10.5194/nhess-15-1859-2015, 2015.
Papagiannaki, K., Kotroni, V., Lagouvardos, K., Ruin, I., and Bezes, A.: Urban Area Response to Flash Flood–761 Triggering Rainfall, Featuring Human Behavioral Factors: The Case of 22 October 2015 in Attica, Greece, Weather Clim. Soc., 9, 621–638, https://doi.org/10.1175/wcas-d-16-0068.1, 2017.
Papaioannou, G., Varlas, G., Terti, G., Papadopoulos, A., Loukas, A., Panagopoulos, Y., and Dimitriou, E.: Flood Inundation Mapping at Ungauged Basins Using Coupled Hydrometeorological–Hydraulic Modelling: The Catastrophic Case of the 2006 Flash Flood in Volos City, Greece, Water, 11, 2328, https://doi.org/10.3390/w11112328, 2019.
Papathanasiou, C., Makropoulos, C., and Mimikou, M.: Hydrological modelling for flood forecasting: Calibrating the post-fire initial conditions, J. Hydrol., 529, 1838–1850, 2015.
Petrucci, O., Papagiannaki, K., Aceto, L., Boissier, L., Kotroni, V., Grimalt, M., Llasat, M. C., Llasat-Botija, M., Rosselló, J., Pasqua, A. A., and Vinet, F.: MEFF: The database of MEditerranean Flood Fatalities (1980 to 2015), J. Flood Risk Manage., 12, 1–17, 2018.
Politi, N., Nastos, P. T., Sfetsos, A., Vlachogiannis, D., and Dalezios, N. R.: Evaluation of the AWR-WRF model confguration at high resolution over the domain of Greece, Atmos. Res., 208, 229–245, https://doi.org/10.1016/j.atmosres.2017.10.019, 2018.
Pytharoulis, I., Kotsopoulos, S., Tegoulias, I., Kartsios, S., Bampzelis, D., and Karacostas, T.: Numerical modeling of an intense precipitation event and its associated lightning activity over northern Greece, Atmos. Res., 169, 523–538, https://doi.org/10.1016/j.atmosres.2015.06.019, 2016.
Romang, H., Zappa, M., Hilker, N., Gerber, M., Dufour, F., Frede, V., Bérod, D., Oplatka, M., Hegg, C., and Rhyner, J.: IFKIS-Hydro: an early warning and information system for floods and debris flows, Nat. Hazards, 56, 509–527, https://doi.org/10.1007/s11069-010-9507-8, 2011.
Schwarzkopf, M. D. and Fels, S. B.: The simplified exchange method revisited: An accurate, rapid method for computation of infrared cooling rates and fluxes, J. Geophys. Res., 96, 9075–9096, https://doi.org/10.1029/89JD01598, 1991.
Senatore, A., Mendicino, G., Gochis, D. J., Yu, W., Yates, D. N., and Kunstmann, H.: Fully coupled atmosphere-hydrology simulations for the Central Mediterranean: impact of enhanced hydrological parameterization for short and long time scales, J. Adv. Model. Earth Syst., 7, 1693–1715, https://doi.org/10.1002/2015MS000510, 2015.
Senatore, A., Furnari, L., and Mendicino, G.: Impact of high-resolution sea surface temperature representation on the forecast of small Mediterranean catchments' hydrological responses to heavy precipitation, Hydrol. Earth Syst. Sci., 24, 269–291, https://doi.org/10.5194/hess-24-269-2020, 2020.
Seneviratne, S., Corti, T., Davin, E., Hirschi, M., Jaeger, E., Lehner, I., Orlowsky, B., and Teuling, A.: Investigating soil moisture-climate interactions in a changing climate: a review, Earth Sci. Rev., 99, 125–161, https://doi.org/10.1016/j.earscirev.2010.02.004, 2010.
Shrestha, P., Sulis, M., Masbou, M., Kollet, S., and Simmer, C.: A scale-consistent terrestrial systems modeling platform based on COSMO, CLM, and ParFlow, Mon. Weather Rev., 142, 3466–3483, https://doi.org/10.1175/MWR-D-14-00029.1, 2014.
Silver, M., Karnieli, A., Ginat, H., Meiri, E., and Fredj, E.: An innovative method for determining hydrological calibration parameters for the WRF-Hydro model in arid regions, Environ. Model. Softw., 91, 47–69, https://doi.org/10.1016/j.envsoft.2017.01.010, 2017.
Skamarock, W. C., Klemp, J. B., Dudhia, J., Gill, D. O., Barker, D. M., Wang, W., and Powers, J. G.: A description of the advanced research WRF version 2, National Center For Atmospheric Research, Mesoscale and Microscale Meteorology Div., Boulder, Colorado, 2005.
Skamarock, W. C., Klemp, J., Dudhia, J., Gill, D., Barker, D., Duda, M., Huang, X., Wang, W., and Powers, J.: A Description of the Advanced Research WRF Version 3 (No. NCAR/TN-475+STR), University Corporation for Atmospheric Research, https://doi.org/10.5065/D68S4MVH, 2008.
Strahler, A. N.: Quantitative analysis of watershed geomorphology, Trans. Am. Geophys. Union, 38, 913–920, https://doi.org/10.1029/tr038i006p00913, 1957.
Tarek, M., Brissette, F. P., and Arsenault, R.: Evaluation of the ERA5 reanalysis as a potential reference dataset for hydrological modelling over North America, Hydrol. Earth Syst. Sci., 24, 2527–2544, https://doi.org/10.5194/hess-24-2527-2020, 2020.
Varlas, G., Anagnostou, M. N., Spyrou, C., Papadopoulos, A., Kalogiros, J., Mentzafou, A., Michaelides, S., Baltas, E., Karymbalis, E., and Katsafados, P.: A Multi-Platform Hydrometeorological Analysis of the Flash Flood Event of 15 November 2017 in Attica, Greece, Remote Sens., 11, 45, https://doi.org/10.3390/rs11010045, 2019.
Verri, G., Pinardi, N., Gochis, D., Tribbia, J., Navarra, A., Coppini, G., and Vukicevic, T.: A meteo-hydrological modelling system for the reconstruction of river runoff: the case of the Ofanto river catchment, Nat. Hazards Earth Syst. Sci., 17, 1741–1761, https://doi.org/10.5194/nhess-17-1741-2017, 2017.
Wagner, S., Fersch, B., Yuan, F., Yu, Z., and Kunstmann, H.: Fully coupled atmospheric-hydrological modeling at regional and long-term scales: development, application, and analysis of WRF-HMS, Water Resour. Res., 52, 1–20, https://doi.org/10.1002/2015WR018185, 2016.
Wang, W., Liu, J., Li, C., Liu, Y., Yu, F., and Yu, E.: An Evaluation Study of the Fully Coupled WRF/WRF-Hydro Modeling System for Simulation of Storm Events with Different Rainfall Evenness in Space and Time, Water, 12, 1209, https://doi.org/10.3390/w12041209, 2020.
Wehbe, Y., Temimi, M., Weston, M., Chaouch, N., Branch, O., Schwitalla, T., Wulfmeyer, V., Zhan, X., Liu, J., and Al Mandous, A.: Analysis of an extreme weather event in a hyper-arid region using WRF-Hydro coupling, station, and satellite data, Nat. Hazards Earth Syst. Sci., 19, 1129–1149, https://doi.org/10.5194/nhess-19-1129-2019, 2019.
White, K. S., Petrucci, O., Papagiannaki, K., Aceto, L., Boissier, L., Kotroni, V., Grimalt, M., Llasat, M. C., Llasat-Botija, M., Rosselló, J., Pasqua, A. A., and Vinet, F.: Technical Summary in Climate Change 2001: Impacts, Adaptation and Vulnerability, Cambridge University Press, Cambridge, 19–73, 2001.
Wigmosta, M. and Lettenmaier, D. P.: A comparison of simplified methods for routing topographically driven subsurface flow, Water Resour. Res., 35, 255–264, 1999.
Wigmosta, M., Vail, L. W., and Lettenmaier, D. P.: A distributed hydrology-vegetation model for complex terrain, Water Resour. Res., 30, 1665–1679, 1994.
Wu, J., Lu, G., and Wu, Z.: Flood forecasts based on multi-model ensemble precipitation forecasting using a coupled atmospheric-hydrological modeling system, Nat. Hazards, 74, 325–340, https://doi.org/10.1007/s11069-014-1204-6, 2014.
Xiang, T., Vivoni, E. R., Gochis, D. J., and Mascaro, G.: On the diurnal cycle of surface energy fluxes in the North American monsoon region using the WRF-Hydro modeling system, J. Geophys. Res.-Atmos., 122, 9024–9049, https://doi.org/10.1002/2017JD026472, 2017.
Yucel, I., Onen, A., Yilmaz, K. K., Gochis, and D. J.: Calibration and evaluation of a flood forecasting system: utility of numerical weather prediction model, data assimilation and satellite-based rainfall, J. Hydrol., 523, 49–66, https://doi.org/10.1016/j.jhydrol.2015.01.042, 2015.
Zigoura, A., Karympalis, E., and Xalkisa, X.: Geomorphological characteristics of Sarantapotamos drainage network as causative factor of flooding in Thriassion Plain. Attica, Greece, in: Proceedings of the 10th International Congress of the Hellenic Geographical Society, 22–24 October 2014, Thessaloniki, Greece, 2014.