the Creative Commons Attribution 4.0 License.
the Creative Commons Attribution 4.0 License.
 | 24 Jun 2021
Indirect flood impacts and cascade risk across interdependent linear infrastructures
Maria Pregnolato
Fabio Castelli
Floods are one of the most frequent and damaging natural threats worldwide. Whereas the assessment of direct impacts is well advanced, the evaluation of indirect impacts is less frequently achieved. Indirect impacts are not due to the physical contact with flood water but result, for example, from the reduced performance of infrastructures. Linear critical infrastructures (such as roads and pipes) have an interconnected nature that may lead to failure propagation, so that impacts extend far beyond the inundated areas and/or period. This work presents the risk analysis of two linear infrastructure systems, i.e. the water distribution system (WSS) and the road network system. The evaluation of indirect flood impacts on the two networks is carried out for four flooding scenarios, obtained by a coupled 1D–quasi-2D hydraulic model. Two methods are used for assessing the impacts on the WSS and on the road network: a pressure-driven demand network model and a transport network disruption model respectively. The analysis is focused on the identification of (i) common impact metrics, (ii) vulnerable elements exposed to the flood, (iii) similarities and differences of the methodological aspects for the two networks, and (iv) risks due to systemic interdependency. The study presents an application to the metropolitan area of Florence (Italy). When interdependencies are accounted for, results showed that the risk to the WSS in terms of population equivalent (PE/year) can be reduced by 71.5 % and 41.8 %, if timely repairs to the WSS stations are accomplished by 60 and 120 min respectively; the risk to WSS in terms of pipe length (km yr−1) reduces by 53.1 % and 15.6 %. The study highlights that resilience is enhanced by systemic risk-informed planning, which ensures timely interventions on critical infrastructures; however, for indirect impacts and cascade effects, temporal and spatial scales are difficult to define. Perspective research could further improve this work by applying a system-risk analysis to multiple urban infrastructures.
- Article
(8692 KB) - Full-text XML
-
Supplement
(17796 KB) - BibTeX
- EndNote


Linear infrastructure systems such as the water supply system (WSS), electricity and transportation are considered critical infrastructures (CIs) because their failure would jeopardize public health and economic security, with repercussions on the whole society (Fekete, 2019; Tarani et al., 2019; Lhomme et al., 2013). CIs are exposed to natural hazards, such as flooding; in particular, ∼7.5 % of road and rail infrastructures are exposed to a 1-in-100-year flood event worldwide (Koks et al., 2019). Flooding can damage CIs directly (when impacts are due to the physical contact with floodwaters, i.e. direct impacts) and indirectly (when impacts are not due to the physical contact and/or occur outside the inundated area in space or time, i.e. indirect or cascade impacts). Changes in socio-economic and climatic conditions, as well as infrastructure interdependencies, could aggravate both direct and indirect impacts in the future (Pregnolato et al., 2017a; Evans et al., 2020).
Existing studies offer well-established methods to determine CI exposure to floods (e.g. Lyu et al., 2018) and direct flood impacts (Winter et al., 2016; Kellermann et al., 2016). Despite the fact that indirect impacts and cascade effects are widely assumed to be more significant due to the interconnected nature of networks (Gil and Steinbach, 2008; Pant et al., 2018; Arrighi et al., 2017), few works are available which address indirect impacts and cascade effects in time and space (Pant et al., 2018; Arrighi et al., 2017). Among these works, indirect impacts and cascade effects are mostly addressed with complex conceptual frameworks that, for their application, would require a significant number of models and data (Fekete, 2019; Emanuelsson et al., 2014), simplified risk indexes (Lyu et al., 2018; Balijepalli and Oppong, 2014; Singh et al., 2018) and/or very limited application to real-world case studies (Arrighi et al., 2019; Pant et al., 2018).
In order to address the above gap, this study aims at developing and applying a multi-infrastructure framework for the assessment of indirect flooding impacts. The framework is practically developed for addressing flooding impact to two linear CIs, namely the WSS and the road system (Arrighi et al., 2021). Compared to point systems (e.g. hospitals), linear ones are more difficult to analyse because they have complex interconnections which induce a non-linear dynamics of impact propagation outside the directly flooded segments; thus, they require ad hoc modelling. Three different models are respectively used in this study for simulating inundation, water pressure in the WSS and traffic disruption due to flooding. Also, different spatial scales are considered to account for the dynamic nature of indirect impacts. The method is demonstrated for the metropolitan area of Florence (Italy). This study represents one of the first attempts to model flooding impact to CIs for real-world networks, considering mutual interconnections, and it is expected to be relevant to researchers, as well as practitioners.
1.1 Cascading effects in CIs and urban resilience
Modern cities are currently defined by the engineering literature as “systems of systems”, where the “systems” are critical infrastructure (CI) systems (Gardner, 2016). Besides engineering systems, cities also include human, cultural and environmental spheres (Falco, 2015), which are out of the scope of this paper. CIs identify assets or systems which are so vital to a society that their incapacitation or destruction would debilitate security, economy, public health or safety, or any combination thereof (Serre and Heinzlef, 2018). Transportation systems, communication networks, sewage, water and electric systems are all examples of linear CIs.
The intrinsic nature of a system lies in the systemic interdependency, i.e. “a bidirectional relationship between two assets in which the operations of both assets affect each other” (Petit et al., 2015). Since an interdependency is effectively a combination of two dependencies, this constitutes a risk multiplier (Zio, 2016). Therefore, CIs should not be considered independently, and silo-based (i.e. where elements are considered in isolation) analyses should be considered as a preliminary attempt to understand the behaviour of a given infrastructure operating in its environment (Dueñas-Osorio et al., 2007; Rinaldi et al., 2001). These interconnections can lead to domino effects or cascading failures, i.e. the disruption or failure of a component in one infrastructure caused by the disruption or failure of a component in another infrastructure (Hilly et al., 2018).
The system-of-systems connotation comprehensively characterizes CIs and the wider urban resilience. The resilience of cities depends on both the intra-system resilience (the resilience of the individual CIs) and on the inter-system resilience (systemic resilience) (Kong and Simonovic, 2018). Hazard consequences may indeed extend well beyond the direct effect to the individual CI and escalate disruption over physical and jurisdictional boundaries. Infrastructure can respond to a hazard in multiple ways by (i) absorbing the impact and minimizing consequence; (ii) adjusting to non-optimal conditions and providing a lower performance (e.g. reduced service); (iii) failing in some or all its parts, without affecting other services; and (iv) failing in some or all its parts and cascading the failure to other services (Kong and Simonovic, 2018).
A more thorough understanding of the complex interactions among CIs and relative consequences on the provided services, environmental and human spheres is therefore essential in preparing for, responding to and recovering from disasters. The assessment of the consequences or impact depends on the (i) magnitude of service interruption (intensity, e.g. the number of impacted users), (ii) extent of service interruption (spatial) and (iii) duration of service interruption (temporal) (Kong and Simonovic, 2018). The systemic interdependency has a strong temporal dimension (e.g. hazard time window, speed of recovery, repair time, disruption duration, emergency backup time), as well as a spatial one (e.g. physical proximity, physical connection, hazard extent, spatial location of failures). In fact, indirect impacts usually dynamically propagate beyond the hazard domain, with an extension which is not proportional to the return period (Arosio et al., 2020). For other systems (e.g. finance, economy), Rinaldi et al. (2001) also considered logical interdependency, i.e. when the (intangible) connection is within variables and/or human behaviour. Appropriate metrics are essential to objectively measure both direct and indirect impacts; the impact due to a damaging event can be seen as the product of the duration of the event and the overall number of people affected (De Bruijn et al., 2019).
Advanced analysis that includes the systemic impact to interlinked CIs is needed to support national and local stakeholders in making better-informed and more holistic decisions, as underlined by the Sendai Framework for Disaster Risk Reduction (United Nations, 2015). Silo-infrastructure studies are limited in their scope since they ignore cascade effects and thus underestimate impact (De Bruijn et al., 2019).
Water supply systems (WSSs) are essential for bringing fresh water; they are complex systems composed by a range of elements functional for collection, storage, transportation, treatment and distribution (e.g. pipes, water pumps, water treatment plants, reservoirs) (Bartram et al., 2009). The assessment of flood risk on a WSS requires a comprehensive approach including several scales of analysis (e.g. catchment area, riverbed, distribution network) and relative models (flood model, distribution network model). These models simulate pressure behaviour in the nodes of the network if components supplied by electricity are affected by flooding (Arrighi et al., 2017; Tarani et al., 2019); pressure fluctuations or low pressures may lead to contamination from leakage orifices and air vacuum valves (Ebacher et al., 2010; Ellison et al., 2003). Existing works implemented methods which integrate geographic information system (GIS) analysis, inundation modelling and hydraulic network modelling with pressure-driven demand (PDD) (Cheung et al., 2005; Siew and Tanyimboh, 2012; Tarani et al., 2019). Two metrics measure flood impact to the WSS operativeness and integrity: (i) the number of inhabitants experiencing lack of service and (ii) the total length of potentially contaminated pipes (Arrighi et al., 2017).
Among CIs, roads are also fundamental for everyday needs of mobility, delivery and accessibility; in particular, during emergencies they become critical for medical supplies, rescue and repairs, with some road links more crucial than others when looking at accessibility (Balijepalli and Oppong, 2014). Network analysis is a powerful tool to navigate citizens, civil protection operators and rescue teams to a chosen destination using a specific journey. Thanks to analysis within routing, it is possible to decide if a route would be the shortest (length), the quickest (time) or safest (e.g. less flood-prone, more protected) according to specific needs. For example, an ambulance would rather use the quickest path, while citizens with normal cars could prefer the least vulnerable roads. Routing calculation can improve static vulnerability assessment, and integrated analysis improves planning of accessibility to critical infrastructure (hospitals, shelters) during flooding (Arrighi et al., 2019; Pregnolato et al., 2017a). In the context of flooded roads, impact assessment criteria include the (i) number of flooded links, (ii) timing (flood duration, operation time, traffic dynamics) and (iii) level of performance (e.g. speed reduction, road capacity reduction) (Casali and Heinimann, 2019; Kermanshah and Derrible, 2017; Balijepalli and Oppong, 2014). Available silo-based studies investigated road links' vulnerability and their failure impact on the overall network functioning (that is crucial for emergency planning); however, they ignore the impact of disconnection and lack of accessibility to critical services, which lead to cascading effects. In the last decade, a bulk of research has approached CI interdependency and pioneered methods to assess cascading effects. Review papers are available in literature for a more comprehensive overview (e.g. Ouyang, 2014). Modelling examples of flooding impact to interlinked CIs include electricity, roads and civil protection infrastructure (Fekete, 2019); roads, IT, water and energy supply (Kong and Simonovic, 2018); energy, water and wastewater (Holden et al., 2013); electricity, airports, wastewater plants and telecommunication (Pant et al., 2018); sewer and roads (Dong et al., 2019); and water and energy supply (Byers et al., 2015). Other studies adopted a participatory approach and investigated interdependencies between infrastructure/services in cities via workshops and/or interviews of residents and utility operators (e.g. De Bruijn et al., 2019). Despite such progress, how cascading consequences propagate, interact, and trigger, and particularly what are the interdependencies at their spatial and temporal scales are still open research questions (Pescaroli et al., 2018). In fact, most of existing multi-infrastructure frameworks are limited in their scope since they remain very theoretical or conceptual (this includes network-theory-based studies, e.g. Li et al., 2018), infrastructure parameters are treated as random variables, and thus they lack real-world application. Few studies have proposed a holistic application to analyse single networks (Casali, 2020) or interdependency effects so far (Pant et al., 2018; Dong et al., 2019); however, indirect consequences are not investigated, especially regarding the WSS–roads interaction.
1.2 Motivation and aim
Infrastructures currently have to cope with the increase in population, ageing of the assets, climate change and inherent complexities (interdependency, technology) of modern cities (Holden et al., 2013). As a result, modellers and decision makers are looking for advanced methods to assess cascade effects for planning and risk management (Alexander, 2018; Pregnolato and Dawson, 2018), to produce robust strategies for efficient performance in the future (any future). Existing studies offer well-established methods to determine CI exposure and direct flood impacts for flooding scenarios; however, a limited number of studies is available about indirect impacts and cascade effects. Moreover, most of these works offer complex conceptual frameworks, without application to real-world situations. In particular, existing models could be improved by exploring the impact to CIs due to a real, weather-related hazard by integrating different models, e.g. a flood model and a GIS (Holden et al., 2013).
Flooding is a threat for any infrastructure system in urban environments. Floodwater can directly affect infrastructure systems by physically damaging assets and equipment (e.g. road pavement, power generators), and these damages can result in further disruption to other systems that rely on such damaged assets and equipment. For example, floodwater can impair the energy supply (direct impact), which leads to disruptions in the systems working with electricity: water supply (e.g. water pumps), transport (e.g. railway, signalling), communication (e.g. routers), waste water (e.g. treatment plants), etc. Figure 1 shows the direct and indirect impacts within the urban infrastructure systems due to a flood event. Hilly et al. (2018) explicitly highlighted that an example of cascading effect from floods is when the WSS cannot be repaired because the roads that provide access to the affected parts are flooded. This is the gap on which this paper focuses (Fig. 1).

Figure 1Direct and indirect impacts on urban critical services and infrastructures. The orange lines identify the focus of this paper, i.e. the interdependency between WSS (water supply system) and the road system.
This study aims at developing and applying a multi-infrastructure framework for the assessment of indirect flooding impacts. This aim is achieved by (i) proposing a risk-based approach which integrate multiple CIs, their interdependency, and direct and indirect impacts; (ii) modelling flooding indirect impact to two linear infrastructure systems (WSS and roads), after identifying metrics which are compatible and representative for both networks, at both a silo-based and an interdependent level; (iii) modelling the actual WSS and roads of the city of Florence for four flooding scenarios as a proof of concept, with a focus on the consequences on the WSS due to the lack of accessibility; and (iv) drawing lessons and recommendation on the results, e.g. by comparing methods and results from the silo-based and independent analysis.
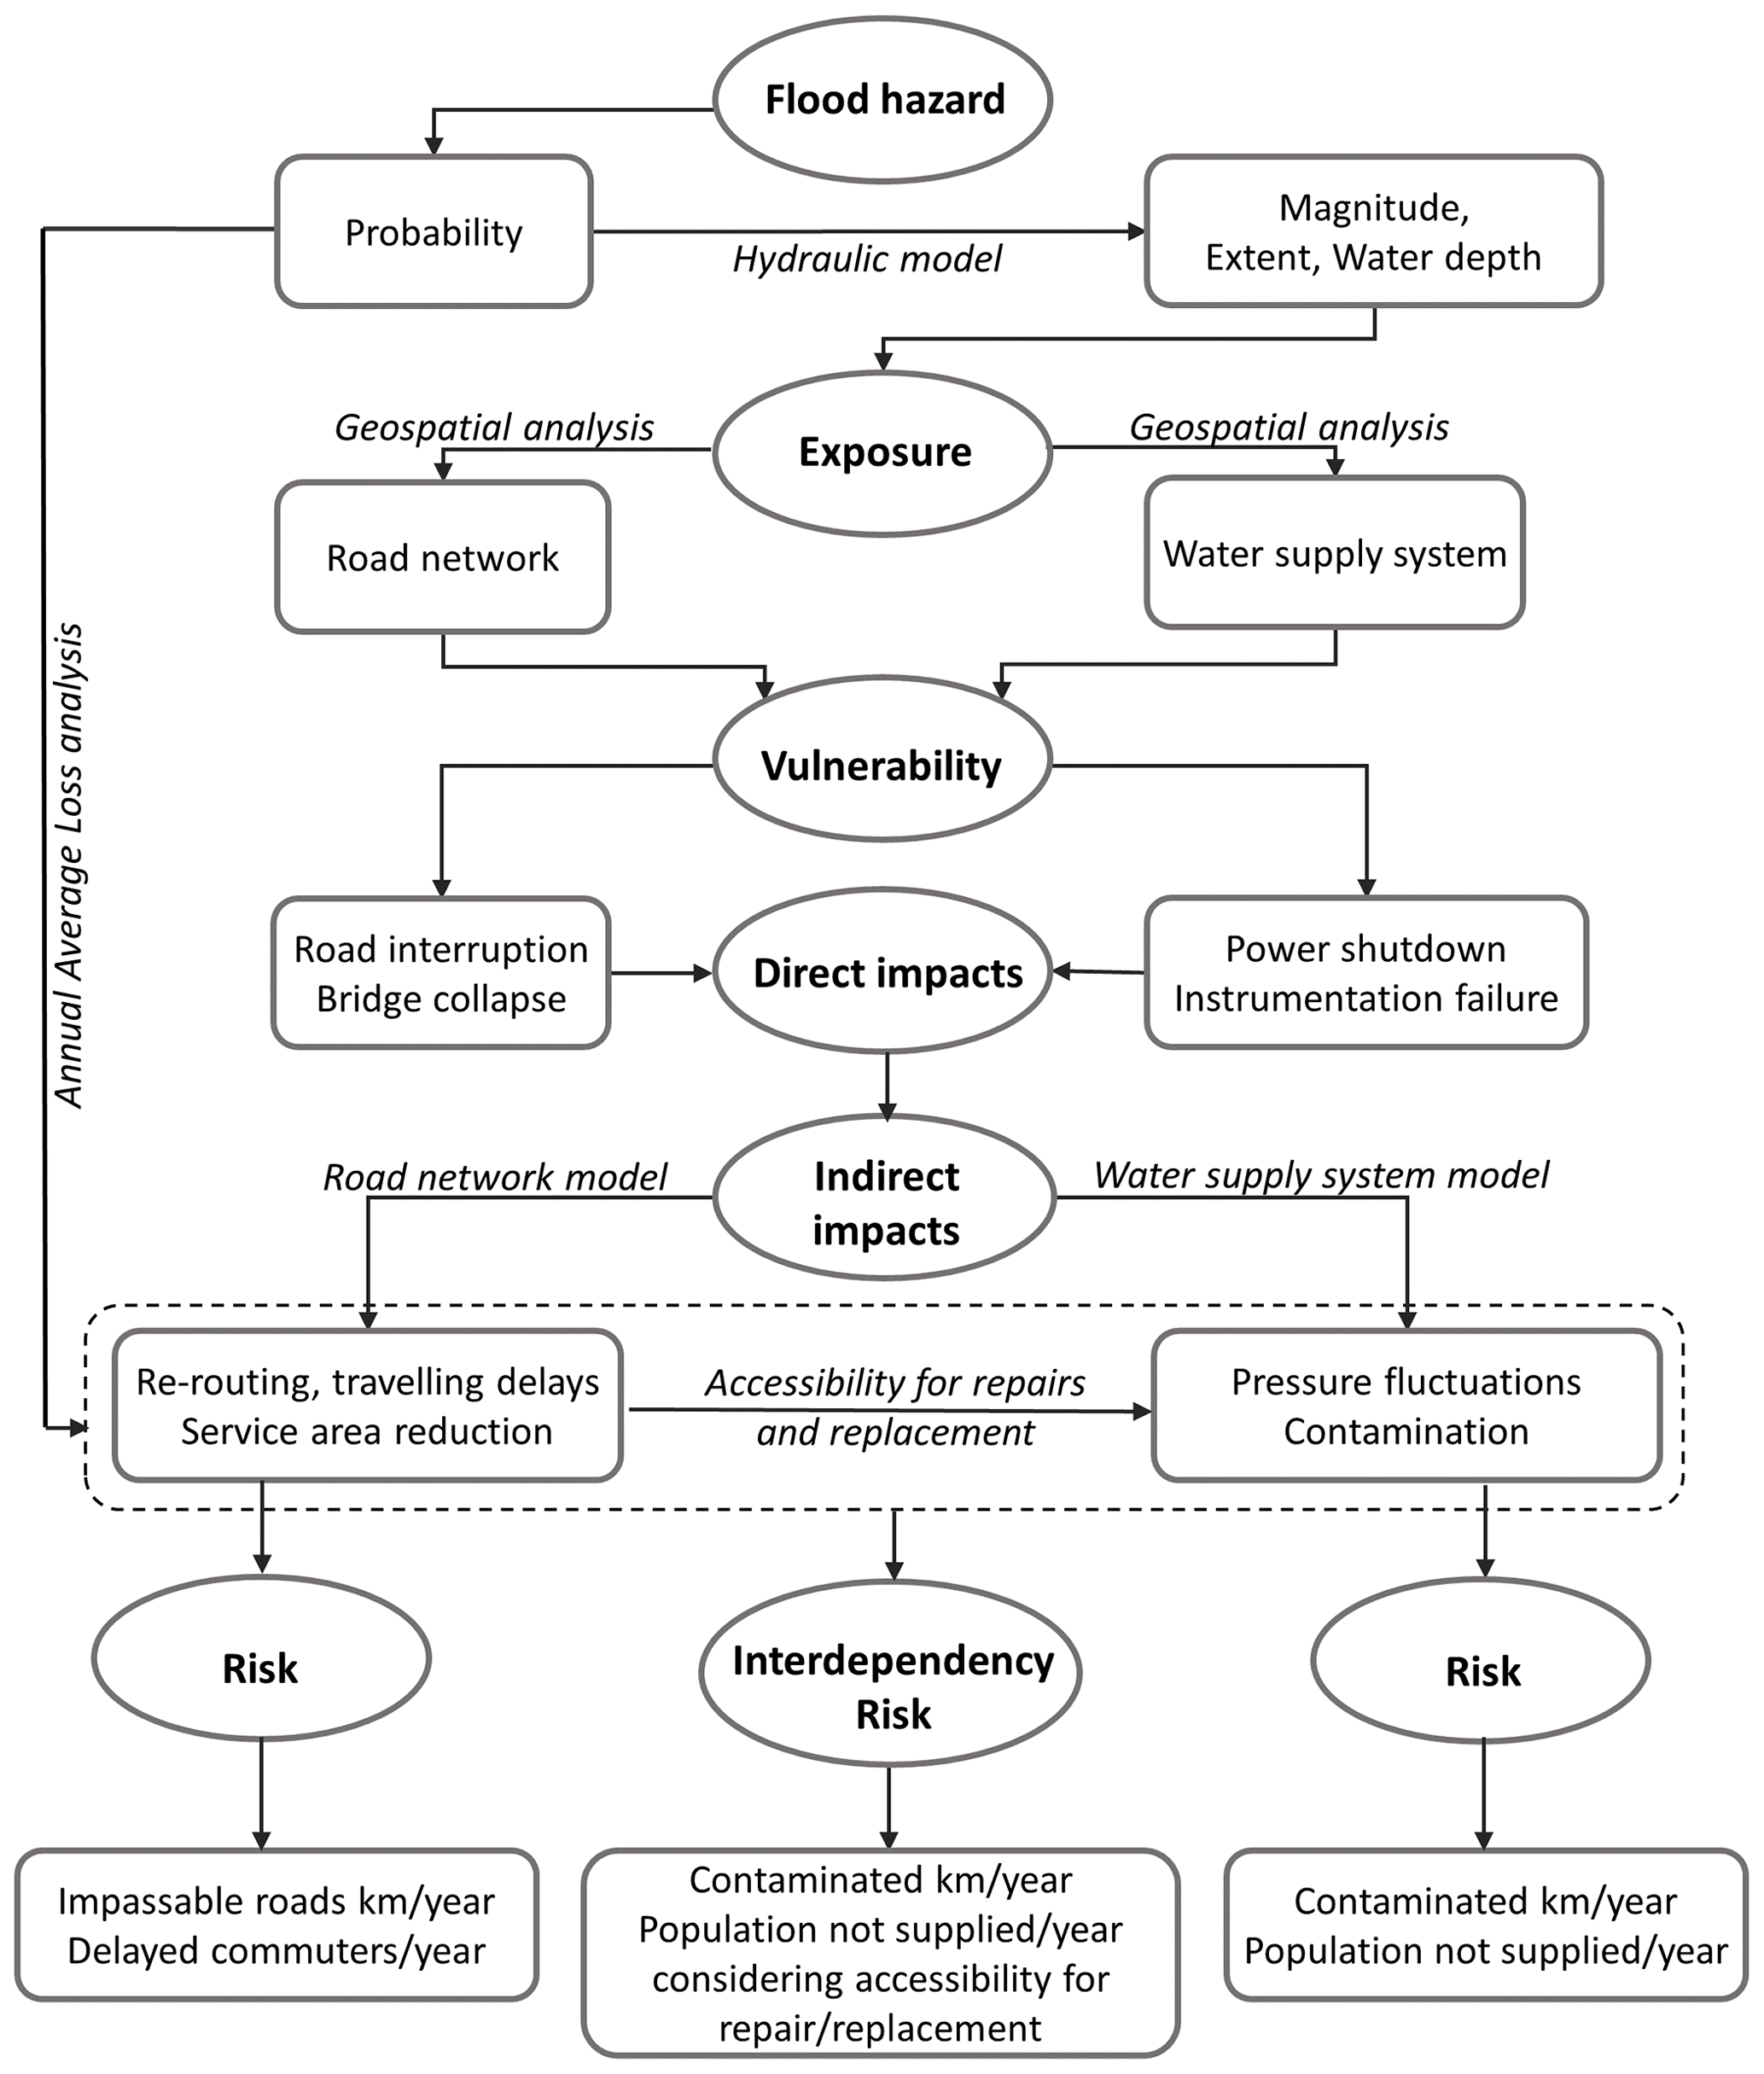
Risk is traditionally described with four moduli: hazard, exposure, vulnerability and consequences (Grossi and Kunreuther, 2005). This study adopts this risk approach to develop a comprehensive methodological framework (Fig. 2) for computing the risk to roads and the WSS due to the indirect impact of flooding. Flood hazard includes the probability of a flood event of a certain intensity to happen; exposure represents the assets subject to flooding (road network and the WSS); vulnerability is the extent of impact under certain conditions of exposure and hazard, e.g. the population not served by these assets. Direct impacts are impacts that may occur due to the physical impact of water, e.g. structural failure of bridges or instrumentation failure; direct impact assessment is out of the scope if this paper. Indirect impacts include service disruption, such as consequences of travelling delays due to floodwater on the roads or pressure fluctuation due to malfunctioning of lifting stations. Pressure fluctuation and zero pressure in pipes lead to the entrance of undesired pathogens with consequent contamination especially in older networks. Indirect impacts are computed with ad hoc models (Sect. 2.2) that concern the studied infrastructure systems (WSS and roads); however, the impact analysis could be tailored with different models for exploring impacts to other infrastructures (e.g. power supply and communication). The identified interdependency, which is a key element in cascade effects, concerns the reduced performance of the flooded road system, which does not allow access to WSS main plants for repairs and replacement of the WSS elements damaged by floodwater. Considering the annual average loss (AAL) as a reference risk metric (USACE, 1989), the risk is finally computed by estimating the impacted road length per year and the contaminated pipe length per year, as well as the delayed travellers and the not supplied population equivalent (PE) per year respectively.
2.1 Flood hazard, exposure and vulnerability analysis
The identification of compatible and representative metrics for both road network and WSS is one of the critical and original steps of this study (Table 1); this compatibility allows us to compare results for the silo-based analysis and, more importantly, to develop the interdependent analysis.
Flood hazard is represented by a map of flood parameters (intensity measures), usually water depths and flow velocity, for assigned probabilistic scenarios. Exposure is evaluated by intersecting hazard maps with GIS elements of the road and WSS networks. WSS nodes are assigned corresponding flood depths through raster zonal statistics. Active nodes, e.g. pumps or lifting stations, exposed to the flood, are modified in the WSS model and marked as failing to simulate the indirect impacts to the network (see Sect. 2.2). Similarly, road network segments, except those described as bridges or embankments, are assigned the flood depths for each inundation scenario.
Table 1Hazard, exposure, vulnerability and impact metrics for the studied linear infrastructures: WSS (water supply system) and road network. WD is the water depth.
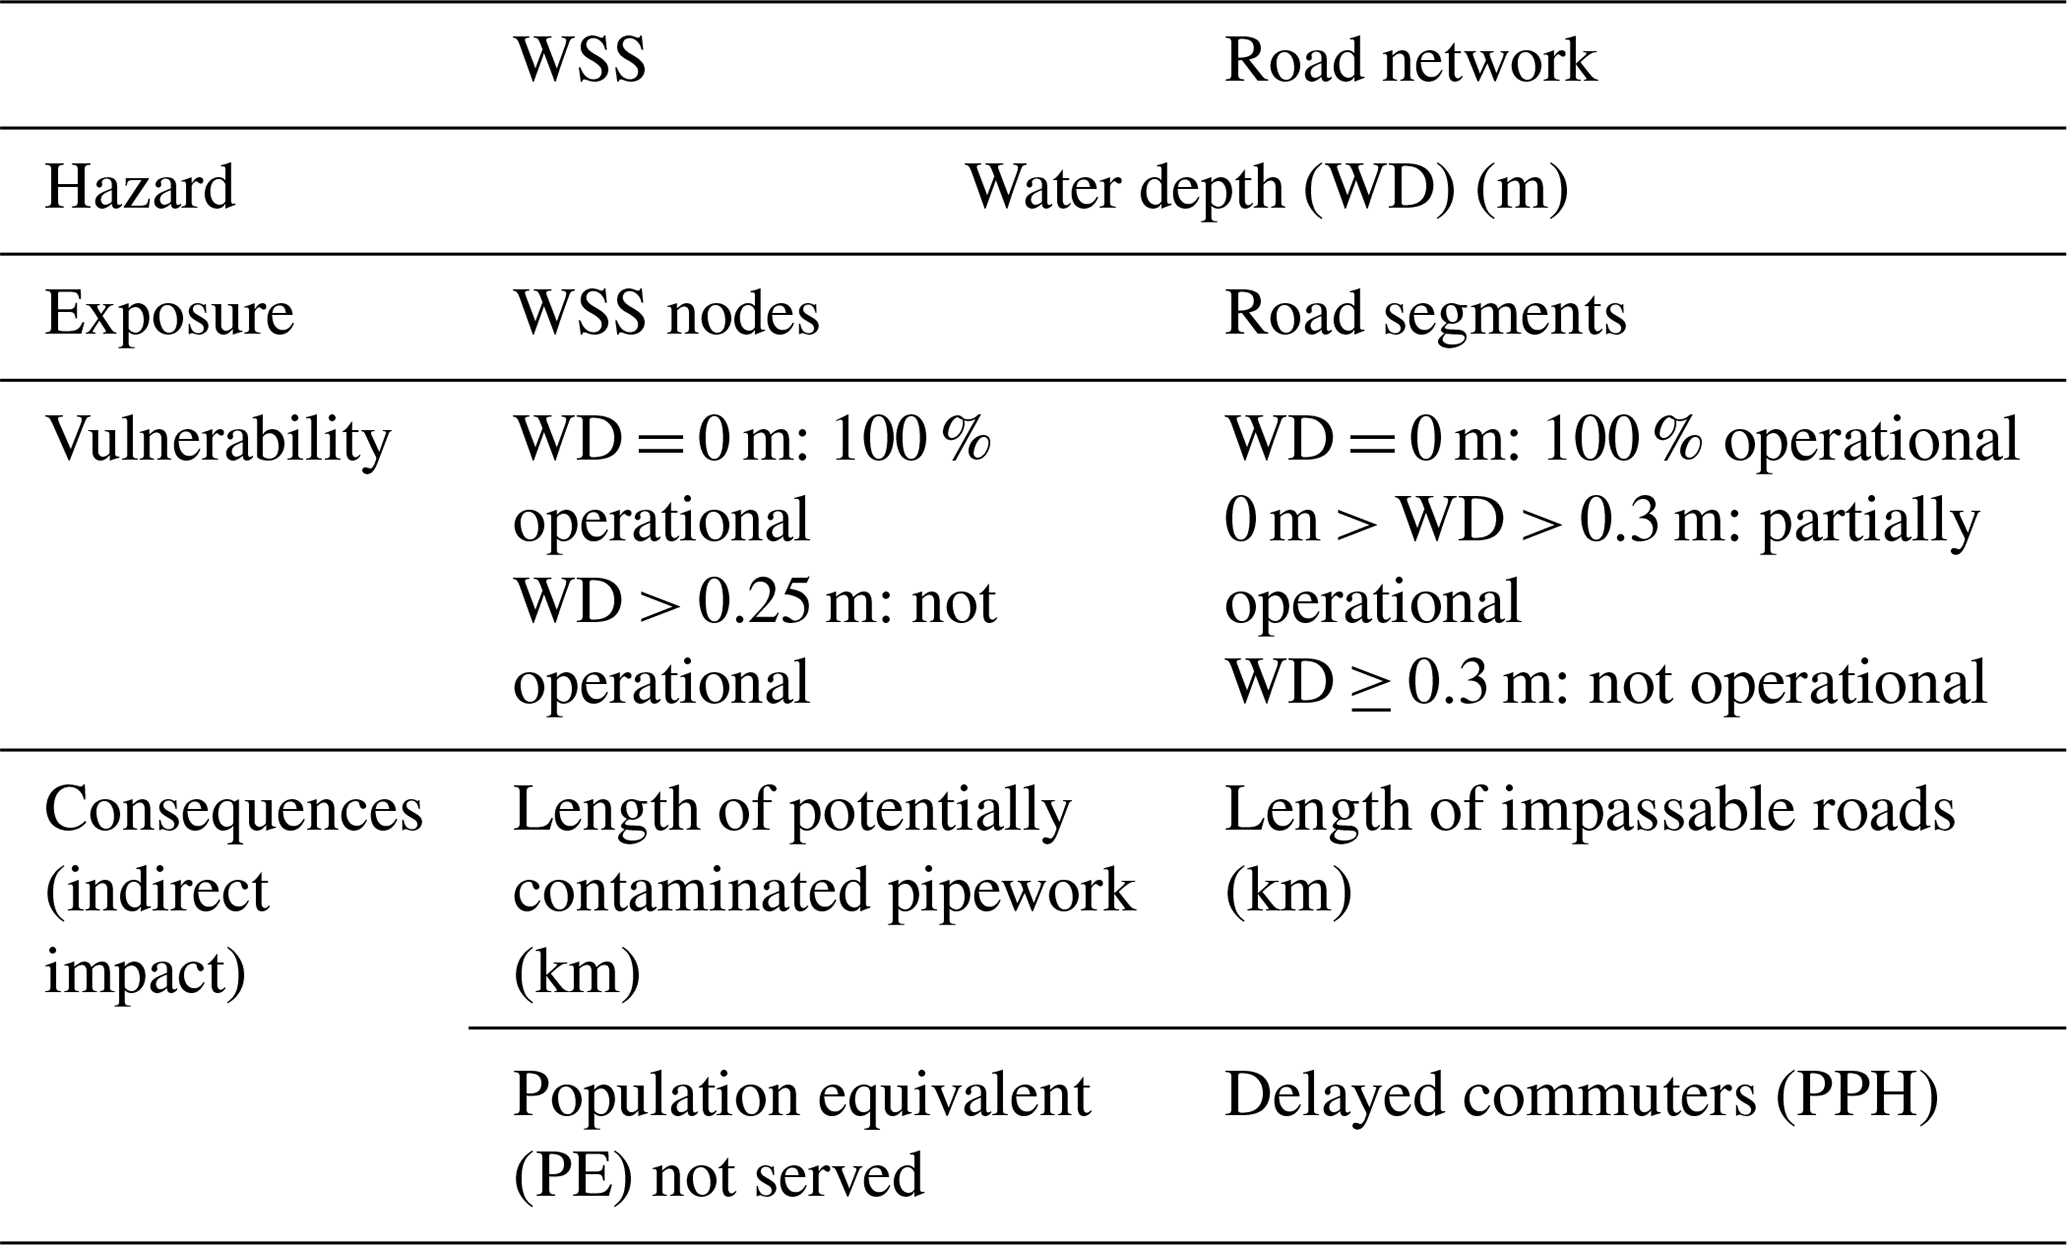
Regarding the hazard, water depth (m) is commonly referred as an intensity measure for flooding and adopted in this study. The exposed elements include the elements of the WSS and road system susceptible to water depth, respectively WSS nodes and road segments (including embankments, elevated roads and underpasses). Vulnerability is defined according to the type of node and road through the relationships shown in Table 1: (i) for WSS, a binary function determines a pumping station to be non-operational when this is touched by floodwater (Tarani et al., 2019); (ii) for the road network, a depth-disruption function computes the reduced velocity for vehicles travelling in flooded roads up to 0.3 m, i.e. the threshold of roadworthiness (Pregnolato et al., 2017b).
2.2 Indirect impacts and cascading assessment
On the basis of literature (see Sect. 1), two impact metrics are selected for assessing indirect impacts: (i) the length of the disrupted network and (ii) the population which experiences loss of service. The first metric can be easily converted into economic costs when replacement/repair costs per unit length are available; the second metric is more suitable to describe unmonetizable social costs (Arrighi et al., 2021).
For the WSS, the metrics are the length of potentially contaminated pipework and the population equivalent (PE) not served. PE is commonly defined as the ratio of the sum of the daily total demand to the individual demand of one person. In Italy, the individual demand for WSS design in cities is prescribed by standards and is about 200 L per day per inhabitant in average size cities. PE would coincide with the number of inhabitants for pure domestic water consumption. For the road network, these two metrics are respectively represented by the length of impassable roads and the delayed commuters. When assessing disruption impacts to road and rail, people per hour (PPH) delay is the metric used to account for both the time loss and the number of people affected (e.g. Network Rail, 2013): PPH is calculated by multiplying the number of hours transport means are delayed (e.g. private cars, a public transport service) by the number of users or passengers.
The WSS model is based on the freeware EPANET software, which calculates pressures at the nodes given a set of initial tank levels, pump switching criteria, base nodal demands and demand patterns. The standard EPANET simulations describe a demand-driven approach, which stems from the direct goal of simulating correctly operated networks. When simulating the failure of the network (e.g. in the case of the inundation of the main lifting station), a pressure-driven demand (PDD) approach is the most appropriate since the nodal demands are not attributed a priori; in fact, their value depends on the current local pressure.
In PDD models the nodal demand value depends on the current local pressure. In particular, and consistently with practice, the model assumes that each node is in one of the three following states: fully served (pressure equal to or higher than nominal pressure, partially served (positive pressure, but lower than nominal pressure) and not served (zero pressure) (see further details in Arrighi et al., 2017). It is thus possible to analyse the temporal dynamics of the pressures in the network and consequently the population not served. Further details on the PDD methodology can be found in Arrighi et al. (2017).
An integrated model that couples flood disruption and transport network is adopted to assess changes in time and distance in users' journey (Pregnolato et al., 2016, 2017a). Floodwater reduces the travelling speed of vehicles or stops traffic flows: roads are commonly considered closed when the flood depth reaches 30 cm (i.e. the depth at which a standard passenger car is unable to operate). In the model, underpasses are considered closed, and elevated roads, i.e. built on embankments, are considered completely functioning. The model evaluates the disruption to network links by comparing pre- and post-event travel times, applying an existing depth-disruption function for flooding (Pregnolato et al., 2017b) and a GIS–based accessibility model (Ford et al., 2015). For the flooded scenarios, the network properties of a link (i.e. travelling speed) are modified according to the function, and traffic parameters are recalculated for the perturbed state. Given that floodwater reduces travelling speed, journey travel time will increase in comparison with the baseline scenario, and eventually journeys are re-routed according to the quickest path (Dijkstra's algorithm – Dijkstra, 1959). A network service area (SA) defines a region that encompasses all accessible streets within a specified time impedance (e.g. a 5 min impedance SA of a point includes all the streets that can be reached within 5 min from that point); they can also be defined as isochrones of equal travel time (Achillopoulou et al., 2020). Pre- and post-event SAs helps to evaluate accessibility and accessibility changes due to flooding.
This study investigates the additional secondary impacts due to the interdependence between road system and the WSS by assessing the lack of accessibility to critical elements of the WSS such as pump stations, preventing repairs and replacements. The delay or the lack of repair/replacement greatly undermines the post-event recovery time.
One of the accepted definitions of resilience is the ability of overcome an impactful event and return to normal condition through a quick recovery (McClymont et al., 2020); the post-event recovery time is indeed a key metric of resilience. As shown in Fig. 3, the pre-event condition (segment 1–2) is the business-as-usual performance of the system where preparedness actions might be adopted. When the natural hazard occurs (2), the state of the system is altered by the impacts of the natural phenomenon, which lead to a reduction of the system performances (e.g. reduced road trafficability, reduced water pressure in pipes). The drop and recovery of the state may have different shapes (Fig. 3, curves a, b, c) according to the resilience of the system and the incorporation of the knowledge of cascade effects and interdependencies in preparedness and emergency plans. A low-resilience system, where preparedness and emergency plans are developed with a silo-based approach (c), is subjected to a sensibly higher reduction of system performances (2–3′′). In fact, unplanned emergency repairs or the activation of backup systems imply a slower recovery (3–4′′). This slow recovery could be due to the delays in assistance caused by the inaccessibility of WSS lifting stations due to flooded roads (silo-based), as well as a slow activation of emergency actions (low resilience).
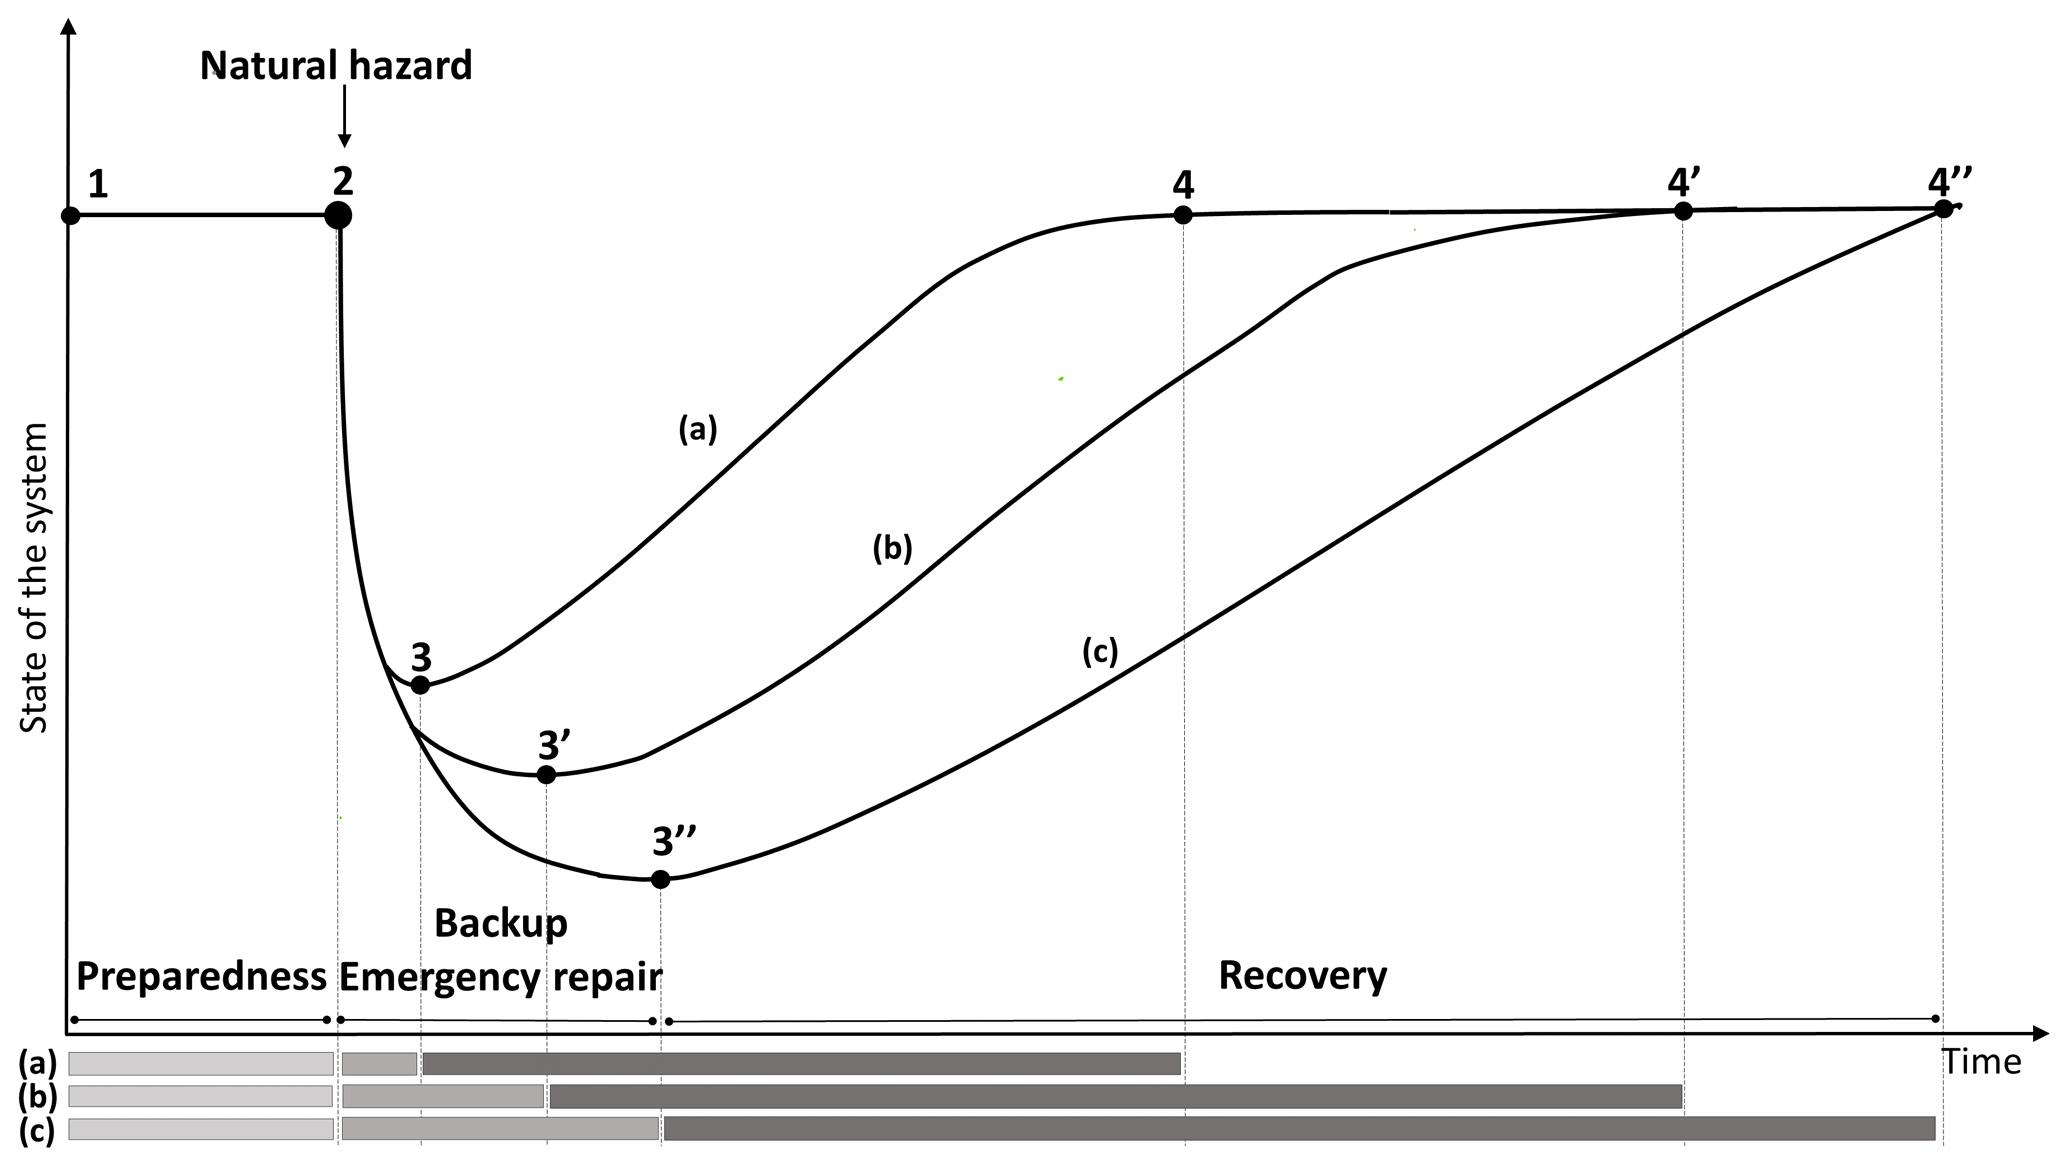
Figure 3Analysis of time windows pre-, during and post-flood event for high resilience with a system-based management approach (a), high resilience with a silo-based approach (b), and low-resilience with a silo-based approach (c). The delay or the lack of repair/replacement greatly undermines the post-event recovery (c).
Again, when emergency actions are promptly activated (high resilience) but there is a poor understanding of infrastructure interdependencies (silo-based) (Fig. 3, curve b) there are delays due to unpreparedness (2–3′).
If plans are developed with a systemic approach, cascading effects can be timely tackled (2–3), and the recovery phase shortens(Fig. 3, curve a), reducing indirect impacts and associated costs. Recovery time relates to the performance loss of the system because post-event recovery operations and necessary resources increase over time, e.g. disinfection flushing of WSS pipes for an increasingly larger portion of the network.
Timing is crucial for resilience to natural hazards; in a context of flood especially, adequate intervention can follow emergency plans which are activated by early warning systems. The identification of the most vulnerable pumping stations and streets allows one to plan accordingly in advance, by e.g. retrofitting some stations or developing emergency plans. The method developed by this study supports informed preparedness, which includes the identification of the pumping station(s) which should be reached in useful time for repair/replacement, reducing the breakdown time, increasing the speed of recovery and decreasing cascade effects.
The methodology is applied to the metropolitan area of Florence (Tuscany, Italy; 1 million inhabitants, of which about 37 % corresponds to the city of Florence). The area has a long record of floods since the Middle Ages and is still prone to inundations (Arrighi et al., 2018). For frequent events, only few municipalities downstream of Florence are inundated, whereas more severe scenarios (e.g. 200-year-event) affect the whole area, including the historic centre of Florence. From the hydrological point of view, this area is placed in the middle of the Arno catchment where the terrain morphology becomes flatter, the floodplain is wider and the riverbed is more affected by anthropogenic changes, i.e. crossings, contractions and rectifications. The wider metropolitan area of Florence includes the three provinces (counties) of Florence (FI), Prato (PO) and Pistoia (PT) (around 1000 km2 of extent), where the province of Florence covers about 40 % of the area. The municipality of Florence (city of Florence), the regional and Arno catchment authorities are involved in the flood risk management of the area, which accounts for prevention, mitigation and preparedness measures. In this work, the Arno River Basin Authority provided hazard information (Autorità di Distretto Appennino Settentrionale, 2016), i.e. water depth maps for four return periods (Tr) (30, 100, 200 and 500 years). The maps were developed by running a coupled 1D–quasi-2D hydraulic model in Hydrologic Engineering Center's River Analysis System (HEC-RAS). The river is simulated using the standard 1D solution of the De Saint-Venant equations, and it is connected to the floodplain through lateral structures described by weir laws. The floodplain is modelled as a system of interconnected storage cells with mass conservation and stage–volume relationships. Terrain altimetry is described by a 1 m resolution, lidar-derived digital terrain model (DTM) with 0.15 m vertical accuracy. More details can be found in Arrighi et al. (2013). The flood map for the worst-case scenario, i.e. 500-years recurrence interval, covers an area of 58 km2 that includes 11 municipalities within the metropolitan area. The data about the piping network (e.g. pipe diameter, nodes, demand at nodes, position and capacity of storage tanks, position and power of the pumps and lifting station) were provided by Publiacqua SpA, the society in charge of managing the integrated water cycle in the area.
The municipal WSS features one main treatment facility with a pumping station, 17 storage tanks, and 619 km of pipework connected by 4863 main nodes to supply drinking water for domestic and industrial use (Fig. 4). The main lifting station of the WSS system is located downstream of the treatment plant of the city as depicted in Fig. 4 with orange triangle symbols. It is equipped with six 710 kW pumps that ensure a maximum head of 60 m and feed the distribution network. The 17 storage tanks are mostly located at high altitudes and feature a total operative volume of 48 620 m3. The storage tanks are equipped with smaller pumps to ensure their day–night operativity. The number of people relying on the municipal WSS are about 800 000 and could reside outside the municipal administrative boundaries. Considering non-domestic use, the population equivalent of the system is about 874 000 (of which about half serves the non-permanent supply to Prato). In fact, the WSS provides fresh water to seven outer municipalities, namely Bagno a Ripoli, Calenzano, Campi Bisenzio, Impruneta, Prato, Sesto Fiorentino and Scandicci (Fig. 5c), to increase the WSS redundancies and tackle potential drought situations. The connections to Calenzano, Campi Bisenzio, Sesto Fiorentino and Scandicci are stable and supply the whole demand of these municipalities, whereas the WSS connection to Prato activates only in case of insufficient availability of the city groundwater-based water supply. The two municipalities of Bagno a Ripoli and Impruneta are partly supplied by the Florence WSS, which integrates other local sources.
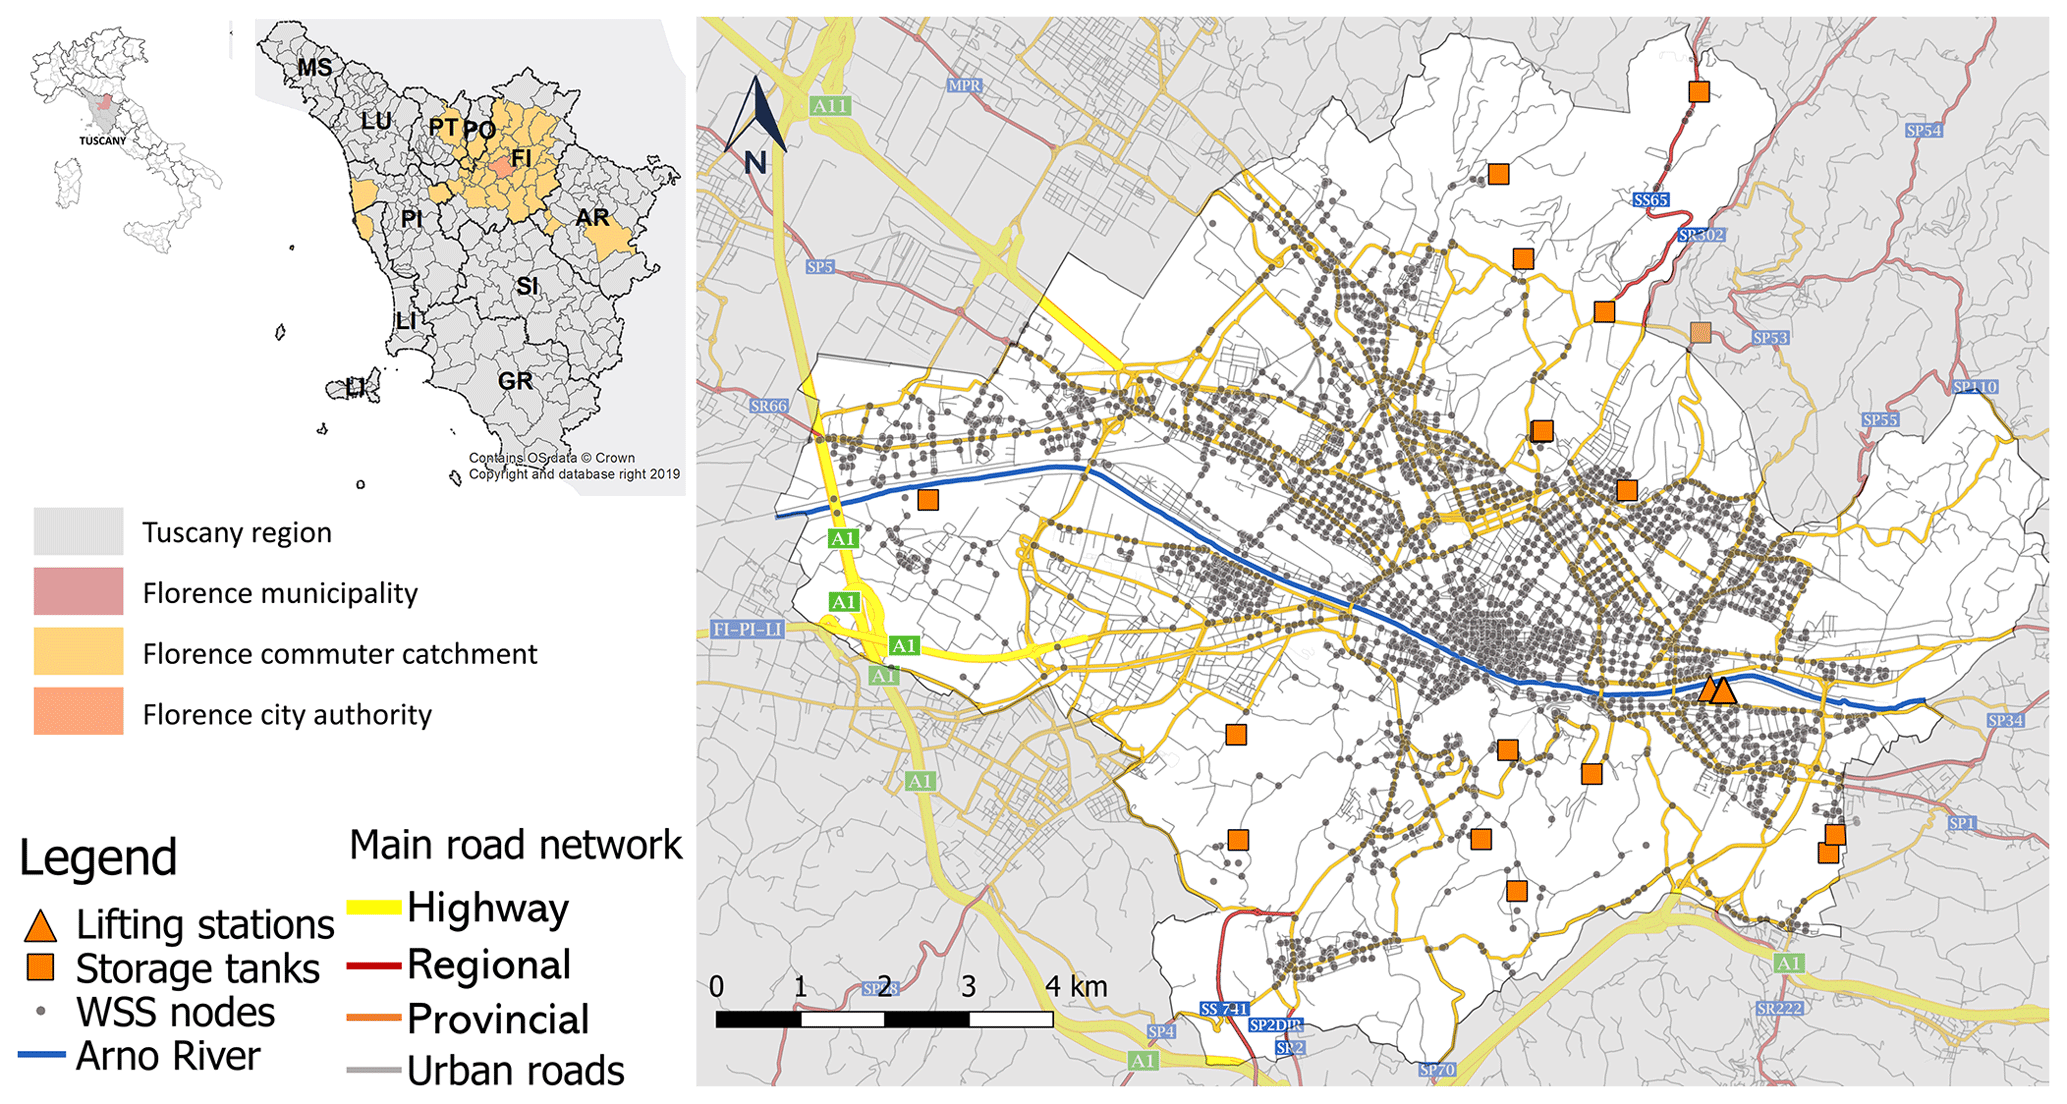
Figure 4Presentation of the study area: (a) Florence metropolitan area and its commuter catchment (Regione Toscana, 2015); (b) municipal WSS nodes, main treatment and lifting station; the road network system and Tuscany administrative boundaries (Regione Toscana cartographic portal). Abbreviations: MS – Massa-Carrara, LU – Lucca, PT – Pistoia, PO – Prato, FI – Florence, AR – Arezzo, PI – Pisa, SI – Siena, LI – Livorno, GR – Grosseto.
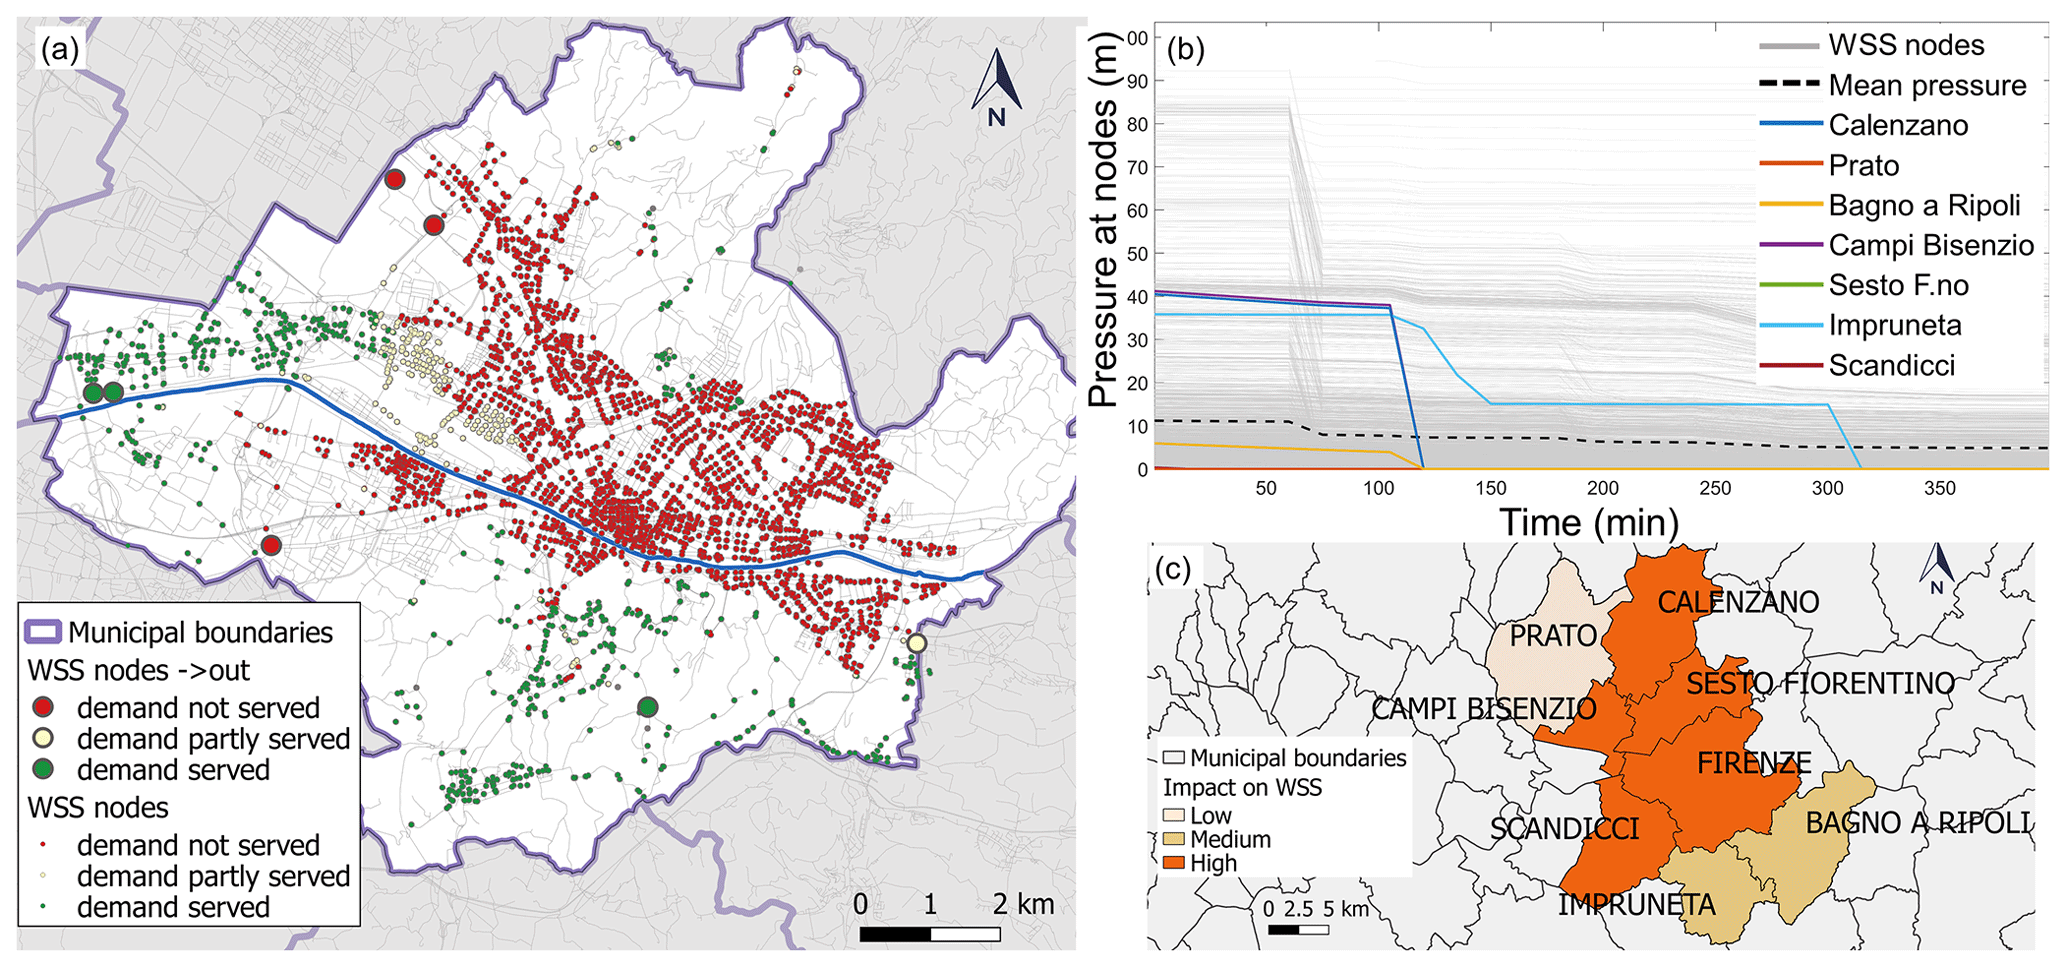
Figure 5A 200-year recurrence interval flood impact on WSS. (a) Pressure at nodes 120 min after the lifting station shutdown in Florence; (b) temporal dynamics of pressure at nodes in the WSS system with details of node links to outer municipalities; (c) severity of impact in all the municipalities (administrative boundaries source: Regione Toscana cartographic portal).
The road network information (road shapefile and associated attributes related to type, speed, etc.) and commuter data used in this study are openly available in the regional geographic data portal. The municipality of Florence underpins a wide commuter catchment, i.e. areas from which the city attracts people for working purposes. The municipality of Florence has the highest number of residents that (internally) commute daily and the biggest commuter catchment in Tuscany (3490 km2, 1 846 882 people); it includes 43 municipalities, 12 of which reside within the jurisdiction of other cities, i.e. Prato, Arezzo, Pistoia, Pisa and Livorno (Regione Toscana, 2015). The 79.5 % of commuting journeys are within 30 min (the highest percentage in the region), and the most common means of commuting is via private cars (63 %). The road network features more than 13 000 km of roads and more than 670 km in the (simulated) hazard area.
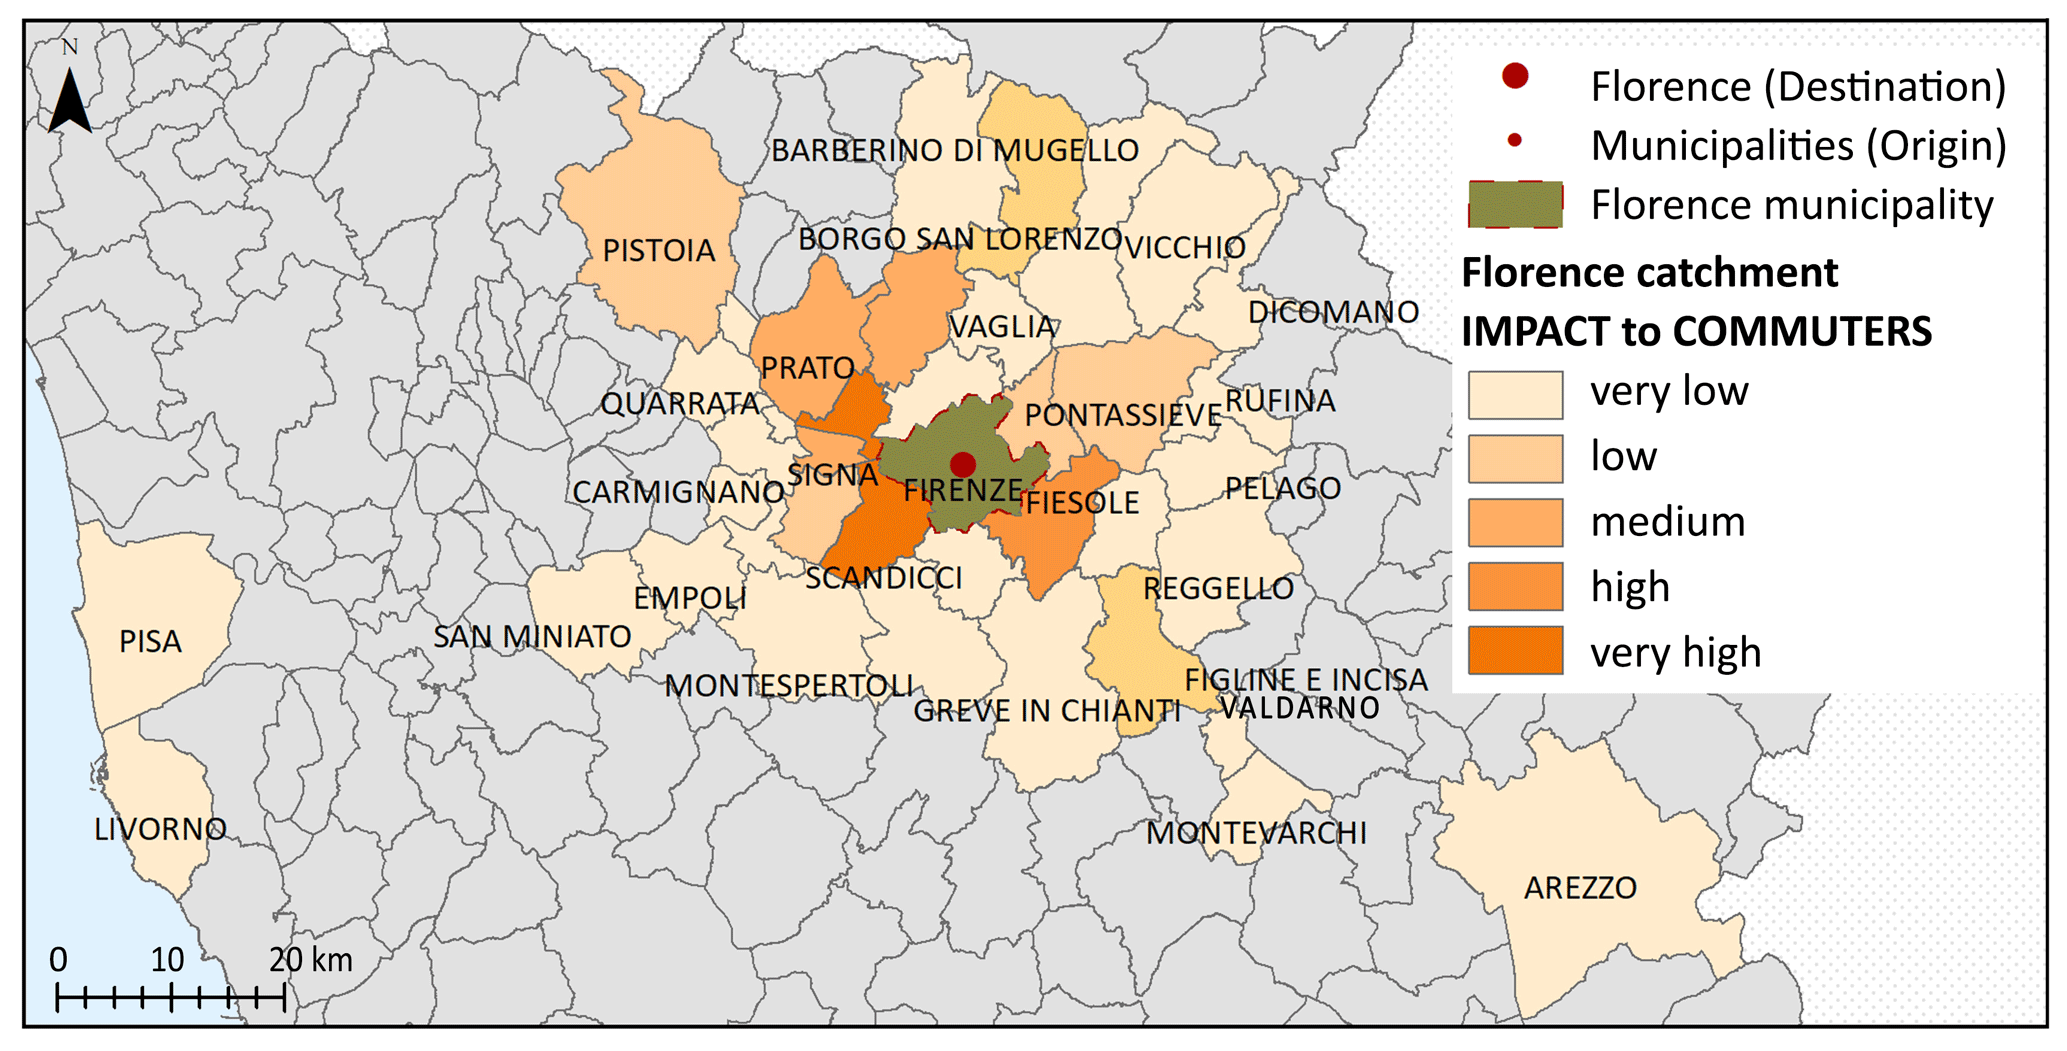
Figure 6The road network is impacted by flooding within and beyond the inundated area for a 1-in-200-year event: sensibly, the municipalities of these travellers are those in the hazard area (Signa, Campi Bisenzio and Poggio a Caiano). However, impact areas include also municipalities which are not contiguous to the hazard domain. Considering people per hour delay (PPH), the legend labels indicate the following: very low, up to 100 k PPH; low, 101–250 k PPH; medium, 251–1000 k PPH; high, 1001–1500 k PPH; very high, >1501 k PPH. Administrative boundaries source: Regione Toscana cartographic website.
4.1 Silo-based analysis
The case study analyses four recurrence interval scenarios. The central main pumping station, which draws water from the Arno river as main water resource, is not affected for low recurrence scenarios (i.e. Tr 30 and Tr 100). For Tr 200 the failure of the WSS lifting station causes the reduction of nodes pressures in the whole municipality, also far from the river and with effects on neighbouring municipalities. Initial storage tank levels are assigned with a warm-up simulation to reach a steady state of the system; these initial levels allow maintaining a partial functionality of the system. After 60 min from the inundation of the lifting station, the 23 % of the PE is not served, and about-one third of the pipes undergo potential contamination (which coincides with the first pressure drop). After 120 min, the nodes able to serve the nominal demand are limited to those supplied by storage reservoirs in the fringe of the Florence municipality (i.e. failure of the 60 % of the nodes, 47 % of PE not served) (Fig. 5a). The three nodes linked to the municipalities of Sesto Fiorentino, Prato, and Scandicci fail, and the node connecting Bagno a Ripoli has a residual partial functionality (Fig. 5a and b). If no remedial actions are taken, after 6 h from the onset of the event the disruption reaches 90 % of the nodes, and insufficient pressure affects 70 % of the Florence PE (i.e. 268 100 people only in one municipality, 3 times the flooded population). The impact to WSS is classified as “high” when the municipality is affected by a loss of functionality of the unique source of water supply, “medium” is when a municipality might rely upon an alternative water source but still will experience some loss of service and “low” is when the municipality does not experience loss of service. After 6 h from the onset of the event, all the links to outer municipalities are cut off, with the highest impacts for those municipalities which are not served by other sources and completely rely on the Florence WSS (Fig. 5c). Downstream neighbourhoods are served by local water tanks; also, they are favoured by lower terrain elevations; hence their nodes are affected later than those in the city centre (Fig. 5a, green dots). Overall, 428 km of pipework in the network, i.e. the 68 % of the whole WSS, is potentially contaminated due to null water pressure in this flood scenario.
Six hours after the shutdown, all the eight interconnected municipalities are affected (Table 2). The affected PE is larger than actual resident population in some municipalities, since there is also an industrial water demand, especially in Scandicci, Sesto Fiorentino and Campi Bisenzio. The municipality of Prato, which is not connected to the network in normal situations, is considered not affected. Errors in the estimation of PE affected are comparable to the variations of resident population in census data (updated every 10 years) and of the order of a few, negligible percent in this analysis since new urbanizations are limited.
Table 2Flooding impact on the WSS network 6 h after the shutdown, expressed as affected population equivalent (PE). WSS is not affected for Tr 30 and Tr 100. The table is ordered by descending impact.

Similarly, for the WSS analysis, the users of the road network are impacted by flooding within and outside the inundated area.
For example, for a 1-in-200-year event the critical depths on roads are reached within 30 min, and around the 78 % of roads in the hazard area is flooded, including 13 km of highways and 45 km of major roads (Fig. 6 and Table 3).
Table 3Flooding impact on the road network, expressed as population per hour delay (PPH). The 10 most-affected municipalities are shown; all results are shown in the Appendix. The table is ordered by descending impact.

Commuters from 37 municipalities are delayed while travelling to Florence. More than 10 % of commuters (>195 000 people) are affected by an increase in their travelling time by 50 %; reasonably, the municipalities of these travellers are those in the hazard area (Signa, Campi Bisenzio and Poggio a Caiano). The travelling times of the commuters of 29 municipalities (>63 % of all commuters, >1 million people) are increased by >10 %. However, impact areas include also municipalities which are not contiguous to the hazard domain – in the north (e.g. Calenzano, >132 500 people, ∼30 % time increase) and municipalities in the south-east (e.g. Bagno Ripoli, >167 700, ∼40 % time increase).
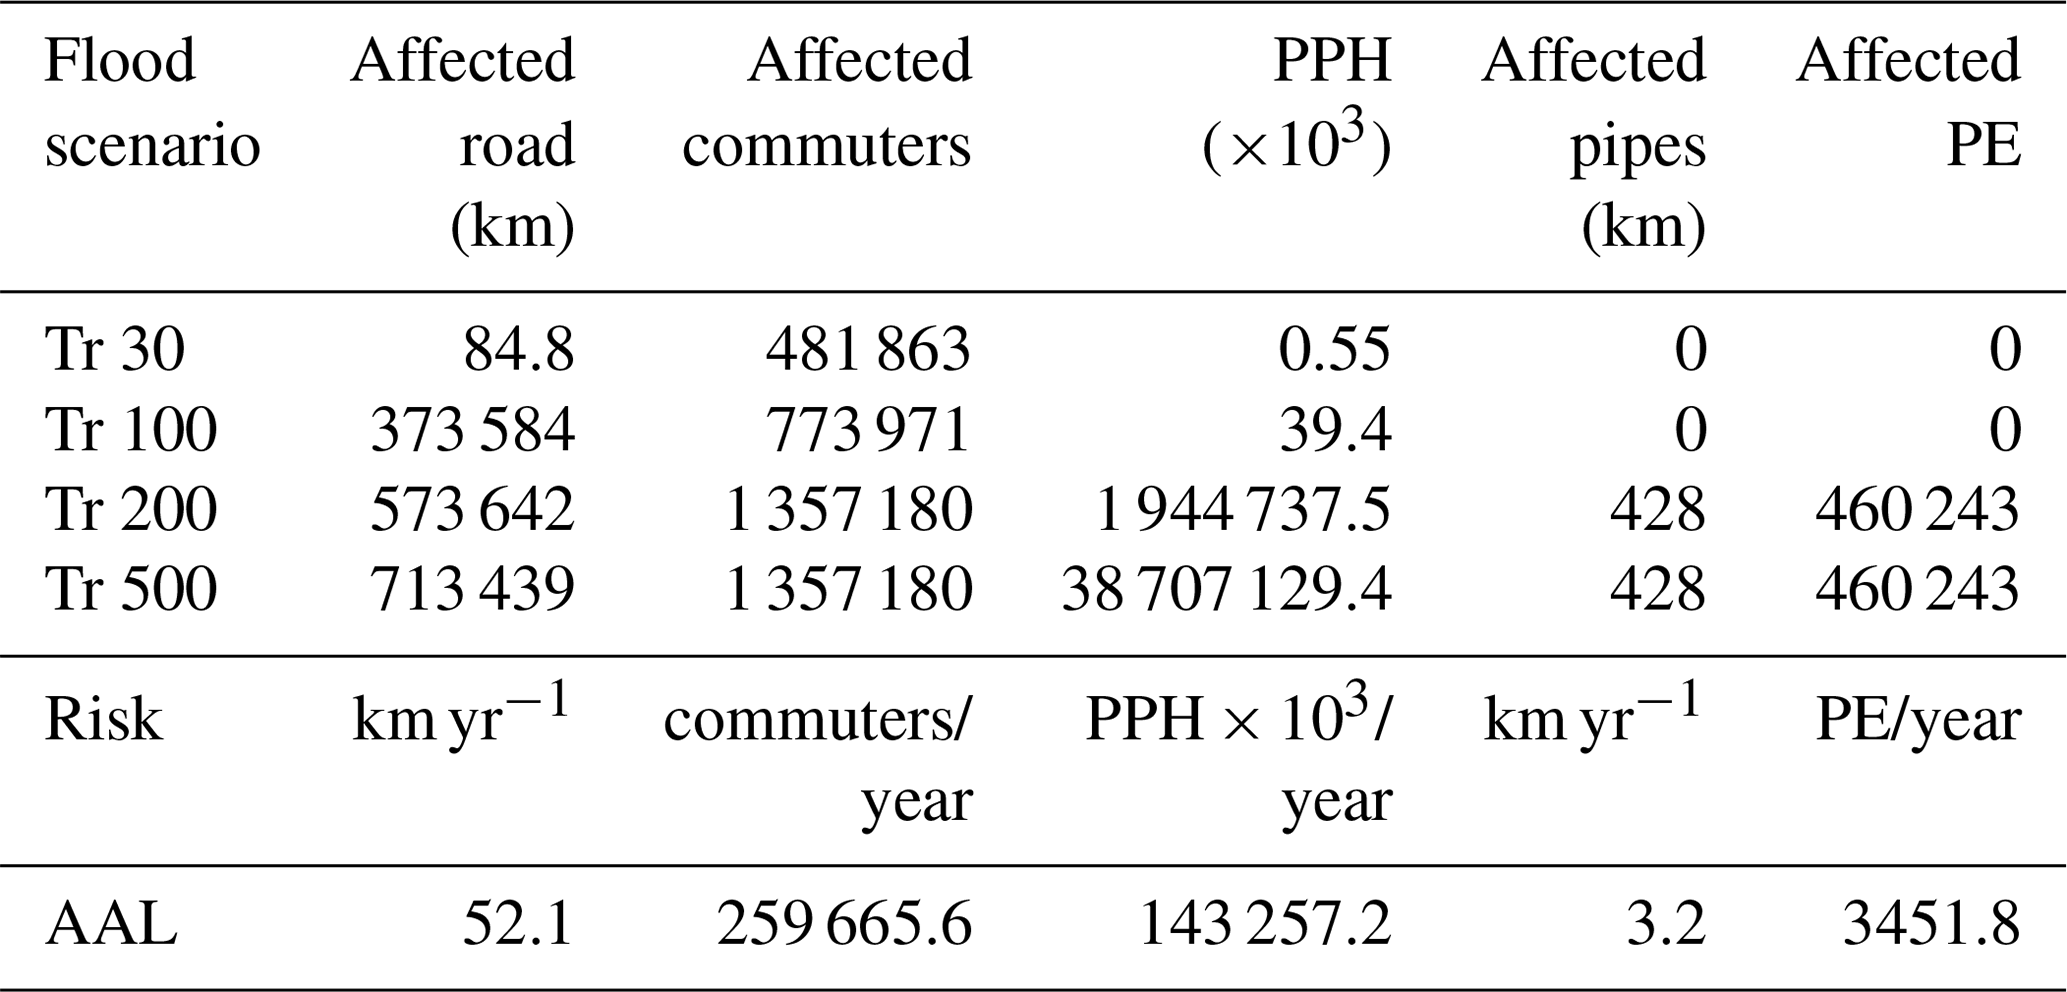
The annual average loss (AAL) is finally computed by estimating (i) the average impacted road length per year, (ii) the average contaminated pipe length per year, (iii) the annual average number of delayed travellers and (iv) the annual average number of population equivalent not supplied (Table 4). Overall, 52.1 km of roads and 3.2 km of pipes per year are affected in the study area; about 260 000 commuters and 3500 PE are yearly affected on average. The comparison between the impacts of the two networks clearly shows that, while roads are increasingly affected with increasing return periods, the WSS has a comparable impact for the two more severe events. In fact, for the WSS the trigger of indirect impacts is the inundation of the lifting station, which becomes almost independent from the flood scenario's intensity for Tr > 100 years.
Table 4Flood impacts for single scenarios and risk in terms of annual average loss (AAL) to road network and WSS in the study area considering a silo-based approach. (Abbreviations: PPH – population per hour delay; PE – population equivalent.)
4.2 Systemic analysis
The systemic analysis includes the modelling and assessment of indirect flooding impacts cascading through the WSS and road system of the city of Florence. Specifically, this study evaluates the consequences on the WSS due to the lack of accessibility, which prevents timely repairs and replacement at the WSS lifting stations.
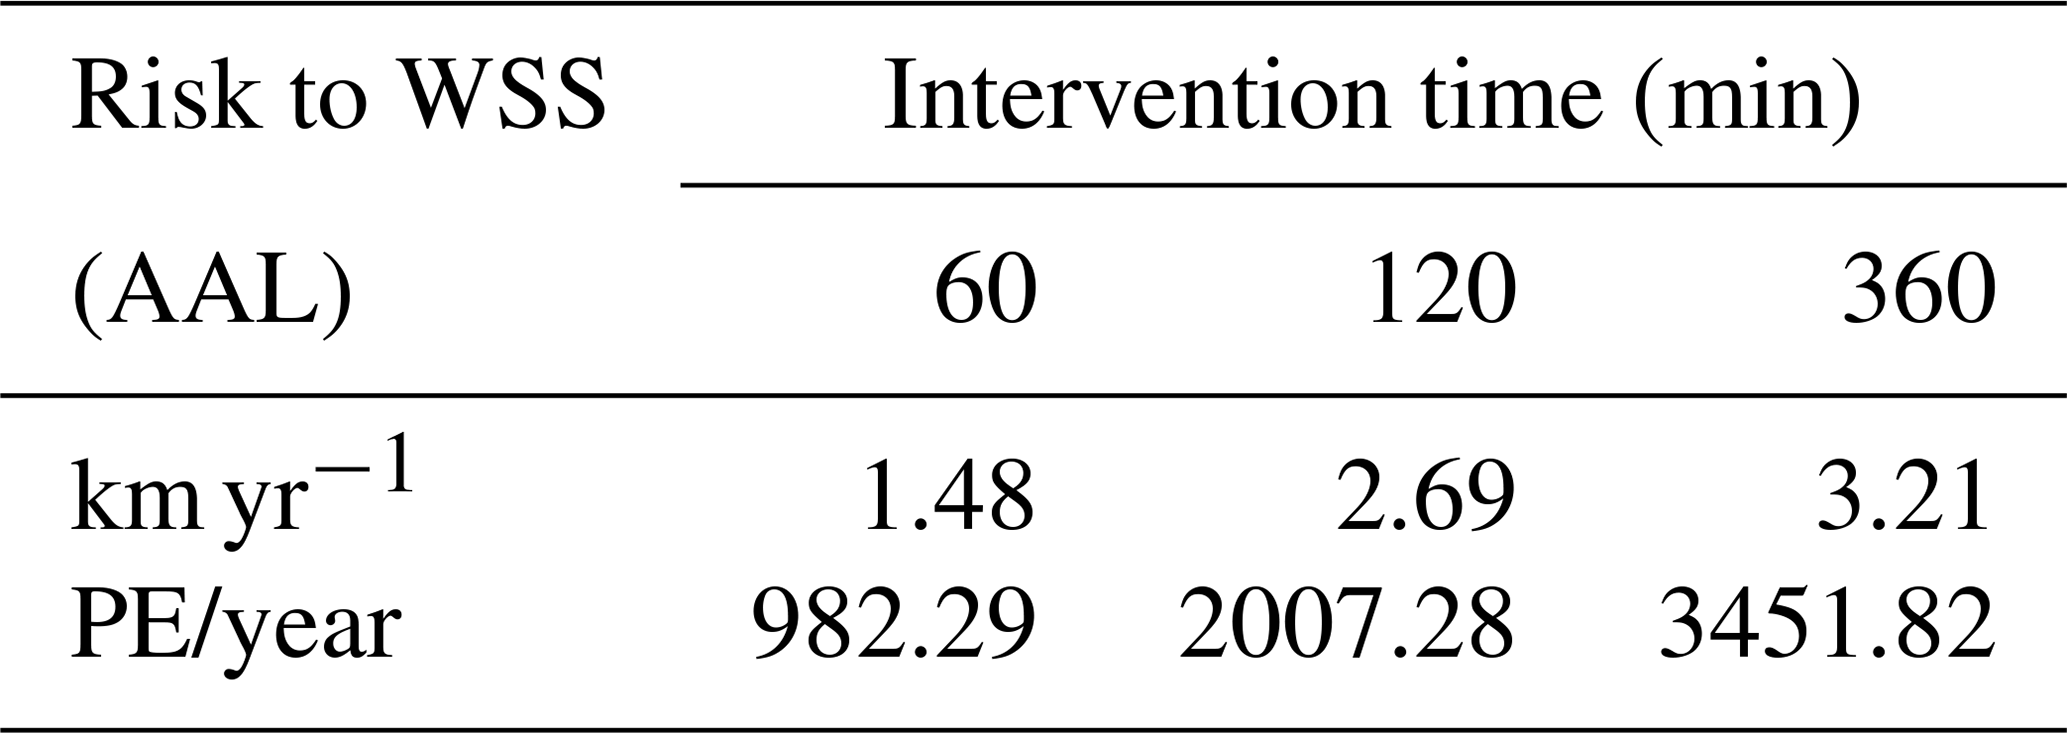
The WSS lifting stations should ideally be accessed for repairs before 60 min from the onset of the event because (i) about 33 % of the pipes undergoes contamination (Sect. 3.1) and (ii) ca. 90 % of the street becomes impassable (by reaching the 30 cm threshold of roadworthiness). At the latest, the main WSS lifting station needs to be repaired in 120 min, i.e. the backup time provided by storage reservoirs; sites in need of repairs would be reached by special vehicles, e.g. SUVs of the civil protection. Although those vehicles would permit higher wading depths in hydrostatic conditions, they are conservatively considered as common cars because water velocities are not simulated but play a crucial role in the loss of stability (Arrighi et al., 2019). The interdependency induces a systemic consequence which is higher than consequences of the single WSS or road system alone. In this case study, the systemic consequence consists in the increase in the recovery time, due to extended outage (due to the lack of repairs), which implies a lower resilience of the city (see Fig. 3). If preparedness and emergency plans are developed with a systemic risk knowledge (i.e. with a full understanding of cascade effects, interdependencies among networks and repairs in the 60 min before the onset of the event), the AAL of the WSS reduces to 982 PE/year (−71.5 %) and 1.5 km yr−1 (−53.1 %) in terms of PE and pipe length respectively. With remedial actions before 120 min, the AAL reduces to 2007 PE/year (−41.8 %) and 2.7 km yr−1 (−15.6 %) (Table 5).
Table 5Risk to WSS in terms in terms of annual average loss (AAL) for different intervention times (PE – population equivalent).
Service areas (SAs), or isochrones areas, are applied to understand which portions of the city are accessible within a given time, i.e. the impedance time (Green et al., 2017; Allen, 2018; El-Maissi et al., 2021). The impedance time for this case study is 8 min, as prescribed by the Italian emergency measures; this impedance time would allow for timely repairs. The SAs were calculated for the four hazard scenarios, considering 8 min of travelling (Fig. 7) and the max depth of water along the whole network. In baseline conditions (no disruption), both lifting stations A and B are easily accessible from most of the Florence municipality and beyond; the SA measures around 120 km2. For a 1-in-30-year event, the SA reduces to ca. 113 km2, and both stations are still well connected with the city. For a 1-in-200-year event, the accessibility level drops, and the SA shrinks to less than 5 km2: the lifting station B is no longer accessible, whereas station A can be reached from very few areas of Florence. For the most extreme event, i.e. a 1-in-500-year event, the SA is almost null and none of the stations are accessible.
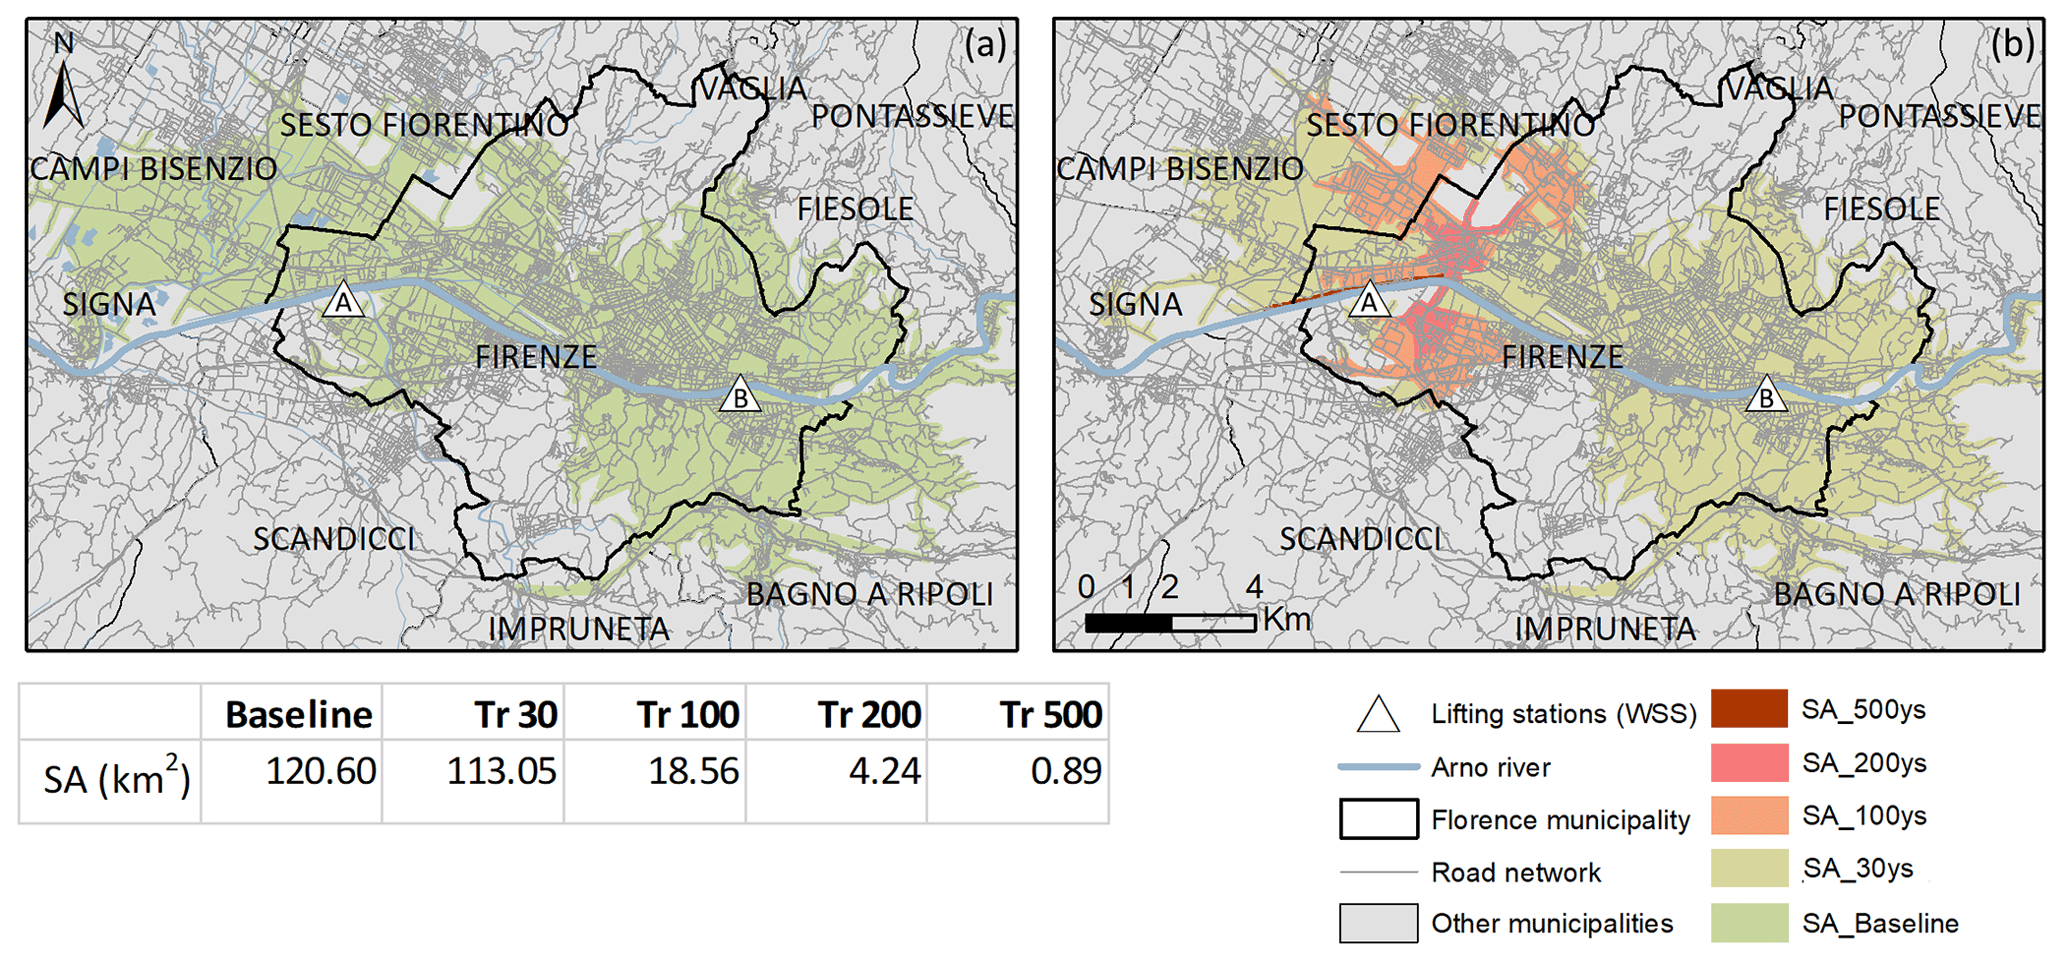
Figure 7Accessibility analysis for the lifting stations of the WSS system using service areas (SAs). The figure shows spatial visualization for (a) the baseline (no flooding) and (b) the four considered hazard scenarios. The A and B triangles are the lifting stations of the WSS. Administrative boundaries and road network source: Regione Toscana cartographic portal.
Results show that for extreme scenarios (Tr 200, Tr 500), road conditions do not allow one to reach both lifting stations on time, unless emergency vehicles are sent before critical depths are reached. Such an operation would happen if the city was prepared to act upon flooding events and actions were pre-planned. Although a lifting station is usually equipped with a backup engine generator to prevent power outages, this cannot work in submerged conditions; moreover, the flood duration might be longer than the duration of fuel availability for the engine generator. The first recommendation is then to develop ad hoc emergency plans by identifying potential critical hotspots which have interdependencies with other infrastructures and might act as risk multipliers, i.e. WSS lifting stations and their accessibility in case of floods. Secondly, to equip the WSS implants with vehicles for repairs that are more resistant than normal cars to water (e.g. four-wheel drive or SUVs – like the civil protection's cars) would allow one to reach sites normally cut off by floods. An alternative option would be to equip the implants with a water-resistant backup system, which increases the time window for repairs. The third recommendation is to enhance the system redundancy for those municipalities totally reliant on a single main system, with e.g. emergency water storage tanks, with respect to considering other factors such as costs or environmental impact.
The WSS and road transport system are two linear infrastructure systems, so they are comparable in terms of flood hazard and impact metrics. For example, the indirect impact respectively included pipework to be decontaminated and length of network affected (i.e. closed or reduced speed segments for roads), as well as the population disrupted by the loss of each service. However, within this study, the system's exposure to flood is measured differently, since the WSS system considers the number of nodes, while the road network features the road network length. Also, service disruptions can lead to different types of potential consequences: the population not served by WSS may experience health issues due to the lack of a basic resource, especially for more vulnerable categories; in the case of the road network, delayed commuters may experience difficulties in reaching their workplace, which can be converted to monetary loss (e.g. using the Value of Time, Vörös et al., 2016).
Moreover, the two infrastructure types have peculiarities in relation to the temporal and spatial scale. WSS disruption starts as soon as the lifting station (next to the river) is flooded (first significant pressure drop in the network in 60 min), while the road network is progressively flooded until reaching the maximum depths (3 to 6 h depending on location), alongside incremental disruption. For the WSS, the indirect impacts reached eight municipalities and impacted all the users (460 243 PE), excluding the Prato municipality, which does not rely on the nodes of the Florence municipality. For the road network, the indirect impacts affected all the commuters travelling to work in the Florence municipality (1 846 882 people), covering also areas which are not contiguous to Florence (Pisa, Livorno, Arezzo). Commuters settled in the eight municipalities affected by the WSS failures experience both disruptions; hence, if they decided to not travel to work upon an issued flood alert, they would experience a lack of water in their homes – due to the same flood event.
This case study highlighted the importance of identifying spatial and temporal thresholds to cascading effects; eventual failures of the WSS system should be addressed in a time window which includes the time to issue the alert, the time to reach the sites and the time to repair the equipment. For example, for the Florence case study, it would be ideal to repair the lifting station 60 min before the beginning of the event; in fact, after 60 min there is the first WSS pressure drop and the onset of the potential pipe contamination. An upper-end threshold would be to repair the WSS systems in 120 min, to avoid reaching the 70 % of node pressure dropping; however, potential contamination would still affect part of the network. Timely repairs to the WSS, assisted by the backup system, makes the difference between a high- and a low-resilience urban environment (Fig. 3).
This work focused on risk analysis; therefore it adopted the worst-case hazard map for each scenario by considering the maximum depth for each point. Static hazard maps (with maximum depth) are also currently typical for urban planning. However, this approach is not fully satisfactory when considering the complex dynamics of water runoff, water supply and traffic flow. A more advanced hydraulic modelling is suggested to produce dynamic hazard maps (with hazard time steps) and assist with a detailed modelling of infrastructure dynamics. In particular, this advanced modelling is seen as necessary for identifying actual emergency operations and plans, looking at fitting the time windows of the disruption. For example, the dynamics of flooding and accessibility are likely to significantly differ for Tr 200 and Tr 500: the high magnitude of Tr 500 would cause floodwater to stay on roads for a longer period, increasing the recovery time. A more sophisticated modelling for the road network is recommended too, for example by considering road congestions and traffic signals.
Additional work could estimate the risk for a wider range of probabilistic scenarios and investigate how the two infrastructure systems recover after the events. Further studies could also include the physical impact to road elements (such as bridges, e.g. Pregnolato et al., 2020), mitigation measure for the WSS and the interdependencies with a third infrastructural system (e.g. power supply). Future studies could particularly focus on the temporal element and scale of the risk analysis, to estimate e.g. operations time. Finally, pressure changes in the WSS network can cause ruptures of aqueduct pipes with consequent water flows in the roads; this cascading effect could be a further topic of future research.
This work presented the risk analysis of two linear infrastructure systems, namely the water distribution system (WSS) and the road network system. The study presents a real-world application to the city of Florence (Italy). The evaluation of indirect flood impacts on the two networks was carried out for four probabilistic scenarios (30, 100, 200 and 500 years), obtained by a coupled 1D–quasi-2D hydraulic model. A pressure-driven demand network model and a flood-transport network model were used for assessing the impacts on the WSS and the road network respectively. The analysis focused firstly on the identification of common impact metrics for both systems for hazard, exposure, vulnerability and (indirect) consequences. Secondly, the study adopted a “silo-based” approach to assess impact and risk to the WSS and road system as separated entities. Results showed that the impact of flooding to the two systems differs in both the spatial (up to 7 affected municipalities per WSS, 37 for the road system) and the temporal scale (60 min before first pressure drop, 30 min to reach critical depths on roads). Thirdly, a “systemic” approach was used to include interdependency and cascading effects, thus to assess impact and risk at the system level. When interdependencies are accounted for, results showed that the risk to the WSS in terms of population equivalent (PE/year) can be reduced by 71.5 % and 41.8 %, if timely repairs to the WSS stations are accomplished by 60 and 120 min respectively; the risk to the WSS in terms of pipes (km yr−1) reduced by 53.1 % and 15.6 %. The study highlighted that systemic risk-informed planning can support timely interventions and enhance infrastructure resilience; however, it is recommended to conduct further studies which focus on the complex dynamics of water runoff, water supply and traffic flows to support practical action planning.
All relevant and publicly available data are available in the Supplement. WSS network data cannot be redistributed. Data sources are clearly specified throughout the paper.
The supplement related to this article is available online at: https://doi.org/10.5194/nhess-21-1955-2021-supplement.
CA conceived the research work and developed the flood hazard, the vulnerability modelling of WSS, the AAL calculation for silo-based and systemic analyses. MP undertook the road network modelling and the service area analysis. CA and MP wrote the manuscript and produced the maps and schemes. FC supervised and reviewed the work.
The authors declare that they have no conflict of interest.
Maria Pregnolato acknowledges the Engineering and Physical Sciences Research Council (EPSRC; EP/R00742X/2). Authors acknowledge Publiacqua SpA for providing the sample network data and for the advice given as stakeholder. The source of GIS road and administrative data is the Regione Toscana cartographic portal (https://www502.regione.toscana.it/geoscopio/cartoteca.html, last access: 18 June 2021).
This paper was edited by Margreth Keiler and reviewed by two anonymous referees.
Achillopoulou, D. V., Mitoulis, S. A., Argyroudis, S. A., and Wang, Y.: Monitoring of transport infrastructure exposed to multiple hazards: A roadmap for building resilience, Sci. Total Environ., 746, 141001, https://doi.org/10.1016/j.scitotenv.2020.141001, 2020.
Alexander, D.: A magnitude scale for cascading disasters, International J. Disast. Risk Reduct., 30, 180–185, https://doi.org/10.1016/j.ijdrr.2018.03.006, 2018.
Allen, J.: Using network segments in the visualization of urban isochrones, Cartogr. Int. J. Geogr. Inf. Geovisual., 53, 262–270, 2018.
Arosio, M., Martina, M. L. V., Creaco, E., and Figueiredo, R.: Indirect Impact Assessment of Pluvial Flooding in Urban Areas Using a Graph-Based Approach: The Mexico City Case Study, Water, 12, 1753, https://doi.org/10.3390/w12061753, 2020.
Arrighi, C., Brugioni, M., Castelli, F., Franceschini, S., and Mazzanti, B.: Urban micro-scale flood risk estimation with parsimonious hydraulic modelling and census data, Nat. Hazards Earth Syst. Sci., 13, 1375–1391, https://doi.org/10.5194/nhess-13-1375-2013, 2013.
Arrighi, C., Tarani, T., Vicario, E., and Castelli, F.: Flood impacts on a water distribution network, Nat. Hazards Earth Syst. Sci., 17, 2109–2123, https://doi.org/10.5194/nhess-17-2109-2017, 2017.
Arrighi, C., Rossi, L., Trasforini, E., Rudari, R., Ferraris, L., Brugioni, M., and Castelli, F.: Quantification of flood risk mitigation benefits: A building-scale damage assessment through the RASOR platform, J. Environ. Manage., 207, 92–104, https://doi.org/10.1016/j.jenvman.2017.11.017, 2018.
Arrighi, C., Pregnolato, M., Dawson, R. J., and Castelli, F.: Preparedness against mobility disruption by floods, Sci. Total Environ., 654, 1010–1022, https://doi.org/10.1016/j.scitotenv.2018.11.191, 2019.
Arrighi, C., Pregnolato, M., and Castelli, F.: Flood impact on critical linear infrastructures, in: Proceedings of FLOODrisk 2020 – 4th European Conference on Flood Risk Management, Budapest, https://doi.org/10.3311/FLOODRisk2020.6.3, 2021.
Arrighi, C., Pregnolato, M. and Castelli, F.: Flood impact on critical linear infrastructures, in: FLOODrisk 2020, 4th European Conference on Flood Risk Management [online], https://doi.org/10.3311/FLOODRisk2020.6.3, 2021.
Autorità di Distretto Appennino Settentrionale: Piano di Gestione del Rischio Alluvioni, available at: http://www.appenninosettentrionale.it/itc/?page_id=410 (last access: 6 June 2020), 2016.
Balijepalli, C. and Oppong, O.: Measuring vulnerability of road network considering the extent of serviceability of critical road links in urban areas, J. Trans. Geogr., 39, 145–155, 2014.
Bartram, J., Corrales, L., Davison, A., Deere, D., Drury, D., Gordon, B., Howard, G., Rinehold, A., and Stevens, M.: Water Safety Plan Manual: Step-by-step risk management for drinking water suppliers, World Health Organization, Geneva, p. 108, https://doi.org/10.1111/j.1752-1688.1970.tb00528.x, 2009.
Byers, E. A., Qadrdan, M., Leathard, A., Alderson, D., Hall, J. W., Amezaga, J. M., Tran, M., Kilsby, C. G., and Chaudry, M.: Cooling water for Great Britain's future electricity supply, Proceedings ICE – Energy, 168, 188–204, 2015.
Casali, Y.: Topological Assessment of Changes in Road Network Systems in Time, under Discrete Flooding Events, and under Classes of Unexpected Disruptions, PhD Thesis, ETH Library, Zurich, https://doi.org/10.3929/ethz-b-000426547, 2020
Casali, Y. and Heinimann, H. R.: A topological characterization of flooding impacts on the Zurich road network, PLoS One, 14, e0220338, https://doi.org/10.1371/journal.pone.0220338, 2019.
Cheung, P., Van Zyl, J., and Reis, L.: Extension of epanet for pressure driven demand modeling in water distribution system, Comput. Control Water Ind., 1, 311–316, 2005.
De Bruijn, K. M., Maran, C., Zygnerski, M., Jurado, J., Burzel, A., Jeuken, C., and Obeysekera, J.: Flood resilience of critical infrastructures: approach and method applied to Fort Lauderdale, Florida, Water, 11, 517, https://doi.org/10.3390/w11030517, 2019.
Dijkstra, E. W.: A note on two problems in connexion with graphs, Numer. Math., 1, 269–271, https://doi.org/10.1007/BF01386390, 1959.
Dong, S., Mostafizi, A., Wang, H., Gao, J., and Li, X.: Measuring the topological robustness of transportation networks to disaster-induced failures: A percolation approach, Physica A, 538, 122971, 2019.
Dueñas-Osorio, L., Craig, J. I., Goodno, B. J., and Bostrom, A.: Interdependent response of networked systems, J. Infrastruct. Syst., 13, 185–194, 2007.
Ebacher, G., Besner, M.-C., and Prevost, M.: Negative Pressure Events in Water Distribution Systems: Public Health Risk Assessment Based on Transient Analysis Outputs (ASCE), ASCE, in: Water Distribution Systems Analysis 2010, ASCE Book Series, Reston, VA, 471–483, https://doi.org/10.1061/41203(425)45, 2010.
Ellison, D., Duranceau, P., Ancel, S., Deagle, G., and McCoy, R.: Investigation of pipe cleaning methods, in: vol. 1, AWWA Research Foundation and American Water Works Association, USA, available at: http://wwwtest.waterrf.org/PostingReportLibrary/90938.pdf (last access: 4 May 2017), 2003.
El-Maissi, A. M., Argyroudis, S. A., and Nazri, F. M.: Seismic Vulnerability Assessment Methodologies for Roadway Assets and Networks: A State-of-the-Art Review, Sustainability, 13, 61, https://doi.org/10.3390/su13010061, 2021.
Emanuelsson, M. A. E., McIntyre, N., Hunt, C. F., Mawle, R., Kitson, J., and Voulvoulis, N.: Flood risk assessment for infrastructure networks, J. Flood Risk Manage., 7, 31–41, 2014.
Evans, B., Chen, A. S., Djordjevic, S., Webber, J., Gonzalez-Gomez, A., and Stevens, J.: Investigating the effects of pluvial flooding and climate change on traffic flows in Barcelona and Bristol, Sustainability, 12, 2330, https://doi.org/10.3390/su12062330, 2020.
Falco, G. J.: City Resilience through Data Analytics: A Human-centric Approach, Proced. Eng., 118, 1008–1014, 2015.
Fekete, A.: Critical infrastructure and flood resilience: cascading effects beyond water, Water, 6, e1370, https://doi.org/10.1002/wat2.1370, 2019.
Ford, A., Barr, S., Dawson, R., and James, P.: Transport accessibility analysis using GIS: Assessing sustainable transport in London, ISPRS Int. J. Geo-Inform., 4, 124–149, 2015.
Gardner G.: The City: A System of Systems, in: State of the World. State of the World, Island Press, Washington, DC, https://doi.org/10.5822/978-1-61091-756-8_3, 2016.
Gil, J. and Steinbach, P.: From flood risk to indirect flood impact: evaluation of street network performance for effective management, response and repair, WIT Trans. Ecol. Environ., 118, 335–344, https://doi.org/10.2495/FRIAR080321, 2008.
Green, D., Yu, D., Pattison, I., Wilby, R., Bosher, L., Patel, R., Thompson, P., Trowell, K., Draycon, J., Halse, M., Yang, L., and Ryley, T.: City-scale accessibility of emergency responders operating during flood events, Nat. Hazards Earth Syst. Sci., 17, 1–16, https://doi.org/10.5194/nhess-17-1-2017, 2017.
Grossi, P. and Kunreuther, H.: Catastrophe modeling: a new approach to managing risk, Springer, New York, 2005.
Hilly, G., Vojinovic, Z., Weesakul, S., Sanchez, A., Hoang, D. N., Djordjevic, S., Chen, A. S., and Evans, B.: Methodological Framework for Analysing Cascading Effects from Flood Events: The Case of Sukhumvit Area, Bangkok, Thailand, Water, 81, 1–26, https://doi.org/10.3390/w10010081, 2018.
Holden, R., Val, D. V., Burkhard, R. and Nodwell, S.: A network flow model for interdependent infrastructures at the local scale, Saf. Sci., 53, 51–60, https://doi.org/10.1016/j.ssci.2012.08.013, 2013.
Kellermann, P., Schönberger, C., and Thieken, A. H.: Large-scale application of the flood damage model RAilway Infrastructure Loss (RAIL), Nat. Hazards Earth Syst. Sci., 16, 2357–2371, https://doi.org/10.5194/nhess-16-2357-2016, 2016.
Kermanshah, A. and Derrible, S.: Robustness of road systems to extreme flooding: using elements of GIS, travel demand, and network science, Nat. Hazards, 86, 151–164, 2017.
Koks, E. E., Rozenberg, J., Zorn, C., Tariverdi, M., Vousdoukas, M., Fraser, S. A., Hall, J. W., and Hallegatte, S.: A global multi-hazard risk analysis of road and railway infrastructure assets, Nat. Commun., 10, 2677, https://doi.org/10.1038/s41467-019-10442-3, 2019.
Kong, J. and Simonovic, S. P.: A model of interdependent infrastructure system resilience, Int. J. Safe. Secur. Eng., 8, 377–389, https://doi.org/10.2495/SAFE-V8-N3-377-389, 2018.
Lhomme, S., Serre, D., Diab, Y., and Laganier, R.: Analyzing resilience of urban networks: a preliminary step towards more flood resilient cities, Nat. Hazards Earth Syst. Sci., 13, 221–230, https://doi.org/10.5194/nhess-13-221-2013, 2013.
Li, J., Shi, C. L., Chen, C. K., and Dueñas-Osorio, L.: A cascading failure model based on AC optimal power flow: Case study, Physica A, 508, 313–323, 2018.
Lyu, H. M., Sun, W. J., Shen, S. L., and Arulrajah, A.: Flood risk assessment in metro systems of mega-cities using a GIS-based modeling approach, Sci. Total Environ., 626, 1012–1025, 2018.
McClymont, K., Morrison, D., Beevers, L., and Carmen, E.: Flood resilience: a systematic review, J. Environ. Plan. Manage., 63, 1151–1176, https://doi.org/10.1080/09640568.2019.1641474, 2020.
Network Rail: Technical overview: Payments relating to disruption, Network Rail, UK, available at: https://www.shorturl.at/ (last access: 26 April 2021), 2013.
Pant, R., Thacker, S., Hall, J. W., Alderson, D., and Barr, S.: Critical infrastructure impact assessment due to flood exposure, J. Flood Risk Manage., 11, 22–33, 2018.
Pescaroli, G.: Perception of cascading risk and interconnected failures in emergency planning: implications for operational resilience and policy making, Int. J. Disast. Risk Reduct., 30, 269–280, https://doi.org/10.1016/j.ijdrr.2018.01.019, 2018.
Petit, F., Verner, D., Brannegan, D., Buehring, W., Dickinson, D., Guziel, K., Haffenden, R., Phillips, J., and Peerenboom, J.: of Critical Infrastructure Dependencies and Interdependencies, Argonne National Laboratory, Global Security Sciences Division, ANL/GSS-15/4, Argonne, Illinois, USA, available at: https://publications.anl.gov/anlpubs/2015/06/111906.pdf (last access: 21 May 2020), 2015.
Pregnolato, M. and Dawson, D.: Adaptation investments for transport resilience: trends and recommendations, Int. J. Safe. Secur. Eng., 8, 515–527, https://doi.org/10.2495/SAFE-V8-N4-515-527, 2018.
Pregnolato, M., Ford, A., Robson, C., Glenis, V., Barr, S., and Dawson, R. J.: Assessing urban strategies for reducing the impacts of extreme weather on infrastructure networks, Roy. Soc. Open Sci., 3, 1–15, 2016.
Pregnolato, M., Ford, A., Glenis, V., Wilkinson, S., and Dawson, R. J.: Impact of Climate Change on Disruption to Urban Transport Networks from Pluvial Flooding, J. Infrastruct. Syst., 23, 1–13, 2017a.
Pregnolato, M., Ford, A., Wilkinson, S. M., and Dawson, R. J.: The impact of flooding on road transport: a depth-disruption function, Transp. Res. D, 55, 67–81, 2017b.
Pregnolato, M., Winter, A. O., Mascarenas, D., Sen, A. D., Bates, P., and Motley, M. R.: Assessing flooding impact to riverine bridges: an integrated analysis, Nat. Hazards Earth Syst. Sci. Discuss. [preprint], https://doi.org/10.5194/nhess-2020-375, in review, 2020.
Ouyang, M.: Review on modeling and simulation of interdependent critical infrastructure systems, Reliab. Eng. Syst. Safe., 121, 43–60, 2014.
Regione Toscana: Ufficio Statistica: Pendolarismo per motivi di lavoro o studio in Toscana, available at: https://bit.ly/3eHEawp (last access: 23 March 2020), 2015.
Rinaldi, S. M., Peerenboom, J. P., and Kelly, T. K.: Identifying, understanding and analysing critical infrastructure interdependencies, IEEE Control Syst. Mag., 21, 11–25, 2001.
Serre, D. and Heinzlef, C.: Assessing and mapping urban resilience to floods with respect to cascading effects through critical infrastructure networks, Int. J. Disast. Risk Reduct., 30, 235–243, https://doi.org/10.1016/j.ijdrr.2018.02.018, 2018.
Siew, C. and Tanyimboh, T. T.: Pressure-dependent EPANET extension, Water Resour. Manage., 26, 1477–1498, 2012.
Singh, P., Sinha, V. S. P., Vijahni, A., and Pahuja, N.: Vulnerability assessment of urban road network from urban flood, Int. J. Disast. Risk Reduct., 28, 237–250, 2018.
Tarani, F., Arrighi, C., Carnevali, L., Castelli, F., and Vicario E.: Flood resilience of a water distribution system, Resilience of Cyber-Physical Systems, Spirnger, Cham, Switzerland, 177–194, 2019.
United Nations: Sendai Framework for Disaster Risk Reduction 2015–2030, Geneva, 2015.
USACE: Expected annual flood damage computation, available at: https://www.hec.usace.army.mil/publications/ComputerProgramDocumentation/CPD-30.pdf (last access: 5 February 2021), 1989.
Vörös, T., Juhász, M., and Koppány, K.: The measurement of indirect effects in project appraisal, Transport. Res. Proced., 13, 114–123, https://doi.org/10.1016/j.trpro.2016.05.012, 2016.
Winter, M. G., hearer, B., Palmer, D., Peeling, D., Harmer, C., and Sharpe, J.: The Economic Impact of Landslides and Floods on the Road Network, Proced. Eng., 143, 1425–1434, 2016.
Zio, E.: Challenges in the vulnerability and risk analysis of critical infrastructures, Reliab. Eng. Syst. Safe., 152, 137–150, 2016.