the Creative Commons Attribution 4.0 License.
the Creative Commons Attribution 4.0 License.
 | 18 Jun 2021
Global ground strike point characteristics in negative downward lightning flashes – Part 2: Algorithm validation
Dieter R. Poelman
Stephane Pedeboy
Leandro Z. S. Campos
Michihiro Matsui
Dustin Hill
Marcelo Saba
Hugh Hunt
At present the lightning flash density is a key input parameter for assessing the risk of occurrence of a lightning strike in a particular region of interest. Since it is known that flashes tend to have more than one ground termination point on average, the use of ground strike point densities as opposed to flash densities is more appropriate. Lightning location systems (LLSs) do not directly provide ground strike point densities. However, ingesting their observations into an algorithm that groups strokes into respective ground strike points results in the sought-after density value. The aim of this study is to assess the ability of three distinct ground strike point algorithms to correctly determine the observed ground-truth strike points. The output of the algorithms is tested against a large set of ground-truth observations taken from different regions around the world, including Austria, Brazil, France, Spain, South Africa and the United States of America. These observations are linked to the observations made by a local LLS in order to retrieve the necessary parameters of each lightning discharge, which serve as input for the algorithms. Median values of the separation distance between the first stroke in the flash and subsequent ground strike points are found to vary between 1.3 and 2.75 km. It follows that all three of the algorithms perform well, with success rates of up to about 90 % to retrieve the correct type of the strokes in the flash, i.e., whether the stroke creates a new termination point or follows a pre-existing channel. The most important factor that influences the algorithms' performance is the accuracy by which the strokes are located by the LLS. Additionally, it is shown that the strokes' peak current plays an important role, whereby strokes with a larger absolute peak current have a higher probability of being correctly classified compared to the weaker strokes.
- Article
(1077 KB) - Full-text XML
- BibTeX
- EndNote


Severe weather has always been around. However, its global impact on both society and economies is increasing steadily, with no signs of decline whatsoever in the future. More specifically, the deleterious effects of lightning discharges should not be underestimated. In this respect, cloud-to-ground (CG) flashes play a particular part since they have an enormous impact on nature and society, both directly and indirectly. Besides lightning-caused fatalities and injuries that are reported each year worldwide (Curran et al., 2000; Holle et al., 2005; Holle, 2016), it is a well-known fact that lightning is a major cause of, for example, wildfires when the conditions to ignite fire near the vicinity of the ground strike point are fulfilled (Balch et al., 2017; Schultz et al., 2019). Moreover, the economic effects of lightning damage on property are immense, whether concerning an individual household or a large-sized company, with total costs that can quickly spiral out of control. In this matter, electrical appliances are vulnerable to the electromagnetic fields induced by lightning. Additionally, to name but one other example, the search for alternative ways of generating energy has led to the construction of vast amounts of wind turbines and wind and solar farms all over the world. It has been demonstrated by Montanyà et al. (2014) by analyzing lightning mapping array (LMA) observations in Spain that the rotating blades of wind turbines can trigger lightning, thereby causing self-induced damage. Not to mention the detrimental effects of lightning in other areas such as aviation, it is clear that adequate lightning protection measures need to be put in place to mitigate the effects of lightning impacts. For a comprehensive overview of lightning hazards to human societies the interested reader is referred to Koshak et al. (2015) and Yair (2018).
Over the years, our knowledge of thunderstorms has greatly improved, not least in the field of lightning. By means of high-speed cameras, it has been observed that roughly half of downward negative CG multiple-stroke flashes exhibit more than one ground strike point (GSP), with an average value varying from around 1.5 to 1.7 GSPs per flash (Rakov et al., 1994; Hermant, 2000; Valine and Krider, 2002; Saraiva et al., 2010; Poelman et al., 2021). This implies that the average number of lightning strike points is about 50 % to 70 % higher than the observed number of flashes. Additionally, the distance between the different GSPs and the first stroke in the flash is of the order of a few kilometers (Thottappillil et al., 1992; Valine and Krider, 2002; Stall et al., 2009). It follows that every ground strike point is a potential threat, and therefore ground strike points ought to be taken into account when it comes to lightning risk estimation for lightning protection.
Nowadays the primary input parameter in lightning risk assessment applications is the lightning flash density, NG. The latter is defined as the number of CG flashes . In the past, an empirical formula was applied to infer NG from the keraunic level of thunderstorm days. However, progress made over the years to detect lightning discharges by means of lightning location systems (LLSs) has led to NG being determined from the ground flash measurements by LLSs. By definition, the location of a flash has historically been determined by that of the first stroke in the flash, although some LLSs use the centroid of the strokes' locations. Taking into account that on average more than one GSP is observed per flash, it follows that the use of NG in the risk calculation of lightning protection leads to an underestimation of the hazard. It is for this reason that NG should be replaced by the lightning strike point density. Nowadays LLSs provide stroke locations with median accuracies on the order of a few hundred meters or better; hence LLSs can provide strike point densities after applying a dedicated algorithm to group the individual strokes within a flash into ground strike points. This is in particular helpful to further improving the risk estimation for lightning protection since it is derived from the density of lightning ground strike points in a region.
In this study, three different ground strike point algorithms are tested against a large set of high-speed video measurement data from multiple regions to find the algorithms' ability to determine the observed ground strike points correctly. In Sects. 2 and 3 the different lightning location systems and ground-truth data sets, respectively, are described, followed by the characteristics of the algorithms in Sect. 4. In Sect. 5 the results are discussed, and Sect. 6 summarizes the study and draws some further conclusions.
The ground-truth data sets outlined in Poelman et al. (2021) and gathered in Austria (AT) in 2012, 2015, 2017 and 2018; Brazil (BR) in 2008; South Africa (SA) in 2017–2019; and the United States of America (US) in 2015 serve among others as input for the ground strike point algorithms described further in Sect. 3. In addition, two extra ground-truth data sets collected in France (FR) during 2013–2016 and Spain (ES) in 2017–2018 are included in this study. Whereas the flash grouping is based on the high-speed video images, the information of, e.g., location, peak current and the semi-major axis of the 50 % confidence ellipse is retrieved by linking the ground-truth data to the observations made by a local ground-based LLS. In this section, the different LLSs are briefly described.
2.1 ALDIS
The Austrian Lightning Detection and Information System (ALDIS) operates a sensor network of eight low-frequency (LF) lightning detection sensors in Austria while the central processor ingests additional sensors from neighboring countries. In addition, ALDIS is partly known for its continuous work related to the European Cooperation for Lightning Detection (EUCLID), recognized as one of the best-documented networks in Europe in terms of location accuracy (LA) and detection efficiency (DE) estimates. This is made possible partly due to the observations made at the instrumented Gaisberg Tower in Austria and supplemented by mobile video and field recording system (VFRS) observations in Austria, as well as throughout Europe. Due to continuous adaptation and improvement of the system with ongoing hardware and software upgrades, the median LA is in the range of 100 m (for more detailed information see Schulz et al., 2016; Poelman et al., 2016; Diendorfer, 2016).
2.2 Météorage
The French national LLS has been operated by Météorage (MTRG) since 1986. It detects low-frequency electromagnetic signals generated by CG lightning, as well as a fraction of large-amplitude intracloud discharges, in much the same way as ALDIS. In the beginning, the LLS was made up of sensors placed only in France. Over the years this core network has expanded with compatible sensors of neighboring partners, providing seamless extended observation coverage over western Europe. In this study, the LLS of MTRG is used to match the ground-truth observations taken in France and Spain. DE and LA values similar to the ones stated above for OVE-ALDIS are applicable for this network.
2.3 RINDAT
At the time the ground-truth observations used in this work were carried out, the Brazilian Lightning Detection Network (RINDAT) was composed of a mix of 47 sensors. The network has evolved somewhat since then resulting in improved network performance. Nevertheless, a stroke and flash DE of RINDAT of 55 % and 87 %, respectively, was reported by Ballarotti et al. (2006). Additionally, an upper limit on the LA was retrieved of about 5 km. More information on the characteristics of the network is given by Naccarato and Pinto (2009).
2.4 SALDN
The South African Lightning Detection Network (SALDN) was first installed in South Africa in 2006 by the South African Weather Service (SAWS), originally consisting of 19 Vaisala LS7000 sensors spread across the country. The network has since been upgraded to 24 sensors with an average sensor baseline of approximately 150 km, forming a grid across the country (Gijben, 2012; Evert and Gijben, 2017). Self-evaluation of the network estimates flash detection efficiencies of above 90 % and location accuracies within 500 m for the whole coverage of the country, only dropping below these levels at the borders (of the country and the network). Ground-truth evaluations report cloud-to-ground stroke detection efficiencies of 85 %–90 %. These evaluations further indicate a median location error within 150 m (Hunt et al., 2014, 2020; Fensham et al., 2018).
2.5 NLDN
The US National Lightning Detection Network (NLDN) has adopted a combination of time-of-arrival and direction-finding technology (Cummins and Murphy 2009), similarly to the other networks, to geolocate lightning CG strokes and IC pulses since 1989. The contiguous United States (CONUS) is covered by approximately 100 LS7002 sensors (Nag et al., 2014). The detection efficiency and location accuracy of the NLDN has been evaluated thoroughly using video observations (Biagi et al., 2007; Warner et al., 2012; Cummins et al., 2014; Zhang et al., 2015; Zhu et al., 2016), tower data (Lafkovici et al., 2006; Cramer and Cummins, 2014; Zhu et al., 2020) and triggered lightning data (Jerauld et al., 2005; Nag et al., 2011; Mallick et al., 2014). It follows that the flash DE is expected to be on the order of 95 % within CONUS. The location accuracy is approximately 150 to 250 m over the majority of the United States and decreases somewhat to 250–500 m toward the edges of the network.
Since not all of the strokes observed by the high-speed cameras and electric field change sensors were detected by the different LLSs, the data sets used in this study differ slightly from the ones presented in Poelman et al. (2021). Note that the list of flashes to test the performance of the ground strike point algorithms is additionally enlarged by two extra data sets gathered in France and Spain. The quality of the latter two data sets is of the same level as the data sets introduced in Poelman et al. (2021, companion paper). However, the limited video recording time of 500 ms prohibits its use in Poelman et al. (2021, companion paper). It should be pointed out that a flash is completely removed if a stroke that creates a new GSP is not detected by the LLS since this would impact the success rate of the algorithm further described in Sect. 5. In what follows, some of the characteristics of the reduced data sets are discussed. Notice that detection efficiency projections of the LLS are out of the scope of this study, and therefore detailed investigation of this is disregarded as such. Nevertheless, one can find in Sect. 2 references for the individual LLS detection efficiency estimations of the individual networks.
Table 1Data set characteristics for Austria (AT), Brazil (BR), France (FR), South Africa (SA), Spain (ES) and the United States of America (US). NGC is new ground contact point; PEC is pre-existing lightning channel.

Some of the characteristics that play a role in the further course of the study are listed in Table 1 for the different data sets and are described in the text that follows. The combined data sets include a total of 1479 flashes, consisting of 4280 strokes, with a total of 2325 ground strike points distributed among them. The sizes of the data sets, in terms of flashes, strokes and ground strike points, are somewhat smaller compared to those of Poelman et al. (2021, companion paper) for the reason described above. Because of this, it is not possible and not valid to use the numbers given in Table 1 for detection efficiency estimations.
The random location errors in the different LLSs can be quantified by using the strokes that follow the same channel as observed from the consecutive high-speed images. Since those strokes are assumed to strike ground at the same point, the differences between the stroke positions within a GSP lead to the LA estimation after applying a downscaling factor of . The latter scaling is applied since both positions are subject to random errors, by analogy with Schulz et al. (2010) and Biagi et al. (2007). The differences determined by this method should be regarded as upper bounds of the actual position differences because there is the possibility that the channel geometry and/or the actual ground contact varied slightly from stroke to stroke and was not resolved by the camera. The results thereof can be consulted in Table 1. All of the LLSs have median LAs in the range of 0.11–0.19 km, except for Brazil with a median LA of 1 km. These LA values correspond with previous LA estimates in other studies mentioned in Sect. 2 for the individual networks.
The error ellipse semi-major axis (SMA) and semi-minor axis lengths along with the ellipse rotation angle reported by an LLS generally correspond to the characteristics of the 50 % confidence ellipse; i.e., 50 % of the located return strokes should have ground-truth strike locations that occur within the error ellipse defined by the provided parameters. This error or confidence ellipse can in fact be calculated for any desired level other than 50 % by scaling the semi-major and semi-minor axes of the 50 % confidence ellipse according to Eq. (1).
with SC being the resulting scaling factor belonging to the desired probability P. More details about the confidence ellipse can be found in Stansfield (1947), Cummins et al. (1998) and Diendorfer et al. (2014). In any case, an alternative way to look at the location quality is to monitor the SMA behavior. From Table 1, it follows that the SMA for BR is highest, indicating that the location quality is lower compared to the other data sets. It also confirms the LA values retrieved by the method described above.
χ2 values provide additional insight about the accuracy of the error ellipse parameters. A standard distribution of χ2 has a mean value of 1, whereby 1 % of the χ2 values are larger than 5. It is expected that the distribution of the SMA of the 50 % confidence ellipse is close to the median location accuracy if all systematical errors are removed and random errors are based on the real measurement errors (Nag et al., 2015). For all the LLSs, except BR, the mean χ2 is about 1, with only a few percent of the strokes exhibiting a χ2 greater than 5 (ranging from 0.51 %–2.21 %). The mean χ2 value in BR is the largest at 4.11, with more than 20 % of the values greater than 5. The latter suggests that many of the location errors in BR will be much larger, i.e., 2 to 3 times what is provided by the ellipse estimates.
Estimated (measured) median peak current values for first strokes, subsequent strokes, new ground contact points (NGCs) and pre-existing lightning channels (PECs) are also presented in Table 1. As expected, the first strokes exhibit larger absolute peak currents compared to the subsequent strokes, analog to the peak current values of NGCs versus PECs. Since higher-peak-current strokes tend to be detected on average by a larger number of lightning sensors, the coordinates appointed by the LLS are likely to be of higher accuracy compared to strokes exhibiting a lower peak current. This may influence the probability of the algorithms to distinguish correctly between a new GSP or a PEC, as will be discussed later on.
Finally, values for the mean and median separation distance between the first stroke in the flash, i.e., first GSP, and subsequent GSPs within the flash are illustrated in Table 1 as well. The position of the respective GSPs is calculated as the mean location of the strokes assigned to the GSP, whereby a weight is given as inversely proportional to the respective semi-major axis of the stroke. The 99th percentiles are indicated together with the maximum estimated separation distance. The case in which this maximum is found to be much larger than the 99th percentile indicates that the maximum is a one-off. Median values of the separation distance vary between 1.3 (US) and 2.75 km (BR). The retrieved median distances agree well with those found in previous studies such as Stall et al. (2009) and Thottappilil et al. (1992). The maximum separation distance for AT, FR and SA is quite large, and for SA a few considerable separation distances are retrieved close to the maximum as evidenced by the value of the 99th percentile. It is essential to highlight that the large maximum separation distances could well be the result of a location error by the LLS or a consequence of the manual grouping methodology based on the video information. From the perspective of cloud charge centers and the horizontal extent of downward leaders, it would make more sense to trace the lightning leader back to the location of the preliminary breakdown and only group strokes that emanate from a common charge region. However, this would require observations made by an LMA.
The sole purpose of a ground strike point algorithm is to group the different strokes of a flash into one or more ground strike points. The ultimate goal is to mimic, as accurately as possible, the exact distribution of GSPs compared to what is observed in the high-speed camera images. The ability to do so enables the user to determine, with a high degree of certainty on a predefined geographical and periodical scale, the ground strike point density based on a large set of actual LLS observations.
To our knowledge, four such GSP algorithms exist to date. One of those has been described by Cummins (2012). The empirical formulae that resulted from that analysis were based on LLS data employing wave shape information from IMPACT sensors. Since in this study, the LLSs described in Sect. 2 utilize the so-called LS700x sensor technology of Vaisala (except for in BR), it is believed that this particular method is unsuitable for direct application to the data in this study and is hence disregarded (Kenneth L. Cummins, personal communication, 2017). In what follows, the three remaining algorithms are described.
4.1 Algorithm 1 (A1)
Developed by MTRG, this iterative K-means method works as follows. During the first iteration, the first stroke in the flash is taken as the location of the first GSP. Then subsequent strokes are assigned to a GSP if and only if the distance falls within a predefined minimum geometrical distance threshold. If the distance between the stroke and the previously determined GSPs is greater than this threshold, the stroke creates a new GSP; otherwise it is assigned to the closest GSP. Before an iteration ends, the GSP positions are updated according to the mean locations of the strokes assigned to the GSP, whereby a weight is given to each stroke that is inversely proportional to the respective SMA; i.e., strokes with smaller SMAs will influence the GSP location more than strokes with large SMAs. Then a new iteration can start, and the process is repeated until the mean GSP positions do not vary anymore, meaning all the strokes are durably assigned to their ground contact. It is important to mention that strokes with a peak current kA and/or with SMA values above 2 km are assigned to the previous GSP regardless of their position. For further details on this algorithm, the interested reader is referred to Pedeboy (2012).
4.2 Algorithm 2 (A2)
This iterative K-means method has been developed and described in great detail in Campos et al. (2015) and Campos (2016). As a first step, strokes are sorted into two main groups, i.e., those with low and those with high SMA values based on a user-defined threshold. Initially, the algorithm tries to group the strokes with low SMAs among themselves, thereby creating the first set of GSPs. To do so, the mean location among the low-SMA strokes is first calculated. Then the algorithm checks the spherical distance between each low-SMA stroke and this mean location. The resulting distances are then compared against a threshold. This threshold depends on the properties of the strokes in the flash, defined as twice the maximum SMA value among the low-SMA strokes in the flash. If all distances fall below the threshold, the low-SMA strokes are grouped within one GSP. However, in the case where one distance is larger and the rest are smaller than the threshold, a new iteration starts whereby two potential GSP locations are now tested. The first GSP adopts the location of the stroke in the previous iteration with the distance larger than the threshold, and the location of the second GSP is the mean of the locations of the other strokes. The algorithm repeatedly checks the distances up to the point that the greatest distance between a GSP and all its associated strokes is smaller than the threshold, implying that the low-SMA strokes are grouped into a fixed set of GSPs. Subsequently, the algorithm attempts to group the strokes with high SMA values into the previously retrieved GSPs, according to an elliptical scaling method described in more detail in Campos et al. (2015). In order to do so, the error ellipse is scaled until it intersects with the location of one of the GSPs. The scaling value indicates how many times the scaled ellipse is larger or smaller than the original error ellipse. A maximum elliptical scaling factor of 2 is adopted in this study. If the scaling factor is below 2, then it is assigned to that GSP and not otherwise. Finally, the algorithm groups redundant GSPs if the distances are smaller than the threshold used to split strokes into strokes with low and high SMAs.
4.3 Algorithm 3 (A3)
The most recent method has been introduced by Matsui et al. (2019). This non-iterative approach excels in its simplicity whereby a stroke with a distance below a certain threshold is assigned to an existing GSP when the 50 % probability ellipse overlaps with one or more of the other error ellipses of strokes already assigned to that GSP. The GSP location is updated directly as the mean of the locations of the strokes. If this criterion is not met, a new GSP is created and the distances of the subsequent strokes are tested against the locations of the already-existing GSPs produced by the algorithm.
Before going any further, it is appropriate to add the following remark. The three algorithms described above somehow all rely to a certain degree on the availability of the strokes' SMA information at some point in the algorithm. However, not all existing LLSs provide details about the strokes' confidence ellipse. Especially in the case of A3, this would mean that GSPs are determined solely by some prescribed separation distance, and consequently A3 coincides with A1.
4.4 Some initial examples
The flashes displayed here are examples of real flashes from the data set of this study and are specifically chosen to explain the principles employed by the algorithms in a clear manner. Of course, more complicated flashes exist with higher multiplicities.
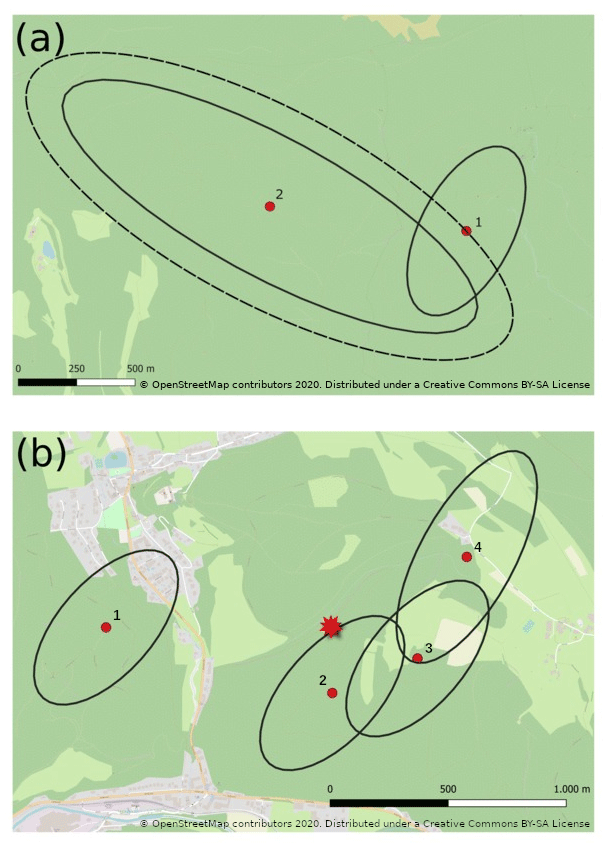
Figure 1(a) Example of a two-stroke flash. The original error ellipses are displayed (solid) alongside the scaled error ellipse of stroke 2 (dashed) as used by A2. (b) A flash with a multiplicity of 4. The star denotes the average position of all four strokes.
Figure 1a displays a two-stroke flash with the original error ellipses displayed as solid lines. The peak currents of the strokes are −11.3 and −3.5 kA, respectively. The strokes are about 850 m apart and have SMA values of 400 m and 1 km, respectively. A1 will always group the strokes together in one GSP irrespective of their distance, since the second stroke has an absolute peak current smaller than 6 kA. For A2, adopting a distance threshold of, e.g., 500 m results in stroke 1 being the first GSP as it is the only low-SMA stroke in the flash. Stroke 2 is in this case regarded as a high-SMA stroke, and elliptical scaling is applied. The scaled error ellipse is displayed as the dotted ellipse in the plot. The error ellipse is scaled by a factor of less than 2 before it intersects with the location of the GSP. Therefore, these strokes will be grouped into one ground strike point. In the case of A3, the error ellipses overlap; therefore the grouping depends solely on the chosen distance threshold. If the threshold is below 850 m, then it will create two GSPs; otherwise the strokes are grouped into a single GSP.
The composition of the four strokes from another flash is visualized in Fig. 1b. The first three have an SMA of 400 m, while the fourth stroke has an SMA of 500 m. If a distance threshold of 200 m is adopted, A1 will create four GSPs accordingly, since the distances are all larger than 200 m for all combinations possible. If the threshold is increased to 1 km however, the algorithm results in one GSP. For A2, let us take a threshold of 200 m to separate the low- and high-SMA strokes. All strokes are considered high-SMA events, and therefore only elliptical scaling is applied. Since the error ellipses already overlap a lot, it is possible to envision that the scaling factors will be below 2, and therefore the last three strokes will be grouped into a single GSP, while the first stroke is a GSP on its own. When adopting 1 km as a threshold, all strokes are considered low-SMA strokes and only spherical grouping is applied. First, the mean location of all four strokes is calculated, highlighted by the star in the plot. Then the distances of the strokes to the star are calculated. Since the distances are all below 1 km, they are grouped into a single GSP. In the case of A3, the first stroke will always be a GSP on its own since the error ellipse does not overlap with any of the other three. Depending on the adopted distance criterion, the algorithm results in either two or more GSPs.
In the following analysis, a similar strategy is applied to all three algorithms. First of all, the ability to distinguish between a stroke creating an NGC and one that follows a PEC is examined. The latter will be denoted as the “type only” criterion. Secondly, a stricter “type and sequence” criterion is validated. The latter checks not only whether the correct type is retrieved but additionally whether the order of occurrence is correct. By this it is meant, in the case of an NGC, whether it is correctly assigned as the first, second, third, etc. GSP in the flash, while in the case of a PEC, it is meant if it is assigned to the correct GSP as retrieved from the video images.
A1 and A3 have one obvious threshold in common, i.e., the distance to group strokes into a particular GSP. In the case of A2, only the low-SMA strokes are grouped according to a flash-dependent distance threshold. However, to facilitate the comparison of the three algorithms, the plots on the left and right in Fig. 2 display the probability of the algorithms to correctly assign the type only and type and sequence, respectively, of the strokes as a function of the distance threshold ranging from 200 m up to 10 km. The latter threshold is exactly the distance threshold used by A1 and A3, while in the case of A2 it is the threshold that subdivides the strokes into low- and high-SMA strokes, followed by the algorithms' specifically designated distance threshold.

Figure 2The success rate for the three algorithms is displayed in the type-only case (a, c, e) and the type-and-sequence case (b, d, f) for algorithm A1 (a, b), A2 (c, d) and A3 (e, f). Colors are linked to each specific data set, whereas the black curve indicates the average result without Brazil.
As will be demonstrated later on, the trend for AT, FR, SA, ES and US is similar for each specific algorithm, while BR exhibits different behavior. It is believed that this behavior of BR is a consequence of the low LA of the LLS observations at that time, prohibiting the algorithm to utilize its full potential. For this reason, the overall success rate of the algorithms, as denoted by the black curve in Fig. 2, is calculated without taking into account BR. Results thereof are quantified in Table 2.
Table 2Performance results for the three algorithms excluding BR, i.e., black curve in Fig. 2. Values in parentheses are success rates for events without the first strokes, i.e., removing all single-stroke flashes as well as the first strokes in the multiple-stroke flashes.

5.1 Results A1
The success rate in determining the type (and sequence) of the strokes is plotted in Fig. 2a (and b). Although only better by 1 % or 2 %, the best overall type-only success rate of 90.6 % is found adopting a distance threshold of 500 m. The algorithm displays a similar behavior for the type-and-sequence criterion, with an overall best of 82.1 % at 500 m. Overall, a 10 % to 15 % drop is noticed if the sequence is additionally taken into account as a criterion. In Table 2 the results for type only are split into the classification success for NGCs or PECs. Increasing the distance threshold in the algorithm leads to strokes being grouped more and more into a single GSP. As such, strokes are gradually more frequently allocated as a PEC by the algorithm. This explains the success rate of almost 100 % for PECs at the largest threshold of 10 km. Similar reasoning can explain the behavior of NGCs, whereby NGCs are better predicted than PECs at lower distance thresholds.
The first strokes in the flash, including single-stroke flashes, are per definition always correctly assigned by the algorithm. Hence, neglecting the first strokes, i.e., removing all single-stroke flashes as well as the first stroke in the multiple-stroke flashes, results in a decrease in the success rate by about 5 % to 10 %. The latter is indicated by the results between parentheses in Table 2. By doing so, the results are not biased by the percentage of single-stroke flashes in the individual regions. Moreover, neglecting the first strokes does not affect the PEC classification.
The effect of not using the condition to group strokes with kA and/or SMA>2 km in the previous GSP regardless of its location results in a minor drop in the success rate by not more than 1 %. This is as expected since only a limited number of strokes fall within this category.
Finally, it is worth mentioning that for an algorithm depending solely on a distance criterion to group strokes into GSPs, the success rate in the limit of very low and very high distance thresholds can be determined theoretically. This is true since all strokes will create a new GSP using the algorithm at very low distance thresholds, while at very high distance thresholds, all strokes are grouped into a single GSP. Making use of the observed number of flashes, strokes and GSPs, the success rate can then be determined at those boundary conditions. The average number of GSPs per flash in the case of SA is the lowest among the data sets, resulting in the best performance at high distance thresholds.
5.2 Results A2
The success rate in determining the type (and sequence) of the strokes is plotted in Fig. 2c (d). To reiterate, in the case of A2, the threshold displayed on the x axis is the threshold that sorts strokes into low- and high-SMA strokes. As such, toward the left side of the plot some strokes will be regarded as large SMA strokes because the algorithm applies a combination of spherical grouping and elliptical scaling. On the other hand, at large distance thresholds, most of the strokes, if not all, are regarded as small SMA strokes and only spherical grouping is utilized. At a threshold of 10 km the outcome resembles the outcome of A1, due to the merging of the GSPs, if the distances are below 10 km. Hence, on this side of the plot most, if not all, flashes have one single GSP. At 200 m, the algorithm performs better for BR compared to the other two algorithms, a consequence of the elliptical scaling. In fact, the primary motivation behind implementing the hybrid scaling method used by this algorithm was to increase the performance in the case of low-sensor-density networks or near borders. Hence, under such conditions the use of this algorithm is recommended. However, the success rate for BR remains low compared to the other data sets at low thresholds. Looking at Table 2, A2 performs best at the 500 m threshold with an overall type-only success rate being about 2 % to 4 % higher than A1 and A3, respectively, and is similar in the case of type and sequence.
5.3 Results A3
Figure 2e and f plot the success rate of correctly assigning the type only and type and sequence in the case of A3. Compared to the previous two algorithms, the behavior exhibits a different pattern whereby the outcome for all data sets increases gradually up to a distance threshold of about 1 km, after which the curve flattens out. Additionally, what is striking is that the results for the data sets are close to each other all over the line within approximately 5 %, except for BR. The reason why an enlarged distance threshold has practically no effect beyond 1 km is the explicit condition that the 50 % probability ellipse needs to overlap with one or more of the other error ellipses of strokes already assigned to the GSP. Hence, this prerequisite prevents grouping strokes located at large distances from each other into a single GSP, as opposed to in A1, for example. One can conclude that for A3, the distance threshold dominates at thresholds smaller than the average SMA values observed in Table 1, whereas the SMA values quickly become more important at larger distance thresholds. This is true since for large thresholds it can be assumed that all strokes are within the threshold distance. The decision to group these into a GSP is determined by whether the ellipses overlap or not. Similarly to A1 and A2, the data for BR exhibit the worst probability of success.
The results for the black curve in Fig. 2e and f are quantified in Table 2. A drop in the success rate somewhat smaller than 10 % is observed going from type only to type and sequence. A more detailed look at the classification success of NGCs and PECs reveals that the behavior is different when compared to the other algorithms. Here, NGC classification success is rather stable over the entire line. Moreover, excluding first strokes does not have such a dramatic effect on the outcome as opposed to in A1 and A2.
5.4 Dependence on the estimated peak current
Figure 3 plots the overall performance of the algorithm to determine the type of the strokes as a function of the median absolute peak current . The results are presented adopting the threshold of 500 m for all three algorithms. A different symbol and color is used for each of the four possible combinations, with open symbols denoting the results when first strokes are neglected, i.e., neglecting single-stroke flashes as well as the first strokes in multiple-stroke flashes.

Figure 3Algorithm performance as a function of median absolute peak current for (a) A1, (b) A2 and (c) A3. The threshold for which the results are presented is 500 m for A1 and A2, and 10 km for A3. The different symbols and colors denote the four possibilities, whereby a green (red) color indicates that the algorithm (ALG) correctly (incorrectly) assigned the type of stroke compared to the ground-truth observations (GT). Ignoring first strokes in the flash results in the open symbols in the plots.
For all the algorithms, the correctly assigned NGC strokes (green triangles) have a median that is larger compared to the incorrectly assigned ones (red triangles). This difference is more pronounced in the case of A1 and A3, while it is only 1 kA for A2. The smaller difference in median between the correctly and incorrectly assigned NGC strokes in the case of A2 indicates that the correct classification is less dependent on the stroke's peak current compared to the other two algorithms.
The effect of neglecting the first strokes (open symbols) has been discussed before. A drop is noticed in the success rate of the algorithms according to the results listed in Table 2 (open triangles). While for A1 and A3, a similar behavior is found in terms of the median peak currents, for A2 it is found that the absolute median for incorrectly assigned NGCs is slightly larger by 0.5 kA as compared to the correctly assigned ones.
Similarly, one can look at the peak currents of the PECs. In the case of A2 and A3, correctly assigned PECs (green squares) have larger absolute medians compared to the incorrectly assigned ones (red squares), whereas the opposite is found for A1. The performance of A1 related to PECs is a consequence of assigning strokes with an absolute peak current below 6 kA and/or SMA value larger than 2 km to the previous GSP regardless of its position. As such, those particular low-peak-current strokes reduce the median peak current of correctly assigned PEC strokes in Fig. 3a.
To conclude, it follows that, in general, larger absolute peak current strokes are more likely to be correctly classified as either an NGC or a PEC. This is not surprising since larger absolute peak current strokes are on average reported by an increased number of lightning sensors, thereby locating the strokes more accurately.
Three different ground strike point algorithms have been assessed in terms of their ability to correctly group strokes into ground strike points. Since it is known that flashes tend to have more than one ground termination point on average, it is advisable to use ground strike point densities as opposed to flash densities derived from LLSs. The input for the algorithms is provided by the observations made by local LLSs, whereas high-speed observations deliver the ground-truth observations against which the outcome of the algorithms is tested. Although some differences are noticeable among the algorithms, all three of them perform well with success rates of up to 90 % to retrieve the correct type of stroke in the flash. This means that in 90 % of the cases, the number of ground strike points that are retrieved matches how they actually occurred in nature. Even though 100 % is not reached, the use of GSP densities after applying a GSP algorithm to group the individual strokes within a flash in ground strike points will result in a significant improvement to assessing the risk posed by lightning.
Note that the occurrence of forked strokes has been investigated in Poelman et al. (2021, companion paper). However, the different ground strike points created by those forked strokes are inherently difficult to disentangle by LLSs, especially when the forked contact points are close to each other. Hence, it follows that applying the algorithms described in this paper would result in an underestimation of the ground strike points.
It is further worth mentioning that the performance results of the different algorithms are biased by the specific flash multiplicity and ground strike point characteristics in the region. Furthermore, the quality of the local LLS is of particular importance in the success rate of the algorithm. Looking at the change in success rate depicted in Fig. 2, one could conclude that adopting a distance threshold proportional to 3 to 5 times that of the mean LA results in the best success rate of the algorithms.
All three algorithms, with their proper characteristics, are high-performance tools in terms of both speed and accuracy to group strokes into ground strike points. It is difficult to favor one algorithm over the other. In absolute terms A2 performs the best but only by a few percent. However, it is also the most complicated algorithm among the three, combining spherical grouping and elliptical scaling. The other two algorithms solely depend on a distance and/or overlap of the error ellipses and are more straightforward to implement by the user.
All codes and data processed could not be made publicly available. For access, the first author can be contacted by email: dieter.poelman@meteo.be.
DRP and WS conceptualized the research and carried out the analysis. SP, LZSC and MM provided the code of the algorithms. WS, SP, DH, MS and HH are strongly involved in the collection and preparation of the data sets used. DRP prepared the manuscript with review and editing from all co-authors.
The authors declare that they have no conflict of interest.
The work performed by the reviewers proved invaluable. Their critical reading and contribution of ideas and comments is very much appreciated. This work has undoubtedly given more depth to the content and the way the results are presented. The authors would like to express their gratitude for the time and effort that has gone into it. The authors would like to thank the South African Weather Service (SAWS) for the use of the SALDN data, specifically Morné Gijben, Andrew van der Merwe and Michelle Hartslief. Additional thanks go to Tom Warner and Carina Schumann for making available the South African high-speed video footage; to Carlos Mata for his effort related to the USA data set; and to Xavier Delorme, Joan Bosca Varela and Antonio Rubio Espana for their help in connection with the ground-truth data taken in France and Spain. Special thanks go to Hannes Kohlmann who assisted Dieter R. Poelman in using QGIS to correctly plot the error ellipses in appropriate projections used throughout this study.
Hugh Hunt would like to thank the National Research Foundation of South Africa (unique grant no. 98244).
This paper was edited by Piero Lionello and reviewed by Kenneth Cummins and one anonymous referee.
Balch, J. K., Bradley, B. A., Abatzoglou, J. T., Nagy, R. C., Fusco, E. J., and Mahood, A. L.: Human-started wildfires expand the fire niche across the United States, P. Natl. Acad. Sci. USA, 114, 1946–2951, 2017.
Ballarotti, M. G., Saba, M. M. F., and Pinto Jr., O.: A new perfomance evaluation of the Brazilian Lightning Location System (RINDAT) based on high-speed camera observations of natural negative ground flashes, proc. 19th Int. Lightning Detection Conf. (ILDC), Tucson, Az, Vaisala, 2006.
Biagi, C. J., Cummins, K. L., Kehoe, K. E., and Krider, E. P.: National Lightning Detection Network (NLDN) performance in southern Arizona, Texas, and Oklahoma in 2003–2004, J. Geophys. Res., 112, D05208, https://doi.org/10.1029/2006JD007341, 2007.
Campos, L. Z. S.: On the mechanisms that lead to multiple ground contacts in lightning, Doctorate Thesis of the Graduate Course in Space Geophysics, Instituto Nacional de Pesquisas eEpaciais (INPE), Chapter 4, available at: http://urlib.net/8JMKD3MGP3W34P/3LG4CDL (last access: June 2021), 2016.
Campos, L. Z. S., Cummins, K. L., and Pinto Jr., O.: An algorithm for identifying ground strike points from return stroke data provided by lightning location systems, Asia-Pacific Conference on Lightning (APL), Nagoya, Japan, 2015.
Cramer, J. A. and Cummins, K. L.: Evaluating location accuracy of lightning location networks using tall towers, 23rd Int. Lightning Detection Conf., Tucson, AZ, Vaisala, 2014.
Cummins, K. L.: Analysis of multiple ground contacts in cloud-to-ground flashes using LLS data: the impact of complext terrain, 22nd International Lightning Detection Conference, 2–3 April 2012, Broomfield, Colorado, USA, 2012.
Cummins, K. L. and Murphy, M. J.: An overview of lightning locating systems: History, techniques, and data uses, with an in-depth look at the U.S. NLDN, IEEE Trans. Electromagn. Compat., 51, 499–518, https://doi.org/10.1109/TEMC.2009.2023450, 2009.
Cummins, K. L., Murphy, M. J., Bardo, E. A., Hiscox, W. L., Pyle, R. B., and Pifer, A. E.: A Combined TOA/MDF Technology Upgrade of the US National Lightning Detection Network, J. Geophys. Res.-Atmos., 103, 9035–9044, 1998.
Cummins, K. L., Zhang, D., Quick M. G., Garolera, A. C., and Myers, J.: Performance of the US NLDN during the Kansas Windfarm 2012 and 2013 field programs, in: 23rd International Lightning Detection Conference, 18–19 March 2014, Tucson, AZ, Vaisala, 2014.
Curran, E. B., Holle, R. L., and Lopez, R. E.: Lightning casualties and damages in the United States from 1959 to 1994, J. Climate, 13, 3448–3453, 2000.
Diendorfer, G.: A review of 25 years of lightning research in Austria from 1991–2015, in: World meeting on Lightning, 6–8 April 2016, Cartagena, Colombia, 2016.
Diendorfer, G., Pichler, H., and Schulz, W.: EUCLID Located Strokes to the Gaisberg Tower – Accuracy of Location and its assigned Confidence Ellipse, in: International Lightning Detection Conference (ILDC), 18–19 March 2014.
Evert, R. C. and Gijben, M.: Official South African Lightning Ground Flash Density Map 2006 to 2017, in: Earthing Africa Inaugural Symposium and Exhibition, Johannesburg, South Africa, 2017.
Fensham, H. G., Schumann, C., Hunt, H. G. P., Nixon, K. J., Warner, T. A., and Gijben M.: Performance evaluation of the SALDN using high-speed camera footage of ground truth lightning events over Johannesburg, South Africa, 34th International Conference on Lightning Protection (ICLP), Rzeszow, Poland, 2018.
Gijben, M.: Lightning Climatology of South Africa, S. Afr. J. Sci., 108, 740, https://doi.org/10.4102/sajs.v108i3/4.740, 2012.
Hermant, A.: Traqueur d'Orages. Les rendez-vous de la nature, Nathan, ISSN 1285-9168, ISBN 2092605461, 9782092605462, 2000.
Holle, R. L., A summary of recent national scale lightning fatality studies, Weather Clim. Soc., 8, 35–42, 2016.
Holle, R. L., Lopez, R. E., and Navarro, B. C.: Deaths, injuries, and damages from lightning in the United States in the 1890s in comparison with the 1990s, J. Appl. Meteorol., 44, 1563–1573, 2005.
Hunt, H. G. P., Liu, Y. C., and Nixon, K.: Evaluation of the South African Lightning Detection Network using photographed tall tower lightning events from 2009–2013, 32rd International Conference on Lightning Protection (ICLP), Shanghai, China, 2014.
Hunt, H. G. P., Nixon, K. J., Jandrell, I. R., and Schulz, W.: Can we model the statistical distribution of lightning location system errors better?, Electr. Pow. Syst. Res., 178, 106042, https://doi.org/10.1016/j.epsr.2019.106042, 2020.
Jerauld, J., Rakov, V. A., Uman, M. A., Rambo, K. J., Jordan, D. M., Cummins, K. L., and Cramer, J. A.: An evaluation of the performance characteristics of the US National Lightning Detection Network in Florida using rocket-triggered lightning, J. Geophys. Res., 110, D19106, https://doi.org/10.1029/2005JD005924, 2005.
Koshak, W. J., Cummins, K. L., Beuchler, D. E., Vant-Hull, B., Blakeslee, R. J., Williams, E. R., and Peterson, H. S.: Variability of CONUS Lightning in 2003–12 and Associated Impacts, J. Appl. Meteorol. Clim., 54, 15–41, https://doi.org/10.1175/JAMC-D-14-0072.1, 2015.
Lafkovici, A., Hussein, A. M., Janischewskyj, W., and Cummins, K. L.: Performance analysis of the North American Lightning Detection Network using CN Tower lightning data, 19th Int. Lightning Detection Conf., Tucson, AZ, Vaisala, 2006.
Mallick, S., Rakov, V. A., Hill, J. D., Ngin, T., Gamerota, W. R., Pilkey, J. T., Biagi, C. J., Jordan, D. M., Uman, M. A., Cramer, J. A., and Nag, A.: Performance characteristics of the NLDN for return strokes and pulses superimposed on steady currents, based on rocket-triggered lightning data acquired in Florida in 2004–2012, J. Geophys. Res.-Atmos., 119, 3825–3856, https://doi.org/10.1002/2013JD021401, 2014.
Matsui, M., Michishita, K., and Yokoyama, S.: Characteristics of negative flashes with multiple ground strike points located by the Japanese lightning detection network, IEEE T. Electromagn. C., 61, 751–758, https://doi.org/10.1109/TEMC.2019.2913661, 2019.
Montanyà, J., van der Velde, O., and Williams, E. R.: Lightning discharges produced by wind turbines, J. Geophys. Res.-Atmos., 119, 1455–1462, https://doi.org/10.1002/2013JD020225, 2014.
Naccarato, K. P. and Pinto Jr., O.: Improvements in the detection efficiency model for the Brazilian lightning detection network (Brasil – DAT), Atmos. Res., 91, 546–563, https://doi.org/10.1016/j.atmosres.2008.06.019, 2009.
Nag, A., Mallick, S., Rakov, V. A., Howard, J. S., Biagi, C. J., Hill, J. D., Uman, M. A., Jordan, D. M., Rambo, K. J., Jerauld, J. E., DeCarlo, B. A., Cummins, K. L., and Cramer, J. A.: Evaluation of US National Lightning Detection Network performance characteristics using rockettriggered lightning data acquired in 2004–2009, J. Geophys. Res., 116, D02123, https://doi.org/10.1029/2010JD014929, 2011.
Nag, A., Murphy, M. J., Cummins, K. L., Pifer, A. E., and Cramer, J. A.: Recent evolution of the US National lightning Detection Network, 23rd Int. Lightning Detection Conf., Tucson, AZ, Vaisala, 2014.
Nag, A., Murphy, M. J., Schulz, W., and Cummins, K. L.: Lightning location systems: insights on characteristics and validation techniques, Earth Space Sci., 2, 65–93, https://doi.org/10.1002/2014ea000051, 2015.
Pedeboy, S.: Identification of the multiple ground contacts flashes with lightning location systems, CIGRE C4 Colloquium on Power Quality and Lightning, 13–16 May 2012, Sarajevo, Bosnia and Herzegovina, 2012.
Poelman, D. R., Schulz, W., Diendorfer, G., and Bernardi, M.: The European lightning location system EUCLID – Part 2: Observations, Nat. Hazards Earth Syst. Sci., 16, 607–616, https://doi.org/10.5194/nhess-16-607-2016, 2016.
Poelman, D. R., Schulz, W., Pedeboy, S., Hill, D., Saba, M., Hunt, H., Schwalt, L., Vergeiner, C., Mata, C. T., Schumann, C., and Warner, T.: Global ground strike point characteristics in negative downward lightning flashes – Part 1: Observations, Nat. Hazards Earth Syst. Sci., 21, 1909–1919, https://doi.org/10.5194/nhess-21-1909-2021, 2021.
Rakov, V. A., Uman, M. A., and Thottappillil, R.: Review of lightning properties from electric field and TV observations, J. Geophys. Res., 99, 10745–10750, https://doi.org/10.1029/93JD01205, 1994.
Saraiva, A. C. V., Saba, M. M. F., Pinto, O., Cummins, K. L., Krider, E. P., and Campos, L. Z. S.: A comparative study of negative cloud-to-ground lightning characteristics in São Paulo (Brazil) and Arizona (United States) based on high-speed video observations, J. Geophys. Res., 115, D11102, https://doi.org/10.1029/2009JD012604, 2010.
Schultz, C. J., Nauslar, N. J., Wachter, J. B., Hain, C. R., and Bell, J. R.: Spatial, Temporal and Electrical Characteristics of Lightning in Reported Lightning-Initiated Wildfire Events, Fire, 2, 18, https://doi.org/10.3390/fire2020018, 2019.
Schulz, W., Pichler, H., and Diendorfer, G.: Evaluation of 45 negative flashes based on E-field measurements, video data and lightning location data in Austria, Proc. 30th Int. Conf. on Lightning Protection, Cagliari, Italy, Power and Energy Society, 1011-1–1014, 2010.
Schulz, W., Diendorfer, G., Pedeboy, S., and Poelman, D. R.: The European lightning location system EUCLID – Part 1: Performance analysis and validation, Nat. Hazards Earth Syst. Sci., 16, 595–605, https://doi.org/10.5194/nhess-16-595-2016, 2016.
Stall, C. A., Cummins, K. L., Krider, E. P., and Cramer, J. A.: Detecting Multiple Ground Contacts in Cloudto-Ground Lightning Flashes, J. Atmos. Ocean. Tech., 26, 2392–2402, 2009.
Stansfield, R. G.: Statistical Theory of D. F. Fixing, Journal of the Institution of Electrical Engineers – Part IIIA: Radiocommunication, 94, 762–770, 1947.
Thottappillil, R., Rakov, V. A., Uman, M. A., Beasley, W. H., Master, M. J., and Shelukhin, D. V.: Lightning subsequent-strokeelectric-field peak greater than the 1st stroke peak and multiple ground terminations, J. Geophys. Res.-Atmos., 97, 7503–7509, 1992.
Valine, W. C. and Krider, E. P.: Statistics and characteristics of cloud-to-ground lightning with multiple ground contacts, J. Geophys. Res.-Atmos., 107, 4441, https://doi.org/10.1029/2001JD001360, 2002.
Warner, T. A., Cummins, K. L., and Orville, R. E.: Upward lightning observations from towers in Rapid City, South Dakota and comparison with National Lightning Detection Network data, 2004–2010, J. Geophys. Res.-Atmos., 117, D19109, https://doi.org/10.1029/2012JD018346, 2012.
Yair, Y.: Lightning hazards to human societies in a changing climate, Environ. Res. Lett., 13, 123002, https://doi.org/10.1088/1748-9326/aaea86, 2018.
Zhang, D., Cummins, K. L. and Nag, A.: Assessment of cloud lightning detection by the US National Lightning Detection Network using video and Lightning Mapping Array observations, Seventh Conf. on the Meteorological Applications of Lightning Data, Phoenix, AZ, Am. Meteorol. Soc., 7.1, available at: https://ams.confex.com/ams/95Annual/webprogram/Paper262568.html (last access: June 2021), 2015.
Zhu, Y., Rakov, V. A., Tran, M. D., and Na,g A.: A study of National Lightning Detection Network responses to natural lightning base don ground truth data acquired at LOG with emphasis on cloud discharge activity, J. Geophys. Res.-Atmos., 121, 14651–14660, https://doi.org/10.1002/2016JD025574, 2016.
Zhu, Y., Lyu, W., Cramer, J., Rakov, V., Bitzer, P., and Ding, Z.: Analysis of location errors of the US National Lightning Detection Network using lightning strikes to towers, J. Geophys. Res.-Atmos., 125, e2020JD032530, https://doi.org/10.1029/2020JD032530, 2020.