the Creative Commons Attribution 4.0 License.
the Creative Commons Attribution 4.0 License.
 | 31 May 2021
Changes in drought features at the European level over the last 120 years
Viorica Nagavciuc
In this study we analyze drought features at the European level over the period 1901–2019 using three drought indices: the standardized precipitation index (SPI), the standardized precipitation evapotranspiration index (SPEI), and the self-calibrated Palmer drought severity index (scPDSI). The results based on the SPEI and scPDSI point to the fact that Central Europe (CEU) and the Mediterranean region (MED) are becoming dryer due to an increase in the potential evapotranspiration and mean air temperature, while North Europe (NEU) is becoming wetter. By contrast, the SPI drought does not reveal these changes in the drought variability, mainly due to the fact that the precipitation does not exhibit a significant change, especially over CEU. The SPEI12 indicates a significant increase both in the drought frequency and area over the last three decades for MED and CEU, while SPI12 does not capture these features. Thus, the performance of the SPI may be insufficient for drought analysis studies over regions where there is a strong warming signal. By analyzing the frequency of compound events (e.g., high temperatures and droughts), we show that the potential evapotranspiration and the mean air temperature are becoming essential components for drought occurrence over CEU and MED. This, together with the projected increase in the potential evapotranspiration under a warming climate, has significant implications concerning the future occurrence of drought events, especially for the MED and CEU regions.
- Article
(17141 KB) - Full-text XML
-
Supplement
(4899 KB) - BibTeX
- EndNote


Over the last two decades, droughts have affected more then 2 billion people globally and their impacts are increasing (CRED and UNISDR, 2019; IPCC, 2014, 2018; Van Lanen et al., 2016). Since the beginning of the 21st century, Europe has become a “hotspot” for high intensity droughts and most European countries have suffered significant socioeconomic losses (CRED and UNISDR, 2019; Spinoni et al., 2016; Stahl et al., 2016). Drought events imply a series of risks to the environment and socio-human activities, and the way they are managed directly influences the drought's final costs. Overall, the impacts of drought events are felt over different sectors ranging from society, economy, forestry, biodiversity, and agriculture. For example, the record breaking heat wave and drought event over Europe in 2003 put an enormous stress on society, the economy, the environment, and biodiversity (Beniston and Stephenson, 2004). Vegetation growth across Europe was reduced by ∼30 % (Ciais et al., 2005), while crops and forests were much less productive than normal. Overall, the summer of 2003 heat wave and drought had a direct economic impact of about EUR 17.134 billion (CRED and UNISDR, 2019). Summer 2015 was the warmest and driest summer since 1950 over the central and eastern parts of Europe and the economic impacts of this event were estimated at EUR 2.172 billion (Ionita et al., 2017; Van Lanen et al., 2016). The economic and societal damages in 2015 were much smaller compared to the ones in 2003, mainly due to a better management at country and European level. Over the period 2018–2019 more than 50 % of Central Europe was affected by drought, with significant consequences for the economy, society, and biodiversity (Bakke et al., 2020; Hari et al., 2020; Ionita et al., 2020, 2021; Ionita and Nagavciuc, 2020; Schuldt et al., 2020). The 2018 drought event also extended over the Nordic countries, leading to intense and devastating wildfires, with Sweden recording a record breaking burned area of ∼24 310 ha (Bakke et al., 2020).
In simple terms, drought is seen as a direct consequence of precipitation deficit (Palmer, 1965); however, drought intensity varies both in time (McKee et al., 1993) and in space (Vicente-Serrano et al., 2010). The World Meteorological Organization (WMO) has classified drought in four distinct categories: (i) meteorological drought, defined as a rainfall deficit relative to a climatological norm; (ii) agricultural drought, which is defined relative to the soil water availability during the growing seasons; (iii) hydrological drought, which is associated with low water and groundwater levels and low water supply to the reservoirs; hydrological drought usually follows after many months of meteorological drought; and (iv) socioeconomic drought, which occurs when water shortages start to affect people and the available water supply cannot satisfy the human and environmental water needs. Since drought is a very complex phenomenon, it is challenging to objectively quantify drought variability (Dai, 2011; Spinoni et al., 2016; Vicente-Serrano et al., 2010). Among the available drought indices, the Palmer drought severity index (PDSI), the standardized precipitation index (SPI), and the standardized precipitation evapotranspiration index (SPEI) are most commonly used. While the PDSI (Palmer, 1965) was successfully used in quantifying drought variability and severity in the United States, it was less successful for other regions (e.g., Australia and South Africa) (Burke et al., 2006; Ntale and Gan, 2003). In this respect, the self-calibrated Palmer drought severity index (scPDSI) has been developed (Wells et al., 2004), which automatically calibrates the behavior of the index for each location by replacing empirical constants in the index computation with dynamically calculated values. Nevertheless, one of the major drawbacks of the PDSI/scPDSI is that it does not have a multi-scalar character (i.e., it cannot be computed for different timescales). To overcome the multi-scalar feature, the SPI has been developed (McKee et al., 1993), which relies on a probabilistic precipitation approach. The multi-scalar character allows us to analyze the effect of precipitation deficit on the different water resource components on different timescales. The SPI takes into account just the precipitation variability, while the role of temperature is ignored, which under current and projected climate change can be a limiting factor for drought risk management. To also take into account the role of temperature, Vicente-Serrano et al. (2010) have developed the standardized precipitation evapotranspiration index (SPEI). The main advantage of the SPEI is that it incorporates the multi-scalar character of the SPI with the ability of also including the effect of temperature on drought assessment. Taking into account that none of the aforementioned drought indices are inherently superior to the rest in all circumstances, one might perform better than the others in terms of providing useful information for drought monitoring and forecasting over different regions (Stagge et al., 2017; Wang et al., 2020). Thus, comparing and analyzing the three drought indices (scPDSI, SPI, and SPEI) together can be helpful in understanding which one has the ability to monitor drought features and evolution over different regions, and since different drought indices used different input parameters, complex analyses of all drought indices will allow the determination of the main parameters that affect drought occurrence. In previous studies it has been shown that the SPI identifies the drought 1 month earlier than the PDSI and the correlation between these indices is higher in semiarid regions than in humid ones (Hayes et al., 1999). Usually the highest correlation is obtained for longer timescales (e.g., 9- and 12-monthly timescales) (Paulo et al., 2012; Vicente-Serrano et al., 2010); thus, in this study we employ SPEI and SPI for an accumulation period of 12 months.
Climate projections indicate that Europe will be one of the future hotspots for hydroclimatic change with the southern and central part of Europe getting drier and the northern part getting wetter (Cook et al., 2020; IPCC, 2018; Naumann et al., 2018; Spinoni et al., 2018, 2020). Therefore, a better understanding of drought characteristics at the European level and at macroregions (i.e., the Mediterranean region, Central Europe, and northern Europe) is crucial for better drought monitoring and forecasting in order to provide reliable adaptation strategies for drought hazard. The drought events over the last two decades were not homogenously distributed throughout Europe; each event had a specific center of action and the drought centers of action have moved or migrated. Thus, a detailed analysis of the drought evolution at a regional level over the last century is needed. In this respect, we analyzed the variability of droughts over the last 120 years over three key macroregions, as defined by the IPCC: the South Europe/Mediterranean region (MED), Central Europe (CEU), and North Europe (NEU). In the current study we want to extend on previous studies (Spinoni et al., 2015, 2017) and make an updated and in-depth analysis of the drought characteristics at the European level for the last ∼120 years. Compared to previous studies (Spinoni et al., 2015, 2017; Vicente-Serrano et al., 2021), here we make a direct comparison between three different drought indices (SPEI, SPI, and scPDSI), each with its specific advantages and disadvantages and we extend the analysis until the end of 2019. This is a very important aspect of our study, taking into account that the 2018–19 drought event set a new European drought benchmark (Hari et al., 2020). This paper has four main sections, including the introduction. In Sect. 2 we present the data and methods used in this study, while in Sect. 3 we describe the results of our study in detail. In Sect. 4 we present the main conclusions and outcomes of the paper.
As stated before, the main region of analysis for this study is Europe, but for most of the analyses employed through the paper we split the European domain into three separate macroregions (Iturbide et al., 2020). These regions, which were chosen following the recommendation from the 5th Assessment Reports of the IPCC (IPCC, 2014) are (a) the South Europe/Mediterranean region (MED), (b) Central Europe (CEU), and (c) North Europe (NEU) (Fig. S1 in the Supplement).
The monthly precipitation amount (PP), monthly mean air temperature (TT), and the potential evapotranspiration (PET) used in this study are obtained from the CRU TS v. 4.04 dataset (Harris et al., 2020). All analyzed data cover the 1902–2019 period and have a spatial resolution of . The use of the CRU TS v. 4.04 dataset prior to 1950 has been widely discussed (Mitchell and Jones, 2005; New et al., 2000; Sousa et al., 2011). The CRU TS v. 4.04 dataset originates from thousands of stations, distributed non-uniformly at global scale (Harris et al., 2020), with the highest density at the mid-latitudes (e.g., the US and Europe). Since our analysis is restricted to Europe, which includes a relatively homogenous number of stations both temporally and spatially (see Figs. 1 and S1 in Harris et al., 2020), we consider that the use of the CRU TS v. 4.04 dataset ensures a robust analysis over the period 1902–2019.
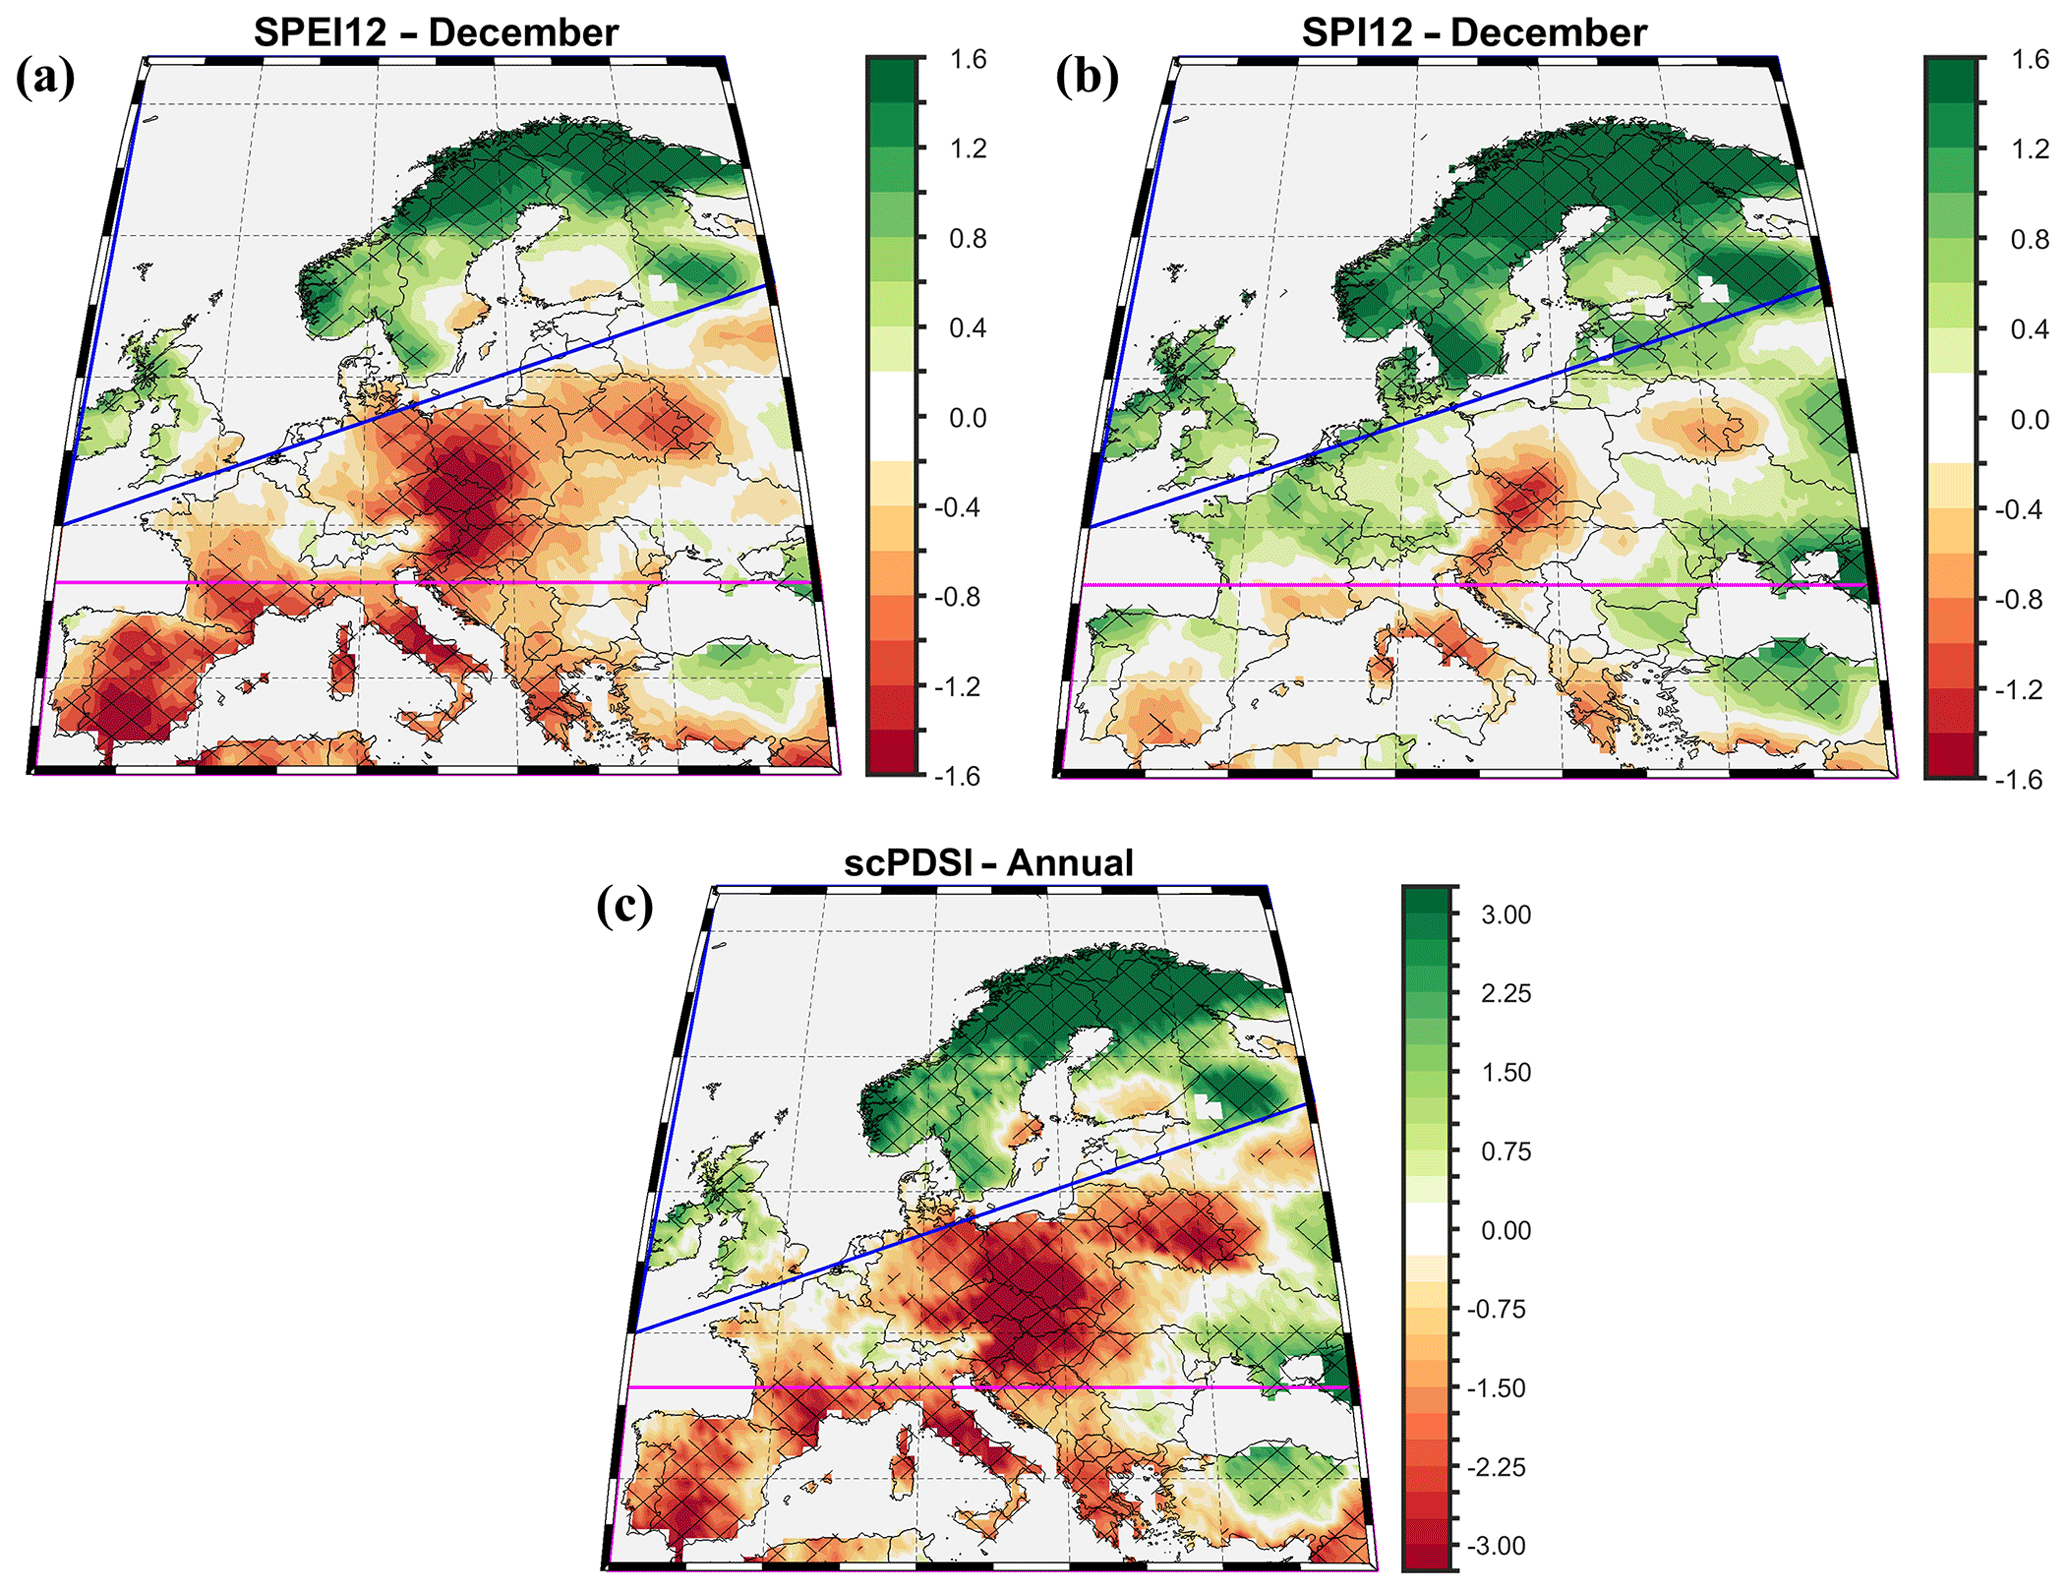
Figure 1(a) Linear trend of the December SPEI12; (b) as in (a) but for the SPI12, and (c) as in (a) but for the annual scPDSI. Stipples indicate statistically significant trends (99 % confidence level). Analyzed period: 1902–2019. Units: z scores/118 years.
For the drought analysis, we used three drought indices: the standardized precipitation index (SPI), the standardized precipitation evapotranspiration index (SPEI), and the self-calibrated Palmer drought severity index (scPDSI). All indices are computed based on the PP, TT, and PET data from the aforementioned CRU TS v. 4.04 dataset. The SPI takes into account the accumulated precipitation data, where the PP data have been fitted to a gamma distribution (McKee et al., 1993). The SPEI computation is based on the probability distribution of the difference between PP and PET (PP–PET). The data are normalized into a log-logistic probability distribution to obtain the SPEI (Vicente-Serrano et al., 2010). The potential evapotranspiration data were computed by employing the Penman–Monteith equation (Vanderlinden et al., 2008). One of the most important advantages of the SPI/SPEI is the representation of multiple timescales, which allows the monitoring of different drought types, such as meteorological, agricultural, and hydrological. Having a multi-scalar characteristic, both the SPI and SPEI were computed for different timescales (i.e., 1, 3, 6, 9, and 12 months). Negative values of the SPI and SPEI indicated dry conditions, while positive values indicate wet conditions. For the current study we used three different classes of drought (Lloyd-Hughes and Saunders, 2002): (i) moderate drought (SPI/SPEI values between −1 and −1.5), (ii) severe drought (SPI/SPEI values between −1.5 and −2), and (iii) extreme drought (SPI/SPEI values less than −2). Both the SPI and SPEI were calculated using the R package SPEI (https://cran.r-project.org/web/packages/SPEI/index.html, last access: 18 February 2021). To test if there are significant changes in the spatial distribution of the SPI and SPEI when using different types of distribution, we performed the same analysis as described above by applying the log-logistic distribution in the computation of the SPI and the Pearson III distribution to compute the SPEI, but no significant changes were noticed (e.g., the correlation coefficients of the SPI/SPEI computed with different distributions vary between 0.98 and 0.99). Thus, in the current study, we decided to show the results based on the widely used candidate distributions: gamma for the SPI and log-logistic for the SPEI.
The scPDSI is based on the well-known Palmer drought severity index (PDSI). Nevertheless, because of data limitations and regionalization used to derive the weighting and calibration algorithm, the original PDSI is not suitable for all regions (Burke et al., 2006). In this respect, here we use the scPDSI, which automatically calibrates the behavior of the index at different locations by replacing the empirical constant with dynamically calculated values (Wells et al., 2004). As in the case for the SPI and SPEI, we have also defined three different drought classes for the scPDSI: (i) moderate drought (scPDSI values between −2 and −3), (ii) severe drought (scPDSI values between −3 and −4), and (iii) extreme drought (scPDSI values less than −4).
To test the influence of TT and PET on the probability of occurrence of dry events, we employ a joint frequency analysis of compound events (e.g., the co-occurrence of low precipitation and dry events or high temperature and dry events) (Hao et al., 2019). In this study we focus on the SPEI for an accumulation period of 12 months (SPEI12), PET, PP, and TT averaged over the three regions: MED, CEU, and NEU. For each region and each pair of variables (i.e., PP and SPEI12, PET and SPEI12, and TT and SPEI12) we computed a binary variable (Y=1 for co-occurrence and Y=0 for non-occurrence), which indicates the occurrence based on PP/PET/TT and the SPEI12. For specific variable thresholds, the occurrence of compound events can be expressed as
where px indicates the precipitation threshold and tx indicates the temperature threshold, for example. For the current analysis we have chosen as thresholds the 80th percentile for TT and PET and the 20th percentile for the SPEI12 and PP.
3.1 Drought trends over the last 120 years
The spatial patterns of the Mann–Kendall trend statistics (Mann, 1945) are presented in Fig. 1 for the December SPEI12 (Fig. 1a), December SPI12 (Fig. 1b), and the annual scPDSI (Fig. 1c) for the 1902–2019 period. Positive values indicate a trend towards wetter conditions, while negative values indicate a trend towards drier conditions. The SPEI12 exhibits a very clear signal: most of the countries in MED and CEU show a significant decreasing trend (drying) over the last 120 years, while the countries in NEU exhibit a significant positive trend (wetting) (Fig. 1a). The SPI12 exhibits significant and negative (drying) trends only over small regions over CEU (e.g., the Czech Republic, Slovakia, Hungary, Belarus, and Poland) and over MED (e.g., Italy, southern Spain, Albania, and Greece) and a positive trend (wetting) over NEU (Fig. 1b). Similar results, based on the SPI12, have been found by Vicente-Serrano et al. (2021). In their study extending back to 1851, Vicente-Serrano et al. (2021) have shown that the SPI12 exhibits positive trends over the UK and Central Europe, and negative trends over Italy and the Balkans. The results based on the annual scPDSI are similar to the ones observed for the SPEI12: a significant drying trend for MED and CEU, with small exceptions over Ukraine and Turkey and a significant wetting trend over NEU (Fig. 1c).
At shorter timescales (e.g., 3 months) there is a clear seasonal signal in the evolution of the drought phenomenon. During winter (February SPEI3 and SPI3), NEU and large parts of CEU, except the Czech Republic, are characterized by a wetting trend over the last 120 years (Fig. S2a and b in the Supplement), while for MED no significant trend is observed. In spring, the May SPEI3 indicates a significant drying trend over most of the countries in the MED region and over the eastern part of CEU region and a wetting trend in the northern part of NEU (Fig. S2c in the Supplement). The May SPI3 shows a different perspective: no significant (wetting or drying) trend is observed in CEU and MED. For NEU, The May SPI3 captures the same features as the May SPEI3: a significant wetting trend over the northern part of NEU (Fig. S2d in the Supplement). The August SPEI3 features a significant drying trend over MED and CEU, with the highest drying amplitude over the Iberian Peninsula, and a significant wetting trend over the northern part of NEU (Fig. S2e in the Supplement). The significant drying trend over MED and CEU are not visible in the August SPI3, but the wetting trend over the northern part of NEU, is captured by the August SPI3, similar to the August SPEI3 (Fig. S2f in the Supplement). In autumn, both the November SPEI3 and SPI3 indicate a significant wetting trend over NEU and no significant changes over MED and CEU (Fig. S2g and h in the Supplement).
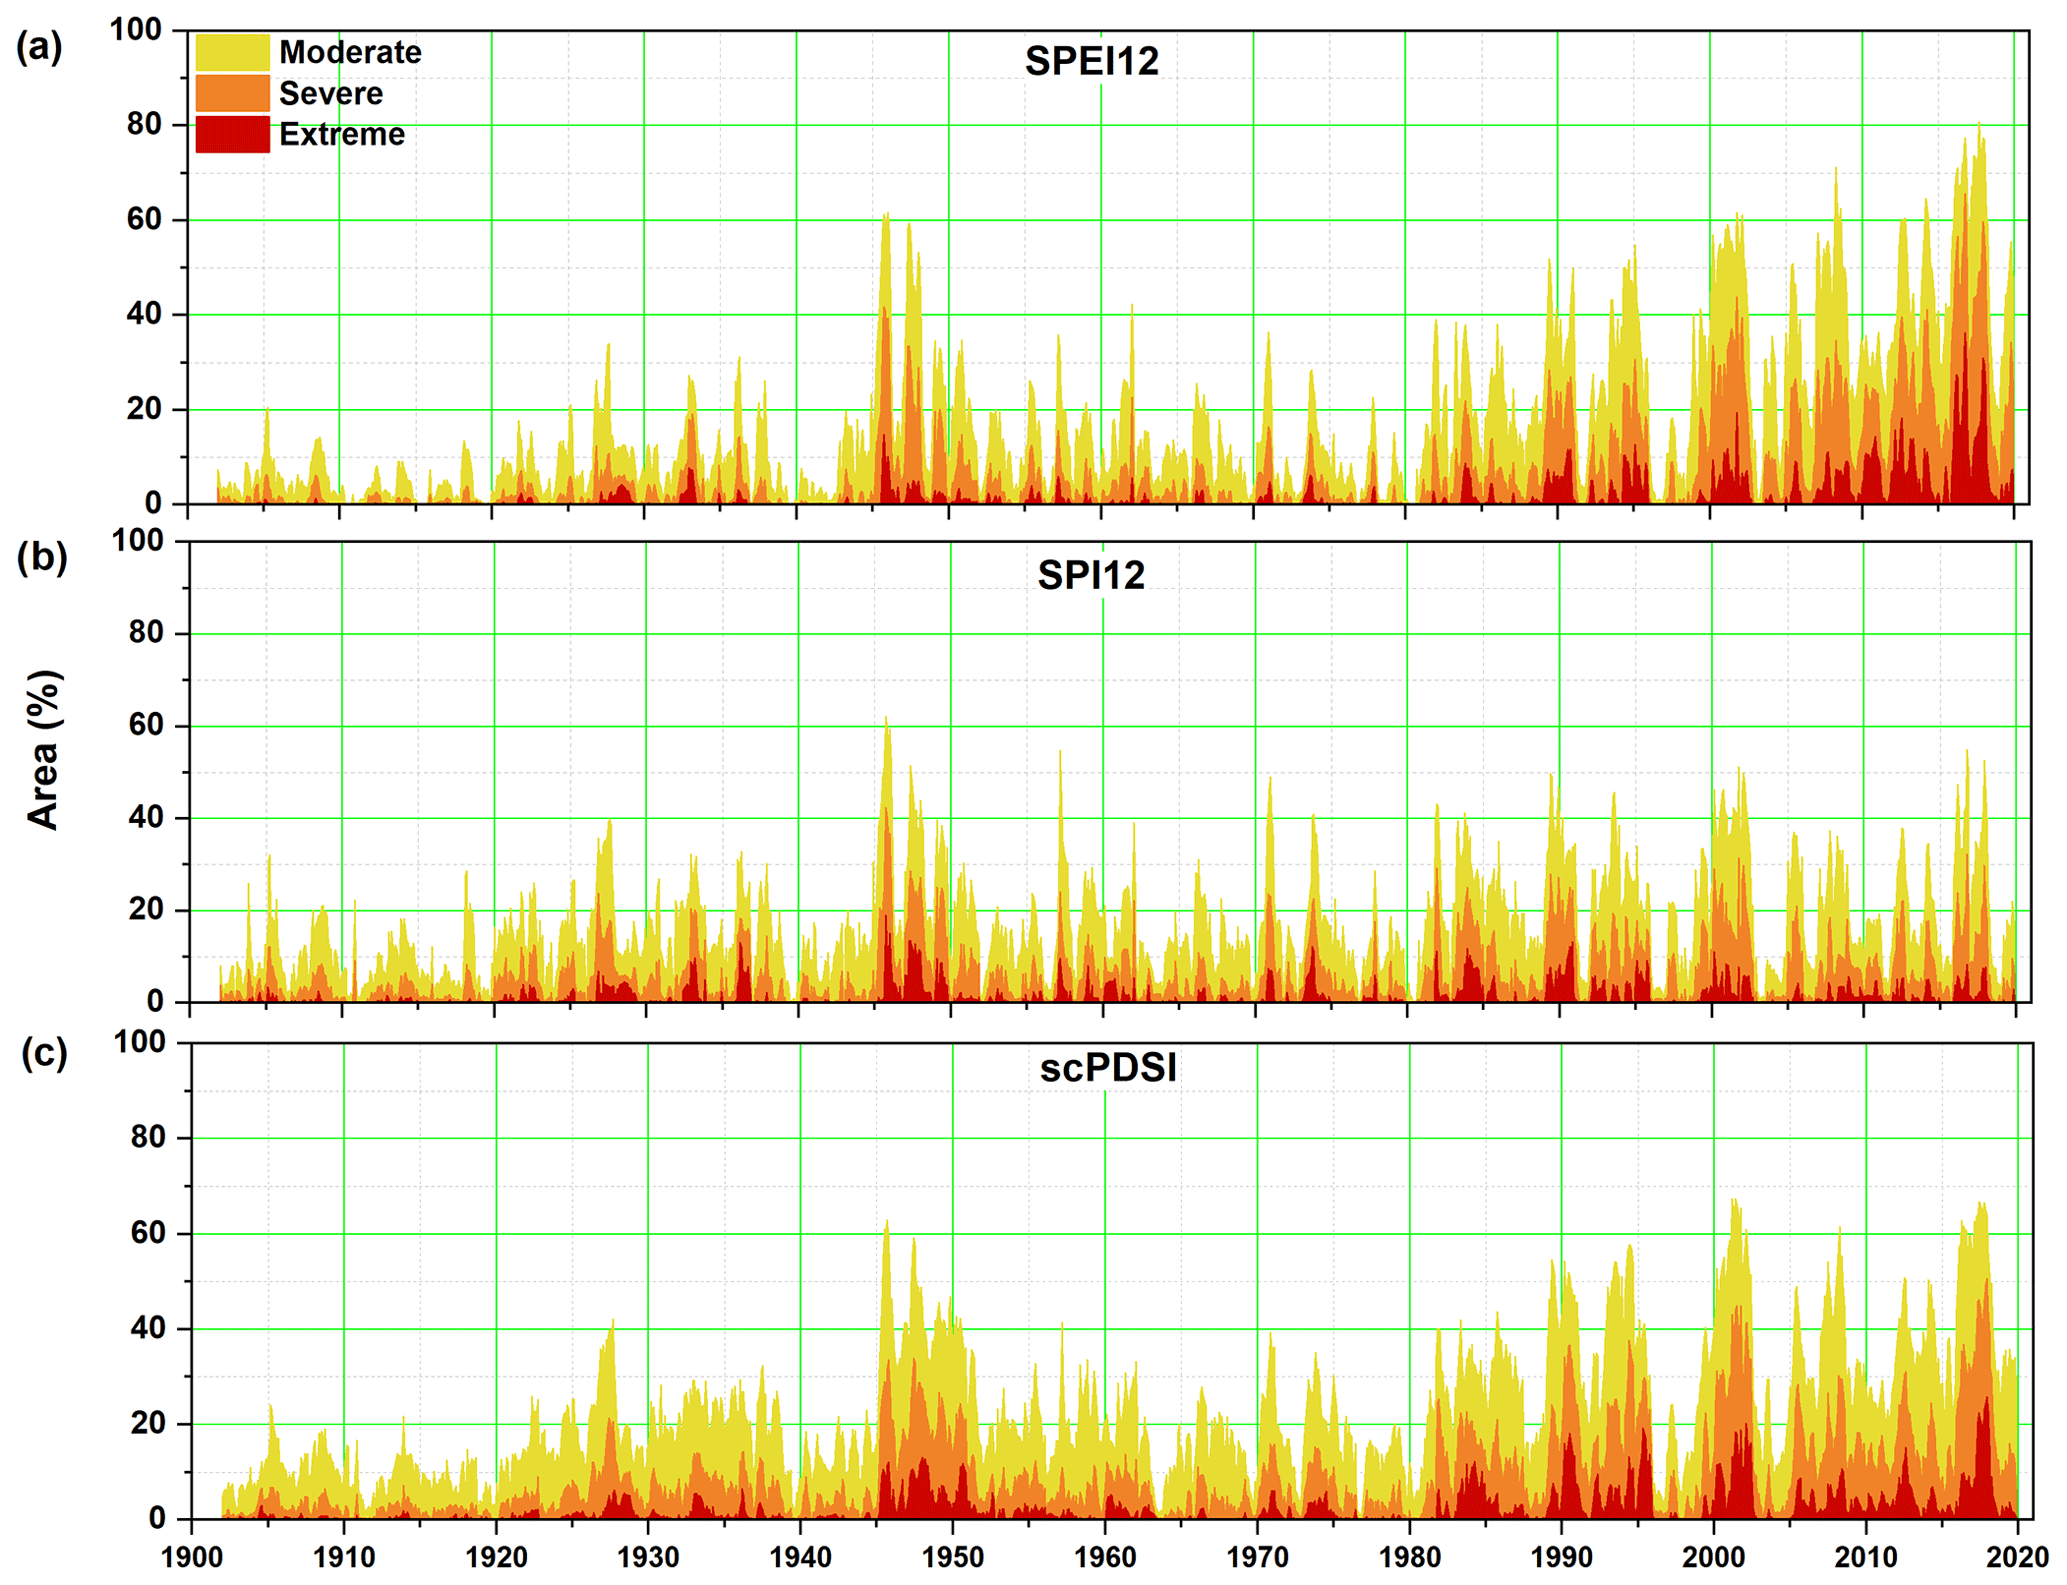
Figure 2Temporal evolution of the percentage area affected by droughts over MED for the (a) SPEI12, (b) SPI12, and (c) scPDSI for three drought severity categories: moderate (yellow), severe (orange), and extreme (dark red). See text for the definition of the drought categories.
From the analyses above, we can see that there are differences in the drought evolution over the last 120 years as reflected by the SPI and SPEI/scPDSI, especially over MED and CEU. This might be due to the fact that in the computation of the SPEI the potential evapotranspiration, and hence temperature, is included. To test the influence of PET and TT variability on the difference observed between the SPEI and SPI, we also computed the seasonal PET, TT, and PP trends over the European region (Fig. S3 in the Supplement). PET is characterized by a significant positive trend (increased potential evaporation) over MED and CEU and the southern part of NEU in spring (Fig. S3d in the Supplement) and summer (Fig. S3g in the Supplement), with the highest amplitude in summer over the MED and CEU. A positive and significant trend is also observed in autumn (Fig. S3j in the Supplement) but just over the western part of CEU and over MED. Seasonal precipitation trends follow the same pattern as those obtained from the seasonal SPI3: a significant wetting trend over NEU in all seasons (Fig. S3b, e, h, and k in the Supplement). In spring, summer, and autumn, no significant precipitation changes are observed over MED and CEU. In the case of the seasonal mean air temperature, the trend signal is very clear: in all seasons there is a significant warming over all analyzed regions (Fig. S3c, f, i, and l in the Supplement). In winter and spring, the warming with the highest amplitude is observed over the eastern part of Europe, while in summer the highest amplitude is observed over the Iberian Peninsula and Austria.
3.2 Drought area
Europe has experienced a number of extremely dry summers within the last decade (i.e., 2015, 2018, and 2019), which have already been documented in previous studies (Bakke et al., 2020; Hari et al., 2020; Ionita et al., 2017; Laaha et al., 2017). To put the last decade drought events into a longer perspective, we computed the drought area for MED, CEU, and NEU, affected by three types of drought: moderate (SPEI12/ SPI12 between −1 and −1.5, and scPDSI between −2 and −3), severe (SPEI12/ SPI12 between −1.5 and −2, and scPDSI between −3 and −4), and extreme (SPEI12/SPI12 smaller than −2, and scPDSI smaller than −4), considering the 12-month SPEI (December SPEI12) and SPI (December SPI12) and the annual scPDSI. For the MED region, a significant increase in the area affected by all types of drought can be observed for the SPEI12, SPI12, and scPDSI (Fig. 2, Table S1 in the Supplement). The years with the largest area affected by all types of drought (based on the SPEI12 and scPDSI) were recorded over the last decade, the peak being observed over the period 2016–2017 (Fig. 2a and c). The year with the largest affected area by drought, based on the SPI12, was 1946–1947 (Fig. 2b). Overall, the amplitude of the drought area is underestimated by the SPI12 compared to the SPEI12 and scPDSI over the last ∼30 years, since the SPI12 does not take into account temperature variability.
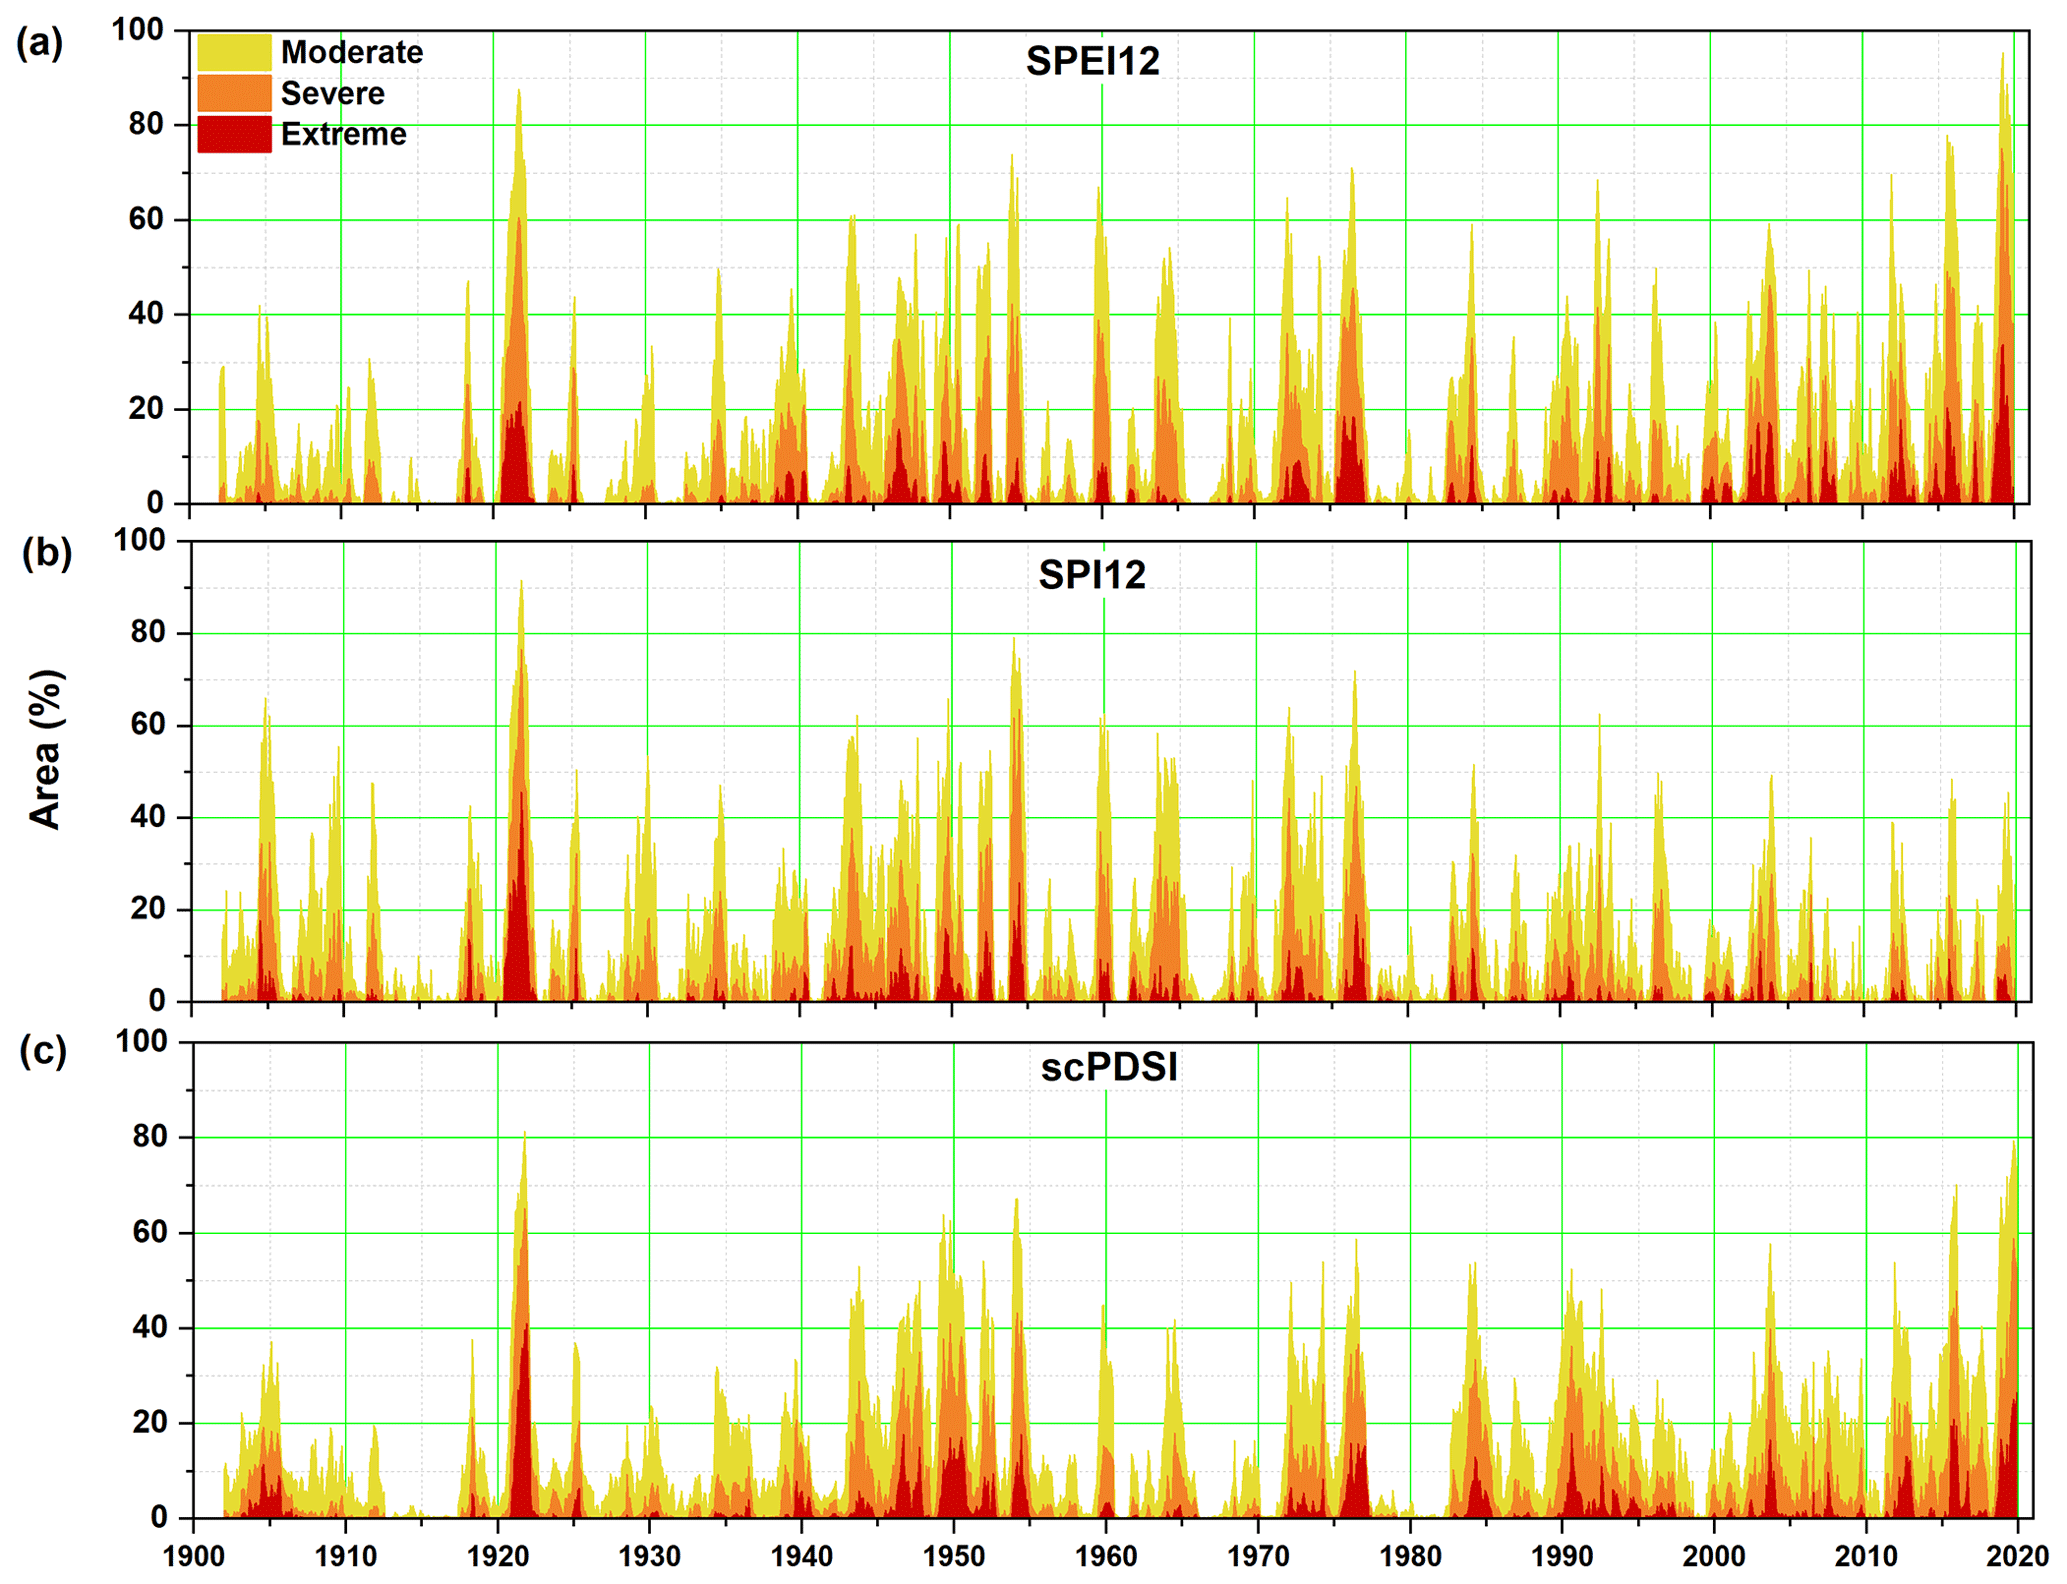
Figure 3Temporal evolution of the percentage area affected by droughts over CEU for the (a) SPEI12, (b) SPI12, and (c) scPDSI for three drought severity categories: moderate (yellow), severe (orange), and extreme (dark red). See text for the definition of the drought categories.
In the case of the CEU region, the driest years based on the SPEI12 (Fig. 3a) and scPDSI (Fig. 3c) in terms of spatial coverage (∼95 %/71 %/34 %) affected by moderate/severe/extreme drought are 1920–1921, 1976, 2015, and 2018–2019. As in the case of MED, the drought events over roughly the last three decades are underestimated when we take into consideration the SPI12 (Fig. 3b). The driest years based on the SPI12 in terms of the largest spatial coverage (∼95 %/78 %/45 %) affected by moderate/severe/extreme drought are 1954 and 1976, with the maximum spatial coverage in 1920–1921. While for MED there was a significant increase in the area affected by drought over the last ∼120 years, in the case of CEU there are altering periods of intense dryness and wetness, with a spatial coverage of almost ∼90 % characterized by prolonged drought conditions and periods of no drought or reduced drought in terms of spatial coverage. There are significant and positive trends in the spatial extent of all types of droughts for the SPEI12 and scPDSI and significant and negative trends for the SPI12 (Table S1 in the Supplement).
The spatial coverage of droughts for NEU shows a relatively different picture compared to MED and CEU. Over the last 30 years there are relatively fewer drought events recorded and their spatial extent is rather small compared to the ones from the beginning of the 20th century (Fig. 4). For the NEU region, the SPEI12, SPI12, and scPDSI show a rather similar variability: higher spatial extent of drought events between 1900–1922, 1935–1950, 1959–1962, and 1970–1980. The driest years in terms of spatial coverage are 1909, 1940–1942, 1947, and 1976. The spatial coverage, for all types of drought, shows a significant and negative trend for all analyzed indices (SPEI12, SPI12, and scPDSI; Table S1 in the Supplement).
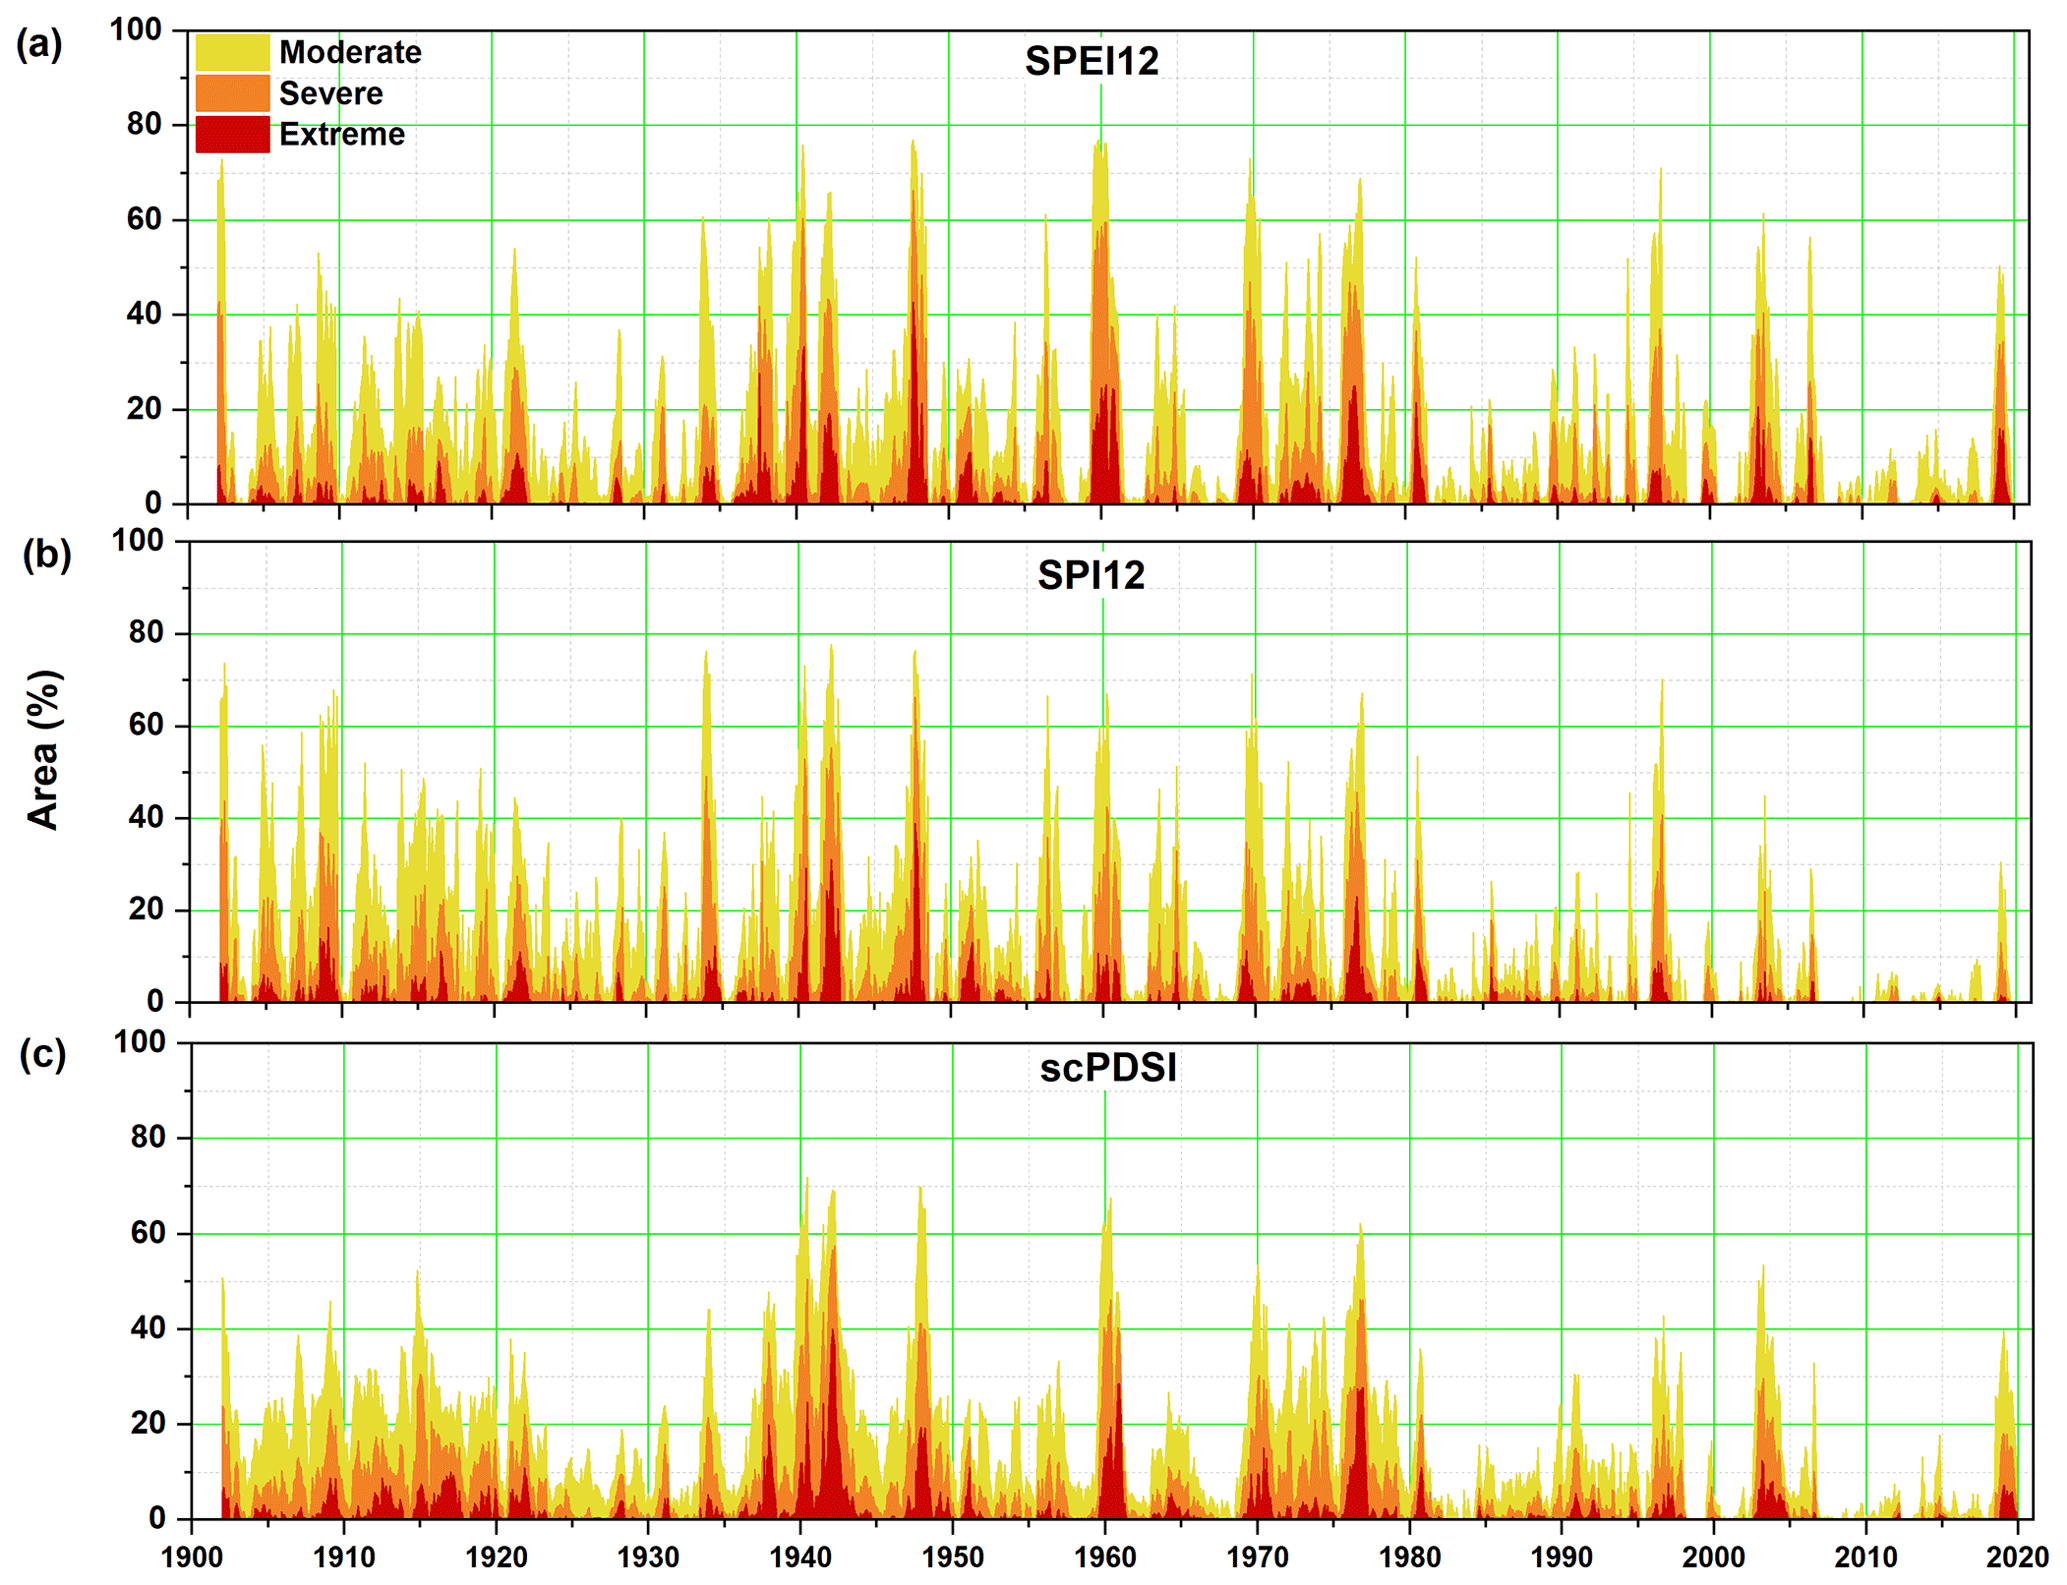
Figure 4Temporal evolution of the percentage area affected by droughts over NEU for the (a) SPEI12, (b) SPI12, and (c) scPDSI for three drought severity categories: moderate (yellow), severe (orange), and extreme (dark red). See text for the definition of the drought categories.
3.3 Drought duration maps
To provide a complete picture of the drought hotspots over the last ∼120 years we split the dataset into 12 different time periods, covering each decade since the beginning of the 20th century up to the end of 2019. We chose these periods to have an equal number of months/years (120 months/10 years) for all of the analyzed periods. The only exceptions are the beginning and the end of the dataset; the 1902–1910 and 2011–2019 time intervals have 108 months and 9 years each. The aim of splitting the data into short time periods was to test if there were significant changes in the drought conditions on a decadal timescale. The analysis is performed for the SPEI12 and SPI12 for three different drought categories, as in the previous section: moderate (SPEI12/SPI12 between −1 and −1.5), severe (SPEI12/SPI12 between −1.5 and −2), and extreme (SPEI12/SPI12 smaller than −2). The drought frequency in each category (moderate (Figs. 5/S4), severe (Figs. 6/S5), and extreme (Figs. 7/S6)) is expressed as the number of months per time period in a given category when the SPEI12 and SPI12 were below a certain threshold.
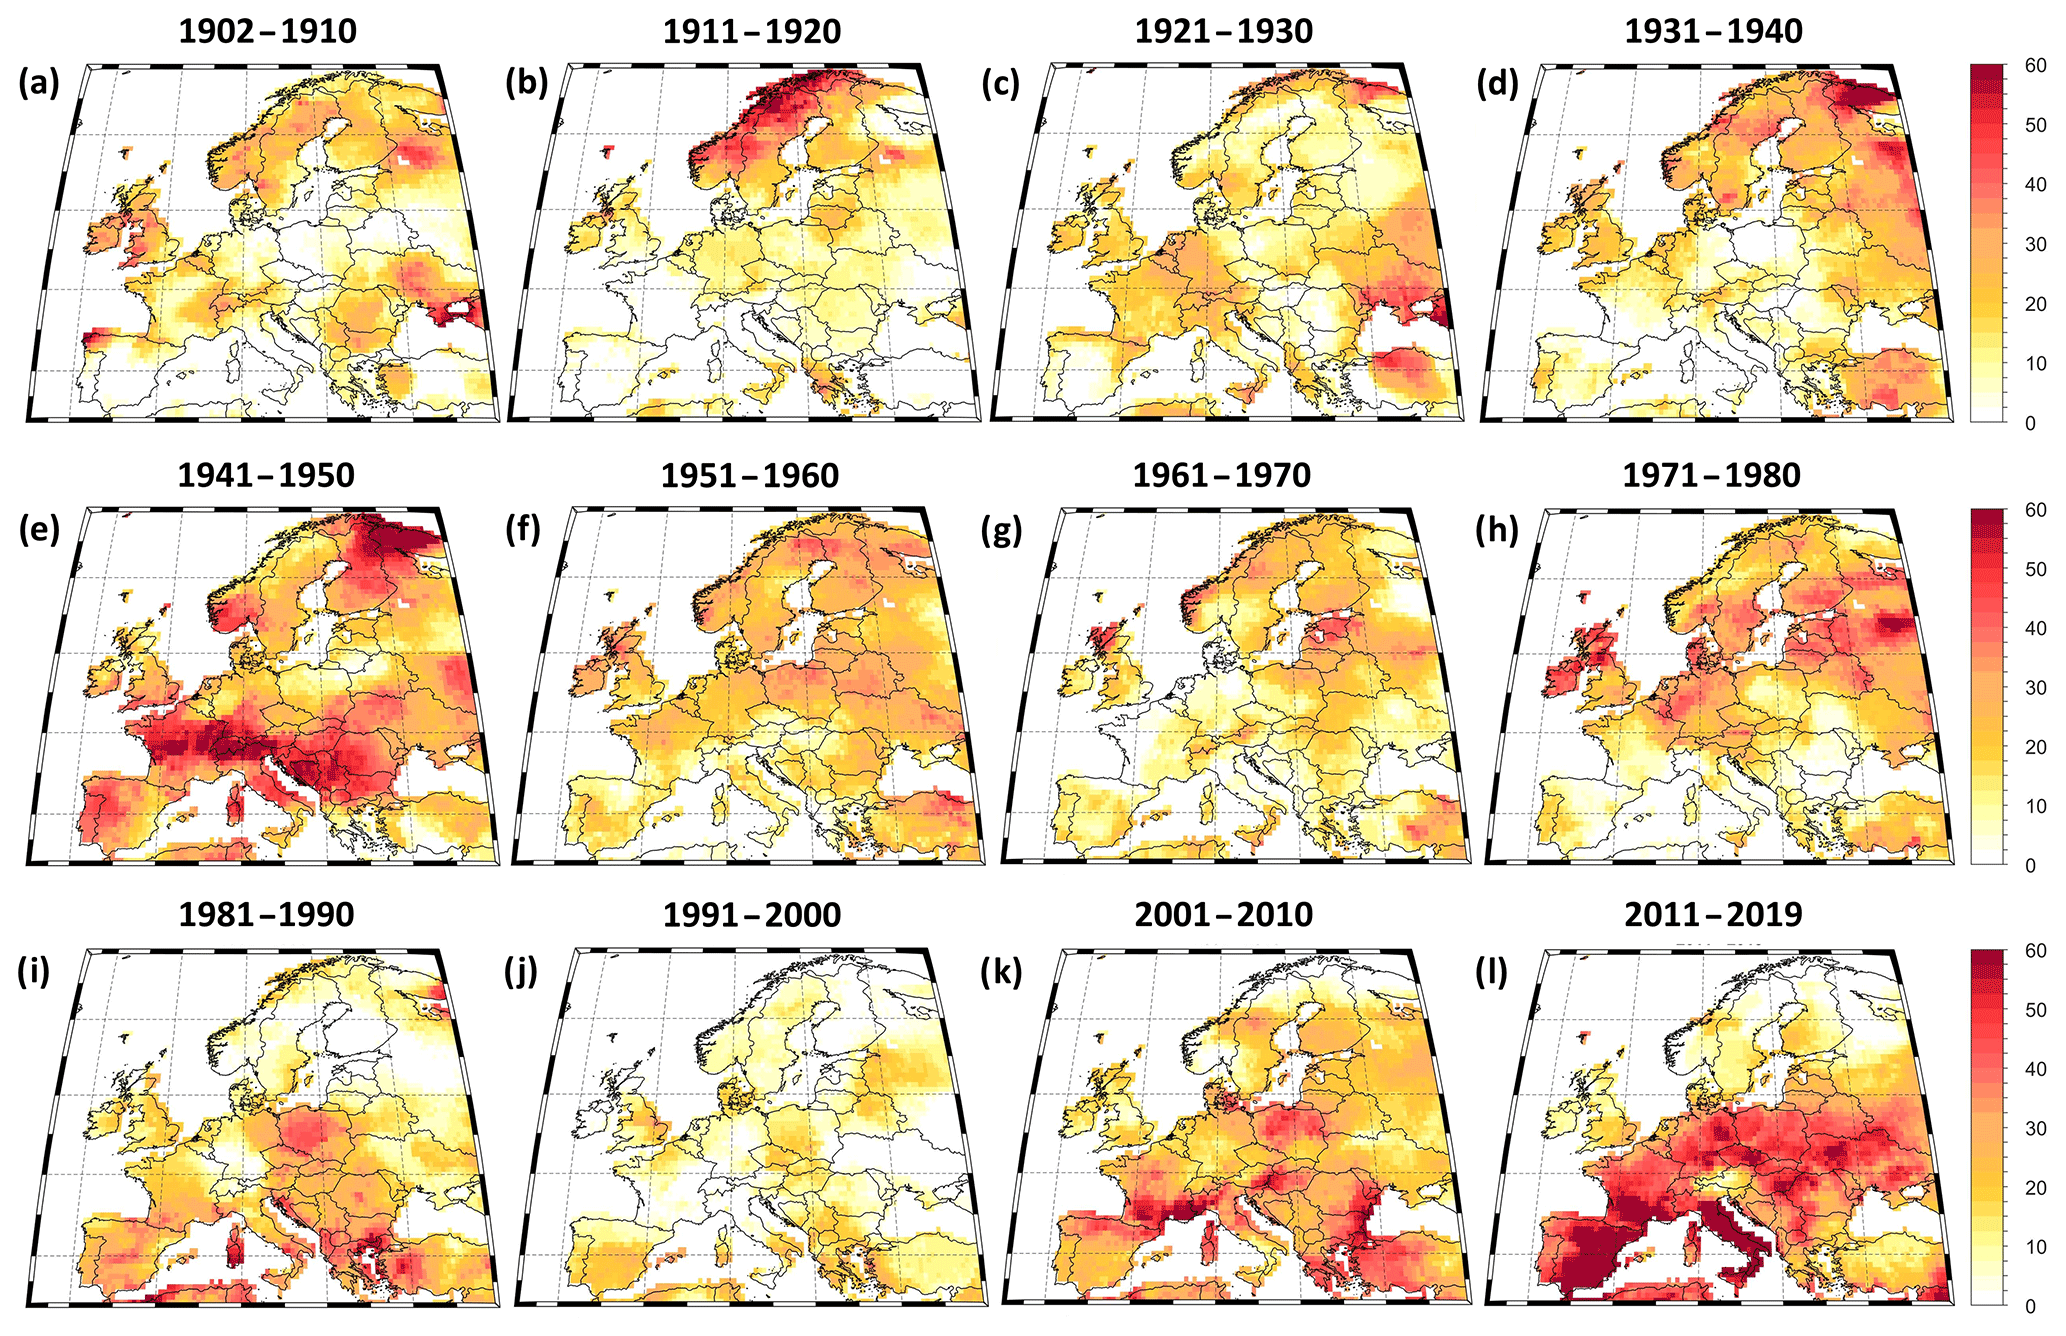
Figure 5Decadal frequency of drought duration for moderate drought (SPEI12 between −1.0 and −1.5). (a) 1902–1901, (b) 1911–1920, (c) 1921–1930, (d) 1931–1940, (e) 1941–1950, (f) 1951–1960, (g) 1961–1970, (h) 1971–1980, (i) 1981–1990, (j) 1991–2000, (k) 2001–2010, and (l) 2011–2019. Units: number of months per period.
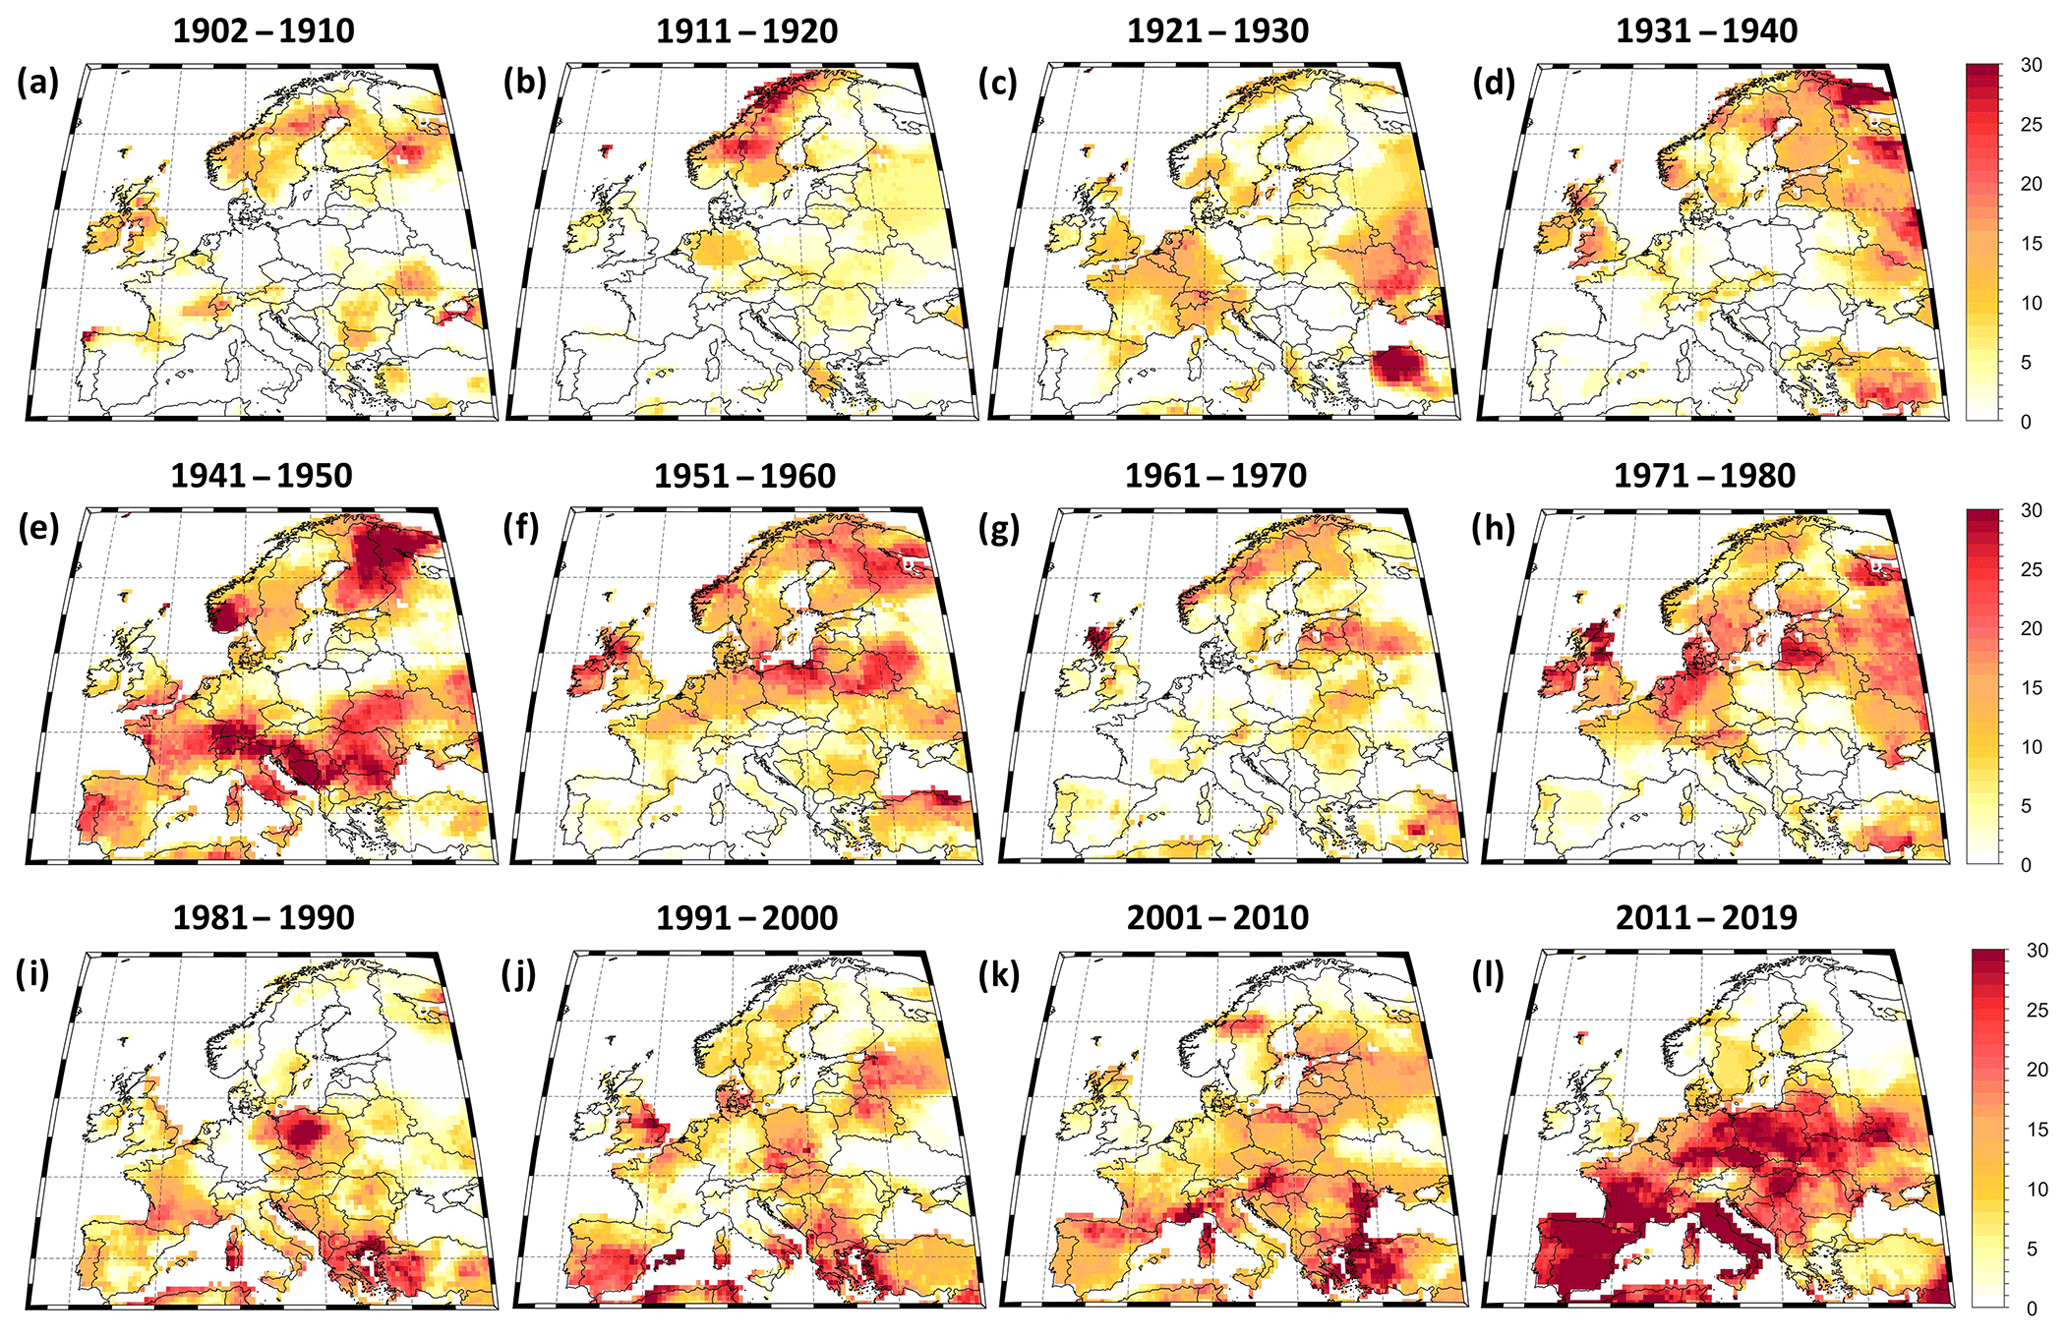
Figure 6Decadal frequency of drought duration for severe drought (SPEI12 between −1.51 and −2). (a) 1902–1901, (b) 1911–1920, (c) 1921–1930, (d) 1931–1940, (e) 1941–1950, (f) 1951–1960, (g) 1961–1970, (h) 1971–1980, (i) 1981–1990, (j) 1991–2000, (k) 2001–2010, and (l) 2011–2019. Units: number of months per period.
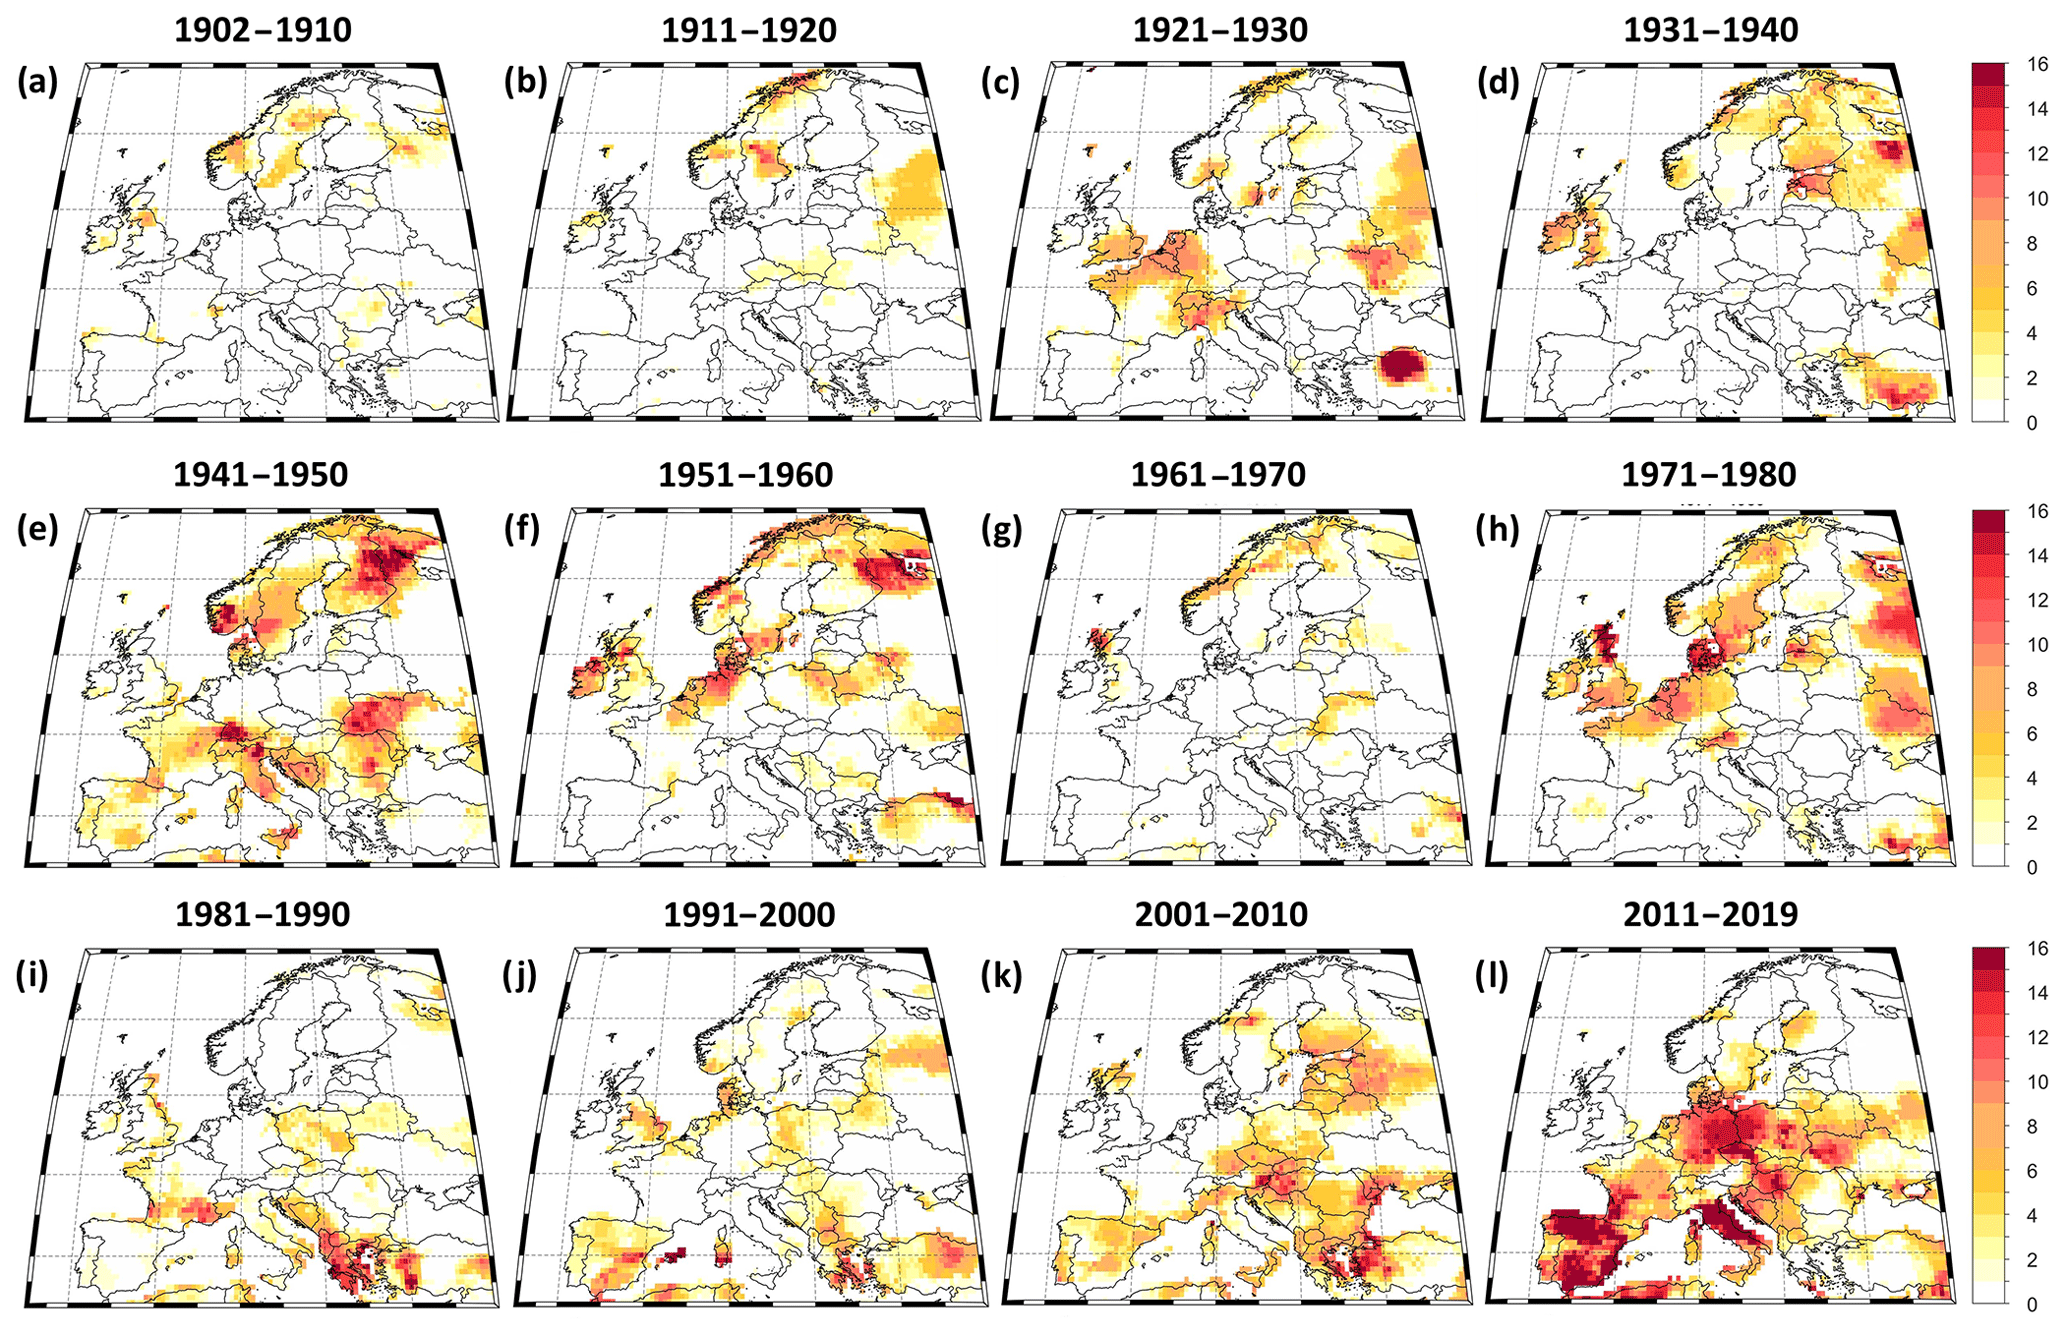
Figure 7Decadal frequency of drought duration for extreme drought (SPEI12 < −2). (a) 1902–1901, (b) 1911–1920, (c) 1921–1930, (d) 1931–1940, (e) 1941–1950, (f) 1951–1960, (g) 1961–1970, (h) 1971–1980, (i) 1981–1990, (j) 1991–2000, (k) 2001–2010, and (l) 2011–2019. Units: number of months per period.
In terms of moderate drought, based on the SPEI12 the decades characterized by a high frequency of dry events (more than 40 months per 10 years) are 1941–1950, 1971–1980, 2002–2010 and 2011–2019 (Fig. 5). Over the 1941–1950 decade, the drought hotspots are over the central, eastern, and northern parts of Europe, the only exception being the countries around the eastern part of the Baltic Sea (e.g., Poland, Lithuania, Latvia, and Estonia). Over the 2011–2019 decade, the drought hotspot is localized over MED and CEU. Over the first eight decades of our analyzed period (1902–1980), the northern part of Europe was characterized by a relatively high frequency of dry events, when compared with the last four decades of our analyzed period, for which the frequency of dry events is very low. Over the last 120 years, the European regions was characterized by the different spatial distribution of the moderate drought hotspots based on the SPI12 maps (Fig. S4 in the Supplement). The driest decades, based on the SPI12, are 1902–1910, 1941–1950, 1971–1980 and 1981–1990, respectively. Over the last three decades of the analyzed period, there is a clear reduction in the frequency of dry events over almost all analyzed regions (Fig. S4 in the Supplement). The driest decade is 1941–1950, when most of the European regions recorded up to 60 months per 10 years of moderate drought.
In terms of severe drought, based on the SPEI12 the decades characterized by a high frequency of dry events (more than 25 months per 10 years) are 1941–1950 and 2011–2019 (Fig. 6). Over the 1941–1950 decade, the drought hotspots are over Central Europe (e.g., northern Italy, the southern part of Germany, Croatia, Romania, and Ukraine), the southern part of Norway, and Finland. Over the 2011–2019 decade, the severe drought hotspot is localized, as in the case of moderate drought, over MED and CEU. The driest decades in terms of drought duration according to the SPI12 maps are 1911–1920 over the northern part of Fennoscandia, 1941–1950 over MED, CEU, and NEU, except the countries around the eastern side of the Baltic Sea, and 1981–1990 over a region stretching the eastern part of Europe (Fig. S5 in the Supplement). Overall, throughout the analyzed period, there is an inhomogeneous evolution of severe drought hotspots.
In Fig. 7, the hotspots representing the extreme drought events are shown. For each decade covering the period 1902–2000 there are relatively just few months (up to 10 months per 10 years) when extreme drought conditions were recorded over different small regions throughout the European continent. Over the 2001–2010 decade a hotspot of extreme drought can be observed based on the SPEI12, mostly over the eastern part of Europe. The 2011–2019 decade is characterized by a high frequency of extreme dry events over MED and CEU, the hotspots being over Germany, the Czech Republic, Spain, and Italy. The frequency distribution of the extreme drought based on the SPI12 shows different results. The frequency of extreme dry events over the last three decades is very small or non-existent over all analyzed regions (Fig. S6 in the Supplement). Opposite to this, there is a higher frequency of dry events over Central Europe and the easternmost part of Europe over the 1921–1930 decade and a relatively high frequency of dry events over Sweden and the southern part of Europe.
3.4 Compound events: PP vs. TT vs. PET
As previously mentioned, due to the consideration of potential evapotranspiration in the computation of the SPEI, and hence temperature, the drought index reflected by the SPEI indicated a significant drying trend over MED and CEU at various timescales (e.g., 3 and 12 months), while the drought index reflected by the SPI showed opposite or no changes over these two regions. Moreover, we found a significant increase both in the frequency and the spatial extent of dry events over the last two decades over MED and CEU when using the SPEI12 and the opposite results when using the SPI12, which is solely based on the precipitation variability. To emphasize the influence of PP, PET, and TT on the variability of the SPEI12, in Fig. 8 we computed the changes in occurrence of concurrent extremes (e.g., low precipitation and drought, high temperature and drought, and high evapotranspiration and drought) by averaging the annual PP, TT, PET, and the SPEI12 over each region (MED, CEU, and NEU).
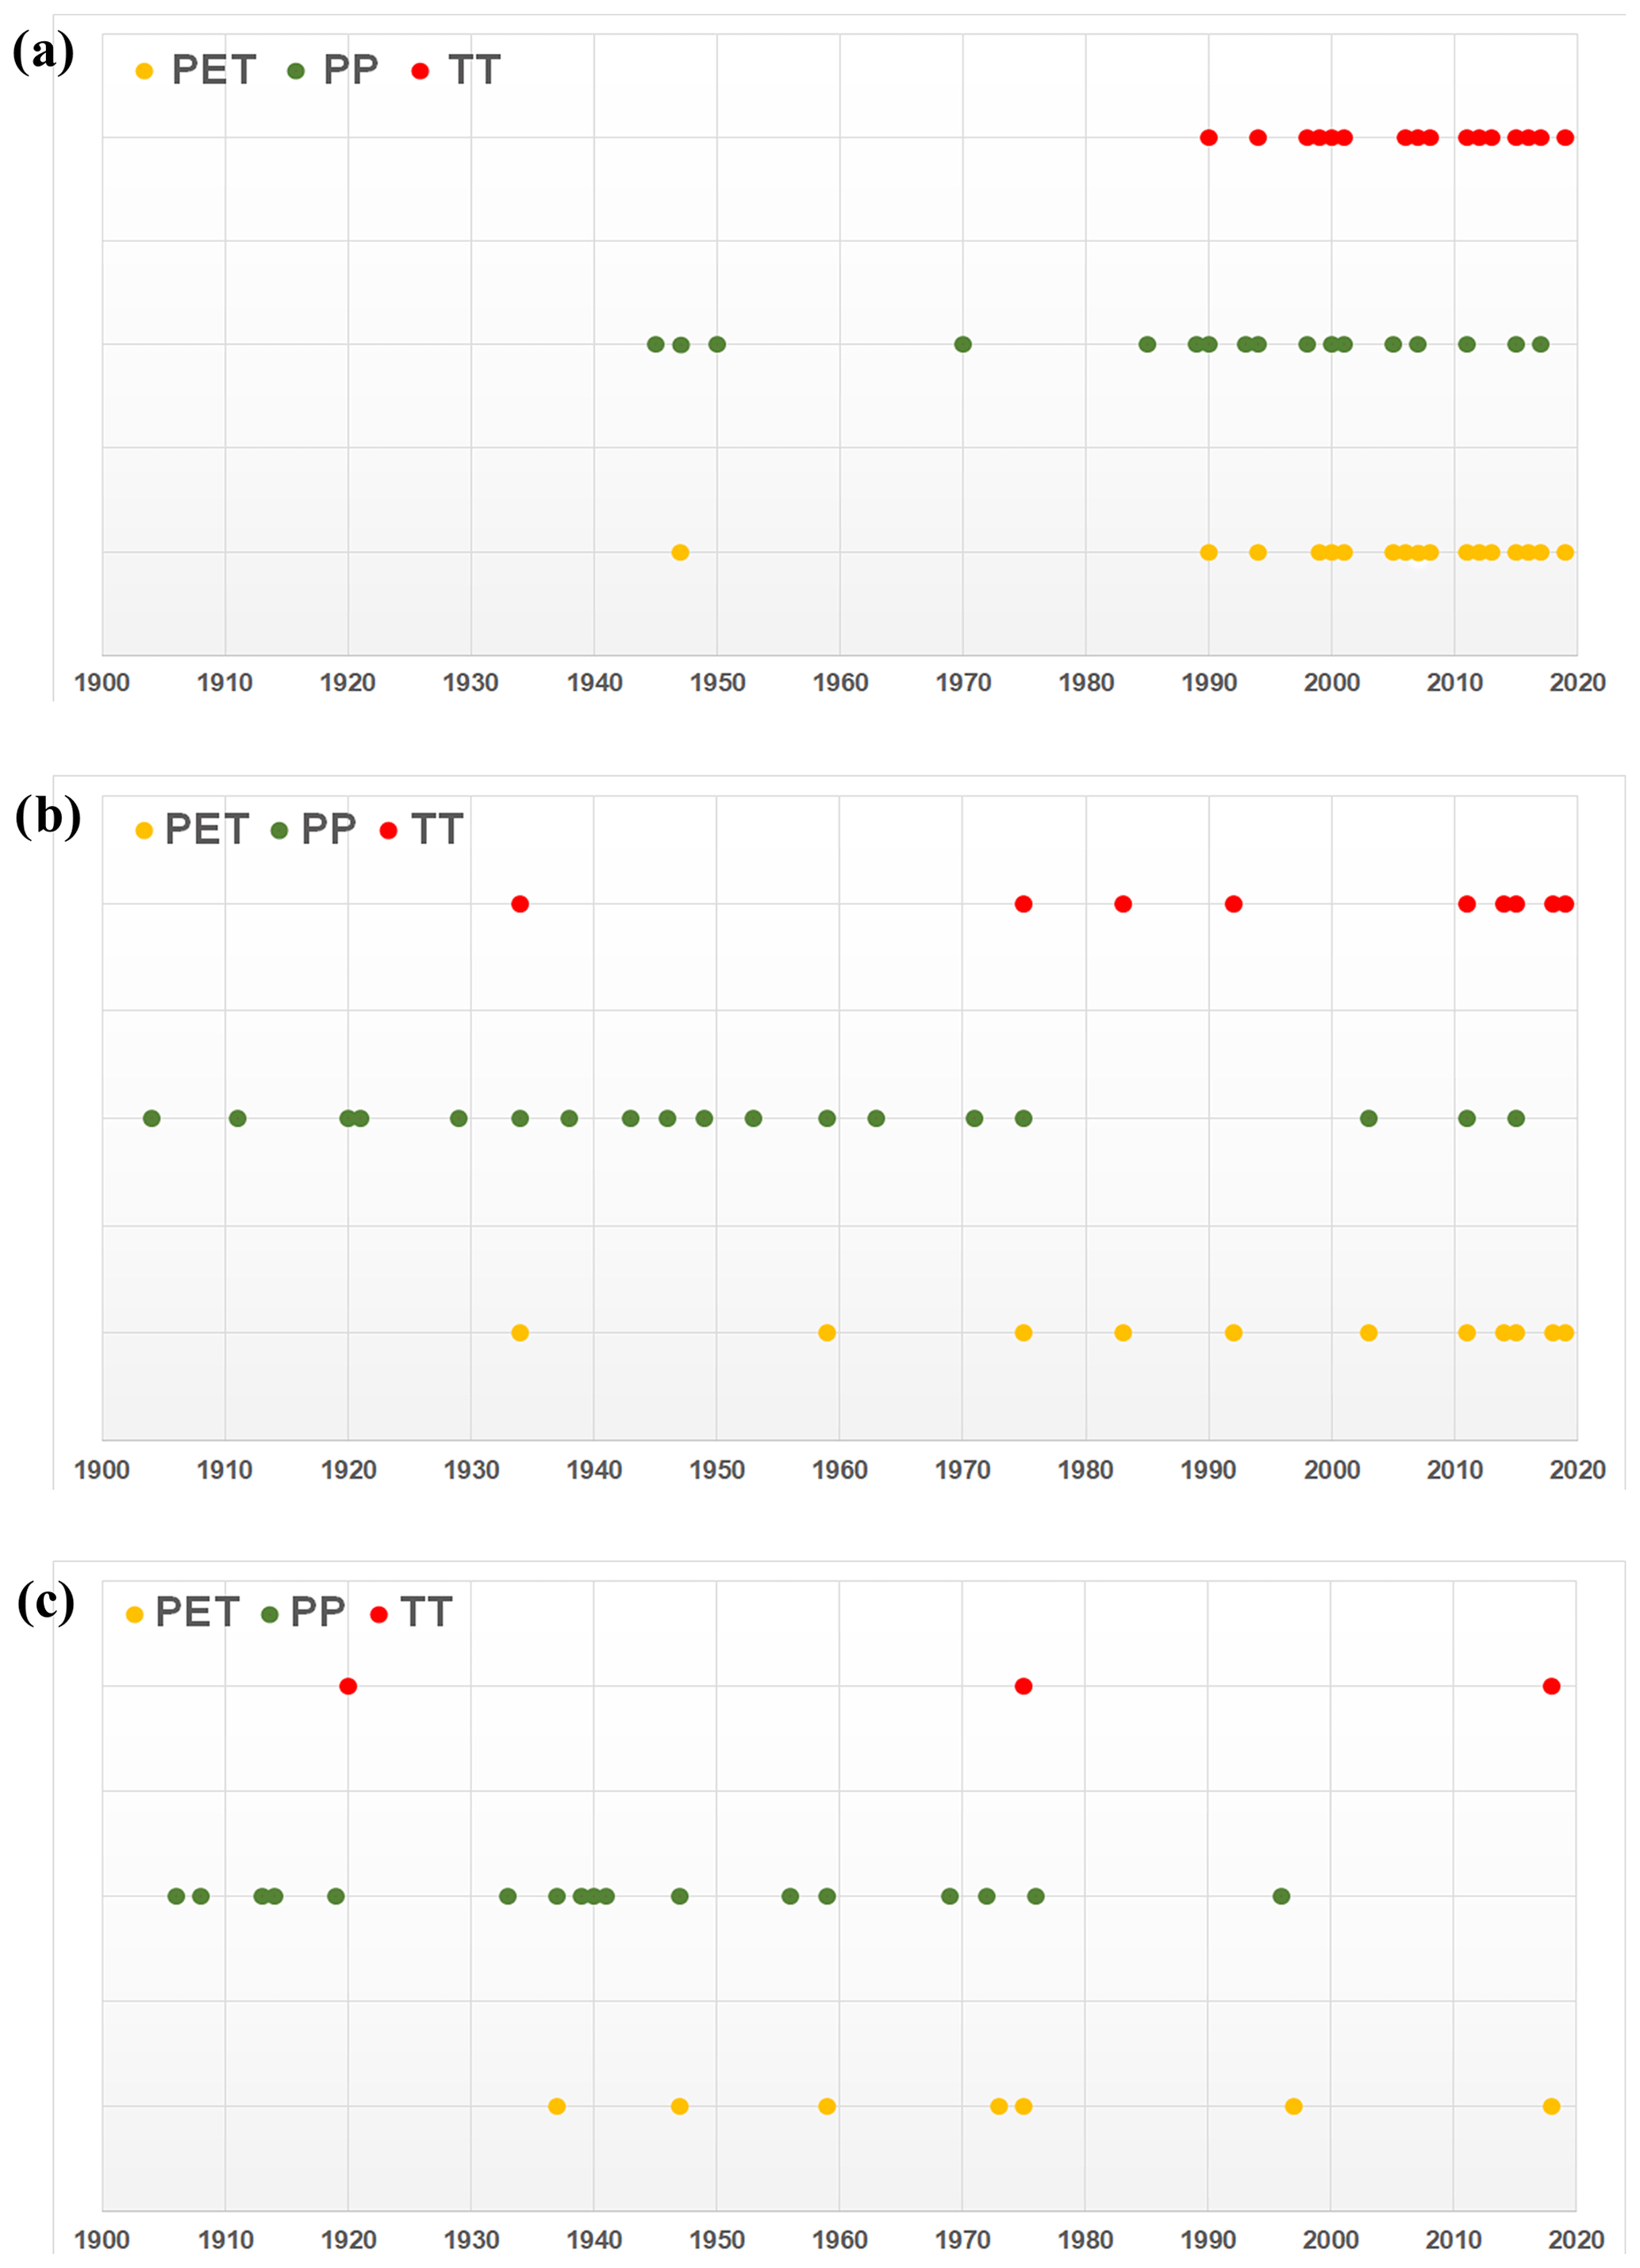
Figure 8(a) Occurrence of warm and dry events (TT80/SPEI1220; red dots), low precipitation and dry events (PP20/SPEI1220; green dots), and enhanced evaporation and dry events (PET80/SPEI1220; yellow dots) for the MED area. (b) As in (a) but for CEU and (c) as in (a) but for NEU. TT80/SPEI1220 indicates that we took into account the common years when the temperature was higher than the 80th percentile and the SPEI12 was smaller that the 20th percentile. PP20/SPEI1220 indicates that we took into account the common years when the precipitation was smaller than the 20th percentile and the SPEI12 was smaller that the 20th percentile. PET80/SPEI1220 indicates that we took into account the common years when the potential evapotranspiration was higher than the 80th percentile and the SPEI12 was smaller that the 20th percentile.
In the case of the MED region, the drought events that occurred before the 1990s were driven mainly by a precipitation deficit (Fig. 8a; green dots). Starting with the 1990s the occurrence of dry events was influenced not only by PP, but also by changes in TT (Fig. 8a; red dots) and PET (Fig. 8a; yellow dots). For the years 1999, 2006, 2008, 2012, 2013, 2016, and 2019 the drought events only occurred along with significant anomalies in TT and PET (Fig. S7 in the Supplement). For CEU, the co-occurrence between low precipitation and the SPEI12 has been a permanent feature over the period 1902–1976. After this period, the role of TT (Fig. 8b; red dots) and PET (Fig. 8b; yellow dots) becomes more important compared to that of PP. For the years 1983, 1992, 2014, 2018, and 2019 the drought events over the CEU region only occurred along with significant anomalies in TT (Fig. 8b; red dots) and PET (Fig. 8b; yellow dots). Over the last 40 years, there were just 3 years (i.e., 2003, 2011, and 2015) when the drought events were accompanied by a precipitation deficit (Fig. S8 in the Supplement). In the case of NEU, all dry years were accompanied by low precipitation years, except for the year 2018 (Fig. 8c; green dots). The role of TT (Fig. 8c; red dots) and PET (Fig. 8b; yellow dots) in driving the occurrence of dry events was recorded just for 2 years: 1976 and 2018 (Fig. S9 in the Supplement). Thus, in the case of NEU, the role of precipitation dominates the occurrence of dry years throughout the analyzed period. Overall, for MED and CEU there is a significant increase (99 % significance level) in the probability of co-occurrence of compound events related to warm and dry events and high evaporation and drought over the last three decades and no significant change in the probability of occurrence of compound events over NEU. We also tested the 90th and the 75th percentile as a threshold for TT/PET and the 10th and the 25th percentile as a threshold for the SPEI/PP (Figs. S10 and S11 in the Supplement, respectively), but we could not find any significant change in the joint frequency analysis of the compound events when using different thresholds for the computation of the joint events (e.g., for MED and CEU there is a significant increase in the co-occurrence of compound events related to warm and dry events and high evaporation and drought over the last three decades and no significant change in the probability of occurrence of compound events over NEU).
3.5 Rank maps and extreme dry events
To analyze the extremeness and the spatial extent of the top five drought events over Europe we use the ranking map methodology (Bakke et al., 2020; Ionita et al., 2017). In this respect, we compute the ranking maps of the SPEI12 and SPI12 for each month (i.e., January–December) over the 1902–2019 period. The five driest years (the lowest SPEI12 recorded at each grid point) from January to December are shown in Fig. 9. The most striking feature of the rank maps is the persistence of the extreme drought events in 1921 and 2018–2019 from January to December. March 1921 ranks as the driest on record over the eastern part of Ukraine and the western part of Russia. This event continues to rank as the driest on record, over the same region, until July 1921. From August 1921 until January 1922 this event ranks as the driest on record, shifting its center from western Russia to the northern part of France and southern part of the UK (Fig. 9a and j–l). The evolution of the monthly SPEI12 from November 1920 until January 1922 (Fig. S12 in the Supplement) indicates that this event had its origin over Ukraine and the western part of Russia in the first months of 1921 and then moved westward towards Europe, reaching the highest amplitude over France and the southern part of the UK from November 1921 to January 1922 (Fig. S12 in the Supplement). The year 1921 was also the driest on record, in terms of low flow, in the Rhine and Weser catchment areas (Ionita and Nagavciuc, 2020). The drought event in 1921–1922 was driven mainly by a precipitation deficit over the central and eastern parts of Europe (Figs. 10a and S8 in the Supplement) and to a lesser extent by TT and PET. The spatial extent of the 1921–1922 event is much higher if we take into account the SPI12 compared to the SPEI12 (left column of Fig. 11). This pattern can also be observed based on the SPI12 monthly rank maps (Fig. S13 in the Supplement). The SPI12 rank maps follow the same pattern as the SPEI12 for the 1921–1922 event. In the case of extreme drought, the area affected by drought in 1921–1922 based on the SPI12 (Fig. 11c), is almost double compared to the area covered by drought based on the SPEI12 (Fig. 11b).
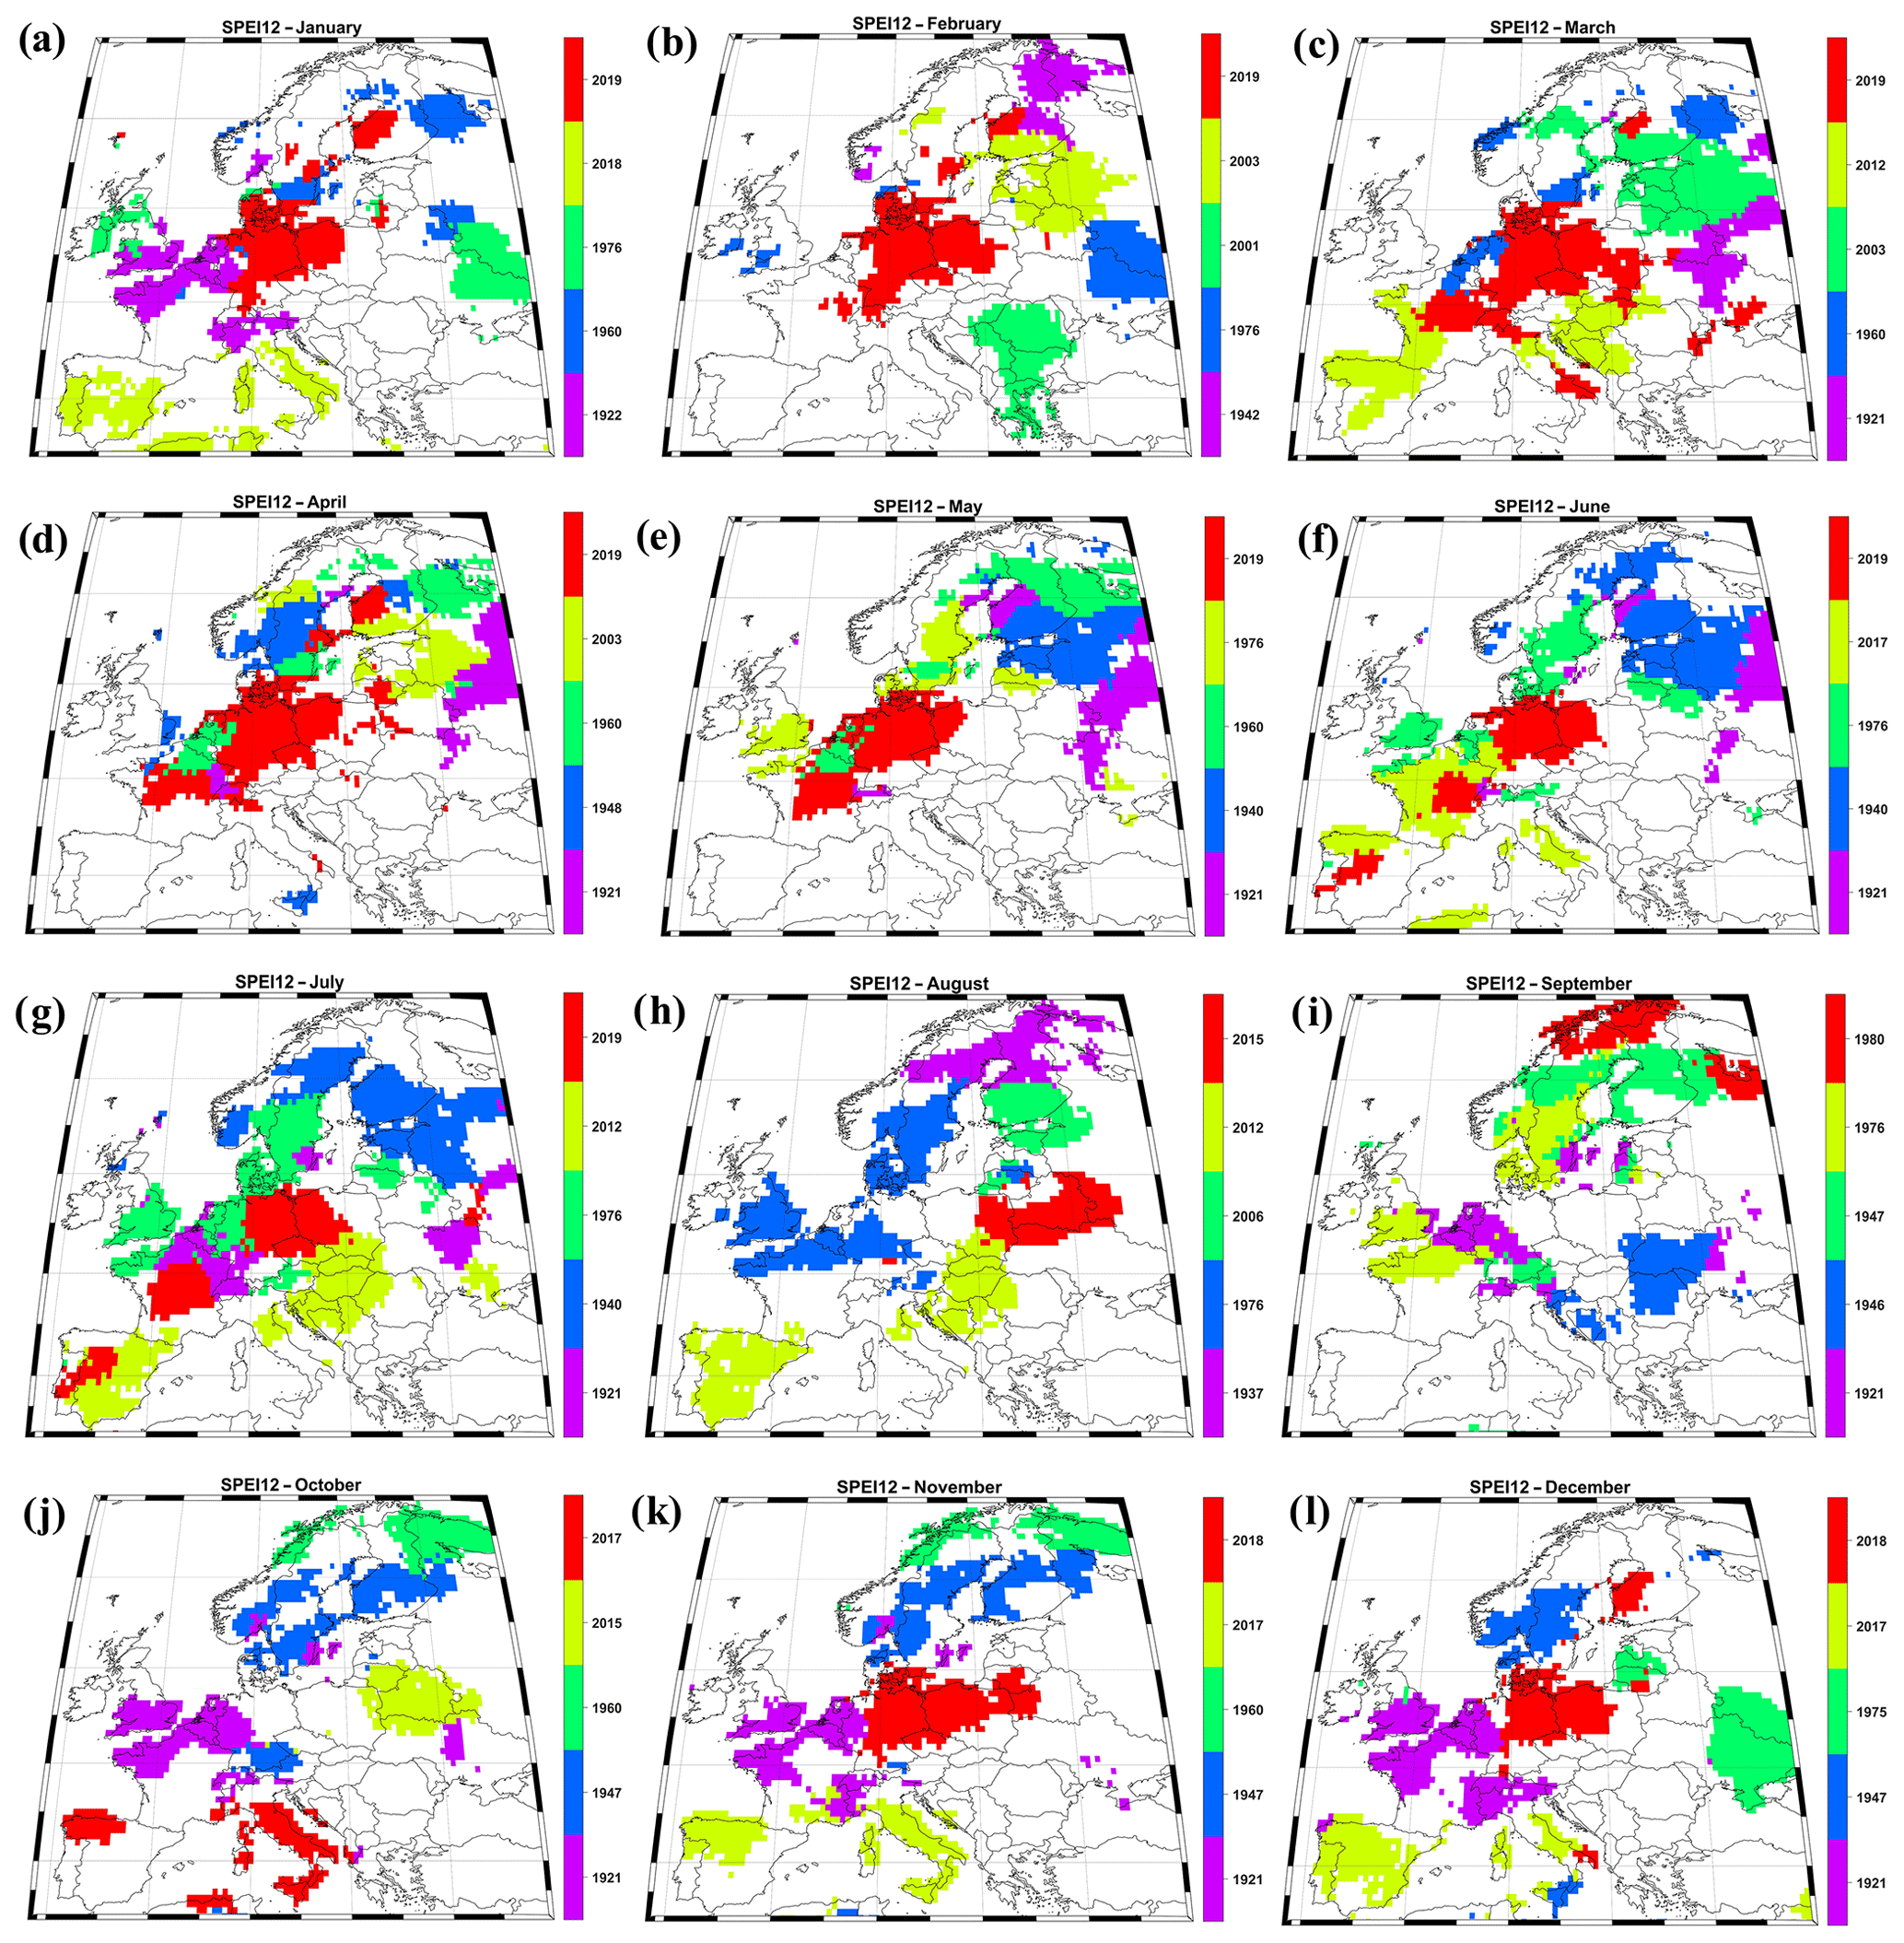
Figure 9The spatial extent and date of the driest years based on the monthly SPEI12 over Europe. Analyzed period: 1902–2019.
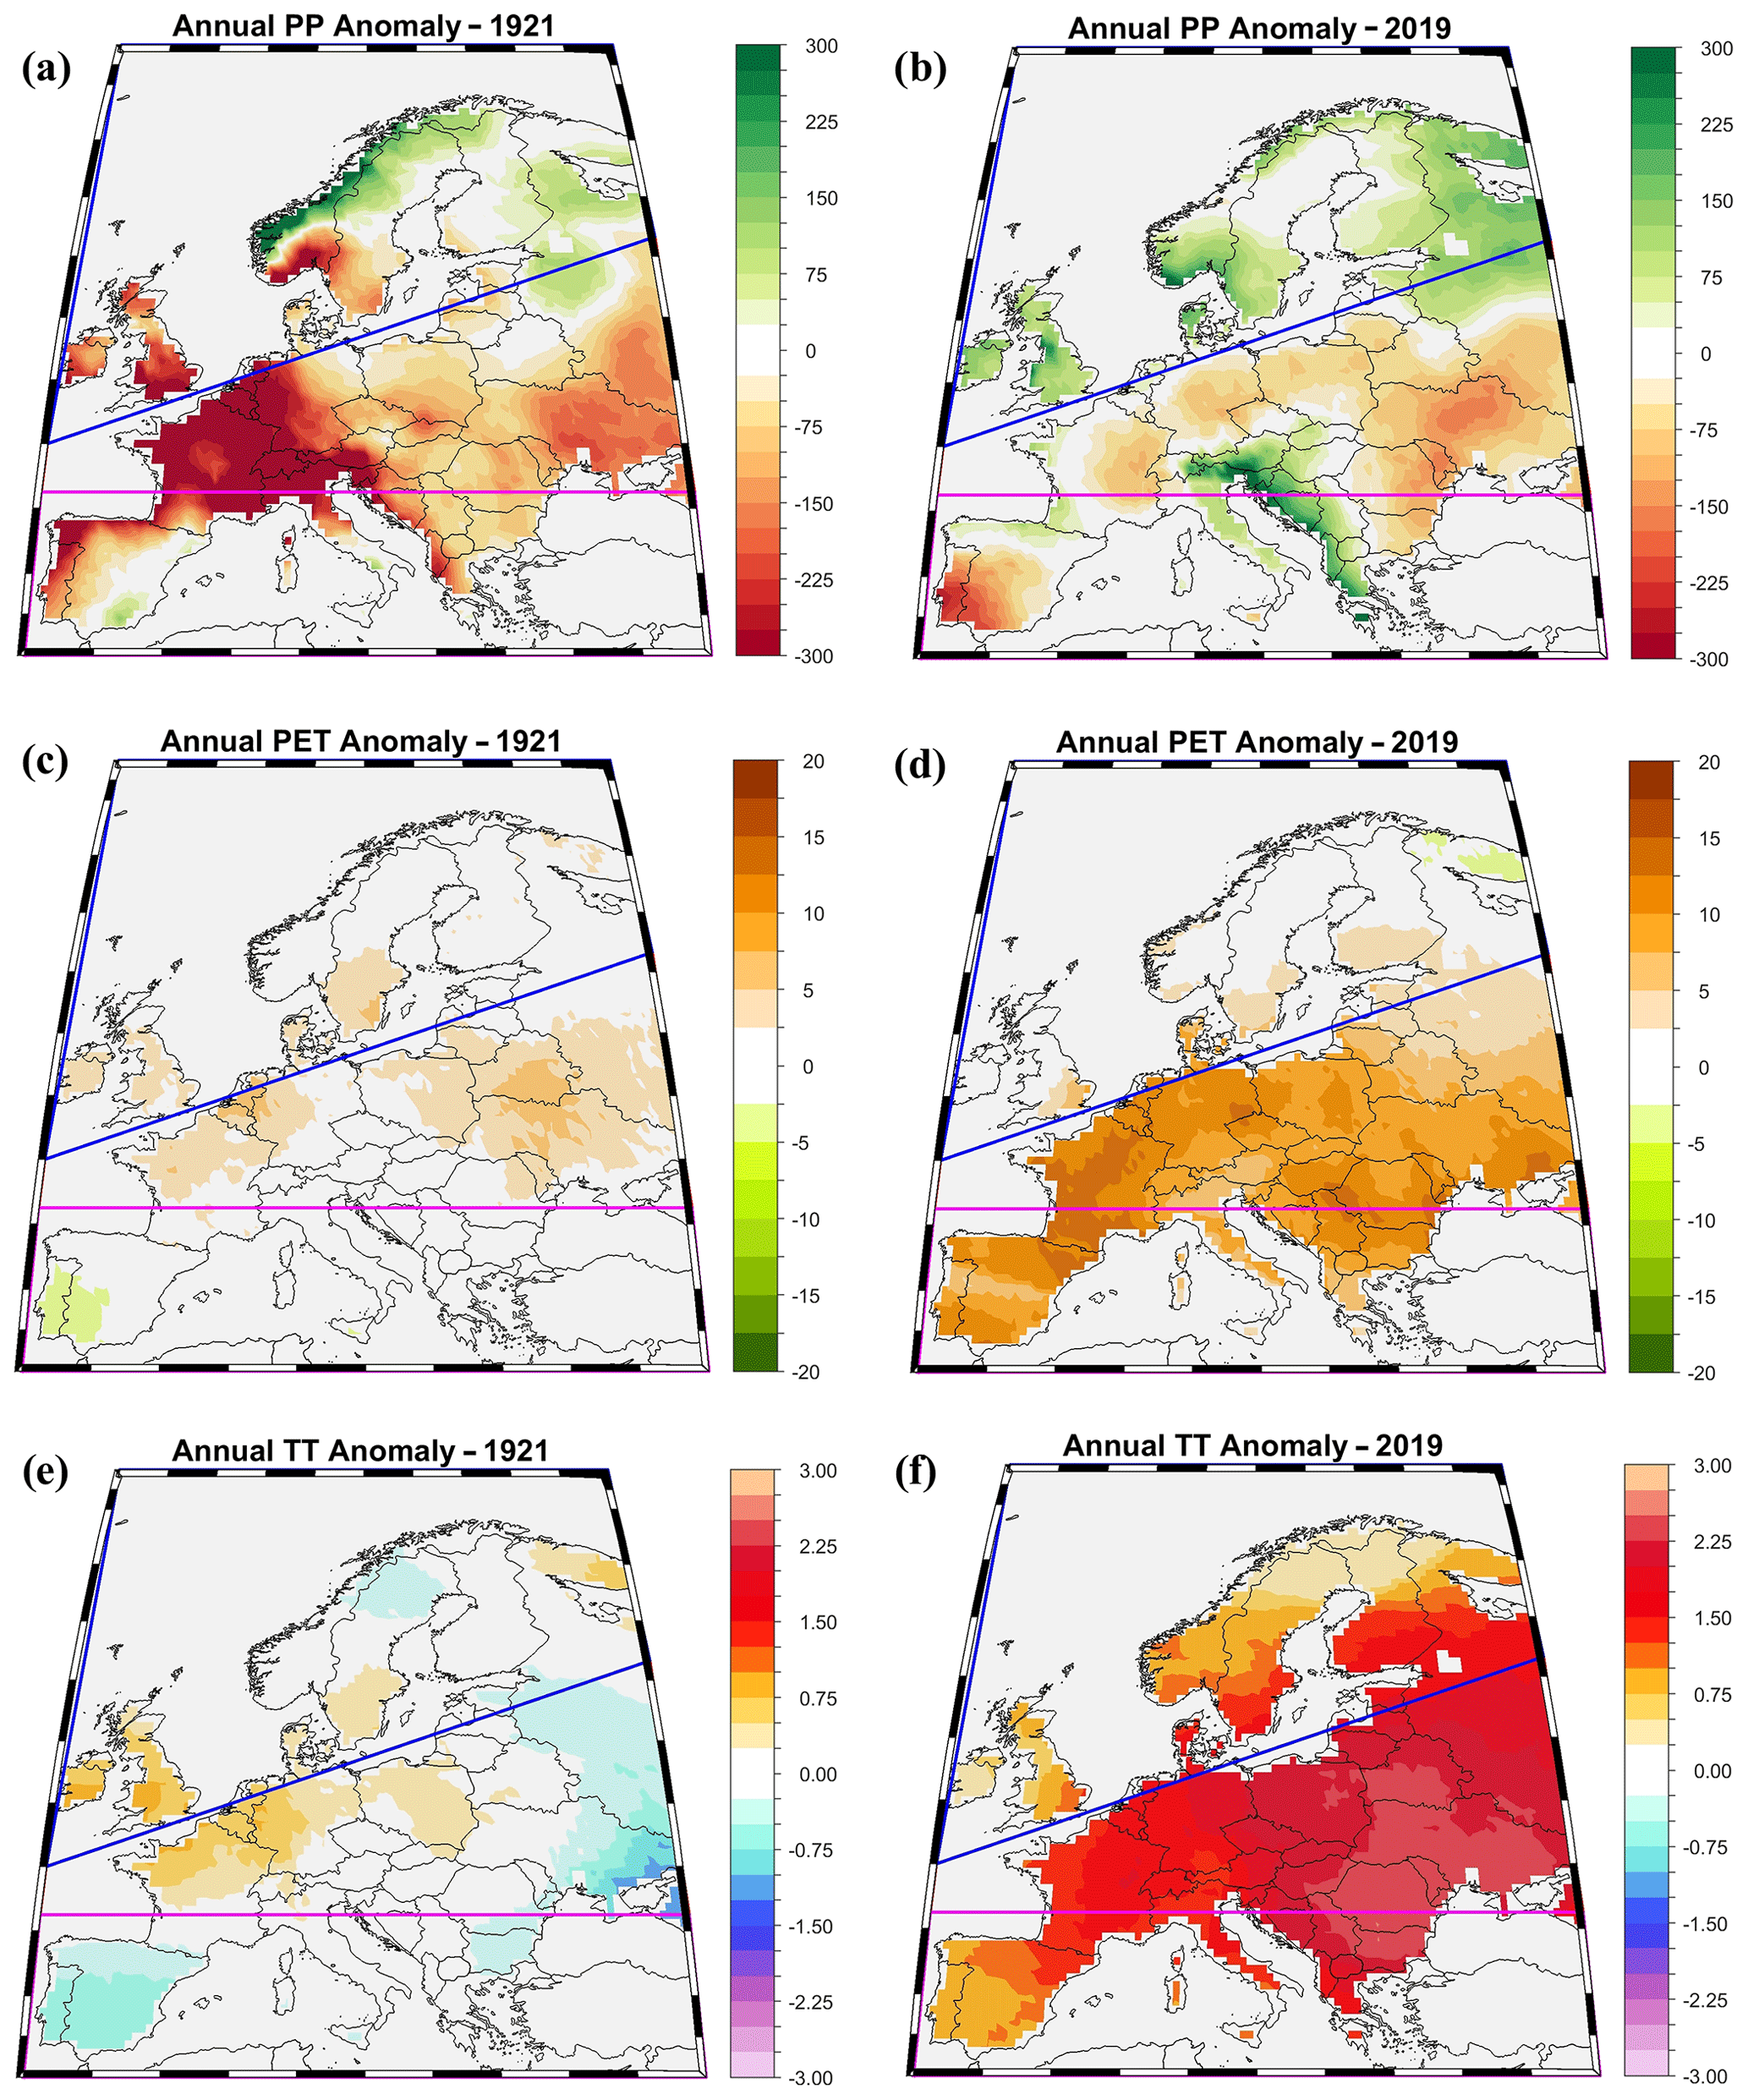
Figure 10Yearly anomalies for (a) PP–1921, (b) PP–2019, (c) TT–1921, (d) TT–2019, (e) PET–1921, and (f) PET–2019. The anomalies are computed relative to the period 1971–2000.
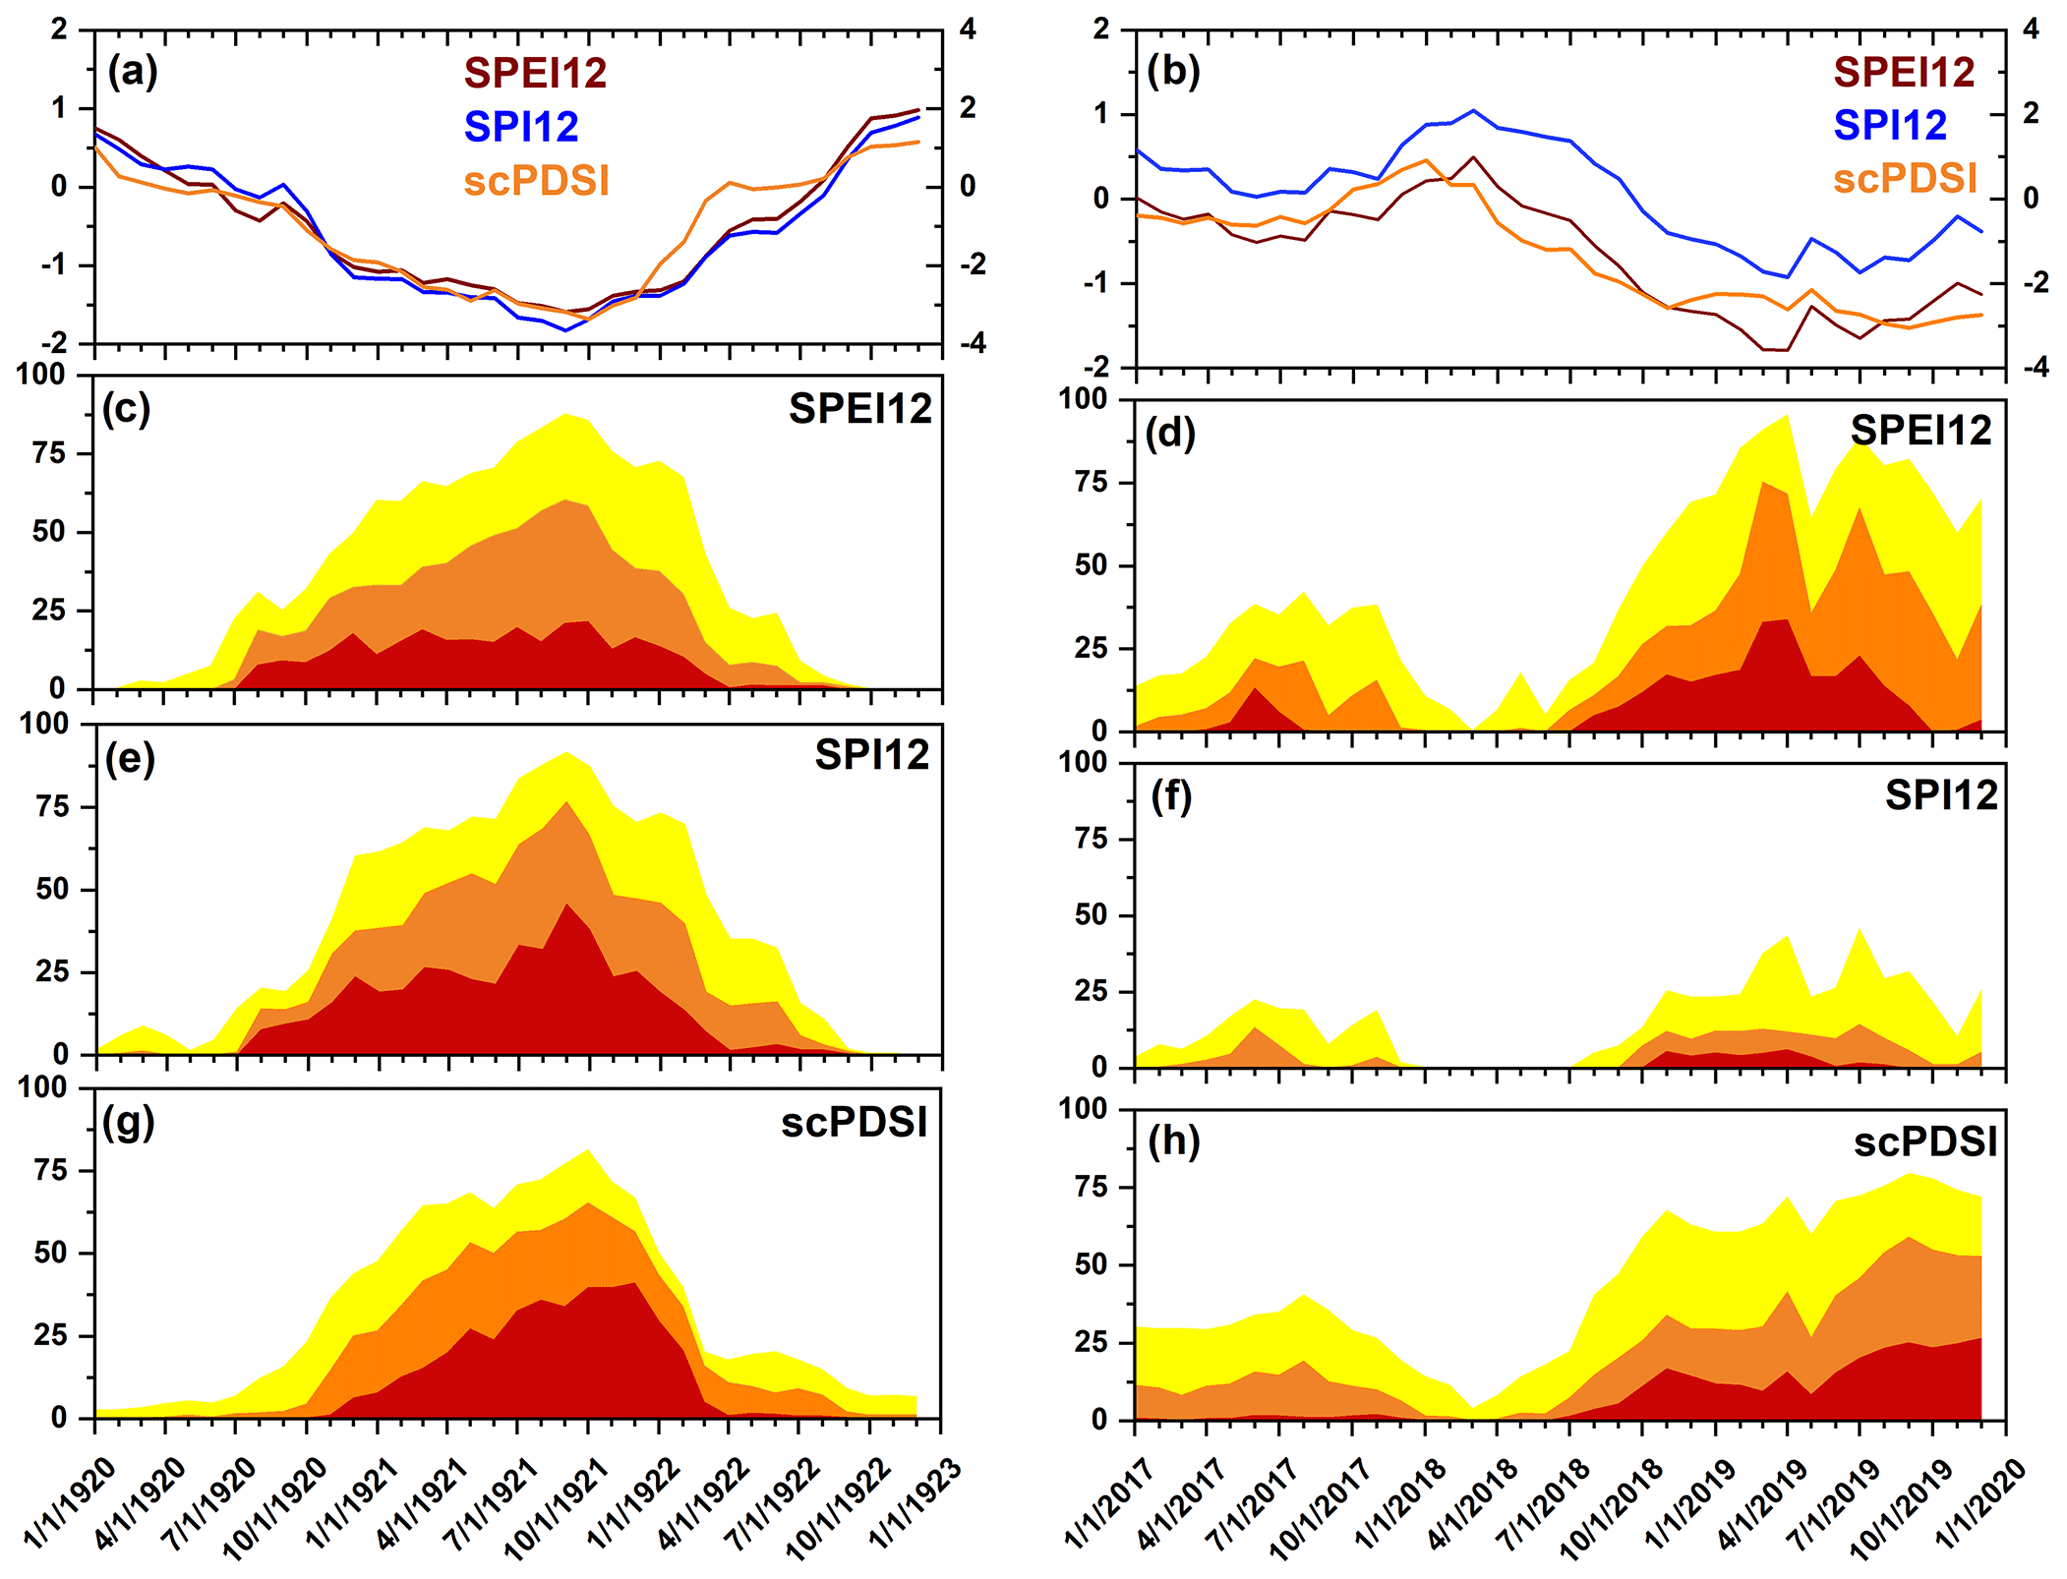
Figure 11(a) Temporal evolution of the monthly SPEI12 (red line), SPI12 (blue line), and scPDSI (orange line) for the period January 1920–December 1922. (b) As in (a), but for the period January 2017–December 2019. (c) Temporal evolution of the drought area for the SPEI12 for the period January 1920–December 1922 for different types of drought: moderate (yellow), severe (orange), and extreme (red). (d) As in (b), but for the period January 2017–December 2019. (e) Temporal evolution of the drought area for SPI12 for the period January 1920–December 1922 for different types of drought: moderate (yellow), severe (orange), and extreme (red). (f) As in (e), but for the period January 2017–December 2019. (g) Temporal evolution of the drought area for the scPDSI for the period January 1920–December 1922 for different types of drought: moderate (yellow), severe (orange), and extreme (red). (h) As in (g), but for the period January 2017–December 2019.
The year 2018 is captured as the driest year over the central part of Europe from November 2018 until August 2019 (Fig. 9). This event affected all of Europe, except the northern part of Fennoscandia, with the highest amplitude over the northeastern part of Germany. On shorter timescales (e.g., SPEI3) the event already starting developing in spring 2018 (Bakke et al., 2020). On longer timescales (e.g., SPEI12) the development of this event started towards the end of 2018 and it was mainly driven by record high temperatures and enhanced evaporation over the European region throughout the summer of 2018 (Figs. 10d, f and S8 in the Supplement). This event persisted until the end of the summer season of 2019 (Fig. S14 in the Supplement), with a special focus on the northeastern part of Germany (Hari et al., 2020; Ionita et al., 2020). The spatial extent of the 2018–2019 event is much higher according to the SPEI12 (Fig. 11f) and scPDSI (Fig. 11h) compared to the SPI12 (Fig. 11g).
Other extremely dry years, as captured by the rank maps based on the SPEI12, are 1947, 1976, 2003, and 2015. The year 1947 was extremely dry over Norway and Finland from September 1947 up to December 1947 (Fig. 9j–l). Overall, the summer of 1947 was dry throughout Europe, but Norway was especially hard-hit. Weather records from Oslo in July and August showed there were only 2.2 mm of rain for an entire month while the monthly average is ∼102 mm (Hisdal et al., 2006). Summer 1976 (SPEI12; June, July, August, and September) ranks as the driest on record over different regions extending from the southern part of the UK, western part of Germany, and southern part of Norway (Fig. 9f–i). The summer of 1976 was considered to be one of the hottest summers in Europe, mainly due to a long-lasting atmospheric blocking pattern that dominated most of Europe for all of the summer months (Rodda and Marh, 2011). The drought events in 2003 and 2015 were restricted mostly to the summer months, and they were driven by record braking temperatures and an extreme soil-moisture deficit (Ionita et al. (2017) and references therein). We also computed the rank maps for the scPDSI (not shown) and the overall driest years captured by the monthly evolution of the scPDSI are similar to the ones recorded by the SPEI12 (e.g., 1921–1922, 1947, 1976, 2003, 2015, and 2018–2019).
In the two past decades, drought has been a recurrent feature at the European level with long-lasting drought events affecting different parts of the continent (Bakke et al., 2020; Hanel et al., 2018; Laaha et al., 2017; Naumann et al., 2018). In 2015, more than 50 % of Europe was affected by severe drought, while over the period 2018–2019 more than 60 % of the continent was affected by moderate and severe dryness (Bakke et al., 2020; Hari et al., 2020; Van Lanen et al., 2016). In this study we have shown the importance of making comparative analyses at large spatial scale (e.g., Europe) based on different drought-related indices in order to put the recent drought events into a long-term context. The novelty of this study is represented by the fact that we make an in-depth analysis of drought frequency and extent for three different drought indices (e.g., SPEI12, SPI12, and scPDSI) covering the 1902–2019 period, and we show that after the 1990s there is a significant divergence between the SPEI/scPDSI and SPI, driven mainly by an increase in the mean air temperature and evapotranspiration. Previous studies have focused either on the analysis of just one drought index (Bonaccorso et al., 2013; Bordi et al., 2009), a shorter time period (Bordi et al., 2009; Hänsel et al., 2019; Oikonomou et al., 2020), or on case studies (Parry et al., 2012). The need for updated studies regarding the trends and changes in drought frequency at the European level is also motivated by the fact that previous studies have indicated that there are no significant changes either in the drought index or in the area affected by drought (Lloyd-Hughes and Saunders, 2002; van der Schrier et al., 2006). Nevertheless, these studies were restricted to the time period 1901–2002 (van der Schrier et al., 2006) and 1901–1999 (Lloyd-Hughes and Saunders, 2002), respectively. Since most of the severe drought events, which had a substantial impact on a wide range of socioeconomic sectors, occurred in the last two decades, it was imperative to make an in-depth analysis of the drought trends and features also taking into account these extreme events. In this respect, changes in several drought characteristics were investigated in this study based on data for the past 120 years, including the percentage of area affected by drought and drought frequency. Our results indicate that droughts over Europe exhibit significant differences depending on the type of drought index used. Based on the SPEI12 we observe a well-defined decadal variation of drought events during the past 120 years, with more frequent droughts occurring between 1941 and 1950 and after the 2000s and fewer drought events in the 1900s and 1990s. Based on changes in affected drought area, several regional differences are detected. When taking into account the SPEI12, the observed changes from our study are in line with the suggested changes by future projections as an effect of climate change, namely a significant drying trend over MED and CEU as a response to an increase in the temperature and evapotranspiration and not necessarily a rainfall deficit (IPCC, 2018; McCabe and Wolock, 2015; Spinoni et al., 2018). For NEU, all indices indicate a wetting trend over the analyzed periods. Similar results have also been shown by Stagge et al. (2017), namely a significant deviation in the drought area measured by the SPEI and SPI, but their study was limited to a shorter period of time (1958–2015). Based on the results from this study, we show that MED and CEU are the regions most prone to drought over the last decades. These results are in line with previous studies, which have also indicated an increasing trend in drought frequency and/or magnitude over these regions (Bordi et al., 2009; Caloiero et al., 2018). Overall, our results indicated that the rainfall deficit contribution to drought occurrence is significant over NEU, while TT and PET are becoming, along with PP, essential ingredients for drought occurrence in MED and CEU. The contribution of TT and PET to drought occurrence has become significant, especially after the 1990s both for MED and CEU (Fig. 8). These findings are in agreement with previous studies dealing with the analysis of the frequency of compound events (e.g., heat waves and droughts) at European level, which have indicated that the probability of such compound events (e.g., hot and dry) has increased across much of Europe over the last decades (Bezak and Mikoš, 2020; Manning et al., 2019). The lack of significant changes, when taking into account the SPI, has also been recently detected by Vicente-Serrano et al. (2021). According to their results, for the western part of Europe no long-term changes in the drought occurrence could be detected using precipitation records alone, which is in line with our findings.
Overall, the main conclusions of our study can be summarized as follows:
-
The trend analysis, based on the SPEI12 and scPDSI, indicates that most countries in the MED and CEU regions show a significant decreasing trend (drying) over the last 120 years, while the countries in NEU exhibit a significant positive trend (wetting). When we take into account the SPI12, no significant changes are observed except for some small regions (e.g., the southern part of Poland, the Czech Republic, Italy, and southern Spain). As expected, the trend observed for the SPI12 (Fig. 1b and the right column of Fig. S2 in the Supplement) follow the trends observed for seasonal precipitation (middle column of Fig. S3 in the Supplement).
-
The analysis based on the drought duration map indicates that there is an increase in the frequency of moderate, severe, and extreme droughts based on the SPEI12 over CEU and MED over the last two decades. The analysis based on the SPI12, indicates a rather opposite pattern: a reduction in the frequency of dry events over the last two decades, especially in the case of extreme droughts, over most of the European region.
-
Based on the joint frequency of compound events (e.g., the co-occurrence of low precipitation and dry events or high temperature and dry events) we show that CEU and MED have changed from a rainfall-deficit-dominated drought risk to a more temperature-dominated drought risk, especially over the last two decades, and PET and TT are becoming essential ingredients for drought occurrence over MED and CEU.
-
The drought events of 1920/21 and 2018/19 are the most extreme in terms of spatial extent and amplitude (Figs. 2, 3, and 9) over the last 120 years. While the 1920/21 event was driven mainly by a significant rainfall deficit, the 2018/19 event (the second most extreme) was driven mainly by extremely high temperatures and increased evaporation rates.
-
Due to the consideration of potential evapotranspiration in the computation of the SPEI, and hence temperature, the drought reflected by the SPEI showed a drying trend over MED and CEU at various timescales, while the drought reflected by the SPI shows the opposite or no changes. Thus, the performance of the SPI may be insufficient for drought analysis studies over regions where there is a strong warming signal.
Therefore, in this study we highlight the importance of temperature, and hence of the potential evapotranspiration, in delineating the drought spatiotemporal variability, and we provide a vital reference for the applicability, at the European scale, of the SPEI, SPI, and scPDSI under climate change. The SPEI and scPDSI indicate an increasing trend in the in drought area and frequency for MED and CEU, which are mainly induced by a significant increase in TT and PET. By contrast, the SPI does not reveal these features for MED and CEU since the precipitation does not exhibit a significant change. The only region where all indices indicate the same changes, namely a wetting trend, is NEU. Based on the results obtained from this study, we suggest that the increasing mean air temperature and the potential evapotranspiration can amplify the drought risk over the southern and central part of Europe; thus, our results have implications concerning the future occurrence of drought events, given that potential evapotranspiration is projected to increase under a warming climate. In this respect, the spatial extent and the duration of the 2018/19 event can be an indication that the climate change signals is already producing palpable effects in the southern and central part of Europe, in concordance with the projected climate change signals for Europe (Naumann et al., 2018; Spinoni et al., 2018). Therefore, the SPEI is probably a more suitable index than the SPI to study the spatiotemporal variability of drought in Europe under climate change, especially for the MED and CEU regions.
The data that support the findings of this study are available from the corresponding author upon reasonable request.
The supplement related to this article is available online at: https://doi.org/10.5194/nhess-21-1685-2021-supplement.
MI designed the study and wrote the manuscript. VN analyzed part of the climate data and helped write the manuscript and interpret the results.
The authors declare that they have no conflict of interest.
Monica Ionita was supported by the Helmholtz Association through the joint program “Changing Earth – Sustaining our Future” (PoF IV) program of the AWI. Funding by the AWI Strategy Fund Project (PalEX) and by the Helmholtz Climate Initiative (REKLIM) is gratefully acknowledged. Viorica Nagavciuc was partially supported by a grant of the Ministry of Research, Innovation and Digitization, CNCS/CCCDI – UEFISCDI, project number PN-III-P1-1.1-PD-2019-0469, within PNCDI III.
The article processing charges for this open-access publication were covered by the Alfred Wegener Institute, Helmholtz Centre for Polar and Marine Research (AWI).
This paper was edited by David J. Peres and reviewed by two anonymous referees.
Bakke, S. J., Ionita, M., and Tallaksen, L. M.: The 2018 northern European hydrological drought and its drivers in a historical perspective, Hydrol. Earth Syst. Sci., 24, 5621–5653, https://doi.org/10.5194/hess-24-5621-2020, 2020.
Beniston, M. and Stephenson, D. B.: Extreme climatic events and their evolution under changing climatic conditions, Global Planet. Change, 44, 1–9, https://doi.org/10.1016/j.gloplacha.2004.06.001, 2004.
Bezak, N. and Mikoš, M.: Changes in the Compound Drought and Extreme Heat Occurrence in the 1961–2018 Period at the European Scale, Water, 12, 3543, https://doi.org/10.3390/w12123543, 2020.
Bonaccorso, B., Peres, D. J., Cancelliere, A., and Rossi, G.: Large Scale Probabilistic Drought Characterization Over Europe, Water Resour. Manage., 27, 1675–1692, https://doi.org/10.1007/s11269-012-0177-z, 2013.
Bordi, I., Fraedrich, K., and Sutera, A.: Observed drought and wetness trends in Europe: an update, Hydrol. Earth Syst. Sci., 13, 1519–1530, https://doi.org/10.5194/hess-13-1519-2009, 2009.
Burke, E. J., Brown, S. J., and Christidis, N.: Modeling the Recent Evolution of Global Drought and Projections for the Twenty-First Century with the Hadley Centre Climate Model, J. Hydrometeorol., 7, 1113–1125, https://doi.org/10.1175/JHM544.1, 2006.
Caloiero, T., Veltri, S., Caloiero, P., and Frustaci, F.: Drought Analysis in Europe and in the Mediterranean Basin Using the Standardized Precipitation Index, Water, 10, 1043, https://doi.org/10.3390/w10081043, 2018.
Ciais, P., Reichstein, M., Viovy, N., Granier, A., Ogée, J., Allard, V., Aubinet, M., Buchmann, N., Bernhofer, C., Carrara, A., Chevallier, F., De Noblet, N., Friend, A. D., Friedlingstein, P., Grünwald, T., Heinesch, B., Keronen, P., Knohl, A., Krinner, G., Loustau, D., Manca, G., Matteucci, G., Miglietta, F., Ourcival, J. M., Papale, D., Pilegaard, K., Rambal, S., Seufert, G., Soussana, J. F., Sanz, M. J., Schulze, E. D., Vesala, T., and Valentini, R.: Europe-wide reduction in primary productivity caused by the heat and drought in 2003, Nature, 437, 529–533, https://doi.org/10.1038/nature03972, 2005.
Cook, B. I., Mankin, J. S., Marvel, K., Williams, A. P., Smerdon, J. E., and Anchukaitis, K. J.: Twenty-first Century Drought Projections in the CMIP6 Forcing Scenarios, Earth's Future, 8, e2019EF001461, https://doi.org/10.1029/2019ef001461, 2020.
CRED and UNISDR: 2018 Review of Disaster Events, Brussels, available at: https://www.cred.be/sites/default/files/PressReleaseReview2018.pdf, last access: 24 January 2019.
Dai, A.: Drought under global warming: a review, WIREs Clim. Chang., 2, 45–65, https://doi.org/10.1002/wcc.81, 2011.
Hanel, M., Rakovec, O., Markonis, Y., Máca, P., Samaniego, L., Kyselý, J., and Kumar, R.: Revisiting the recent European droughts from a long-term perspective, Sci. Rep., 8, 1–11, https://doi.org/10.1038/s41598-018-27464-4, 2018.
Hänsel, S., Ustrnul, Z., Łupikasza, E., and Skalak, P.: Assessing seasonal drought variations and trends over Central Europe, Adv. Water Resour., 127, 53–75, https://doi.org/10.1016/j.advwatres.2019.03.005, 2019.
Hao, Z., Hao, F., Xia, Y., Singh, V. P., and Zhang, X.: A monitoring and prediction system for compound dry and hot events, Environ. Res. Lett., 14, 114034, https://doi.org/10.1088/1748-9326/ab4df5, 2019.
Hari, V., Rakovec, O., Markonis, Y., Hanel, M., and Kumar, R.: Increased future occurrences of the exceptional 2018–2019 Central European drought under global warming, Sci. Rep., 10, 12207, https://doi.org/10.1038/s41598-020-68872-9, 2020.
Harris, I., Osborn, T. J., Jones, P., and Lister, D.: Version 4 of the CRU TS monthly high-resolution gridded multivariate climate dataset, Sci. Data, 7, 1–18, https://doi.org/10.1038/s41597-020-0453-3, 2020.
Hayes, M. J., Svoboda, M. D., Wiihite, D. A., and Vanyarkho, O. V: Monitoring the 1996 Drought Using the Standardized Precipitation Index, B. Am. Meteorol. Soc., 80, 429–438, https://doi.org/10.1175/1520-0477(1999)080<0429:MTDUTS>2.0.CO;2, 1999.
Hisdal, H., Roald, L., and Beldring, S.: Past and future changes in flood and drought in the Nordic countries, IAHS-AISH Publ., 308, 502–507, 2006.
Ionita, M. and Nagavciuc, V.: Forecasting low flow conditions months in advance through teleconnection patterns, with a special focus on summer 2018, Sci. Rep., 10, 13258, https://doi.org/10.1038/s41598-020-70060-8, 2020.
Ionita, M., Tallaksen, L. M., Kingston, D. G., Stagge, J. H., Laaha, G., Lanen, H. A. J. Van, Scholz, P., Chelcea, S. M., and Haslinger, K.: The European 2015 drought from a climatological perspective, Hydrol. Earth Syst. Sci., 21, 1397–1419, https://doi.org/10.5194/hess-21-1397-2017, 2017.
Ionita, M., Nagavciuc, V., Kumar, R., and Rakovec, O.: On the curious case of the recent decade, mid-spring precipitation deficit in central Europe, npj Clim. Atmos. Sci., 3, 49, https://doi.org/10.1038/s41612-020-00153-8, 2020.
Ionita, M., Dima, M., Nagavciuc, V., Scholz, P., and Lohmann, G.: Past megadroughts in central Europe were longer, more severe and less warm than modern droughts, Commun. Earth Environ., 2, 61, https://doi.org/10.1038/s43247-021-00130-w, 2021.
IPCC: IPPC Climate Change 2014 Synthesis Report, IPCC, Geneva, Switzerland, 2014.
IPCC: Global warming of 1.5 ∘C An IPCC Special Report, Geneva, Switzerland, 2018.
Iturbide, M., Gutiérrez, J. M., Alves, L. M., Bedia, J., Cerezo-Mota, R., Cimadevilla, E., Cofiño, A. S., Di Luca, A., Faria, S. H., Gorodetskaya, I. V, Hauser, M., Herrera, S., Hennessy, K., Hewitt, H. T., Jones, R. G., Krakovska, S., Manzanas, R., Martínez-Castro, D., Narisma, G. T., Nurhati, I. S., Pinto, I., Seneviratne, S. I., van den Hurk, B., and Vera, C. S.: An update of IPCC climate reference regions for subcontinental analysis of climate model data: definition and aggregated datasets, Earth Syst. Sci. Data, 12, 2959–2970, https://doi.org/10.5194/essd-12-2959-2020, 2020.
Laaha, G., Gauster, T., Tallaksen, L. M., Vidal, J.-P., Stahl, K., Prudhomme, C., Heudorfer, B., Vlnas, R., Ionita, M., Van Lanen, H. A. J., Adler, M.-J., Caillouet, L., Delus, C., Fendekova, M., Gailliez, S., Hannaford, J., Kingston, D., Van Loon, A. F., Mediero, L., Osuch, M., Romanowicz, R., Sauquet, E., Stagge, J. H., and Wong, W. K.: The European 2015 drought from a hydrological perspective, Hydrol. Earth Syst. Sci., 21, 3001–3024, https://doi.org/10.5194/hess-21-3001-2017, 2017.
Lloyd-Hughes, B. and Saunders, M. A.: A drought climatology for Europe, Int. J. Climatol., 22, 1571–1592, https://doi.org/10.1002/joc.846, 2002.
Mann, H. B.: Nonparametric Tests Against Trend, Econometrica, 13, 245–259, https://doi.org/10.2307/1907187, 1945.
Manning, C., Widmann, M., Bevacqua, E., Van Loon, A. F., Maraun, D., and Vrac, M.: Increased probability of compound long-duration dry and hot events in Europe during summer (1950–2013), Environ. Res. Lett., 14, 094006, https://doi.org/10.1088/1748-9326/ab23bf, 2019.
McCabe, G. J. and Wolock, D. M.: Variability and trends in global drought, Earth Space Sci., 2, 223–228, https://doi.org/10.1002/2015EA000100, 2015.
McKee, T. B., Nolan, J., and Kleist, J.: The relationship of drought frequency and duration yo time scales, in: Eighth Conf. Appl. Climatol., 17–22 January 1993, Anaheim, California, 1–6, https://doi.org/10.1002/jso.23002, 1993.
Mitchell, T. D. and Jones, P. D.: An improved method of constructing a database of monthly climate observations and associated high-resolution grids, Int. J. Climatol., 25, 693–712, https://doi.org/10.1002/joc.1181, 2005.
Naumann, G., Alfieri, L., Wyser, K., Mentaschi, L., Betts, R. A., Carrao, H., Spinoni, J., Vogt, J., and Feyen, L.: Global Changes in Drought Conditions Under Different Levels of Warming, Geophys. Res. Lett., 45, 3285–3296, https://doi.org/10.1002/2017GL076521, 2018.
New, M., Hulme, M., and Jones, P.: Representing Twentieth-Century Space–Time Climate Variability. Part II: Development of 1901–96 Monthly Grids of Terrestrial Surface Climate, J. Climate, 13, 2217–2238, https://doi.org/10.1175/1520-0442(2000)013<2217:RTCSTC>2.0.CO;2, 2000.
Ntale, H. K. and Gan, T. Y.: Drought indices and their application to East Africa, Int. J. Climatol., 23, 1335–1357, https://doi.org/10.1002/joc.931, 2003.
Oikonomou, P. D., Karavitis, C. A., Tsesmelis, D. E., Kolokytha, E., and Maia, R.: Drought Characteristics Assessment in Europe over the Past 50 Years, Water Resour. Manage., 34, 4757–4772, https://doi.org/10.1007/s11269-020-02688-0, 2020.
Palmer, W. C.: Meteorological drought, US Research Paper No. 45, US Weather Bureau, Washington, DC, available at: https://www.ncdc.noaa.gov/temp-and-precip/drought/docs/palmer.pdf (last access: 18 February 2021), 1965.
Parry, S., Hannaford, J., Lloyd-Hughes, B., and Prudhomme, C.: Multi-year droughts in Europe: analysis of development and causes, Hydrol. Res., 43, 689–706, https://doi.org/10.2166/nh.2012.024, 2012.
Paulo, A. A., Rosa, R. D., and Pereira, L. S.: Climate trends and behaviour of drought indices based on precipitation and evapotranspiration in Portugal, Nat. Hazards Earth Syst. Sci., 12, 1481–1491, https://doi.org/10.5194/nhess-12-1481-2012, 2012.
Rodda, J. C. and Marsh, T. J.: The 1975–76 Drought – a contemporary and retrospective review, Centre for Ecology & Hydrology, 58 pp., ISBN 978-1-906698-24-9, 2011.
Schuldt, B., Buras, A., Arend, M., Vitasse, Y., Beierkuhnlein, C., Damm, A., Gharun, M., Grams, T. E. E., Hauck, M., Hajek, P., Hartmann, H., Hiltbrunner, E., Hoch, G., Holloway-Phillips, M., Körner, C., Larysch, E., Lübbe, T., Nelson, D. B., Rammig, A., Rigling, A., Rose, L., Ruehr, N. K., Schumann, K., Weiser, F., Werner, C., Wohlgemuth, T., Zang, C. S., and Kahmen, A.: A first assessment of the impact of the extreme 2018 summer drought on Central European forests, Basic Appl. Ecol., 45, 86–103, https://doi.org/10.1016/j.baae.2020.04.003, 2020.
Sousa, P. M., Trigo, R. M., Aizpurua, P., Nieto, R., Gimeno, L., and Garcia-Herrera, R.: Trends and extremes of drought indices throughout the 20th century in the Mediterranean, Nat. Hazards Earth Syst. Sci., 11, 33–51, https://doi.org/10.5194/nhess-11-33-2011, 2011.
Spinoni, J., Naumann, G., Vogt, J., and Barbosa, P.: European drought climatologies and trends based on a multi-indicator approach, Global Planet. Change, 127, 50–57, https://doi.org/10.1016/j.gloplacha.2015.01.012, 2015.
Spinoni, J., Naumann, G., Vogt, J. V., and Barbosa, P.: Meteorological Droughts in Europe: Events and Impacts – Past Trends and Future Projections, Luxembourg, EUR 27748 EN, 2016.
Spinoni, J., Naumann, G., and Vogt, J. V.: Pan-European seasonal trends and recent changes of drought frequency and severity, Global Planet. Change, 148, 113–130, https://doi.org/10.1016/j.gloplacha.2016.11.013, 2017.
Spinoni, J., Vogt, J. V., Naumann, G., Barbosa, P., and Dosio, A.: Will drought events become more frequent and severe in Europe?, Int. J. Climatol., 38, 1718–1736, https://doi.org/10.1002/joc.5291, 2018.
Spinoni, J., Barbosa, P., Bucchignani, E., Cassano, J., Cavazos, T., Christensen, J. H., Christensen, O. B., Coppola, E., Evans, J., Geyer, B., Giorgi, F., Hadjinicolaou, P., Jacob, D., Katzfey, J., Koenigk, T., Laprise, R., Lennard, C. J., Kurnaz, M. L., Li, D., Llopart, M., McCormick, N., Naumann, G., Nikulin, G., Ozturk, T., Panitz, H.-J., da Rocha, R. P., Rockel, B., Solman, S. A., Syktus, J., Tangang, F., Teichmann, C., Vautard, R., Vogt, J. V, Winger, K., Zittis, G., and Dosio, A.: Future Global Meteorological Drought Hot Spots: A Study Based on CORDEX Data, J. Climate, 33, 3635–3661, https://doi.org/10.1175/JCLI-D-19-0084.1, 2020.
Stagge, J. H., Kingston, D. G., Tallaksen, L. M., and Hannah, D. M.: Observed drought indices show increasing divergence across Europe, Sci. Rep., 7, 1–10, https://doi.org/10.1038/s41598-017-14283-2, 2017.
Stahl, K., Kohn, I., Blauhut, V., Urquijo, J., De Stefano, L., Acácio, V., Dias, S., Stagge, J. H., Tallaksen, L. M., Kampragou, E., Van Loon, A. F., Barker, L. J., Melsen, L. A., Bifulco, C., Musolino, D., de Carli, A., Massarutto, A., Assimacopoulos, D., and Van Lanen, H. A. J.: Impacts of European drought events: insights from an international database of text-based reports, Nat. Hazards Earth Syst. Sci., 16, 801–819, https://doi.org/10.5194/nhess-16-801-2016, 2016.
Vanderlinden, K., Giráldez, J. V., and Meirvenne, M. Van: Spatial Estimation of Reference Evapotranspiration in Andalusia, Spain, J. Hydrometeorol., 9, 242–255, https://doi.org/10.1175/2007JHM880.1, 2008.
van der Schrier, G., Briffa, K. R., Jones, P. D., and Osborn, T. J.: Summer Moisture Variability across Europe, J. Climate, 19, 2818–2834, https://doi.org/10.1175/JCLI3734.1, 2006.
Van Lanen, H. A. J. H. A. J., Laaha, G., Kingston, D. G. D. G., Gauster, T., Ionita, M., Vidal, J.-P. J. P., Vlnas, R., Tallaksen, L. M. L. M., Stahl, K., Hannaford, J., Delus, C., Fendekova, M., Mediero, L., Prudhomme, C., Rets, E., Romanowicz, R. J. R. J., Gailliez, S., Wong, W. K. W. K., Adler, M. J. M.-J., Blauhut, V., Caillouet, L., Chelcea, S., Frolova, N., Gudmundsson, L., Hanel, M., Haslinger, K., Kireeva, M., Osuch, M., Sauquet, E., Stagge, J. H. J. H., and Van Loon, A. F. A. F.: Hydrology needed to manage droughts: the 2015 European case, Hydrol. Process., 30, 3097–3104, https://doi.org/10.1002/hyp.10838, 2016.
Vicente-Serrano, S. M., Beguería, S., and López-Moreno, J. I.: A multiscalar drought index sensitive to global warming: The standardized precipitation evapotranspiration index, J. Climate, 23, 1696–1718, https://doi.org/10.1175/2009JCLI2909.1, 2010.
Vicente-Serrano, S. M., Domínguez-Castro, F., Murphy, C., Hannaford, J., Reig, F., Peña-Angulo, D., Tramblay, Y., Trigo, R. M., Mac Donald, N., Luna, M. Y., Mc Carthy, M., der Schrier, G., Turco, M., Camuffo, D., Noguera, I., García-Herrera, R., Becherini, F., Della Valle, A., Tomas-Burguera, M., and El Kenawy, A.: Long-term variability and trends in meteorological droughts in Western Europe (1851–2018), Int. J. Climatol., 41, E690–E717, https://doi.org/10.1002/joc.6719, 2021.
Wang, Y., Yang, J., Chen, Y., Su, Z., Li, B., Guo, H., and De Maeyer, P.: Monitoring and Predicting Drought Based on Multiple Indicators in an Arid Area, China, Remote Sens., 12, 2298, https://doi.org/10.3390/rs12142298, 2020.
Wells, N., Goddard, S., and Hayes, M. J.: A Self-Calibrating Palmer Drought Severity Index, J. Climate, 17, 2335–2351, https://doi.org/10.1175/1520-0442(2004)017<2335:ASPDSI>2.0.CO;2, 2004.