the Creative Commons Attribution 4.0 License.
the Creative Commons Attribution 4.0 License.
 | 28 May 2021
Thematic vent opening probability maps and hazard assessment of small-scale pyroclastic density currents in the San Salvador volcanic complex (El Salvador) and Nejapa-Chiltepe volcanic complex (Nicaragua)
Andrea Bevilacqua
Augusto Neri
Eduardo Gutiérrez
Demetrio Escobar
Melida Schliz
Alessandro Aiuppa
Raffaello Cioni
The San Salvador volcanic complex (El Salvador) and Nejapa-Chiltepe volcanic complex (Nicaragua) have been characterized by a significant variability in eruption style and vent location. Densely inhabited cities are built on them and their surroundings, including the metropolitan areas of San Salvador (∼2.4 million people) and Managua (∼1.4 million people), respectively. In this study we present novel vent opening probability maps for these volcanic complexes, which are based on a multi-model approach that relies on kernel density estimators. In particular, we present thematic vent opening maps, i.e., we consider different hazardous phenomena separately, including lava emission, small-scale pyroclastic density currents, ejection of ballistic projectiles, and low-intensity pyroclastic fallout. Our volcanological dataset includes: (1) the location of past vents, (2) the mapping of the main fault structures, and (3) the eruption styles of past events, obtained from critical analysis of the literature and/or inferred from volcanic deposits and morphological features observed remotely and in the field. To illustrate the effects of considering the expected eruption style in the construction of vent opening maps, we focus on the analysis of small-scale pyroclastic density currents derived from phreatomagmatic activity or from low-intensity magmatic volcanism. For the numerical simulation of these phenomena we adopted the recently developed branching energy cone model by using the program ECMapProb. Our results show that the implementation of thematic vent opening maps can produce significantly different hazard levels from those estimated with traditional, non-thematic maps.
- Article
(27778 KB) - Full-text XML
-
Supplement
(1779 KB) - BibTeX
- EndNote


Volcanic hazard assessment is typically influenced by eruption style and the associated eruptive phenomena (e.g., pyroclastic fallout, ballistic projectiles, pyroclastic density currents, lava flows). A widely adopted methodology for assessing volcanic hazard is based on the determination and analysis of a number of expectable eruptive scenarios (e.g., Newhall and Hoblitt, 2002; Cioni et al., 2008; Neri et al., 2008; Martí et al., 2012; Ferrés et al., 2013; Newhall and Pallister, 2015; Wright et al., 2019). These scenarios are commonly based on the characteristics of past eruptions, while their potential effects on the surrounding area can be evaluated by coupling field observations, uncertainty quantification, and numerical simulations (e.g., Bonadonna et al., 2005; Del Negro et al., 2013; Bayarri et al., 2015; Neri et al., 2015; Bevilacqua et al., 2017b; Mead and Magill, 2017; Strehlow et al., 2017; Rutarindwa et al., 2019). In addition to the expected magnitude and eruption style, other sources of uncertainty for volcanic hazard assessment may derive from the unknown position of the vent during future eruptions, especially for volcanic fields associated with large calderas or controlled by regional tectonics (e.g., Connor et al., 2019). Accordingly, vent opening probability maps have become fundamental tools for the assessment of hazard and risk in different volcanic systems (e.g., Alberico et al., 2002; Connor et al., 2012; Bevilacqua et al., 2015, 2017a; Thompson et al., 2015; Poland and Anderson, 2020). The procedures adopted to construct these maps typically consider the data associated with vent position of past eruptions and, sometimes, major fault structures. Thus, they require the availability of a detailed dataset of geological and volcanological information (Marzocchi and Bebbington, 2012; Connor et al., 2015; Németh and Kereszturi, 2015).
Vent opening maps have been developed for a growing number of volcanoes, such as Campi Flegrei (Alberico et al., 2002; Selva et al., 2012; Bevilacqua et al., 2015, 2017b), Somma-Vesuvius (Tadini et al., 2017a, b), Etna (Cappello et al., 2012; Del Negro et al., 2020), the Yucca Mountain region (Connor and Hill, 1995; Connor et al., 2000), the Main Ethiopian Rift (Mazzarini et al., 2013, 2016), the Auckland volcanic field (Bebbington, 2013, 2015; Ang et al., 2020), the Long Valley volcanic region (Bevilacqua et al., 2017a, 2018), El Hierro Island (Becerril et al., 2013), the Pacaya volcanic complex (Rose et al., 2013), the Harrat Rahat volcanic field (Runge et al., 2014), Snake River Plain (Gallant et al., 2018), Taupo Volcanic Zone (Kósik et al., 2020), and Aluto (Clarke et al., 2020). Furthermore, the expected eruption style and resulting volcanic phenomena are likely influenced by vent position. In other words, vent position is not only important for volcanic hazard assessment because it controls the final dispersal of volcanic products, but also because it can be correlated with eruption style and intensity. However, there are significant difficulties associated with interpreting and modeling the dependence between eruption style and vent position (e.g., Thompson et al., 2015; Clarke et al., 2020). A number of different volcanic processes may produce this correlation, such as the involvement of different portions of the plumbing system, the presence of groundwater or surface water in specific zones of the volcanic field, or variations in the mechanical characteristics of the country rocks (e.g., Andronico et al., 2005; Coppola et al., 2009; Aravena et al., 2020b). This is evident, for example, in partially submerged calderas in which the style of activity of vents in the submerged zones is clearly influenced by their position either increasing the explosivity through magma–water interactions or reducing explosivity in deepwater conditions (Tonini et al., 2015; Sandri et al., 2018; Paris et al., 2019). Thus, the spatial distribution of the expected style of activity could be strongly relevant when vent opening maps are used to produce long-term hazard maps for different eruption scenarios.
In this context, in order to deal simultaneously with the uncertainty associated with vent position, eruptive style, and their interdependence, we present thematic vent opening maps that consider separately the occurrence of four selected volcanic phenomena: lava emission, small-scale pyroclastic density currents, ejection of ballistic projectiles, and low-intensity pyroclastic fallout. The input geological information adopted for the construction of these maps includes the mapping of the main fault structures, the position of past eruptive vents, and various information on the eruption styles and processes. This is deduced from a critical analysis of the literature, the study of volcanic deposits, and from remote analysis of their morphological characteristics. The resulting thematic probability maps include uncertainty quantification both on past vent locations and on model parameters. To illustrate the effects of using thematic vent opening maps instead of ordinary non-thematic maps, we show a systematic application of the recently developed branching energy cone model (Aravena et al., 2020a), which is able to describe the invasion area of pyroclastic density currents considering channelization processes.
In this investigation, developed within the framework of the RIESCA project, funded by the Italian Development Cooperation and aimed at promoting applied training in risk scenarios in Central America, we construct thematic vent opening maps for two volcanic complexes of the Central America Volcanic Arc: the San Salvador volcanic complex (SSVC, El Salvador; Fig. 1a) and Nejapa-Chiltepe volcanic complex (NCVC, Nicaragua; Fig. 1b). The SSVC and NCVC are both associated with the subduction of the Cocos Plate beneath the Caribbean Plate at an average rate of 70–90 mm yr−1 (Barckhausen et al., 2001; DeMets, 2001) and pose particularly critical volcanic risks due to the presence of densely inhabited communities in the surrounding areas, including the metropolitan areas of San Salvador (∼2.4 million people) and Managua (∼1.4 million people), respectively (Fig. 1a and b). This implies that any future volcanic activity could threaten the life of hundreds of thousands of people. Thus, in addition to being an interesting application of our new methodology, the availability of vent opening maps becomes relevant for improving hazard assessment in these regions.

Figure 1(a, b) Topographic maps of the San Salvador volcanic complex (a), mainly based on Ferrés et al. (2011), and the Nejapa-Chiltepe volcanic complex (b), mainly based on Avellán et al. (2012). Data associated with the vents of past eruptions and major structures are also presented, which were employed for the construction of thematic vent opening probability maps. In panel (a), the letter A refers to a N40W-trending fault and the letter B refers to a N65W-trending fault. Eruptions 25a (∼36 ka BP) and 25g (∼3 ka BP) mark the limits between the three evolution stages defined for the SSVC. In panel (b), NML refers to the Nejapa-Miraflores lineament. The green zones present indicative limits of the urbanized areas. (c, d) Schemes of the eruptive sequences associated with the San Salvador volcanic complex (c) and Nejapa-Chiltepe volcanic complex (d). Yellow symbols represent their eruptions (see Tables 1 and 2) and black symbols represent regional stratigraphic markers. Eruption numbers refer to the vents (see panels a and b) and letters are used to identify different eruptions from a single vent. Bifurcations are used to separate sets of eruptions whose chronostratigraphic relationship is not known.
In this paper, after a description of the geological framework of the SSVC and NCVC (Sect. 2), we present new thematic vent opening maps for the two studied volcanic complexes (Sect. 3). Then we present invasion probability maps of small-scale pyroclastic density currents (PDCs), which are derived from the application of the branching energy cone model (program ECMapProb) and the adoption of the thematic vent opening maps described previously (Sect. 4). Finally, Sects. 5 and 6 present the discussion and conclusions of this study.
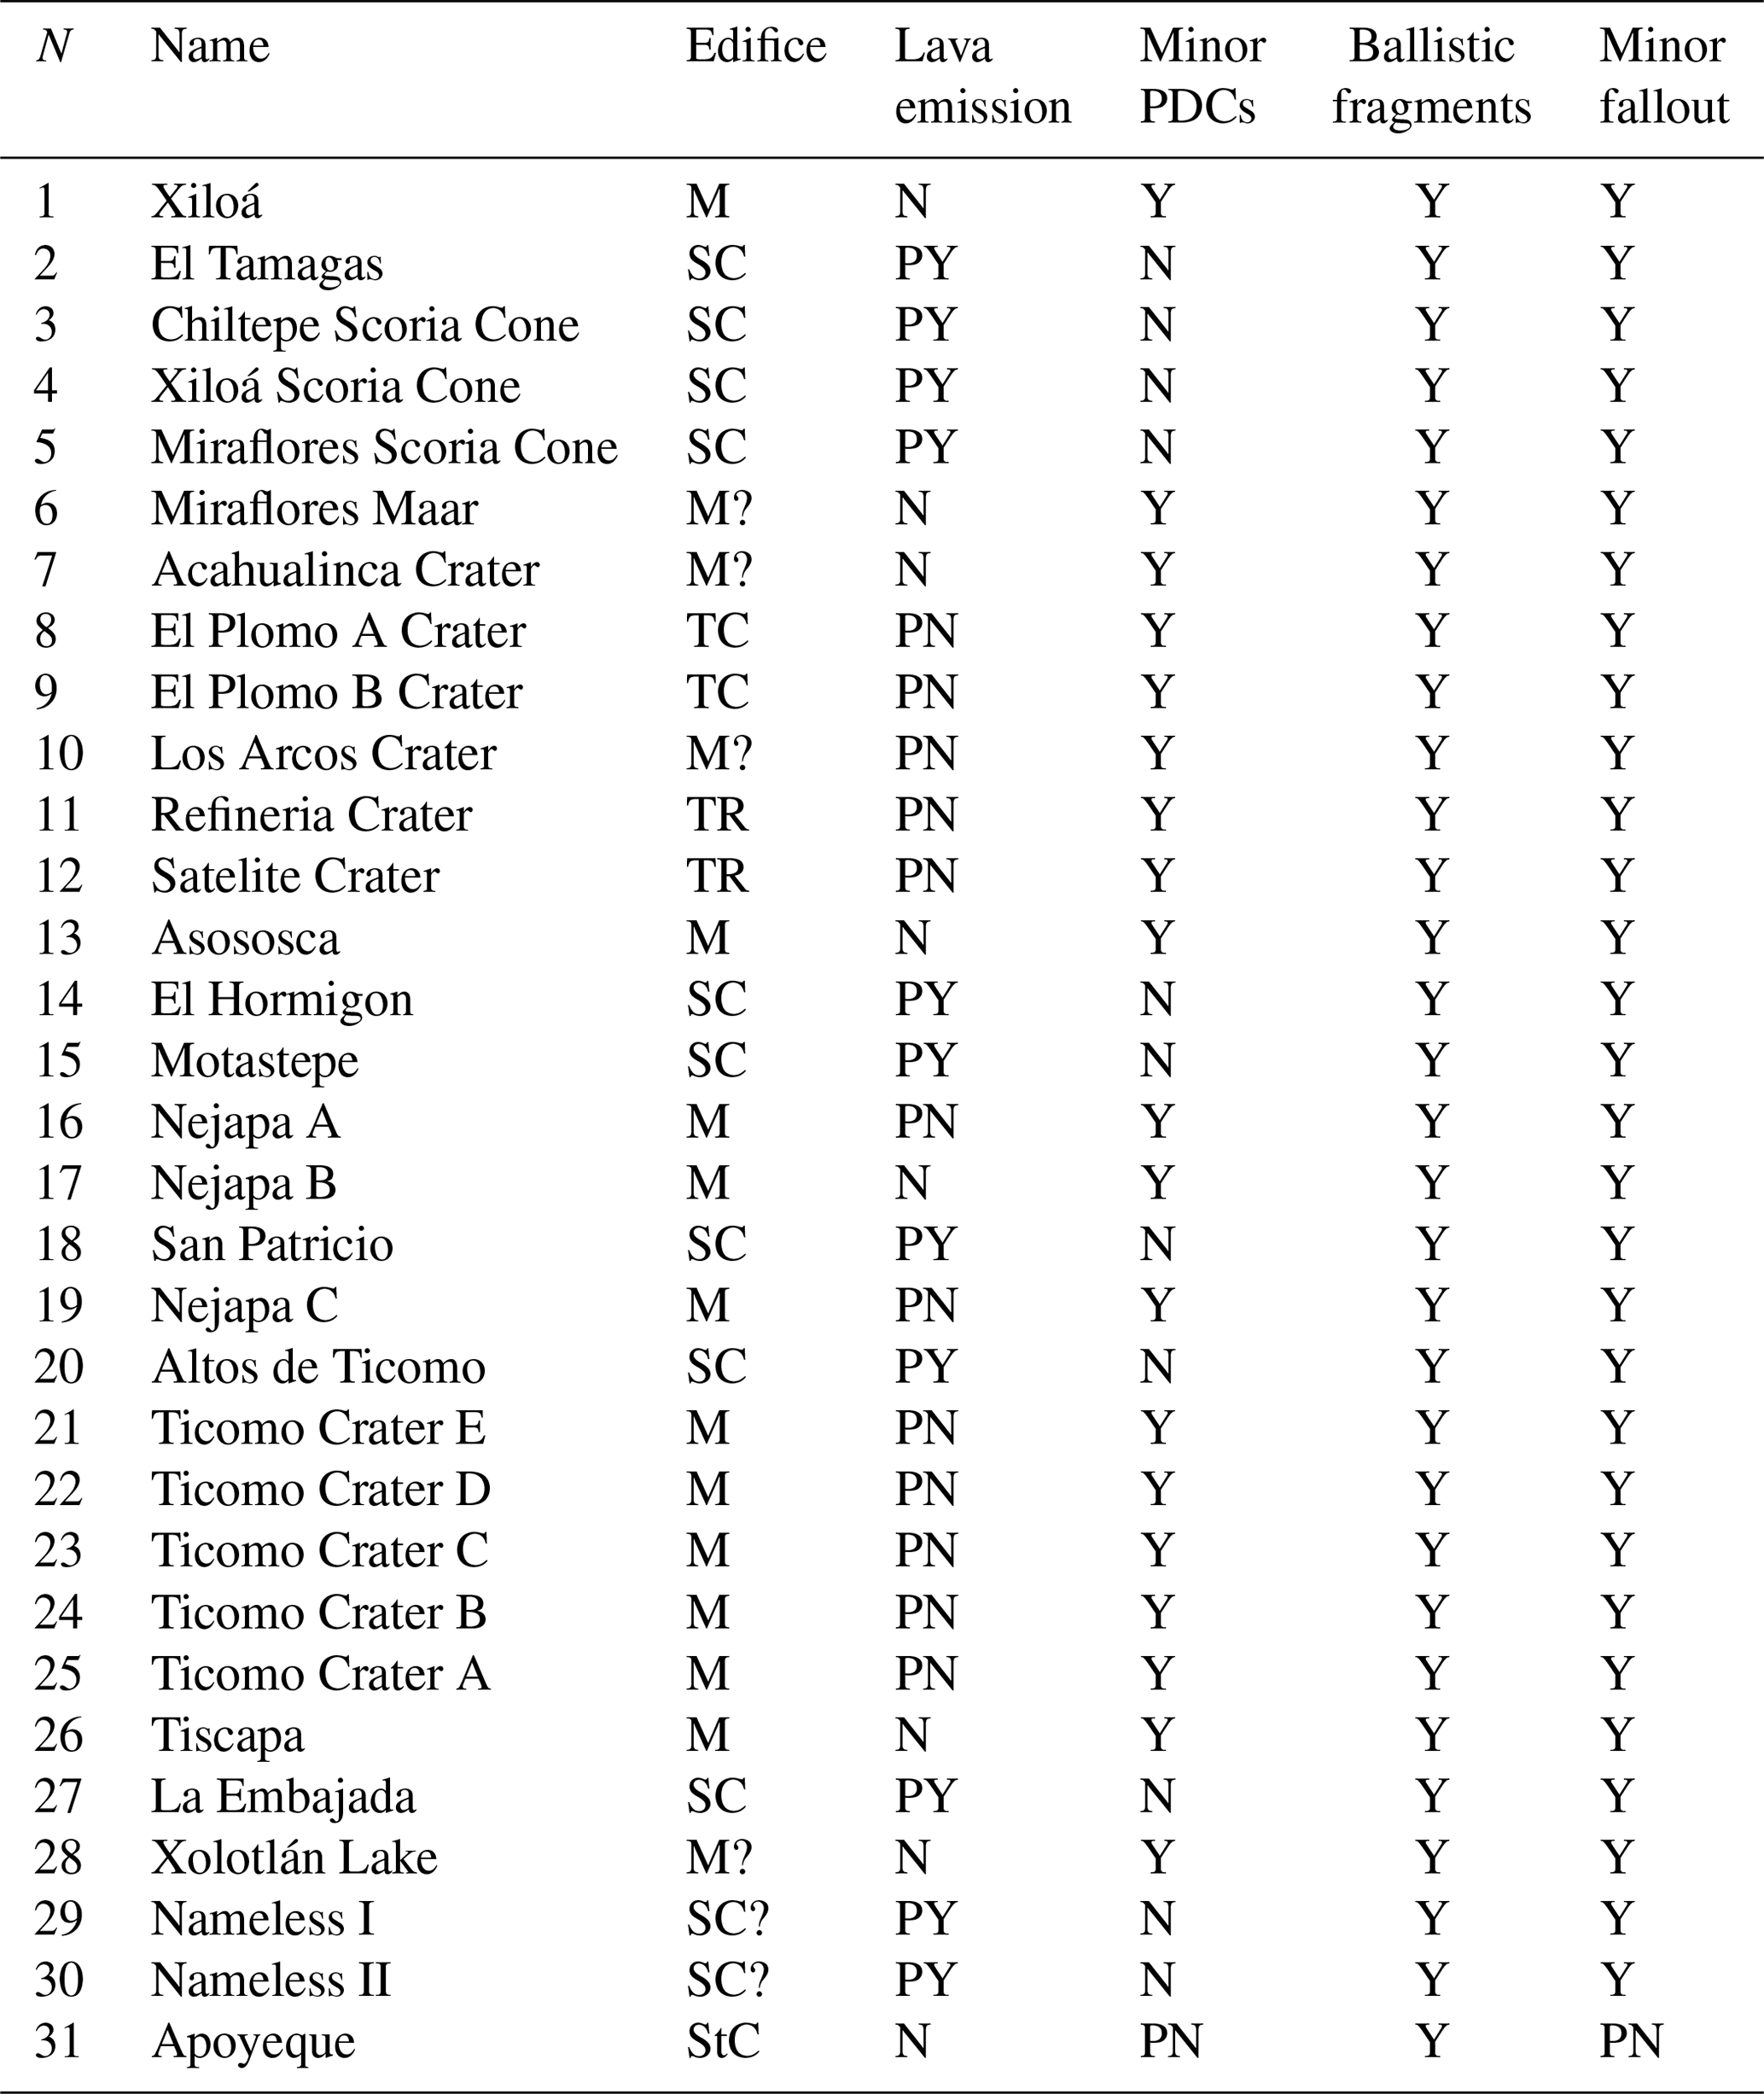
Table 1Vents considered in the SSVC (Sofield, 1998; Ferrés et al., 2011, 2013; Ferrés, 2014).

SC: Scoria cone. LF: Lava flow (emitted from a fissure vent). TC: Tuff cone. M: Maar. EC: Explosion crater. TR: Tuff ring. CC: Central crater. Y: Yes. PY: Probably yes. PN: Probably no. N: No. A scheme of the eruptive sequence is presented in Fig. 1c.
We performed a detailed literature analysis in order to collect volcanological data and structural information on the SSVC and NCVC (Fig. 1a and b).
First, we collected information about past vent locations and their uncertainty areas, which were defined using polygons (Fig. 1a and b). Inside these polygons the probability is distributed uniformly. Small polygons are associated with well-constrained vent locations (e.g., by the existence of a well-preserved crater), while large polygons are related to significant uncertainty in vent position. Figure 1c and d presents the eruptive sequence of the two volcanic complexes addressed in this work, where yellow symbols represent their well-documented eruptions (see Tables 1 and 2) and black symbols represent regional stratigraphic markers. In this figure, eruption numbers refer to the source vents (see Fig. 1a, b and Tables 1 and 2) while the letters are used to identify different eruptions from a single vent. In both case studies there are many monogenetic vents and only one polygenetic vent, i.e., San Salvador–Boquerón volcano and Apoyeque volcano, respectively.
Table 2Vents considered in the NCVC (Pardo et al., 2008; Freundt et al., 2010; Avellán et al., 2012).
SC: Scoria cone. TC: Tuff cone. M: Maar. TR: Tuff ring. StC: Stratocone. Y: Yes. PY: Probably yes. PN: Probably no. N: No. A scheme of the eruptive sequence is presented in Fig. 1d.
Then, we considered the major fault structures present in the studied volcanic areas (Fig. 1a and b), which likely had a significant influence in the vent position of past events because of their effect in magma ascent dynamics (Gaffney and Damjanac, 2006; Valentine and Krogh, 2006; Ferrés et al., 2011; Avellán et al., 2012; Le Corvec et al., 2013).
Finally, we considered the range of eruptive phenomena associated with past events, mainly based on the nature of the different volcanic edifices and deposits, and on the available volcanological literature (see Tables 1 and 2). In this way, for each vent, we defined one of four probability levels, i.e., Y = 1, PY = 0.75, PN = 0.25, or N = 0, associated with the occurrence of four different eruptive phenomena: (1) lava emission, (2) small-scale pyroclastic density currents associated with phreatomagmatic activity or low-intensity magmatic volcanism, (3) ejection of ballistic projectiles, and (4) low-intensity pyroclastic fallout due to Strombolian, violent Strombolian, or Vulcanian activity (see Tables 1 and 2 and their footnotes). These probability levels are then used to weight the importance of the different vents in the construction of thematic vent opening maps, as described below. We remark that although sub-Plinian to plinian eruptions able to produce large-scale pyroclastic flows and fallout deposits are also present in the geological record of the SSVC and NCVC, this eruption type was only associated with the two main central edifices (i.e., San Salvador volcano and Apoyeque volcano, respectively). Thus, the probability of vent opening for these phenomena is largely concentrated on the apical part of these edifices and, consequently, the construction of vent opening maps for these events is not considered in this work.
2.1 San Salvador volcanic complex (SSVC)
The Pleistocene–Holocene San Salvador volcanic complex (SSVC, El Salvador; Fig. 1a) sits in a E–W trending graben and is formed by a summit cone called Boquerón volcano (BV) enclosed by the remnants of the ancient volcanic edifice of San Salvador volcano (SSV) and by at least 25 monogenetic volcanic edifices located southeast, northwest, and north of the main edifice (Fig. 1a). The monogenetic edifices include scoria cones, maars, tuff rings, tuff cones, and explosion craters. Their positions are strongly influenced by two NW-trending normal faults (Fig. 1a). In this work, following Ferrés et al. (2013) and Ferrés (2014), these structures are referred to as faults A (i.e., the N40W-trending fault) and B (i.e., the N65W-trending fault; see Fig. 1a).
Ferrés et al. (2013) and Ferrés (2014) identified three main periods in the eruptive history of the SSVC:
- a.
Stage I (>72–36 ka) corresponds to the construction and collapse of SSV. It is represented by pyroclastic deposits intercalated with andesitic and basaltic andesitic lavas and fallout sequences associated with the Coatepeque caldera (Kutterolf et al., 2008; Ferrés et al., 2011). El Picacho (∼1960 m a.s.l.), El Jabalí (∼1400 m a.s.l.), and the SW portion of the current volcanic edifice are the present remnants of the collapsed and deeply eroded SSV (Fig. 1a; Ferrés, 2014). No monogenetic centers have been identified during this stage (Ferrés, 2014). The collapse of SSV was a consequence of a phreatoplinian eruption responsible for the emplacement of the pyroclastic sequence G1 (event 25a in the nomenclature adopted in Fig. 1c; Sofield, 1998).
- b.
Stage II (36–3 ka) represents the construction of the active Boquerón volcano (volume of circa 8.5 km3; Ferrés, 2014). It includes both effusive and explosive volcanism associated with the emission of basaltic andesitic and andesitic magmas, intercalated with pyroclastic deposits from the Ilopango caldera (Kutterolf et al., 2008; Ferrés et al., 2011; Smith et al., 2020). During this period, lava flows were issued from SSV (in particular, 14 lava flows were recognized by Fairbrothers et al., 1978), while the explosive activity included at least six events after the pyroclastic sequence G1 (events 25b–g in the nomenclature of Fig. 1c; the last one marked the limit between Stages II and III; Ferrés et al., 2013).
- c.
Stage III (3 ka–present) includes eruptive activity mainly concentrated in the flanks of BV and in the plain nearby. Sofield (1998) suggests that this shift was related to the reaching of the critical height of the younger edifice (i.e., BV). Several monogenetic edifices were formed during this period as a consequence of both explosive and effusive volcanism, which frequently involved magma interaction with external water, such as Crater La Escondida and Loma Caldera (Table 1). In any case, no hydromagmatic explosions have occurred in the area in the last 1000 years (after Talpetate I; see Fig. 1c; Sofield, 1998), possibly as a consequence of a reduction in the level of groundwater in the flanks of the volcano.
Ferrés (2014) suggests that the enlargement of the volcanic field during Stage III is associated with a general decrease of activity in the Central Crater. It is important to note that although flank activity started approximately 10 ka ago, it has been dominant only during the last 3 ka, exhibiting a strong structural control (Fig. 1a). On the other hand, during this period BV volcanic activity has included at least three volcanic events: Talpetate I (San Andres Tuff, which includes fallout and surge deposits widely distributed towards the southwest; event 25h in the nomenclature of Fig. 1c), Talpetate II (event 25i in the nomenclature of Fig. 1c), and the last eruption (i.e., AD 1917 event, vent 29; Fig. 1c and Table 1) when minor explosive activity in the central crater, associated with the construction of the intra-crateric Boqueroncito tuff ring, coexisted with an important lava effusion from parasitic vents of the N flank (vents 27 and 28 in our nomenclature; Fig. 1c and Table 1).
Sofield (2004) proposed five different eruption scenarios: (1) hydromagmatic flank eruption of Volcanic Explosivity Index (VEI) 1–3, (2) monogenetic magmatic eruption of VEI 1–3, (3) small-scale eruption of VEI 1–3 within the Boquerón crater, (4) sub-Plinian eruption from the central vent (VEI 4–5), and (5) Plinian eruption from the central vent (VEI 6). Major et al. (2001) also described plausible scenarios associated with lahar occurrence. A first hazard assessment exercise for BV was done by Ferrés et al. (2013), considering ash fall, ballistic projectiles, and pyroclastic density currents issued from the central vent. However, since a recurrence period of 85±50 years was proposed by Sofield (1998, 2004) for flank eruptions during Stage III, the most probable future event is associated with monogenetic volcanism, and thus the analysis of the hazard associated with flank eruptions is of paramount importance in the SSVC in order to complement the recent literature.
In this study, we focused on the last 36 ka of volcanic activity at the SSVC (i.e., our analysis starts with the end of Stage I, when the collapse of SSV occurred). In particular, following Sofield (1998), Ferrés et al. (2011), and Ferrés (2014), we considered 29 vents in the SSVC (Fig. 1a and Table 1), most of them with a monogenetic character (the only exception is vent 25, i.e., the central crater). Mainly considering the edifice type, the deposits characteristics, and the historical activity, for each volcanic vent we defined the probability of occurrence of the four volcanic phenomena studied here (i.e., lava emission, small-scale PDCs, emission of ballistic projectiles, and low-intensity pyroclastic fallout; Table 1). In general terms, small-scale PDCs were not associated with the activity of scoria cones, while all four volcanic phenomena considered here have been linked, although with different probability of occurrence, to maars, explosion craters, tuff cones, and tuff rings as well as to the central activity of BV. It is important to highlight that the products of Plinian and sub-Plinian volcanism, which have been produced at the central vent of the SSVC, were not considered in the construction of our vent opening maps due to the small uncertainty in vent position for these events.
2.2 Nejapa-Chiltepe volcanic complex (NCVC)
The Pleistocene–Holocene Nejapa-Chiltepe volcanic complex (NCVC; Fig. 1b) is located at the western edge of the active Managua graben in Nicaragua. It includes at least 31 volcanic vents mainly emplaced following the Nejapa-Miraflores lineament (NML in Fig. 1b; Espinoza, 2007; Avellán et al., 2012). At its northern limit, the NCVC includes the polygenetic Apoyeque stratovolcano and several monogenetic volcanoes including maars, tuff rings, tuff cones, and scoria cones (Table 2, Avellán et al., 2012). One of these vents, named Tiscapa maar (vent 26 in the nomenclature presented in Fig. 1d and Table 2) and whose emplacement was controlled by the seismically active Tiscapa fault, is located inside the city of Managua (Ward et al., 1974; Freundt et al., 2010; Freundt and Kutterolf, 2019).
The NCVC deposits are intercalated with pyroclastic deposits derived from the Apoyo and Masaya calderas, which represent useful stratigraphic markers (Fig. 1d; Kutterolf et al., 2008). Apoyeque products are mainly dacitic to rhyolitic in composition, while the products of monogenetic vents range from basaltic to andesitic basaltic (Avellán et al., 2012). Most of the eruptions associated with the NCVC involved hydromagmatic activity, possibly triggered by the interaction between rising magma and shallow aquifers (Avellán et al., 2012). The possible presence of sources of surface water is therefore of primary importance for volcanic hazard assessment in this area.
No clear trends are recognized in the temporal evolution of vent position and eruption style, even if important climate variations have been documented in this zone during the Holocene (Freundt et al., 2010). In any case, it is important to highlight that phreatomagmatic activity in the central and southern NCVC has been dominantly observed relatively close to the Nejapa fault (e.g., El Plomo craters, Ticomo craters, Refineria crater), while scoria cones are preferentially observed in the peripheral zone (e.g., Motastepe, Altos de Ticomo, San Patricio). A detailed description of the eruptive history of the NCVC, particularly of its central and southern parts, is presented in Avellán et al. (2012), while Pardo et al. (2008) and Freundt et al. (2010) focus on the youngest eruptions of the NCVC, which created the Asososca and Tiscapa maars. Details on Plinian eruptions of Apoyeque volcano are present in Kutterolf et al. (2011) and Avellán et al. (2014). A previous hazard assessment exercise for the NCVC was done by Connor et al. (2019) by adopting an elliptical kernel density estimator. However, these maps were based on 28 past vent locations, did not consider uncertainty in vent locations, and did not incorporate fault structures nor information on past eruptive styles. The main differences between our approach and theirs are briefly discussed in Sect. 5.
Based on Pardo et al. (2008), Freundt et al. (2010), and Avellán et al. (2012, 2014), we considered 31 vents in the NCVC (Fig. 1b and Table 2). In this case as well, for each volcanic vent we defined the probability of occurrence of the four volcanic phenomena studied in this work, mainly based on the edifice type, the characteristics of the documented deposits, and the current presence of surface water, which may induce an eruption dynamics controlled by magma–water interaction processes (Table 2). In general terms, scoria cones were mainly related to the production of small-volume fallout deposits, ejection of ballistic projectiles, and the emission of lavas. On the other hand, the hydromagmatic activity typical of maars, tuff cones, and tuff rings has been linked to the emission of ballistic projectiles and generation of relatively small PDCs and fallout deposits, while lava flows are generally absent at this type of edifice. Finally, for Apoyeque volcano (i.e., vent 31, Fig. 1d and Table 2), we consider that the typical volcanism is characterized by the emission of ballistic projectiles and the eventual generation of relatively small volumes of fallout deposits and small-scale PDCs. We remark that the analysis of large-scale explosive eruptions, which have characterized the activity of Apoyeque volcano, is beyond the objective of this work and thus they were not considered in the construction of our vent opening maps. We choose to consider the volcanic activity of Apoyeque volcano and in other zones of this volcanic system in a common framework to assess volcanic hazard. Although volcanoes of the Nejapa-Miraflores lineament and those of the Chiltepe peninsula have different style and magma composition, it is undoubtful that their activity was strongly interfingered in the recent past (Kutterolf et al., 2007) and that the tectonic structures controlling these volcanoes are strictly interrelated. It is worth noting that the influence of this assumption in the analysis of small-scale events is limited because of the restricted influence of a single vent within the entire volcanic system and because the weight assigned to the different volcanic phenomena at the Apoyeque caldera is null or small in most of the cases (for three of the four considered volcanic phenomena).
3.1 Methods
In both the SSVC and NCVC case studies, we adopt the kernel-based multi-model approach developed in Bevilacqua et al. (2015, 2017a) and Tadini et al. (2017b). These are long-term assessments based on the record of past eruptions and mapped faults, which rely on the assumption that a new vent will likely open close to previous vents and to geological structures that, in the past, have favored the ascent of magma to the surface.
We linearly integrate two models named Model 1 and Model 2, with weights affected by uncertainty (Fig. 2). Model 1 considers the faults and the position of past vents following a Bayesian approach and relies on the assumption that new vents will likely occur near structures that interacted with ascending magmas in the past (Martin et al., 2004; Jaquet et al., 2012). On the other hand, Model 2 adopts a Gaussian kernel density estimator applied on a uniform distribution within the uncertainty areas enclosing the past vents (Tadini et al., 2017b). This model does not consider structures but only a measure of the expected distance between past and future vent positions. We remark that in both models past vents do not comprise simple points but areas of uncertainty of different extent. Each area can cover several cells of our 100 m resolution computational grid, some of them completely, others only partially. Therefore, for each cell, the fraction of each uncertain area that it contains was taken into account (Bevilacqua et al., 2015; Tadini et al., 2017a). Both models are reviewed in Appendix A. A key novelty of this study is the fact that we weight the past vents differently according to the chance that the new vents related to them will be the source of a specified hazardous phenomenon, based on the past eruptions that locally occurred. The thematic weights, which lead to the production of thematic maps, are reported in Tables 1 and 2.
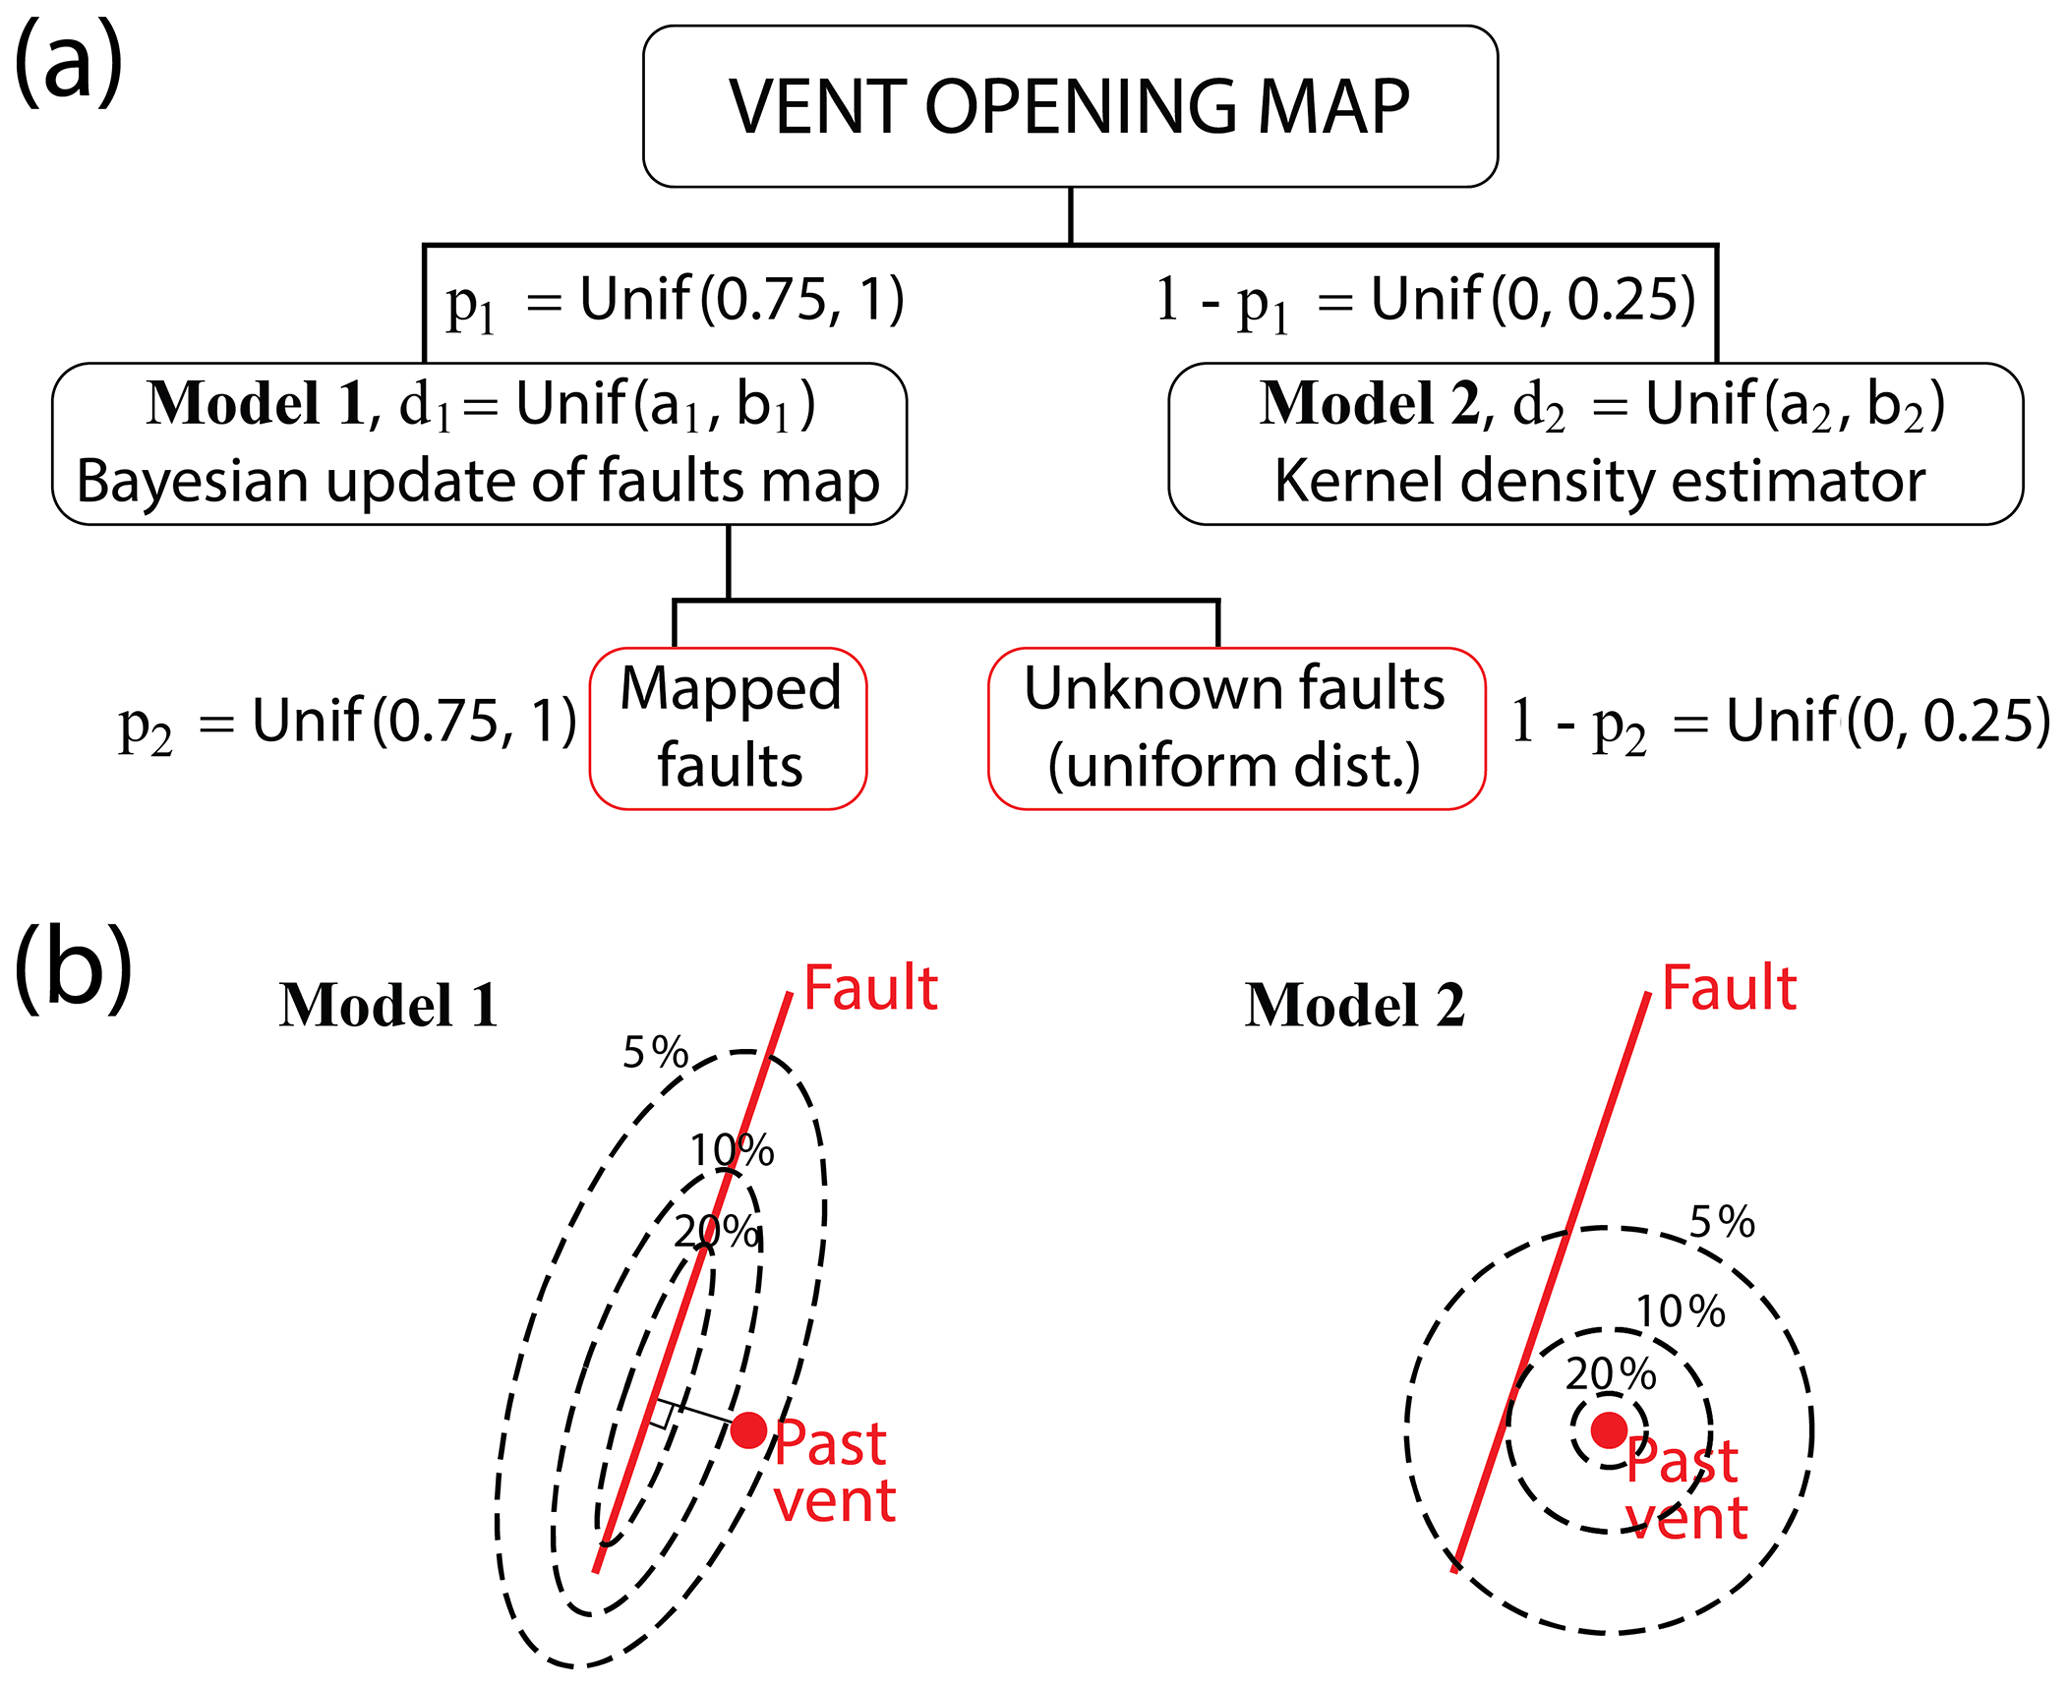
Figure 2(a) Logic tree of the multi-model scheme presenting epistemic uncertainty sources. Random variables modeling epistemic uncertainty sources are displayed. Red boxes show the two maps of prior probability of faults locations. (b) Schematic example of the application of the two models used in this work in the test case of a past vent near a fault.
The location of the next eruptive vent is modeled as a random variable X with a continuous probability density function (PDF) in the spatial domain. The vent opening map is then displayed as the probability density of the variable X per km2. We remark that the probabilities of vent opening that we obtain are conditioned on the occurrence of a new eruption and there is no associated temporal window. We did not count the polygenetic vents multiple times in these models. In Sect. 5 we discuss this assumption and we test the opposite choice.
We remark that our estimates are doubly stochastic (e.g., Cox and Isham, 1980; Daley and Vere-Jones, 2003, 2008; Jaquet et al., 2008, 2012, 2017), which means that the statistical distribution of the location of the next eruptive vent is represented using ill-constrained parameters that are treated as uniformly distributed random variables (e.g., Bevilacqua, 2016). These parameters are two distance values d1 and d2 tuning the kernel bandwidth of the two models and two probability values p1 and p2 tuning the probabilistic relevance of Model 1 compared to Model 2 and of the mapped faults compared to unknown structures, respectively. As a consequence of this approach, the PDF values will have their own confidence intervals.
In particular, the two map layers associated with different conceptual models (Model 1 and Model 2) are linearly combined with specific weights, p1 and (1−p1), for the development of a multi-model vent opening map (Fig. 2). A similar approach is adopted inside Model 1 to define the prior fault map as the combination of two layers, weighted p2 and (1−p2). One layer, z1, is related to the mapped faults (i.e., fault outcrops) and the other layer, z2, is a uniform PDF representing the unknown (i.e., buried) faults. Figure 2a illustrates the logic of this vent opening model combination. Figure 2b shows the two models and their differences when applied to the test example of a past vent near a fault.
The input parameter was constrained through a straightforward expert judgment after the assumption that Model 1 should have a greater relevance than Model 2. This is because both the SSVC and NCVC are characterized by robust geological information, which suggests significant relationships between past vents, fault structures, and volcanism, with several aligned vents along the main faults. Similarly, was chosen through expert judgment due to the greater relevance of mapped faults compared to unknown structures that are assumed to be uniformly distributed in the region. Thus, the vent opening maps produced here are dominated by Model 1 and by the information of mapped faults, but the possibility of a new vent not influenced by structural alignments or controlled by an unknown fault is considered. Further research focused on a deeper understanding of the two case studies of the SSVC and NCVC could improve these constraints, either through more structured expert judgment techniques (Bevilacqua et al., 2015; Tadini et al., 2017a), likelihood-based techniques (Bevilacqua et al., 2017a, 2018), and/or through other geophysical models able to address regional volcanism (e.g., Martin et al., 2004; Jaquet et al., 2012; Runge et al., 2016; Deng et al., 2017).
On the other hand, our multi-model approach depends on two additional parameters: d1 and d2 (see Appendix A). The parameter d1 in Model 1 is the average distance between sub-parallel regional faults. Different distances are measured in different sub-regions, thus defining the uncertainty range of d1. Specifically, km for both the SSVC and NCVC. The parameter d2 in Model 2 is the average of the distance of the kth nearest neighbor of each past vent. The number k is varied in [1, 3] to consider the presence of spatial clusters, thus defining the uncertainty range of d2. Specifically, km for the SSVC and km for the NCVC.
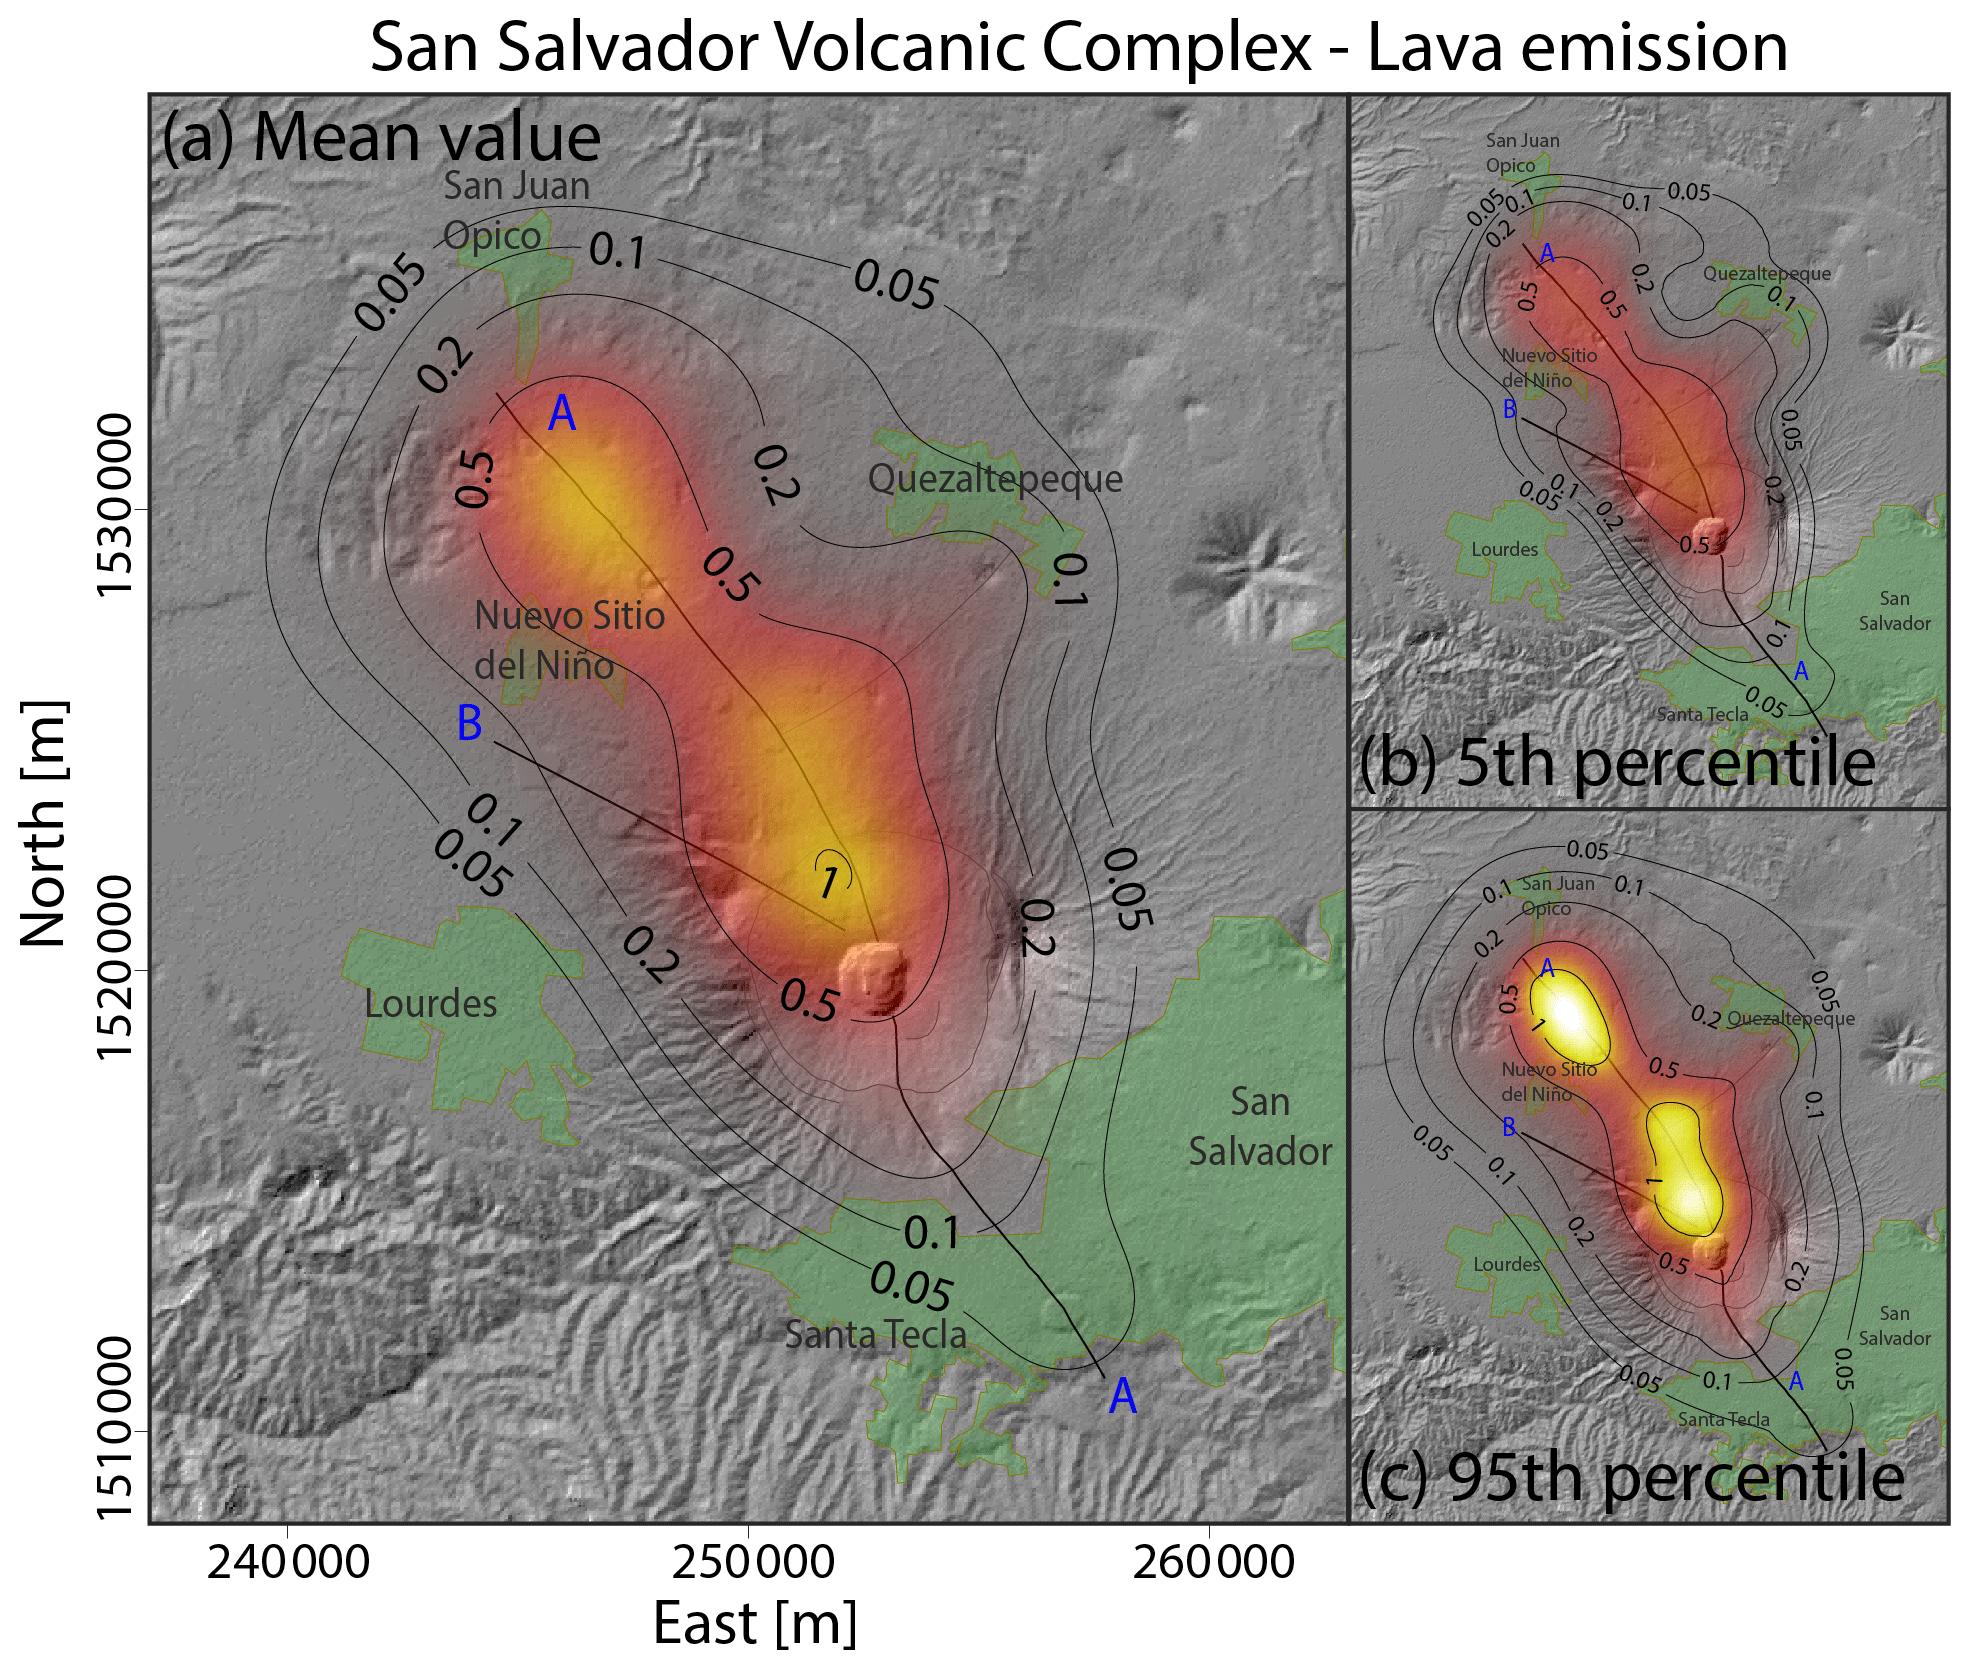
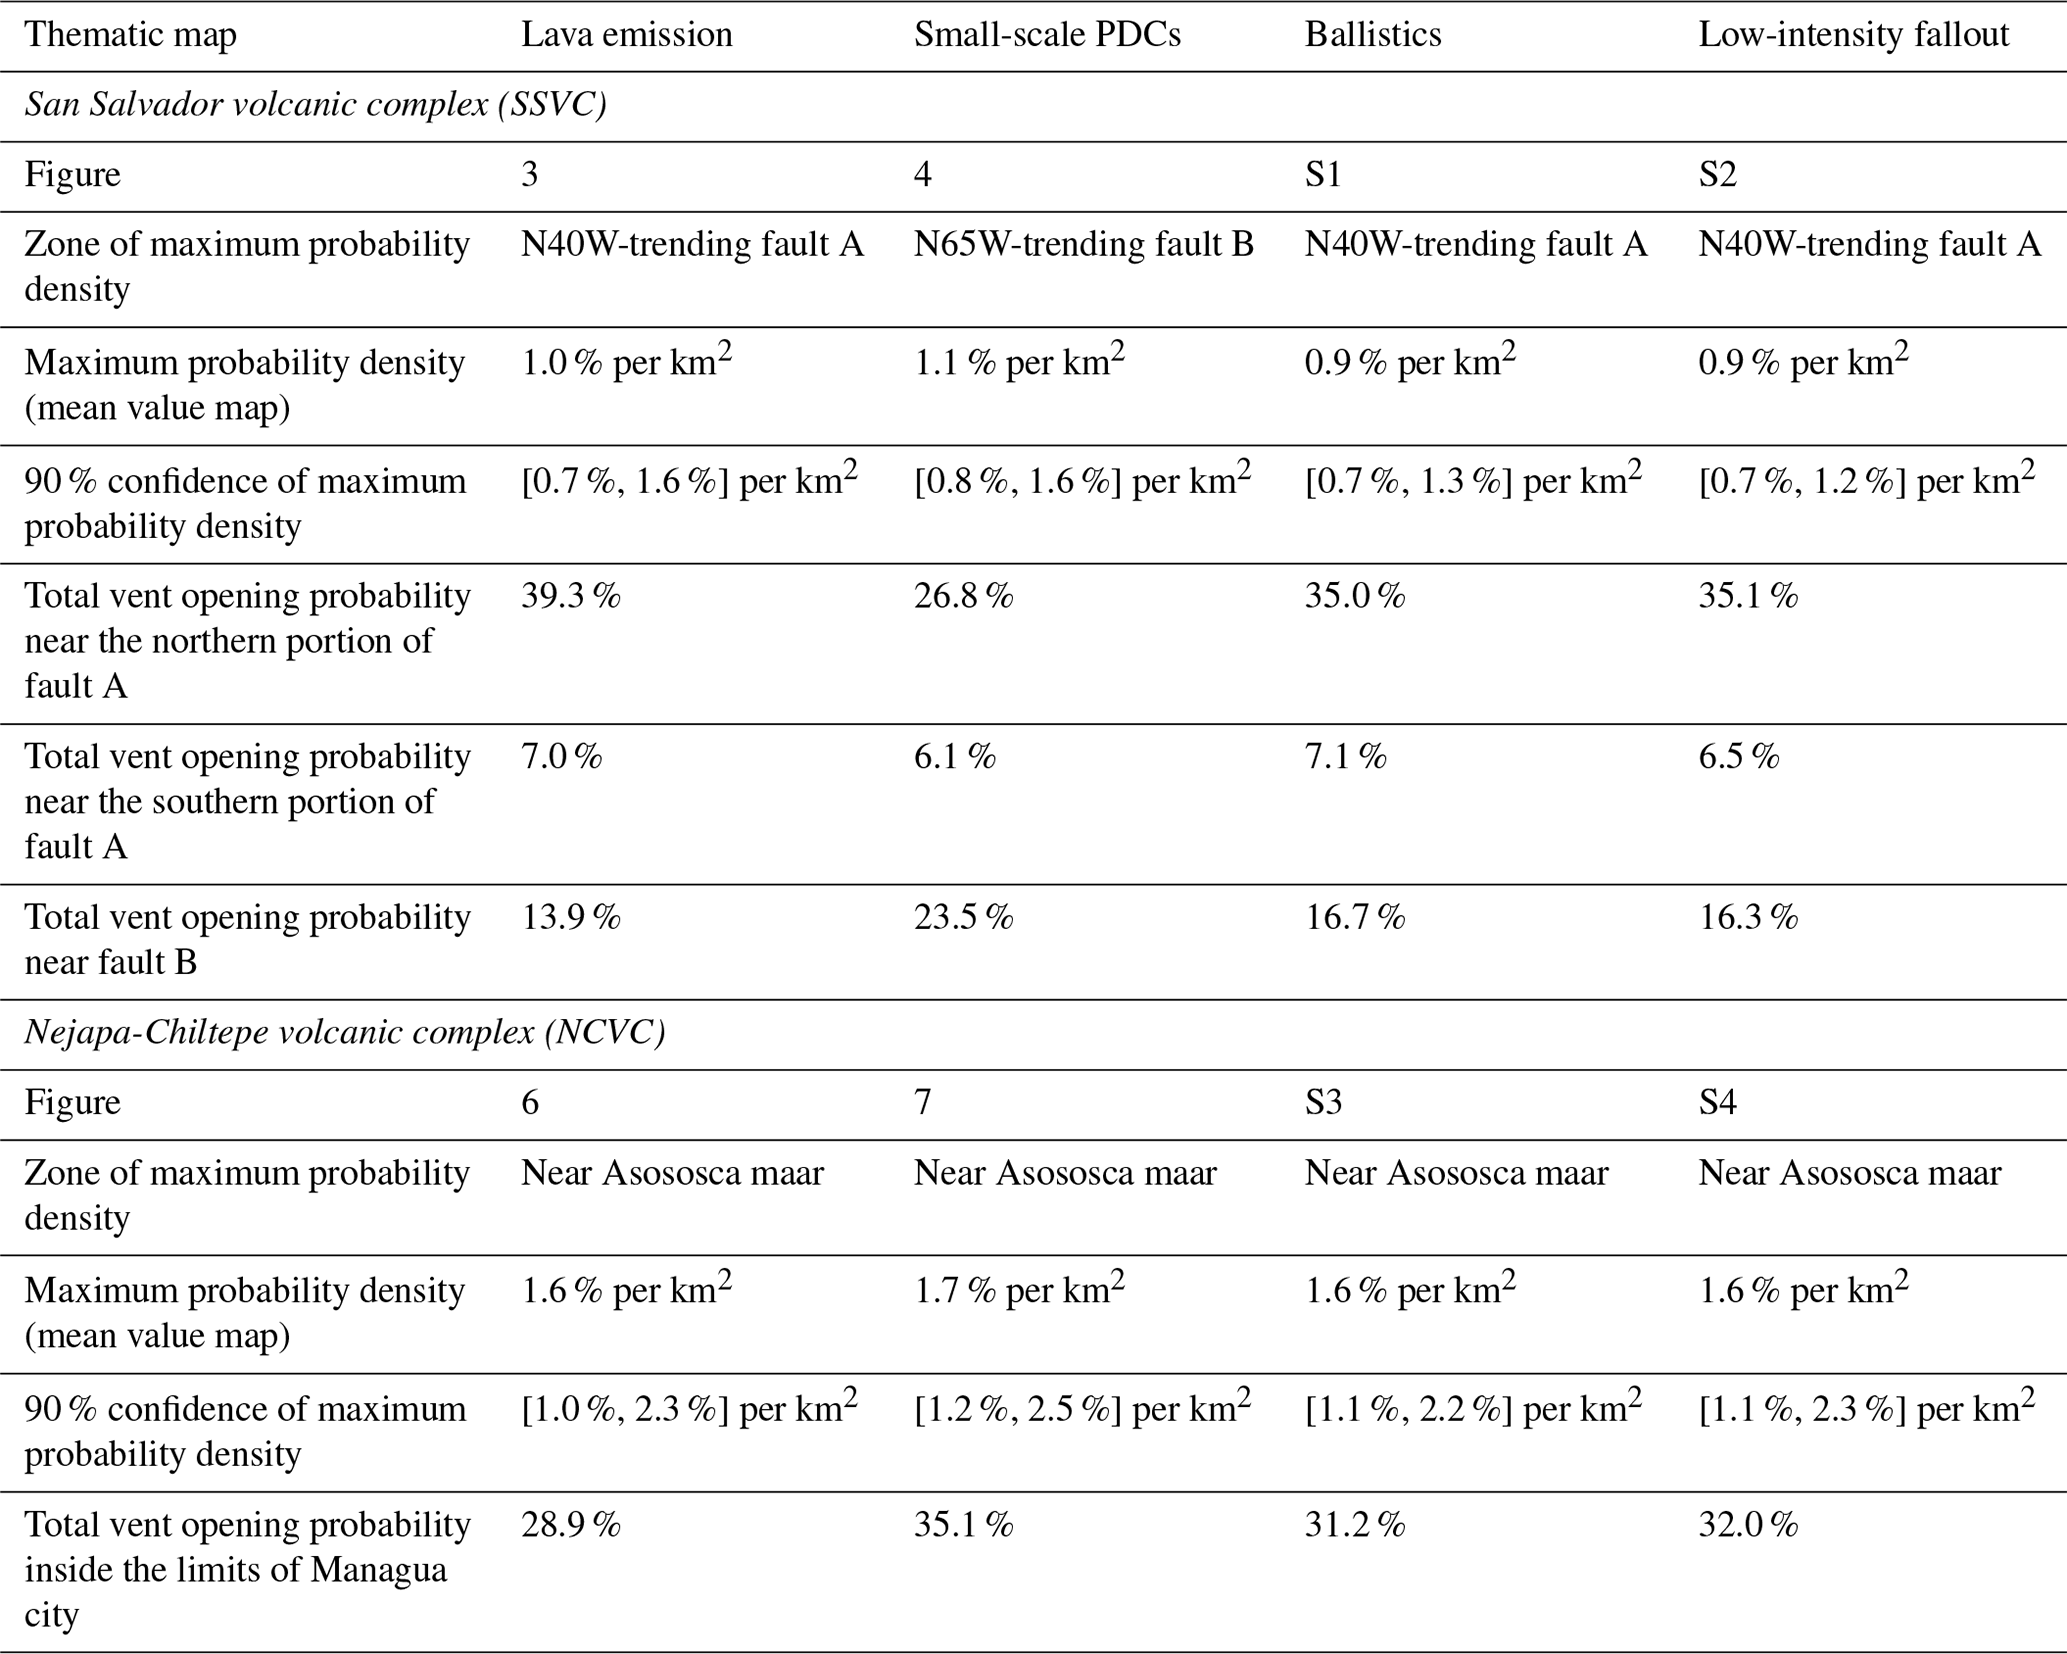
Figure 3Density distribution of the probability of vent opening at the San Salvador volcanic complex associated with the occurrence of volcanic activity able to produce lava flows. (a) Mean value. (b) 5th percentile. (c) 95th percentile. Results are expressed in percentage per km2.
In summary, if g(x) is the PDF of Model 1 and f(x) is the PDF of Model 2, then the multi-model “integrated” vent opening map is given by
which is
where we also express the dependence of g on the mapped faults z1, the uniformly distributed map of unknown faults z2, and the distance parameter d1. We also included the dependence of f on the distance parameter d2.
3.2 Results
3.2.1 San Salvador volcanic complex
Figures 3 and 4 present the resulting vent opening map associated with the SSVC for two of the four hazardous volcanic phenomena considered in this work: lava emission and small-scale PDCs, respectively. The results related to the emission of ballistic projectiles and the generation of small-scale fallout deposits are described in Figs. S1 and S2 in the Supplement. Each figure presents the mean value of the computed probability distribution and the results associated with the 5th percentile and the 95th percentile, expressed in terms of probability density per km2 in percentage. For comparison purposes, Fig. 5a presents the results associated with the mean value of a non-thematic vent opening map constructed using the same procedure but with all the vents adopting the same weight. Please note that in practice this map is equivalent to the vent opening map of ballistic projectiles (Fig. S1 in the Supplement). In general, we remark that if almost all past eruptions are characterized by a common volcanic hazardous phenomenon (e.g., the small-scale fallout), the corresponding thematic map will be very similar to the non-thematic map (Fig. S2 in the Supplement).
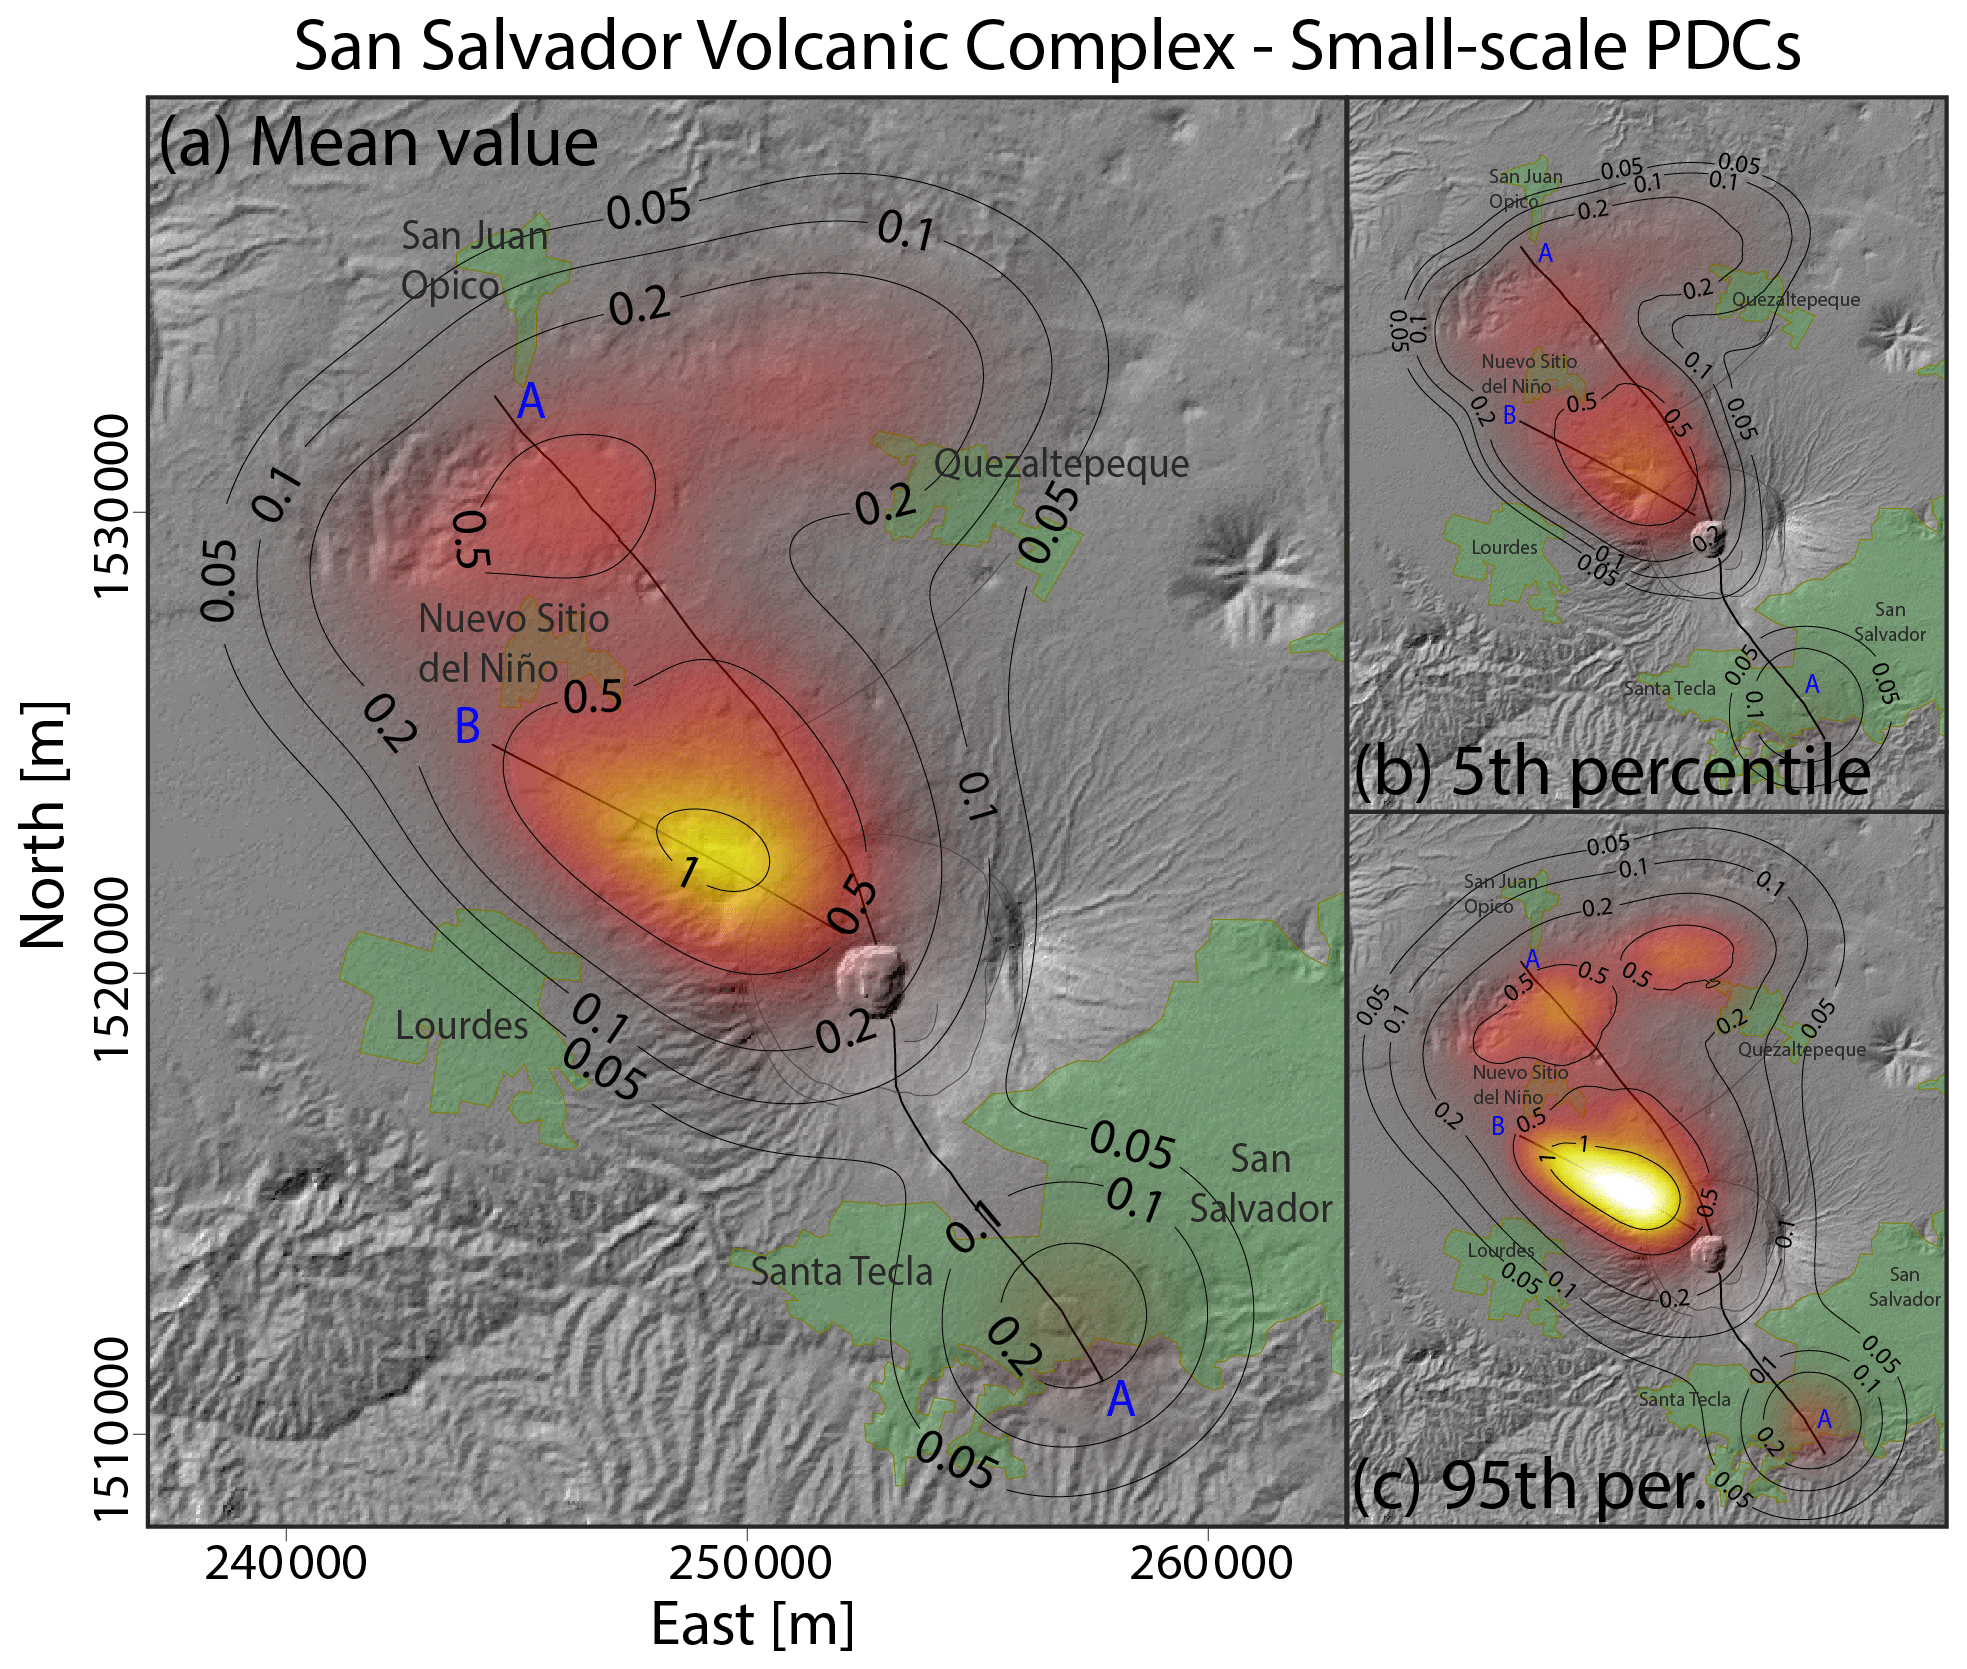
Figure 4Density distribution of the probability of vent opening at the San Salvador volcanic complex associated with the occurrence of volcanic activity able to produce small-scale pyroclastic density currents. (a) Mean value. (b) 5th percentile. (c) 95th percentile. Results are expressed in percentage per km2.
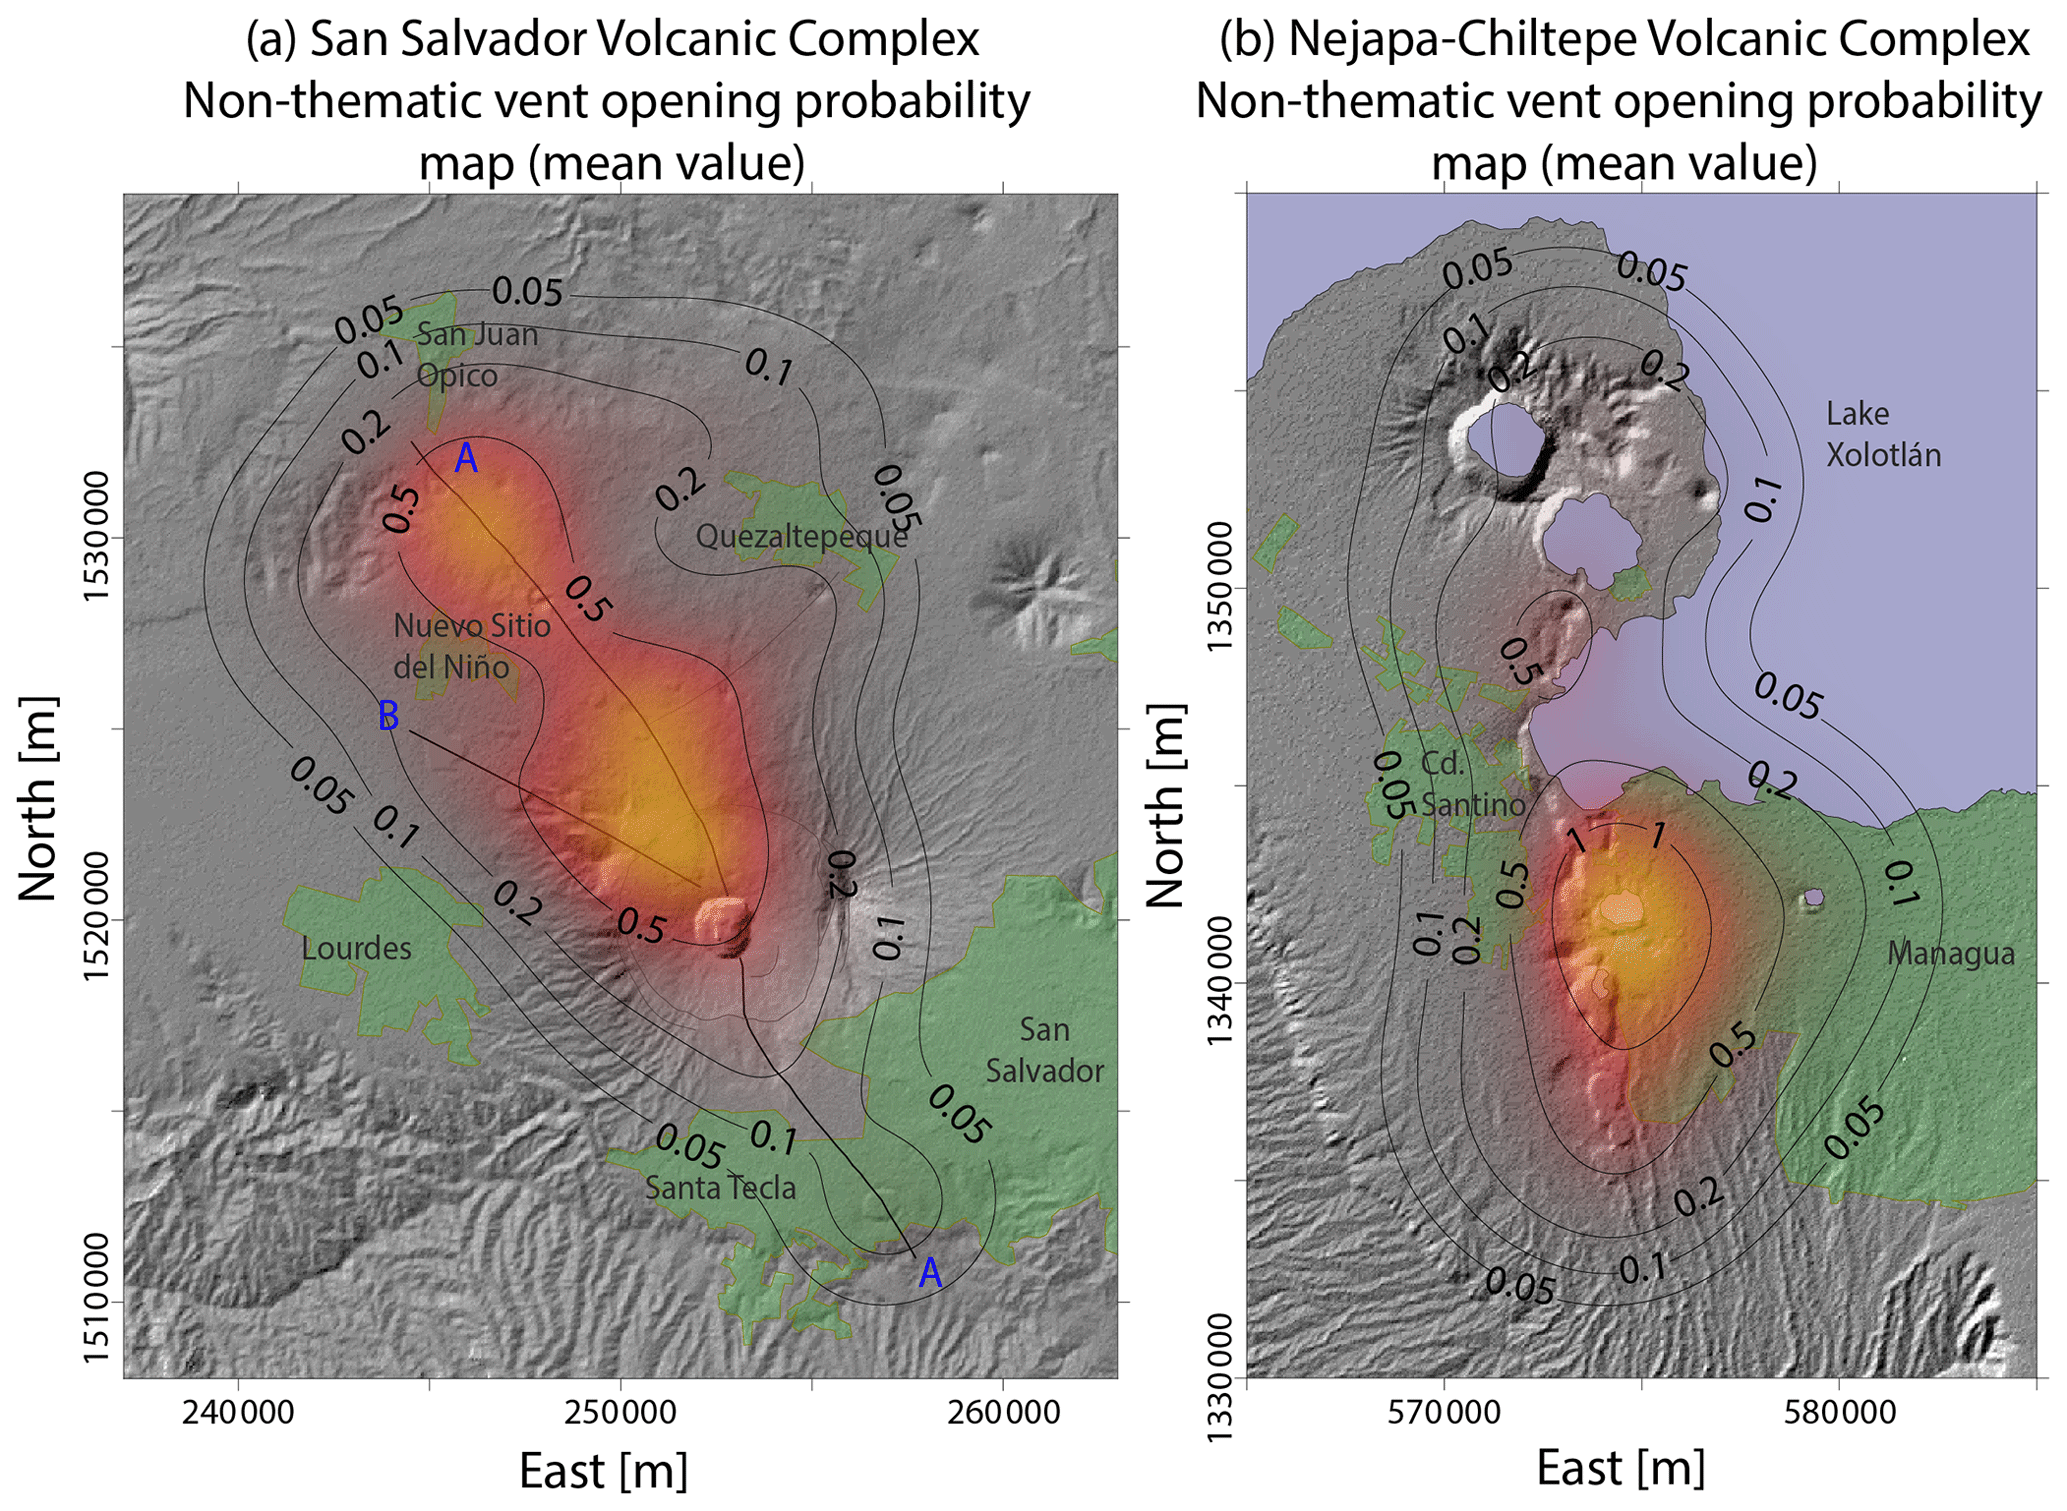
Figure 5Density distribution of the probability of vent opening (mean value) at the San Salvador volcanic complex (a) and Nejapa-Chiltepe volcanic complex (b). Results, which are not thematic, are expressed in percentage per km2.
Results exhibit significant differences between the various thematic maps. While the highest vent opening probability associated with small-scale PDCs follows the N65W-trending fault B (Fig. 4), in the other thematic maps the highest vent opening probabilities tend to locate along the northern portion of the N40W-trending fault A (Figs. 3 and S1 and S2 in the Supplement).
In particular, in the case of events able to produce lava flows (Fig. 3), the maximum probability density is located on the NW flank of San Salvador volcano along fault A, reaching probabilities of up to 1.0 % per km2 in the mean value map, with a 90 % confidence interval [0.7 %, 1.6 %] per km2. Considering the mean value map, the total probability of vent opening in a 4 km wide belt across the northern portion of fault A is 39.3 %, excluding the pixels that are closer to fault B than to fault A. On the other hand, the total probability of vent opening close to fault B is 13.9 %. This value was also computed by considering a 4 km wide belt across the fault under examination. Please note that this criterion is also used in the analysis of the other thematic maps.
Instead, as mentioned above, the region of maximum probability of vent opening conditioned on the occurrence of an eruption able to produce small-scale PDCs is located along the N65W-trending fault B (Fig. 4), with a peak probability in the mean value map of 1.1 % per km2, with a 90 % confidence interval [0.8 %, 1.6 %] per km2. In fact, in this case the total probability of vent opening near fault B (i.e., 23.5 %) is significantly higher than the results observed in the thematic map of lava emission. Instead, the probabilities of vent opening along the northern and southern portions of fault A are 26.8 % and 6.1 %, respectively.
The thematic maps associated with ballistic projectiles (Fig. S1 in the Supplement) are quite similar to the case of lava emission, with the maximum values observed along fault A. These maps show a peak probability density of 0.9 % per km2 in the mean value map, with a 90 % confidence interval [0.7 %, 1.3 %] per km2. The probabilities of vent opening near the northern portion of fault A, the southern portion of fault A, and fault B are 35.0 %, 7.1 %, and 16.7 %, respectively.
Finally, the vent opening maps related to eruptions able to produce small-scale fallout deposits (Fig. S2 in the Supplement) are similar to those presented for lava emission and ballistic projectiles. The maximum probability of vent opening, located at the NW flank of the volcano, is 0.9 % per km2, with a 90 % confidence interval [0.7 %, 1.2 %] per km2. In this case, the probabilities of vent opening close to the northern portion of fault A, the southern part of fault A, and fault B are 35.1 %, 6.5 %, and 16.3 %, respectively. Results are summarized in Table 3.
Table 3Summary of the main features of the vent opening probability maps presented in this work.
3.2.2 Nejapa-Chiltepe volcanic complex
The thematic vent opening maps associated with the NCVC are presented in Fig. 6 (lava flows), Fig. 7 (small-scale PDCs), Fig. S3 in the Supplement (ballistic projectiles), and Fig. S4 in the Supplement (small-scale fallout pyroclastic deposits). Again, each figure presents the mean value of probability per km2, in percentage, including the results of the 5th percentile and the 95th percentile. In contrast, Fig. 5b shows the mean value of a non-thematic vent opening map, i.e., with no differences in the weight of the different vents. In this case, too, the map is equivalent to the vent opening map of ballistic projectiles (Fig. S3 in the Supplement).
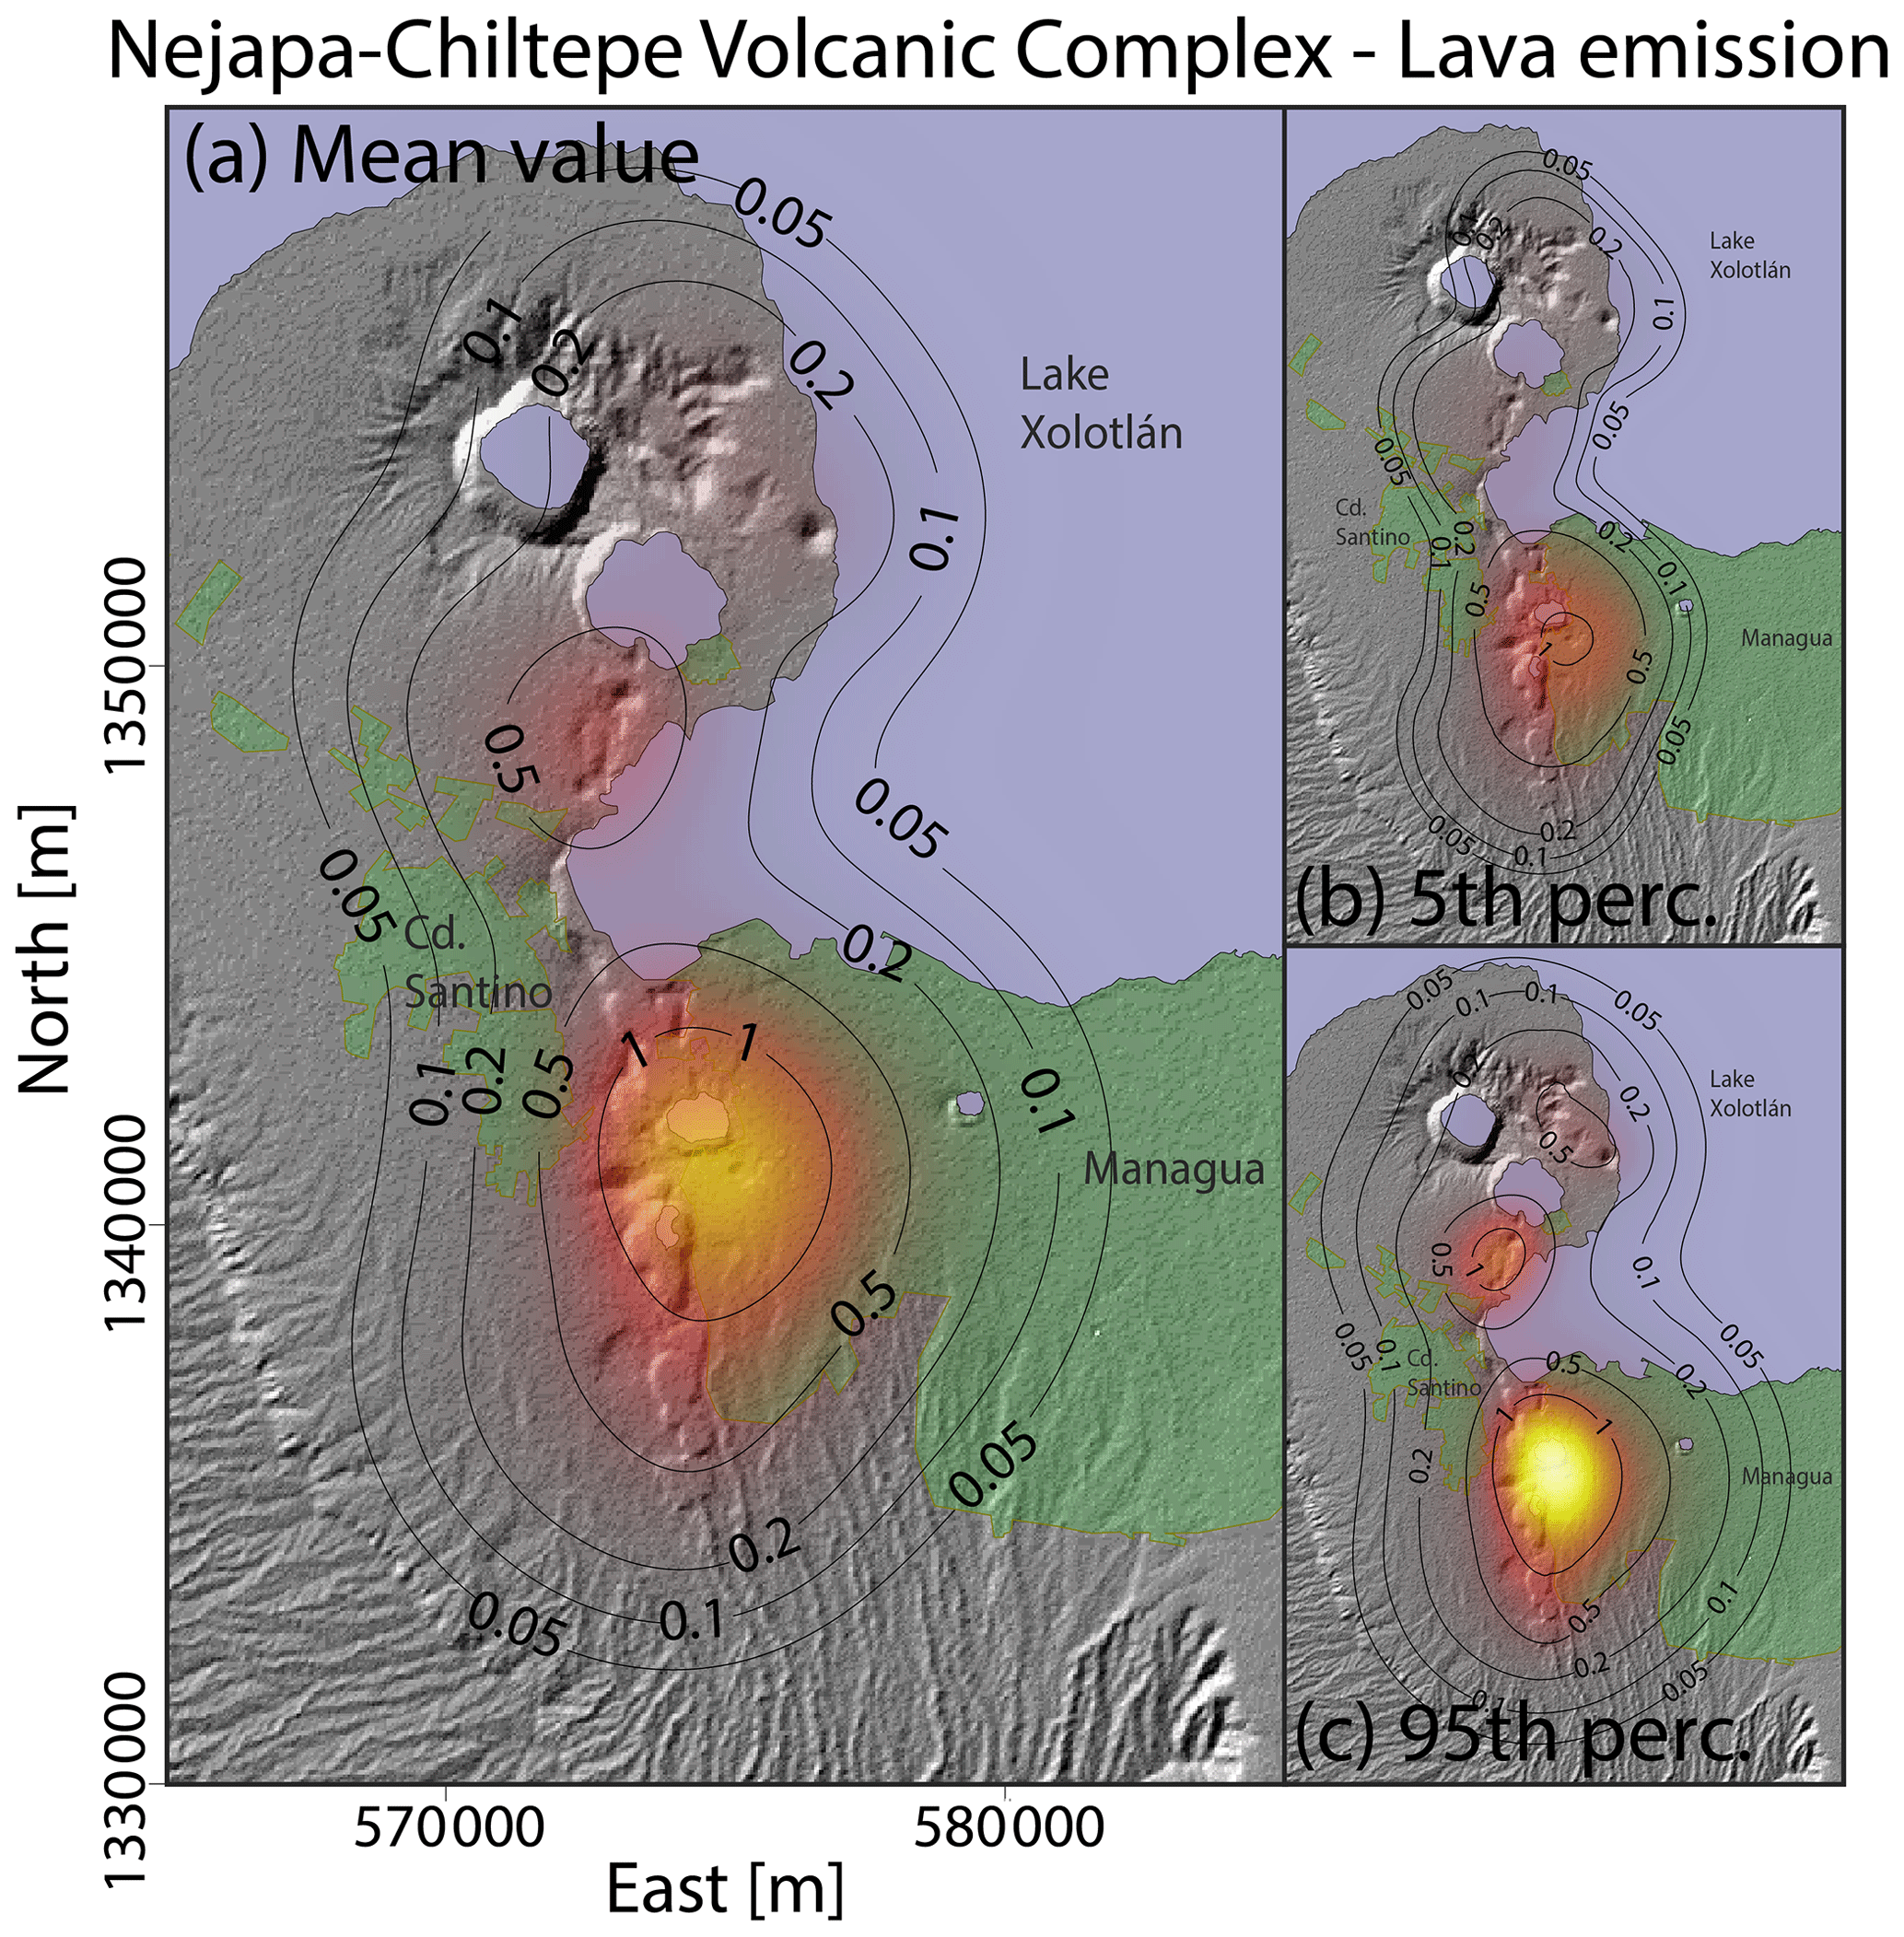
Figure 6Density distribution of the probability of vent opening at the Nejapa-Chiltepe volcanic complex associated with the occurrence of volcanic activity able to produce lava flows. (a) Mean value. (b) 5th percentile. (c) 95th percentile. Results are expressed in percentage per km2.
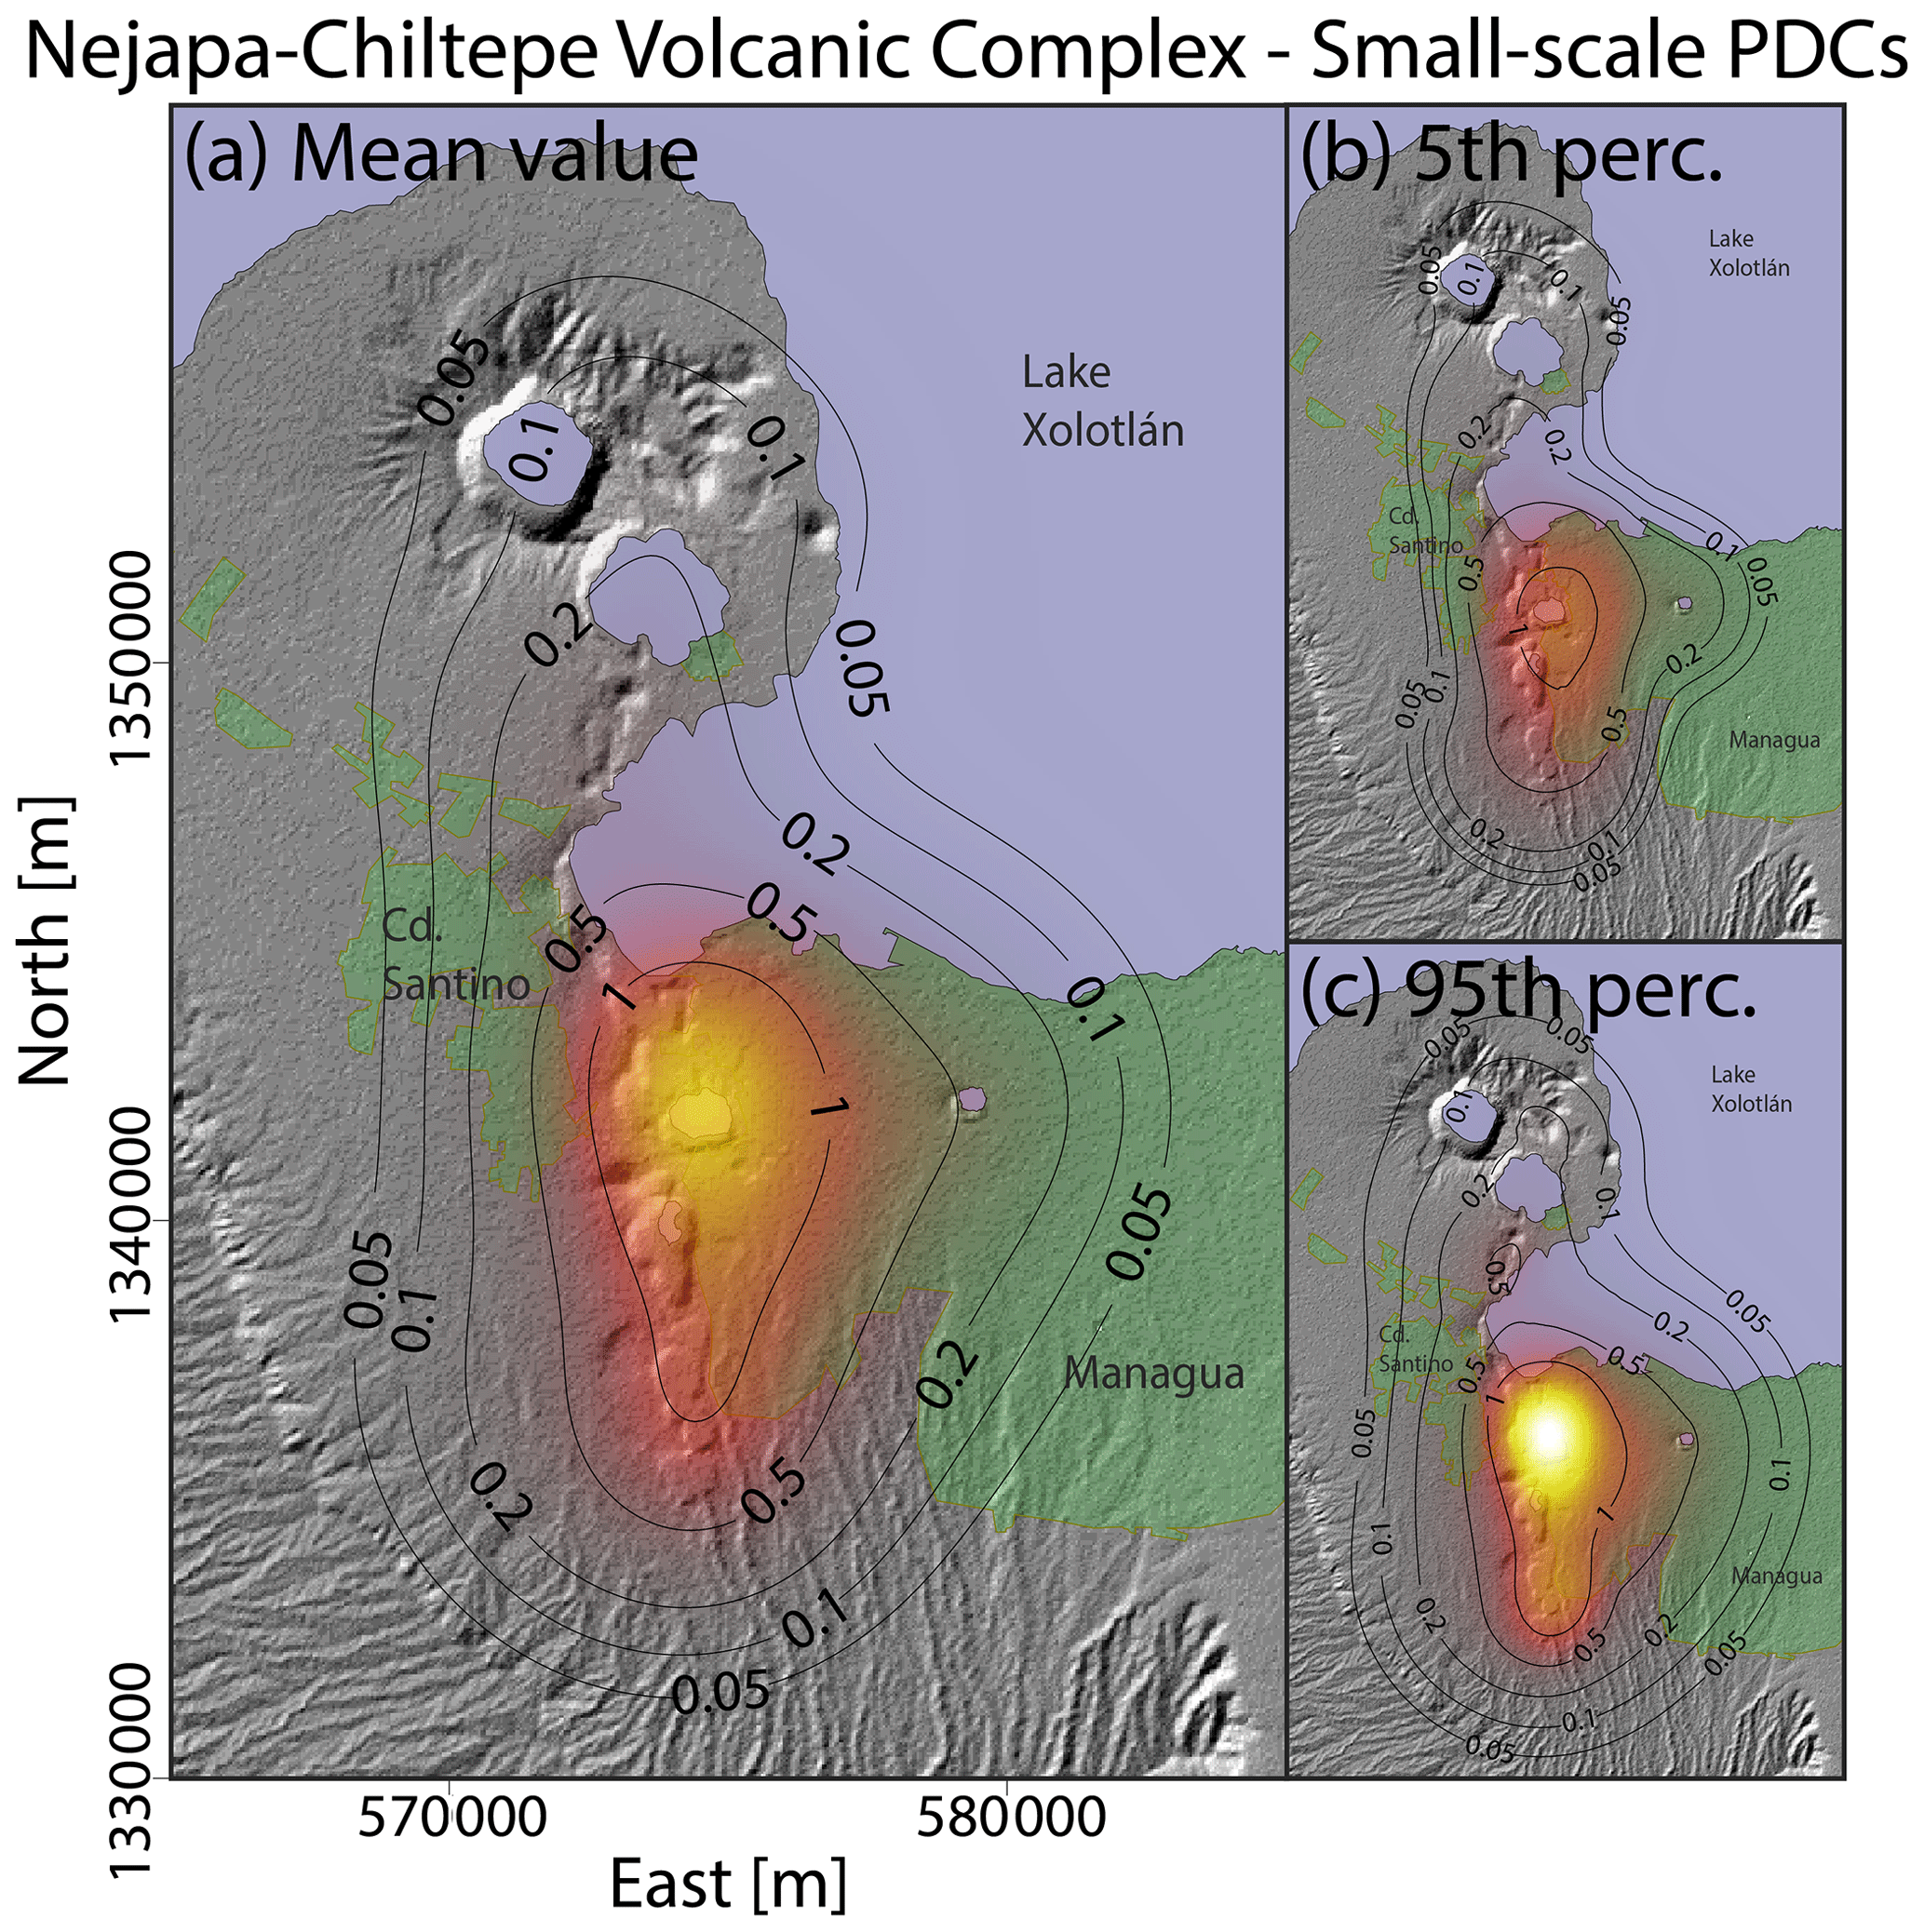
Figure 7Density distribution of the probability of vent opening at the Nejapa-Chiltepe volcanic complex associated with the occurrence of volcanic activity able to produce small-scale pyroclastic density currents. (a) Mean value. (b) 5th percentile. (c) 95th percentile. Results are expressed in percentage per km2.
All the maps show the maximum probability near Asososca maar (vent number 13 in Fig. 1b, d and Table 2) and the only significant differences are related to the N–S extent of the high-probability zone, which tends to be longer in the maps associated with the occurrence of small-scale PDCs (Fig. 7). A secondary peak is observed near Miraflores scoria cone.
In particular, the peak of vent opening probability density in the mean value map related to the emission of lavas is 1.6 % per km2, with a 90 % confidence interval [1.0 %, 2.3 %] per km2 (Fig. 6). The maximum values in the other maps are: 1.7 % per km2 for events able to produce small-scale PDCs, with a 90 % confidence interval [1.2 %, 2.5 %] per km2 (Fig. 7); 1.6 % per km2 for ballistic projectiles, with a 90 % confidence interval [1.1 %, 2.2 %] per km2 (Fig. S3 in the Supplement); and 1.6 % per km2 for eruptions that produce small-scale fallout deposits, with a 90 % confidence interval [1.1 %, 2.3 %] per km2 (Fig. S4 in the Supplement). The resulting probabilities of vent opening inside the limits of Managua are 28.9 %, 35.1 %, 31.2 %, and 32.0 % for events able to produce lava flows, small-scale PDCs, ballistic projectiles, and small-scale fallout deposits, respectively. Also these results are summarized in Table 3.
The previous hazard assessment exercise in Connor et al. (2019) produced spatial density maps that differ from our results. As mentioned above, they did not associate any uncertainty area to past vent locations, they considered slightly fewer events, and they did not use the map of the main fault structures. Moreover, their method is not doubly stochastic; thus, they did not quantify the uncertainty affecting their results. In other words, their spatial map is not a PDF but a spatial density. However, once divided by the number of past vents considered, it becomes a vent opening map. Their maximum probability values are ∼2.8 %–3.2 % per km2 and are shifted ∼1 km towards the west compared to ours. Their region above 1 % probability per km2 has a similar areal extent to ours but is significantly stretched in the N–S direction, due to the use of an elliptical kernel. Further comparison would be needed to fully evaluate the strengths and weaknesses of both approaches.
For both the SSVC and NCVC we extracted 100 sets of 1024 samples of vent position by using the thematic vent opening maps associated with small-scale PDCs. Each set of 1024 vent positions is associated with one of 100 different arrays of the model parameters (p1, p2, d1, d2) adopted in the construction of our thematic vent opening maps. The sampling method is based on a Latin hypercube sampling scheme, generalized with orthogonal arrays to increase the space-filling properties (e.g., Bevilacqua et al., 2019b; Patra et al., 2020). We modified the method to work under the assumption of a non-uniform PDF, as detailed in Appendix A. In particular, our set of PDC initiation points changes for each of the 100 LHS designs explored (Rutarindwa et al., 2019), and we did not rely on a number of fixed grid cells as initiation points (e.g., Sandri et al., 2018; Clarke et al., 2020). The samples are denser where vent opening probability is higher, and their total number is great enough not to leave any region free of testing.
Through the use of the branching energy cone model, implemented in the program ECMapProb and described in Aravena et al. (2020a), we performed these 100×1024 simulations (i.e., 102 400 simulations) for each volcanic complex. Despite the branching energy cone model (Aravena et al., 2020a) being able to consider channelization processes in the construction of PDC invasion maps, the topographies of both volcanic systems do not present significant channelization zones. Under these conditions, the branching energy cone model tends to present similar results to the traditional formulation, although not equal. The reason for running different sets of simulations for each volcanic system is to investigate the propagation of the uncertainty associated with our vent opening maps in the resulting probability maps of PDC inundation. We fixed the other PDC initial conditions. In particular, we assumed Hc=500 m and tan (φ)=0.25 (i.e., ∼14∘). These input conditions are consistent with the runout distances observed in the small phreatomagmatic deposits recognized in the field (i.e., on the order of 2 km), e.g., Loma Caldera in the SSVC, and are assumed to be representative of the studied PDCs. In this study we focus on gravity-driven PDCs, but we remark that small-scale phreatomagmatic eruptions may also produce dominantly inertial dilute fully turbulent density currents, whose dynamics is better replicated by the so-called box-model approach (Huppert and Simpson, 1980). We decided not to use variable input conditions for initial PDC characteristics, so our hazard assessment is only valid in this specific scenario of PDC size and friction angle (for examples of friction angle variability in studies based on the energy cone model, see Hayashi and Self, 1992; Sheridan and Macías, 1995; Tierz et al., 2016b; Sandri et al., 2018). A more complete PDC hazard assessment considering variable size and friction properties would require additional information to properly calibrate these input parameters (e.g., Cioni et al., 2020) and/or complementary data coming from analogue volcanoes (e.g., Tierz et al., 2016a; Clarke et al., 2020). Further analysis could investigate the sensibility of numerical results on these parameters, increase the number of inputs that are sampled in the LHS scheme, and consider correlations between PDC size and friction properties, but this is beyond the purpose of this study (e.g., Spiller et al., 2014; Ogburn et al., 2016; Ogburn and Calder, 2017; Tierz et al., 2018; Rutarindwa et al., 2019; Patra et al., 2020).
Figures 8 and 9 present the invasion probability of small-scale PDCs at the SSVC and NCVC, derived from the systematic application of the branching energy cone model (Aravena et al., 2020a) and the adoption of the thematic vent opening maps shown in Figs. 4 and 7. Numerical simulations were performed using a DEM at 30 m resolution. PDC invasion probabilities are described in percentage, including the mean value at each pixel of the map, the 5th percentile, and the 95th percentile. These results derive from the coupled effect of the vent opening probability distribution controlled by structures and past vents, and the transport dynamics of PDCs controlled by volcano topography and the characteristics of the branching energy cone model.
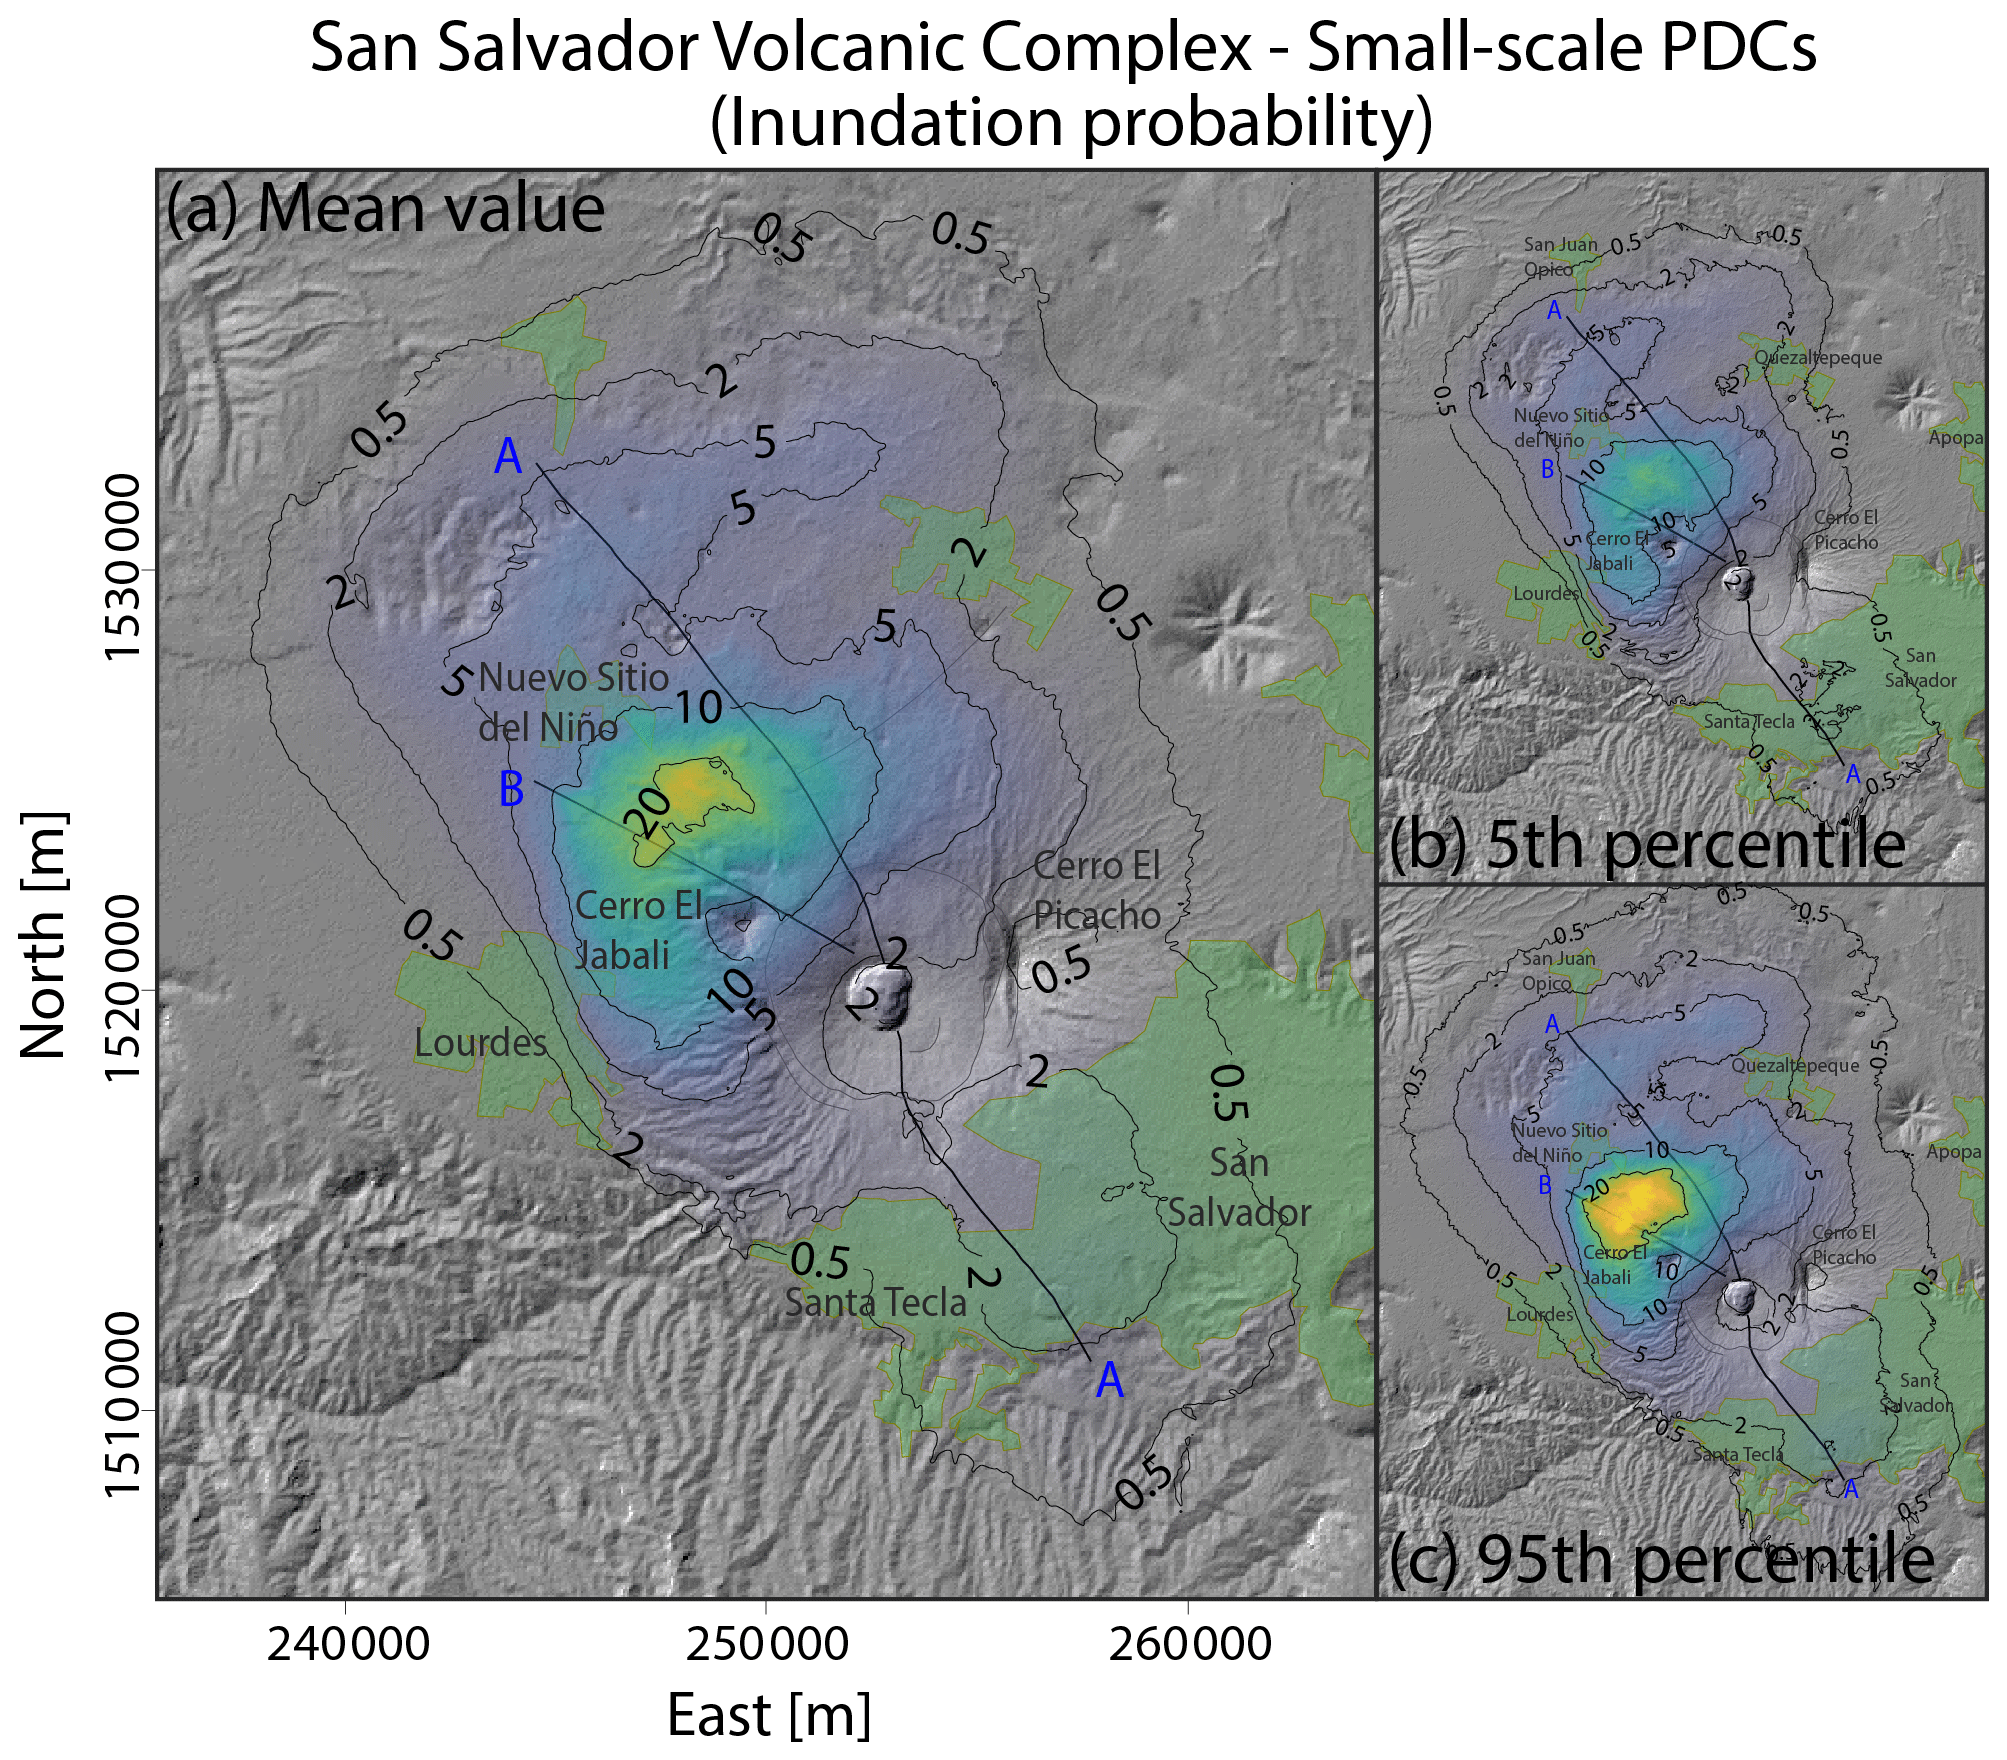
Figure 8Inundation probability of small-scale PDC at the San Salvador volcanic complex derived from the systematic application of the branching energy cone model (Aravena et al., 2020a) and the vent opening probability map shown in Fig. 4. (a) Mean value. (b) 5th percentile. (c) 95th percentile. Inundation probability is expressed in percentage. These probability maps are conditioned on the occurrence of an eruption able to produce small-scale PDCs.
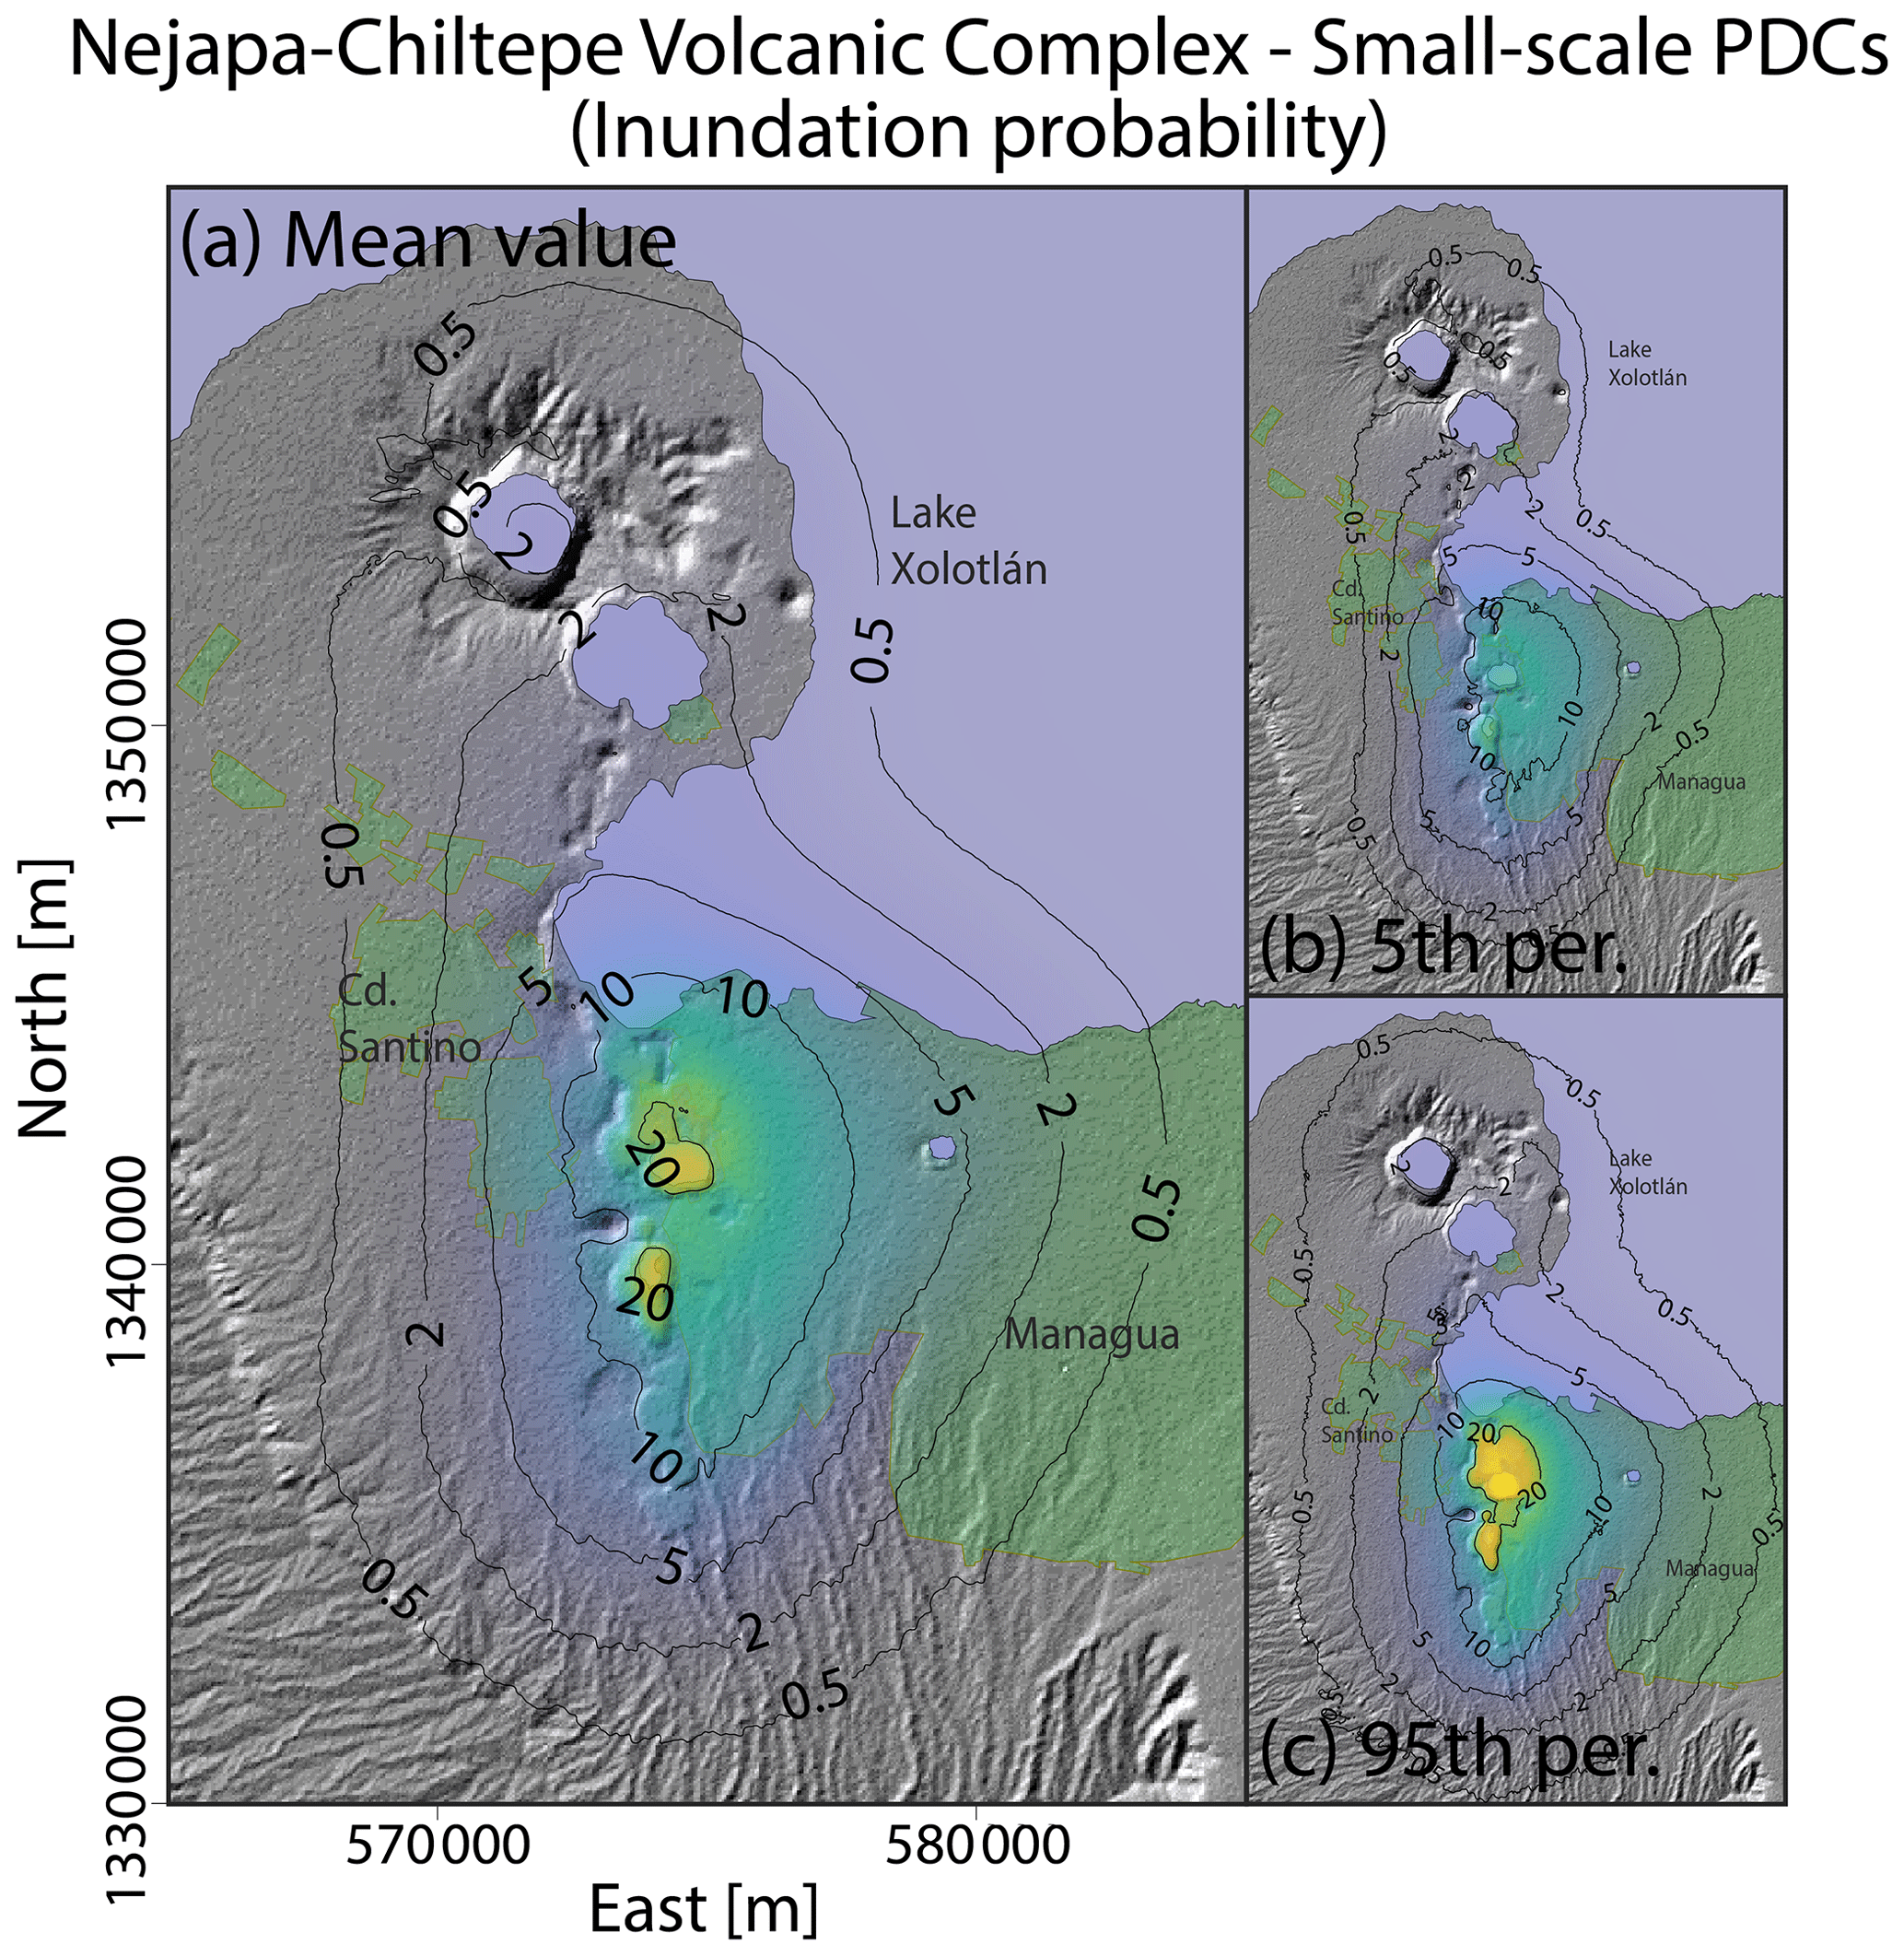
Figure 9Inundation probability of small-scale PDC at the Nejapa-Chiltepe volcanic complex derived from the systematic application of the branching energy cone model (Aravena et al., 2020a) and the vent opening probability map shown in Fig. 7. (a) Mean value. (b) 5th percentile. (c) 95th percentile. Inundation probability is expressed in percentage. These probability maps are conditioned on the occurrence of an eruption able to produce small-scale PDCs.
In the case of the SSVC, results show a zone of high PDC invasion probability located northwest of San Salvador volcano, with a maximum value of 23 % with a 90 % confidence interval [19 %, 29 %] and high invasion probabilities near the cities of Nuevo Sitio del Niño and Lourdes (Fig. 8). The modeled invasion probability at the SE flank of San Salvador volcano and in the city of San Salvador tends to be low, where a significant effect is exerted by the topographic barrier of Cerro El Picacho as well as of the entire central edifice of the SSVC (Fig. 8). This is because vent opening probabilities are high on the NW flank of the volcano and on the surrounding plain to the north–northwest of the edifice, while significantly lower probabilities of vent opening were computed on the E flank of the volcano (Fig. 8). The highest PDC invasion probability calculated at the metropolitan area of San Salvador, ∼2 %–3 %, is located in its western sector, i.e., between the western portion of San Salvador and Santa Tecla. These values might be explained by the peak in vent opening probability shown in Fig. 4 and/or by the high slope of the main edifice and the absence of significant topographic barriers on the southern sector of the central edifice.
In the case of the NCVC, numerical results indicate the highest invasion probabilities along the Nejapa fault near the western border of and within Managua city. The maximum values of invasion probability, i.e., 22 % and 23 % in the mean value map, are associated with the low-elevation areas of Asososca maar and Nejapa maar, respectively (Fig. 9). Non-negligible invasion probabilities have been calculated at the eastern portion of Ciudad Sandino as well, while the invasion probability of small-scale PDCs at the northern part of the studied zone, i.e., near Apoyeque volcano, tends to be low (Fig. 9).

Figure 10Difference between the probability maps of small-scale PDC inundation presented in Figs. 8 and 9 (mean values), which are derived from the use of thematic vent opening maps, and the equivalent results that would be derived from the application of non-thematic vent opening maps. The inundation probability difference is expressed in percentage. These maps highlight the relevance of using thematic vent opening maps in the assessment of volcanic hazard at volcanoes where eruptive style may significantly change with vent location. (a) San Salvador volcanic complex. (b) Nejapa-Chiltepe volcanic complex.
Finally, for the two volcanic complexes addressed here, Fig. 10 presents the difference between the mean PDC invasion probability percentages obtained by adopting thematic vent opening maps (i.e., Figs. 8a and 9a) and the equivalent results that would be derived from the application of non-thematic vent opening maps, i.e., by using the maps displayed in Fig. 5. These results show clearly the relevance of using thematic vent opening maps in the assessment of hazard at volcanoes where eruptive style may significantly change with vent location. Positive values (i.e., red zones) represent the portions of the map where the application of thematic vent opening maps implies an increase in the calculated PDC invasion probability, while negative values (i.e., blue zones) are the sectors where the use of thematic vent opening maps instead of the traditional ones is manifested in a reduction of the computed PDC invasion probability. The SSVC exhibits differences ranging from −7.2 %, on the N–NNE flank of Boquerón volcano (BV), south of Quezaltepeque, to +5.8 % on the NW flank of BV, near Lourdes (Fig. 10a). These results involve dramatic modifications in the computed PDC invasion probability. In fact, at the N–NNE flank of BV, the PDC invasion probability is halved when thematic vent opening maps are considered, while probability increases by 70 % in some portions of the NW flank of BV. On the other hand, the computed differences for the NCVC are moderate and vary from −2.9 % in the northern portion of the NCVC to +3.2 % in the southern portion of this volcanic field, including a significant area that belongs to the city of Managua. In any case, in relative terms the differences between the results derived from the application of thematic and non-thematic maps are low both in Managua and in its surroundings.
Several probabilistic assessments of vent opening at different volcanoes have been presented during the last decade (e.g., Marzocchi and Bebbington, 2012; Connor et al., 2015; Poland and Anderson, 2020), improving the methodologies implemented to construct these maps and sensibly increasing the number of volcanic systems for which a probabilistic assessment of vent opening is available. For example, the inclusion of structured expert judgment procedures to constrain the input parameters of the models adopted to construct these maps (Chapman et al., 2012; Bevilacqua et al., 2015; Tadini et al., 2017a; Bebbington et al., 2018) and their coupling with models aimed at describing the dispersal of volcanic products (e.g., Del Negro et al., 2013; Neri et al., 2015; Thompson et al., 2015; Tierz et al., 2018; Gallant et al., 2018; Hyman et al., 2019; Rutarindwa et al., 2019) are remarkable. A growing effort is aimed at the production of short-term vent opening maps that can modify the long-term estimates after plugging in the monitoring information that progressively evolves during volcanic unrest (e.g., Sandri et al., 2012, 2020; Chaussard and Amelung, 2012; Selva et al., 2014; Bevilacqua et al., 2019c, 2020a, b; Patra et al., 2019).
In this context, we adopted a novel approach where we considered different volcanic hazardous phenomena separately (i.e., emission of lava flows, small-scale PDCs, ballistic projectiles, and small-scale pyroclastic fallout). This led to the construction of thematic vent opening maps that allow us to assess the hazard that different volcanic phenomena involve separately. We remark that previous studies already produced vent opening maps devoted to specific types of eruptions (e.g., Plinian and sub-Plinian eruptions in Tadini et al., 2017b; or pumice-cone-forming eruptions in Clarke et al., 2020), to eruptions inside selected sub-regions (Bevilacqua et al., 2017b), or to a suite of pre-imposed eruptive scenarios (Ang et al., 2020). It is worth highlighting that the approach adopted here, where the resulting vent opening maps are conditioned on the occurrence of a specific volcanic phenomenon, is opposite from the strategy adopted in a series of studies of hazard assessment (e.g., Neri et al., 2015; Thompson et al., 2015; Bevilacqua et al., 2017a; Tierz et al., 2020), where the probability of having a specific hazardous phenomenon or a specific eruption size is conditioned on vent location. Although both alternatives can be useful for hazard assessment, their suitability is controlled by the expected application and the two approaches are linked through the application of Bayes' theorem. Our approach seems to be more appropriate for the construction of thematic hazard maps for a specific volcanic phenomenon and eruption size, while the opposite strategy, possibly coupled with event trees, seems to better suit the formulation of hazard maps that combine multiple phenomena and/or multiple eruption sizes.
In order to apply our approach, in addition to the mapped faults and the record of past eruptions, we considered the eruption style and the likely eruptive phenomena that the past eruptions could have produced on the basis of deposits and morphological features of volcanic edifices. This is justified by the suggested relation of vent position and eruption style and intensity, which has been observed at different volcanic fields (e.g., Andronico et al., 2005; Coppola et al., 2009; Sigmundsson et al., 2010). In particular, for the SSVC, small-scale PDCs have been preferentially produced by vents located along the N65W-trending fault B (Fig. 1a and Table 1), while lava flows have been commonly observed in vents located along the N40W-trending fault A (Fig. 1a and Table 1). Apparently, no small-scale PDCs have been issued in the past from the central vent of the present Boquerón volcano. On the other hand, at the NCVC, maars and tuff rings have been mainly produced in events whose vent was located near the Nejapa fault, while scoria cones are predominant in the peripheral zones. Additional evidence is also reported for the possible presence of hydromagmatic eruptive centers located in the southwestern corner of Xolotlán Lake.
As expected, the integration of this information in the construction of thematic vent opening maps is manifested in the resulting probability distributions (Figs. 3, 4, 6, 7 and S1–S4 in the Supplement), which in some cases present significant differences as a function of the considered hazardous phenomenon. We also estimated how these differences are sensitive to some of the main sources of uncertainty of our model. In fact, the 90 % confidence interval of the vent opening probability per km2 can strongly enhance the differences between thematic maps as can be observed, for example, in Figs. 3c and 4c.
The design and implementation of mitigation strategies of volcanic risk are deeply associated with the characteristics of the volcanic process under consideration and vent position. In this sense, the importance of using thematic maps when the studied volcanic complex shows a vent position-controlled eruption style has been illustrated by modeling the propagation dynamics of small-scale PDCs. Our results, which were obtained by adopting the branching energy cone model (Aravena et al., 2020a), show the coupled effect of vent opening maps and volcano topography in determining the PDC invasion hazard. Results stress that the adoption of thematic vent opening maps is able to produce significant effects in the construction of hazard maps, which are particularly relevant for the SSVC.
Finally, an important aspect in our analysis is that we did not count the polygenetic vents multiple times (San Salvador–Boquerón volcano in the SSVC and Apoyeque volcano in the NCVC), i.e., every vent was weighted only by considering its past eruptive phenomena and not by the number of eruptions. Similarly, in Connor et al. (2019), Apoyeque volcano was counted only once in the production of their spatial density maps. In contrast, a straightforward event-counting approach could lead to different results and this fact deserves some additional comments.
In the case of the SSVC, we counted nine explosive events during the last 36 ka: six eruptions during Stage II (including the collapse of SSV, which marks the limit between Stages I and II) and three during Stage III (Fig. 1c). Moreover, in Stage II at least 14 lava flows were issued from SSV (Fairbrothers et al., 1978). In the NCVC we counted three explosive eruptions from Apoyeque and no lava flows during the last 30 ka (Fig. 1d). In our results, we did not follow an event-counting approach for the reasons explained below.
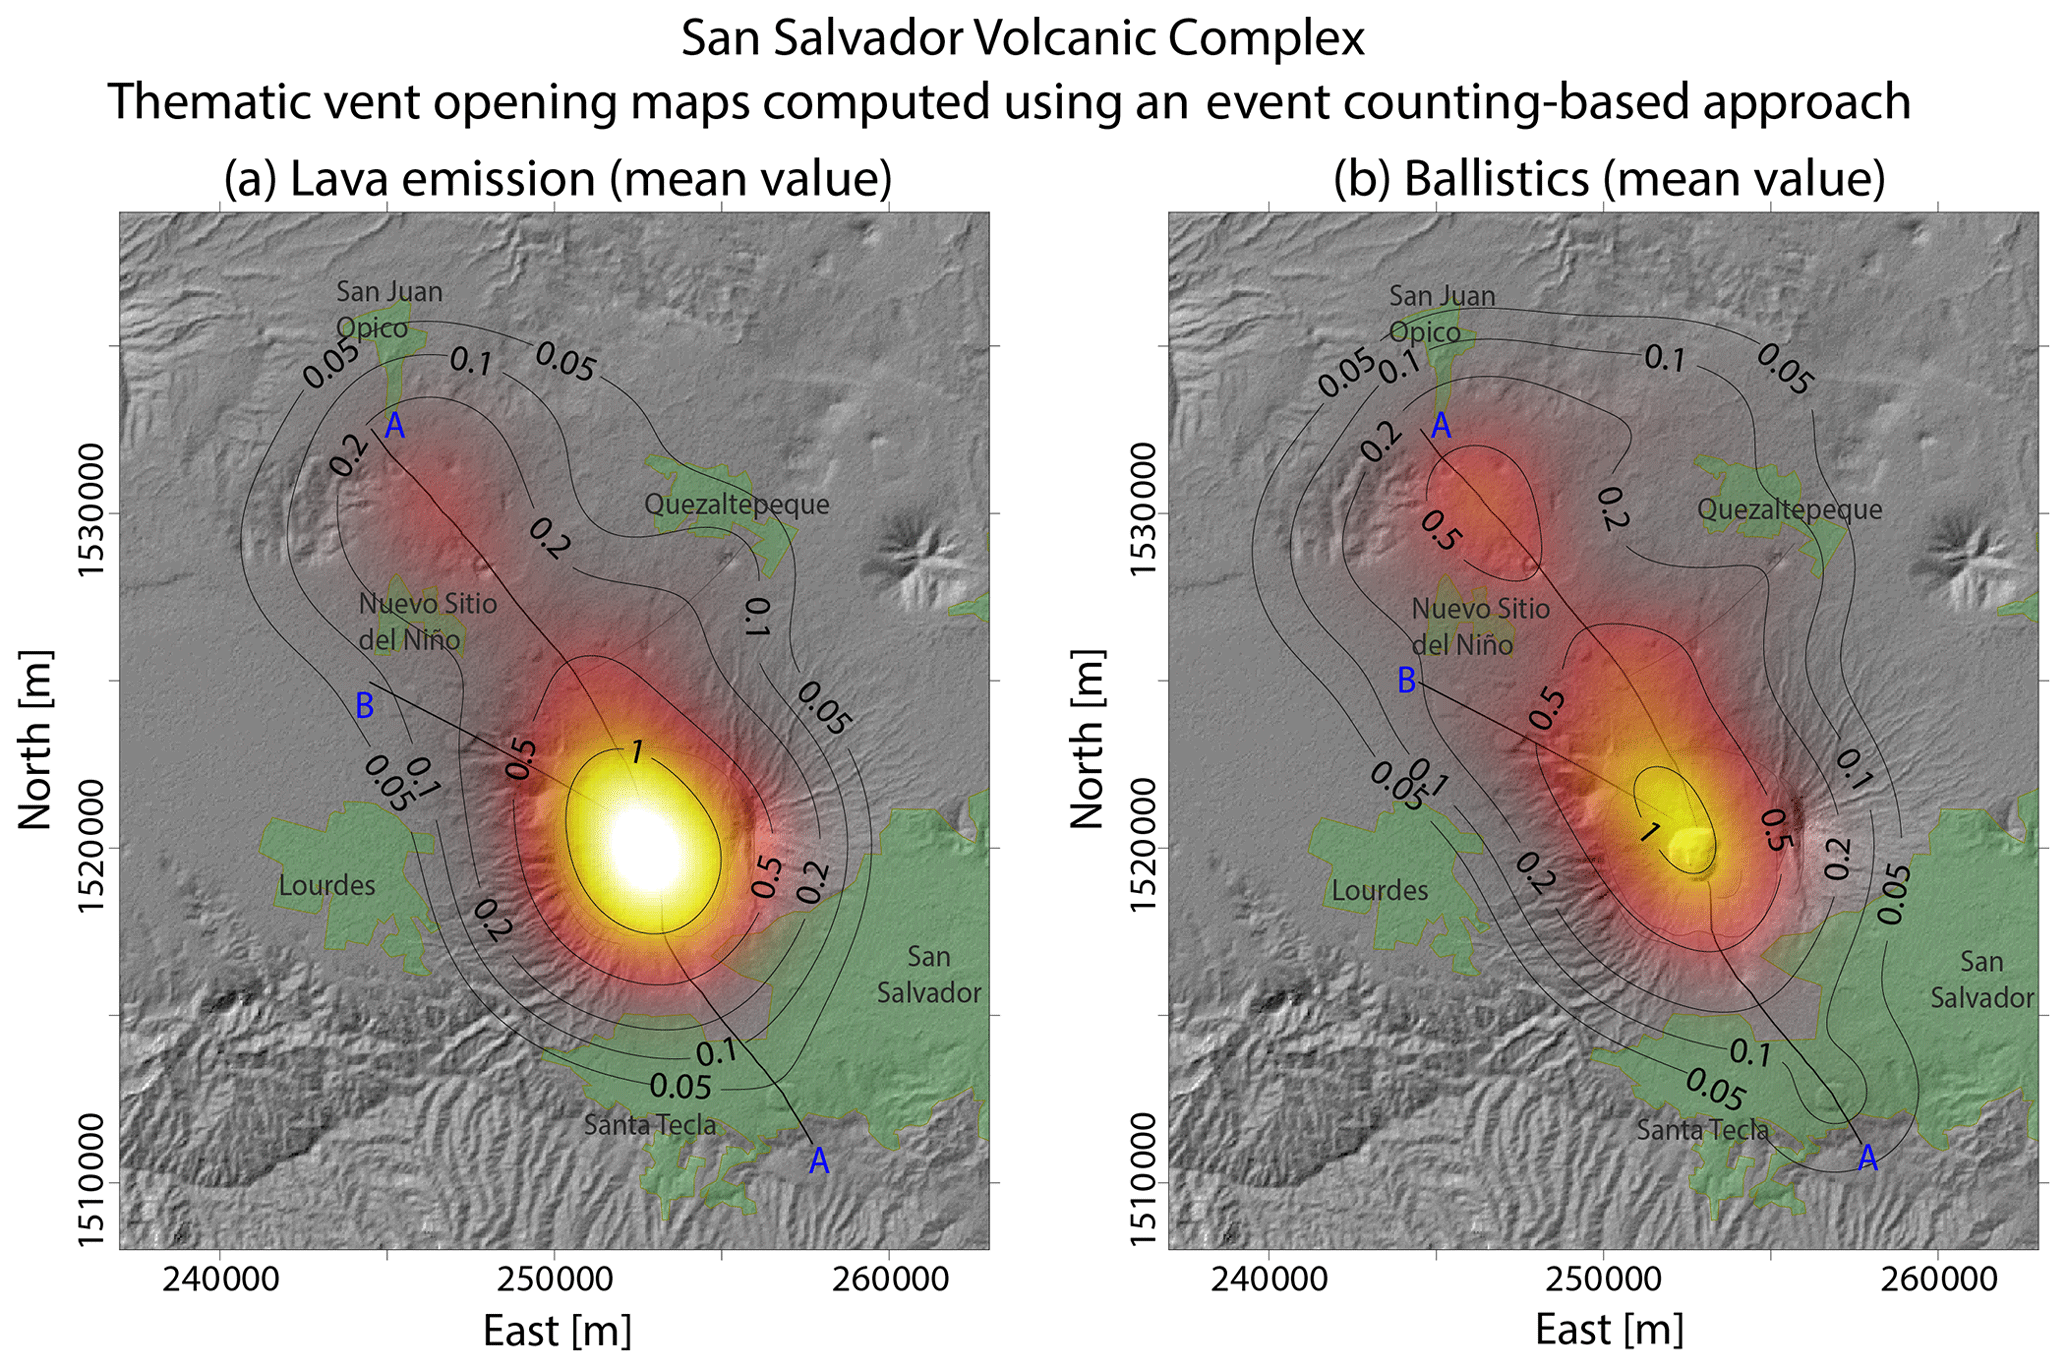
Figure 11Density distributions of the probability of vent opening at the San Salvador volcanic complex (mean value) computed using an event-counting approach (i.e., the polygenetic central vent presents a weight higher than monogenetic vents). These maps, which are thematic, are associated with the occurrence of volcanic activity able to produce lavas flows (a) and ballistic fragments (b). Results are expressed in percentage per km2.
Firstly, an event-counting approach would rely on the assumption that the volcanic system is stationary over the time period considered in the statistics. In contrast, for example, the SSVC apparently shifted from a central volcanism to the development of the monogenetic field on the flanks of BV and in the plain nearby 3 ka ago. Most of the 28 known monogenetic events occurred after 3 ka BP, while only three of the BV eruptions are associated with this period. In addition, how much the Central Crater should count depends on the time interval considered. In a similar situation, Bevilacqua et al. (2017a) treated the uncertainty related to a shift of volcanic activity from the Long Valley Caldera to the Mono–Inyo chain by weighting the events in the older site from 0 % to 50 % of the more recent events. Bevilacqua et al. (2015) weighted differently the vents in the three past epochs of the Campi Flegrei post-collapse activity after an expert elicitation. Again, the older vents tended to weigh less than the more recent vents.
Secondly, in the SSVC and NCVC case studies, the specific knowledge of many eruptive centers is variable and sometimes poor, under-recording is likely, and a robust event counting is not possible. However, the possible errors in event counting are not the same in the various thematic maps. For example, in the case of small-scale PDCs at the SSVC, the capability of producing low energy events in the central edifice should not be substantially different from monogenetic vents. In contrast, BV is a stratovolcano built after a large number of lava flows, while monogenetic vents typically produce a single flow.
Figure 11 shows two illustrative examples of modified vent opening maps of the SSVC after following an event-counting approach. We only present the results of the SSVC because the potential effect of this modification would be minor in the NCVC due to the relatively small number of known polygenetic events. In particular, Fig. 11a shows a vent opening map for lava flow emission that counts the central crater 16.25 times, i.e., 14 times for the past lava flows in Stage II plus 9×0.25 times for the past explosive eruptions during the last 36 ka. Figure 11b shows a vent opening map for ballistics that counts the central crater nine times, i.e., the past explosive eruptions. Figures S5 and S6 in the Supplement show the 5th and the 95th percentile values of these maps. The significant concentration of vent opening probability towards the polygenetic center is evident in these figures. Conversely, in terms of hazard assessment, our choice (i.e., with no consideration of a higher weight for polygenetic vents) spreads the vent opening probability further from the central volcano and potentially closer to highly inhabited areas. In summary, to improve this aspect of the analysis, separate maps for the central volcano and the surrounding volcanic field could be produced and their differential weight better constrained after additional research.
In this study, we have presented vent opening probability maps for two Central American volcanic systems: the San Salvador volcanic complex and Nejapa-Chiltepe volcanic complex. Like many other volcanoes in the world, these volcanic fields present some features that make the availability of this tool critical for the design and implementation of volcanic risk mitigation procedures: (1) they are next to highly inhabited cities, i.e., San Salvador (2.4 million people) and Managua (1.4 million people), respectively; (2) they present a significant variability in vent position; and (3) they produced a number of different types of eruption style.
We implemented quantitative vent opening probability estimates that are based on main fault structures and past vent positions, and include uncertainty quantification and the type of activity of the documented eruptions. We produced different thematic maps related to the emission of lava, small-scale pyroclastic density currents, ballistic projectiles, and small-scale fallout deposits.
The main findings derived from the new vent opening maps are
- a.
At the SSVC, the maps show their maximum values on the NW flank of San Salvador volcano and in the northern region of this volcanic complex. In particular, results indicate that the zone of high probability of vent opening (>0.5 % mean probability per km2) for events able to produce small-scale PDCs follows the N65W-trending fault B, while the high-probability zone related to lava emission, ballistic projectiles, and the production of small-volume fallout deposits follows the N40W-trending fault A. This shows that the separate consideration of different hazardous phenomena is able to produce relevant differences in vent opening probability maps.
- b.
At the NCVC, results show that the maximum vent opening probability is located near Asososca maar. The only differences between the different thematic maps is the N–S extent of the high-probability zone, which tends to be larger in the maps associated with small-scale PDCs than in the other thematic maps. Importantly, a significant portion of the vent opening probability distribution is located inside the limits of Managua City, which implies major challenges in managing the volcanic risk associated with the NCVC.
We remark that we did not consider the occurrence of large volume pyroclastic deposits derived from sub-Plinian or Plinian eruptions, e.g., large-volume fallout or PDC deposits. Indeed, in the past they were only emitted from the polygenetic central vents of both volcanic complexes, i.e., San Salvador and Apoyeque, respectively. Thus in these cases the construction of vent opening probability maps is not meaningful at the scale of the other thematic maps, i.e., tens of kilometers.
Finally, we have adopted the branching energy cone model described in Aravena et al. (2020a) to illustrate the use of the thematic vent opening maps presented here. In particular, we performed a Monte Carlo simulation of ∼105 small-scale PDCs representative of those derived in the past from phreatomagmatic activity or low-intensity magmatic volcanism. We varied the vent location following a doubly stochastic approach that enabled us to estimate the effects of the uncertainty affecting the vent opening PDF. We did not change the size and friction properties of the flow to better analyze the effects of the different vent opening maps.
Results of this new hazard assessment show that
- a.
At the SSVC, a significant effect is exerted by volcanic topography. The highest values of invasion probability are observed northwest of San Salvador volcano, with high invasion probabilities (5 %–10 % in the mean value map) near the cities of Nuevo Sitio del Niño and Lourdes. Invasion probability in the city of San Salvador tends to be relatively small, with the highest values (2 %–3 % in the mean value map) observed at the western sector of the urbanized zone (i.e., the western zone of San Salvador and Santa Tecla). The use of the thematic map increased the small-PDC invasion hazard estimates on the western side of BV, while it decreased the same hazard on the northern side of the volcano.
- b.
At the NCVC, the high vent opening probability inside and near the limits of Managua produces high small-PDC invasion probabilities inside this city (∼10 %–20 % in the mean value map). High invasion probabilities (∼5 %–10 % in the mean value map) are computed at the eastern portion of Ciudad Sandino as well. The use of the thematic map increased the small-PDC invasion hazard estimates in the southern part of NML, while it decreased the same hazard in the northern part.
- c.
In both case studies, the examination of the 5th and 95th percentile maps show that hazard values can change by ca. ±30 %–50 % because of the uncertainty sources affecting the vent opening PDF. The effects of using a thematic map in the small-scale PDC hazard estimates are evident in both the SSVC and NCVC but significantly stronger in the first case. This is enhanced by considering the uncertainty range.
The findings presented in this paper represent relevant information for the management of volcanic risk in these volcanic complexes and complement previous work focused on the hazard assessment of volcanic activity in the central vents (e.g., Avellán et al., 2012; Ferrés et al., 2013). Coupling of thematic vent opening probability maps with numerical models able to describe other eruptive phenomena (e.g., lava flows and ballistic projectiles) would provide further relevant data for the assessment of volcanic hazard, as shown here for PDCs.
In the following we review the details of Model 1 and Model 2, and the non-uniform Latin hypercube sampling scheme adopted in this work.
A1 Model 1: Kernel-based Bayesian update of fault map
Model 1 merges the faults and past vent locations following a Bayesian approach. This model is also detailed in Bevilacqua et al. (2017a) but differs in the method used to select the distance parameter d1. We assume that the mapped faults provide information in the forecast of future vent locations (e.g., Felpeto et al., 2007; Cappello et al., 2012, 2015). In fact, we expect the new vents to more likely occur near mapped faults that previously interacted with rising magma (Martin et al., 2004; Jaquet et al., 2012). The key idea in Model 1 is that the vent opening map depends on an additional spatial parameter ζ=(ζ1, ζ2) representing the surface projection of a fault interacting with a future potential rising dike. We call z the prior PDF of ζ, i.e., the prior fault map. Namely, z=z1 is the distribution of mapped faults and z=z2 is the distribution of unknown faults. In particular, z1 is uniform inside a 100 m buffer along the fault outcrop, which does not sensibly affect the results because it is an order of magnitude lower than d1. Considering that linear averaging is not commutative with the Bayes' theorem, we average the posterior probability maps because, in this way, the linear weights directly impact the final results and they are not altered by the multiplicative step.
For each past vent location (xi, yi), we use Bayes' theorem to calculate the posterior probability density values z(ζ1, ζ2|xi, yi) up to a multiplicative normalization constant C detailed below. This represents the fault locations that may have interacted with the rise of magma that led to the past vent (xi, yi). We integrate past vent locations (i=1, … ,N) on their uncertainty areas (Di) according to the expression:
where is a Gaussian likelihood defined below (Eq. A2). We calculate different posterior probabilities, one for each past vent considered (i=1, …, N), and we define the global posterior of ζ as the weighted average of them with weights C=wi, where wi is related to the specified hazardous phenomenon (see Tables 1 and 2). Different hazards will lead to different posterior maps.
Then, conditioned on the value of parameter ζ, we define the likelihood for a vent location x as a symmetrical, two-dimensional Gaussian function of mean ζ and covariance matrix σ2
This kernel function creates a link between the past vents and the portions of the faults next to them, i.e., ζ. The value of the standard deviation is , where d1 is the average distance between sub-parallel regional faults. In other words, we assume that, on average, about 95 % of the vents that are related to a fault will open closer than the next sub-parallel fault. This is a different strategy from that adopted by Bevilacqua et al. (2017a), where the distance bound was obtained through a geometric argument on the maximum depth of the fault–dike interaction and the dip angle of the faults.
Finally, we calculate the vent opening map applying again the kernel function to the global posterior probability distribution of ζ. So, the kernel function creates a link between ζ and the new vents. Thus, the vent opening probability density g according to Model 1 is defined by
where zj with j=1, 2 are the two posterior probability density functions of ζ, m1=p2, and .
A2 Model 2: Kernel density estimator
Model 2 is a Gaussian kernel density estimation applied on a uniform distribution within the uncertainty areas enclosing the past vents (Bebbington and Cronin, 2011; Connor et al., 2012; Bevilacqua et al., 2015). This method is detailed in Tadini et al. (2017b), but differs in the selection of the distance parameter d2. The kernel function describes the expected distance between past and future eruptive vents. The kernel function can be any positive function K that integrates to 1 (Weller et al., 2006) and, in general, given a finite sample xi=(xi, yi), a kernel density estimator can be defined as follows:
where h is the bandwidth and wi are the vent weights related to the specified hazardous phenomenon. We assume K is equal to a two-dimensional radially symmetric Gaussian function and h is the standard deviation parameter. In this study we consider , where d2 is the average of the distance of the kth nearest neighbor of each past vent, formally represented by a Rayleigh distribution. This is a different procedure from that adopted by Tadini et al. (2017b), where k=1 and h=d2.
A3 Non-uniform Latin hypercube sampling
Our sampling technique of the input variables in the PDC simulations is based on the Latin hypercube sampling (LHS) idea and, in particular, on the improved space-filling properties of the orthogonal array-based Latin hypercubes.
The LHS is a well-established procedure for defining pseudo-random designs of samples with good properties with respect to the uniform probability distribution on an hypercube [0, 1]d. In particular, if compared to a random sampling, LHS: (1) enhances the capability to fill the space, (2) avoids the overlapping of point locations projections, and (3) reduces the dependence on dimensionality (Stein, 1987; McKay et al., 2000; Ranjan and Spencer, 2014).
Once the desired number of samples N is selected, [0, 1] is divided in N equal bins and then each bin will contain one and only one projection of the samples over every coordinate. There is a large number of possible designs, i.e., the number of permutations of the N bins in the d projections. If these permutations are randomly sampled, clusters of points or regions of void space may be observed. For this reason, we base our design on orthogonal arrays, which constrain the samples to fill the space with respect to a regular grid at a coarser scale than the LHS bins (Owen, 1992; Tang, 1993; Ai et al., 2016; Patra et al., 2018, 2020; Bevilacqua et al., 2019b).
In this study we further modified a two-dimensional LHS to work under the assumption of a non-uniform PDF, i.e., the vent opening probability map f(⋅). This approach was also implemented in Bevilacqua et al. (2019a). In particular, for any given y we defined the conditional PDF along the x direction:
where C is the appropriate normalizing constant.
Then we calculated the marginal PDF along the y direction:
where a(y) and b(y) are the limits of the mapping region along the x direction for any given y.
For any value (i, j) in [0, 1]2 we define the transformation:
where Φ(⋅|y) and FX(⋅) are the cumulative functions of φ(⋅|y) and fX(⋅), respectively.
Thus, once a uniformly distributed LHS is sampled, we apply the transformation H(⋅) to obtain a set of input variables that are distributed according to the vent opening map f(⋅) but preserve the good space-filling properties of the original LHS.
The program ECMapProb used to apply the branching energy cone model is available at https://doi.org/10.5281/zenodo.3755086 (Aravena, 2020). The vent opening maps and derived data are also available upon request.
The supplement related to this article is available online at: https://doi.org/10.5194/nhess-21-1639-2021-supplement.
All co-authors contributed to the compilation and critical revision of volcanological data of the SSVC and NCVC. AB, RC, and AN contributed to the choice of the different strategies and assumptions adopted to construct vent opening probability maps. AB constructed the presented vent opening probability maps. AA performed the branching energy cone simulations and then processed the numerical results. AB, AA, and RC prepared the manuscript with contributions from all co-authors.
The authors declare that they have no conflict of interest.
The work is dedicated to the memory of Eduardo Gutierrez, who suddenly passed away before having the opportunity to receive the final version of the manuscript. We are all deeply indebted to him; without his enthusiasm and continuous stimulus to initiate and enforce our collaboration, we would have never obtained these results. We lost a precious teammate and a good friend. Rest in peace, Eduardo!
This research was supported by the RIESCA project, funded by the Italian Agency for Development Cooperation and aimed at promoting applied training in risk scenarios in Central America. The constant coordination and support to the project by Giuseppe Giunta is greatly acknowledged.
Alvaro Aravena was also financed by the French government IDEX-ISITE initiative 16-IDEX-0001 (CAP 20-25).
We thank an anonymous referee and Pablo Tierz for their useful comments to improve this work.
This research has been supported by the Agenzia Italiana per la Cooperazione allo Sviluppo (RIESCA project).
This paper was edited by Giovanni Macedonio and reviewed by Pablo Tierz and one anonymous referee.
Ai, M., Kong, X., and Li, K.: A general theory for orthogonal array based latin hypercube sampling, Statist. Sin., 26, 761–777, https://doi.org/10.5705/ss.202015.0029, 2016.
Alberico, I., Lirer, L., Petrosino, P., and Scandone, R.: A methodology for the evaluation of long-term volcanic risk from pyroclastic flows in Campi Flegrei (Italy), J. Volcanol. Geoth. Res., 116, 63–78, 2002.
Andronico, D., Branca, S., Calvari, S., Burton, M., Caltabiano, T., Corsaro, R., Del Carlo, P., Garfì, G., Lodato, L., and Miraglia, L.: A multi-disciplinary study of the 2002–03 Etna eruption: insights into a complex plumbing system, Bull. Volcanol., 67, 314–330, 2005.
Ang, P., Bebbington, M., Lindsay, J., and Jenkins, S.: From eruption scenarios to probabilistic volcanic hazard analysis: An example of the Auckland Volcanic Field, New Zealand, J. Volcanol. Geoth. Res., 397, 106871, https://doi.org/10.1016/j.jvolgeores.2020.106871, 2020.
Aravena, A.: Branching Kinetic Models (ECMapProb and BoxMapProb) (Version 1.0), Zenodo, https://doi.org/10.5281/zenodo.3755086, 2020.
Aravena, A., Cioni, R., Bevilacqua, A., de' Michieli Vitturi, M., Esposti Ongaro, T., and Neri, A.: Tree-branching based enhancement of kinetic energy models for reproducing channelization processes of pyroclastic density currents, J. Geophys. Res.-Solid, 125, e2019JB019271, https://doi.org/10.1029/2019JB019271, 2020a.
Aravena, A., Cioni, R., Coppola, D., de' Michieli Vitturi, M., Neri, A., Pistolesi, M., and Ripepe, M.: Effusion rate evolution during small-volume basaltic eruptions: Insights from numerical modeling, J. Geophys. Res.-Solid, 125, e2019JB019301, https://doi.org/10.1029/2019JB019301, 2020b.
Avellán, D., Macías, J., Pardo, N., Scolamacchia, T., and Rodriguez, D.: Stratigraphy, geomorphology, geochemistry and hazard implications of the Nejapa Volcanic Field, western Managua, Nicaragua, J. Volcanol. Geoth. Res., 213, 51–71, 2012.
Avellán, D., Macías, J., Sosa-Ceballos, G., and Velásquez, G.: Stratigraphy, chemistry, and eruptive dynamics of the 12.4 ka plinian eruption of Apoyeque volcano, Managua, Nicaragua, Bull. Volcanol., 76, 792, https://doi.org/10.1007/s00445-013-0792-4, 2014.
Barckhausen, U., Ranero, C., von Huene, R., Cande, S., and Roeser, H.: Revised tectonic boundaries in the Cocos Plate off Costa Rica: Implications for the segmentation of the convergent margin and for plate tectonic models, J. Geophys. Res.-Solid, 106, 19207–19220, 2001.
Bayarri, M., Berger, J., Calder, E., Patra, A., Pitman, E., Spiller, E., and Wolpert, R.: Probabilistic quantification of hazards: a methodology using small ensembles of physics-based simulations and statistical surrogates, Int. J. Uncertain. Quantificat., 5, 297–325, https://doi.org/10.1615/Int.J.UncertaintyQuantification.2015011451, 2015.
Bebbington, M.: Assessing spatio-temporal eruption forecasts in a monogenetic volcanic field, J. Volcanol. Geoth. Res., 252, 14–28, 2013.
Bebbington, M.: Spatio-volumetric hazard estimation in the Auckland volcanic field, Bull. Volcanol., 77, 39, https://doi.org/10.1007/s00445-015-0921-3, 2015.
Bebbington, M. and Cronin, S.: Spatio-temporal hazard estimation in the Auckland Volcanic Field, New Zealand, with a new event-order model, Bull. Volcanol., 73, 55–72, 2011.
Bebbington, M., Stirling, M., Cronin, S., Wang, T., and Jolly, G.: National-level long-term eruption forecasts by expert elicitation, Bull. Volcanol., 80, 56, https://doi.org/10.1007/s00445-018-1230-4, 2018.
Becerril, L., Cappello, A., Galindo, I., Neri, M., and Del Negro, C.: Spatial probability distribution of future volcanic eruptions at El Hierro Island (Canary Islands, Spain), J. Volcanol. Geoth. Res., 257, 21–30, 2013.
Bevilacqua, A.: Doubly stochastic models for volcanic hazard assessment at Campi Flegrei caldera, in: Thesis, 21, Edizioni della Normale, Birkhäuser/Springer, Pisa, 2016.
Bevilacqua, A., Isaia, R., Neri, A., Vitale, S., Aspinall, W., Bisson, M., Flandoli, F., Baxter, P., Bertagnini, A., and Esposti Ongaro, T.: Quantifying volcanic hazard at Campi Flegrei caldera (Italy) with uncertainty assessment: 1. Vent opening maps, J. Geophys. Res.-Solid, 120, 2309–2329, 2015.
Bevilacqua, A., Bursik, M., Patra, A., Pitman, E., and Till, R.: Bayesian construction of a long-term vent opening probability map in the Long Valley volcanic region (CA, USA), Statist. Volcanol., 3, 1, https://doi.org/10.5038/2163-338X.3.1, 2017a.
Bevilacqua, A., Neri, A., Bisson, M., Esposti Ongaro, T., Flandoli, F., Isaia, R., Rosi, M., and Vitale, S.: The effects of vent location, event scale, and time forecasts on pyroclastic density current hazard maps at Campi Flegrei caldera (Italy), Front. Earth Sci., 5, 72, https://doi.org/10.3389/feart.2017.00072, 2017b.
Bevilacqua, A., Bursik, M., Patra, A., Pitman, E., Yang, Q., Sangani, R., and Kobs-Nawotniak, S.: Late Quaternary eruption record and probability of future volcanic eruptions in the Long Valley volcanic region (CA, USA), J. Geophys. Res.-Solid, 123, 5466–5494, 2018.
Bevilacqua, A., de' Michieli Vitturi, M., Esposti Ongaro, T., and Neri, A.: Enhancing the uncertainty quantification of pyroclastic density current dynamics in the Campi Flegrei caldera, Frontiers of Uncertainty Quantification 19 (ERCOFTAC-GAMM-AC), Pisa, Italy, 2019a.
Bevilacqua, A., Patra, A. K., Bursik, M. I., Pitman, E. B., Macías, J. L., Saucedo, R., and Hyman, D.: Probabilistic forecasting of plausible debris flows from Nevado de Colima (Mexico) using data from the Atenquique debris flow, 1955, Nat. Hazards Earth Syst. Sci., 19, 791–820, https://doi.org/10.5194/nhess-19-791-2019, 2019b.
Bevilacqua, A., Pitman, E., Patra, A., Neri, A., Bursik, M., and Voight, B.: Probabilistic enhancement of the Failure Forecast Method using a stochastic differential equation and application to volcanic eruption forecasts, Front. Earth Sci., 7, 135, https://doi.org/10.3389/feart.2019.00135, 2019c.
Bevilacqua, A., Neri, A., De Martino, P., Isaia, R., Novellino, A., Tramparulo, F., and Vitale, S.: Radial interpolation of GPS and leveling data of ground deformation in a resurgent caldera: application to Campi Flegrei (Italy), J. Geod., 94, 24, https://doi.org/10.1007/s00190-020-01355-x, 2020a.
Bevilacqua, A., Patra, A., Pitman, E., Bursik, M., De Martino, P., Giudicepietro, F., Macedonio, G., Vitale, S., Flandoli, F., Voight, B., and Neri, A.: First application of the failure forecast method to the GPS horizontal displacement data collected in the Campi Flegrei caldera (Italy) in 2011–2020, ArXiv: preprint, ArXiv 2007.02756, 2020b.
Bonadonna, C., Connor, C. B., Houghton, B. F., Connor, L., Byrne, M., Laing, A., and Hincks, T. K.: Probabilistic modeling of tephra dispersal: Hazard assessment of a multiphase rhyolitic eruption at Tarawera, New Zealand, J. Geophys. Res.-Solid, 110, B03203, https://doi.org/10.1029/2003JB002896, 2005.
Cappello, A., Neri, M., Acocella, V., Gallo, G., Vicari, A., and Del Negro, C.: Spatial vent opening probability map of Etna volcano (Sicily, Italy), Bull. Volcanol., 74, 2083–2094, 2012.
Cappello, A., Geshi, N., Neri, M., and Del Negro, C.: Lava flow hazards – An impending threat at Miyakejima volcano, Japan, J. Volcanol. Geoth. Res., 308, 1–9, 2015.
Chapman, N., Apted, M., Aspinall, W., Berryman, K., Cloos, M., Connor, C., Connor, L., Jaquet, O., and Kiyosugi, K.: TOPAZ Project: Long-term tectonic hazard to geological repositories, Nuclear Waste Management Organization of Japan (NUMO) Report, 87 pp., 2012.
Chaussard, E. and Amelung, F.: Precursory inflation of shallow magma reservoirs at west Sunda volcanoes detected by InSAR, Geophys. Res. Lett., 39, L21311, https://doi.org/10.1029/2012GL053817, 2012.
Cioni, R., Bertagnini, A., Santacroce, R., and Andronico, D.: Explosive activity and eruption scenarios at Somma-Vesuvius (Italy): towards a new classification scheme, J. Volcanol. Geoth. Res., 178, 331–346, 2008.
Cioni, R., Tadini, A., Gurioli, L., Bertagnini, A., Mulas, M., Bevilacqua, A., and Neri, A.: Estimating eruptive parameters and related uncertainties for pyroclastic density currents deposits: worked examples from Somma-Vesuvius (Italy), Bull. Volcanol., 82, 1–20, 2020.
Clarke, B., Tierz, P., Calder, E., and Yirgu, G.: Probabilistic volcanic hazard assessment for pyroclastic density currents from pumice cone eruptions at Aluto Volcano, Ethiopia, Front. Earth Sci., 8, 348, https://doi.org/10.3389/feart.2020.00348, 2020.
Connor, C. and Hill, B.: Three nonhomogeneous Poisson models for the probability of basaltic volcanism: application to the Yucca Mountain region, Nevada, J. Geophys. Res.-Solid, 100, 10107–10125, 1995.
Connor, C., Stamatakos, J., Ferrill, D., Hill, B., Ofoegbu, G., Conway, F., Sagar, B., and Trapp, J.: Geologic factors controlling patterns of small-volume basaltic volcanism: Application to a volcanic hazards assessment at Yucca Mountain, Nevada, J. Geophys. Res.-Solid, 105, 417–432, 2000.
Connor, C., Bebbington, M., and Marzocchi, W.: Probabilistic volcanic hazard assessment, in: Encyclopedia of Volcanoes, 2nd Edn., edited by: Sigurdsson, H., Academic Press, Amsterdam, 897–910, https://doi.org/10.1016/B978-0-12-385938-9.00051-1, 2015.
Connor, C., Connor, L., Germa, A., Richardson, J., Bebbington, M., Gallant, E., and Saballos, A.: How to use kernel density estimation as a diagnostic and forecasting tool for distributed volcanic vents, Statist. Volcanol., 4, 1–25, https://doi.org/10.5038/2163-338X.4.3, 2019.
Connor, L., Connor, C., Meliksetian, K., and Savov, I.: Probabilistic approach to modeling lava flow inundation: a lava flow hazard assessment for a nuclear facility in Armenia, J. Appl. Volcanol., 1, 3, https://doi.org/10.1186/2191-5040-1-3, 2012.
Coppola, D., Piscopo, D., Staudacher, T., and Cigolini, C.: Lava discharge rate and effusive pattern at Piton de la Fournaise from MODIS data, J. Volcanol. Geoth. Res., 184, 174–192, 2009.
Cox, D. R. and Isham, V.: Point processes, Chapman and Hall, London, New York, 1980.
Daley, D. and Vere-Jones, D.: An Introduction to the Theory of Point Processes, in: Volume I: Elementary Theory and Methods, Springer, Heidelberg, 2003.
Daley, D. and Vere-Jones, D.: An Introduction to the Theory of Point Processes, in: Volume II: General Theory and Structure, Springer, New York, 2008.
Del Negro, C., Cappello, A., Neri, M., Bilotta, G., Hérault, A., and Ganci, G.: Lava flow hazards at Mount Etna: constraints imposed by eruptive history and numerical simulations, Scient. Rep., 3, 1–8, 2013.
Del Negro, C., Cappello, A., Bilotta, G., Ganci, G., Hérault, A., and Zago, V.: Living at the edge of an active volcano: Risk from lava flows on Mt. Etna, GSA Bull., 132, 1615–1625, 2020.
DeMets, C.: A new estimate for present-day Cocos-Caribbean plate motion: Implications for slip along the Central American volcanic arc, Geophys. Res. Lett., 28, 4043–4046, 2001.
Deng, F., Connor, C. B., Malservisi, R., Connor, L. J., White, J. T., Germa, A., and Wetmore, P. H.: A geophysical model for the origin of volcano vent clusters in a Colorado Plateau volcanic field, J. Geophys. Res.-Solid, 122, 8910–8924, 2017.
Espinoza, F.: Neotectónica de la falla Nejapa, porción oeste del graben de Managua, Nicaragua, tesis de Maestría, UNAM, México, 2007.
Fairbrothers, G., Carr, M., and Mayfield, D.: Temporal magmatic variation at Boqueron volcano, El Salvador, Contrib. Mineral. Petrol., 67, 1–9, 1978.
Felpeto, A., Martí, J., and Ortiz, R.: Automatic GIS-based system for volcanic hazard assessment, J. Volcanol. Geoth. Res., 166, 106–116, 2007.
Ferrés, D., Delgado-Granados, H., Hernández, W., Pullinger, C., Chávez, H., Taracena, C. C., and Cañas-Dinarte, C.: Three thousand years of flank and central vent eruptions of the San Salvador volcanic complex (El Salvador) and their effects on El Cambio archeological site: a review based on tephrostratigraphy, Bull. Volcanol., 73, 833, https://doi.org/10.1007/s00445-011-0465-0, 2011.
Ferrés, D., Delgado-Granados, H., Gutiérrez, R., Farraz, I., Hernández, E., Pullinger, C., and Escobar, C.: Explosive volcanic history and hazard zonation maps of Boquerón Volcano (San Salvador volcanic complex, El Salvador), Geological Society of America Special Papers 498, Geological Society of America, 201–230, https://doi.org/10.1130/2013.2498(12), 2013.
Ferrés, D.: Estratigrafía, geología y evaluación de peligros volcánicos del Complejo Volcánico de San Salvador (El Salvador), PhD. thesis, Universidad Nacional Autónoma de México, México, 316 pp., 2014.
Freundt, A. and Kutterolf, S.: The long-lived Chiltepe volcanic complex, Nicaragua: magmatic evolution at an arc offset, Bull. Volcanol., 81, 1–22, 2019.
Freundt, A., Hartmann, A., Kutterolf, S., and Strauch, W.: Volcaniclastic stratigraphy of the Tiscapa maar crater walls (Managua, Nicaragua): implications for volcanic and seismic hazards and Holocene climate changes, Int. J. Earth Sci., 99, 1453–1470, 2010.
Gaffney, E. and Damjanac, B.: Localization of volcanic activity: topographic effects on dike propagation, eruption and conduit formation, Geophys. Res. Lett., 33, L14313, https://doi.org/10.1029/2006GL026852, 2006.
Gallant, E., Richardson, J., Connor, C., Wetmore, P., and Connor, L.: A new approach to probabilistic lava flow hazard assessments, applied to the Idaho National Laboratory, eastern Snake River Plain, Idaho, USA, Geology, 46, 895–898, 2018.
Hayashi, J. N. and Self, S.: A comparison of pyroclastic flow and debris avalanche mobility, J. Geophys. Res.-Solid, 97, 9063–9071, 1992.
Huppert, H. E. and Simpson, J. E.: The slumping of gravity currents, J. Fluid Mech., 99, 785–799, 1980.
Hyman, D. M., Bevilacqua, A., and Bursik, M. I.: Statistical theory of probabilistic hazard maps: a probability distribution for the hazard boundary location, Nat. Hazards Earth Syst. Sci., 19, 1347–1363, https://doi.org/10.5194/nhess-19-1347-2019, 2019.
Jaquet, O., Connor, C., and Connor, L.: Probabilistic methodology for long-term assessment of volcanic hazards, Nucl. Technol., 163, 180–189, 2008.
Jaquet, O., Lantuéjoul, C., and Goto, J.: Probabilistic estimation of long-term volcanic hazard with assimilation of geophysics and tectonic data, J. Volcanol. Geoth. Res., 235, 29–36, 2012.
Jaquet, O., Lantuéjoul, C., and Goto, J.: Probabilistic estimation of long-term volcanic hazard under evolving tectonic conditions in a 1 Ma timeframe, J. Volcanol. Geoth. Res., 345, 58–66, 2017.
Kósik, S., Bebbington, M., and Németh, K.: Spatio-temporal hazard estimation in the central silicic part of Taupo Volcanic Zone, New Zealand, based on small to medium volume eruptions, Bull. Volcanol., 82, 50, https://doi.org/10.1007/s00445-020-01392-6, 2020.
Kutterolf, S., Freundt, A., Perez, W., Wehrmann, H., and Schmincke, H. U.: Late Pleistocene to Holocene temporal succession and magnitudes of highly-explosive volcanic eruptions in west-central Nicaragua, J. Volcanol. Geoth. Res., 163, 55–82, 2007.
Kutterolf, S., Freundt, A., and Perez, W.: Pacific offshore record of plinian arc volcanism in Central America: 2. Tephra volumes and erupted masses, Geochem. Geophy. Geosy., 9, Q02S02, https://doi.org/10.1029/2007GC001791, 2008.
Kutterolf, S., Freundt, A., and Burkert, C.: Eruptive history and magmatic evolution of the 1.9 kyr Plinian dacitic Chiltepe Tephra from Apoyeque volcano in west-central Nicaragua, Bull. Volcanol., 73, 811–831, 2011.
Le Corvec, N., Menand, T., and Lindsay, J.: Interaction of ascending magma with pre-existing crustal fractures in monogenetic basaltic volcanism: an experimental approach, J. Geophys. Res.-Solid, 118, 968–984, 2013.
Major, J., Schilling, S., Pullinger, C., Escobar, C., and Howell, M.: Volcano-hazard zonation for San Vicente Volcano, El Salvador, US Geological Survey Open File Report 01-367, US Geological Survey, Vancouver, Washington, p. 22, 2001.
Martí, J., Sobradelo, R., Felpeto, A., and García, O.: Eruptive scenarios of phonolitic volcanism at Teide–Pico Viejo volcanic complex (Tenerife, Canary Islands), Bull. Volcanol., 74, 767–782, https://doi.org/10.1007/s00445-011-0569-6, 2012.
Martin, A., Umeda, K., Connor, C., Weller, J., Zhao, D., and Takahashi, M.: Modeling long-term volcanic hazards through Bayesian inference: An example from the Tohoku volcanic arc, Japan, J. Geophys. Res.-Solid, 109, B10208, https://doi.org/10.1029/2004JB003201, 2004.
Marzocchi, W. and Bebbington, M.: Probabilistic eruption forecasting at short and long time scales, Bull. Volcanol., 74, 1777–1805, 2012.
Mazzarini, F., Rooney, T., and Isola, I.: The intimate relationship between strain and magmatism: A numerical treatment of clustered monogenetic fields in the Main Ethiopian Rift, Tectonics, 32, 49–64, 2013.
Mazzarini, F., Le Corvec, N., Isola, I., and Favalli, M.: Volcanic field elongation, vent distribution, and tectonic evolution of a continental rift: The Main Ethiopian Rift example, Geosphere, 12, 706–720, 2016.
McKay, M., Beckman, R., and Conover, W.: A comparison of three methods for selecting values of input variables in the analysis of output from a computer code, Technometrics, 42, 55–61, 2000.
Mead, S. R. and Magill, C. R.: Probabilistic hazard modelling of rain-triggered lahars, J. Appl. Volcanol., 6, 1–7, 2017.
Németh, K. and Kereszturi, G.: Monogenetic volcanism: personal views and discussion, Int. J. Earth Sci., 104, 2131–2146, 2015.
Neri, A., Aspinall, W., Cioni, R., Bertagnini, A., Baxter, P., Zuccaro, G., Andronico, D., Barsotti, S., Cole, P., and Esposti Ongaro, T.: Developing an event tree for probabilistic hazard and risk assessment at Vesuvius, J. Volcanol. Geoth. Res., 178, 397–415, 2008.
Neri, A., Bevilacqua, A., Esposti Ongaro, T., Isaia, R., Aspinall, W., Bisson, M., Flandoli, F., Baxter, P., Bertagnini, A., and Iannuzzi, E.: Quantifying volcanic hazard at Campi Flegrei caldera (Italy) with uncertainty assessment: 2. Pyroclastic density current invasion maps, J. Geophys. Res., 120, 2330–2349, 2015.
Newhall, C. and Hoblitt, R.: Constructing event trees for volcanic crises, Bull. Volcanol., 64, 3–20, 2002.
Newhall, C. G. and Pallister, J. S.: Using multiple data sets to populate probabilistic volcanic event trees, in: Volcanic Hazards, Risks and Disasters, Elsevier, Amsterdam, the Netherlands, 203–232, https://doi.org/10.1016/B978-0-12-396453-3.00008-3, 2015.
Ogburn, S. and Calder, E.: The relative effectiveness of empirical and physical models for simulating the dense undercurrent of pyroclastic flows under different emplacement conditions, Front. Earth Sci., 5, 83, https://doi.org/10.3389/feart.2017.00083, 2017.
Ogburn, S., Berger, J., Calder, E., Lopes, D., Patra, A., Pitman, E., Rutarindwa, R., Spiller, E., and Wolpert, R.: Pooling strength amongst limited datasets using hierarchical Bayesian analysis, with application to pyroclastic density current mobility metrics, Statist. Volcanol., 2, 1–26, https://doi.org/10.5038/2163-338X.2.1, 2016.
Owen, A.: Orthogonal arrays for computer experiments, integration and visualization, Statist. Sin., 2, 439–452, 1992.
Pardo, N., Avellán, D., Macías, J., Scolamacchia, T., and Rodríguez, D.: The ∼1245 yr BP Asososca maar: New advances on recent volcanic stratigraphy of Managua (Nicaragua) and hazard implications, J. Volcanol. Geoth. Res., 176, 493–512, 2008.
Paris, R., Ulvrova, M., Selva, J., Brizuela, B., Costa, A., Grezio, A., Lorito, S., and Tonini, R.: Probabilistic hazard analysis for tsunamis generated by subaqueous volcanic explosions in the Campi Flegrei caldera, Italy, J. Volcanol. Geoth. Res., 379, 106–116, 2019.
Patra, A. K., Bevilacqua, A., and Akhavan-Safaei, A.: Analyzing Complex Models using Data and Statistics, in: vol. 10861 of ICCS, Lecture Notes in Computer Science, chap. 57, Springer, Cham, 724–736, https://doi.org/10.1007/978-3-319-93701-4_57, 2018.
Patra, A., Bevilacqua, A., Pitman, E., Bursik, M., Voight, B., Neri, A., Macedonio, G., Flandoli, F., De Martino, P., Giudicepietro, F., and Vitale, S.: A statistical approach for spatial mapping and temporal forecasts of volcanic eruptions using monitoring data, in: AGU 2019 Fall Meeting, San Francisco, CA, USA, 2019.
Patra, A., Bevilacqua, A., Akhavan-Safaei, A., Pitman, E., Bursik, M., and Hyman, D.: Comparative Analysis of the Structures and Outcomes of Geophysical Flow Models and Modeling Assumptions Using Uncertainty Quantification, Front. Earth Sci., 8, 275, https://doi.org/10.3389/feart.2020.00275, 2020.
Poland, M. and Anderson, K.: Partly Cloudy With a Chance of Lava Flows: Forecasting Volcanic Eruptions in the Twenty-First Century, J. Geophys. Res.-Solid, 125, e2018JB016974, https://doi.org/10.1029/2018JB016974, 2020.
Ranjan, P. and Spencer, N.: Space-filling Latin hypercube designs based on randomization restrictions in factorial experiments, Statist. Probabil. Lett., 94, 239–247, 2014.
Rose, W., Palma, J., Wolf, R., and Gomez, R.: A 50 yr eruption of a basaltic composite cone: Pacaya, Guatemala, The Geological Society of America Special Paper 498, Geological Society of America, Boulder, CO, USA, 1–21, https://doi.org/10.1130/2013.2498(01), 2013.
Runge, M., Bebbington, M., Cronin, S., Lindsay, J., Kenedi, C., and Moufti, M.: Vents to events: determining an eruption event record from volcanic vent structures for the Harrat Rahat, Saudi Arabia, Bull. Volcanol., 76, 804, https://doi.org/10.1007/s00445-014-0804-z, 2014.
Runge, M., Bebbington, M., Cronin, S., Lindsay, J., and Moufti, M.: Integrating geological and geophysical data to improve probabilistic hazard forecasting of Arabian Shield volcanism, J. Volcanol. Geoth. Res., 311, 41–59, 2016.
Rutarindwa, R., Spiller, E., Bevilacqua, A., Bursik, M., and Patra, A.: Dynamic probabilistic hazard mapping in the Long Valley Volcanic Region CA: integrating vent opening maps and statistical surrogates of physical models of pyroclastic density currents, J. Geophys. Res.-Solid, 124, 9600–9621, 2019.
Sandri, L., Jolly, G., Lindsay, J., Howe, T., and Marzocchi, W.: Combining long-and short-term probabilistic volcanic hazard assessment with cost-benefit analysis to support decision making in a volcanic crisis from the Auckland Volcanic Field, New Zealand, Bull. Volcanol., 74, 705–723, 2012.
Sandri, L., Tierz, P., Costa, A., and Marzocchi, W.: Probabilistic hazard from pyroclastic density currents in the Neapolitan area (Southern Italy), J. Geophys. Res.-Solid, 123, 3474–3500, 2018.
Sandri, L., Bevilacqua, A., Selva, J., Neri, A., Costa, A., and Macedonio, G.: Eruption forecasting and hazard assessment at INGV during the 2019 crisis exercise at Campi Flegrei, in: 4th Rittmann Conference, Catania, Italy, 2020.
Selva, J., Orsi, G., Di Vito, M., Marzocchi, W., and Sandri, L.: Probability hazard map for future vent opening at the Campi Flegrei caldera, Italy, Bull. Volcanol., 74, 497–510, 2012.
Selva, J., Costa, A., Sandri, L., Macedonio, G., and Marzocchi, W.: Probabilistic short-term volcanic hazard in phases of unrest: A case study for tephra fallout, J. Geophys. Res.-Solid, 119, 8805–8826, 2014.
Sheridan, M. F. and Macías, J.: Estimation of risk probability for gravity-driven pyroclastic flows at Volcan Colima, Mexico, J. Volcanol. Geoth. Res., 66, 251–256, 1995.
Sigmundsson, F., Hreinsdóttir, S., Hooper, A., Arnadóttir, T., Pedersen, R., Roberts, M. J., Óskarsson, N., Auriac, A., Decriem, J., Einarsson, P., Geirsson, H., Hensch, M., Ófeigsson, B. G., Sturkell, E., Sveinbjörnsson, H., and Feigl, K. L.: Intrusion triggering of the 2010 Eyjafjallajökull explosive eruption, Nature, 468, 426–430, 2010.
Smith, V., Costa, A., Aguirre-Díaz, G., Pedrazzi, D., Scifo, A., Plunkett, G., Poret, M., Tournigand, P., Miles, D., and Dee, M.: The magnitude and impact of the 431 CE Tierra Blanca Joven eruption of Ilopango, El Salvador, P. Natl. Acad. Sci. USA, 117, 26061–26068, 2020.
Sofield, D.: History and Hazards of Volcán San Salvador, El Salvador, MS thesis, Michigan Technological University, Houghton, Michigan, USA, 1998.
Sofield, D.: Eruptive history and volcanic hazards of Volcan San Salvador, Natural hazards in El Salvador, Society of America (GSA), Boulder, CO, USA, 147–158, https://doi.org/10.1130/0-8137-2375-2.147, 2004.
Spiller, E., Bayarri, M., Berger, J., Calder, E., Patra, A., Pitman, E., and Wolpert, R.: Automating emulator construction for geophysical hazard maps, SIAM/ASA J. Uncertain. Quantificat., 2, 126–152, 2014.
Stein, M.: Large sample properties of simulations using Latin hypercube sampling, Technometrics, 29, 143–151, 1987.
Strehlow, K., Sandri, L., Gottsmann, J. H., Kilgour, G., Rust, A. C., and Tonini, R.: Phreatic eruptions at crater lakes: occurrence statistics and probabilistic hazard forecast, J. Appl. Volcanol., 6, 1–21, 2017.
Tadini, A., Bevilacqua, A., Neri, A., Cioni, R., Aspinall, W., Bisson, M., Isaia, R., Mazzarini, F., Valentine, G., and Vitale, S.: Assessing future vent opening locations at the Somma-Vesuvio volcanic complex: 2. Probability maps of the caldera for a future Plinian/sub-Plinian event with uncertainty quantification, J. Geophys. Re.-Solid, 122, 4357–4376, 2017a.
Tadini, A., Bisson, M., Neri, A., Cioni, R., Bevilacqua, A., and Aspinall, W.: Assessing future vent opening locations at the Somma-Vesuvio volcanic complex: 1. A new information geodatabase with uncertainty characterizations, J. Geophys. Res.-Solid, 122, 4336–4356, 2017b.
Tang, B.: Orthogonal array-based Latin hypercubes, J. Am. Statist. Assoc., 88, 1392–1397, 1993.
Thompson, M. A., Lindsay, J. M., Sandri, L., Biass, S., Bonadonna, C., Jolly, G., and Marzocchi, W.: Exploring the influence of vent location and eruption style on tephra fall hazard from the Okataina Volcanic Centre, New Zealand, Bull. Volcanol., 77, 1–23, 2015.
Tierz, P., Sandri, L., Costa, A., Zaccarelli, L., Di Vito, M. A., Sulpizio, R., and Marzocchi, W.: Suitability of energy cone for probabilistic volcanic hazard assessment: validation tests at Somma-Vesuvius and Campi Flegrei (Italy), Bull. Volcanol., 78, 1–15, 2016a.
Tierz, P., Sandri, L., Costa, A., Sulpizio, R., Zaccarelli, L., Di Vito, M. A., and Marzocchi, W.: Uncertainty assessment of pyroclastic density currents at Mount Vesuvius (Italy) simulated through the energy cone model, in: Natural hazard uncertainty assessment: Modeling and decision support, American Geophysical Union, Washington, 125–145, https://doi.org/10.1002/9781119028116.ch9, 2016b.
Tierz, P., Stefanescu, E. R., Sandri, L., Sulpizio, R., Valentine, G. A., Marzocchi, W., and Patra, A. K.: Towards quantitative volcanic risk of pyroclastic density currents: Probabilistic hazard curves and maps around Somma-Vesuvius (Italy), J. Geophys. Res.-Solid, 123, 6299–6317, 2018.
Tierz, P., Clarke, B., Calder, E. S., Dessalegn, F., Lewi, E., Yirgu, G., Fontijn, K., Crummy, J. M., Bekele, Y., and Loughlin, S. C.: Event trees and epistemic uncertainty in long-term volcanic hazard assessment of rift volcanoes: The example of Aluto (Central Ethiopia), Geochem. Geophy. Geosy., 21, e2020GC009219, https://doi.org/10.1029/2020GC009219, 2020.
Tonini, R., Sandri, L., Costa, A., and Selva, J.: Brief Communication: The effect of submerged vents on probabilistic hazard assessment for tephra fallout, Nat. Hazards Earth Syst. Sci., 15, 409–415, https://doi.org/10.5194/nhess-15-409-2015, 2015.
Valentine, G. and Krogh, K.: Emplacement of shallow dikes and sills beneath a small basaltic volcanic center–The role of pre-existing structure (Paiute Ridge, southern Nevada, USA), Earth Planet. Sc. Lett., 246, 217–230, 2006.
Ward, P., Gibbs, J., Harlow, D., and Aburto, A.: Aftershocks of the Managua, Nicaragua, earthquake and the tectonic significance of the Tiscapa fault, Bull. Seismol. Soc. Am., 64, 1017–1029, 1974.
Weller, J., Martin, A., Connor, C., Connor, L., and Karakhanian, A.: Modelling the spatial distribution of volcanoes: an example from Armenia, Statistics in Volcanology, Special Publications of IAVCEI, 1, 77–88, 2006.
Wright, H., Pallister, J., McCausland, W., Griswold, J., Andreastuti, S., Budianto, A., Primulyana, S., Gunawan, H., Battaglia, M., and Diefenbach, A.: Construction of probabilistic event trees for eruption forecasting at Sinabung volcano, Indonesia 2013–14, J. Volcanol. Geoth. Res., 382, 233–252, 2019.
- Abstract
- Introduction
- Geological framework and volcanological dataset
- Probability maps of vent opening
- Numerical simulation of small-scale PDC invasion hazard maps
- Discussion
- Conclusions
- Appendix A
- Code and data availability
- Author contributions
- Competing interests
- Acknowledgements
- Financial support
- Review statement
- References
- Supplement