the Creative Commons Attribution 4.0 License.
the Creative Commons Attribution 4.0 License.
 | 06 Apr 2021
Online urban-waterlogging monitoring based on a recurrent neural network for classification of microblogging text
Hui Liu
Wenhao Zhang
Hanyue Zhang
Fei Gao
Jinping Tong
With the global climate change and rapid urbanization, urban flood disasters spread and become increasingly serious in China. Urban rainstorms and waterlogging have become an urgent challenge that needs to be monitored in real time and further predicted for the improvement of urbanization construction. We trained a recurrent neural network (RNN) model to classify microblogging posts related to urban waterlogging and establish an online monitoring system of urban waterlogging caused by flood disasters. We manually curated more than 4400 waterlogging posts to train the RNN model so that it can precisely identify waterlogging-related posts of Sina Weibo to timely determine urban waterlogging. The RNN model has been thoroughly evaluated, and our experimental results showed that it achieved higher accuracy than traditional machine learning methods, such as the support vector machine (SVM) and gradient boosting decision tree (GBDT). Furthermore, we build a nationwide map of urban waterlogging based on recent 2-year microblogging data.
- Article
(2160 KB) - Full-text XML
-
Supplement
(202 KB) - BibTeX
- EndNote


Due to climate change and rapid urbanization, global flood disasters have become increasingly frequent and serious, leading to traffic jams, environmental pollution, travel and health risks for residents, etc. (Wheater and Evans, 2009; Kuklicke and Demeritt, 2016; Sofia et al., 2017). Therefore, it is crucial to address the problem of early warning and monitoring of flood disasters for the sake of life and property safety. However, it is difficult to predict natural disasters and emergencies, such as earthquakes and flooding, as we usually do not have enough data to train an effective prediction model. Take flooding as an example: we expect that the model can integrate various data resources, including weather forecasting, historical waterlogging events, and hydrogeological data, to predict the occurrence of flooding and timely remind the residents to prepare for the disaster, thereby reducing the loss and achieving the early warning function.
Existing methods for early warning of flood disasters generally use meteorological and hydrological data as the basis of construction of forecasting models. Researchers build hydrological models that take into account various factors and simulate the occurrence, progression, and consequence of flood disasters (Tawatchai and Mohammed, 2005; Yu et al., 2015; Anselmo et al., 1996; Lima et al., 2015). Subsequently, multilevel thresholds corresponding to different warning levels are determined based on the simulation result of the hydrological models. Also, some scholars have developed methods for early warning of flood disasters. For example, Xiao et al. (2019) developed a flood forecasting and early-warning method based on similarity theory and a hydrological model to extend the lead time and achieve dynamic rolling forecasting (Xiao et al., 2019). Kang et al. (2019) proposed a flood warning method based on dynamic critical precipitation (Kang et al., 2019). In order to meet the actual need of early flood warning, Liang et al. (2019) constructed a new “grade-reliability” comprehensive evaluation of the accuracy of early flood warning. The method combines the grade prediction accuracy evaluation criteria and uncertainly analysis method to evaluate the reliability of the predicted results (Liang et al., 2019). Also, Liang (2019) discussed how to determine the early flood warning and forecasting time by use of rising-rate analysis on the basis of the flood rising rate changing over time in historical data (Liang, 2019).
The rapid development of mobile internet and smartphones has boosted various social media, such as Weibo and Twitter. Weibo is run by the Sina Corporation in China, and it is similar to Twitter. A Weibo post contains the fields such as user ID, user name, microblog content, posted time, etc. Some posts also include pictures and video. In fact, Weibo has become very popular among Chinese people, and accordingly it has become an important information source of flooding and natural disasters (Robinson et al., 2014). Some researchers have explored social media to extract information about disasters. For example, de Bruijn et al. (2019) proposed a database for detecting floods in real-time on a global scale using Twitter. This database was developed using 88 million tweets, from which they derived over 10 000 flood events (de Bruijn et al., 2019). Cheng et al. (2019) used Sina Weibo data to reveal the public sentiments to natural disasters on social media in the context of East Asian culture. The Pearson correlation between information dissemination and precipitation was analyzed, and important accounts and their information in social networks were determined through visual analysis (Cheng et al., 2019). Barker et al. (2019) developed a prototype of a national-scale Twitter data mining pipeline for improved stakeholder situational awareness during flooding events across Great Britain by retrieving relevant social geodata, grounded in environment data sources (flood warnings and river levels) (Barker et al., 2019). Wang et al. (2012) analyzed the subject words and user sentiments of the earthquake events based on the week-long discussion on Sina Weibo after the earthquake in Japan (Wang et al., 2012). Zhang and Wang (2015) used the Shanghai Bund stampede incident as an example, according to the response time, response speed, microblog contents, and microblog interaction of the government microblog after the emergency, to analyze and evaluate the information release and response ability of the government in an emergency. Some concrete ways and suggestions for the government to make information release more effective were put forward (Zhang and Wang, 2015).
Text classification is a hot topic in the field of natural language processing (NLP) (Hu et al., 2018; Kim, 2014) and has been widely used to identify important information of interest from social media. For example, Wadawadagi and Pagi (2020) investigated the severity of disaster events from microblog messages during natural calamities and emergencies using convolutional neural networks (CNNs) and recurrent neural networks (RNNs). Their work employed a joint model to combine the features of CNNs with RNNs, taking account of the coarse-grained local features generated via CNNs and long-range dependencies learned through RNNs for analysis of small text messages (Wadawadagi and Pagi, 2020). Also, Singh et al. (2020) investigated the problem of localization using the social sensing model (Twitter) to provide an efficient, reliable, and accurate flood text classification model with minimal labeled data. They proposed performing text classification using the inductive-transfer learning method for effective classification of flood-related feeds in new locations (Singh et al., 2020).
In this paper, we employ text classification of Weibo posts to identify urban waterlogging caused by flood. By manually collecting more than 4400 waterlogging-related Weibo posts from 2017 to 2018, we built a gold-standard data set to train a text classification model. We tested three popular models, including a recurrent neural network (RNN), support vector machine (SVM), and gradient boosting decision tree (GBDT), and found that the RNN achieved the best performance, evaluated on an independent test set that contains 400 Weibo posts (positive and negative) of 2019. Furthermore, we built a nationwide map of urban waterlogging based on recent 2-year microblogging data and a monitoring system based on the WeChat applet that will alert the user via voice alarm when he or she approaches a waterlogging point.
To the best of our knowledge, this is the first manually validated and the largest data set of Weibo posts related to urban flood deposits, which is ready for building a text classification model to identify Weibo posts that truly report waterlogging events. Also, we are the first to build a nationwide map with more than 6000 waterlogging points, which covers most cities in China. Furthermore, the RNN model trained in our data set can precisely identify flood deposits via online Weibo classification, and our monitoring system based on the WeChat applet would effectively benefit users by reducing the risk and loss caused by flood.
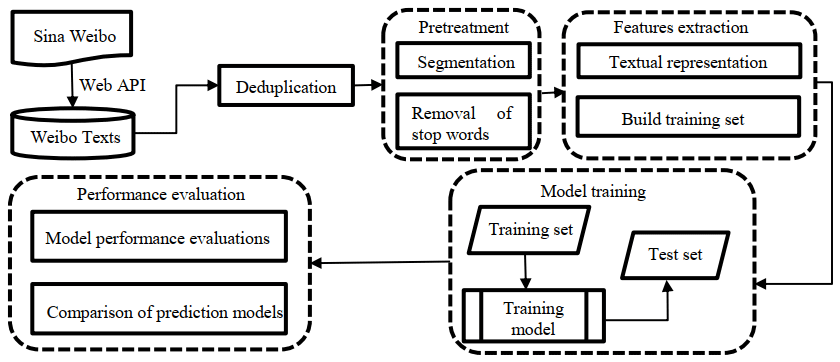
The overall framework of our method is shown in Fig. 1. There are four steps to build the RNN-based text classification model of Weibo posts for monitoring urban flood waterlogging. First, we collect 2017–2018 Weibo posts and get more than 70 000 posts after deduplication. After Chinese-word segmentation and removal of stop words, we build feature representations of each Weibo post based on word vector space and the word2vector model. Next, three popular text classification models are trained and tuned for their respective parameters, and their performances are evaluated on an independent test data set that is manually collected from 2019 Weibo posts.
2.1 Data sets
2.1.1 Data sources
The Weibo posts were obtained using Sina Weibo application programming interface (API). To exclude completely irrelevant posts, we downloaded only the Weibo posts including the keywords
“![]() ” or “
” or “![]() ” (drowning or waterlogging in Chinese). All microblogging text was saved in a comma-separated values (CSV) file to form a data table, including the issuer, microblogging text, post time, etc. We found that there were some posts with attached coordinates. However, not every post had attached coordinates because the GPS function is often turned off by users (de Bruijn et al., 2018).
” (drowning or waterlogging in Chinese). All microblogging text was saved in a comma-separated values (CSV) file to form a data table, including the issuer, microblogging text, post time, etc. We found that there were some posts with attached coordinates. However, not every post had attached coordinates because the GPS function is often turned off by users (de Bruijn et al., 2018).
For the sake of geographical localization of urban-waterlogging points from the content of Weibo posts, we also downloaded the catalog of nationwide communities of 307 cities in China, including community name, geographical location, floor area ratio, greening rate, and other information, from a famous housing website https://www.anjuke.com/ (last access: 1 February 2020) in China. Each city includes an average of 1500 communities.
2.1.2 Data cleaning
Weibo posts have a large number of repetitions due to its commenting function with the forward of original text and image content. A hot post may have been commented many times, but the main body of these Weibo posts is the same. Another case is that the “@” (retweet) function also leads to many duplicates. We removed duplicates by using a string match pattern that compared a number of leading characters of two posts. For example, if the first 15 characters of two posts were same, they were considered to be duplicates, and kept only one.
We supposed that downloaded posts stated the fact that waterlogging events occurred in some places. However, in real life, more complex situations do occur, such as some places with heavy rainfall but not flooding, indicating that local drainage infrastructure and dewatering facilities work well, and the residents were not threatened by flooding. On the other hand, many Weibo posts were actually irrelevant to flooding and waterlogging. For example, many posts contained the Chinese keywords for drowning or waterlogging mentioned above but discussed some diseases such as “hydrocephalus”, “knee dropsy”, and so on. Such Weibo posts had nothing to do with our task. To exclude these specious posts, we manually marked each post with a positive or negative label based on whether the content of the posts was related to urban waterlogging.
2.1.3 Localization of flood deposits
First, the Weibo posts that contained words like “certain community” and “highland” were excluded as the location of the flood deposits mentioned in these posts was difficult to determine.
Second, most posts have no attached coordinates, and some posts related to urban waterlogging actually specified the locations of the flood deposits in the text instead of the coordinates attached to the posts. For example, the post “In, Xingqing District, in Yinchuan city, on a section of Shanghai Road (Jinning Street to Fenghuang Street) the road surface water was more serious because of the heavy rain” specified that the waterlogging occurred on Shanghai Road in the text of this post. We extracted the terms about communities, roads, and orientation from the posts. Subsequently, we used the catalog of communities of 307 cities in China to match these terms so that we could determine the geographic location of the flood deposits reported via these Weibo posts. As a result, we cannot determine the location of the flood deposit using coordinates attached to the post. The localizations of the waterlogging were done based on the textual content. For this purpose, we have not dealt with two problems: one was that a community name contained the microblog overlapped with other communities; namely, two or more communities had the same name but were located in different cities. The other was that the communities mentioned were not included in the catalog. For both cases, we resorted to manual matching and deduplication. We manually checked the communities with duplicate names in different cities to ensure that the flood deposits were accurately located. Also, if a post referred to a certain city not included in the catalog, we manually identified the waterlogging locations by exploiting the community names or the coordinates attached to the post.
Table 1Examples of Weibo posts related to urban flood deposits.
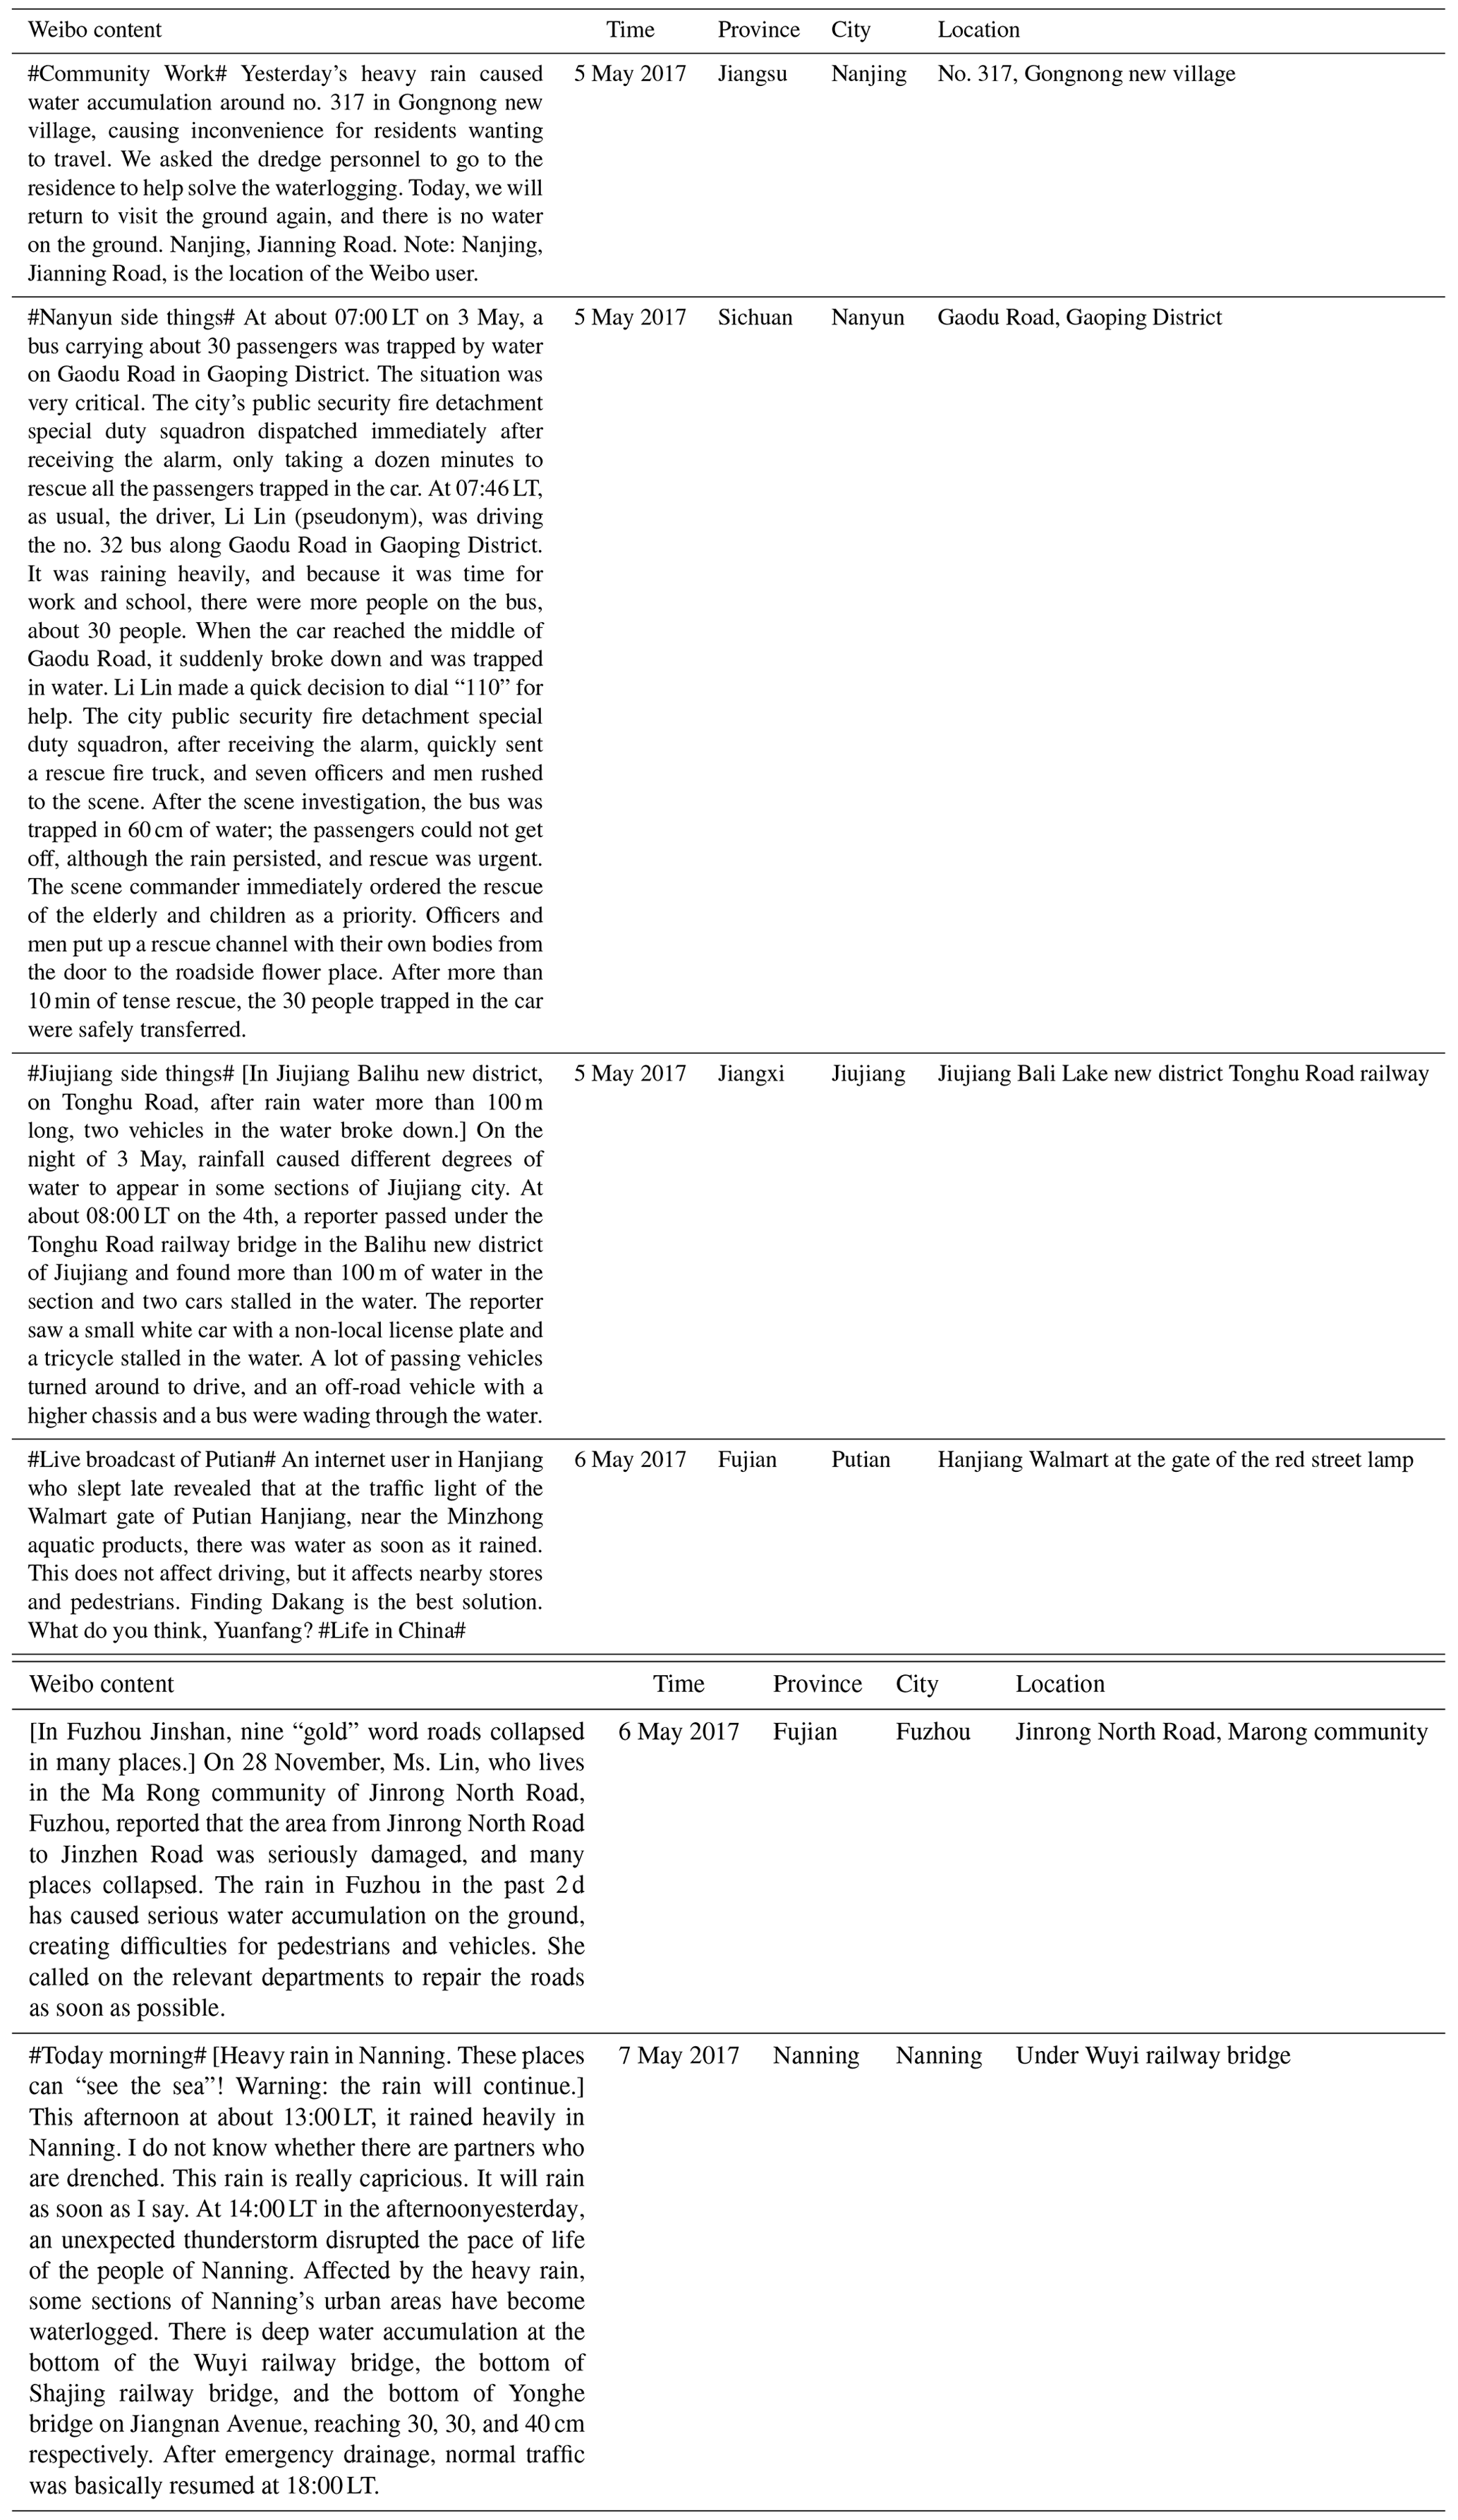
Note: original Chinese version of the text can be found in the Supplement.
Finally, we deleted duplicate posts that had the same text and same location. If their content was different, we would keep all, even if their location was same. For example, we have two posts: (i) on the morning of 12 May, the reporter learned from the Nanning traffic police detachment that because of the rainy day, surrounding roads leading to Pingle Avenue were partially flooded, and (ii) at present, there has been water accumulation in some sections of Yinhai Avenue, Ruihe Jiayuan, and Pingle Avenue; pedestrians and vehicles are requested to please pass carefully. We kept both posts. If the content of two or more posts was the same, we kept only one post. In total, we obtained 4451 Weibo posts that were successfully attributed to urban flood deposits. Some examples are shown in Table 1.
2.1.4 Selection of negative samples
The positive samples were exactly those posts that included both locations and waterlogging. The negative samples consisted of all remaining posts, including those irrelevant to waterlogging keywords as well as the posts with waterlogging keywords but without specific locations in the text. For example, the posts that actually discussed diseases, such as hydrocephalus, knee dropsy, and so on, were regarded as negative samples.
In addition, it is worth noting that a huge number of posts irrelevant to waterlogging actually included a lot of location names, and these posts were used as negative samples to train the classifier. So, we believed that the classifier could actually learned the waterlogging-related features of posts. During the selection of negative samples, the positive samples were excluded. Finally, we built a training data set that includes 4451 positive samples (labeled as 1) and 246 341 negative samples (labeled as 0).
2.2 Extract feature vectors and construct training set
To train a text classifier, it is necessary to transform a Weibo post, which typically is strings of words, into a feature vector suitable for classification tasks. The first step of preprocessing Weibo posts included Chinese-word segmentation and removal of stop words. Thereafter, we constructed a bag of words by extracting unique words in the training set and then built feature representations of each Weibo post based on word vector space and word2vector model.
2.2.1 Data preprocessing
Because the Sina Weibo posts are written in Chinese, the text does not have a natural separator between words. Therefore, it is necessary to perform Chinese-word segmentation on Weibo posts, which is actually a basic process in Chinese natural language processing. We used the Jieba tool to segment words of Weibo posts.
There were many common auxiliary words, prepositions, and so on in Chinese,
such as “![]() ” (of) and “
” (of) and “![]() ” (in), which should be removed with the help of a dictionary of stop words. In the word-base retrieval system, words with high frequency but without retrieval significance are determined as stop words. We completed this task by exploiting the stop word list released by the Harbin Institute of Technology (Guan et al., 2017), which is a widely used stop word catalogue. Also, many words were useless to our task but
appeared in the Weibo posts, such as “
” (in), which should be removed with the help of a dictionary of stop words. In the word-base retrieval system, words with high frequency but without retrieval significance are determined as stop words. We completed this task by exploiting the stop word list released by the Harbin Institute of Technology (Guan et al., 2017), which is a widely used stop word catalogue. Also, many words were useless to our task but
appeared in the Weibo posts, such as “![]() ” (video), “
” (video), “![]() ” (Weibo), etc. These words were also added to the stop word dictionary so as to remove such words from the Weibo posts. For example, for the sentence
“
” (Weibo), etc. These words were also added to the stop word dictionary so as to remove such words from the Weibo posts. For example, for the sentence
“ ” (There was heavy rain in Kunshan
yesterday; the new city domain was flooded, and the house prices
were more expensive than the surrounding flooded communities. It is really
naked irony!). After Chinese-word segmentation and removal of stop
words, the result was as follows: “
” (There was heavy rain in Kunshan
yesterday; the new city domain was flooded, and the house prices
were more expensive than the surrounding flooded communities. It is really
naked irony!). After Chinese-word segmentation and removal of stop
words, the result was as follows: “ ” (Kunshan | Yesterday | Heavy rain | New city | Domain | Flooded | House price | Than | Surrounding | Flooded | Community | Expensive | Naked | Irony).
2.2.2 Feature representation
The purpose of feature representation is to encode a numeric vector that represents the content of a Weibo post. We considered the two most popular methods, TF–IDF (term frequency–inverse document frequency) and word2vector. TF–IDF is the most popular term-weighting scheme for information retrieval and data mining. The word2vector models the context of words and the semantic relationship between words and context and maps words to a low-dimensional real-number space to generate the corresponding word vectors (Wang et al., 2018). This paper uses both TF–IDF and word2vector methods for feature representations of Weibo posts. TF–IDF was used to build feature vectors prepared for input into the SVM and GBDT classifiers, while word2vector was used for the RNN, SVM, and GBDT classifiers.
The TF–IDF scheme is a statistical method employed to evaluate the importance of a word in a document. TF is the word frequency, formally written as tf(t, d), which means the frequency of the term t appears in the document d and reflects the correlation between t and d. IDF is the inverse document frequency, formally written as idf(t), which represents the quantification of the term distributions in a collection of documents. The commonly used calculation method is , in which N represents the total number of documents, and nt represents the number of documents in which term t appears (Xiong et al., 2008). TF–IDF represents the importance of relevant terms in the document space. The calculation method is as follows (Salton and Buckley, 1998):
where w(t,d) represents the weight of term t in document d.
The larger the TF–IDF of a term, the higher the importance in the document. By calculating the TF–IDF value of each word in a Weibo post, we can construct a real-value vector representation of this post. This paper uses the TfidfVectorizer in the scikit-learn Python package to calculate the TF–IDF value of each word of Weibo posts. According to the TF–IDF value of words, the first 5000 words were selected to construct the dictionary, and subsequently each post was converted into a 5000-dimensional vector.
The word2vec model exploits the idea of deep neural networks to simplify the processing of text content into vector representation in a K-dimensional space, and the similarity in a vector space can be used to represent the semantic association between words (Mikolov et al., 2013). The word2vec model takes as its input a large corpus of text to produce a vector space and assigns each unique word a distributed representation in the space.
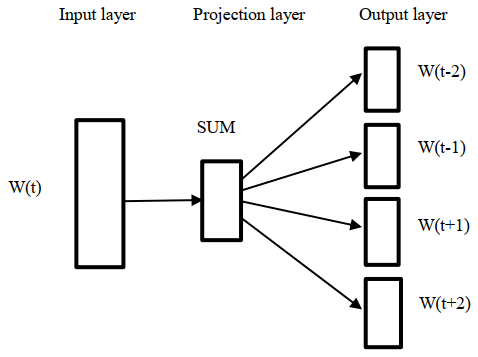
We used the Gensim library (Gensim, 2020), which takes as input the urban-waterlogging-related Weibo posts, to train a 100-dimensional word2vector model with the skip-gram to obtain the vector representation of each word. The structure of the skip-gram model is shown in Fig. 2. Its underlying rationale is to predict the context given a certain word. The specific calculation method is
where Wt is the current word, and c is the size of the window. After learning with a large corpus of Weibo posts, the weights were the corresponding vector representation for each word to train the RNN model (Feng and Sester, 2018).
2.2.3 Undersampling
Our whole data set contains 246 341 negative samples and 4451 positive samples. As the number of negative samples intensively surpasses that of positive samples in the training data set, the imbalance often leads to an ill-structured decision boundary of classification that is overwhelmed by the majority class and ignores the minority class (Chawla et al., 2004). For example, in a case of an imbalance level of 99, a classifier that minimizes the error rate would decide to classify all examples into the majority class to achieve a low error rate of 1 %, but in fact all minority examples are misclassified. Therefore, the imbalance problem must be handled carefully to build a robust classifier in a problem with a large degree of imbalance (Liu et al., 2008).
We adopted the undersampling technique to reduce the number of examples belonging to the majority class with the objective of equalizing the number of examples of each class (García and Herrera, 2009). The undersampling is done by using a third-party Python package imblearn. The RandomUnderSampler function in the imblearn package implements bootstrap sampling by setting the parameter replacement to true. This function randomly removes samples in the original data set with multiple classes to build a balanced subset of the whole samples. In particular, we considered the negative samples to be the majority class and the positive samples to be the minority class. We used the undersampling method to resample the same number of negative samples as positive samples and then combined them to create a balanced data set to train the classification model. The undersampling process was repeated enough times to ensure that every sample would be seen by the classifier.
2.3 Training of classifiers
We tested three popular models, including the recurrent neural network (RNN), support vector machine (SVM), and gradient boosting decision tree (GBDT), using both TF–IDF features and distributed representation derived from the word2vector algorithm.
2.3.1 Recurrent neural network (RNN)
In natural language processing, the recurrent neural network is the most commonly used method. A recurrent neural network (RNN) is used to process sequential data, which takes sequence data as input and performs recursion in the evolution direction of the sequence, and all nodes (recurrent units) are connected by chain. The recurrent neural network and its unfolding structure are shown in Fig. 3 (LeCun et al., 2015). The RNN introduces a directional loop to pass down the parameters of the hidden-layer state St−1 at the previous moment and calculate the hidden state St at the next moment so as to achieve the persistence of information and solve the problem of association between the input information before and after (Liu et al., 2018).
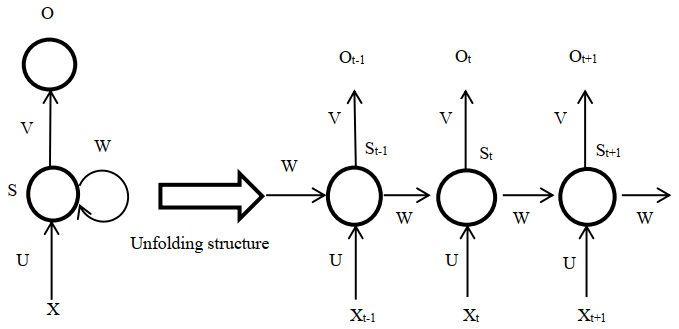
As shown in Fig. 3, X is the input layer, O is the output layer, and S is the hidden layer. V, W, and U are the weights of the input layer, hidden layer, and output layer, respectively, and t is the number of calculations for the tth time. Calculating the hidden state for the tth time is done as follows:
In this way, the current hidden-layer calculation results and the current input are related to the previous hidden-layer calculation results, and the purpose of the memory function is achieved.
Unfortunately, it is difficult for the RNN model to learn long-distance correlation information in a sequence, which will affect the classification effect. Therefore, this paper adopts the improved RNN model by the long short-term memory (LSTM) network. The LSTM (Hochreiter and Schmidhuber, 1997) is a special RNN that can learn long-distance-dependent information. The key design of the LSTM is the “gate” structure, through which information is removed or added to the cell state, thereby updating the hidden-layer state of each layer. In this paper, we use the improved RNN model by the LSTM to replace each hidden layer with a cell that has a memory function. The LSTM has great advantages in processing time series and language text sequences (Niu et al., 2018). The network structure of the LSTM is shown in Fig. 4.
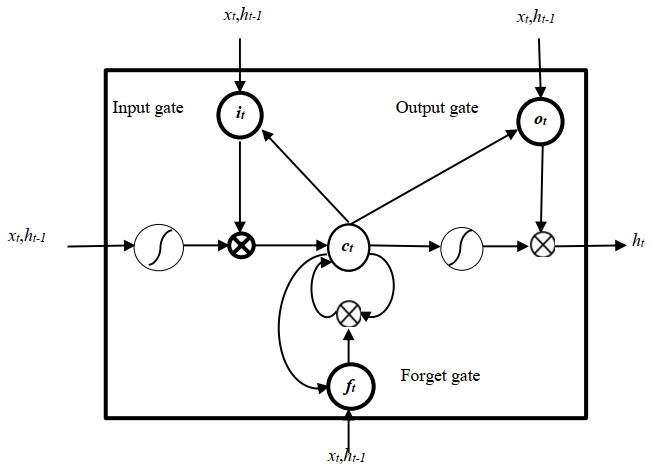
Each unit of the LSTM model is composed of the input gate i, the output gate o, the forget gate f, and the internal-memory unit c. Through these three thresholds, the internal memory can be selectively input, passed, and forgotten, which can effectively overcome the problem of gradient disappearance (Li and Chen, 2018). Intuitively, the forget gate controls the amount of each unit of the memory cell that is erased, the input gate controls how much each unit is updated, and the output gate controls the exposure of the internal-memory state (Liu et al., 2016). The hidden state of the LSTM model at time t is as follows:
where σ(⋅) denotes the sigmoid activation function; ⊗ denotes element-wise multiplication; W* and U* are the weight matrix in the network; b* is the bias term; and it, ot, and ft are the values of the input gate, output gate, and forget gate at time t, respectively (Li and Chen, 2018).
During the experiments, the input layer of the RNN model imported the word vector representation matrix of the words in the sentence. For example, there are n words in a microblog post, the dimension of the word vectors is k, and the size of the input matrix is n×k. Then the “gate” structure of the LSTM model removes or adds information to the cell state of the network to update the hidden state of each layer. The hidden state is input to the softmax layer, and next to output the final classification results are output, thereby realizing text classification.
2.3.2 Support vector machine
The support vector machine (SVM) classifier is widely used to solve two-category problems. The SVM model is defined as a linear classifier with the largest interval in the feature space. Its basic idea is to find the classification hyperplane that can divide the training data set correctly and has the largest geometric interval (Tan and Ding, 2008). The SVM model is suitable for classification in high-dimensional space and has a good performance on small-size data sets.
2.3.3 Gradient boosting decision tree
The gradient boosting decision tree (GBDT) is a boosting algorithm proposed by Friedman (2000) in 2001. The GBDT is an iterative decision tree algorithm, which is composed of multiple decision trees, and the answers of all trees are added up to make the final decision. The model established each time is in the gradient descent direction of the previously established model loss function so that it performs better than traditional boosting algorithms, which reweight the correct and wrong samples after each round of training (Feng et al., 2017).
3.1 Confusion matrix
The confusion matrix, also known as the possibility table or error matrix, is a specific matrix used to present the visual effect map of the classifier performance. The rows represent the predicted values, whereas the columns represent the actual values. The categories used in analysis are false positive, true positive, false negative, and true negative. The structure of the confusion matrix is shown in Table 2.
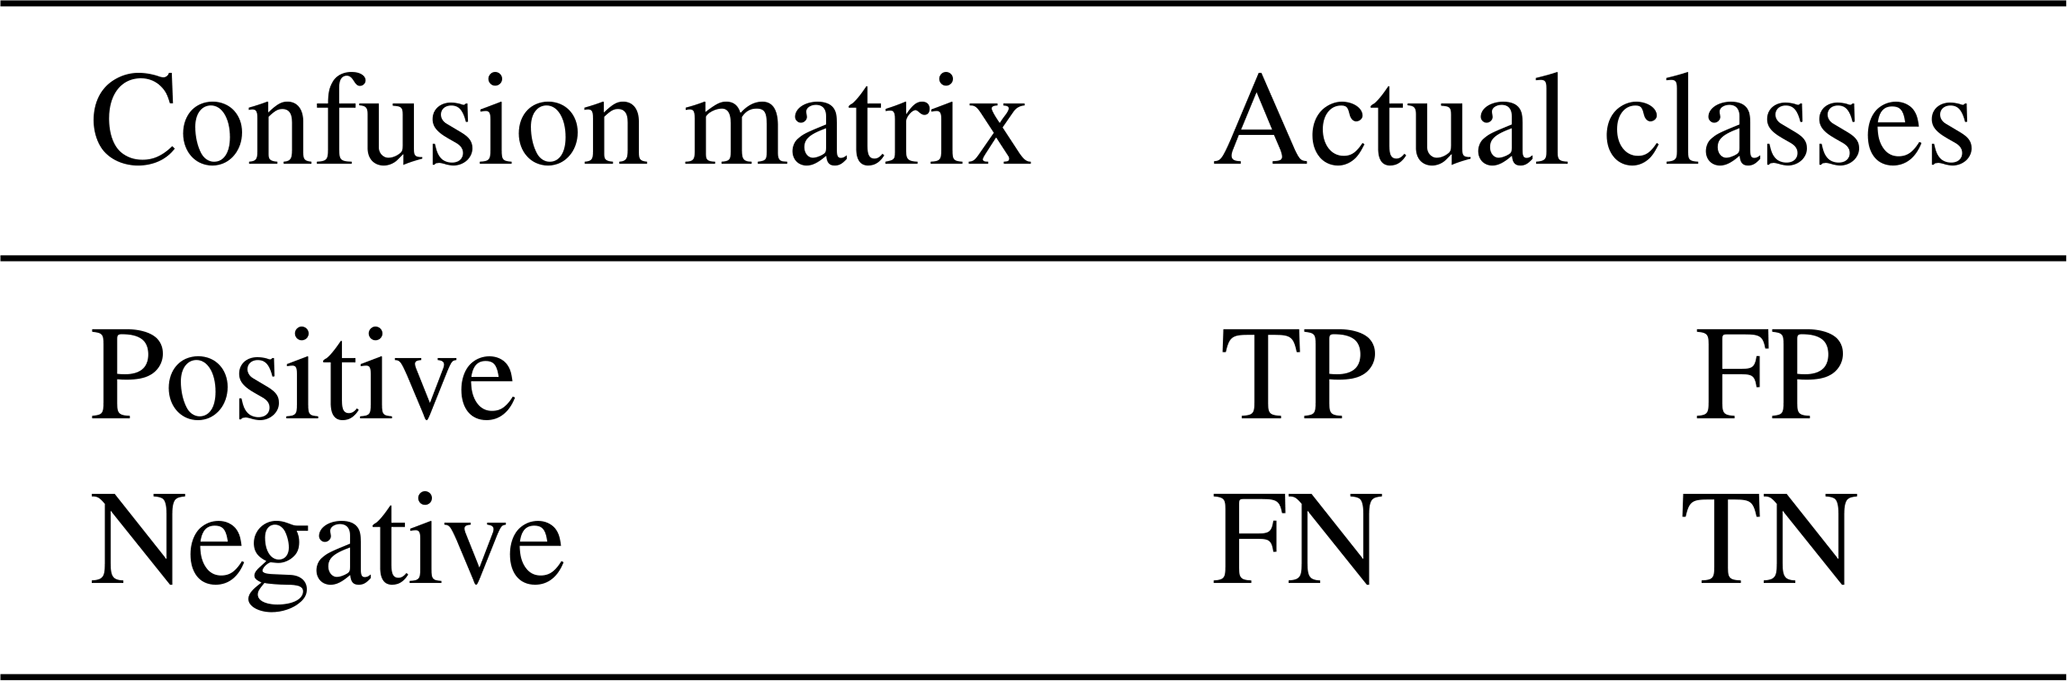
For example, a post reads as follows: “in the early hours of this morning, there was a heavy rain in Shenzhen. Many roads were flooded, and only the top of cars could be seen. Among them, the water at the bottom of the Hezhou bridge was serious, which caused the road to be interrupted.” TP means true positive: the truth is positive, and the classifier predicts a positive. For example, the bottom of the Hezhou bridge is flooded, and the classifier accurately reports this. TN means true negative: the truth is negative, and the classifier predicts a negative. For instance, the bottom of the Hezhou bridge is not flooded, and the classifier accurately reports this. FP means false positive: the truth is negative, but the classifier predicts a positive. For example, the bottom of the Hezhou bridge is not flooded, but the classifier inaccurately reports that it is. FN means false negative: the truth is positive, but the classifier predicts a negative. For example, the bottom of the Hezhou bridge is flooded, but the classifier inaccurately reports that it is not.
3.2 Hyperparameter optimization
When building a deep learning model, the selection of hyperparameters is very important. This paper uses a grid search to find the optimal hyperparameters of the RNN. The grid search is an optimization strategy by specifying parameter values of exhaustive enumerations to select optimal parameters. The hyperparameters to be selected include optimizer, batch size, keep probability, and so on. To reduce the computational overhead, we chose to fix other parameters and changed the parameter value for experimentation.
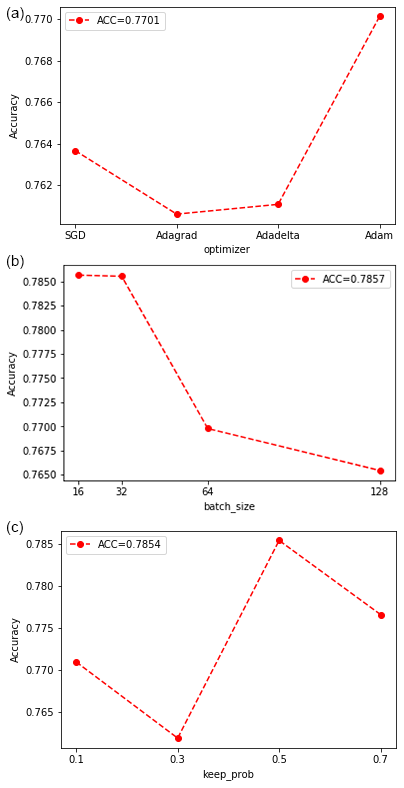
Figure 5Hyperparameter selection based on grid search: optimization function selection image (a), batch_size selection image (b), keep_probs selection image (c).
The optimizer is used to update weights when training a deep neural network. We tested several adaptive optimizers, including SGD, Adagrad, Adadelta, and Adam. As can be seen from Fig. 5a, the Adam optimizer achieved the highest accuracy, at 77 %. Therefore, we select Adam as the optimizer in the subsequent performance evaluation experiments.
Batch size represents the number of samples captured in one training round, and its value affects the training speed and model optimization. As shown in Fig. 5b, the accuracy of the RNN model is reduced but still remains above 0.76, with the batch size value ranging from 16 to 128. When the batch size is 16, the accuracy reaches the highest, at 0.7857. Therefore, the batch size is set to 16.
We adjusted the size of keep probability to prevent overfitting and improve the generalization ability of the model. As can be seen from Fig. 5c, when keep probability is equal to 0.5, the RNN model reaches the highest accuracy, at 0.7854. Therefore, the size of keep probability is set to 0.5.
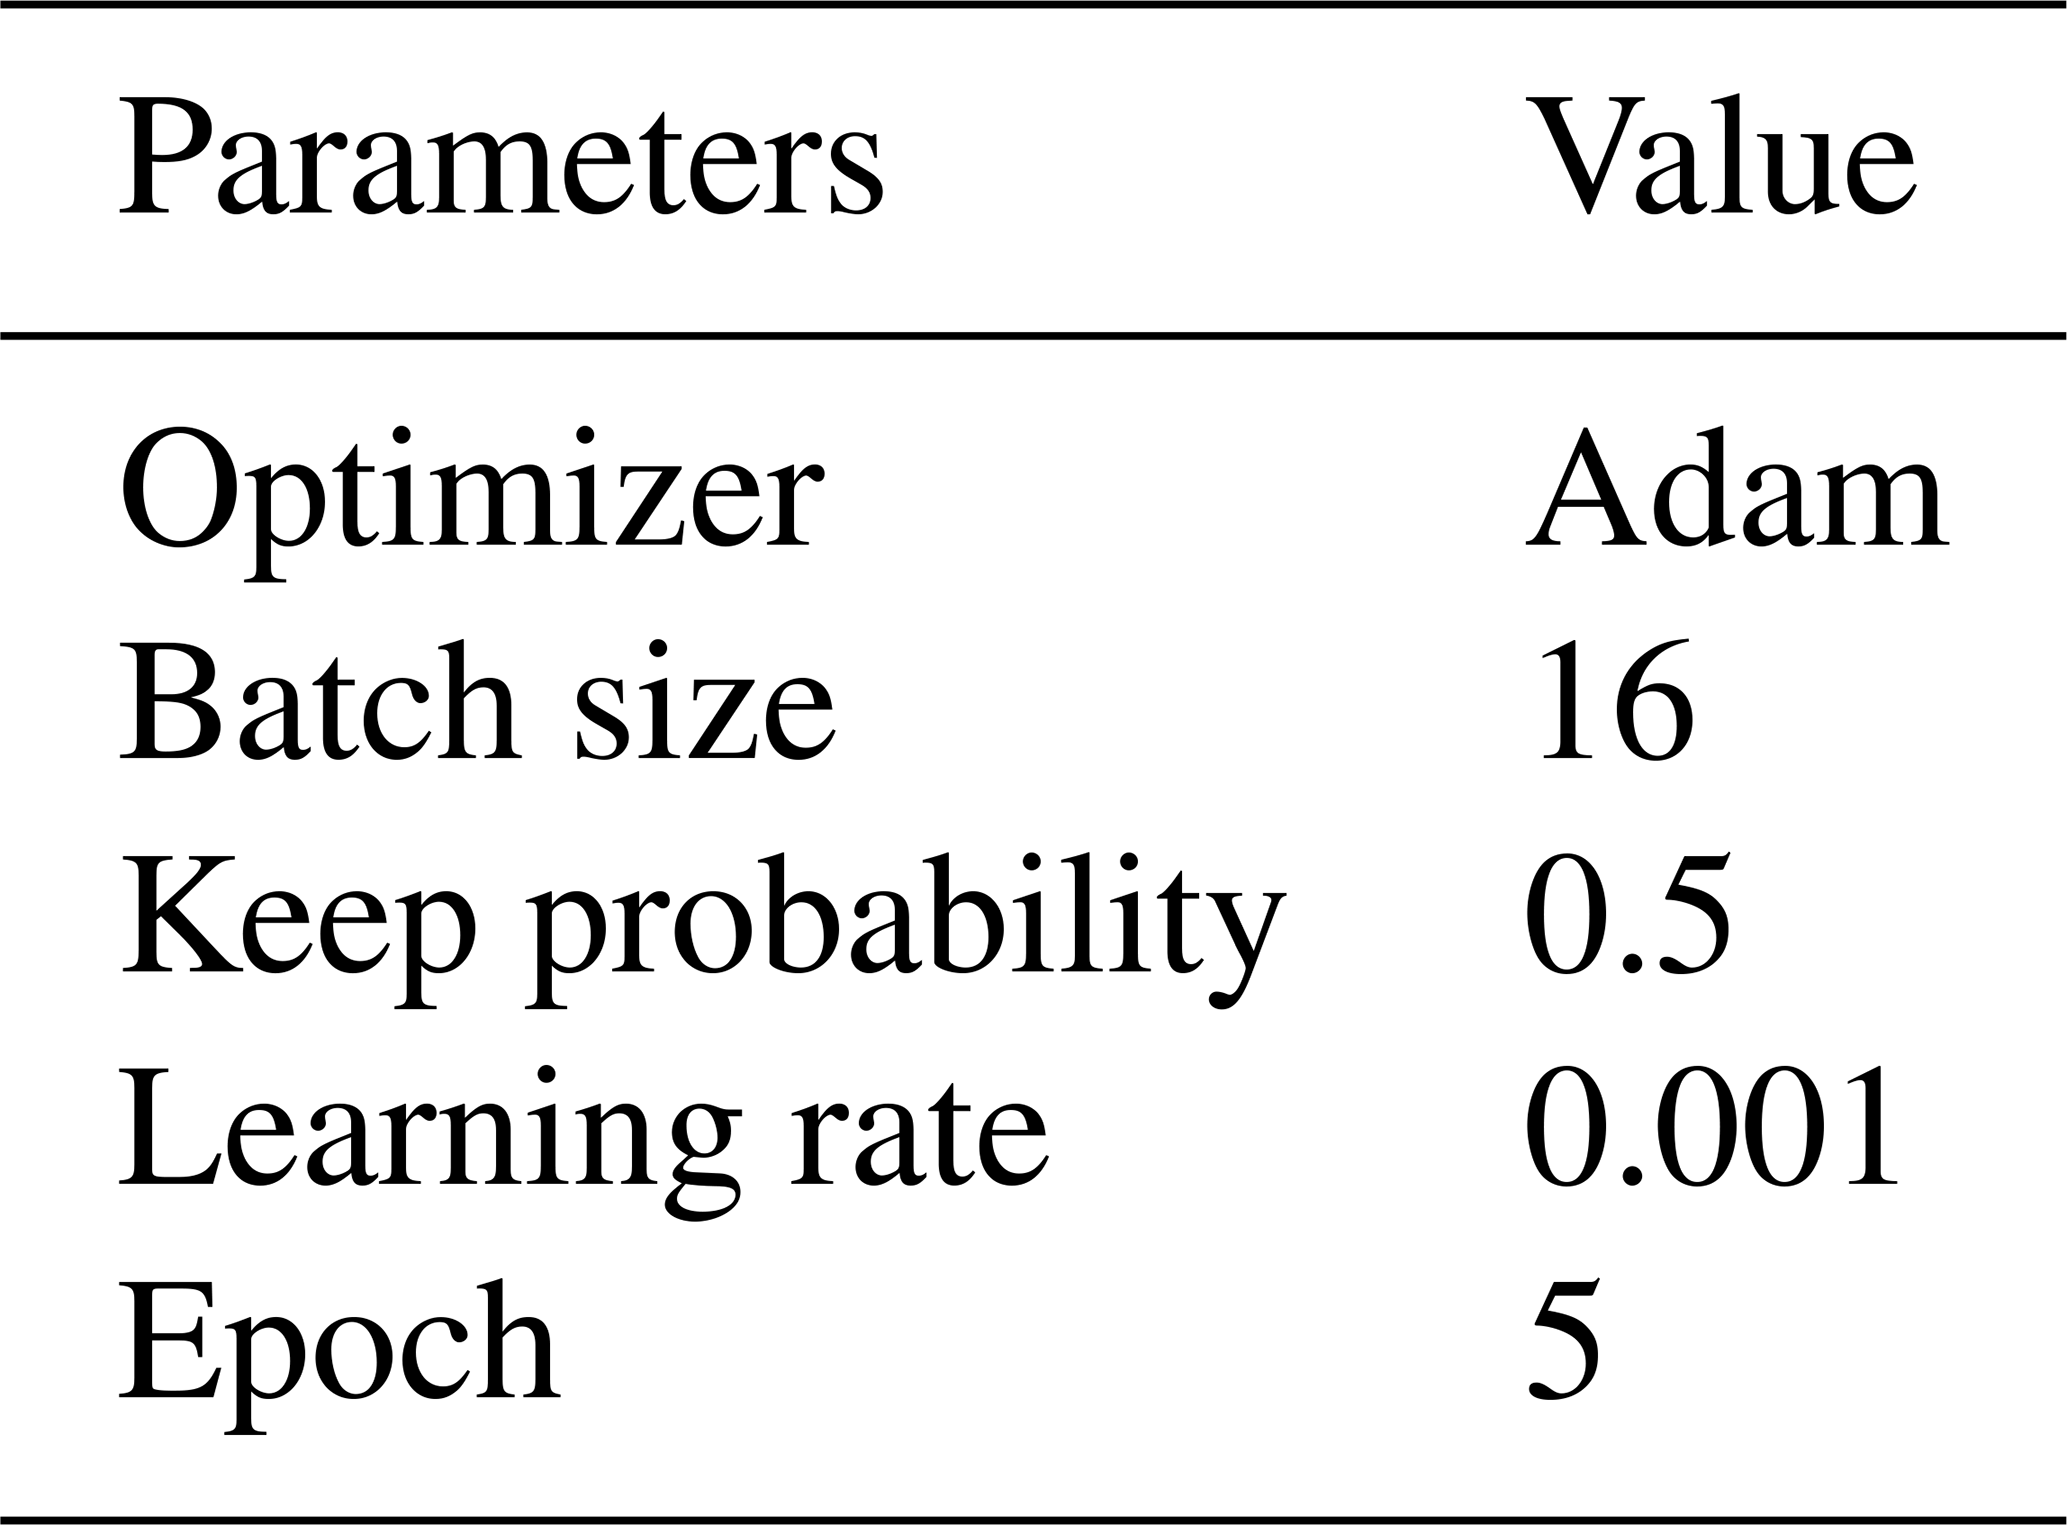
In addition, the learning rate and epoch are tuned to 0.001 and 5, respectively. The selection of important parameters is shown in Table 3.
3.3 Verification of flood deposits based on an AutoNavi waterlogging map
In cooperation with the Public Meteorological Service Center of the China Meteorological Administration, AutoNavi, a famous online map service provider in China, has released a nationwide map of urban waterlogging based on AutoNavi-inherent road and traffic data, and historical flood deposits reported by traffic police. The AutoNavi app visualizes the urban flood deposits that can be retrieved by users.
We collected the flood deposits on an AutoNavi waterlogging map, including the degree of floods and the latitude and longitude of each flood deposit. Next, we selected the flood deposits in Nanjing city on an AutoNavi waterlogging map to check how many of the flood deposits identified from Weibo posts overlapped.
4.1 Performance measures
We adopted a variety of measures to evaluate the performance of our proposed method, including accuracy (ACC), precision (P), recall (R), and F1 measure (F1). The receiver operating characteristic (ROC) curves and area under curve (AUC) were also used as criteria for performance evaluation. The accuracy (ACC) is defined as the ratio of the correctly classified samples to the total number of samples as in Eq. (4). The precision (P) represents the proportion of positive samples that are correctly classified to the total number of positive samples as in Eq. (5). The recall (R) is expressed as the ratio of the correctly classified negative samples to the total number of negative samples as in Eq. (6). F1 measure (F1), also referred to as F1 score, represents the harmonic mean of precision and recall as in Eq. (7) (Tharwat, 2018). The higher the value of F1, the better the performance of the method. The ROC curve is a graphical plot that illustrates the diagnostic ability of a binary classifier system as its discrimination threshold is varied. The curve is created by plotting the true-positive rate (TPR) against the false-positive rate (FPR) at various threshold settings (Receiver, 2020). The AUC metric calculates the area under the ROC curve (Tharwat, 2018). The higher the AUC value, the better the performance (Yu and Zhai, 2014).
4.2 Performance evaluation
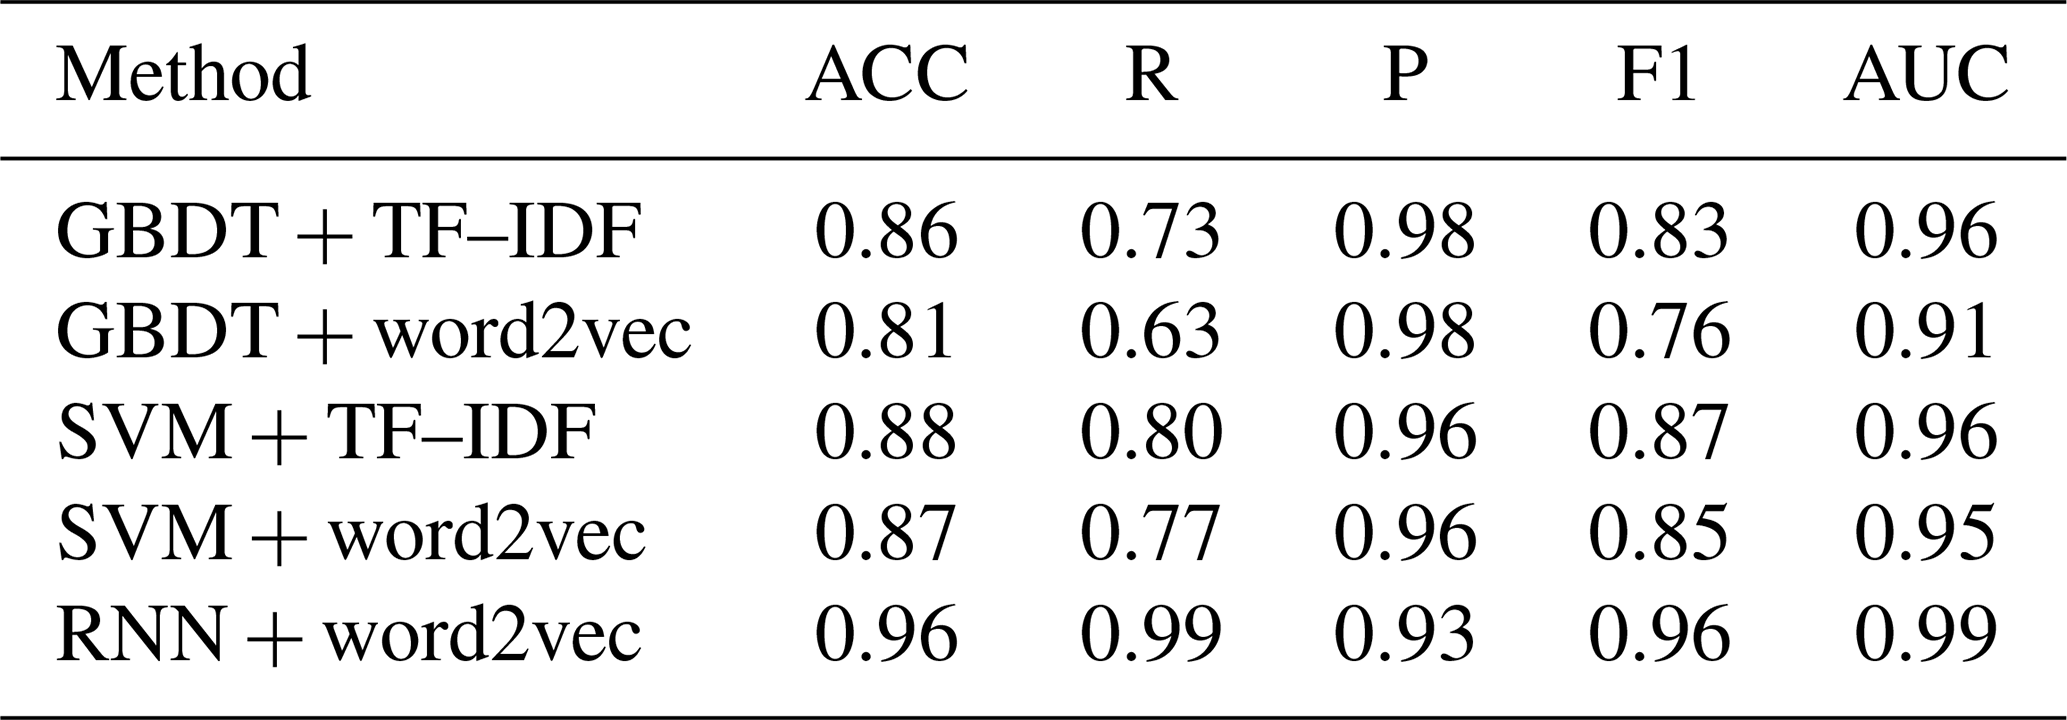
4.2.1 Performance evaluation of validation set
We tested two types of feature representations, TF–IDF and word2vec, on three classifiers, including the SVM, GBDT, and RNN. Note that the RNN model cannot be applied to TF–IDF feature representation as its input requires sequences. A total of 200 samples were randomly selected from the positive and negative sample sets, respectively, as the validation set (400 samples in total), and the remaining samples were used as the training set. The performance measures were computed based on the predicted result of the validation set by learned models. The process was repeated 50 times, and the averages were reported as the final performance measures.
As shown in Table 4, the RNN classifier based on word2vec feature representation achieved the best performance. The accuracy, recall, and F1 value of this model reach above 96 %, and the AUC value also achieves 0.99, indicating that the RNN is an effective model for online classification of waterlogging-related posts. According to the experimental results, it is found that the RNN model based on word2vec features performs generally better than traditional classifiers, such as GBDT + TF–IDF (ACC = 0.86), GBDT + word2vec (ACC = 0.81), SVM + TF–IDF (ACC = 0.88), and SVM + word2vec (ACC = 0.87).
Table 4Validation set results of the SVM, GBDT, and RNN models.
4.2.2 Performance evaluation of independent set
To further verify the effectiveness of the RNN model, we built an
independent test set to evaluate the model. The independent test set
contains 400 Weibo posts (200 positive and negative, respectively) of 2019.
These posts were downloaded using the keywords “![]() ” or “
” or “![]() ” (drowning
and waterlogging in Chinese) and then manually checked. Each trained model
was performed on the certain independent test set, and the performance
measures were computed, as shown in Table 5 and Fig. 6. The RNN model
based on word2vec features significantly outperforms all other models and
achieves the highest accuracy, recall, and F1 values. It also has achieved the
largest AUC value, at 0.95.
” (drowning
and waterlogging in Chinese) and then manually checked. Each trained model
was performed on the certain independent test set, and the performance
measures were computed, as shown in Table 5 and Fig. 6. The RNN model
based on word2vec features significantly outperforms all other models and
achieves the highest accuracy, recall, and F1 values. It also has achieved the
largest AUC value, at 0.95.
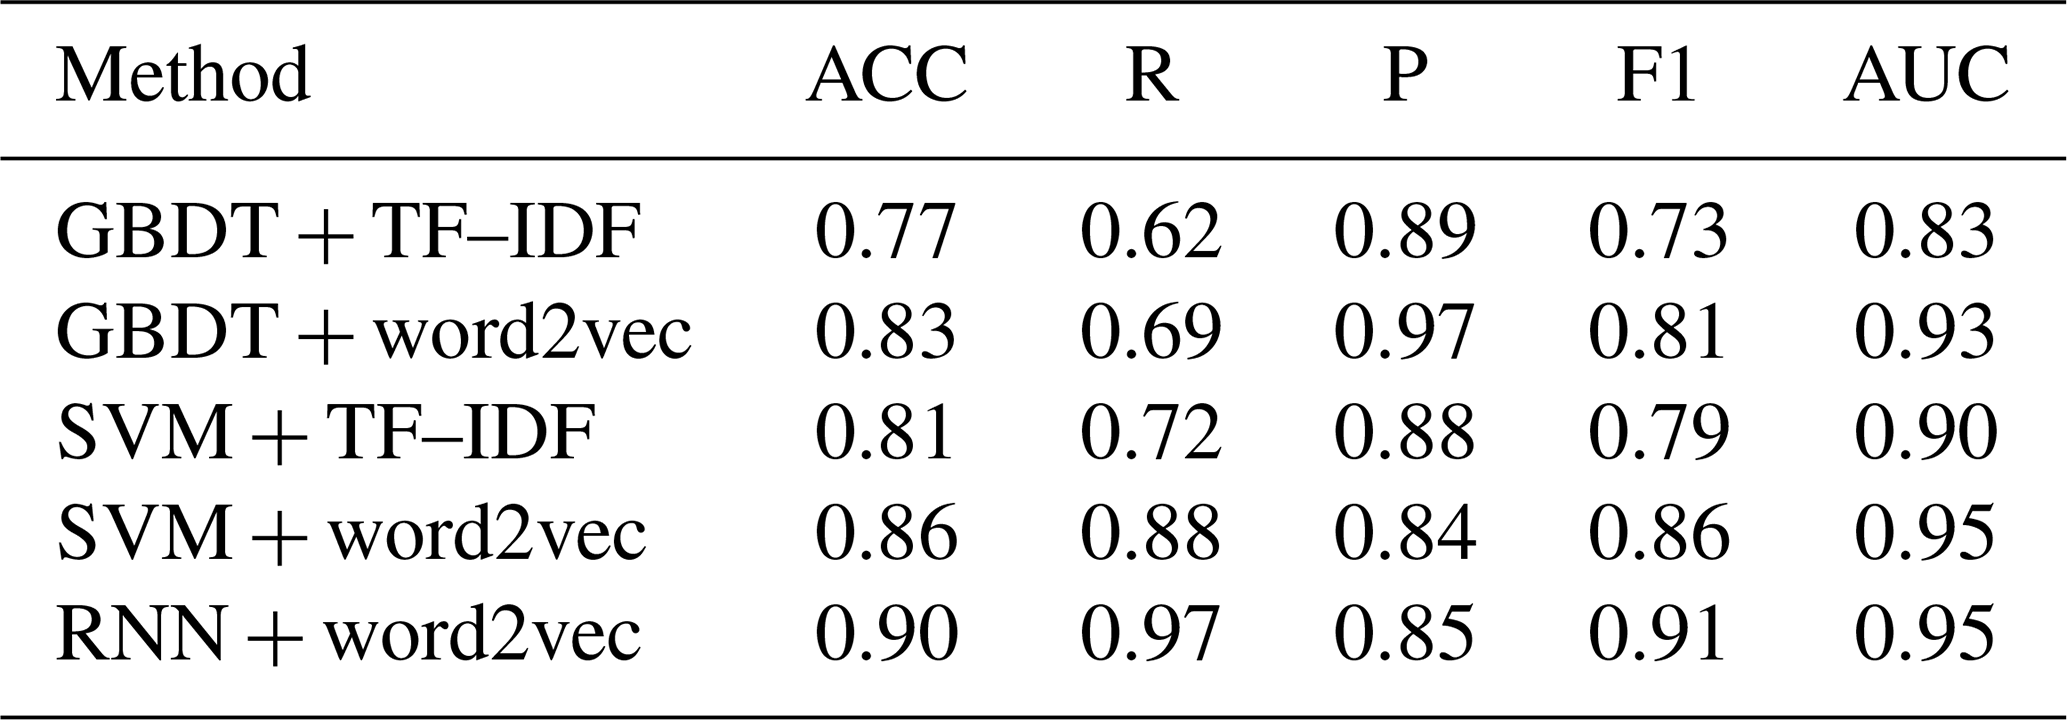
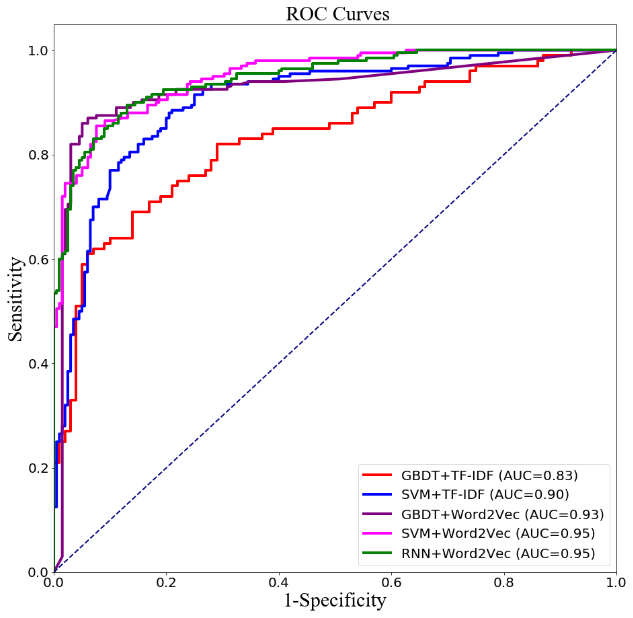
Furthermore, it can also be seen that the word2vec feature representation effectively improves the performance of text classification models in the independent test data set. This shows that the word vectors generated by the word2vec model are more informative than traditional TF–IDF in expressing the features of microblogging posts related to urban waterlogging. For both the GBDT and SVM, the models trained on word2vec features obtained better performance in the independent test data set compared to those trained on TF–IDF. In fact, we find similar results in Table 4; RNN + word2vec obtained the best performance, followed by SVM + word2vec.
4.3 Verification based on an AutoNavi waterlogging map
We collected 1660 flood deposits from an AutoNavi waterlogging map and found 75 flood deposits located in Nanjing city. Among the 165 flood deposits in Nanjing derived from Weibo posts of 2017–2018, there were 18 overlapped points on the AutoNavi waterlogging map. Figure 7 shows these overlapped flood deposits.
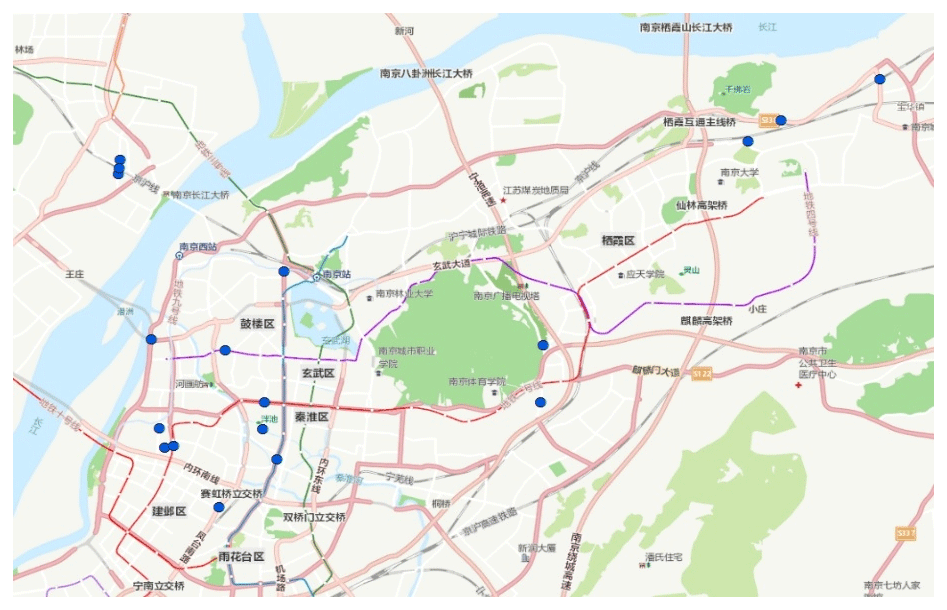
Figure 7Overlapping flood deposits in Nanjing (© Google Maps 2019).
To verify the effectiveness of our RNN model, we used the locations of these
18 overlapped flood deposits as keywords, such as “![]() ” (Bisheng Road),
to retrieve posts from Sina Weibo and obtained more than 800 microblogging posts,
among which only 29 posts were really related to these flood deposits.
Taking all these posts as input, the trained RNN model achieved 0.836
accuracy. This experiment confirmed that the RNN model proposed in this
paper can be applicable for online monitoring of urban waterlogging. It is especially worth noting that the AutoNavi waterlogging map is no longer
updated. There is a pressing demand to propose a new monitoring system for
urban waterlogging.
” (Bisheng Road),
to retrieve posts from Sina Weibo and obtained more than 800 microblogging posts,
among which only 29 posts were really related to these flood deposits.
Taking all these posts as input, the trained RNN model achieved 0.836
accuracy. This experiment confirmed that the RNN model proposed in this
paper can be applicable for online monitoring of urban waterlogging. It is especially worth noting that the AutoNavi waterlogging map is no longer
updated. There is a pressing demand to propose a new monitoring system for
urban waterlogging.
4.4 Nationwide map of urban waterlogging
We built a nationwide waterlogging map with more than 6000 flood deposits based on microblogging data from 2017 to 2018, as shown in Fig. 8. The locations of these flood deposits were manually located. The map was generated by ArcGIS 10.6 software. The small black dots represent the flood deposits (as shown in Fig 8a), and orange dots represent the number of flood deposits within the province (as shown in Fig. 8b). For example, the more flood deposits in the province, the larger the orange points. We notice an overall correlation between the economic development and the number of urban flood deposits. We used the GDP of each province as its background color on the map; i.e., the higher the GDP, the darker the color. It can be seen that the provinces located in eastern and central regions are more developed than northeastern and western regions in China, as shown in Fig. 8b. Also, these regions have a higher population and higher internet penetration rates than other regions. Accordingly, we found that the number of flood deposits in the eastern and central provinces is larger than in northeastern and western provinces. This phenomenon may be caused by the rapid urbanization and ground hardening so that the water permeability is greatly reduced. The potential economic loss in developed areas is larger, and the real-time monitoring system for urban-waterlogging disasters is more important in developed areas. On the other hand, the new technology adoption is also a factor related to the size of the orange dot. For example, Nanjing, Jiangsu Province, has more than 200 posts every day, while Lhasa, Tibet Autonomous Region, has about 40 posts per day. When a flood occurs, people discuss more waterlogging-related content on Weibo, and we will collect more posts related to the waterlogging, which will lead to the orange dot being bigger. Therefore, the residents of the Nanjing area that discussed waterlogging via Weibo may make the orange dot bigger. However, it is worth noting that the new technology adoption itself is correlated to GDP.
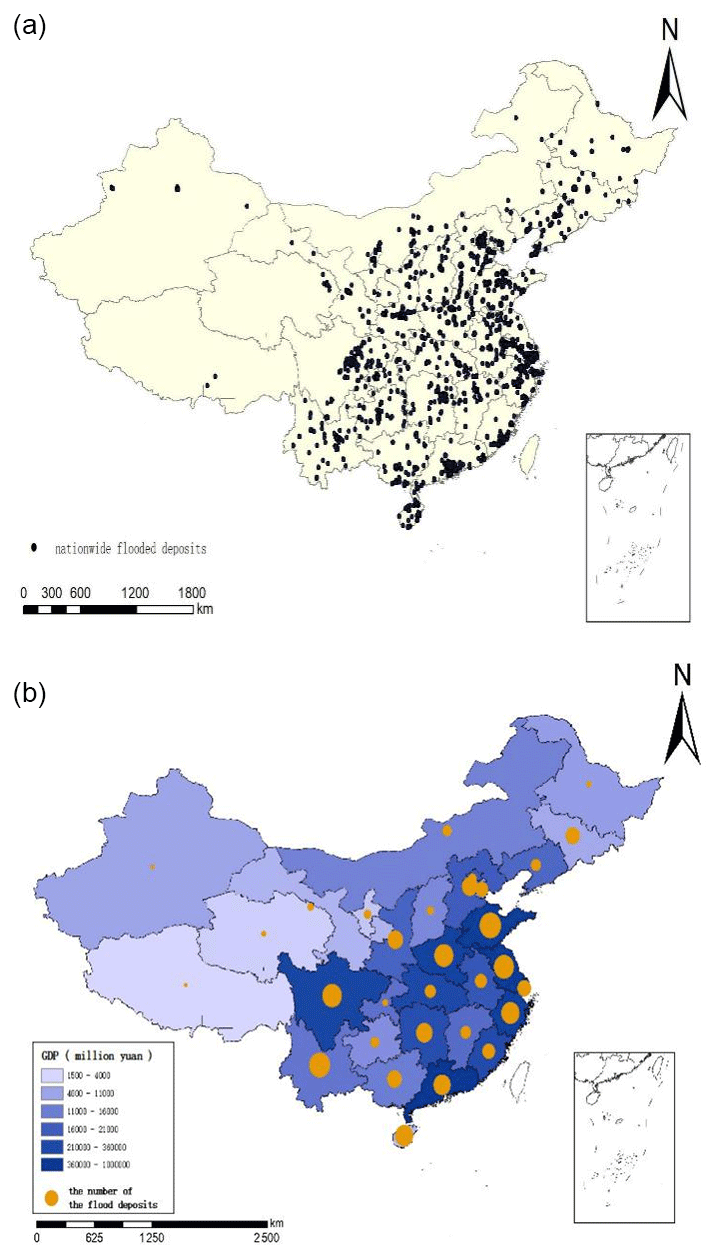
Figure 8Nationwide map of waterlogging: flood deposit image (a), image of the number of flood deposits (b).
4.5 Monitoring system based on the WeChat applet
To facilitate the usage of the nationwide map of urban waterlogging, we developed an applet based on WeChat, a popular mobile social app in China. With the help of WeChat's powerful web service capability and wide application, it is helpful for people to monitor the flood deposits. The applet visualizes all urban-waterlogging points on the map of China, as shown in Fig. 9. By clicking on a waterlogging icon, a pop-up dialog will display detail information on this urban waterlogging, such as the location description, longitude, and latitude. The applet runs a daemon monitoring process that computes the distance of the current position to waterlogging points nearby. In rainstorm weather, the applet would greatly benefit taxis and bus drivers. When a driver approaches a flood deposit, the applet will make a voice alarm, such as “warning, warning, waterlogging ahead”, to remind the driver that there is a flood deposit ahead to drive carefully.
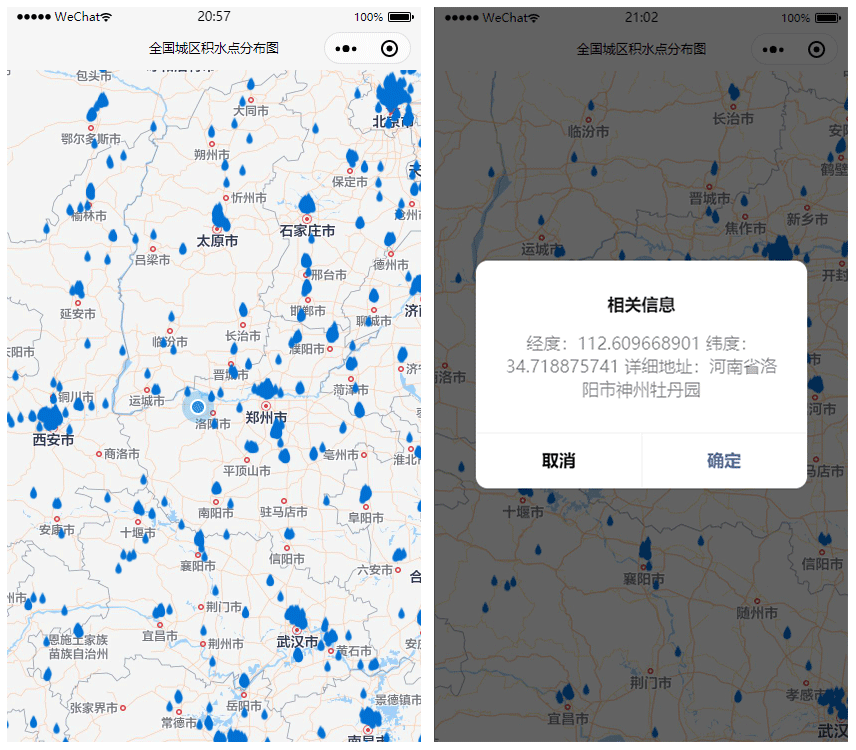
Figure 9Screenshots of the monitoring system based on the WeChat applet. (a) Nationwide map of urban waterlogging (© Tencent Maps) and (b) detailed information of one waterlogging point.
We trained text classification models to identify microblogging text related to urban waterlogging caused by flood disasters. By manually collecting more than 4400 waterlogging-related Weibo posts from 2017 to 2018, we built a gold-standard data set to evaluate three text classification models, including the RNN, SVM, and GBDT. Our empirical experimental results showed that the RNN model achieves higher accuracy than the other two classifiers in an independent test set. Also, we found that the feature representation extracted by word2vec could improve performance compared to traditional TF–IDF features. Furthermore, we built a nationwide map of urban waterlogging based on recent 2-year microblogging data and a monitoring system based on the WeChat applet that will alert the user via voice alarm when he or she approaches a waterlogging point.
The limitation of our study lies in the fact that the number of positive samples in the data set is relatively small. In future study, we will set about to extend the scale of the data set to build a predictive model with better performance. Meanwhile, we will consider other deep learning models, such as convolutional neural networks (CNNs), to further integrate remote sensing images and social media to improve the prediction of urban flood deposits and develop a more powerful monitoring system of urban waterlogging.
The source code and manually collected Weibo posts that report flood deposits can be download from https://doi.org/10.5281/zenodo.4646972 (Liu, 2021).
The supplement related to this article is available online at: https://doi.org/10.5194/nhess-21-1179-2021-supplement.
HL proposed the original idea. HL and YH designed and performed the experiments. WZ and HZ helped to process data sets. YH drafted the manuscript, and HL revised the manuscript. JT supervised this work. All authors have read and agreed to publish the paper.
The authors declare that they have no conflict of interest.
This research has been supported by the National Natural Science Foundation of China (grant no. 91846203) and the Graduate Research and Innovation Projects of Jiangsu Province (grant nos. KYCX20_2619 and KYCX20_2620).
This paper was edited by Philip Ward and reviewed by Jens de Bruijn and Valerio Lorini.
Anselmo, V., Galeati, G., Palmieri, S., Rossi, U., and Todini, E.: Flood risk assessment using an integrated hydrological and hydraulic modelling approach: a case study, J. Hydrol., 175, 533–554, https://doi.org/10.1016/S0022-1694(96)80023-0, 1996.
Barker, J., Barker, J. L. P., and Macleod, C. J. A.: Development of a national-scale real-time Twitter data mining pipeline for social geodata on the potential impacts of flooding on communities, Environ. Model. Softw., 115, 213–227, https://doi.org/10.1016/j.envsoft.2018.11.013, 2019.
Chawla, N., Japkowicz, N., and Kolcz, A.: Editorial: Special issue on learning from imbalanced data sets, ACM SIGKDD Explor., 6, 1–6, https://doi.org/10.1145/1007730.1007733, 2004.
Cheng, X., Han, G. F., Zhao, Y. F., and Li, L.: Evaluating social media response to urban flood disaster: Case study on an East Asian City (Wuhan, China), Sustainability, 11, 1–18, https://doi.org/10.3390/su11195330, 2019.
de Bruijn, J. A., de Model, H., Jongman, B., Wagemaker, J., and Aerts, J. C. J. H.: TAGGS: Grouping tweets to improve global geoparsing for disaster response, J. Geovisual. Spat. Anal., 2, 2, https://doi.org/10.1007/s41651-017-0010-6, 2018.
de Bruijn, J. A., de Model, H., Jongman, B., de Ruiter, M. C., Wagemaker, J., and Aerts, J. C. J. H.: A global database of historic and real-time flood events based on social media, Sci. Data, 6, 311, https://doi.org/10.1038/s41597-019-0326-9, 2019.
Feng, H., Li, M., Hou, X., and Xu, Z.: Study of network intrusion detection method based on SMOTE and GBDT, Appl. Res. Comput., 34, 3745–3748, https://doi.org/10.3969/j.issn.1001-3695.2017.12.051, 2017.
Feng, Y. and Sester, M.: Extraction of pluvial flood relevant volunteered geographic information (VGI) by deep learning from user generated texts and photos, ISPRS Int. J. Geo-Inf., 7, 39–64, https://doi.org/10.3390/ijgi7020039, 2018.
Friedman, J. H.: Greedy function approximation a gradient boosting machine, Ann. Stat., 29, 1189–1232, 2000.
García, S. and Herrera, F.: Evolutionary undersampling for classification with imbalanced datasets: Proposals and taxonomy, Evolution. Comput., 17, 275–306, https://doi.org/10.1162/evco.2009.17.3.275, 2009.
Gensim: Gensim topic modelling for humans: Word2vec embeddings, available at: https://radimrehurek.com/gensim/models/word2vec.html, last access: 4 September 2020.
Guan, Q., Deng, S., and Wang, H.: Chinese stopwords for text clustering: A comparative study, Data Anal. Knowled. Discov., 1, 72–80, 2017.
Hochreiter, S. and Schmidhuber, J.: Long short-term memory, Neural Comput., 9, 1735–1780, https://doi.org/10.1162/neco.1997.9.8.1735, 1997.
Hu, X., Liu, L., and Qiu, N.: A novel spam categorization algorithm based on active learning method and negative selection algorithm, Acta Electron. Sin., 46, 203–209, https://doi.org/10.3969/j.issn.0372-2112.2018.01.028, 2018.
Kang, A., Zhang, K., Liang, J., and Yan, B.: Applying the dynamic critical precipitation method for flash flood early warning, J. Environ. Stud., 28, 1727–1733, https://doi.org/10.15244/pjoes/83731, 2019.
Kim, Y.: Convolutional neural networks for sentence classification, in: Conference on Empirical Methods in Natural Language Processing, Doha, Qatar, 2014.
Kuklicke, C. and Demeritt, D.: Adaptive and risk-based approaches to climate change and the management of uncertainly and institutional risk: The case of future flooding in England, Global Environ. Change, 37, 56–68, https://doi.org/10.1016/j.gloenvcha.2016.01.007, 2016.
LeCun, Y., Bengio, Y., and Hinton, G.: Deep learning, Nature, 521, 436–444, 2015.
Li, S. and Chen, D.: Recurrent neural network using attention model for sentiment analysis, J. Huaqiao Univers. (Nat. Sci.), 39, 252–255, https://doi.org/10.11830/ISSN.1000-5013.201606123, 2018.
Liu, H.: hliu2016/waterlogging: urban waterlogging (Version v1.0), Zenodo, https://doi.org/10.5281/zenodo.4646972, 2021.
Liang, L.: Application of rising rate analysis method in flood warning and forecast, Guangxi Water Resour. Hydropow. Eng., 2, 29–32, https://doi.org/10.16014/j.cnki.1003-1510.2019.02.008, 2019.
Liang, Z., Tang, T., Li, B., Wang, J., and Hu, Y.: Research and application of comprehensive evaluation method for flood early warning, Yellow River, 41, 82–86, 2019.
Lima, C., Lall, U., Troy, T. J., and Devineni, N.: A climate informed model for nonstationary flood risk prediction: Application to Negro River at Manaus, Amazonia, J. Hydrol., 522, 594–602, https://doi.org/10.1016/j.jhydrol.2015.01.009, 2015.
Liu, P., Qiu, X., and Huang, X.: Recurrent neural network for text classification with multi-task learning, Computer Science, arxiv: preprint, available at: https://arxiv.org/abs/1605.05101 (last access: 29 July 2020), 2016.
Liu, T., Zhu, W., and Liu, G.: Advances in deep learning based on text classification, Elect. Power Inform. Commun. Tech., 16, 1–7, https://doi.org/10.16543/j.2095-641x.electric.power.ict.2018.03.000, 2018.
Liu, X. Y., Wu, J., and Zhou, Z. H.: Exploratory undersampling for class-imbalance learning, IEEE T. Syst. Man Cybernet. Pt. B, 39, 539–550, https://doi.org/10.1109/TSMCB.2008.2007853, 2008.
Mikolov, T., Chen, K., Corrado, G.,and Dean, J.: Efficient estimation of word representations in vector space, Computer Science, arxiv: preprint, available at: https://arxiv.org/abs/1301.3781 (last access: 13 May 2020), 2013.
Niu, C., Zhan, G., and Li, Z.: Chinese Weibo sentiment analysis based on deep neural network, Comput. Syst. Appl., 27, 205–210, https://doi.org/10.15888/j.cnki.csa.006645, 2018.
Receiver: Receiver operating characteristic: Receiver operating characteristic, available at: https://en.wikipedia.org/wiki/Receiver_operating_characteristic/, last access: 21 August 2020.
Robinson, B., Bai, H., Power, R., and Lin, X. G.: Research on social media disaster detection for Sina Weibo, in: International Symposium on Emergency Management 2014, 25 November 2014, Shenzhen, China, 2014.
Salton, G. and Buckley, B.: Term-weighting approaches in automatic text retrieval, Inform. Process. Manage., 24, 513–523, https://doi.org/10.1016/0306-4573(88)90021-0, 1998.
Singh, N., Roy, N., and Gangopadhyay, A.: Localized flood detection with minimal labeled social media data using transfer learning, arXiv: preprint, available at: https://arxiv.org/abs/2003.04973, last access: 15 June 2020.
Sofia, G., Roder, G., Dalla Fontana, G., and Tarolli, P.: Flood dynamics in urbanised landscapes: 100 years of climate and humans' interaction, Sci. Rep., 7, 40527, https://doi.org/10.1038/srep40527, 2017.
Tan, G. and Ding, H.: Improvement of SVM method in text categorization, Inform. Technol., 1, 83–85, 2008.
Tawatchai, T. and Mohammed, F. K.: Flood hazard and risk analysis in the southwest region of Bangladesh, Hydrol. Process., 19, 2055–2069, https://doi.org/10.1002/hyp.5666, 2005.
Tharwat, A.: Classification assessment methods, Appl. Comput. Inform., 17, 168–192, https://doi.org/10.1016/j.aci.2018.08.003, 2018.
Wadawadagi, R. and Pagi, V.: Disaster severity analysis from micro-blog texts using Deep-NN, Evolution in Computational Intelligence, Springer, Singapore, 1176, 145–157, https://doi.org/10.1007/978-981-15-5788-0_14, 2020.
Wang, H., Yang, L., and Lin, H. F.: Hot event analysis of Japan earthquake on microblog, J. Chinese Inform. Process., 26, 7–14, 2012.
Wang, J., Luo, L., and Wang, D.: Research on Chinese short text classification based on Word2Vec, Comput. Syst. Appl., 27, 209–215, 2018.
Wheater, H. and Evans, E.: Land use, water management and future flood risk, Land Use Policy, 26, 251–264, https://doi.org/10.1016/j.landusepol.2009.08.019, 2009.
Xiao, Z., Liang, Z., Li, B., Hu, Y., and Wang, J.: New flood early warning and forecasting method based on similarity theory, J. Hydrol. Eng., 24, 04019023, https://doi.org/10.1061/(ASCE)HE.1943-5584.0001811, 2019.
Xiong, Z., Li, G., Chen, X., and Chen, W.: Improvement and application to weighting terms based on text classification, Comput. Eng. Appl., 44, 187–189, 2008.
Yu, H. and Zhai, H.: Applying a subspace clustering algorithm in multi-label text classification, Comput. Appl. Softw., 31, 288–303, 2014.
Yu, W., Nakakita, E., Kim, S., and Yamaguchi, K.: Improvement of rainfall and flood forecasts by blending ensemble NWP rainfall with radar prediction considering orographic rainfall, J. Hydrol., 531, 494–507, https://doi.org/10.1016/j.jhydrol.2015.04.055, 2015.
Zhang, Y. and Wang, J. C.: On the problems and countermeasures of government information release mechanism in emergency – based on the case study of 2015 Shanghai Bund Stampede Incident, J. Intellig., 34, 111–117, 2015.