the Creative Commons Attribution 4.0 License.
the Creative Commons Attribution 4.0 License.
 | 15 Mar 2021
Flood risk assessment of the European road network
Kees C. H. van Ginkel
Francesco Dottori
Lorenzo Alfieri
Luc Feyen
Elco E. Koks
River floods pose a significant threat to road transport infrastructure in Europe. This study presents a high-resolution object-based continental-scale assessment of direct flood risk of the European road network for the present climate, using high-resolution exposure data from OpenStreetMap. A new set of road-specific damage functions is developed. The expected annual direct damage from large river floods to road infrastructure in Europe is EUR 230 million per year. Compared to grid-based approaches, the object-based approach is more precise and provides more action perspective for road owners because it calculates damage directly for individual road segments while accounting for segment-specific attributes. This enables the identification of European hotspots, such as roads in the Alps and along the Sava River. A first comparison to a reference case shows that the new object-based method computes realistic damage estimates, paving the way for targeted risk reduction strategies.
- Article
(5490 KB) - Full-text XML
-
Supplement
(40905 KB) - BibTeX
- EndNote


River flooding is among the most damaging natural hazards in Europe. Following disruptive and costly European floods in the year 2000 and between 2009 and 2014, significant advances in continental-scale (and global-scale) flood risk modelling have been made (Dankers and Feyen, 2008; Hirabayashi et al., 2013; Kundzewicz et al., 2017; Ward et al., 2013). Although these models provide good estimates of total damage to all land use types, they do not accurately represent damage to transport infrastructure (Jongman et al., 2012; Bubeck et al., 2019). Flood damage to road infrastructure is still an underexplored yet important issue (Doll et al., 2014; Merz et al., 2010; Koks et al., 2019). Road flood damages have two dimensions: direct–indirect and tangible–intangible. Direct tangible damage includes clean-up and repair of the physical road assets and traffic management systems, damage to (parked) vehicles, and costs of evacuation and rescue operations; direct intangible damage includes fatalities, injuries, and inconvenience; indirect tangible damage includes damage for companies (and society) suffering from delayed freight and persons and associated shifts in economic input and output; indirect intangible damage includes societal disruption and undermined trust in public authorities (Jonkman et al., 2008). Previous studies have shown that transport infrastructure significantly contributes to direct tangible flood losses, usually in the order of 5 %–10 % but in exceptional cases up to 50 %–60 % (Bubeck et al., 2019; Jongman et al., 2012). At the same time, transport disruptions are an important source of indirect economic effects through passenger and cargo delay costs, which may exceed the direct costs (Pregnolato et al., 2019). Furthermore, the accessibility of the road network during flood events is of crucial importance to evacuations and therefore in avoiding casualties (Sohn, 2006). Vehicle-related drowning is the most frequent cause of death during flood disasters (Jonkman and Kelman, 2005). This study not only focuses on improving the estimates of direct physical asset damage to road infrastructure but also paves the way for assessment of indirect effects on the continental scale.
Existing continental-scale river flood risk studies do not accurately represent damage to road networks for several reasons. First, these studies are typically grid-based. Damage in a grid cell is determined using a depth–damage curve based on the land use and flood depth in each grid cell. In these grid-based approaches, infrastructure damage is typically determined using the (potential) percentage of infrastructural land use per grid cell in land cover maps such as CORINE (Coordination of Information on the Environment) or LUISA (Land Use-based Integrated Sustainability Assessment) (Büttner et al., 2014, Rosina et al., 2018). However, transport network infrastructure such as roads and railways are (relatively narrow) line elements and take up only a small percentage within a typical grid size for continental-scale modelling (e.g. 100×100 m2 in Europe). As these (assumed) percentages are often applied uniformly among the same land use type, this may result in an overestimation of infrastructure damage when there in reality is no infrastructure, but it may be an underestimation if the infrastructure is there but is not enough to be the dominant land use type. Second, little progress has been made in research on transport-specific damage functions (Hackl et al., 2016), and there is very limited reported data on road damage from flooding. Many studies have pointed out that research on flood vulnerability is underdeveloped (Dottori et al., 2018a), with high associated uncertainty (de Moel and Aerts, 2011) stressing the need for improved vulnerability methods (Winsemius et al., 2013), especially for infrastructure (Jongman et al., 2012). To date, virtually all European-wide flood risk studies (Bouwer et al., 2018; Dottori et al., 2020; Lincke et al., 2019) still rely on the comprehensive set of damage curves proposed by Huizinga (2007), which were developed for (coarse) grid-based assessments but lack detail for accurate assessment of damage to road networks (Jongman et al., 2012).
Previously, the grid-based approach could be justified by incomplete continental-scale object-based exposure datasets and insufficient computational power for a more detailed approach. Object-based transport infrastructure datasets such as OpenStreetMap (OSM) are now nearly complete – as of January 2016, most European countries had more than 95 % of their roads mapped in OSM (Barrington-Leigh and Millard-Ball, 2017). Also, computational power is no longer a limiting factor, allowing for large-scale high-resolution object-based modelling (Koks et al., 2019), which previously was limited to smaller scales, such as cities (Chang et al., 2010; Suarez et al., 2005). Object-based damage models, where the damage accounting takes place at the level of objects (in this case road segments), rather than grid cells, have substantial benefits compared to grid-based approaches. First, the geometric representations have a higher resolution, allowing for more accurate intersects between the exposed roads and the hazard data. Second, object-specific attributes can be used to make more accurate damage estimates (Merz et al., 2010). For example, for an intersect between the road network and an inundation map, it is crucial to differentiate an inundated road from a bridge over the water. The attributes also enable the development of different damage curves for different road types (e.g. motorway or rural road), which may have very different characteristics (e.g. number of lanes, width, quality, and maintenance standards). Third, the network properties of roads, enabling graph representations, can be maintained in an object-based approach (Gil and Steinbach, 2008). This enables the study of direct infrastructural flood damage in coherence with other sources of impacts, such as travel delay times from road closures and detours, as well as indirect economic losses from passenger or freight delays.
Koks et al. (2019) proposed a method to study the impacts of climate hazards to road (and rail) infrastructure on the global scale, using data from OSM. The analysis in this global, multi-hazard study used highly stylized damage functions and had to take several assumptions due to information gaps in data-scarce parts of the world. In Europe, object attribute data availability is more complete, allowing for a more detailed approach in this study. Based on an extensive review of road (re)construction costs in Europe, we developed new damage curves by utilizing the available data on road type, number of lanes, and the presence of street lighting. Also, we benefit from the higher resolution of flood protection and GDP (gross domestic product) data in Europe. The increased level of detail allows for presenting the results on the level of individual road segments for hotspot identification. This meets the need of European road owners for GIS-aided (geographic information system) vulnerability assessments, for which guidelines have been provided in the ROADAPT (Roads for today adapted for tomorrow) project (Bles et al., 2016) but where actual modelling has so far focussed on small spatial scales (e.g. Hackl et al., 2018).
This study introduces an object-based, continental-scale assessment of large-scale river flood risk of the European road network for the present climate. We introduce new damage functions for the object-based approach and compare it to a grid-based approach. To illustrate the richness of the object-based approach, flood hotspots will be identified within the European motorway network. The model results are compared to damage reported for a real flood event near Deggendorf, Germany.
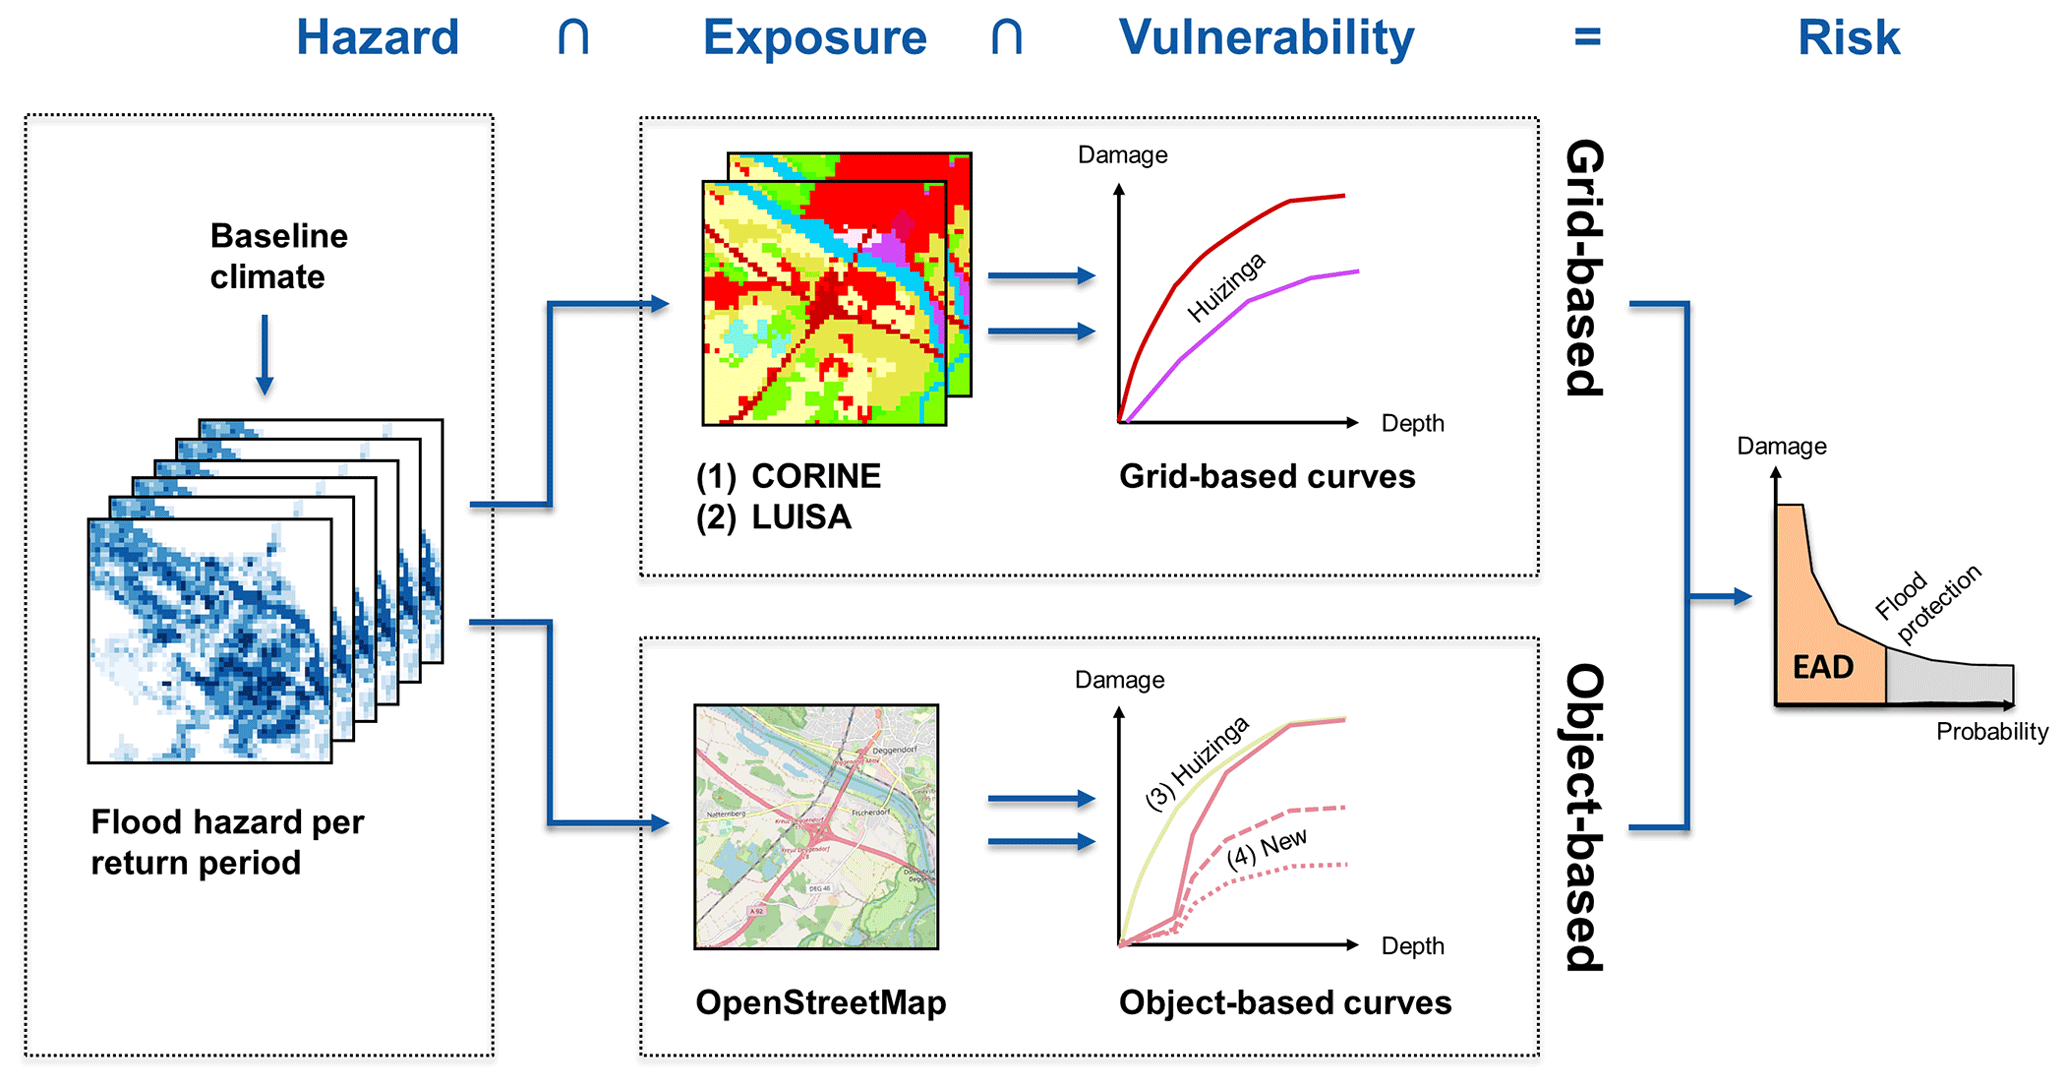
Figure 1Graphical representation of the risk assessment using the grid-based approach (top row) with the (1) CORINE and (2) LUISA land cover grids and the object-based approach (bottom row) with OpenStreetMap and (3) the Huizinga damage curve and (4) a set of new damage curves © OpenStreetMap contributors 2019. Distributed under a Creative Commons BY-SA License.
Flood risk is commonly defined as a function of flood hazard, exposure, and vulnerability (Kron, 2005; Peduzzi et al., 2009). In this study, these components are modelled in three blocks (Fig. 1). Hazard data are taken from the Joint Research Centre's inundation maps of large river floods in Europe (Fig. 1, left). The hazard maps are inputs to two approaches that model exposure and vulnerability: the grid-based approach (Fig. 1, top) and the object-based approach using OSM (Fig. 1, bottom). In total, four combinations of exposure and vulnerability are used to calculate the risk.
The grid-based approach is as follows:
- 1
CORINE land cover and the Huizinga infrastructure damage curve
- 2
LUISA land cover and the Huizinga infrastructure damage curve.
The object-based approach is as follows:
- 3
OpenStreetMap and object translation of the Huizinga infrastructure damage curve
- 4
OpenStreetMap and new object-based damage curves.
These four combinations are selected to enable a comparison between the grid-based and object-based approaches, for (1) a land cover grid with poor representation of the road network, (2) a land cover grid with the road network explicitly added to the grid, (3) an object-based approach with the damage curves of the grid-based approach, and (4) an object-based approach with new damage curves. In the remainder of this section, we introduce the flood hazard maps (Sect. 2.1), the grid-based approach (Sect. 2.2), the object-based approach (Sect. 2.3), the development of new damage curves (Sect. 2.4), the sampling procedure (Sect. 2.5), and the reference case (Sect. 2.6).
2.1 Flood hazard
Flood hazard is represented with a set of inundation maps taken from Alfieri et al. (2015), with a recent update by Dottori et al. (2021a), which cover most of the European domain at a grid resolution of 100 m. We provide here a brief description of the inundation maps, noting that no new work was done in the present study to modify these data. The dataset consists of six raster maps of inundation depth corresponding to flood return periods of 10, 20, 50, 100, 200, and 500 years, assuming no flood protection in place (flood protection is considered in the risk assessment step, Fig. S1). These maps represent the inundation depth and extent in all river sections with an upstream area larger than 500 km2. They do not include the effect of pluvial and coastal flooding. They also do not include river and flash flooding in the most upstream catchments, with an upstream area smaller than 500 km2. Inundation maps were produced by merging the results of thousands of 2D hydraulic simulations along the European river network, based on the hydrodynamic model LISFLOOD-FP (Bates et al., 2010). The input hydrographs of flood simulations were defined consistently with the peak discharges and flow duration curves of a 25-year-long simulation taken from the European Flood Awareness System (Thielen et al., 2009) and based on the hydrological model LISFLOOD (Van der Knijff et al., 2010). Additional details on the methods and models used to produce the maps are described in Alfieri et al. (2014, 2015) and in Dottori et al. (2021a), together with some skill assessment of the simulated maps versus official flood maps for different European countries and river basins.
2.2 Grid-based exposure and vulnerability
In the grid-based approach, two different land cover maps are used: CORINE 2012 (version 18.5) and LUISA (version 2). They indicate the dominant land use type in each 100×100 m2 grid cell. The CORINE land cover map (Büttner et al., 2014) and its predecessors have been used in many European flood risk studies (e.g. Alfieri et al., 2018; Lugeri et al., 2010; Serinaldi and Kilsby, 2017). CORINE, however, overlooks most of the road network (Rosina et al., 2018) because even large motorways typically cover less than 50 % of a 100×100 m2 grid cell (see Fig. S2). Therefore, roads have been manually added to the land cover map in some studies (e.g. Jongman et al., 2012; cf. Meneses et al., 2019). The LUISA land cover map is a spatial and thematic refinement of CORINE 2012 using various additional data sources, such as rasterized-object datasets (Rosina et al., 2018). Therefore, motorways and trunk roads that were absent in CORINE are now present in LUISA as coarse grid representations of the original lines. However, due to the 100×100 m2 resolution of the grid, the actual road width is overestimated in most areas (Fig. S2).
To correct for the underrepresentation of infrastructural land use (and other land use types) in CORINE and LUISA, they assume for each land use class some percentage of infrastructure (Tables S1 and S2). This assumption follows from Huizinga's suggestion (2007, p. 22 of chap. 2) to map the damage functions to CORINE using a cross-tabulation by the EEA (2006), which then became the default implementation method. To enable a comparison with the object-based approach, we only consider the percentage of infrastructure per land use class, whereas the contributions of the other damage curves are ignored (Tables S1 and S2). An implication of these percentages is that, although motorways and trunk roads are mostly missing in CORINE, damage for (local) roads in urban and industrial areas (amongst others) is still calculated, albeit without any explicit spatial reference to the actual road position but rather based on their average presence in these land use types. Also, note that in the land cover category “road and rail networks and associated land”, only a 27 % infrastructural land use is assumed (Tables S1 and S2), which to some extent corrects the overestimation of the actual road widths in LUISA. In summary, the grid-based land cover category “road and rail networks and associated land” roughly corresponds to the object-based road types “motorway” and “trunk road”, and the infrastructure percentages in the other grid-based land cover categories roughly correspond to the object-based road types “primary”, “secondary”, “tertiary”, and “other road”.
2.3 Object-based exposure and vulnerability
This section details the set-up of the object-based model (Sect. 2.3.1) and the application of the Huizinga reference curve (Sect. 2.3.2) in the object-based approach.
For hydrological reasons, the analysis includes the 27 member states of the European Union (EU) (excluding Cyprus and Malta); the United Kingdom and the European Free Trade Association countries of Liechtenstein, Norway, and Switzerland (not Iceland); and the (potential) candidate countries of Albania, Montenegro, North Macedonia, and Serbia (not Turkey). We excluded the EU's remote overseas areas such as the Azores, the Canary Islands, and Guadeloupe as well as small islands.
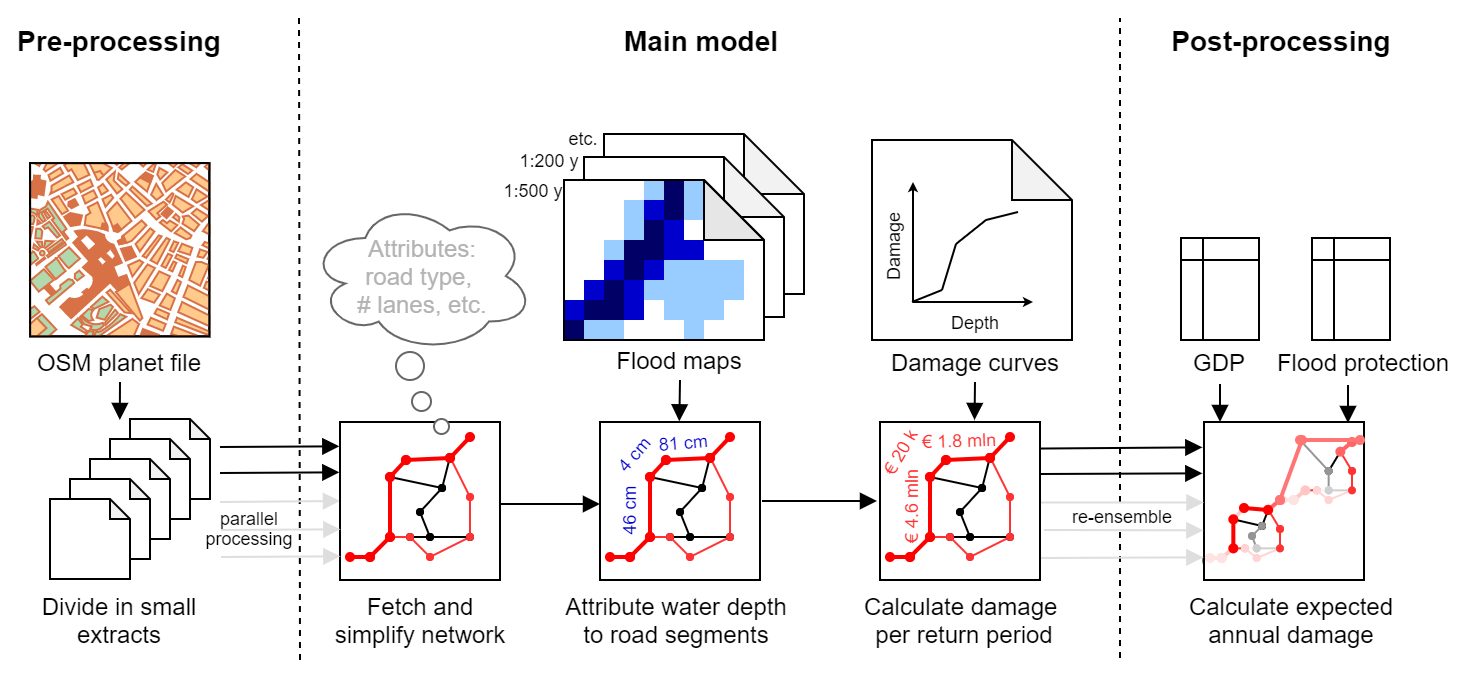
2.3.1 Model set-up
In the object-based approach, all individual OSM road segments are intersected with the flood hazard data, followed by a damage and risk calculation per inundated segment (Fig. 2). To perform this analysis using parallel processing (Fig. 2), the continental OSM “planet” file is subdivided into 1498 regions, based on the European NUTS 3 (Nomenclature of Territorial Units for Statistics; Nomenclature des unités territoriales statistiques) division. Per region, every road segment's geometry is simplified to 0.00005∘ resolution (∼5 m in Europe) and intersected with the flood hazard maps per return period to determine the inundated length and average depth over the inundated part of the segment. Then, the damage to the road segment is calculated for the applicable damage curves. In the post-processing step, the expected annual damage (EAD) is calculated using the trapezoidal rule (Olsen et al., 2015), accounting for flood protection (Fig. S1). In detail, this approach assumes no inundation for return periods of the discharge peaks smaller than that of the flood protection in the same area, while it considers the unprotected inundation maps (Sect. 2.1) for any larger peak (Fig. S1). We used flood protection data developed by Dottori et al. (2020) which integrates the available information on design standards of flood protection (e.g. through technical reports) with modelled protection standards calculated by Jongman et al. (2014) and Scussolini et al. (2016). Modelled data are selected according to observed and simulated historical flood loss data. In this step, the maximum damage per segment is corrected by linearly scaling the national to the average real GDP per capita of the former EU-28 (European Union with 28 member states; Eurostat, 2019); see Sect. S8 for an example.
Where available, OSM attributes on road type, number of lanes, bridges, and lighting is used to improve the damage estimates. Six road types are distinguished following the OSM tagging convention: motorway, trunk, primary, secondary, tertiary, and other roads (Table S3). Lane data are available for 90 % of the motorways, 60 % of the trunks, 48 % of the primary roads, 23 % of the secondary roads, and less than 5 % of the tertiary and other roads; where unavailable, the countries' median number of lanes per road type is used. For road–water intersections tagged as bridges, no damage to the road is calculated. We acknowledge that bridge failure can be an important source of flood damage (Lamb et al., 2019; Pregnolato, 2019; Vennapusa et al., 2013). Bridge damage, however, does not usually originate from the inundation of the roadway but rather from scour hole formation to bridge piles and its foundation (Lamb et al., 2019), which cannot be accurately represented in our model.
2.3.2 The Huizinga reference curve
A comprehensive set of depth–damage curves has been proposed by Huizinga et al. (2017) and Huizinga (2007), which has been applied in many studies (e.g. Albano et al., 2017; Amadio et al., 2016, 2019; Carisi et al., 2018; Dottori et al., 2018b; Jongman et al., 2012; Prahl et al., 2018). We use the “EU-average curve” for road infrastructures (Huizinga, 2007). This curve is normally applied in grid-based approaches (see Sect. 2.2), but to enable a comparison to our newly developed curves, we also made an object-based translation of the Huizinga curve, by multiplying the damage per square metre by typical widths of roads in Europe (Table S4).
2.4 New damage curves
The new damage curves cover several aspects of the direct tangible costs. It includes clean-up costs, resurfacing of top and deeper asphalt layers, repairs of road embankments, and where applicable also the repair of electronic signalling and lighting. It includes neither structural damage to bridges and tunnels nor emergency response costs such as the placement of sand bags or signposting of traffic diversions.
To construct the new damage curves, multiple steps are taken. First, we compile an overview of road construction costs, from which we derive a cost bandwidth per OSM road type (Tables S5–S7). Expert judgement is used to construct a coherent system of absolute cost values, ratios between the different road types, and a scale factor for roads with more or less than the default number of lanes, while accounting for differences in national real GDP per capita. Second, an inventory is created consisting of road clean-up, repair, and reconstruction costs expressed as percentages of the road construction costs of the first step (Table S8). Third, repair activities are linked to the road repairs needed following a river flood, derived from the literature and photo imagery of river floods in Europe. Fourth, the repair activities and corresponding damage percentages (percentage of construction costs) are fitted to the depth–damage curves. These depth–damage curves with corresponding narratives are verified in expert workshops with flood risk and transport modelling experts and experts from the Dutch road operator (see Acknowledgements). An overview of the damage curves and supporting narratives (reasoning from the road construction and maintenance costs presented below) is given in Figs. S3 and S4 and Tables S9 and S10.
2.4.1 Background data: road construction and repair costs
All costs mentioned in this and the following subsections are linearly scaled using national real GDP per capita (Eurostat, 2019) to represent the average 2015 price levels in euros (EUR) of the former EU-28. The model inverses this operation when doing the damage calculation to tailor the damage to the local context. This is common practice in pan-European flood risk studies (e.g. Alfieri et al., 2016b; Arnell and Gosling, 2016; Ward et al., 2013) and enables comparison with existing studies.
The cost of constructing a new road depends on many factors, such as road design, accessories like lighting and electronic signalling systems, soil conditions, noise reduction elements, and presence of tunnels and bridges (e.g. Blanc-Brude et al., 2006). For motorways, the European Court of Auditors (ECA, 2013) estimates the EU-average construction costs at EUR 11.4 million per kilometre. The cheapest 2×2 lane motorways with fairly simple road designs are about EUR 3.5 million per kilometre; the most expensive roads with tunnels, bridges, or noise barriers cost about EUR 35 million per kilometre (ECA, 2013). Other studies report values well within this range (Carruthers, 2013; Federal Ministry of Transport and Digital Infrastructure, 2016; Heralova et al., 2014; Nijland et al., 2010; Pryzluski et al., 2012), as presented in Table S6. For costs of other road types see Table 1, which is based on literature tabulated in the Supplement (Tables S5–S7). For roads with more (less) than the default number of lanes, we added (subtracted) 25 % of costs for each lane, based on Table S5.
Table 1Road construction costs and maximum damage per road type, differentiated between low flow (low-flow velocities) and high flow (high-flow velocities). The values present the average for the former EU-28, in millions of euros (year 2015) per kilometre.
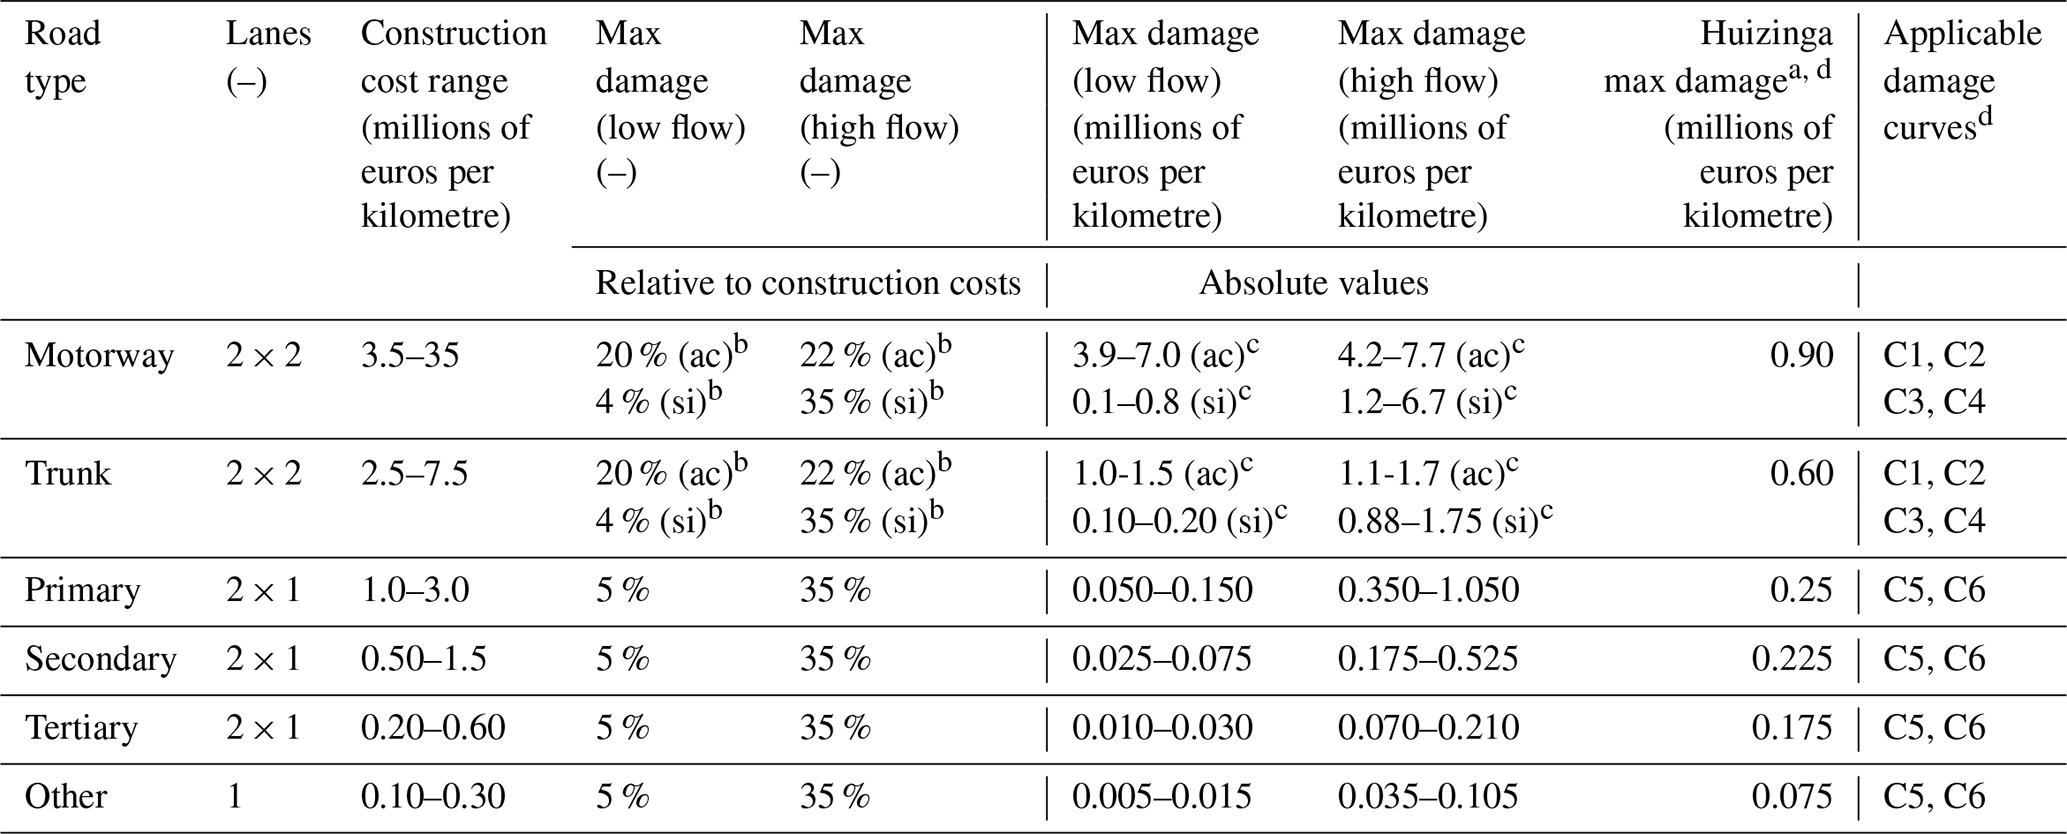
a Huizinga max damage costs (euros per kilometre) are obtained by multiplying the
costs per square metre with typical road widths per road type (Table S4).
b “ac” refers to a sophisticated road with accessories such as street lighting and
electronic signalling; “si” refers to a simple road without accessories.
c For accessories roads: 50 %–100 % of the construction cost range; for
simple roads: 0 %–50 % of the construction cost range.
d Huizinga max damage is to be combined with the Huizinga damage
function, not C1–C6.
We expressed road maintenance and repair costs as a percentage of the construction costs of the corresponding road type (Table S8). Clean-up activities and small repair works are in the order of a few percent of construction costs (Reese et al., 2003; Archondo-Callao, 2000). Larger-scale road improvement and resurfacing is in the order of 10 %, whereas major asphalt work and road reconstruction is in the order of 30 %–40 % of construction costs (Carruthers et al., 2013; Archondo-Callao, 2000).
2.4.2 Categories of damage curves
Continental-scale models typically work with functions relating damage to water depth only (Alfieri et al., 2016a; de Moel et al., 2015; Winsemius et al., 2013). Flow velocity, however, is at least as important as water depth for explaining damage to roads (Kreibich et al., 2009; Merz et al., 2010; Thieken et al., 2009). Under low-flow velocities (<0.2 m s−1), there is hardly any structural damage to pavements, whereas under high-flow velocities (>2.0 m s−1) there is most likely severe structural damage (Kreibich et al., 2009). Indeed, pictures of floods in Europe show that under very quiet flow conditions, a road can remain almost undamaged, whereas under flash floods with strong currents, complete reconstruction may be required. The flood hazard maps used in this study represent floods in rivers with an upstream area >500 km2, whereas large flow velocities are typically found in smaller water courses in steep upstream areas and locally, close to dike-break locations (de Moel et al., 2009). Therefore, we assume that the predicted floods have relatively low-flow velocities. We deal with the remaining uncertainty by estimating two depth–damage curves that span the uncertainty of this typical slow flow velocity; one for the low-flow estimate and one for high-flow estimate (i.e. the lower and upper boundary of the relatively slow velocity) that can be reasonably expected for large river floods.
The six new depth–damage curves differentiate between three dimensions: road type, road accessories, and flow velocity (Fig. 3). Concerning road type, motorways and trunk roads are distinguished from other roads because of higher driving speeds and maintenance standards, reflected in higher reconstruction costs. Also, these are often built on top of embankments so that relatively little damage occurs when the top of the road embankment is not yet reached, represented by a concave section in the beginning of curve C1–C4 (Fig. 4). The other road categories (primary, secondary, tertiary, and other roads) are usually not built on top of embankments, and their curves (C5 and C6) therefore do not have such a concave section. Next, motorways and trunk roads with sophisticated accessories such as electronic traffic management systems, lighting, and noise barriers (C1 and C2) are differentiated from simple roads without these accessories (C3 and C4). This represents the large spread in construction costs between simple and sophisticated motorways and trunk roads (Table S6) and the corresponding extra damage that may occur to the electronic signalling and lighting of sophisticated roads, even under low-flow conditions (Fig. 4). Finally, low-flow conditions (C1, C3, and C5) are distinguished from high-flow conditions (C2, C4, and C6).
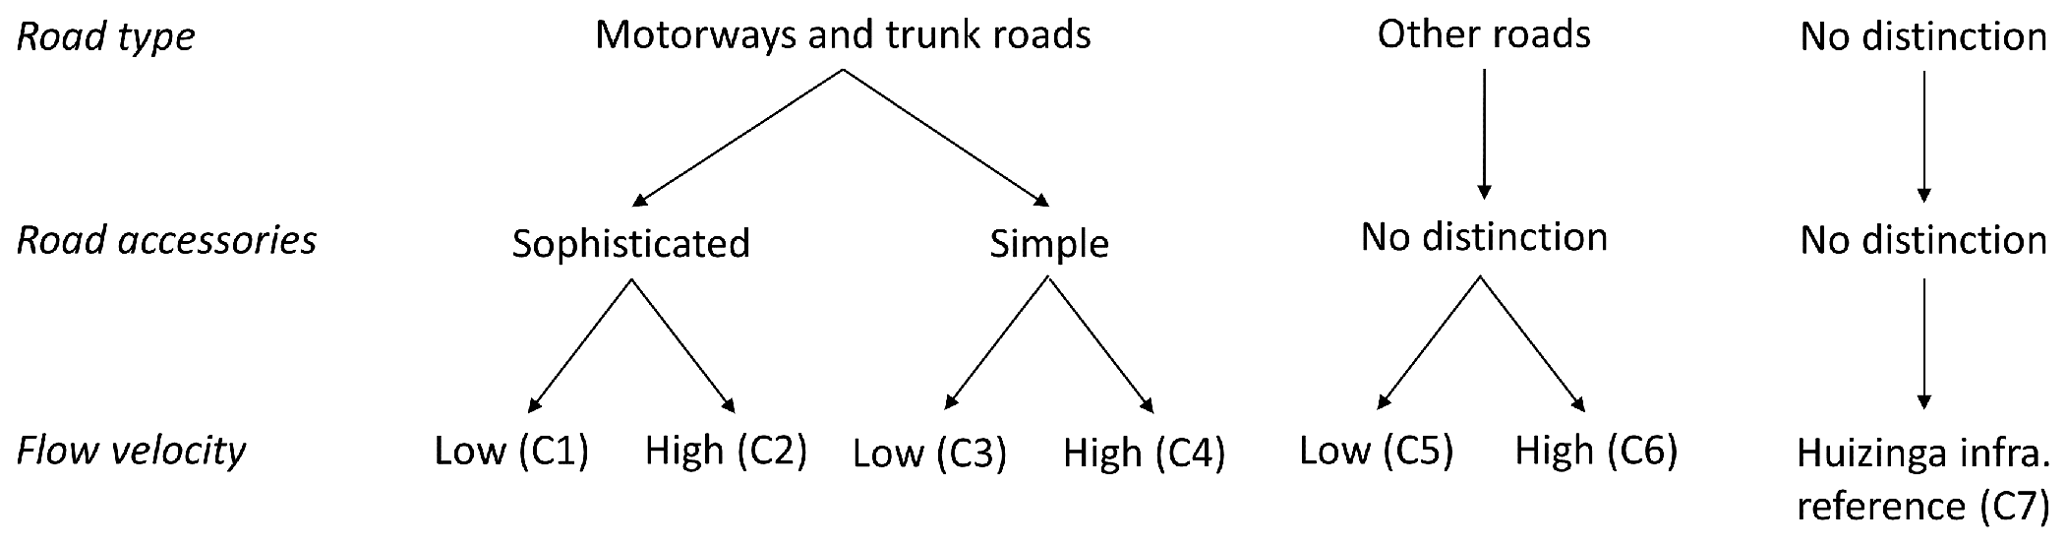
Figure 3Dimensions used for differentiating the new damage curves (C1–C6) and the Huizinga infrastructure reference curve (C7).
2.4.3 New damage curves
The damage curves are expressed as percentage of the road construction costs (see Table 2). They are to be multiplied with the construction cost range per road type (Table 1). This gives the absolute damage as a function of water depth in the average 2015 price level of the former EU-28 (see Fig. 4). A protocol for implementation of the curves can be found in Sect. S8.
The shapes of the curves are derived from the expected clean-up and repair activities (all percentages refer to the percentage of construction costs) at a given water depth and flow condition. For illustration purposes, we here describe the narratives of curves C3 and C4. Under low-flow conditions, simple motorways and trunk roads (C3) exhibit very little damage as long as the top of the 1 m high road embankment is not yet reached. Upon embankment overtopping, a clean-up of the road pavement is required (∼1 %). At increasing water depth, the water starts carrying larger debris, requiring a clean-up and minor repair works, until it is about ∼4 % at maximum water depth. Under high-flow conditions (C4), erosion and instability already causes damage before the road is overtopped. When water starts overtopping the embankment (>1 m) larger-scale road repairs are needed (∼10 %), increasing to major repair works and road reconstruction (∼35 %). For sophisticated roads with electronic signalling, we have assumed that the difference between the low-flow (C1) and high-flow curve (C2) is smaller, because the electronic signalling (compared to embankments and pavements) is relatively more sensitive to water depth than to flow velocity. All narratives can be found in Tables S9 and S10.
Table 2Damage curves as a percentage of road construction costs.

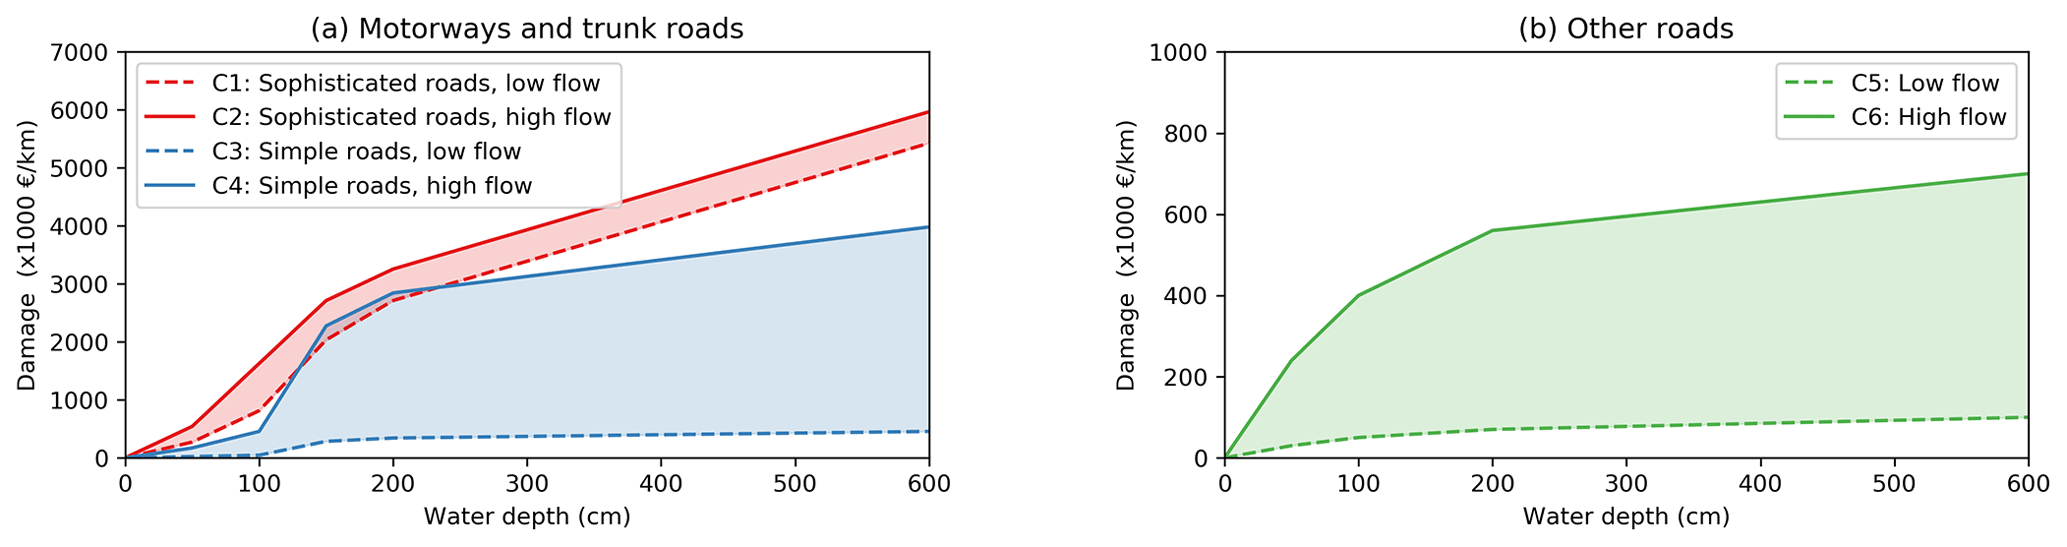
Figure 4Damage curves for illustrative values of road construction costs, in euros per kilometre. (a) The curves for sophisticated roads (C1 and C2) are combined with the 75th percentile of the construction cost range for 2×2 lane motorways, and the curves for simple roads (C3 and C4) are combined with the 25th percentile. (b) These curves (C5 and C6) are combined with the 50th percentile of the construction costs of primary roads. The price level is the average of the former EU-28, in 2015.
2.5 Sampling the uncertainty space
The damage estimates come with considerable uncertainty, which primarily originates from the bandwidth of the construction costs and the space between the upper and lower estimate of the flow velocity. This uncertainty space is sampled to obtain (1) a deterministic estimate of the expected annual damage, as well as (2) a probability distribution around this estimate. Motorways and trunk roads with street lighting tags in OSM are assumed to have sophisticated road accessories; damage curves C1 and C2 are applied (Fig. 3) in combination with a construction cost sample from 50 % to 100 % of the range (Table 1, note c). In the probabilistic sample, per road segment, a random choice is made between the 50th, 75th, and 100th percentiles of the range, and in the deterministic sample, the 75th percentile is used for each segment. For motorway and trunk roads without street lighting tags, simple road designs are assumed; damage curves C3 and C4 are applied in combination with a random choice from the 0th, 25th, and 50th percentiles of the range in the probabilistic and the 25th percentile in the deterministic sample. For all other road types, for each road segment a random choice is made from the entire construction cost range in the probabilistic approach and 50 % in the deterministic sample. To account for the uncertainty in flow velocity in the probabilistic approach, we quasi-randomly sample 1000 z scores assuming a normal distribution with the low-flow curve at −2 standard deviations and the max flow curve at +2 standard deviations from the mean flow damage. This assumption was made because of the lack of reference data. This results in 1000 estimates of the damage per segment (1 for each z score). Per z score, the damage of all road segments is aggregated to construct Fig. 5d. In the deterministic sample, the average of the minimum and maximum flow curves is taken.
2.6 Comparison to reference case
As a reference, we compare our model to road repair data reported by the Bavarian government (Table S17). On 4 and 5 June 2013, an approximately 1:100-year flood caused a dike breach near the confluence of the Danube River and its tributary, the Isar River, close to the town of Deggendorf. The inundated area spanned the cloverleaf junction of the motorways A92 and A3, as well as 6.6 km of the A3 and 2.8 km of the A92 (Fig. 8). Both roads have 2×2 lanes + 2 safety lanes and are 30 and 26 m wide, respectively. They are accurately represented as 2×2 motorways in OSM. The roads are located on embankments and have a fairly simple road design, i.e. no lighting or electronic signalling. We estimate water depths and damage to these roads and surrounding area from reports (Rogowsky, 2016), videos, photos, and satellite imagery (Table S17). We then mask the 1:10-year flood hazard map (which better resembled the reported inundation than the 1:100-year flood map) over the extent of the observed inundation and calculate the damage using the object-based model. This offers a partial validation of the damage curves for motorways with a simple design; more data are needed to validate the entire methodology.
This section presents the flood risk of the European road network. Firstly, the object-based approach is compared to the grid-based approach, using the Huizinga damage curves in both approaches (Sect. 3.1). Secondly, the new damage curves are used in the object-based approach to give more precise estimates of the aggregated road damage in Europe and to give insight into the uncertainty surrounding these estimates (Sect. 3.2). Thirdly, these results are presented on the road segment level to identify flood hotspots in the European highway network (Sect. 3.3). Fourthly, the model results are put in perspective of the damage reported for the Deggendorf flood event (Sect. 3.4).
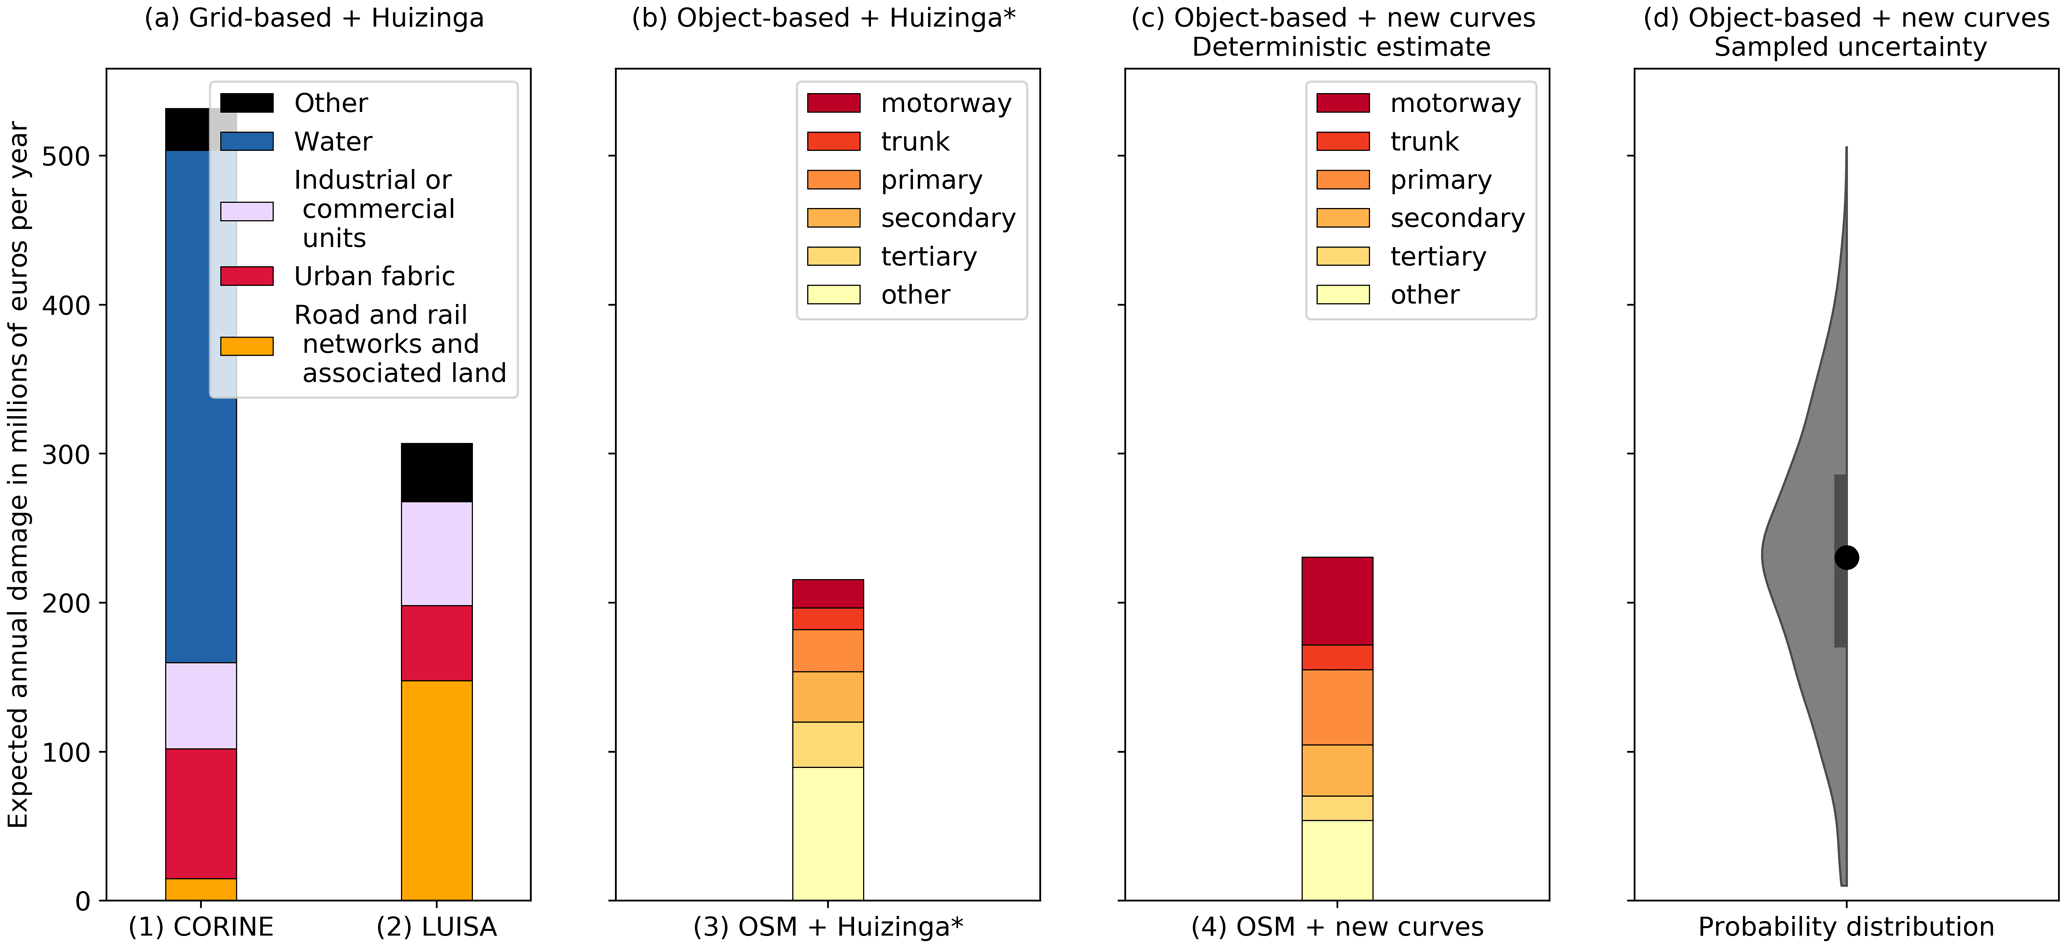
Figure 5Flood risk of the European road network according to the grid-based and the object-based approach. (a) Grid-based approach with (1) CORINE and (2) LUISA and the Huizinga damage curves, per land cover type. (b) Object-based approach and *object translation of Huizinga damage curves (3), per road type. (c) Object-based approach and new damage curves (4), deterministic estimate per road type. (d) Same as (4) with probability density around the deterministic estimate of (c), with the black dot indicating the median and the thick line indicating the interquartile range.
3.1 Grid-based versus object-based damage for the Huizinga damage curve
The grid-based approach estimates the total expected annual damage (EAD) for the CORINE and LUISA land cover map at EUR 536 million and 301 million per year, respectively (Fig. 5a), whereas only EUR 228 million per year is estimated by the object-based approach (Fig. 5b). Both approaches use the same hazard data, and both use the Huizinga vulnerability curve so that the differences are mainly attributable to the exposure data. A surprising observation concerning the exposure data is the large amount of infrastructural damage (65 %) attributed to the CORINE land cover type “water”. This peculiarity originates from Huizinga's suggestion (Huizinga, 2007, p. 2-22) to map the damage functions to CORINE using a land cover cross-tabulation from the European Environment Agency (EEA, 2006, cf. Table S1). The EEA shows that some cells that contain “waterbodies” in CORINE contain infrastructure in a reference map. Consequently, some percentage of infrastructure is assumed for all CORINE waterbodies, for which large damage is calculated, because sometimes large inundation depths are modelled for waterbodies. This peculiarity was manually removed in the model implementation of LUISA (Table S2), such as it was in the recent PESETA IV (Projection of Economic impacts of climate change in Sectors of the European Union based on bottom-up Analysis) study (Dottori et al., 2020). Another difference is the strong increase in damage to “road and rail networks and associated land”, from EUR 15 million per year in CORINE to EUR 144 million per year in LUISA, resulting from integrating the motorway network into the LUISA land cover grid (Rosina et al., 2018).
It should be noted that the object-based approach only reports damage to road infrastructure, whereas the grid-based approach also reports damage to rail infrastructure. However, the area occupied by the railway network is usually limited compared to the road network. Moreover, since the very narrow railway line elements have not been explicitly integrated in the LUISA grid (Rosina et al., 2018), they are mostly overseen, and hence their contribution to the LUISA damage is small. Therefore, we assume that the LUISA class “road and rail networks and associated land” corresponds to the motorway network and that the other LUISA land use classes correspond to the underlying road network. Accordingly, in the grid-based approach, motorways contribute 48 % and the underlying road network contributes 52 % to the total road infrastructure damage (Fig. 5a). In the object-based approach, motorways contribute 9 %; trunk roads contribute 7 %; and the underlying road network contributes 85 % (Fig. 5b, percentages rounded). This relatively minor contribution of motorways in the object-based approach results from the way in which the Huizinga curve is implemented: damage per square metre is multiplied by the road width. Motorways, however, are relatively more expensive than is to be expected from merely their width. Therefore, the damage to motorways is underestimated in Fig. 5b. The other way around, the other road types are less expensive than is to be expected from their width. Therefore, damage to the underlying road network is overestimated in Fig. 5b. This emphasizes the need for damage curves that correct for road characteristics beyond only the road width, as used in the next section.
3.2 Object-based damage using new damage curves
With the new depth–damage curves the EAD is estimated at EUR 231 million per year (Fig. 5c), which is again below the grid-based LUISA estimate (EUR 301 million per year, Fig. 5a). The total damage with the new curves (EUR 231 million per year, Fig. 5c) is somewhat higher than the object-based implementation of the Huizinga damage curve (EUR 216 million per year, Fig. 5b), and the contribution per road type is substantially different. Notably, the contribution of motorways (26 %) has become much larger. The other contributions are 7 % for trunk, 22 % for primary, 15 % for secondary, 7 % for tertiary, and 23 % for other roads (Fig. 5c).
The object-based approach also gives insight into the uncertainty surrounding the deterministic estimate of EUR 231 million per year. The mean of the stochastically generated samples is EUR 229 million per year, and the median is EUR 230 million per year (Fig. 5d), which approximates the deterministic estimate well. The interquartile range (containing 50 % of the samples) is EUR 172 million to 284 million per year. The lower tail (Fig. 5d) is truncated because outliers in low-flow velocity cannot cause damage below zero, whereas at the high tail high-flow velocities cause large damage.
Figure 6a shows how the object-based risk (deterministic estimate) is geographically spread over Europe. Germany, France, and Italy are exposed to the highest flood risk (EUR 45 million, 43 million, and 23 million per year, respectively; see Figs. S5 and S6). In these countries, the risk is concentrated around the rivers that rise in the Alps and then flow through regions with dense road networks, such as the Danube and Rhine flowing through southern Germany, the Rhone flowing through south-eastern France, and the Po flowing through northern Italy. These three countries have additional flood hotspots in the Elbe River, Garonne River, and Tiber River basins, respectively. Of the top 10 NUTS 2 regions with the largest damage, 5 are in France, and 2 are in Italy (Table S16).
Another concentration of high flood risk is found on the Scandinavian Peninsula. This can be partly explained by the high GDP per capita and the relatively large NUTS regions. However, also when correcting for these factors, we find that the sparse road networks in these countries indeed have the potential to be inundated with large water depths, causing large damage. The regions Pohjois-ja Itä-Suomi (Finland) and Hedmark og Oppland (Norway) are in the top 10 of the NUTS 2 regions with the largest risk (Table S16).
Because the value of the exposed assets is scaled to the national GDP per capita, the risk is relatively high in high-income countries. If the risk is expressed as share of the GDP per NUTS 3 region, other high-risk regions emerge: the central European countries of the Czech Republic, Slovakia, and Hungary and also Croatia and Latvia (Fig. 6b). Although these countries contribute little to the total damage in Europe, the relative impact of road disruptions in these countries is large. Note that these regional (NUTS 3) risk aggregations are influenced by the size of the regions in the NUTS classification; smaller regions show relatively smaller risk in Fig. 6. Therefore, aggregation at different levels reveals slightly different spatial patterns (Fig. S6, Tables S14–S16).
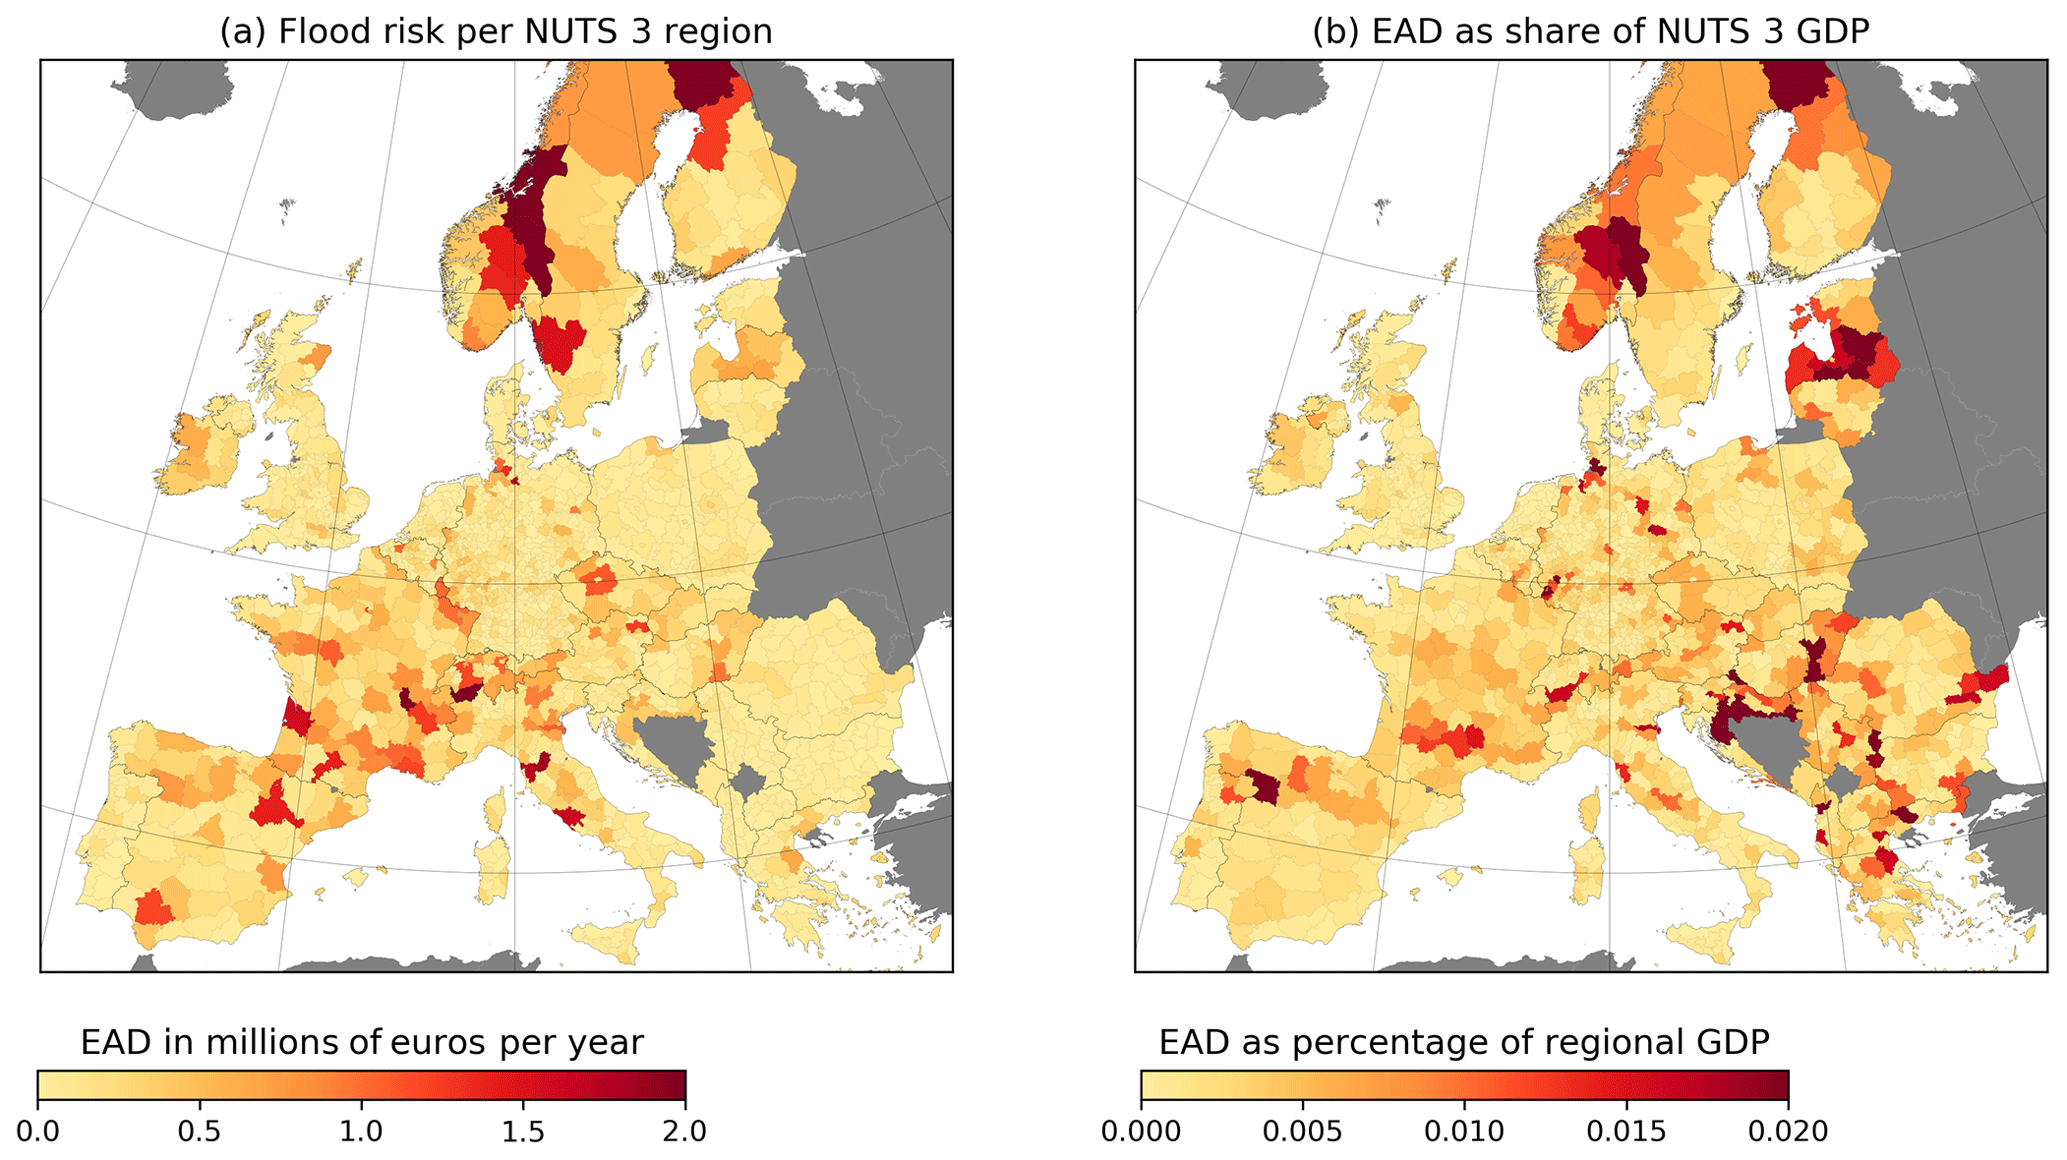
Figure 6Expected annual damage (EAD) to road infrastructure aggregated by the NUTS 3 region. Panel (a) presents the absolute values; panel (b) expresses the EAD as a percentage of the GDP per NUTS 3 region.
3.3 Current flood hotspots in the EU transport network
The flood risk of all motorways and trunks in the EU road network is now presented on a high-resolution map (see Fig. S8). To illustrate how this map can be used to identify flood hotspots in the EU road network, we highlight three notable regions (Fig. 7).
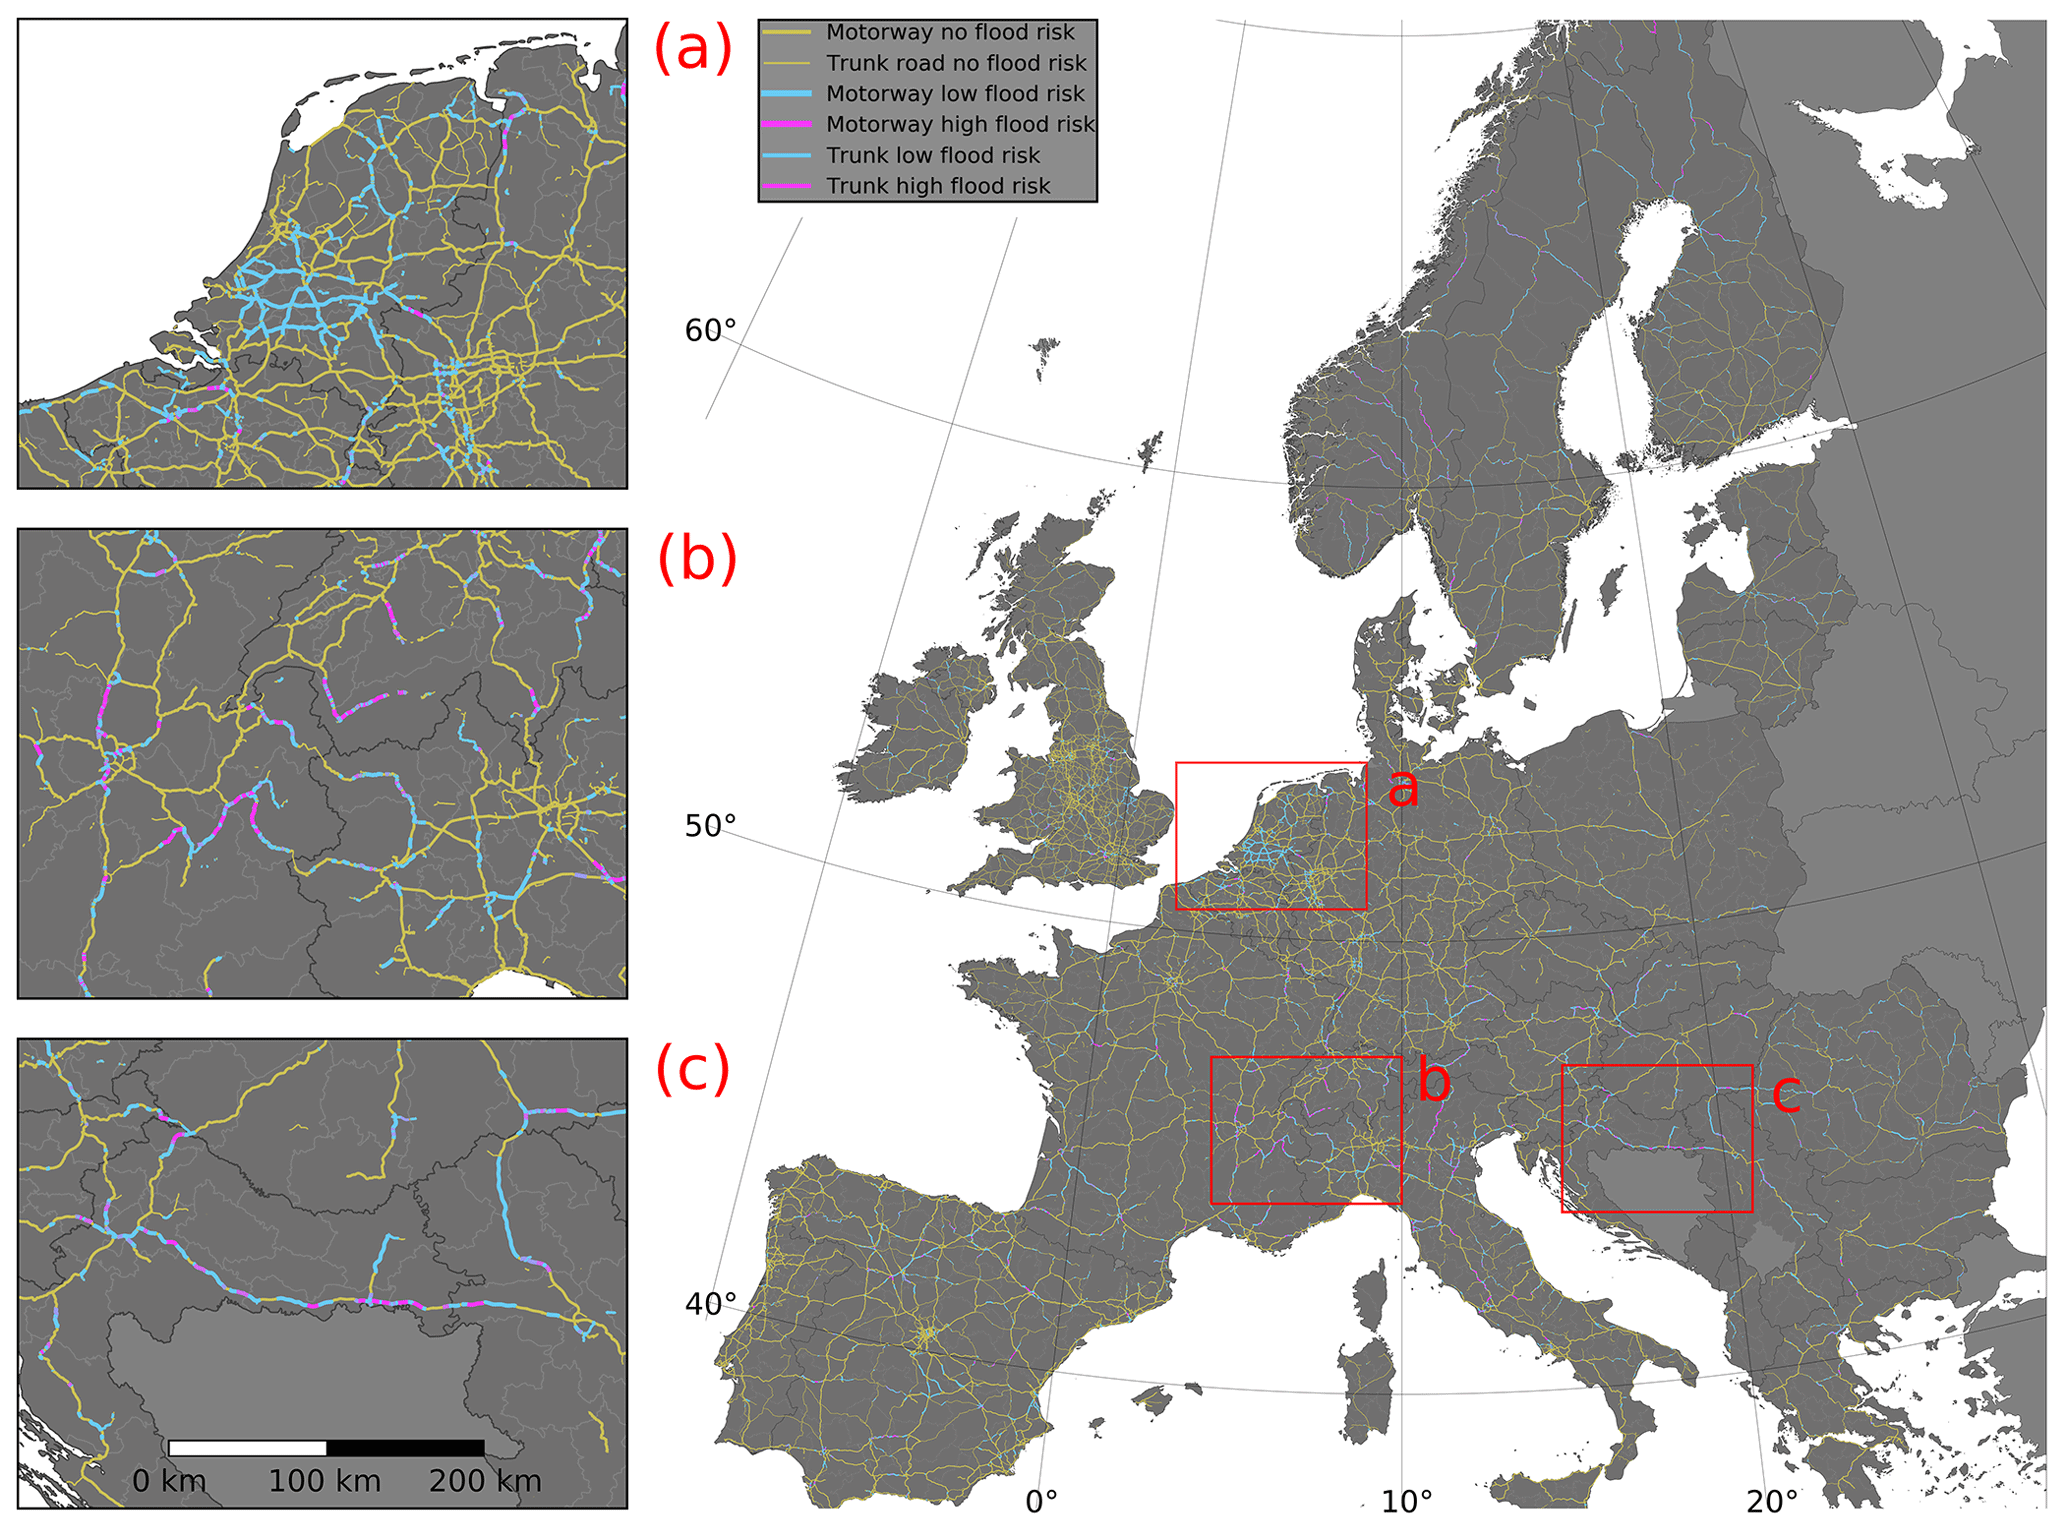
Figure 7Flood risk of motorways and trunk roads in the European main road network (see Fig. S8 for a high-resolution version), which is also made available as shapefile. (a) The Netherlands. (b) Western Alps in France, Switzerland, and Italy. (c) North-western Balkans in Croatia and Serbia. Road geometries © OpenStreetMap contributors 2019. Distributed under a Creative Commons BY-SA License.
The Netherlands stands out in Fig. 7a because many of its motorways have the potential to be inundated, although at the same time, the aggregated flood risk is among the lowest of the countries in Europe (Fig. S5). This can be explained by the very high river flood protection standards in the country (return period of 1:1000 years or higher in most places), which make the likelihood of flood events very small. However, if dikes did breach, many roads would be inundated with large water depths, causing large damage. Also, this could severely hinder the possibilities for evacuation, especially in the centre of the country.
The Alps are identified as a high-risk region. For example, in France, the model predicts large EAD for the A41 from Grenoble to Chambéry and the A43 from Chambéry to Saint-Jean-de-Maurienne (Fig. 7b). Both motorways are located in narrow flood plain valleys along rivers. This exposes them to large flood hazards, which is also recognized in local flood risk studies (e.g. Strappazzon and Pierlot, 2017). Similar exposure of motorways can be found in other Alpine regions, such as the A9 from Sion to Montreux (Switzerland), the A22 from Lake Garda to Bolzano (Italy), and the A12 from Landeck via Innsbruck to Kufstein (Austria).
In the Balkans, the E70 motorway from Zagreb (Croatia) to Belgrade (Serbia) is subject to large flood risk (Fig. 7c). This road follows the course of the Sava River for about 400 km. The flood plains of the Sava River were struck by a large flood in 2014 (International Sava River Basin Commission, 2014). According to our model, the flood waters could hit the motorway at several locations. For some road segments the EAD is notably high. This is primarily the result of a large flood hazard rather than a large value of exposed assets because the GDP of Croatia and Serbia is below the average of the (former) EU-28.
3.4 Deggendorf reference case
As described in Sect. 2.4, the Deggendorf flood event is used as a reference for the damage estimates of the model (Fig. 8). During the flood event, the pavement of the A3 motorway was submerged over 6.6 km because the road embankment was lower than the water level in the surrounding area, resulting in water depth of 0.5 m above the road pavement, on average. After the flood, the A3 was covered with debris (a gas tank, hay bags covered in plastic, wooden logs, plastic bags, and pallets), sand, and mud, requiring a major clean-up. At the cloverleaf, there were rifts in the asphalt, requiring small asphalt works. Small strips of asphalt (but not the entire road) were milled and resurfaced. The embankment of the A92 was higher than the embankment of the A3 so that its pavement remained dry over the entire 2.8 km, except for a small depression at an underpass with a local road (see Table S17).

Figure 8Observed and simulated flood in Deggendorf. Simulated map according to the cropped return period (RP) of the 10-year flood map (Alfieri et al., 2015). Background map © OpenStreetMap contributors 2019. Distributed under a Creative Commons BY-SA License.
The Bavarian State Ministry for Housing, Construction and Transport was granted EUR 3.8 million for rehabilitating the Deggendorf cloverleaf junction (Table S17). The model calculates damage of EUR 3.4 million for the low-flow curve (C3) and EUR 28.6 million for the high-flow curve (C4). The video imagery and the limited asphalt damage (Table S17) suggest that flow velocities were relatively low so that one expects the damage more towards our low-flow than the high-flow damage curve, which is indeed the case.
When interpreting these results, one should consider that German motorways are relatively cheap compared to those in other EU countries (after scaling for GDP, see Table S6), which could imply that rehabilitation works are also relatively cheap (cf. ECA, 2013). Additionally, most damage seems to have occurred to the cloverleaf itself, rather than the straight sections of the two highways. Finally, it is likely that the road owner made additional repair costs beyond what was funded using the EUR 3.8 million grant.
In this work, the object-based approach resulted in lower damage estimates than the grid-based approach. This contrasts with findings of previous studies. For example Jongman et al. (2012) found that “even with the complementary infrastructure data added to CORINE [by adding the road network to the grid], all damage models that include this class strongly underestimate the corresponding losses” (2012, p. 3744, square brackets and emphasis by us) and that this “is in line with results from earlier studies” (p. 3748). Instead, our findings suggest that grid-based studies using CORINE may overestimate infrastructural damage by allocating infrastructural damage to waterbodies. However, since the infrastructure contribution to the total damage in these approaches is limited, the estimate of total damage (beyond infrastructure) could still be reliable despite the misallocation in some land cover categories. The grid-based approach using LUISA provided an estimate close to the object-based assessment, indicating that with LUISA, a fair proxy of the total damage to road infrastructure can be obtained.
Within the object-based approach, replacing the Huizinga damage curve with a new set of damage curves resulted in a comparable estimate of the total road damage but distributed a larger share of the damage to motorways and trunk roads. This indicates that the Huizinga infrastructure function is a fair proxy for the average damage to road assets but is unsuitable for assessing damage at the individual road level. The Deggendorf reference case showed that the low-flow curve best resembled the reported flood damage. The new curves also compare reasonably well to damage reported for a Missouri River flood in Iowa, United States of America (Vennapusa et al., 2013). In order to compare our curves to the damage reported in this study, let us assume a motorway construction costs of EUR 5 million per kilometre, given that the road design in Iowa is fairly “simple” (Table 1). Vennapusa et al. (2013) report the following motorway damage (Table S18): EUR 18 000–65 000 km−1 for clean-up costs, which is in the order 1 % (of EUR 5 million); EUR 54 000–388 000 km−1 for minor up to major repair works, which is in the order of 1 %–10 %; and EUR 5.8 million per kilometre for complete reconstruction of a motorway, which is in the order of 100 % of construction costs. A general limitation of our approach is that the flood hazard data used are relatively coarse compared to the high-resolution road segments. In some locations this overestimates the damage, e.g. when in a sharp bend a road is falsely overlapped by a river raster cell; in other locations this underestimates the damage, e.g. when a local road depression in reality floods deeper than suggested by the relatively coarse elevation model used to construct the hazard data.
European flood risk studies estimate the total river flood risk aggregated over all land cover types at EUR 4 billion–6 billion per year (Alfieri et al., 2016b; Jongman et al., 2014), which resembles the reported damage (Paprotny et al., 2018). Our estimate of road damage of EUR 230 million per year is in the order of 3.8 % (of EUR 6 billion) to 5.8 % (of EUR 4 billion) of total damage. This infrastructure share of total flood damage is usually in the order of 5 %–10 % (Jongman et al., 2012). Using grid-based models, Jongman et al. (2012) find 8.9 %, 2.6 %, and 8.9 % for a flood in Carlisle, for which 11.9 % was reported. In specific cases, the damage may be much higher: Jongman et al. (2012) also find values of 18 %, 5 %, 17 %, and 3 % for a flood in Eilenburg, for which 50 % was reported. This made Bubeck et al. (2019) suggest that infrastructural losses may amount up to 60 % of total damage. Our results however, suggest that such a high value should be seen as an exception; usually the infrastructure percentage of total damage is much lower. We also perceive the estimate of Bubeck et al. (2019) for the damage to railway infrastructure (11 %–14 % of overall flood losses) as being on the high side, given that we find a percentage of only 4 %–6 % for road infrastructure (with the same hazard data) and given that rail damage is usually smaller than road damage (Doll et al., 2014).
Our estimate of EUR 230 million per year, and 90 % confidence interval of EUR 89 million–373 million per year is lower than the EUR 660 million per year reported by Enei et al. (2011). They used an elasticity model linking meteorological indices to road vulnerability data derived from the literature. This accounted for the ageing of infrastructure so that the costs attributed to flood damage are lower than the unit replacement costs. However, they included damage caused by landslides as well as damage to bridges, whereas we only look at the impact of floods, and excluded damage to bridges.
Considering that other studies find higher values, could we have underestimated the damage? On the one hand, this seems not to be the case. Firstly, the estimated size of total damage costs for the reference event is at the lower range of our damage estimate. Secondly, it can be argued that places for which our model calculates large damage could be more flood-proofed than what was incorporated in our damage curves. For example, large damage is found for roads along rivers located in flat flood plains between mountains. In these very vulnerable places, the design standards of the roads may be higher than of the average European road; the road could be extra protected in anticipation of the flood events. Thirdly, road segments that follow a meandering river are sometimes accidently intersected by the relatively coarse flood hazard grid, whereas they do not flood. This makes our model more likely to overestimate than to underestimate the damage.
On the other hand, there are reasons to think that the actual river flood damage is larger than predicted by our model. Firstly, we have limited ourselves to large river floods represented in the flood hazard maps, thereby omitting floods originating from small catchments (<500 km2). In hilly terrain, flash floods and associated landslides in these smaller catchments can locally cause large damage to road infrastructure, not the least because the flow velocities may exceed what was anticipated in our high-flow curve. Secondly, our study omitted additional damage originating from junctions, viaducts, bridges, and tunnels, whereas these could contribute significantly to overall damage. For the reference event, damage to the cloverleaf seems to have contributed most to the overall damage. Similarly, a main source of the exceptionally large damage for the Eilenburg case reported by Jongman et al. (2012) was the collapse of a bridge.
Finally, we would like to emphasize that one should take caution when applying our newly developed damage curves in their own study. We urge researchers to always evaluate the local situation, use the damage accounting principle, and strive for consistency with the hazard data when choosing the most applicable curve. We consider our study to be another step forward in high-resolution risk modelling for transport infrastructure and ask the community to further calibrate (and validate) the curves, when more empirical data are available. For this, the data in the Supplement can serve as a reference.
This study introduced an object-based approach to modelling the river flood risk of European road infrastructure. This enabled a comparison with the commonly used grid-based approaches, which clearly have difficulties to accurately estimate damage to line infrastructure: road infrastructure may either be overlooked or overestimated by attributing infrastructural damage to the wrong land use types. Also, the study introduced a new set of damage curves which puts the frequently used Huizinga curves into perspective. The expected annual damage from river floods to the road network is EUR 230 million per year, which is well below the grid-based estimates with CORINE (EUR 536 million per year) and LUISA (EUR 301 million per year). Additionally, we showcased how the object-based approach can be used to identify flood hotspots in the European road network, for which the grid-based approach was unsuitable. This generalized approach can potentially be used for other hazards such as coastal and pluvial floods. We especially recommend the investigation of the damage caused by flash floods and associated landslides in hilly terrain because the flow velocities and resulting damages seem to exceed what we observed for large-scale river flooding.
The model introduced in this study could be a starting point for further analysis. First, the flood hazard data can be easily substituted with (smaller-scale) high-resolution data to fully exploit the level of detail offered by the OSM exposure dataset. In combination with higher-resolution flood hazard data, it is worth investigating if splitting the OSM road segments into smaller subsegments can further improve the object-based approach. Second, local-scale case studies are required to validate the proposed damage curves. Currently, very few road flood damage case studies are described in the literature; collection of such data by road operators and academics should be a research priority because the absence of damage data hampers the validation of the models. Third, because road flood damage is very sensitive to uncertainty in flood velocity, accounting for this parameter could improve the predictive capacity of the model. Fourth, an object-based approach can be used to investigate potential damage to bridges, culverts, tunnels, viaducts, and junctions.
In the broader context of risk assessments for roads, this study offers a practical method for large-scale (continental-scale) risk assessment without compromising the resolution of the exposure data and is hence suitable for hotspot identification. Both continental-scale and local-scale assessments can use the same framework; only the hazard data need to be substituted with high-resolution local data. The results are presented on the level of individual road segments which meets a demand of road owners (Bles et al., 2016) by providing immediate perspective of action. This bridges the gap between detailed local-scale object-based studies (e.g. Hackl et al., 2018) and coarse continental-scale econometric (e.g. Doll et al., 2014) or grid-based studies (e.g. Dottori et al., 2020). Finally, the object-based approach offers an indispensable level of detail for two types of analysis. First, damage from network disruptions and indirect economic effects can be studied using the same road network as used in the analysis of direct damage. Network graphs can be directly constructed from the OSM road objects, which is impossible with a grid-based approach. Second, flood risk studies are increasingly used to support decision making on climate adaptation. The unique characteristics of each road segment are highly relevant for targeted climate resilient infrastructure investments and can only be captured in a road-specific, object-based approach.
The Python code for the object-based model can be retrieved from https://doi.org/10.5281/zenodo.4588800 (van Ginkel, 2021). The Supplement contains a shapefile with the model outputs for the European highway network (motorways and trunk roads). Data for all OSM road classes per NUTS 3 region can be retrieved from the authors.
The JRC flood hazard maps used in this work are available for download and reuse at the JRC Data Catalogue at https://data.jrc.ec.europa.eu/dataset/1d128b6c-a4ee-4858-9e34-6210707f3c81 (Dottori et al., 2021b).
This paper contains supplementary information with model settings, road construction and maintenance cost data, the new damage curves, and detailed descriptions of the model results. These results include a high-resolution map and shapefile of the flood risk of motorways and trunk roads in the European road network. The supplement related to this article is available online at: https://doi.org/10.5194/nhess-21-1011-2021-supplement.
KCHvG prepared the paper with contributions from all co-authors. FD, LA, and LF prepared the flood hazard maps and damage maps of the grid-based approach. EEK developed the object-based approach; KCHvG tailored it to the European context. KCHvG and EEK carried out the computational experiments and investigated, validated, and visualized the results. All authors approved the final publication.
The authors declare that they have no conflict of interest.
We thank the Dutch Ministry of Infrastructure and Water Management, Rijkswaterstaat, for providing insight into the cost structure of motorways and the Bavarian State Ministry for Housing, Construction and Transport for providing the data on flood damage in Deggendorf. Deltares colleagues Thomas Bles, Ana Laura Costa, and Dennis Wagenaar contributed to shaping the new damage curves. Aoife O'Connor assisted in collecting data on road construction costs.
This paper has received funding from the European Union's Horizon 2020 research and innovation programme (grant no. 776479) for the project CO-designing the Assessment of Climate CHange costs (https://www.coacch.eu/, last access: 8 March 2021). Elco Koks was further supported by the Netherlands Organisation for Scientific Research (NWO; grant no. VI.Veni.194.033).
This paper was edited by Kai Schröter and reviewed by four anonymous referees.
Albano, R., Mancusi, L., Sole, A., and Adamowski, J.: FloodRisk: a collaborative, free and open-source software for flood risk analysis, Geomatics, Nat. Hazards Risk, 8, 1812–1832, https://doi.org/10.1080/19475705.2017.1388854, 2017.
Alfieri, L., Salamon, P., Bianchi, A., Neal, J., Bates, P., and Feyen, L.: Advances in pan-European flood hazard mapping, Hydrol. Process., 28, 4067–4077, https://doi.org/10.1002/hyp.9947, 2014.
Alfieri, L., Feyen, L., Dottori, F., and Bianchi, A.: Ensemble flood risk assessment in Europe under high end climate scenarios, Glob. Environ. Chang., 35, 199–212, https://doi.org/10.1016/j.gloenvcha.2015.09.004, 2015.
Alfieri, L., Feyen, L., and Di Baldassarre, G.: Increasing flood risk under climate change: a pan-European assessment of the benefits of four adaptation strategies, Clim. Change, 136, 507–521, https://doi.org/10.1007/s10584-016-1641-1, 2016a.
Alfieri, L., Feyen, L., Salamon, P., Thielen, J., Bianchi, A., Dottori, F., and Burek, P.: Modelling the socio-economic impact of river floods in Europe, Nat. Hazards Earth Syst. Sci., 16, 1401–1411, https://doi.org/10.5194/nhess-16-1401-2016, 2016b.
Alfieri, L., Dottori, F., Betts, R., Salamon, P., and Feyen, L.: Multi-Model Projections of River Flood Risk in Europe under Global Warming, Climate, 6, 6, https://doi.org/10.3390/cli6010006, 2018.
Amadio, M., Mysiak, J., Carrera, L., and Koks, E.: Improving flood damage assessment models in Italy, Nat. Hazards, 82, 2075–2088, https://doi.org/10.1007/s11069-016-2286-0, 2016.
Amadio, M., Scorzini, A. R., Carisi, F., Essenfelder, A. H., Domeneghetti, A., Mysiak, J., and Castellarin, A.: Testing empirical and synthetic flood damage models: the case of Italy, Nat. Hazards Earth Syst. Sci., 19, 661–678, https://doi.org/10.5194/nhess-19-661-2019, 2019.
Archondo-Callao, R.: Roads works costs per km from World Bank Reports, 1 May 2000, The World Bank, Washington D.C., presentation, 2000.
Arnell, N. W. and Gosling, S. N.: The impacts of climate change on river flood risk at the global scale, Clim. Change, 134, 387–401, https://doi.org/10.1007/s10584-014-1084-5, 2016.
Barrington-Leigh, C. and Millard-Ball, A.: The world's user-generated road map is more than 80 % complete, PLoS One, 12, 1–20, https://doi.org/10.1371/journal.pone.0180698, 2017.
Bates, P. D., Horritt, M. S., and Fewtrell, T. J.: A simple inertial formulation of the shallow water equations for efficient two-dimensional flood inundation modelling, J. Hydrol., 387, 33–45, https://doi.org/10.1016/j.jhydrol.2010.03.027, 2010.
Blanc-Brude, F., Goldsmith, H., and Välilä, T.: Ex Ante Construction Costs in the European Road Sector: A Comparison of Public-Private Partnerships and Traditional Public Procurement (Economic and Financial Report 2006/01), European Investment Bank, Kirchberg, Luxembourg, 38 pp., 2006.
Bles, T., Bessembinder, J., Chevreuil, M., Danielsson, P., Falemo, S., Venmans, A., Ennesser, Y., and Löfroth, H.: Climate change risk assessment and adaptation for roads – results of the ROADAPT project, in: Transportation Research Procedia, 14, 58–67, 2016.
Bouwer, L., Capriolo, A., Chiabai, A., Foudi, S., Garrote, L., Harmackova, Z. V., Iglesias, A., Jeuken, A., Olazabal, M., Spadaro, J., Taylor, T., and Zandersen, M.: Upscaling the impacts of climate change in different sectors and adaptation strategies, in: Adapting to climate change in Europe, edited by: Sanderson, H., Hilden, M., Russel, D., Penha-Lopes, G., and Capriolo, A., Elsevier, Amsterdam, the Netherlands, 173–243, https://doi.org/10.1016/B978-0-12-849887-3.00001-0, 2018.
Bubeck, P., Dillenardt, L., Alfieri, L., Feyen, L., Thieken, A. H., and Kellermann, P.: Global warming to increase flood risk on European railways, Clim. Change, 155, 19–36, https://doi.org/10.1007/s10584-019-02434-5, 2019.
Büttner, G., Soukup, T., and Kosztra, B.: CLC2012. Addendum to CLC2006 Technical Guidelines, European Environment Agency, Copenhagen, Denmark, 35 pp., 2014.
Carisi, F., Schröter, K., Domeneghetti, A., Kreibich, H., and Castellarin, A.: Development and assessment of uni- and multivariable flood loss models for Emilia-Romagna (Italy), Nat. Hazards Earth Syst. Sci., 18, 2057–2079, https://doi.org/10.5194/nhess-18-2057-2018, 2018.
Carruthers, R.: What prospects for transport infrastructure and impacts on growth in southern and eastern Mediterranean countries?, MEDPRO report No. 3, CEPS Centre for European Policy Studies, Brussels, Belgium, 36 pp., 2013.
Chang, H., Lafrenz, M., Jung, I.-W., Figliozzi, M., Platman, D., and Pederson, C.: Potential Impacts of Climate Change on Flood-Induced Travel Disruptions: A Case Study of Portland, Oregon, USA, Ann. Assoc. Am. Geogr., 100, 938–952, https://doi.org/10.1080/00045608.2010.497110, 2010.
Dankers, R. and Feyen, L.: Climate change impact on flood hazard in Europe: An assessment based on high-resolution climate simulations, J. Geophys. Res.-Atmos., 113, 1–17, https://doi.org/10.1029/2007JD009719, 2008.
de Moel, H. and Aerts, J. C. J. H.: Effect of uncertainty in land use, damage models and inundation depth on flood damage estimates, Nat. Hazards, 58, 407–425, https://doi.org/10.1007/s11069-010-9675-6, 2011.
de Moel, H., van Alphen, J., and Aerts, J. C. J. H.: Flood maps in Europe – methods, availability and use, Nat. Hazards Earth Syst. Sci., 9, 289–301, https://doi.org/10.5194/nhess-9-289-2009, 2009.
de Moel, H., Jongman, B., Kreibich, H., Merz, B., Penning-Rowsell, E., and Ward, P. J.: Flood risk assessments at different spatial scales, Mitig. Adapt. Strateg. Glob. Chang., 20, 865–890, https://doi.org/10.1007/s11027-015-9654-z, 2015.
Doll, C., Klug, S., and Enei, R.: Large and small numbers: options for quantifying the costs of extremes on transport now and in 40 years, Nat. Hazards, 72, 211–239, https://doi.org/10.1007/s11069-013-0821-9, 2014.
Dottori, F., Martina, M. L. V., and Figueiredo, R.: A methodology for flood susceptibility and vulnerability analysis in complex flood scenarios, J. Flood Risk Manag., 11, 632–645, https://doi.org/10.1111/jfr3.12234, 2018a.
Dottori, F., Szewczyk, W., Ciscar, J. C., Zhao, F., Alfieri, L., Hirabayashi, Y., Bianchi, A., Mongelli, I., Frieler, K., Betts, R. A., and Feyen, L.: Increased human and economic losses from river flooding with anthropogenic warming, Nat. Clim. Change, 8, 781–786, https://doi.org/10.1038/s41558-018-0257-z, 2018b.
Dottori, F., Mentaschi, L., Bianchi, A., Alfieri, L., and Feyen L.: Adapting to rising river flood risk in the EU under climate change, Publications Office of the European Union, Luxembourg, Luxembourg, https://doi.org/10.2760/14505, 39 pp., 2020.
Dottori, F., Alfieri, L., Bianchi, A., Skoien, J., and Salamon, P.: A new dataset of river flood hazard maps for Europe and the Mediterranean Basin region, Earth Syst. Sci. Data Discuss. [preprint], https://doi.org/10.5194/essd-2020-313, in review, 2021a.
Dottori, F., Alfieri, L., Bianchi, A., and Salamon, P.: River flood hazard maps for Europe and the Mediterranean Basin region, European Commission, Joint Research Centre (JRC) [Dataset], available at: http://data.europa.eu/89h/1d128b6c-a4ee-4858-9e34-6210707f3c81, last access: 9 May 2021b.
ECA: Are EU Cohesion Policy funds well spent on roads?, Special Report No 5/2013, European Court of Auditors, Luxembourg, Luxembourg, https://doi.org/10.2865/71435, 45 pp., 2013.
EEA: The thematic accuracy of Corine land cover 2000 – assessment using LUCAS, Technical report No 7/2006, European Environment Agency, Copenhagen, Denmark, 33 pp., 2006.
Enei, R., Doll, C., Klug, S., Partzsch, I., Sedlacek, N., Kiel, J., Nesterova, N., Rudzikaite, L., Papanikolaou, A., and Mitsakis, V.: Weather Extremes: Assessment of Impacts on Transport Systems and Hazards for European Regions, Deliverable 2 of the WEATHER project, Fraunhofer-Institute for Systems and Innovation Research (ISI), Karlsruhe, Germany, 2011.
Eurostat: Real GDP per capita, Statistical Office of the European Union, European Commission, Brussels, Belgium, available at: https://ec.europa.eu/eurostat/web/main/data/database (last access: 8 March 2021), 2019.
Federal Ministry of Transport and Digital Infrastructure: Verkehrsinvestitionsbericht für das berichtsjahr 2016, Berlin, Germany, 301 pp., 2016.
Gil, J. and Steinbach, P.: From flood risk to indirect flood impact: Evaluation of street network performance for effective management, response and repair, WIT Trans. Ecol. Environ., 118, 335–344, https://doi.org/10.2495/FRIAR080321, 2008.
Hackl, J., Heitzler, M., Lam, J. C., Adey, B., and Hurni, L.: Deliverable 4.2 of the INFRARISK project (Novel indicators for identifying critical infrastructure at risk from natural hazards), Zürich, Switzerland, 2016.
Hackl, J., Lam, J. C., Heitzler, M., Adey, B. T., and Hurni, L.: Estimating network related risks: A methodology and an application in the transport sector, Nat. Hazards Earth Syst. Sci., 18, 2273–2293, https://doi.org/10.5194/nhess-18-2273-2018, 2018.
Heralova, R. S., Hromada, E., and Johnston, H.: Cost structure of the highway projects in the Czech Republic, Procedia Eng., 85, 222–230, https://doi.org/10.1016/j.proeng.2014.10.547, 2014.
Heralova, R. S., Hromada, E., and Johnston, H.: Cost structure of the highway projects in the Czech Republic, Procedia Eng., 85, 222–230, https://doi.org/10.1016/j.proeng.2014.10.547, 2014.
Hirabayashi, Y., Mahendran, R., Koirala, S., Konoshima, L., Yamazaki, D., Watanabe, S., Kim, H., and Kanae, S.: Global flood risk under climate change, Nat. Clim. Change, 3, 816–821, https://doi.org/10.1038/nclimate1911, 2013.
Huizinga, H. J.: Flood damage functions for EU member states, HKV Consultants, Lelystad, the Netherlands, 2007.
Huizinga, J., de Moel, H., and Szewczyk, W.: Global flood depth-damage functions. Methodology and database with guidelines, Publications Office of the European Union, Luxembourg, Luxembourg, https://doi.org/10.2760/16510, 110 pp., 2017.
International Sava River Basin Commission: Preliminary Flood Risk Assessment in the Sava River Basin, Zagreb, Croatia, 28 pp., 2014.
Jongman, B., Kreibich, H., Apel, H., Barredo, J. I., Bates, P. D., Feyen, L., Gericke, A., Neal, J., Aerts, J. C. J. H., and Ward, P. J.: Comparative flood damage model assessment: towards a European approach, Nat. Hazards Earth Syst. Sci., 12, 3733–3752, https://doi.org/10.5194/nhess-12-3733-2012, 2012.
Jongman, B., Hochrainer-Stigler, S., Feyen, L., Aerts, J. C. J. H., Mechler, R., Botzen, W. J. W., Bouwer, L. M., Pflug, G., Rojas, R., and Ward, P. J.: Increasing stress on disaster-risk finance due to large floods, Nat. Clim. Change, 4, 264–268, https://doi.org/10.1038/nclimate2124, 2014.
Jonkman, S. N. and Kelman, I.: An Analysis of the Causes and Circumstances of Flood Disaster Deaths, Disasters, 29, 75–79, https://doi.org/10.1111/j.0361-3666.2005.00275.x, 2005
Jonkman, S. N., Bočkarjova, M., Kok, M., and Bernardini, P.: Integrated hydrodynamic and economic modelling of flood damage in the Netherlands, Ecol. Econ., 66, 77–90, https://doi.org/10.1016/j.ecolecon.2007.12.022, 2008.
Koks, E. E., Rozenberg, J., Zorn, C., Tariverdi, M., Vousdoukas, M., Fraser, S. A., Hall, J. W., and Hallegatte, S.: A global multi-hazard risk analysis of road and railway infrastructure assets, Nat. Commun., 10, 1–11, https://doi.org/10.1038/s41467-019-10442-3, 2019.
Kreibich, H., Piroth, K., Seifert, I., Maiwald, H., Kunert, U., Schwarz, J., Merz, B., and Thieken, A. H.: Is flow velocity a significant parameter in flood damage modelling?, Nat. Hazards Earth Syst. Sci., 9, 1679–1692, https://doi.org/10.5194/nhess-9-1679-2009, 2009.
Kron, W.: Flood Risk = Hazard ⋅ Values ⋅ Vulnerability, Water Int., 30, 58–68, https://doi.org/10.1080/02508060508691837, 2005.
Kundzewicz, Z. W., Krysanova, V., Dankers, R., Hirabayashi, Y., Kanae, S., Hattermann, F. F., Huang, S., Milly, P. C. D., Stoffel, M., Driessen, P. P. J., Matczak, P., Quevauviller, P., and Schellnhuber, H. J.: Differences in flood hazard projections in Europe – their causes and consequences for decision making, Hydrol. Sci. J., 62, 1–14, https://doi.org/10.1080/02626667.2016.1241398, 2017.
Lamb, R., Garside, P., Pant, R., and Hall, J. W.: A Probabilistic Model of the Economic Risk to Britain's Railway Network from Bridge Scour During Floods, Risk Anal., 39, 2457–2478, https://doi.org/10.1111/risa.13370, 2019.
Lincke, D., Hinkel, H., van Ginkel, K., Jeuken, A., Botzen, W., Tesselaar, M., Scoccimarro, E., and Ignjacevic, P.: Impacts on infrastructure, built environment and transport, Deliverable 2.3 of the COACCH project, Global Climate Forum, Berlin, Germany, 78 pp., 2019.
Lugeri, N., Kundzewicz, Z. W., Genovese, E., Hochrainer, S., and Radziejewski, M.: River flood risk and adaptation in Europe-assessment of the present status, Mitig. Adapt. Strateg. Glob. Chang., 15, 621–639, https://doi.org/10.1007/s11027-009-9211-8, 2010.
Meneses, B. M., Pereira, S., and Reis, E.: Effects of different land use and land cover data on the landslide susceptibility zonation of road networks, Nat. Hazards Earth Syst. Sci., 19, 471–487, https://doi.org/10.5194/nhess-19-471-2019, 2019.
Merz, B., Kreibich, H., Schwarze, R., and Thieken, A.: Review article “Assessment of economic flood damage”, Nat. Hazards Earth Syst. Sci., 10, 1697–1724, https://doi.org/10.5194/nhess-10-1697-2010, 2010.
Nijland, H., Wortelboer-van Donselaar, P. M., Korteweg, J. A. C., and Snellen, D.: `Met de kennis van nu': leren van evalueren Een casestudy: A5 Verlengde Westrandweg, Netherlands Environmental Assessment Agency, The Hague, the Netherlands, 60 pp., 2010.
Olsen, A. S., Zhou, Q., Linde, J. J., and Arnbjerg-Nielsen, K.: Comparing methods of calculating expected annual damage in urban pluvial flood risk assessments, Water, 7, 255–270, doi.org/10.3390/w7010255, 2015.
OpenStreetMap contributors: availabe at: http://openstreetmap.org, last access: 7 January 2019.
Paprotny, D., Sebastian, A., Morales-Nápoles, O., and Jonkman, S. N.: Trends in flood losses in Europe over the past 150 years, Nat. Commun., 9, 1985, https://doi.org/10.1038/s41467-018-04253-1, 2018.
Peduzzi, P., Dao, H., Herold, C., and Mouton, F.: Assessing global exposure and vulnerability towards natural hazards: the Disaster Risk Index, Nat. Hazards Earth Syst. Sci., 9, 1149–1159, https://doi.org/10.5194/nhess-9-1149-2009, 2009.
Prahl, B. F., Boettle, M., Costa, L., Kropp, J. P., and Rybski, D.: Damage and protection cost curves for coastal floods within the 600 largest European cities, Sci. Data, 5, 180034, https://doi.org/10.1038/sdata.2018.34, 2018.
Pregnolato, M.: Bridge safety is not for granted – A novel approach to bridge management, Eng. Struct., 196, 109193, https://doi.org/10.1016/j.engstruct.2019.05.035, 2019.
Pryzluski, V., Hallegatte, S., Tomozeiu, R., Cacciamani, C., Pavan, V., and Doll, C.: Weather Trends and Economy-Wide Impacts (Deliverable 1 within the research project WEATHER (Weather Extremes: Impacts on Transport Systems and Hazards for European Regions), International Research Center on Environment and Development, Paris, France, 2012.
Reese, S., Markau, H., and Sterr, H.: Mikroskalige Evaluation der Risiken in überflutungsgefährdeten Küstenniederungen, Forschungs- und Technologiezentrum Westküste, E34893, Kiel, Germany, 168 pp., 2003.
Rogowsky, W.: Erfahrungsbericht vor Ort beim Hochwasser 2013 in Bayern, in: Internationales Wasserbau-Symposium Aachen (IWASA), Aachen, Germany, 7 January 2016–8 January 2016, 1–10, 2016.
Rosina, K., Batistae Silva, F., Vizcaino, P., Marín Herrera, M., Freire, S., and Schiavina, M.: Increasing the detail of European land use/cover data by combining heterogeneous data sets, Int. J. Digit. Earth, 13, 602–626, https://doi.org/10.1080/17538947.2018.1550119, 2018.
Scussolini, P., Aerts, J. C. J. H., Jongman, B., Bouwer, L. M., Winsemius, H. C., de Moel, H., and Ward, P. J.: FLOPROS: an evolving global database of flood protection standards, Nat. Hazards Earth Syst. Sci., 16, 1049–1061, https://doi.org/10.5194/nhess-16-1049-2016, 2016.
Serinaldi, F. and Kilsby, C. G.: A Blueprint for Full Collective Flood Risk Estimation: Demonstration for European River Flooding, Risk Anal., 37, 1958–1976, https://doi.org/10.1111/risa.12747, 2017.
Sohn, J.: Evaluating the significance of highway network links under the flood damage: An accessibility approach, Transport. Res. A-Pol., 40, 491–506, https://doi.org/10.1016/j.tra.2005.08.006, 2006.
Strappazzon, Q. and Pierlot, D.: Stratégie locale de Gestion du Risque Inondation: Grenoble – Voiron, Grenoble, France, Préfet de L'Isère, 116 pp., 2017.
Suarez, P., Anderson, W., Mahal, V., and Lakshmanan, T. R.: Impacts of flooding and climate change on urban transportation: A systemwide performance assessment of the Boston Metro Area, Transp. Res. D Transp. Environ., 10, 231–244, https://doi.org/10.1016/j.trd.2005.04.007, 2005.
Thieken, A. H., Ackermann, V., Elmer, F., Kreibich, H., Kuhlmann, B., Kunert, U., Maiwald, H., Merz, B., Müller, M., Piroth, K., Schwarz, J., Schwarze, R., Seifert, I., and Seifert, J.: Methods for the evaluation of direct and indirect flood losses, RIMAX Contributions at the 4th International Symposium on Flood Defence (ISFD4), Toronto, Ontario, Canada, 6 May 2008–8 May 2008, 1–10, 2009.
Thielen, J., Bartholmes, J., Ramos, M.-H., and de Roo, A.: The European Flood Alert System – Part 1: Concept and development, Hydrol. Earth Syst. Sci., 13, 125–140, https://doi.org/10.5194/hess-13-125-2009, 2009.
van der Knijff, J. M., Younis, J., and De Roo, A. P. J.: LISFLOOD: a GIS-based distributed model for river basin scale water balance and flood simulation, Int. J. Geogr. Inf. Sci., 24, 189–212, https://doi.org/10.1080/13658810802549154, 2010.
van Ginkel, K.: keesvanginkel/OSdaMage: v2.0_NHESS_final_publication (Version 2.0), Zenodo, https://doi.org/10.5281/zenodo.4588800, 2021.
Vennapusa, P. K. R., White, D. J., and Miller, D. K.: Western Iowa Missouri River Flooding – Geo-Infrastructure Damage Assessment, Repair and Mitigation Strategies, InTrans Project Reports 97, Iowa State University, Ames, USA, 180 pp., 2013.
Ward, P. J., Jongman, B., Weiland, F. S., Bouwman, A., van Beek, R., Bierkens, M. F. P., Ligtvoet, W., and Winsemius, H. C.: Assessing flood risk at the global scale: Model setup, results, and sensitivity, Environ. Res. Lett., 8, 44019, https://doi.org/10.1088/1748-9326/8/4/044019, 2013.
Winsemius, H. C., Van Beek, L. P. H., Jongman, B., Ward, P. J., and Bouwman, A.: A framework for global river flood risk assessments, Hydrol. Earth Syst. Sci., 17, 1871–1892, https://doi.org/10.5194/hess-17-1871-2013, 2013.