the Creative Commons Attribution 4.0 License.
the Creative Commons Attribution 4.0 License.
 | 26 Feb 2020
Quantifying seasonal cornice dynamics using a terrestrial laser scanner in Svalbard, Norway
Holt Hancock
Markus Eckerstorfer
Alexander Prokop
Jordy Hendrikx
Snow cornices develop along mountain ridges, edges of plateaus, and marked inflections in topography throughout regions with seasonal and permanent snow cover. Despite the recognized hazard posed by cornices in mountainous locations, limited modern research on cornice dynamics exists and accurately forecasting cornice failure continues to be problematic. Cornice failures and associated cornice fall avalanches comprise a majority of observed avalanche activity and endanger human life and infrastructure annually near Longyearbyen in central Svalbard, Norway. In this work, we monitored the seasonal development of the cornices along the plateaus near Longyearbyen with a terrestrial laser scanner (TLS) during the 2016–2017 and 2017–2018 winter seasons. The spatial resolution at which we acquired snow surface data with TLS enabled us to observe and quantify changes to the cornice systems in detail not previously achieved. We focused primarily on the evolution and failure of the lower cornice surfaces where accessibility has precluded previous research. We measured cornice accretion rates in excess of 10 mm h−1 during several accretion events coinciding with winter storms. We observed five cornice fall avalanche events following periods of cornice accretion and one event following a warm period with midwinter rain. The results of our investigation provide quantitative reinforcement to existing conceptual models of cornice dynamics and illustrate cornice response to specific meteorological events. Our results demonstrate the utility of TLS for monitoring cornice processes and as a viable method for quantitative cornice studies in this and other locations where cornices are of scientific or operational interest.
- Article
(26821 KB) - Full-text XML
- BibTeX
- EndNote


Snow cornices are overhanging projections of snow that form due to the deposition of wind-transported snow in the lee of ridgelines or sharp slope inflections (Montagne et al., 1968; Seligman, 1936). Cornices have attracted interest for their hydrologic implications (e.g., Anderton et al., 2004) and as agents of geomorphic change in periglacial environments (Eckerstorfer et al., 2013; Humlum et al., 2007), but they are perhaps best recognized as a snow and avalanche hazard in mountainous terrain (Montagne et al., 1968; Vogel et al., 2012). Cornices pose an avalanche hazard when they fail either as a full cornice failure with the entire cornice detaching from the ground or as a partial failure with a smaller cornice mass separating from the rest of the cornice. The detached cornice blocks travel downslope under the influence of gravity and become a cornice fall avalanche by entraining loose surface snow or triggering a snow slab on the slope below (e.g., Vogel et al., 2012). In ski areas or where cornices and cornice fall avalanches endanger infrastructure, both explosives (Farizy, 2013; McCarty et al., 1986) and structural defenses (e.g., Montagne et al., 1968) are employed operationally to mitigate cornice hazards. Most cornice-related fatalities, however, occur in recreational backcountry settings and result from the victim's weight triggering cornice failure.
Despite the well-recognized hazards and operational challenges associated with cornices and cornice fall avalanches, specific cornice research is relatively scarce. Early cornice studies summarized by Vogel et al. (2012) focused on qualitative descriptions of cornice formation processes and resulting cornice structures (e.g., Montagne et al., 1968; Seligman, 1936). Later studies investigated mechanisms by which individual snow crystals adhere during cornice accretion (Latham and Montagne, 1970), the physical snow characteristics at various structural locations on individual cornices (Naruse et al., 1985), and the specific interactions between wind-drifted snow and cornice morphology during cornice formation (Kobayashi et al., 1988).
Recent work has refined the conceptual model of seasonal cornice dynamics established by these earlier studies primarily by employing time-lapse photography to examine cornice responses to the meteorological factors controlling the development and failure of cornices (Munroe, 2018; van Herwijnen and Fierz, 2014; Vogel et al., 2012). Vogel et al. (2012) observed cornice processes over two winter seasons on a single mountain slope in central Svalbard and proposed a conceptual model of seasonal cornice dynamics including cornice accretion, deformation, and failure. Their results indicated cornice accretion occurs during or immediately following winter storms with wind speeds in excess of 10 m s−1 from a direction perpendicular to the ridgeline, while cornice scouring resulted from strong winds oriented towards the cornice's leading edge. Smaller cornice failures observed by Vogel et al. (2012) were clustered in June near the end of the snow season and coincided with increasing air temperatures and decreased snow strength. Less frequent failures in the earlier part of the winter often involved the entire cornice mass and resulted in some of the largest cornice fall avalanches observed in the study.
Later work in an alpine setting also linked cornice accretion to strong winds during or soon after a snowfall and found the SNOWPACK wind drift index correlated well with cornice width estimates (van Herwijnen and Fierz, 2014). No cornice failures or cornice fall avalanches were observed in this study, however. Munroe (2018) used time-lapse photography to observe the growth and repeated failure of a cornice in Utah, USA. He also found cornice accretion to primarily coincide with periods of snowdrift. He divided the 19 cornice fall avalanches observed in his study into two distinct groups: snow-caused cornice fall avalanches where failure primarily resulted from snow loading on the cornice and temperature-caused avalanches where failure was related to rapid temperature increases presumably leading to destabilization of the cornice through the loss of snow strength.
We build upon the observational understanding and conceptual model of seasonal cornice dynamics established in these previous works by monitoring cornice systems in Longyeardalen – including one site previously examined by Vogel et al. (2012) – with a terrestrial laser scanner (TLS). TLS – or ground-based lidar (light detection and ranging) – is an active remote sensing technology with documented applications for observing and monitoring various slope processes and hazards including landslides (Jaboyedoff et al., 2012; Prokop and Panholzer, 2009), coastal cliff erosion (e.g., Caputo et al., 2018), and rock slope instability (Abellán et al., 2014). TLS is being increasingly employed in snow and avalanche research to map snow depth and snow depth change (e.g., Deems et al., 2013; Fey et al., 2019; Prokop, 2008; Schirmer et al., 2011). Other specific snow-related applications include quantifying snow drift processes to verify physical models (Mott et al., 2011; Schön et al., 2015; Vionnet et al., 2014), observing avalanche activity to calibrate dynamic avalanche models (Prokop et al., 2015), assisting avalanche control operations (Deems et al., 2013), and planning and designing snow fences that limit hazardous snow accumulation in avalanche release areas (Prokop and Procter, 2016).
We monitored cornice accretion, deformation, failure, and associated cornice fall avalanche activity near Longyearbyen, Svalbard, with TLS technology over two winter seasons (2016–2017 and 2017–2018). To our knowledge TLS has not been employed to specifically monitor cornice dynamics, so our primary objectives are to use the high-spatial-resolution snow surface data acquired via TLS to
-
demonstrate the utility of TLS to observe cornice processes;
-
observe and quantify cornice accretion, deformation, failure, and associated cornice fall avalanches and link these processes to their controlling meteorological factors;
-
use our findings to provide suggestions for forecasting cornice fall avalanches in this and other locations threatened by cornices.
The present study focuses on the cornices forming above Longyeardalen (“the Longyear valley”) in central Svalbard (Fig. 1). Longyeardalen is a glacially sculpted, U-shaped valley with a northeast–southwest-oriented axis running approximately 3 km from the termini of two small mountain glaciers to a fjord. The Gruvefjellet and Platåberget plateaus border Longyeardalen to the west and east, respectively, with Svalbard's administrative center, Longyearbyen, situated in the valley bottom. The Gruvefjellet and Platåberget slopes lie within the horizontally bedded, lower-Tertiary Van Mijenfjord Group of sandstones and shales (Major et al., 2001). Resistant strata within this group form the area's extensive plateau topography. The entire region is underlain by continuous permafrost ranging in thickness from 100 m near the coasts to over 500 m in the higher mountains (Humlum et al., 2003).
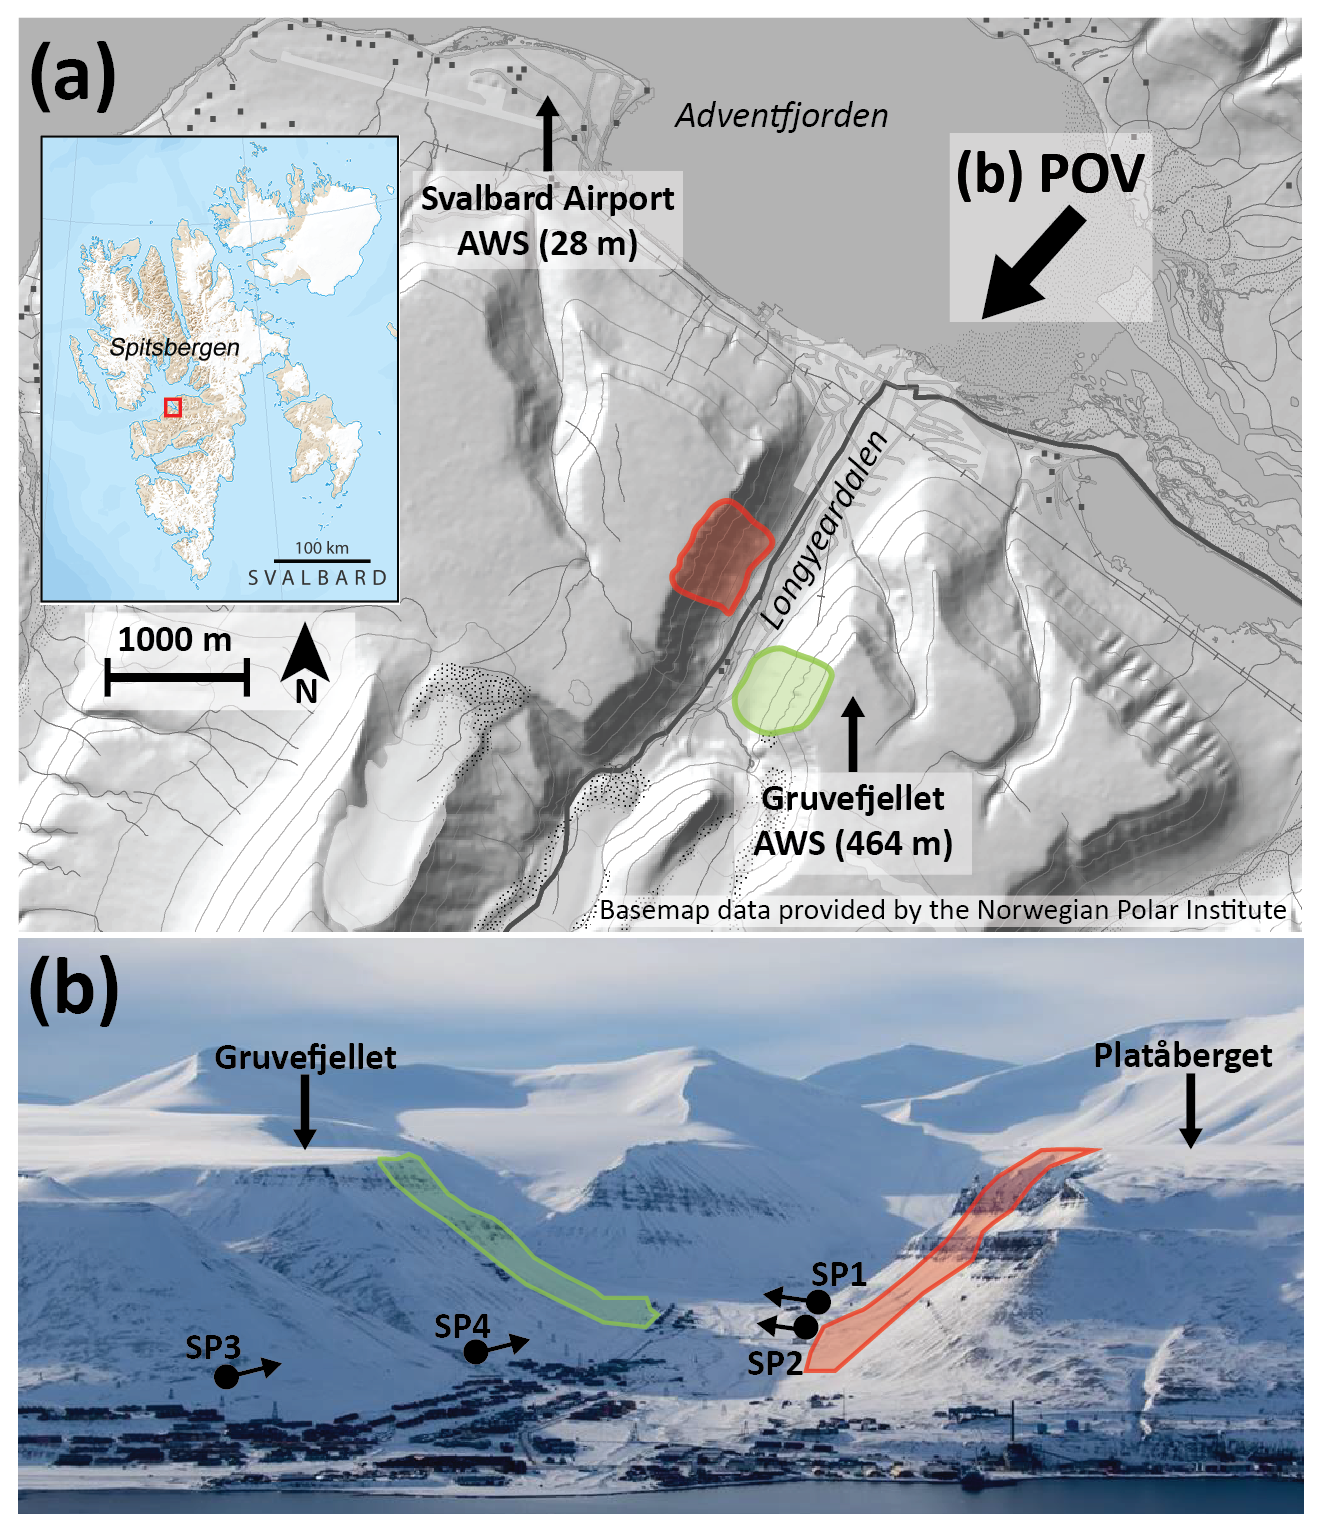
Figure 1Overview of Longyeardalen and key locations, including automated weather stations (AWSs), mentioned in the text. Contour lines in (a) are spaced at 100 m. The location and direction from which the photo in (b) was taken is indicated by POV (point of view) in (a). The location and extent of the Gruvefjellet and Platåberget study sites are indicated in (a) and (b) with green and red shading, respectively. Locations of scan positions SP1, SP2, SP3, and SP4 as well as the orientation of the scanner at each position are also indicated.
We investigated seasonal cornice dynamics and cornice fall avalanches along and under the Gruvefjellet and Platåberget plateau margins, respectively (Fig. 2). The steep valley walls descending from the broad plateau summits (approximately 450 m elevation) are characterized in their upper portions by protruding resistant bedrock buttresses and transport couloirs incised by fluvial and gravitational slope processes. The Gruvefjellet slope described in detail by Eckerstorfer et al. (2013) consists of a 50–70 m near-vertical bedrock cliff situated under the plateau margin and over a 40–50∘ slope that serves as a slab avalanche release area. This broad slope transitions into the transport couloirs which in turn feed extensive avalanche fan deposits downslope. Similar morphology exists on the Platåberget slope, but the plateau margin transitions directly into discrete 45–55∘ release areas leading into the couloirs and lacks the near-vertical bedrock face present on Gruvefjellet.
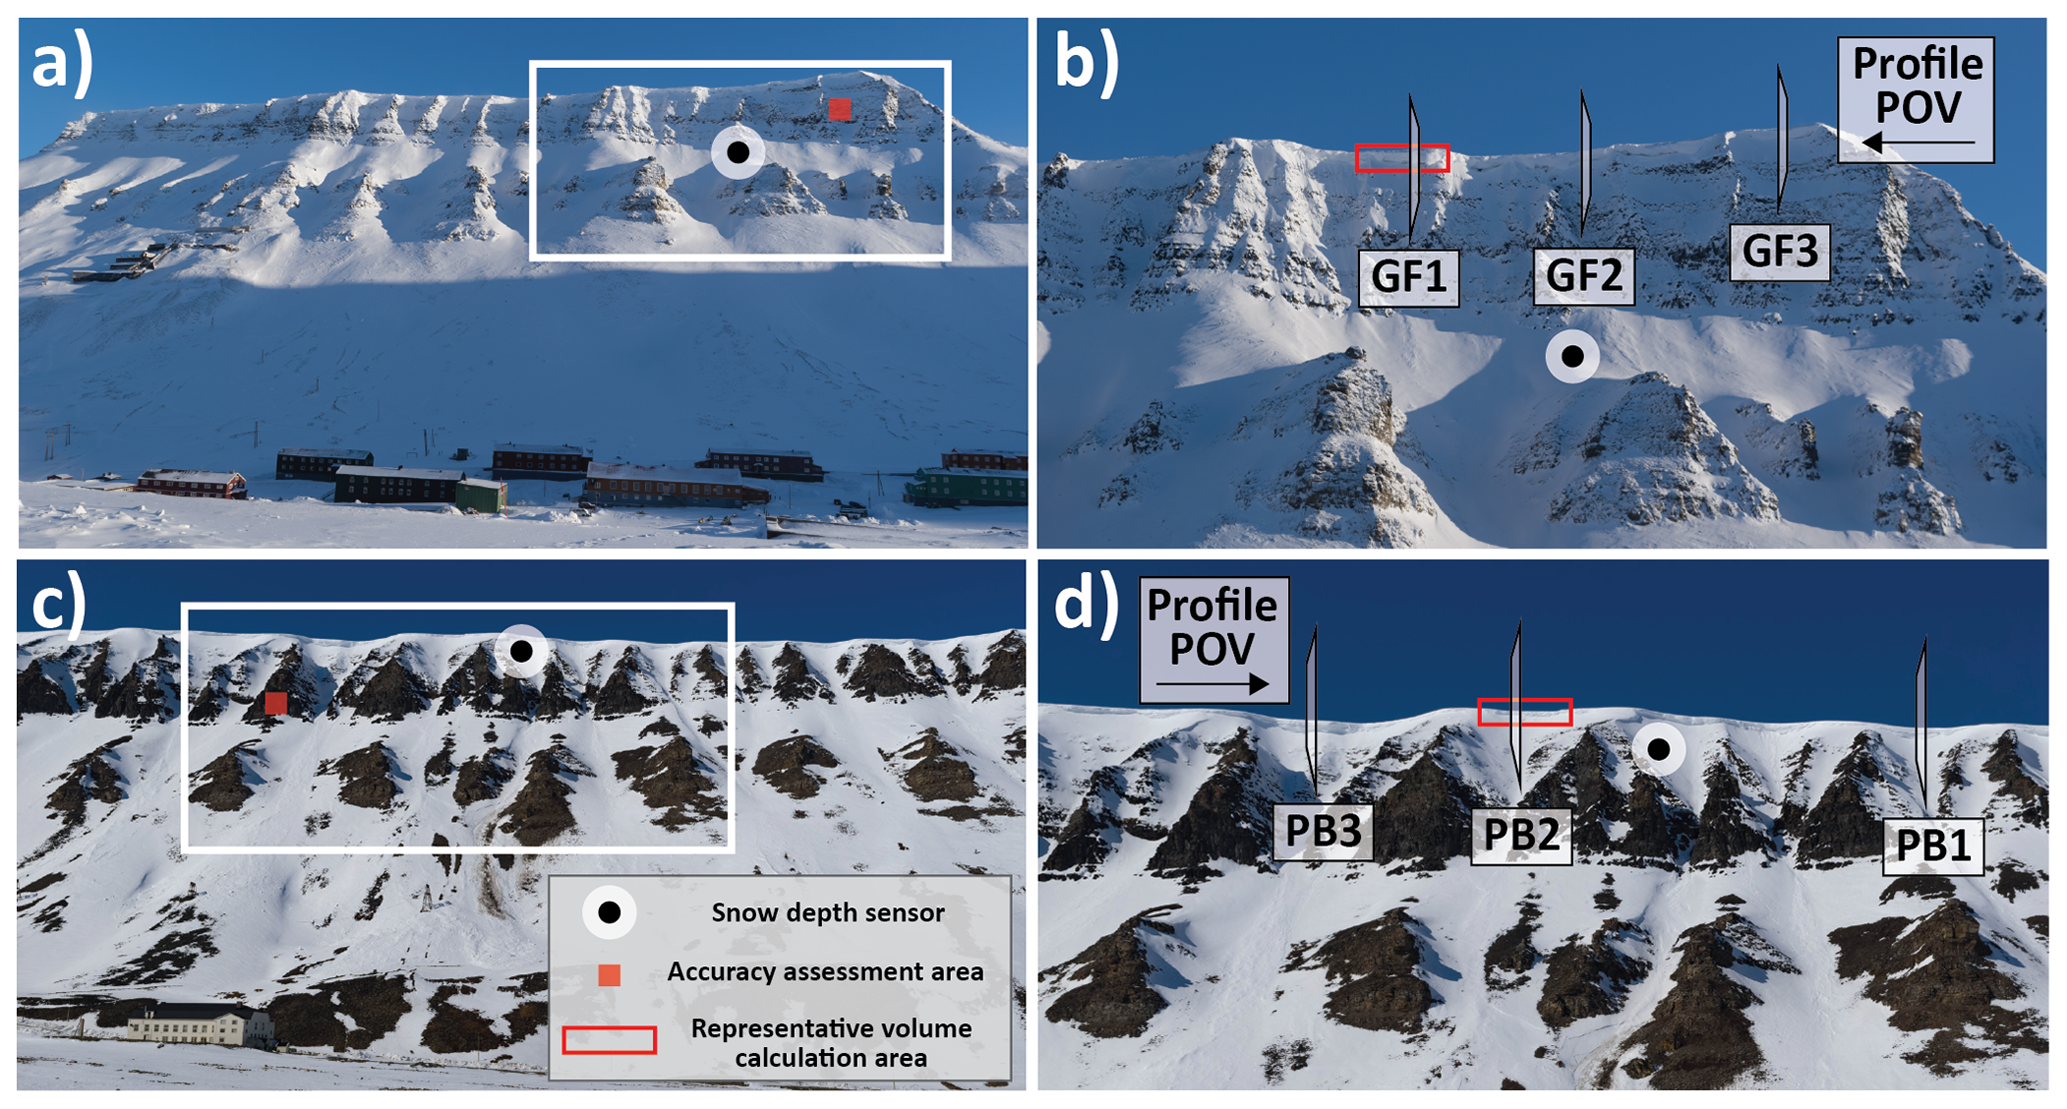
Figure 2Overview of the cornice systems and locations of the primary spatial data employed in this work. Panel (a) shows Gruvefjellet from SP1 taken on 21 March 2017, with the white rectangle approximating the 600 m horizontal extent of (b). Panel (b) indicates the location of the 2-D cross-sectional profiles GF1, GF2, and GF3. Panel (c) shows Platåberget from SP4 taken on 24 May 2017, with the white rectangle approximating the 600 m horizontal extent of (d). Panel (d) indicates the location of the 2-D cross-sectional profiles PB1, PB2, and PB3.
Central Svalbard's climate is cold and arid, with a mean annual air temperature of −4.6 ∘C and mean annual precipitation of 191 mm at the Svalbard Airport automated weather station (AWS) for the 1981–2010 period of record (Førland et al., 2011). Combined mean winter (DJF) and mean spring (MAM) precipitation for 1981–2010 is 86 mm (Førland et al., 2011). Mean winter air temperature for the same period is −11.7 ∘C and mean spring air temperature is −8.3 ∘C (Førland et al., 2011). Rapidly increasing air temperatures in the winter and spring in response to decreased sea ice extent (Isaksen et al., 2016) create difficulties establishing representative baseline temperature conditions, with recent reports indicating warming on the order of 3–5 ∘C for Svalbard as a whole from 1971 to 2017 (Hanssen-Bauer et al., 2019). Less clear changes are apparent in the precipitation trends (e.g., Hanssen-Bauer et al., 2019), but midwinter rain-on-snow events are dramatically increasing in frequency (e.g., Vikhamar-Schuler et al., 2016).
The climate of Svalbard prohibits the growth of woody vegetation, and snow distribution across the landscape is thus strongly controlled by the wind (e.g., Jaedicke and Sandvik, 2002). Southeasterly winds generally prevail across the region's plateau mountains but often switch to westerly or southwesterly during winter storms and are frequently redirected along the major valley axes at lower elevations (Christiansen et al., 2013). Winter weather in central Svalbard fluctuates between extended periods of cold, stable high pressure punctuated by warm, wet low-pressure systems conveyed northwards along the North Atlantic cyclone track (Hanssen-Bauer et al., 1990; Rogers et al., 2005). This is reflected in the region's snow and avalanche climate, where the snowpack typically consists of persistent weak layers formed during high pressure interspersed with wind slabs or ice layers formed during snowstorms or rain-on-snow events (Eckerstorfer and Christiansen, 2011a). Avalanche activity here displays a strong topographical and meteorological control, with direct action slab avalanches clustered around winter storms and the region's plateaus serving as source areas for the extensive cornice systems that contribute to frequent cornice fall avalanches (Eckerstorfer and Christiansen, 2011b).
3.1 Automated snow and weather data
We obtained wind and air temperature data from the Gruvefjellet automated weather station (AWS), precipitation data from the Svalbard Airport AWS, and a limited time series of snow depth data from a pair of ultrasonic snow depth sensors placed in avalanche release areas on Gruvefjellet and Platåberget during the 2017–2018 winter season (Figs. 1 and 2). We defined the winter season as 1 December to 30 June for the purposes of this study. The Gruvefjellet AWS is located less than 500 m east of the Gruvefjellet cornice system at an elevation of 464 m and records hourly meteorological data. The Svalbard Airport AWS is situated approximately 5 km northwest of the study area at 28 m and is the only weather station in the region with long-term precipitation measurements.
As part of the installation of a network of automated snow monitoring stations in Longyeardalen (Prokop et al., 2018), we mounted two ultrasonic snow depth sensors in avalanche release areas under the cornice systems in autumn 2017. These sensors were located at 350 and 450 m elevation on Gruvefjellet and Platåberget, respectively (Fig. 2). We employed the Campbell Scientific SR50A ultrasonic distance sensor to measure snow depth at each location. The snow sensors began recording reliable snow depth data on 15 November 2017 and continued until the end of the 2017–2018 season at 10 min intervals.
3.2 Terrestrial laser scanning (TLS) and post-processing
We used a Riegl® Laser Measurement Systems VZ-6000 ultra-long-range terrestrial laser scanner to repeatedly scan the Gruvefjellet and Platåberget cornice systems throughout the 2016–2017 and 2017–2018 winter seasons. The VZ-6000's 1064 nm operating wavelength is particularly well-suited for measuring snow surfaces, while the high scanning speed and measurement range up to 6 km with a 30 kHz pulse repetition rate ensured adequate data acquisition capabilities across the study area in a variety of atmospheric conditions (Riegl® Laser Measurement Systems, 2019; Prokop, 2008).
We use data from 25 scans of Gruvefjellet and 22 scans of Platåberget during the duration of the study (Appendix A). Of these, one scan from Gruvefjellet and Platåberget each is a snow-free surface taken on 16 September 2016. For Gruvefjellet, we acquired usable snow surface data from 18 scans during the 2016–2017 season and seven scans during 2017–2018. We acquired 14 snow surface scans of Platåberget during 2016–2017 and seven scans during 2017–2018. The TLS was unfortunately damaged in late April 2018, and we were unable to acquire any scans after our final scan on 13 April 2018.
We preprocessed the raw point clouds in RiSCAN Pro, Riegl's proprietary data processing software. We established a suite of ground control points on both Platåberget and Gruvefjellet using a differential global positioning system (DGPS) which we used to georeference individual point clouds. We then aligned repeated snow-covered scans to the snow-free scans established in September 2016 using these ground control points and the “Multi-Station Adjustment” plugin in RiSCAN Pro following the approach outlined by Prokop and Panholzer (2009). We then manually filtered non-ground points or points above the snow surface. Finally, we applied an octree filter with a 0.10 m increment and exported to an XYZ text file.
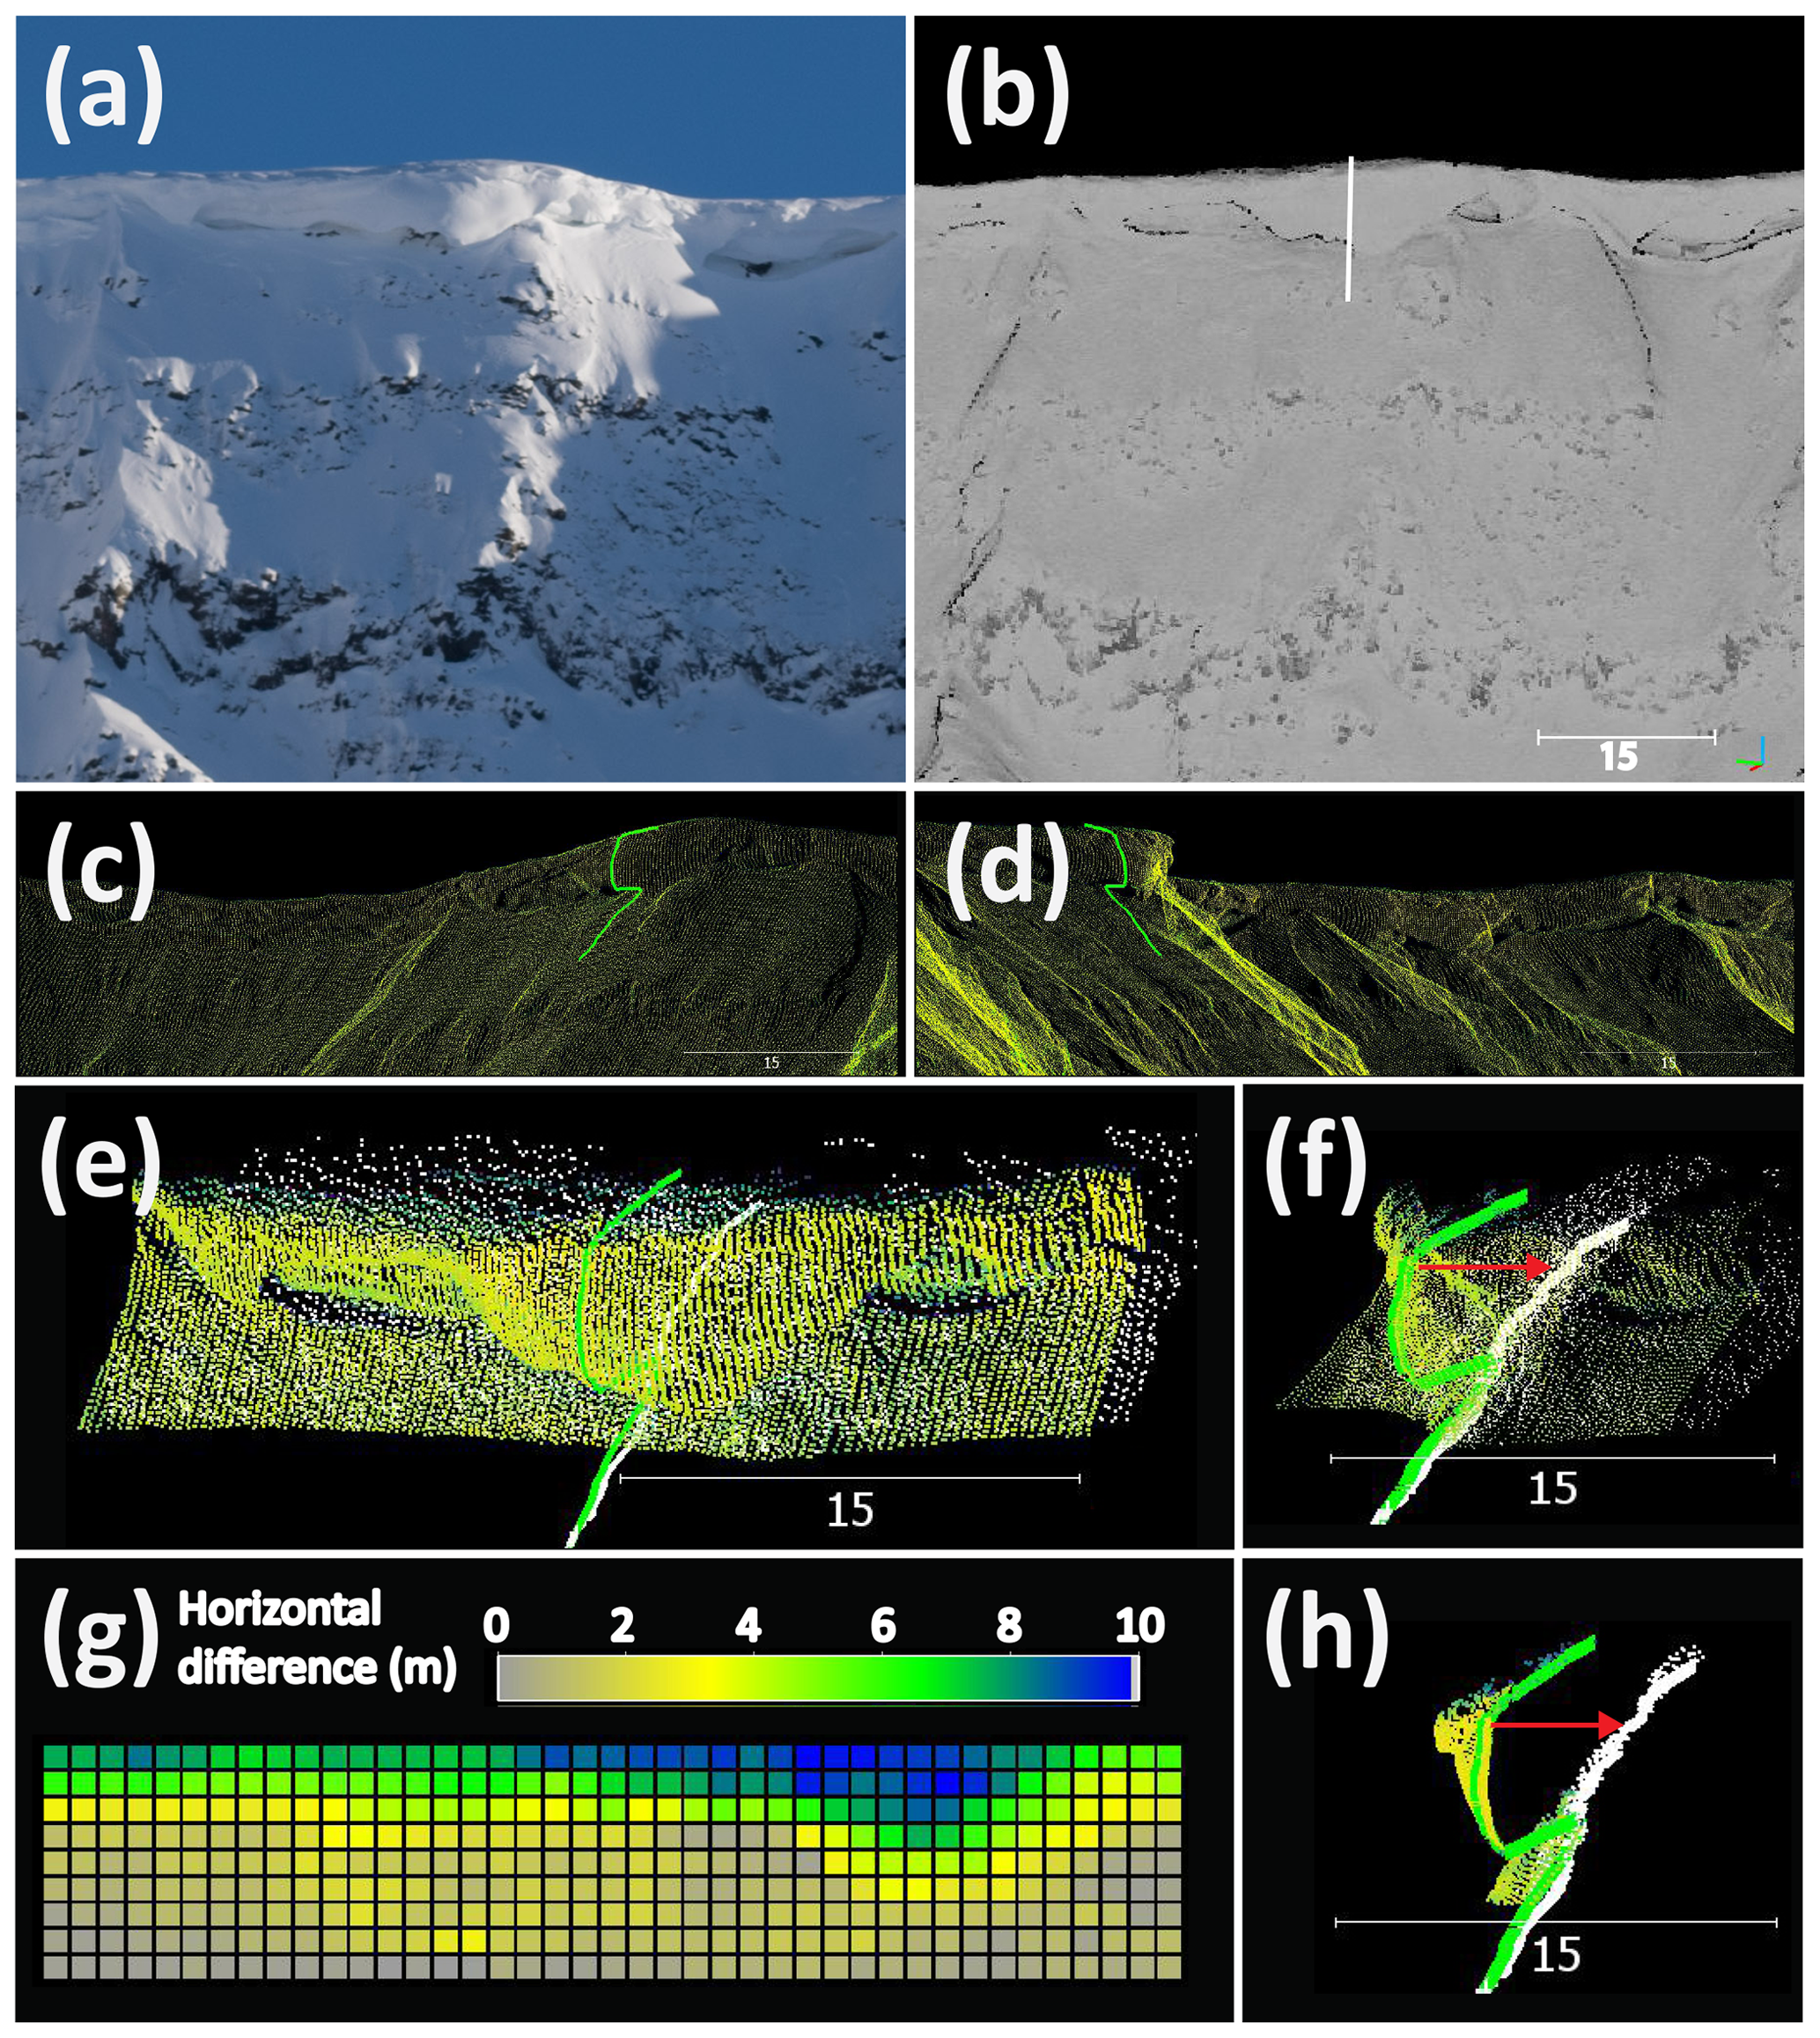
Figure 3Visualization of the point cloud processing methods in CloudCompare. Panel (a) shows a photo of the cornice represented by profile GF1 on 21 March 2017. Panel (b) shows the same surface as represented by the 0.10 m point cloud. The manually defined axis of GF1 is indicated by the white line. Panels (c) and (d) show the 21 March scanned surface and extracted profile from two vantage points. Panel (e) displays both the 21 March (colored points) and bare-earth (white points) surfaces oriented parallel to the projection direction, with the 21 March profile (green) and bare-earth profile (white) also indicated. Panels (f) and (h) display similar data but with the surfaces oriented roughly perpendicular to the projection direction (shown with red arrows), and (h) shows a cross section of the surface shown in (e) and (f). The 1 m grid showing the horizontal differences between the 21 March and bare-earth scans is displayed in (g). All scale bars are in meters.
We imported individual point clouds into CloudCompare (CloudCompare, 2019) for further analyses (Fig. 3). To create 2-D cornice profile cross sections, we extracted point cloud profile sections along manually defined axes using the polyline extraction tool native to CloudCompare (Fig. 3c and d). This tool requires user-defined inputs for profile type, section thickness, and maximum edge length which we set to “both”, 0.6 and 0.2 m. We then manually edited and digitized the resulting shapefiles in the ArcScene 3-D Editing environment (ArcGIS 10.4.1) to create the vertical cornice profile schematics as 3-D shapefiles.
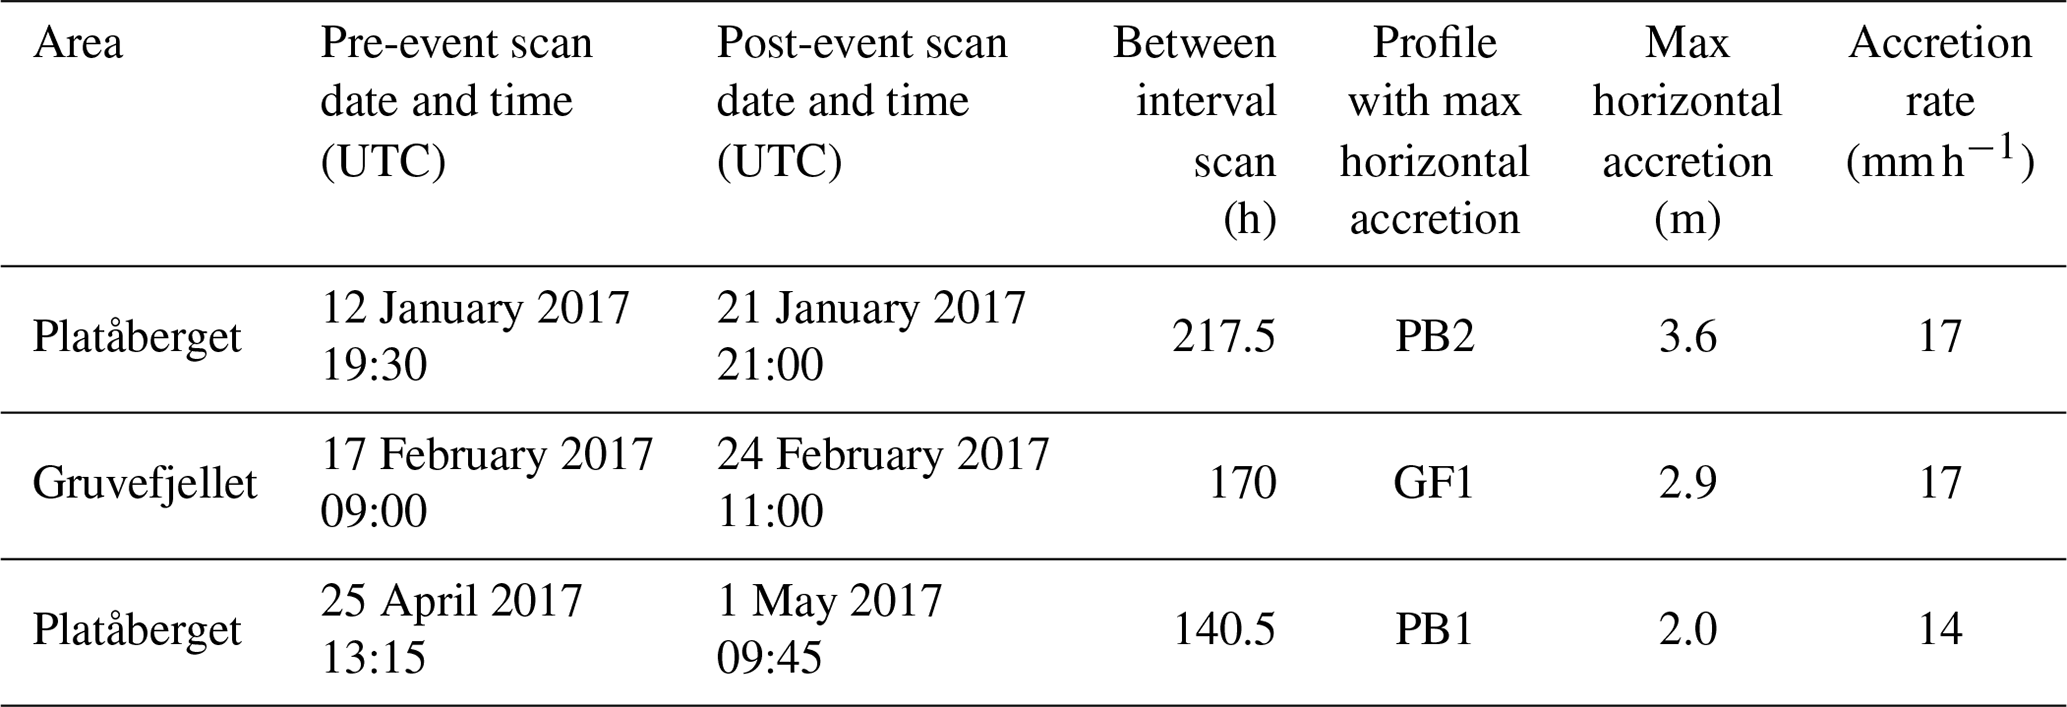
We calculated representative volumes for selected areas from both the Platåberget and Gruvefjellet cornice systems using the “compute 2.5-D volume” tool in CloudCompare. This tool computes the volume between two 2.5-D point clouds by rasterizing the point clouds to a specified grid size and then computing volumes based on the differences in a specified projection direction between the rasterized values (Fig. 3e–h). In our case, we rasterized our point clouds to a 1 m grid and calculated horizontal distance differences along the “X” projection direction, which in our georeferenced point clouds corresponds to east–west (i.e., the slope fall lines). For each cornice system, we computed the volume of snow in a 40 m × 8 m area of the plateau margin for each usable snow surface scan by subtracting the bare-earth surface from the scanned snow surface (Fig. 3e–g). We chose this areal extent to maximize coverage of an individual cornice throughout its development during the season (i.e., to completely capture the vertical extension of the leading edge) while minimizing volume changes related to other snow on the slope.
We used the Multiscale Model-to-Model Cloud Comparison (M3C2) algorithm developed by Lague et al. (2013) and implemented as a plugin in CloudCompare to quantify changes in the cornices and snow surfaces on the slopes below in 3-D. The M3C2 algorithm allows for direct comparison of point clouds in 3-D and is specifically developed to handle 3-D differences and detect changes to complex surfaces where both vertical and horizontal changes exist (Lague et al., 2013). This functionality requires the user to input the following parameters: the normal scale, the projection scale, and the maximum depth (e.g., Lague et al., 2013; Watson et al., 2017). We selected a normal scale of 2 m oriented positively to the scan position (i.e., the normals “face” the scan position), a projection scale of 1 m, and a maximum depth of 10 m for all M3C2 calculations.
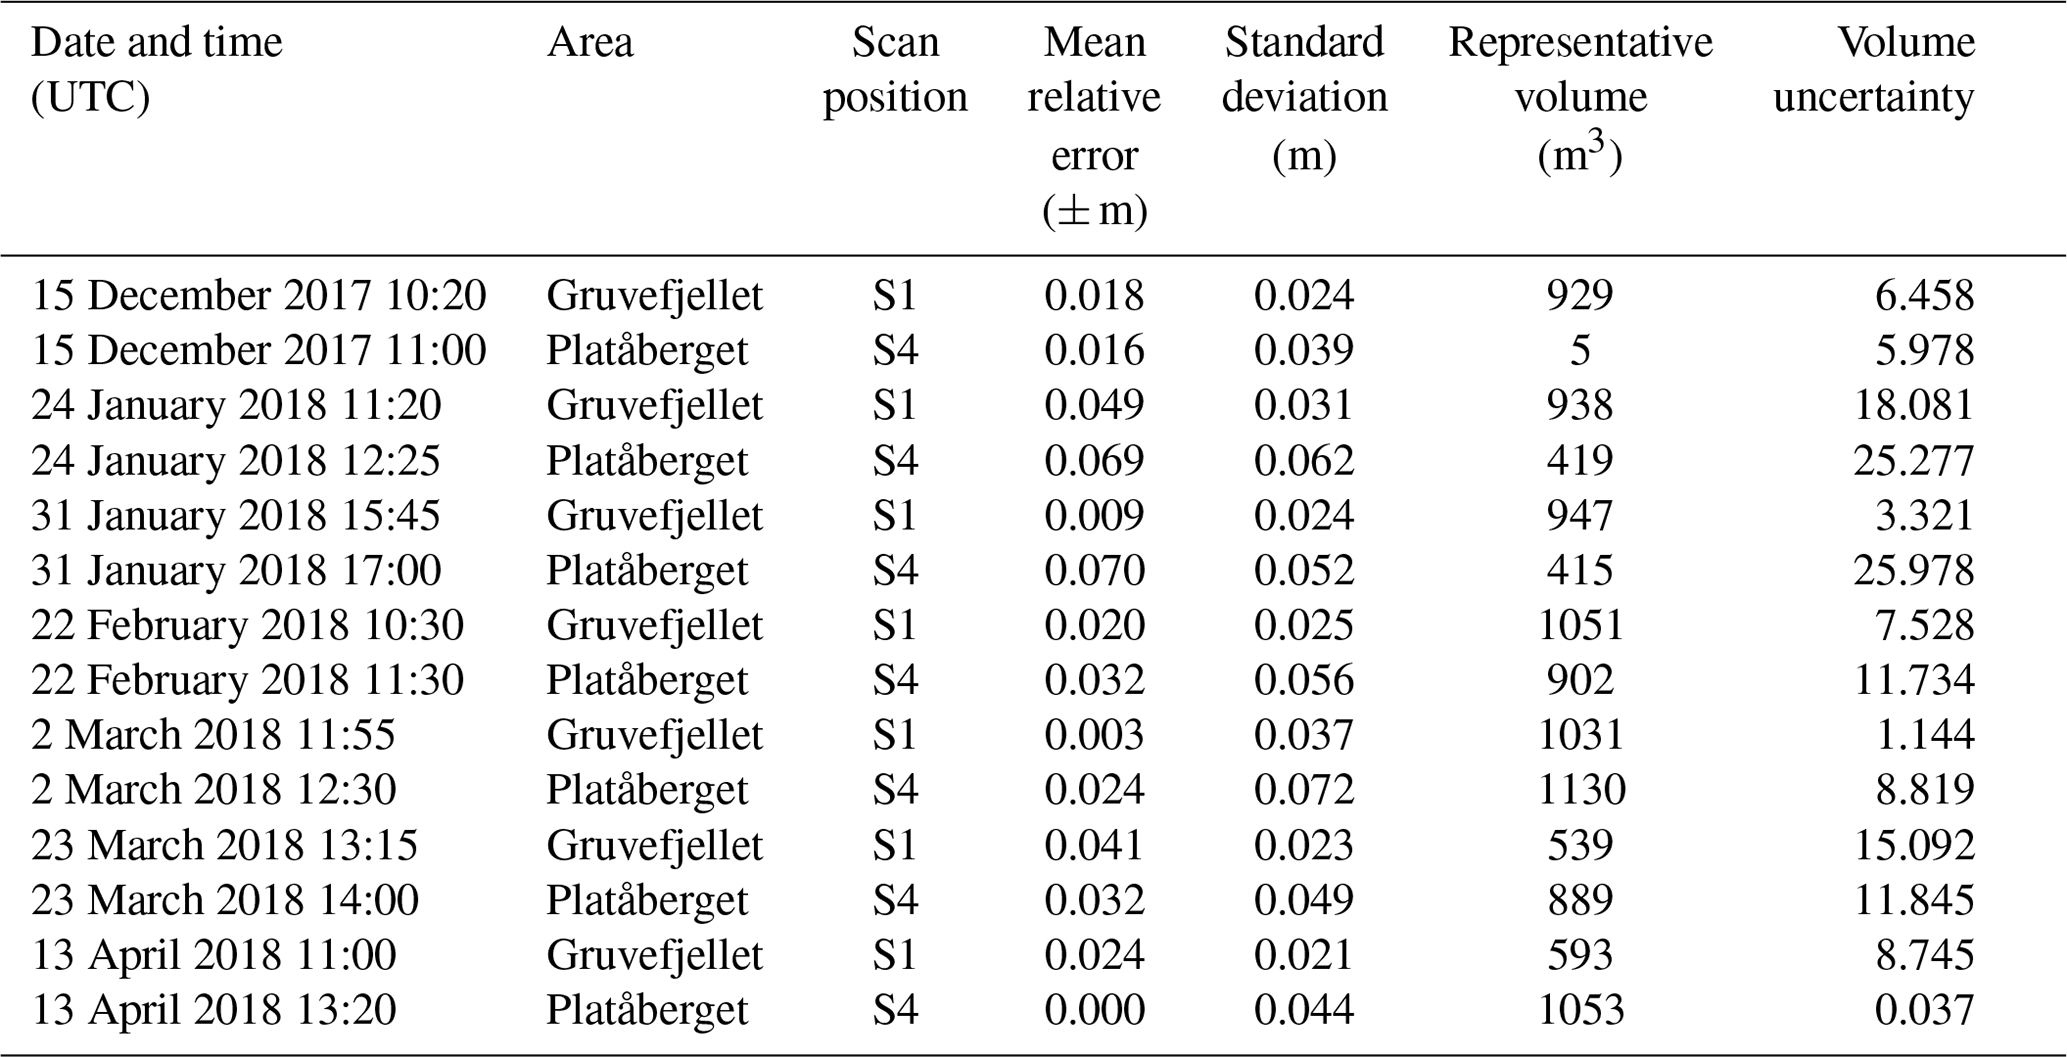
TLS-based snow surface measurement accuracy generally decreases with increasing distance from the scanner to the measured snow surface and is affected by the manner in which the laser beam interacts with the snow surface, the local terrain characteristics, the stability of the scanner while scanning, and the quality of the scan data registration process (Fey et al., 2019; Hartzell et al., 2017; Prokop et al., 2008). The relative accuracy – the deviation between measurements of an unchanged surface taken under different measurement conditions – can be assessed to quantify uncertainties related to both registration errors and positional errors from the interaction of the laser beam with the surface (Fey et al., 2019; Prokop and Panholzer, 2009). We assessed relative accuracy for our data by measuring M3C2 distances between each snow-covered scan and the snow-free scan on a 10 m × 10 m area of stable, snow-free rock faces near the cornices on both Gruvefjellet and Platåberget (Fig. 2). We were unfortunately limited to this single area on which to conduct accuracy assessments because all other surfaces near the cornices became snow covered at some point during the study. We report relative accuracy for each snow-covered scan as the mean of all M3C2 distances on the 10 m × 10 m area (Appendix A). This location for the relative accuracy assessment was selected based on its ability to remain functionally snow-free throughout the study and because it was not otherwise used in the registration process. As both registration and positional errors can be spatially variable across the scanned area (Fey et al., 2019; Hartzell et al., 2017; Prokop, 2008), we used this location in close proximity to the cornices of interest to best represent the relative accuracy near the cornices. Mean M3C2 distance values are smaller than 80 mm for all scans, with standard deviations ranging from <10 to 72 mm (Appendix A). Uncertainty associated with the relative volume metric, calculated by multiplying the relative accuracy of each scan by the surface area considered in the volume calculations (369 m2) thus ranged from less than 1 to 28 m3 (Appendix A).
3.3 Supplemental observational data
We relied on snow and avalanche observations from Platåberget and Gruvefjellet from the Norwegian Water Resources and Energy Directorate's (NVE) online observation platform regObs (https://www.regobs.no/, last access: 6 October 2019) to supplement our TLS observations. Local observers conduct snow and avalanche assessments on the Gruvefjellet and Platåberget slopes on a sub-weekly basis, so we were able to much better constrain avalanche cycle timing than with the temporal resolution available from the TLS data.
4.1 Seasonal summaries of meteorological conditions and cornice dynamics
4.1.1 2016–2017
We compare seasonal meteorological conditions (Fig. 4) with cross-sectional cornice profiles derived from eight scanned snow surfaces on Gruvefjellet and seven surfaces on Platåberget. We selected these profiles from a pool of 18 usable scans from Gruvefjellet and 14 from Platåberget (Appendix A) to represent key points in the development of the cornice systems.
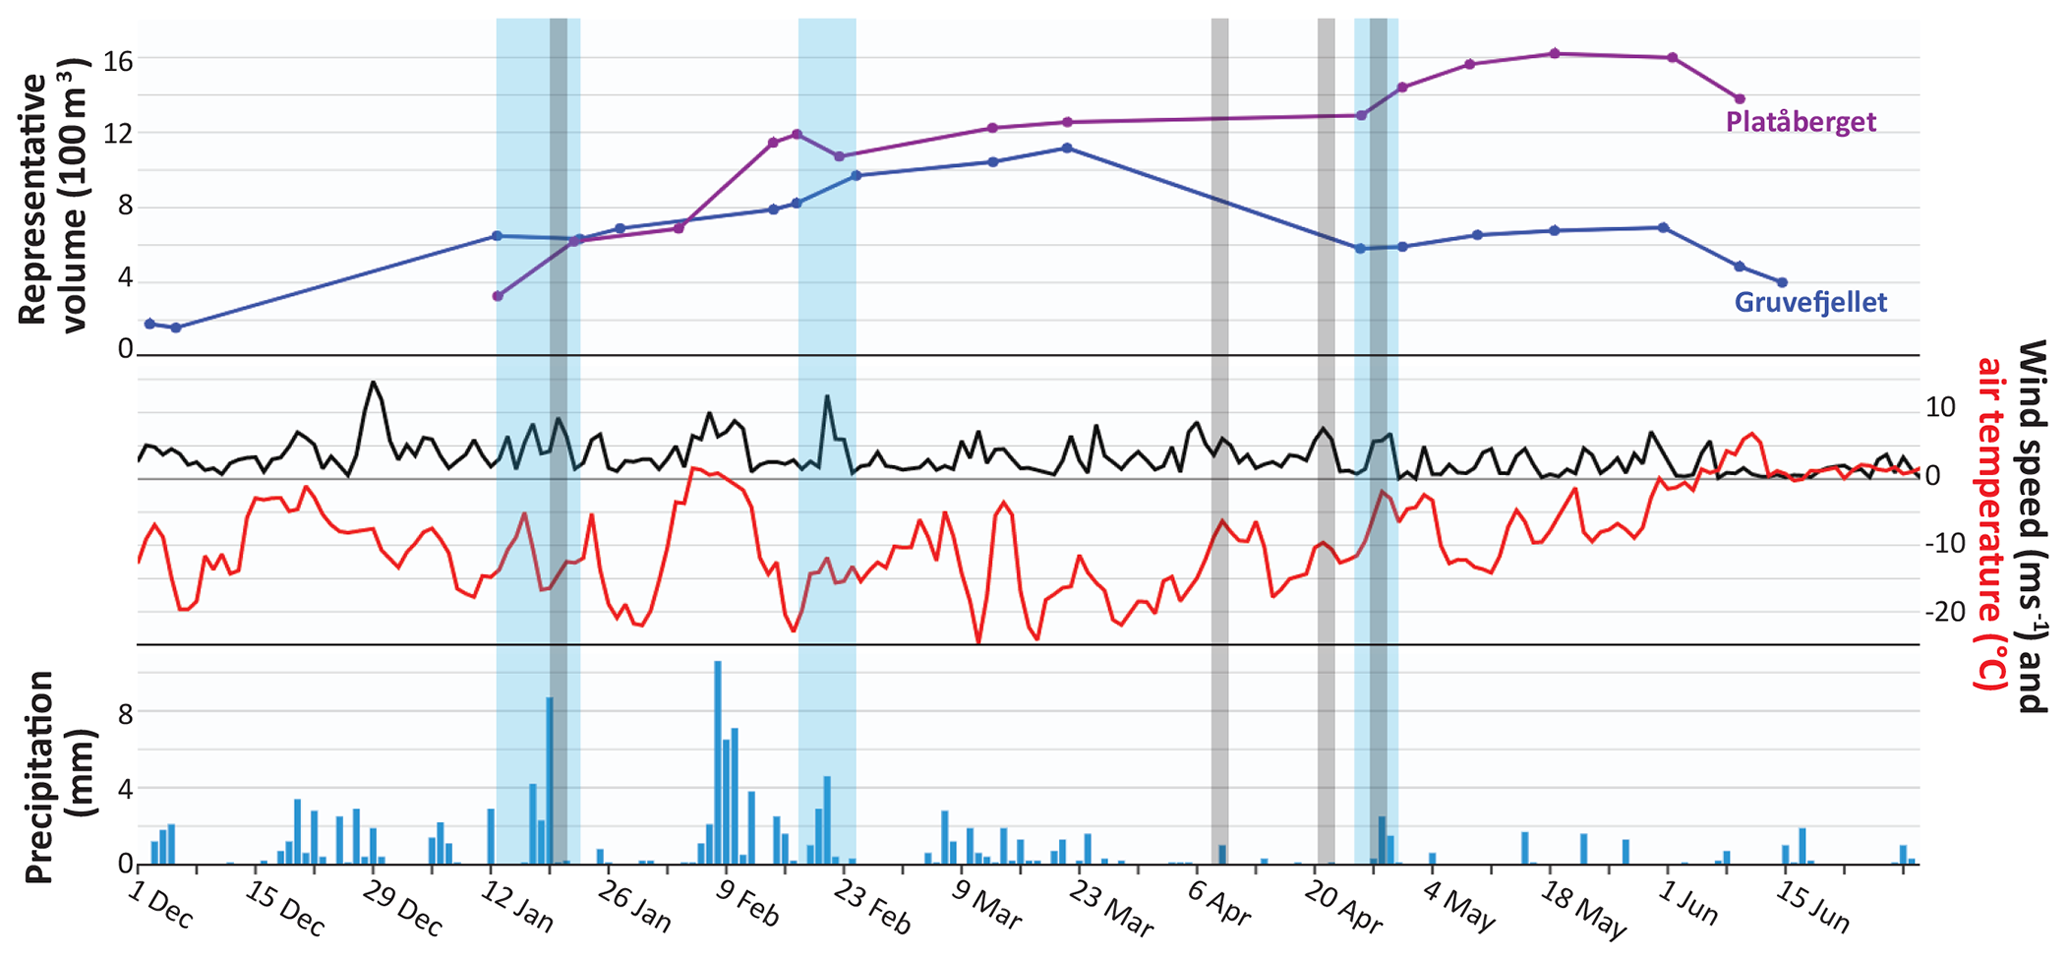
Figure 4Summary of the representative cornice volume progression and meteorological conditions for the 2016–2017 winter season. Wind speed and air temperature are daily averaged values from the Gruvefjellet AWS, and precipitation data are daily values from the Svalbard Airport AWS measured at 06:00 UTC. Shaded blue vertical bars indicate well-constrained cornice accretion periods for which we were able to calculate horizontal cornice accretion rates (Table 2). Shaded grey vertical bars indicate 48 h periods with observed noteworthy cornice fall avalanche activity (Table 1).
Small cornices had accumulated on Gruvefjellet by 2 December 2016. Maximum horizontal cornice growth prior to this scan occurred in the vicinity of profile GF2, where both vertical and horizontal cornice growth exceeded 1 m from the edge of the plateau (Fig. 5). The representative cornice volume in the vicinity of profile GF1 already approached 200 m3. Temperatures remained below freezing over the next month, and daily averaged wind speeds exceeded 10 m s−1 only on 29 December 2016. By 12 January 2017, the representative cornice volume on Gruvefjellet had more than tripled relative to early December to over 600 m3. Horizontal cornice extension along the Gruvefjellet cornice system exceeded 4 m in most locations, with maximum horizontal extension near profile GF1 exceeding 5 m (Fig. 5). The representative cornice volume of just over 300 m3 from the Platåberget cornices on the same date shows considerably less cornice growth (Fig. 4).
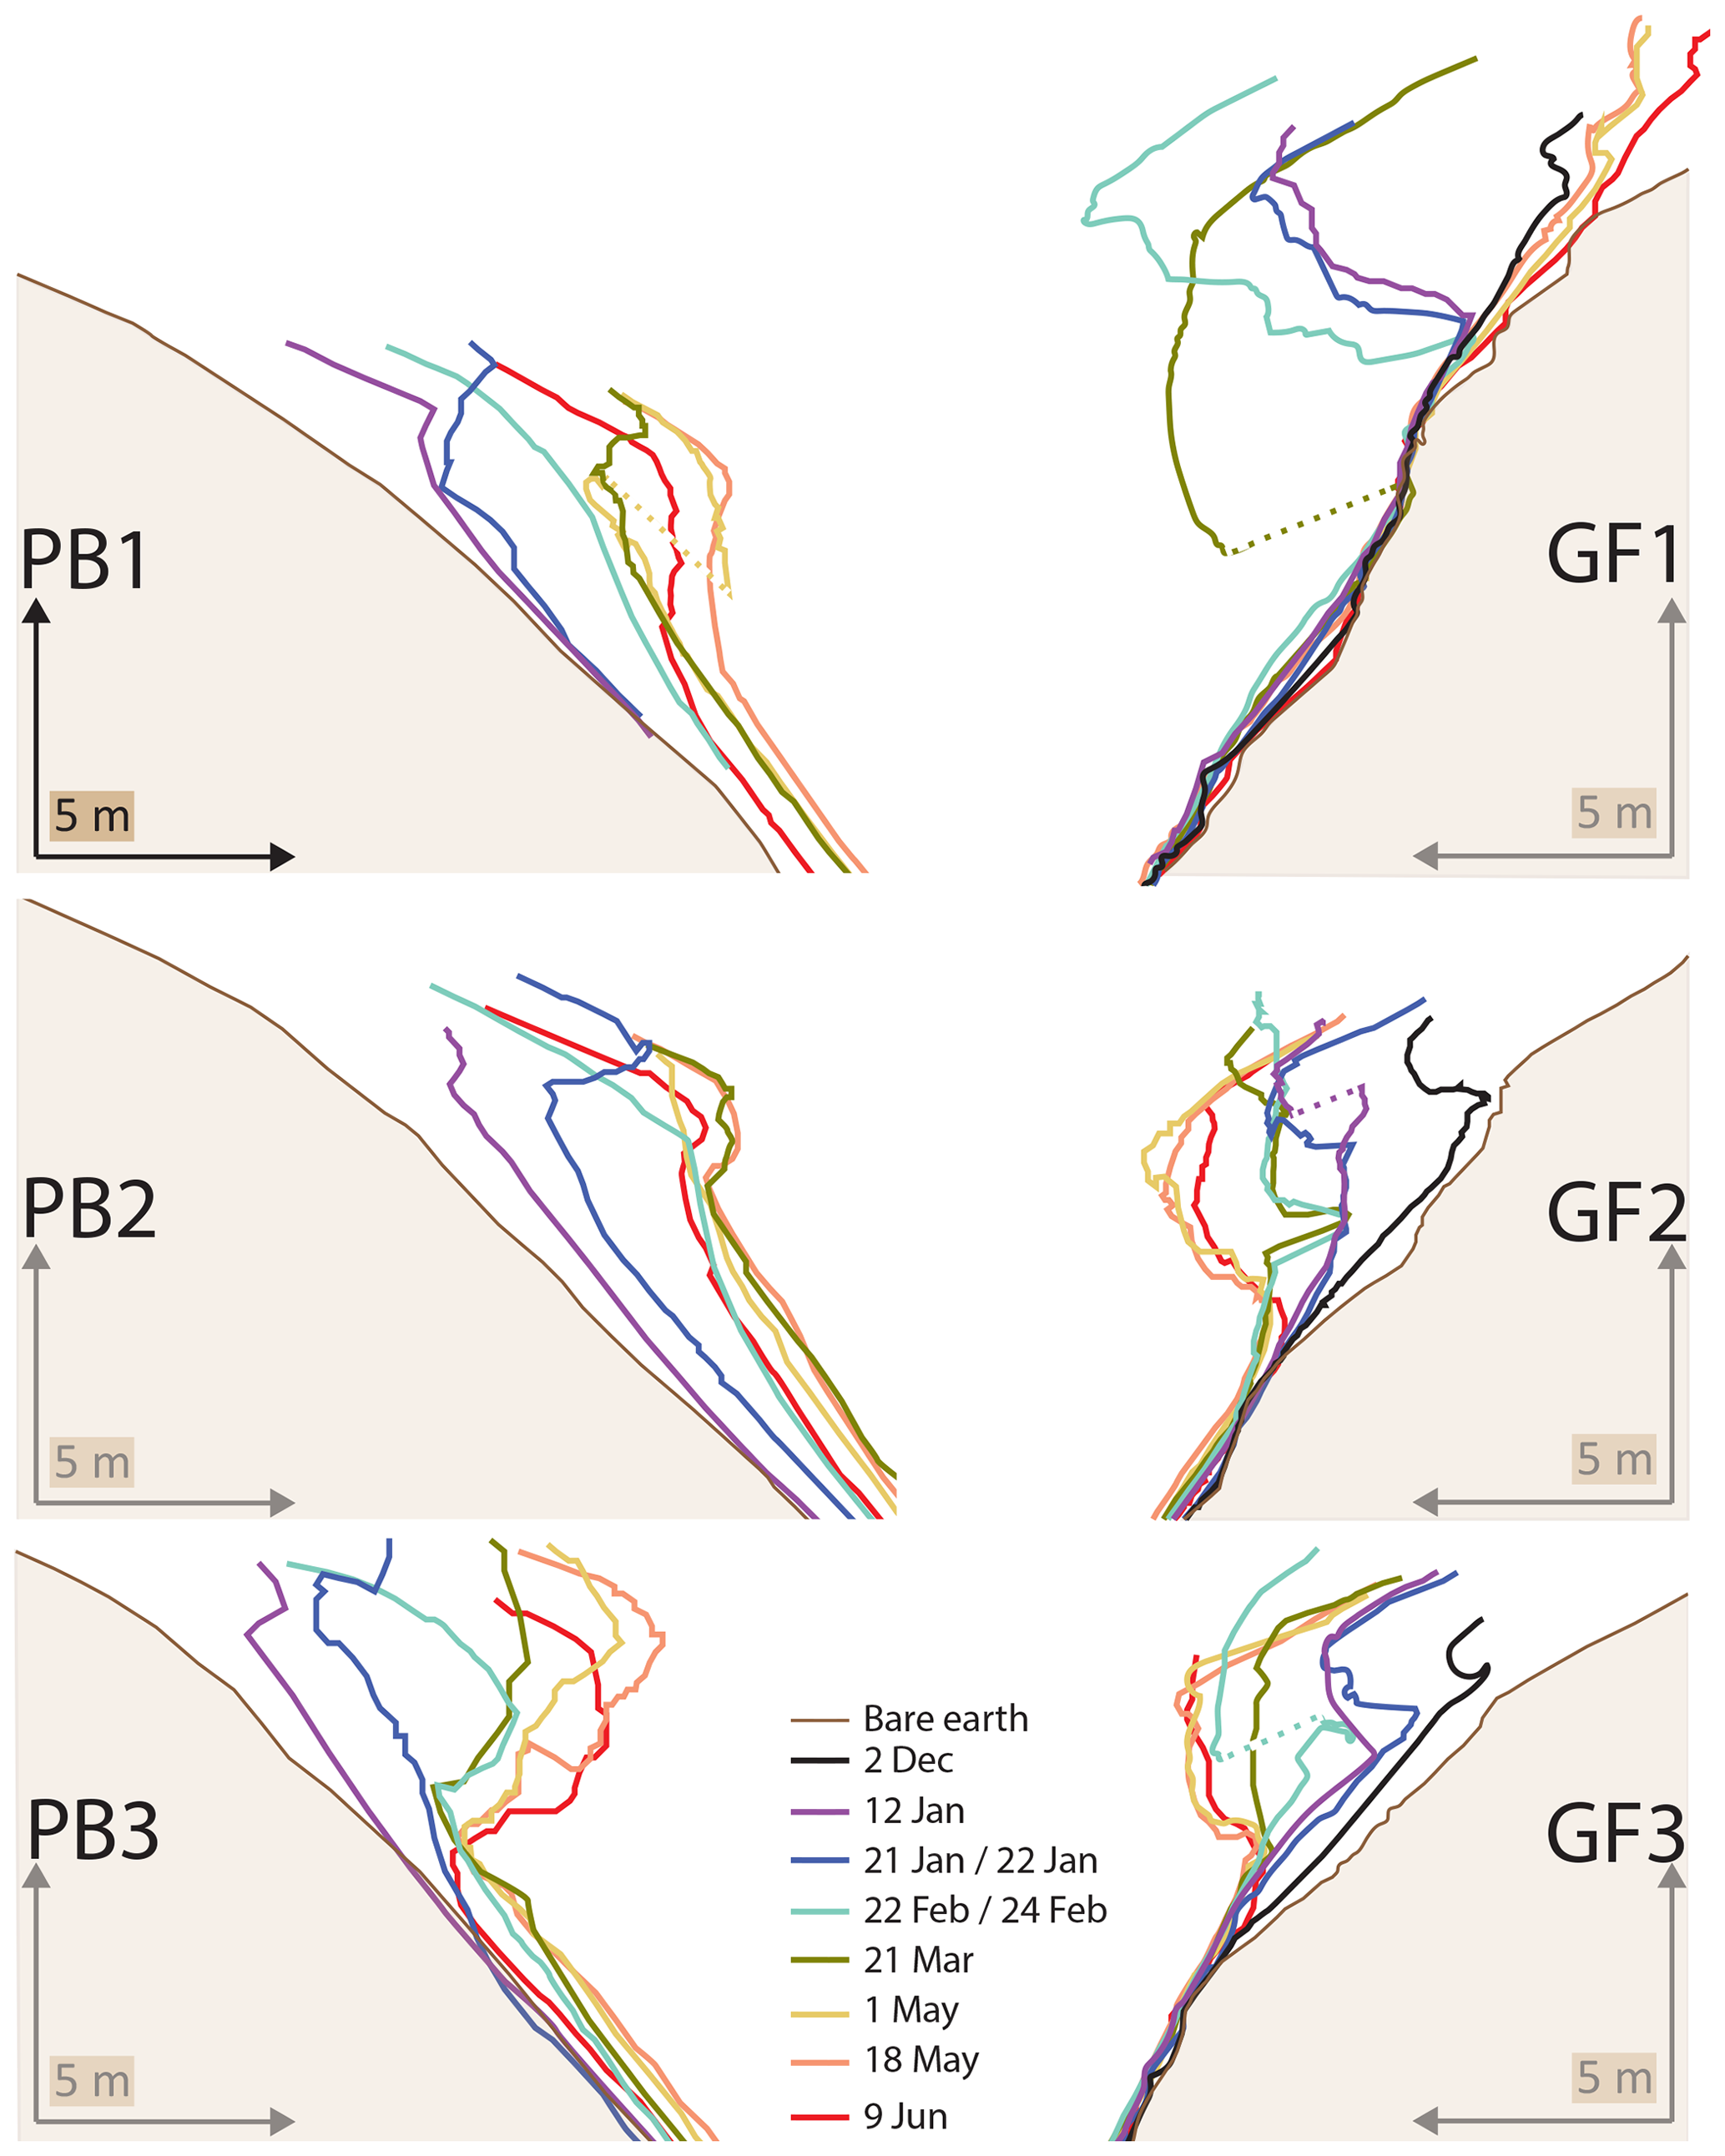
Figure 5The 2-D cornice profiles showing cornice progression for selected scan dates throughout the 2016–2017 winter season. Each profile is labeled as it is referred to in the text and corresponds to the location and POV depicted in Fig. 2.
Heavy snowfall followed by strong westerly winds preceded several cornice fall avalanches on 21 January on Platåberget (Fig. 4, Table 1). Representative cornice volume on Platåberget nearly doubled from roughly 300 to over 600 m3 between the 12 and 21 January scans. Horizontal accretion on profile PB2 exceeded 3.5 m, resulting in an accretion rate of 17 mm h−1 (Table 2). The cornice represented by profile PB1 failed, triggering a cornice fall avalanche (Size D2, R3 after American Avalanche Association, 2016) which reached the road at the foot of the slope. The failure plane represented by the 21 January profile on PB1 does not extend back to the 12 January surface, suggesting newly accreted snow comprised the bulk of the failure (Fig. 5). Cornices on Gruvefjellet experienced comparably minor changes during this event, with the representative volumes decreasing by just 30 m3 and minimal changes evident in the profiles (Fig. 5).
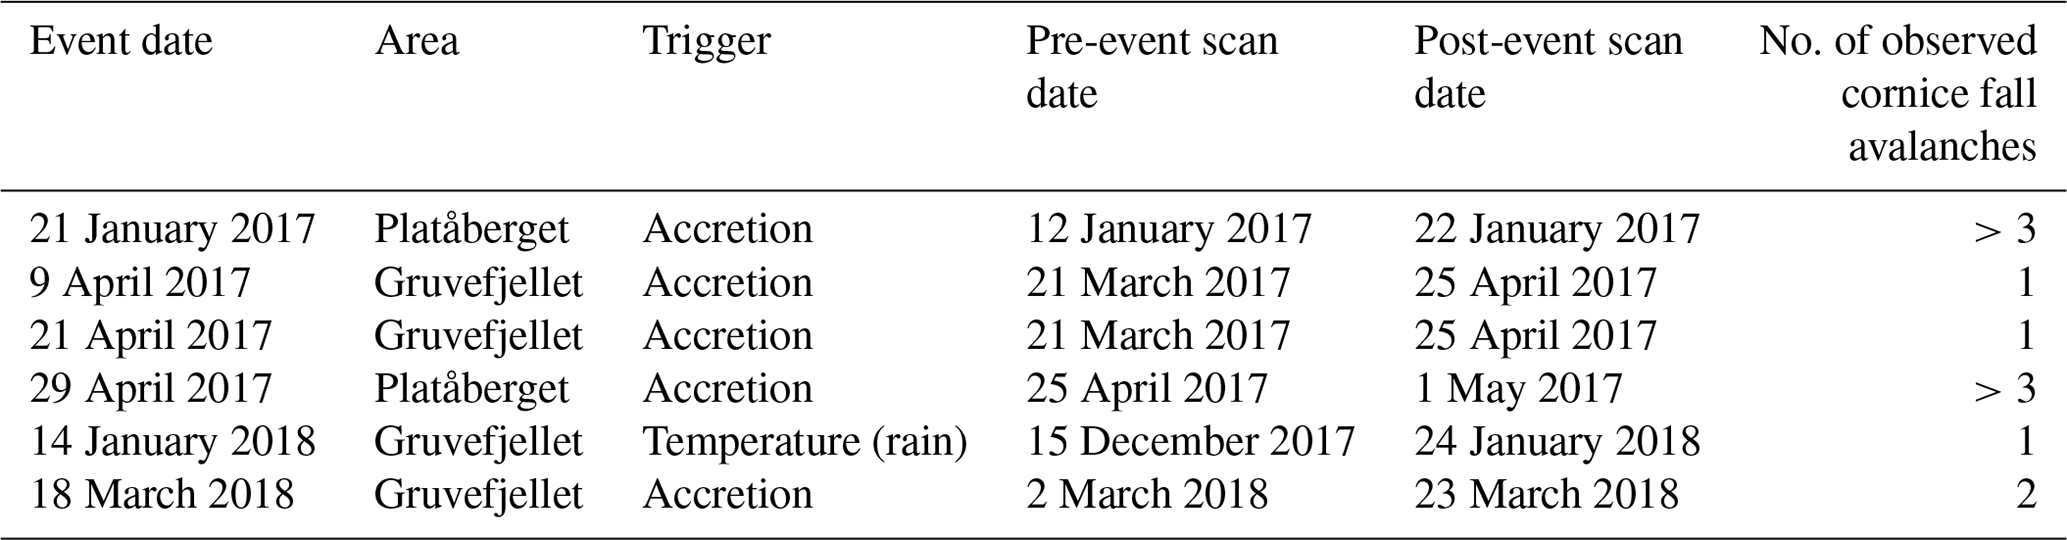
A major accretion event in mid-February 2017 followed several weeks of unseasonably high temperatures at cornice elevation during early February (Fig. 4). Locally heavy snowfall and strong easterly winds accompanying a vigorous winter storm impacted the region between 19 and 21 February. Profile GF1's horizontal extension increased by nearly 3 m between the 17 and 24 February scans, resulting in horizontal accretion rates exceeding 15 mm h−1 (Table 2). The representative volume increased by approximately 100 m3 during the same timeframe. The strong easterly winds stripped the Platåberget cornice system on the windward side of the valley reflected by the abrupt decrease of over 100 m3 to the representative volume there.
Representative volumes for both cornice systems gradually increased in the following month, and profiles from 21 March 2017 show considerable rounding and downslope creep of the cornices' leading edges in profiles GF1 and GF3 (Fig. 5). Cornices continued to grow on Platåberget, with horizontal growth exceeding 2 m on portions of the PB1 and PB2 profiles and PB3's vertical extent increasing by over 2 m. The Platåberget cornices did not deform downslope to the same degree as the Gruvefjellet cornices during this time period. A representative volume decrease of over 500 m3 (roughly 50 % of the volume) on Gruvefjellet in April is related to a major cornice failure near profile GF1, while Platåberget's representative volume increased by 150 m3 in an accretion event near the end of the month (see Sect. 4.2.1). Considerable cornice accretion is evident in all cornice profiles between 21 March and 1 May except for profiles GF1 and PB2 where we documented cornice failures. Representative volumes continued to increase in early May as light precipitation coincided with continued subzero temperatures. Representative cornice volume on Gruvefjellet gradually increased through 31 May and then dramatically decreased with the onset of sustained positive temperatures at the Gruvefjellet AWS. Cornices on Platåberget continued to accrete through the 18 May scan before beginning to melt away between 18 May and 9 June.
4.1.2 2017–2018
We gathered seven scanned snow surfaces from both Gruvefjellet and Platåberget for the 2017–2018 season with which to compare to meteorological conditions. Cornice development during the 2017–2018 winter season differed considerably from the 2016–2017 winter season despite relatively similar seasonal meteorological conditions (Table 3). Gruvefjellet profiles from 15 December 2017 show over 5 m of horizontal cornice growth in all profiles, and representative volume approached 1000 m3 (Figs. 6 and 7). Contrastingly, the Platåberget plateau margin remained functionally free of snow. Cornices continued to grow over the following 5 weeks on Gruvefjellet up to the 24 January scan, with profiles GF1 and GF3 reaching their maximum horizontal extensions for the season of nearly 7 and over 8 m, respectively (Fig. 7). Cornice fall avalanches observed on 13 January 2018 are evident in the decreased cornice extension in GF2 in the 24 January scan relative to the 15 December 2017 surface and were associated with positive air temperatures and rain at cornice elevation (Table 1). Profiles on Platåberget on 24 January 2018 do not show cornice development, with snow accumulating relatively parallel to the underlying topography.
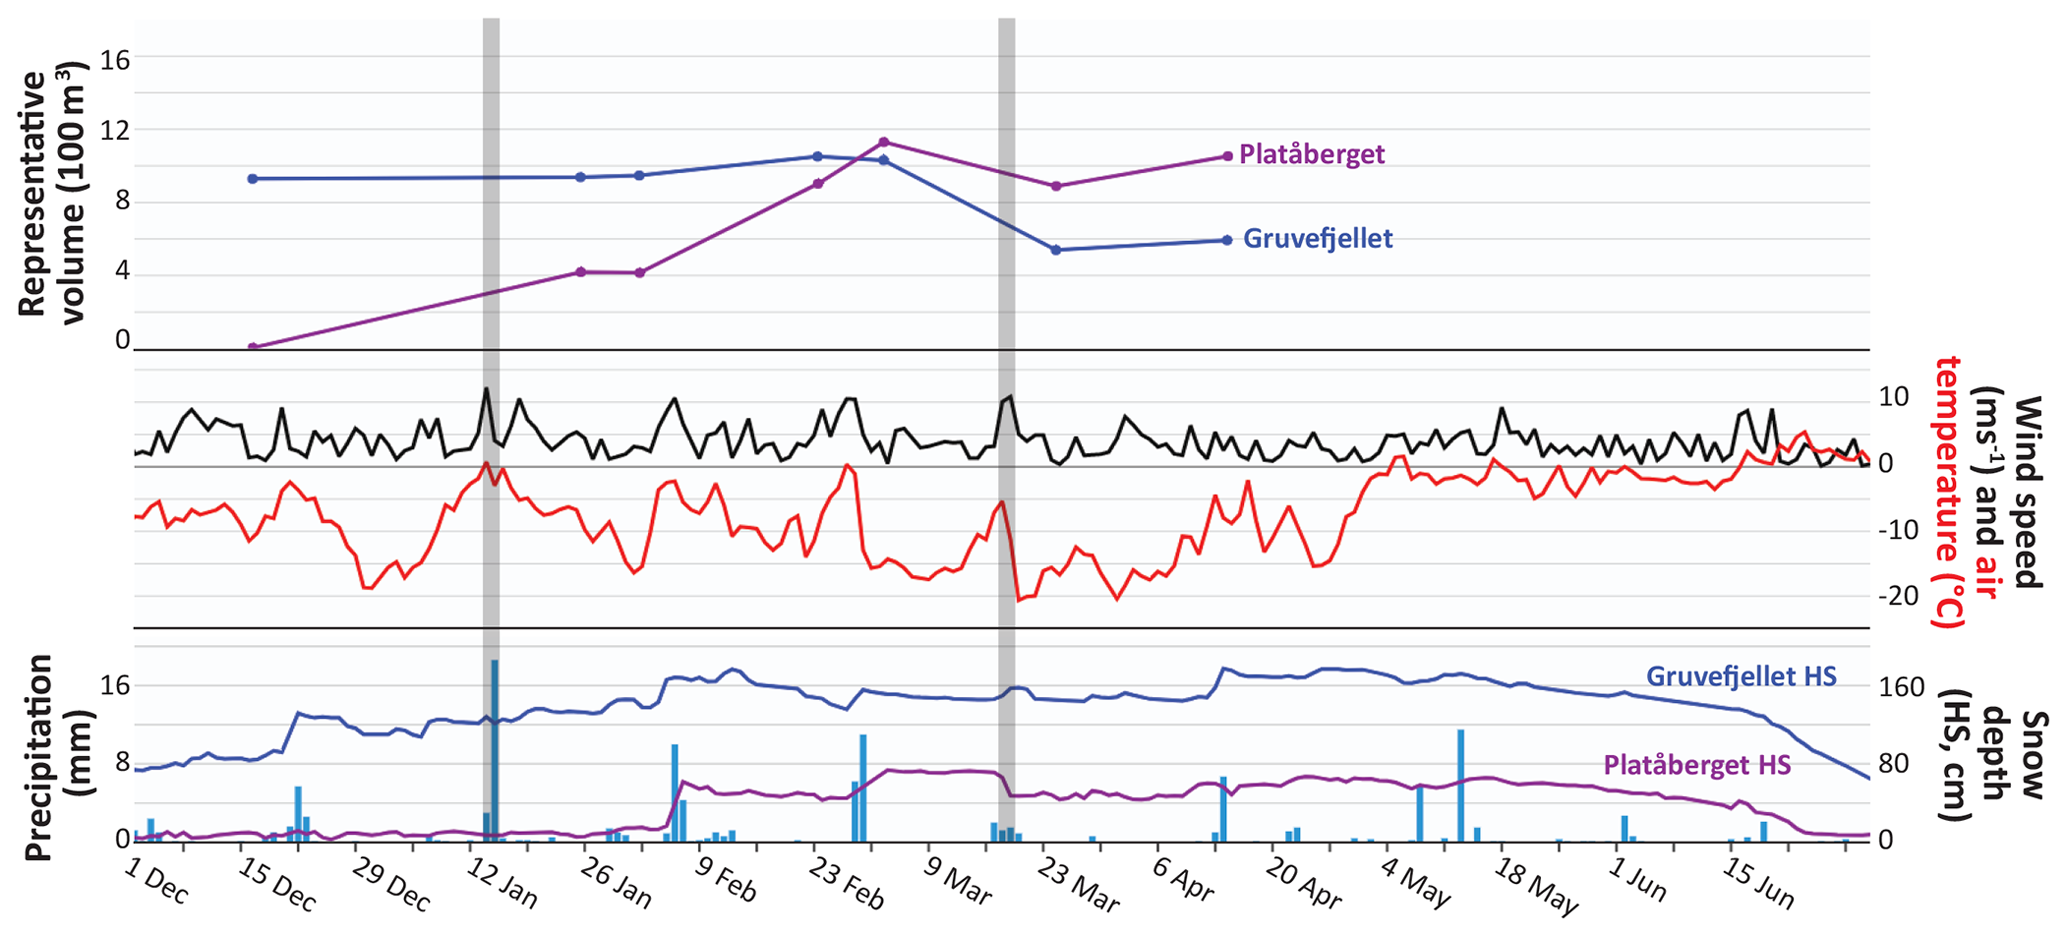
Figure 6Summary of the representative cornice volumes and meteorological conditions for the 2017–2018 winter season. Wind speed and air temperature are daily averaged values from the Gruvefjellet AWS, precipitation data are daily values from the Svalbard Airport AWS measured at 06:00 UTC, and snow depths are daily averages from the snow sensors on Gruvefjellet and Platåfjellet. Shaded grey vertical bars indicate 48 h periods with observed noteworthy cornice fall avalanche activity (Table 2).
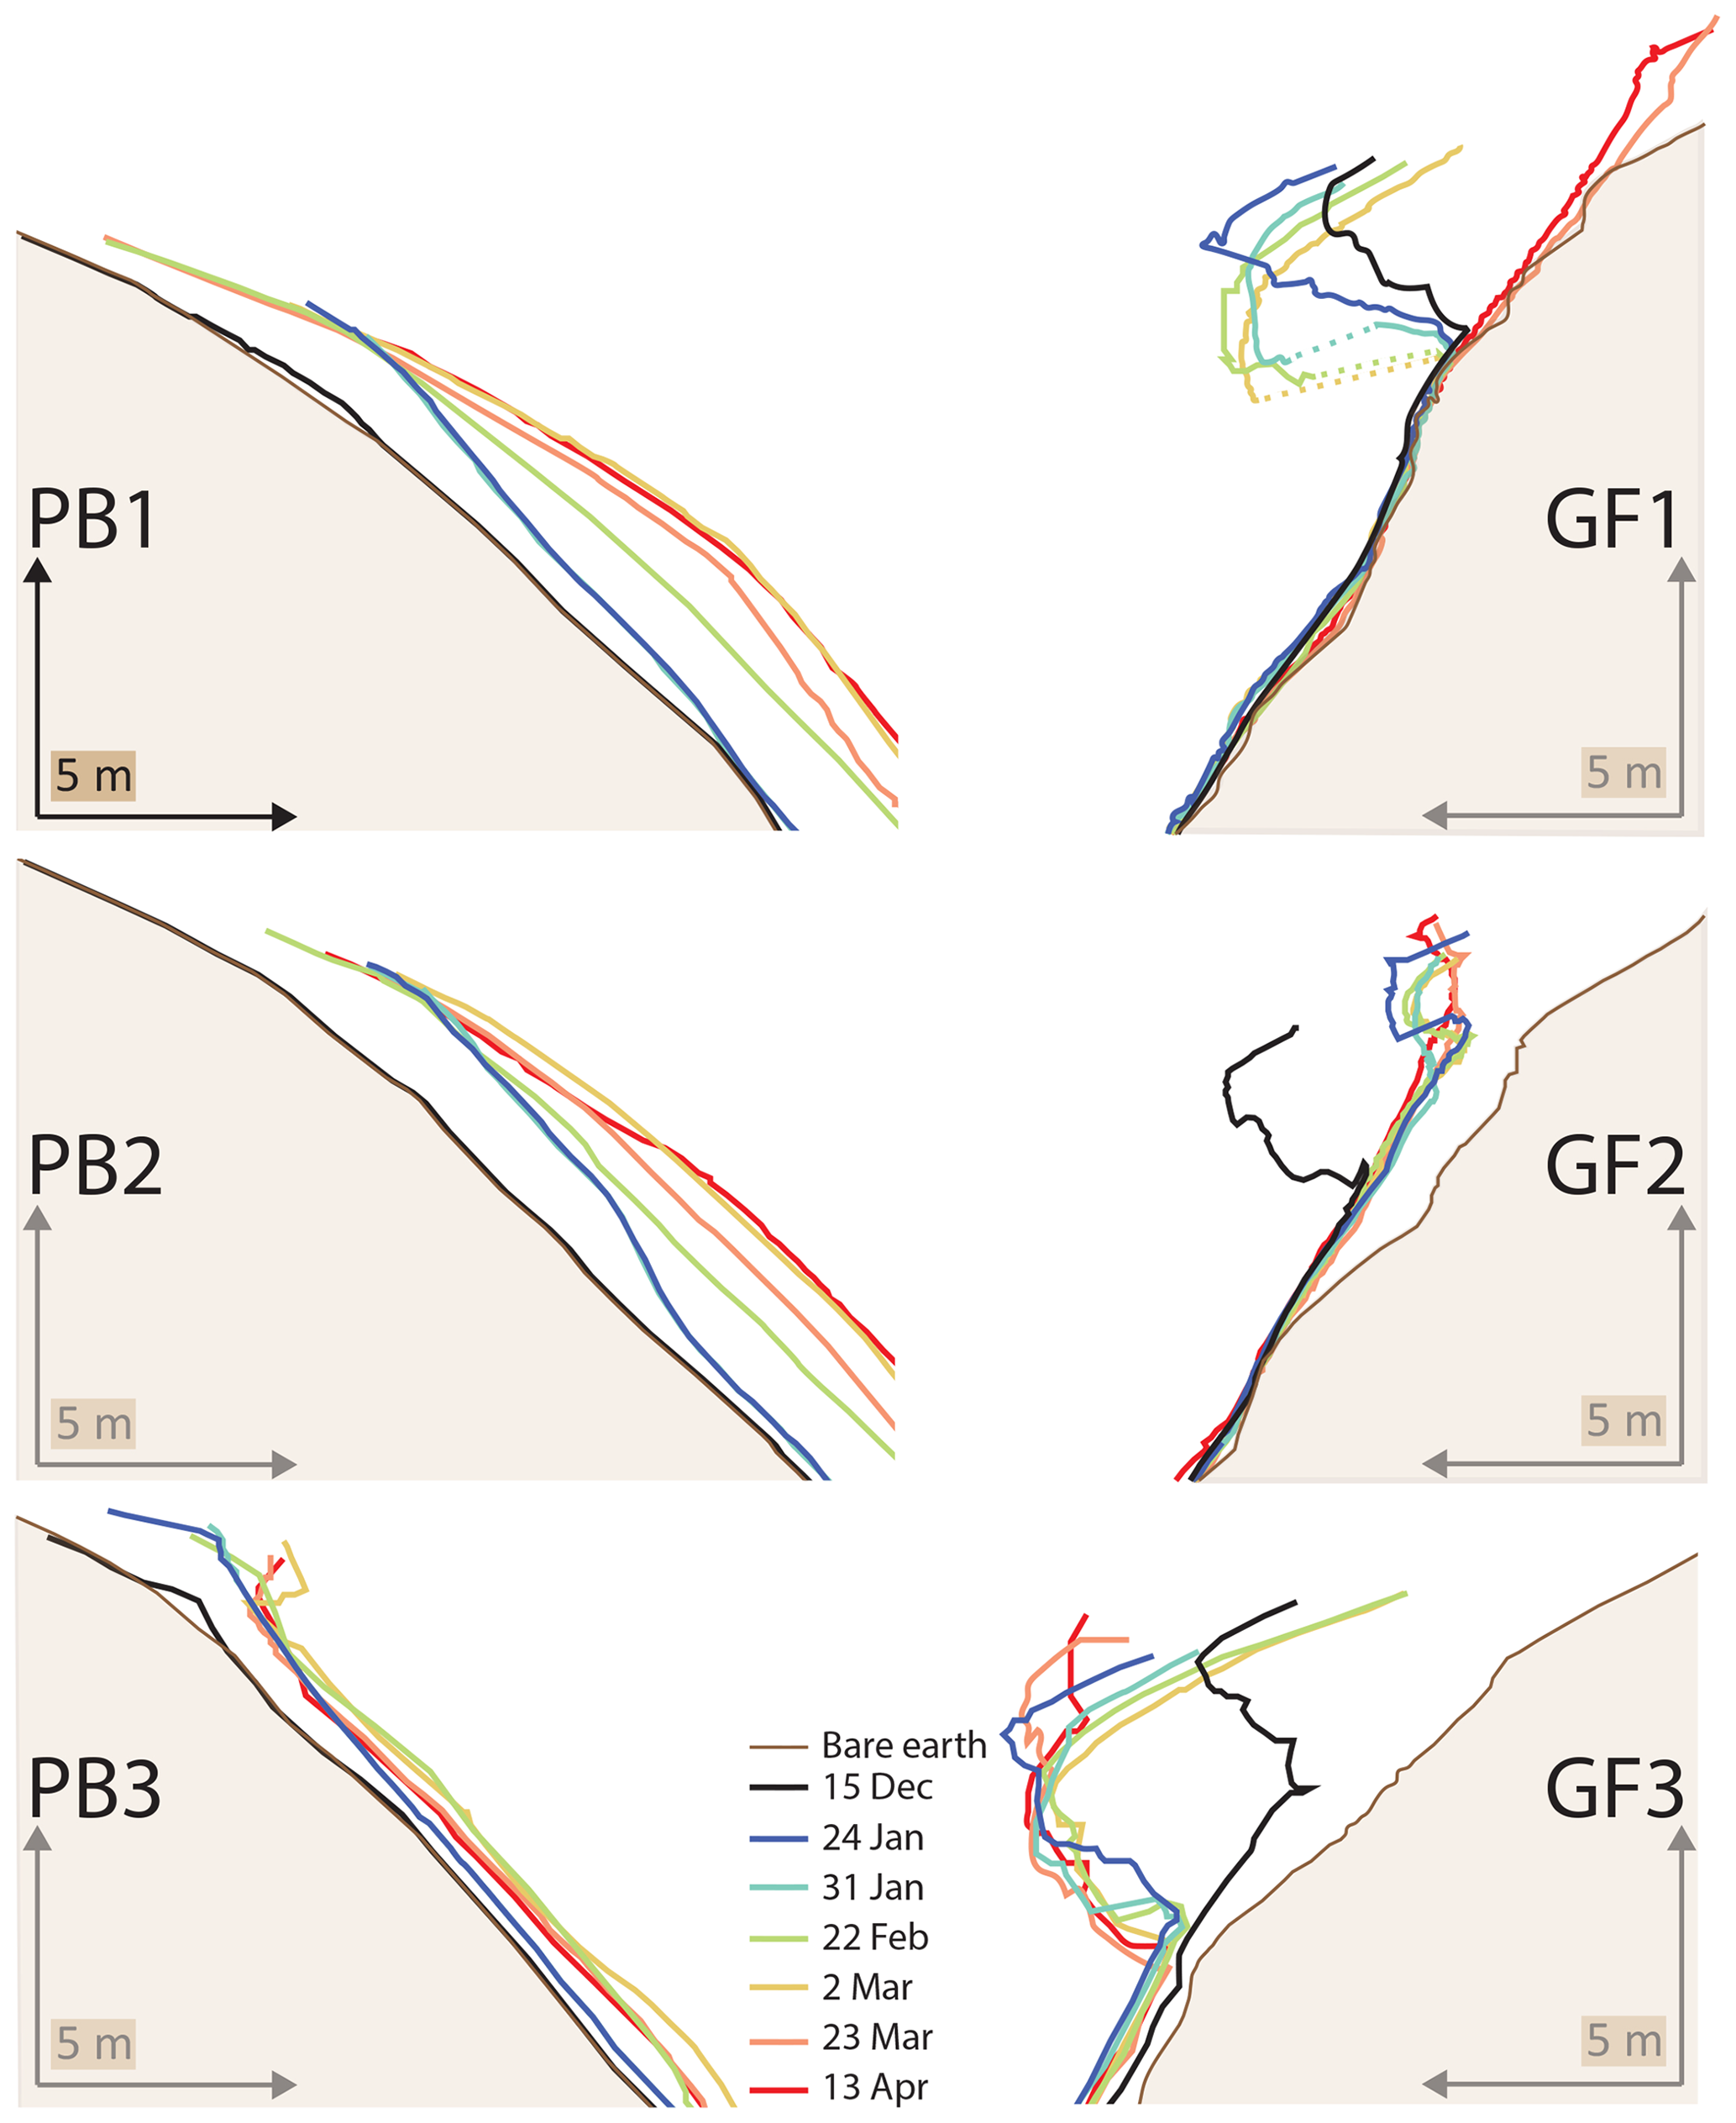
Figure 7The 2-D cornice profiles showing cornice progression for 2017–2018 winter season scan dates. Each profile is labeled as it is referred to in the text and corresponds to the location and POV depicted in Fig. 2.
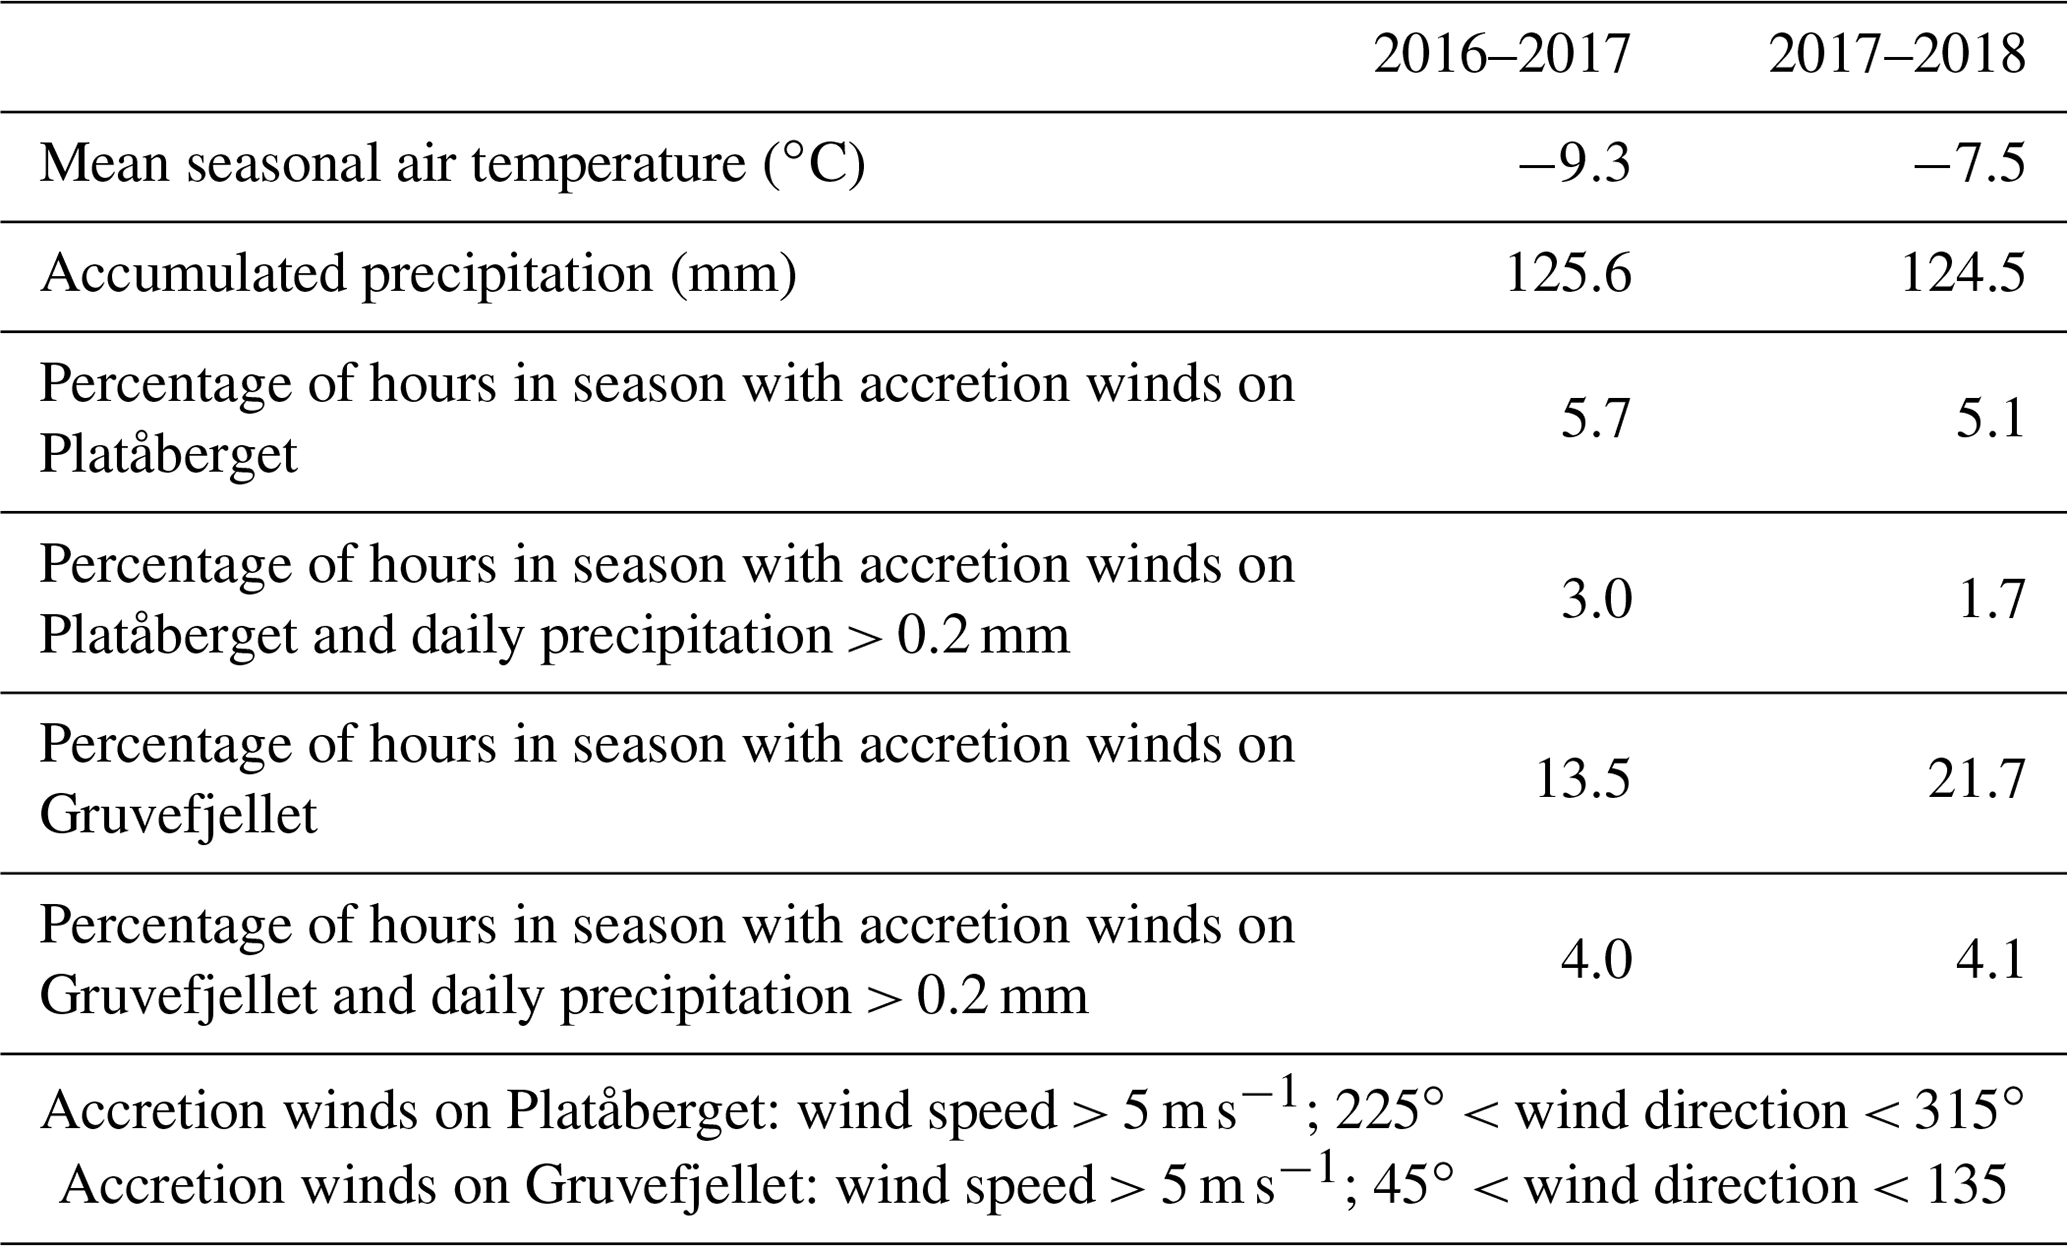
Table 3Seasonal summaries. All parameters are measured at the Gruvefjellet AWS except for precipitation, which is measured at the Svalbard Airport AWS.
Representative volume doubled on Platåberget between the 31 January and 22 February scans from 400 to 900 m3. This coincided with a 0.34 m increase in snow depth at the snow sensor during a snowstorm on 5 and 6 February where 14 mm of precipitation was measured at the Svalbard Airport AWS (Fig. 6). Cornice system changes were more minimal on Gruvefjellet, with a subtle increase of 100 m3 in representative volume. Measured snow depth on Gruvefjellet increased from 1.45 m on 31 January to a maximum of 1.77 m on 13 February, before slowly decreasing back to 1.48 m by 22 February (Fig. 6). A minor decrease in horizontal extension (<1 m) and slight downslope deformation exhibited in profile GF1 are the main observed changes to the cornice profiles between 31 January and 22 February (Fig. 7).
Snow depths increased by 0.20 and 0.28 m on Gruvefjellet and Platåfjellet, respectively, on 26 and 27 February 2018 as over 7 mm precipitation was recorded at the airport (Fig. 7). A marked increase in representative volume of 230 m3 on Platåberget between the 22 February and 2 March scans coincides with an increase in snow depth of 0.28 cm over 26 and 27 February. Although a small cornice is evident in profile PB3 on 2 March, increased volume during this time illustrates slope-normal snow depth increase rather than cornice accretion in the representative volume area in the vicinity of PB2 (Fig. 7). On Gruvefjellet, downslope creep of the cornice masses continued, with maximum vertical deformation close to 0.80 m for the leading edge of profile GF1. A winter storm on 18 March 2018 resulted in cornice failures seen in both GF1 and GF2 and decreased representative volume on Gruvefjellet, while scouring reduced volume during this time on Platåberget (see Sect. 4.2.2). Minimal further changes are evident in season's final scan (due to scanner failure) taken on 13 April 2018.
4.2 Case studies
4.2.1 Cornice accretion and failure in April 2017
We documented three periods of cornice fall avalanche activity with TLS data in April 2017. In the first, a small portion of the cornice between profiles GF1 and GF2 failed on 9 April following a period of precipitation falling as snow and easterly winds in excess of 10 m s−1 (Figs. 8a and 9a, annotation 1). The cornice represented by profile GF1 then failed completely on 21 April 2017 coincident with trace precipitation falling as snow and 2 d of moderate to strong easterly winds (Figs. 8b and 10). Negative M3C2 distances displaying changes to the Gruvefjellet cornice system between the 21 March and 25 April 2017 scans show the largest portion of the failed cornice along the axis of profile GF1 (Fig. 9a, annotation 2). This failure extended northwards almost 40 m along the cornice. Negative M3C2 distances on the vertical rock face immediately downslope of both the 9 and 21 April cornice failures show how the falling cornice blocks remove snow from the rock face before impacting avalanche release areas below (Fig. 9a, annotation 3). Here, cornice impact craters and small slab avalanche releases are apparent in negative M3C2 distances (Fig. 9a, annotation 4). Lower on the slope, the cornice fall avalanche deposition – complete with intact cornice chunks in the avalanche debris – is apparent in strongly positive M3C2 distances (Fig. 9a, annotation 5). Other positive M3C2 distances along the cornices (Fig. 9a, annotation 6) and horizontal and vertical extent increases on profiles GF2 and GF3 (Fig. 10) show cornice accretion occurred elsewhere along Gruvefjellet during this time span. The easterly winds stripped the cornices on Platåberget, evidenced by representative volume decreases of nearly 200 m3 and vertical extension decreases of up to 1.5 m at profile PB3 (Fig. 10).
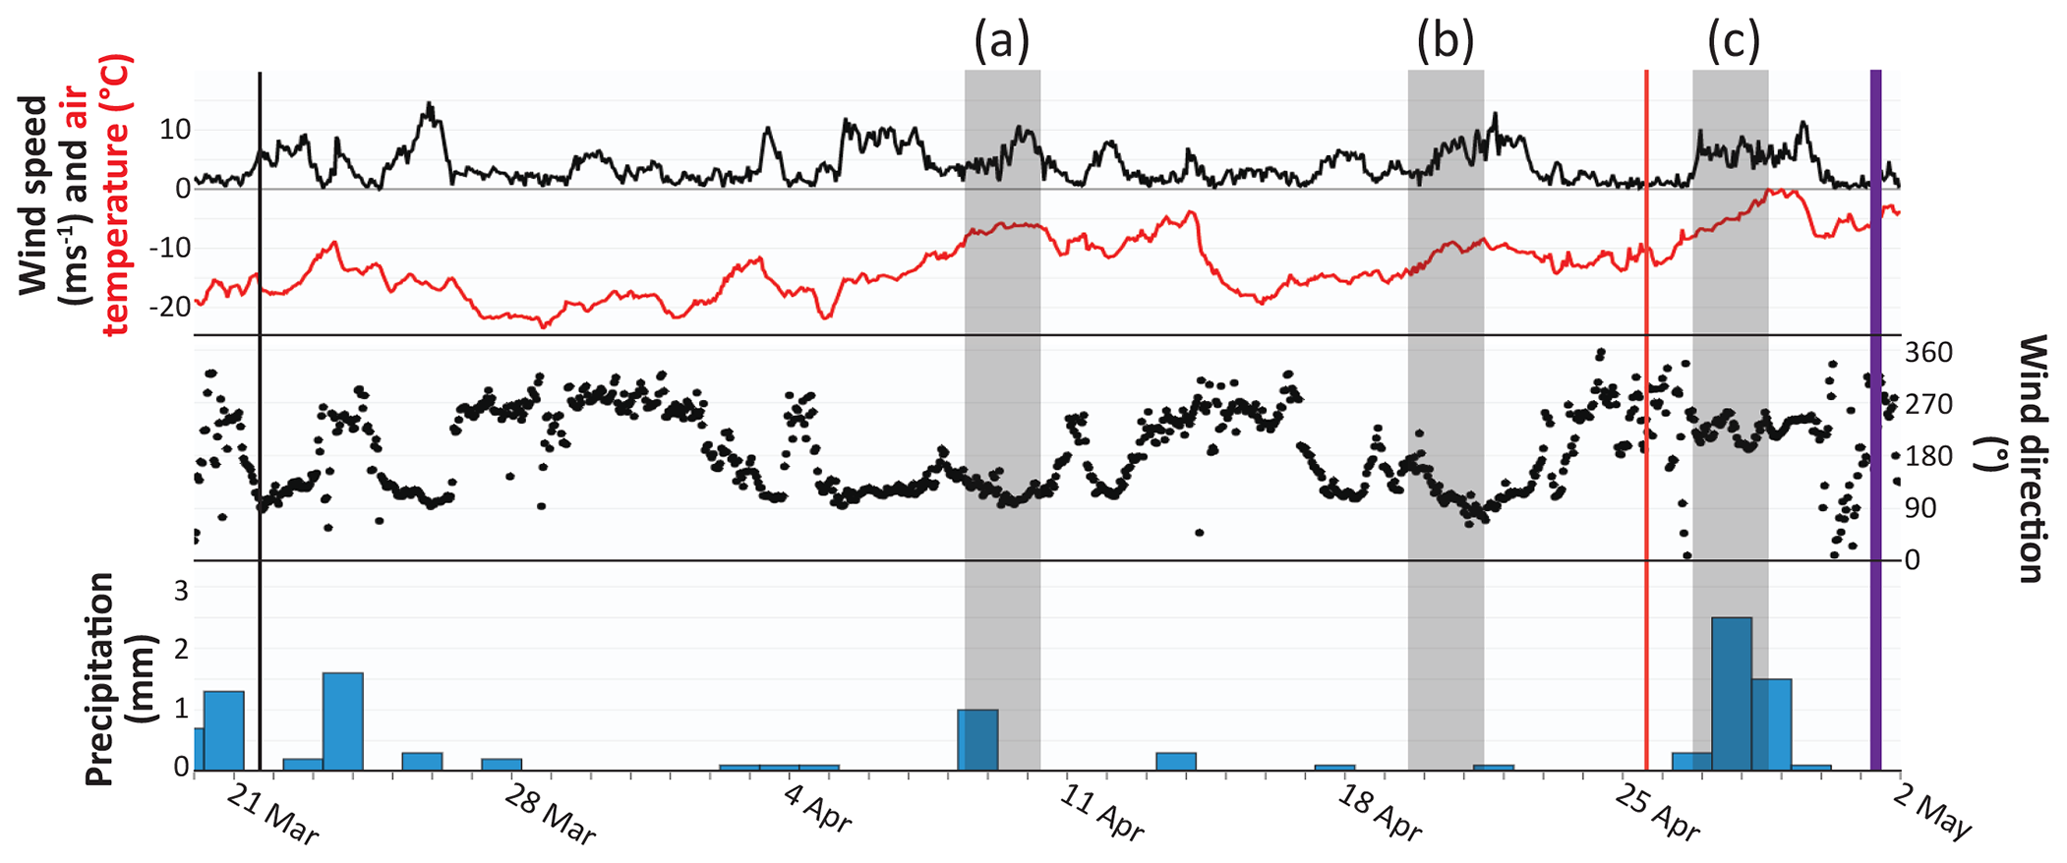
Figure 8Meteorological summary of the April 2017 case study. Wind speed, wind direction, and air temperature are hourly values from the Gruvefjellet AWS, and precipitation data are daily values from the Svalbard Airport AWS measured at 06:00 UTC. Colored vertical lines in the time series indicate the scan timing corresponding to the profiles in Fig. 9. Vertical grey bars marked (a)–(c) correspond to 48 h time periods with noteworthy avalanche activity discussed in the text.
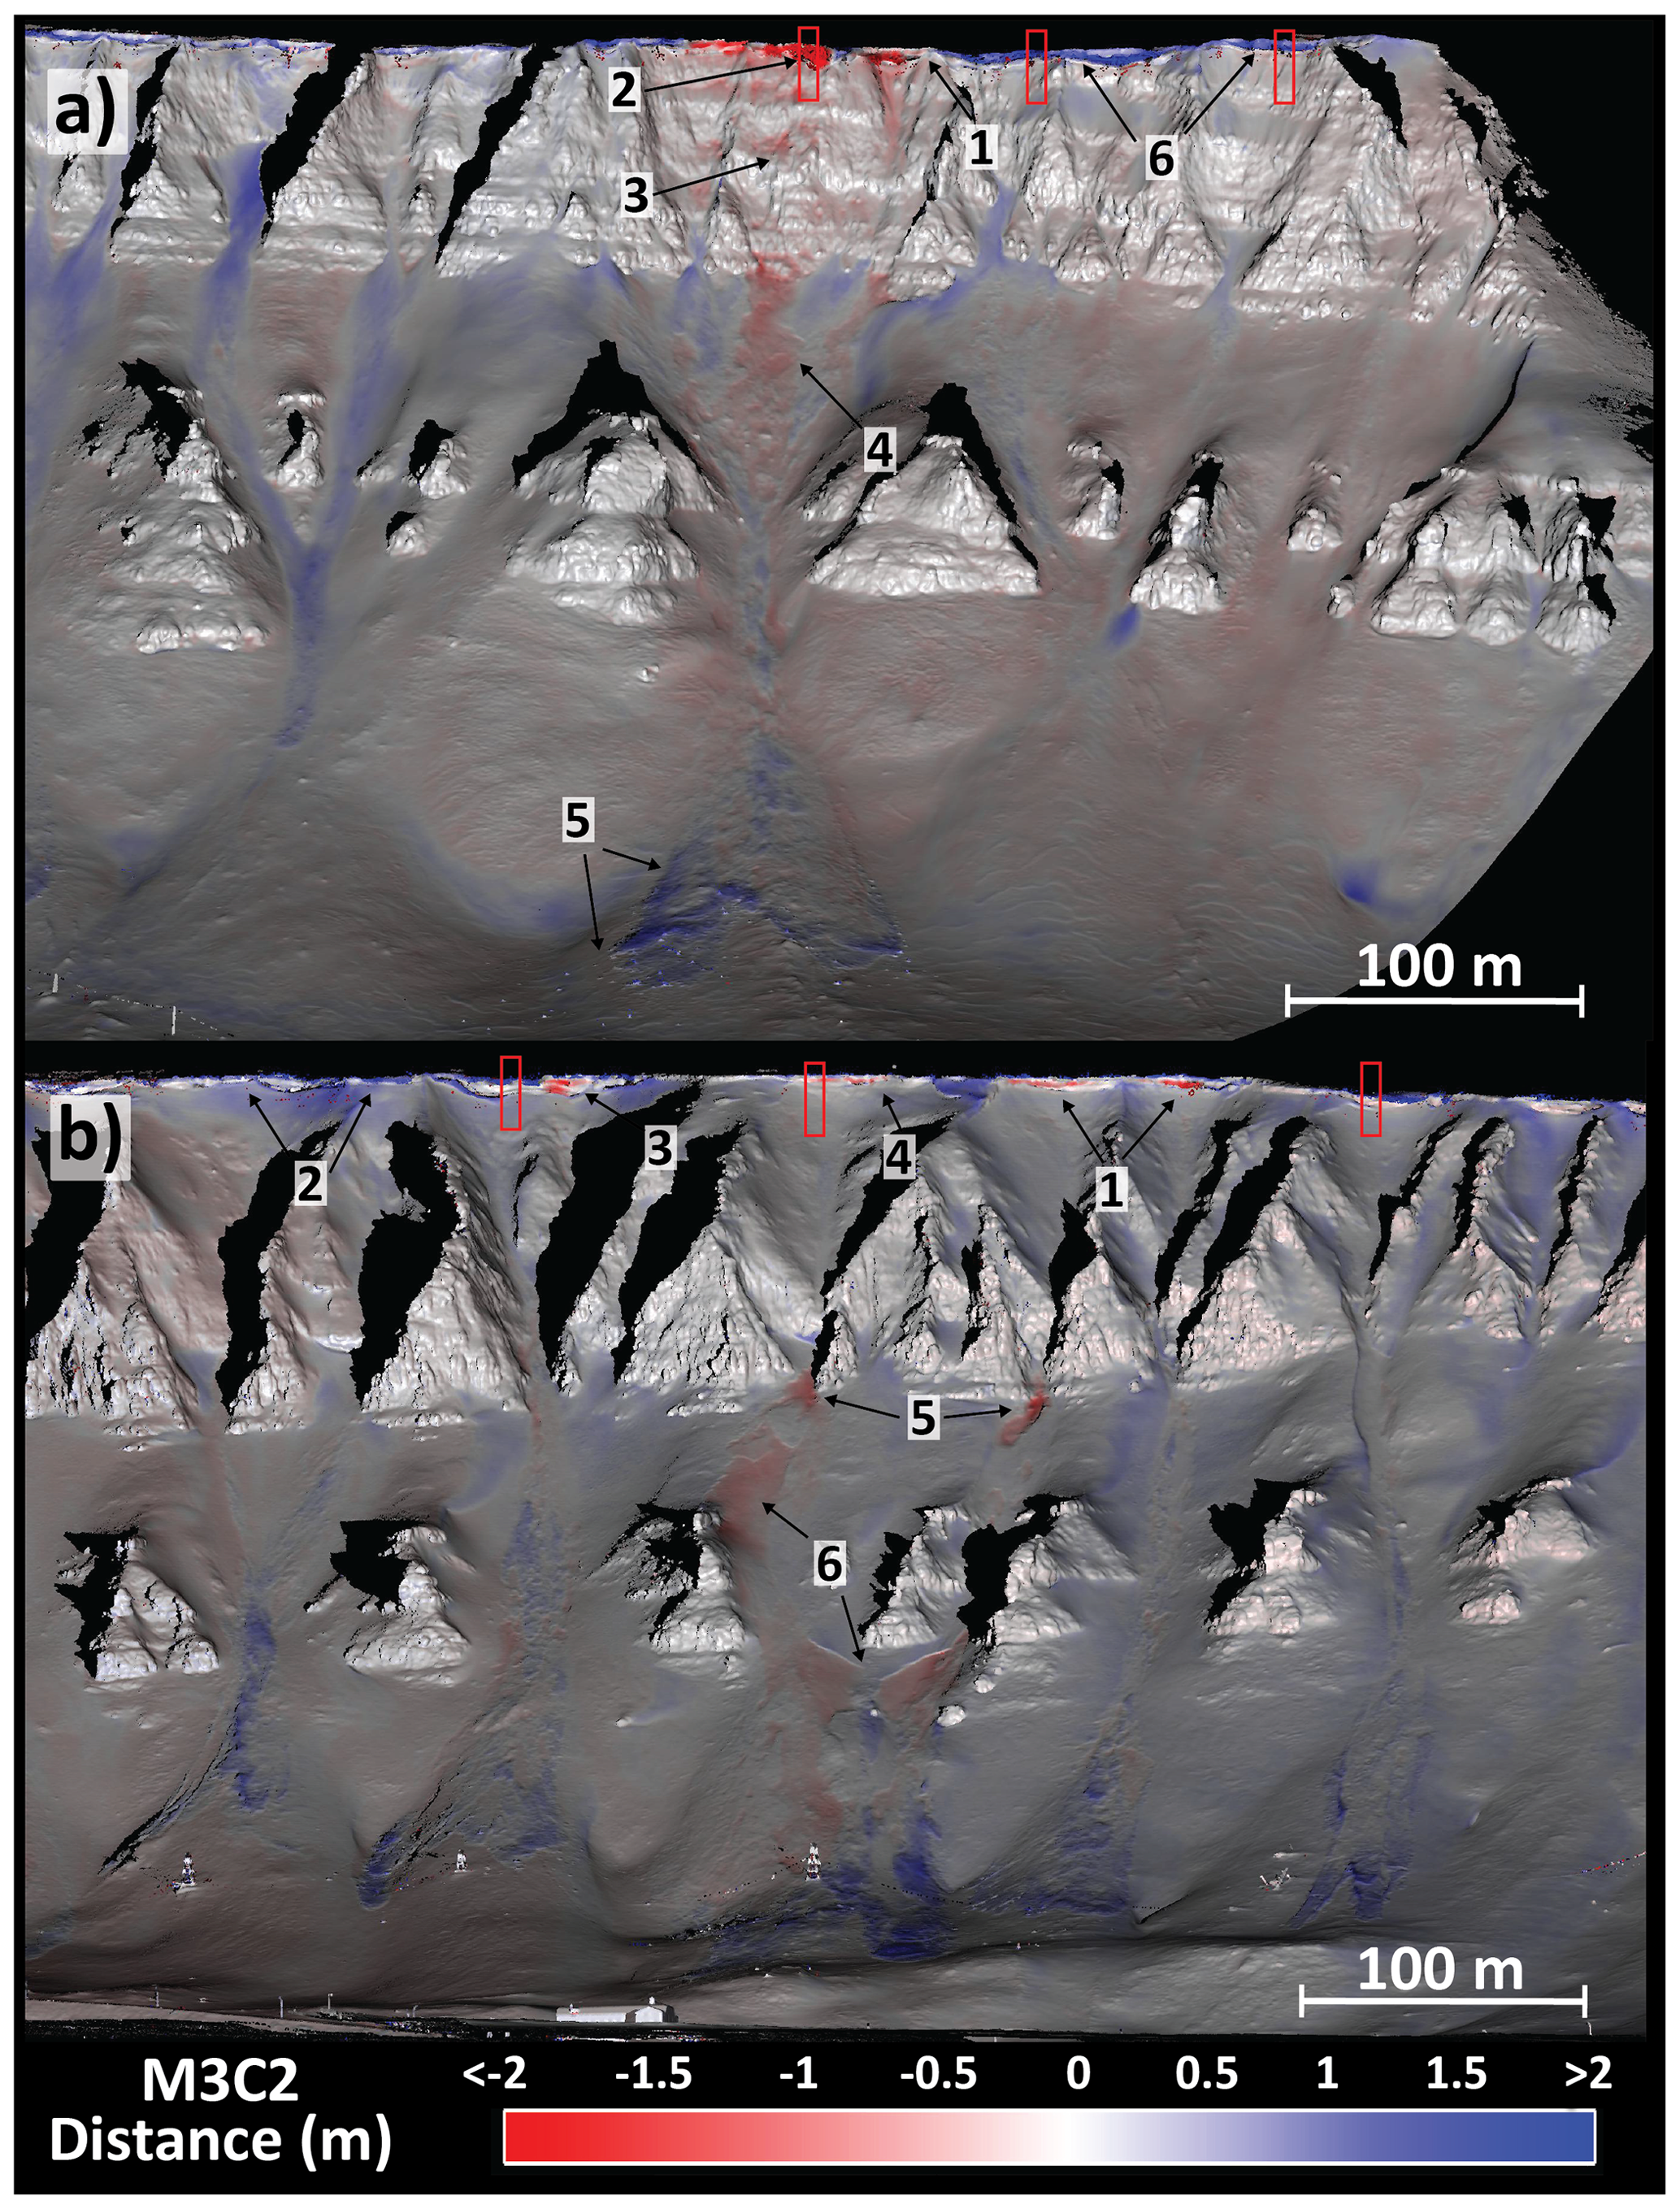
Figure 9M3C2 distances displaying changes to the snow cover on Gruvefjellet between the 21 March and 25 April 2017 scans (a) and on Platåberget between the 25 April and 1 May 2017 scans (b). Red rectangles in both panels indicate the locations of the cornice profiles. Specific snow surface features are annotated as they are referred to in the text.
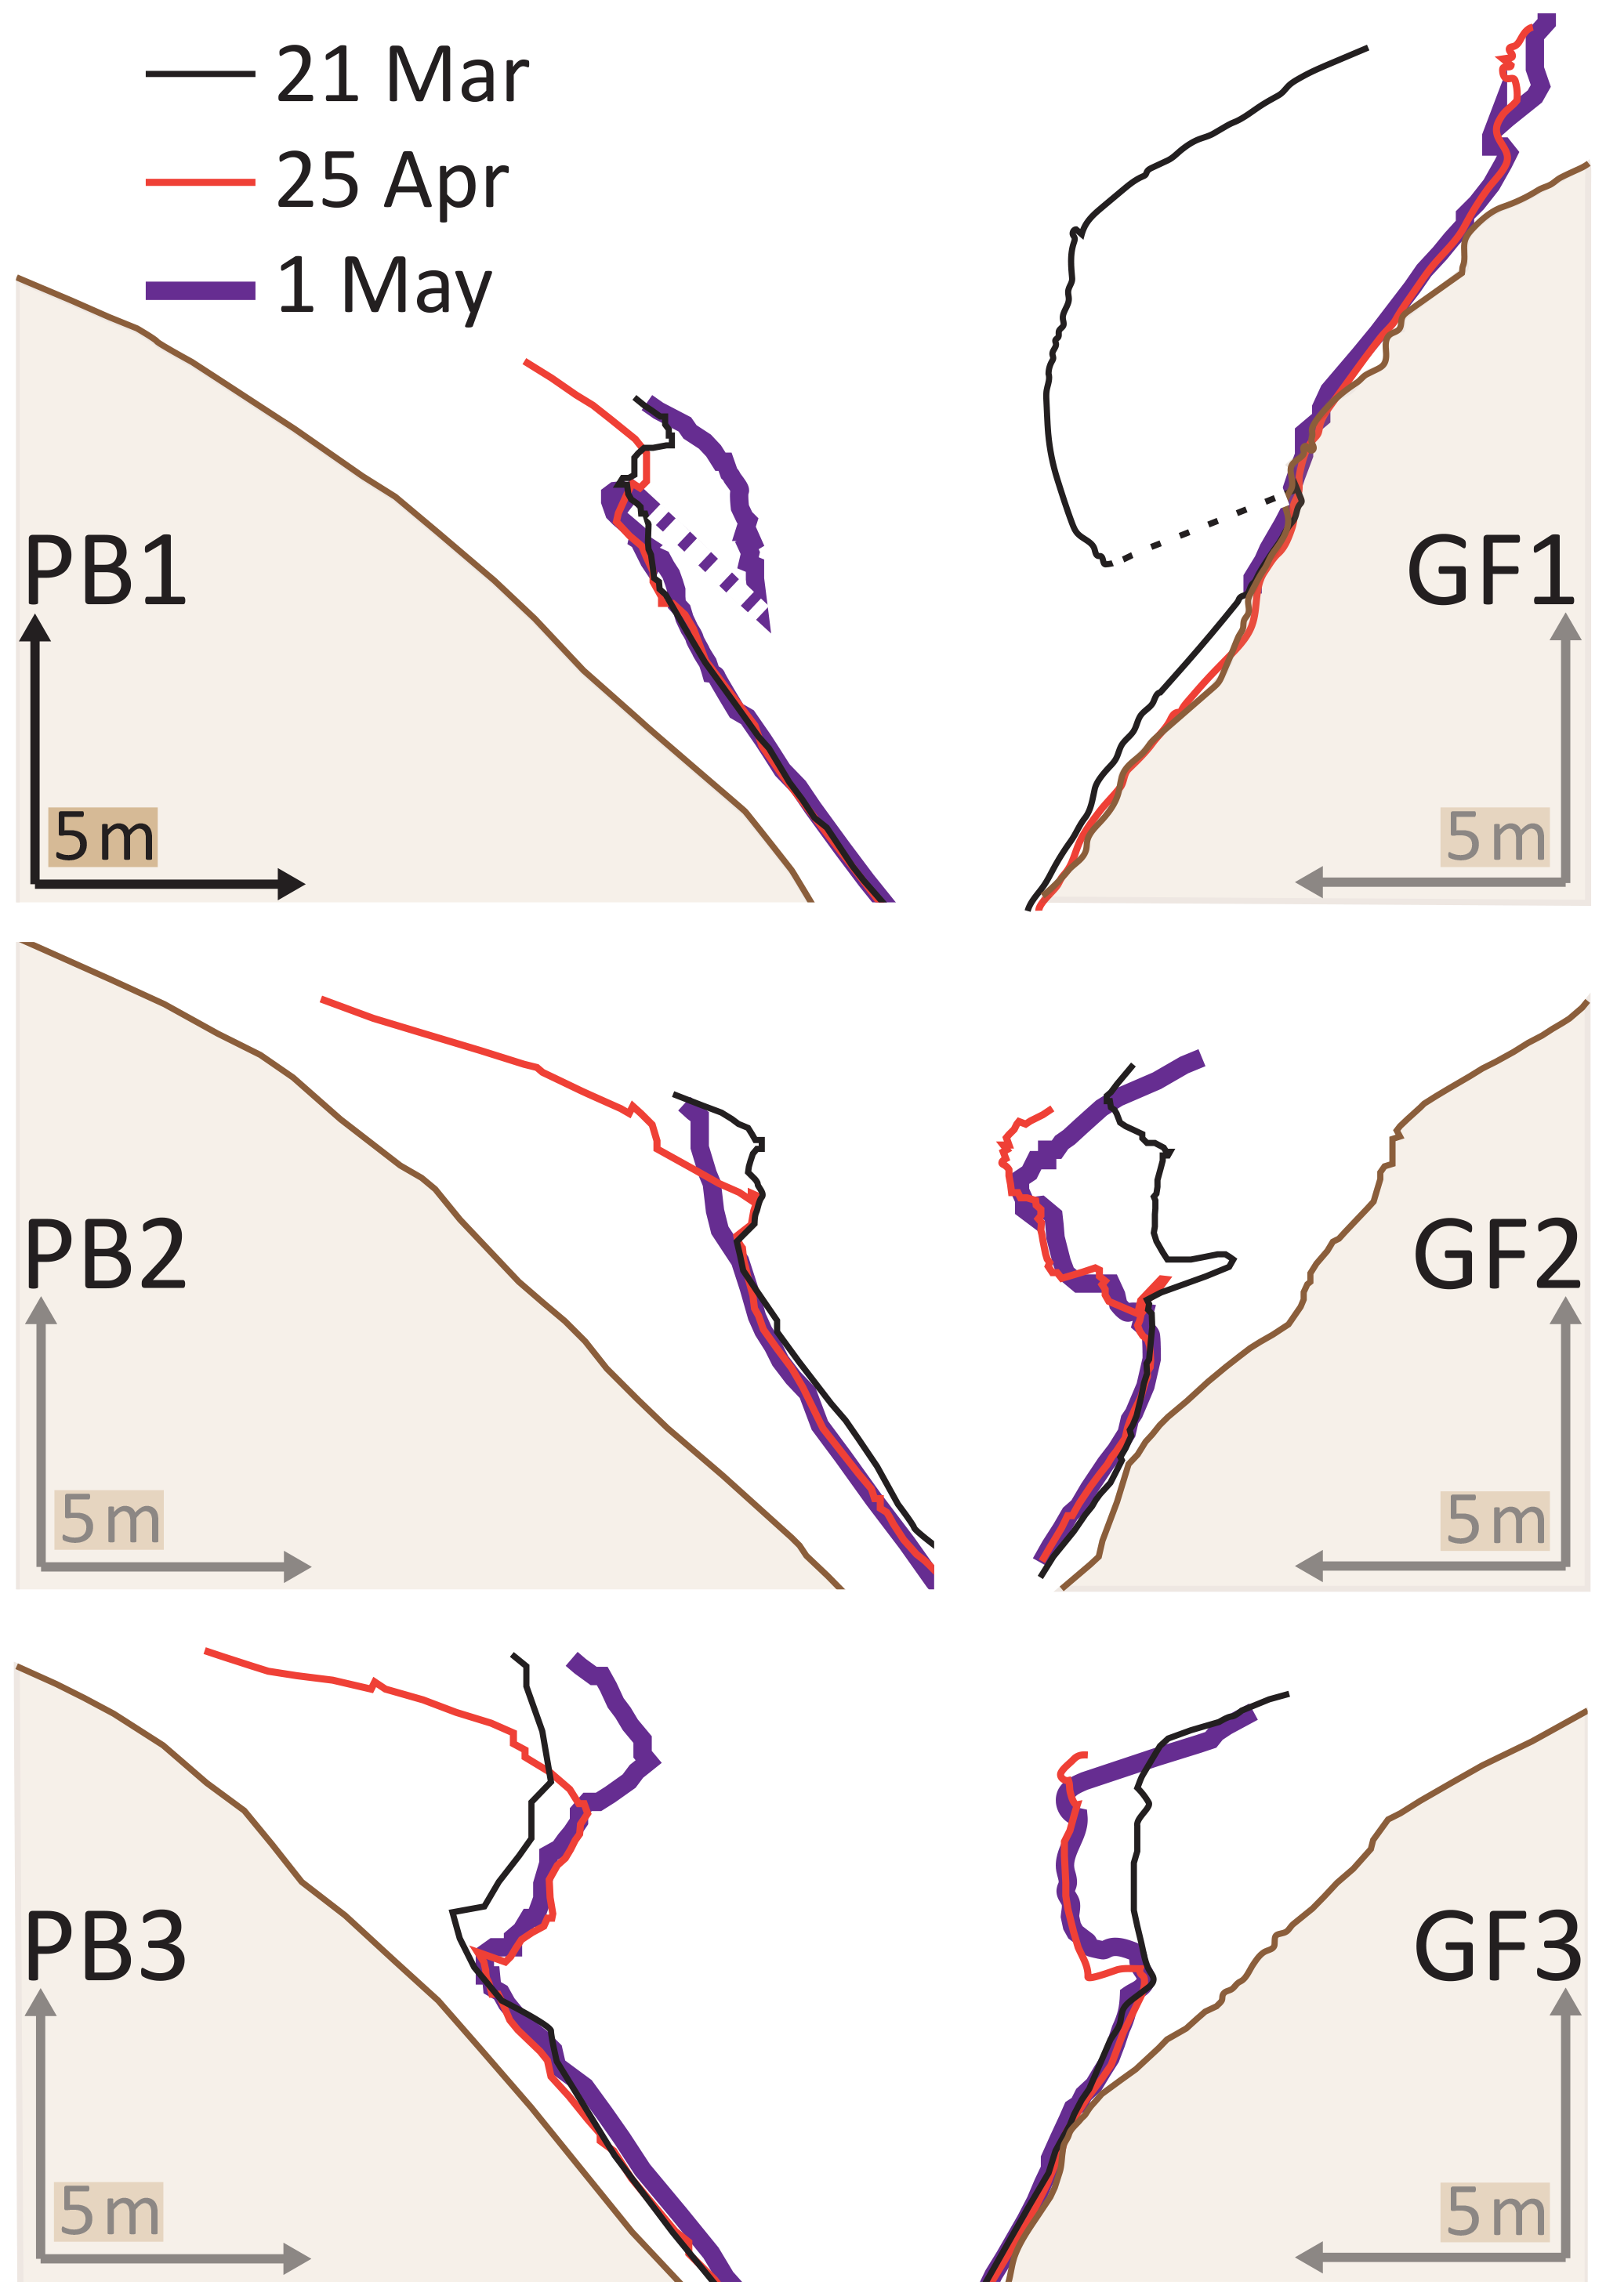
Figure 10Cornice profiles illustrating cornice dynamics during the April 2017 case study, with each profile labeled as it is referred to in the text. Dashed lines indicate interpolated data where overhanging cornice structure shadowed the snow surface from the TLS.
A warm winter storm accompanied by 4.5 mm of precipitation, southwesterly winds, and air temperatures approaching 0 ∘C at cornice level resulted in a period of major cornice accretion and associated cornice fall avalanche activity on the Platåberget cornice system between the 25 April and 1 May 2017 scans (Fig. 8c). Widespread cornice failures are shown by negative M3C2 distances along the Platåberget plateau margin (Fig. 9b, annotation 1). These failures coincide with positive M3C2 distances in excess of 1.5 m indicative of cornice accretion elsewhere along the plateau margin (Fig. 9b, annotation 2). Profile PB3, for example, experienced over a meter of increased vertical cornice extension (Fig. 10) just south of a cornice failure shown in the M3C2 distances (Fig. 9b, annotation 3). In profile PB1, 2 m maximum increases in horizontal extension resulted in accretion rates of 17 mm h−1 (Table 2). The semi-vertical profile surface shown in profile PB2 (Fig. 10) combined with the M3C2 distance decreases in the profile's immediate surroundings (Fig. 9b, annotation 4) indicate cornice failure here occurred after some vertical cornice accretion, as the failure plane extends above the cornice roof from the 25 April snow surface. Cornice blocks released from this cornice and the one immediately to the north poured over cliffs further downslope and gouged impact craters (Fig. 9b, annotation 5) before releasing slab avalanches lower on the slope (Fig. 9b, annotation 6). Minimal changes to the Gruvefjellet cornices occurred during this event.
4.2.2 Cornice accretion and failure in March 2018
A storm in mid-March 2018 punctuated a month of otherwise stable weather and resulted in cornice fall avalanches on Gruvefjellet (Fig. 11a). From 15 to 19 March, 5.6 mm of precipitation accumulated at the airport AWS, snow depths at the Gruvefjellet sensor increased by a maximum of 18 cm while those at the Platåberget sensor decreased by approximately 0.25 m, and strong winds blew from the ENE for 24 h on 17–18 March. Two large cornice failures on Gruvefjellet visible as strongly negative M3C2 distances near profile GF1 and slightly to the north (Fig. 12a, annotation 1) triggered avalanches on the slope below (Fig. 12a, annotation 2). Similar to the morphology observed in the April 2017 cornice fall avalanches, the failed cornice blocks stripped snow off the vertical rock face and created impact craters while entraining snow as they moved downslope. The cornice chunks from these cornice failures also remained intact throughout the event and ran further than the rest of the avalanche debris (Fig. 12a, annotation 3). A cornice block approximately 5 m in horizontal extension detached from the cornice represented by profile GF1, while a smaller (<1 m horizontal extension) piece detached near GF2 (Fig. 13). The GF3 profile did not fail, but over 1 m of snow accreted vertically on the cornice's leading edge. By contrast, Platåberget's plateau margin lost snow, with snow depth decreases in excess of 0.20 m measured at the snow station and strongly negative M3C2 distances across the upper portion of the Platåberget release areas (Fig. 12b, annotation 1).
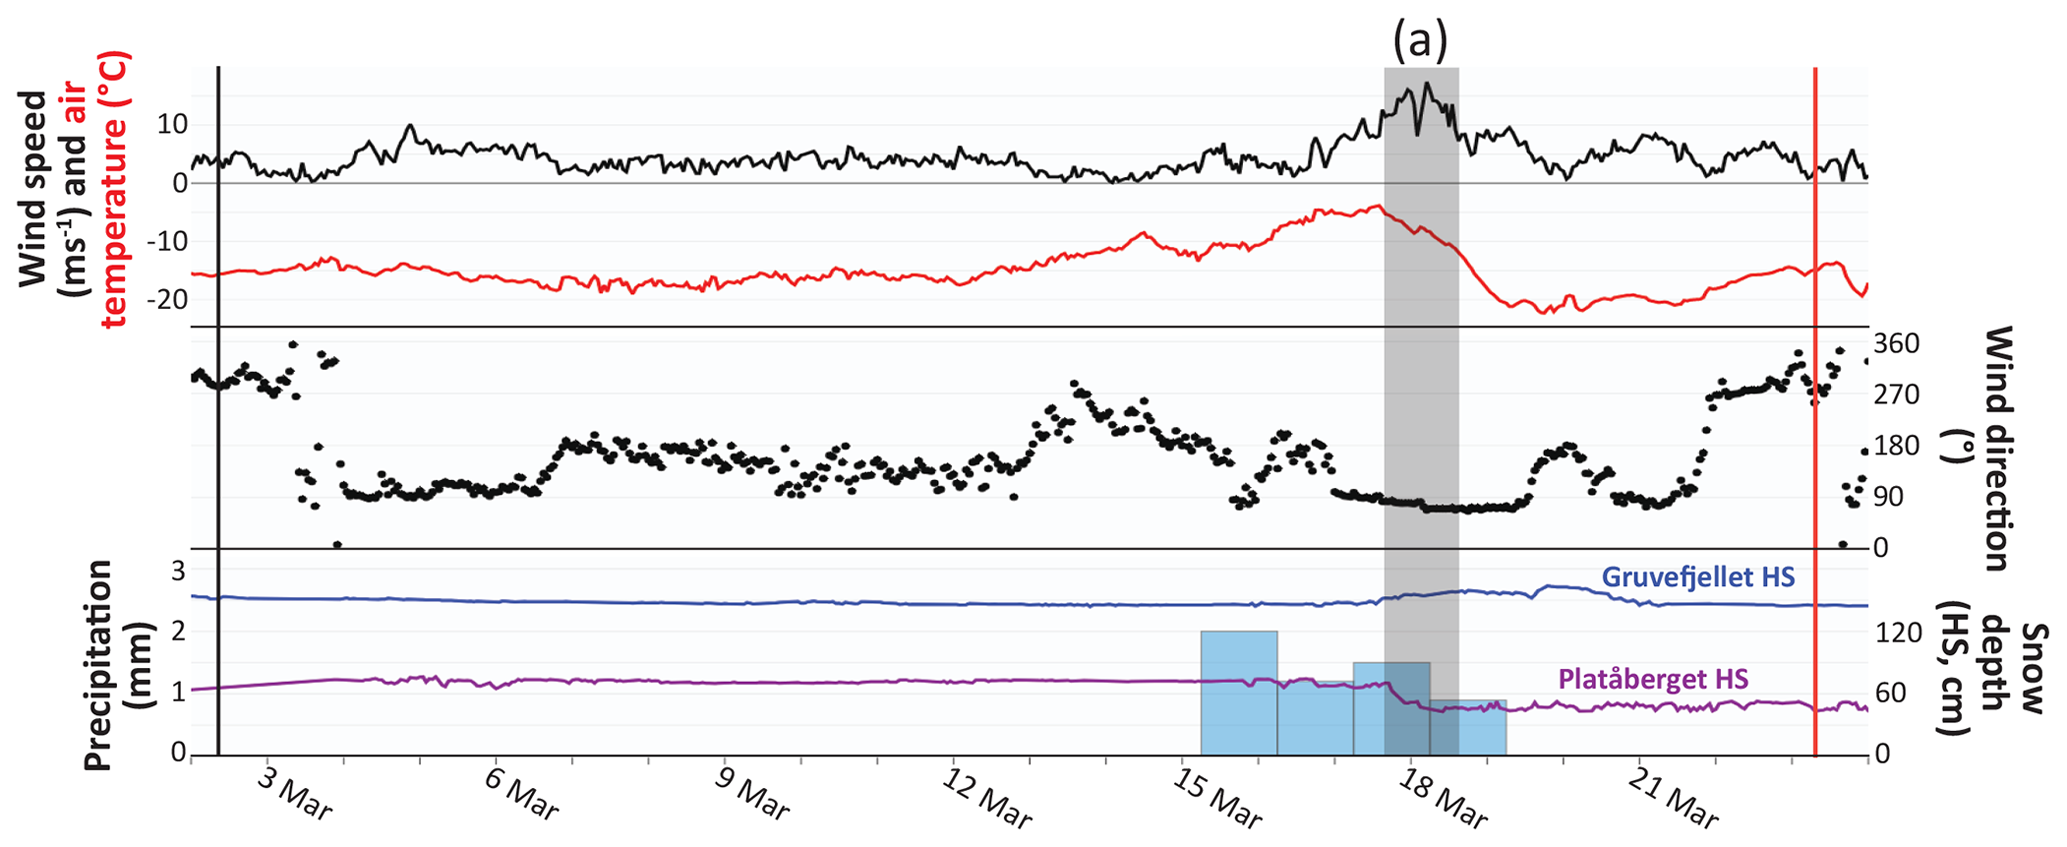
Figure 11Meteorological summary of the March 2018 case study. Wind speed, wind direction, and temperature are hourly values from the Gruvefjellet AWS, and precipitation data are daily values from the Svalbard Airport AWS measured at 06:00 UTC. Colored vertical lines in the time series indicate the scan timing corresponding to the profiles in Fig. 12, and the grey vertical bar annotated with (a) corresponds to the 48 h time period with noteworthy avalanche activity mentioned in the text.

Figure 12M3C2 distances displaying changes to the snow cover on Gruvefjellet (a) and Platåberget (b) between the 2 and 23 March 2018 scans. Red rectangles in both panels indicate the locations of the cornice profiles. Specific snow surface features are annotated as they are referred to in the text, and snow depth sensors are marked and labeled.
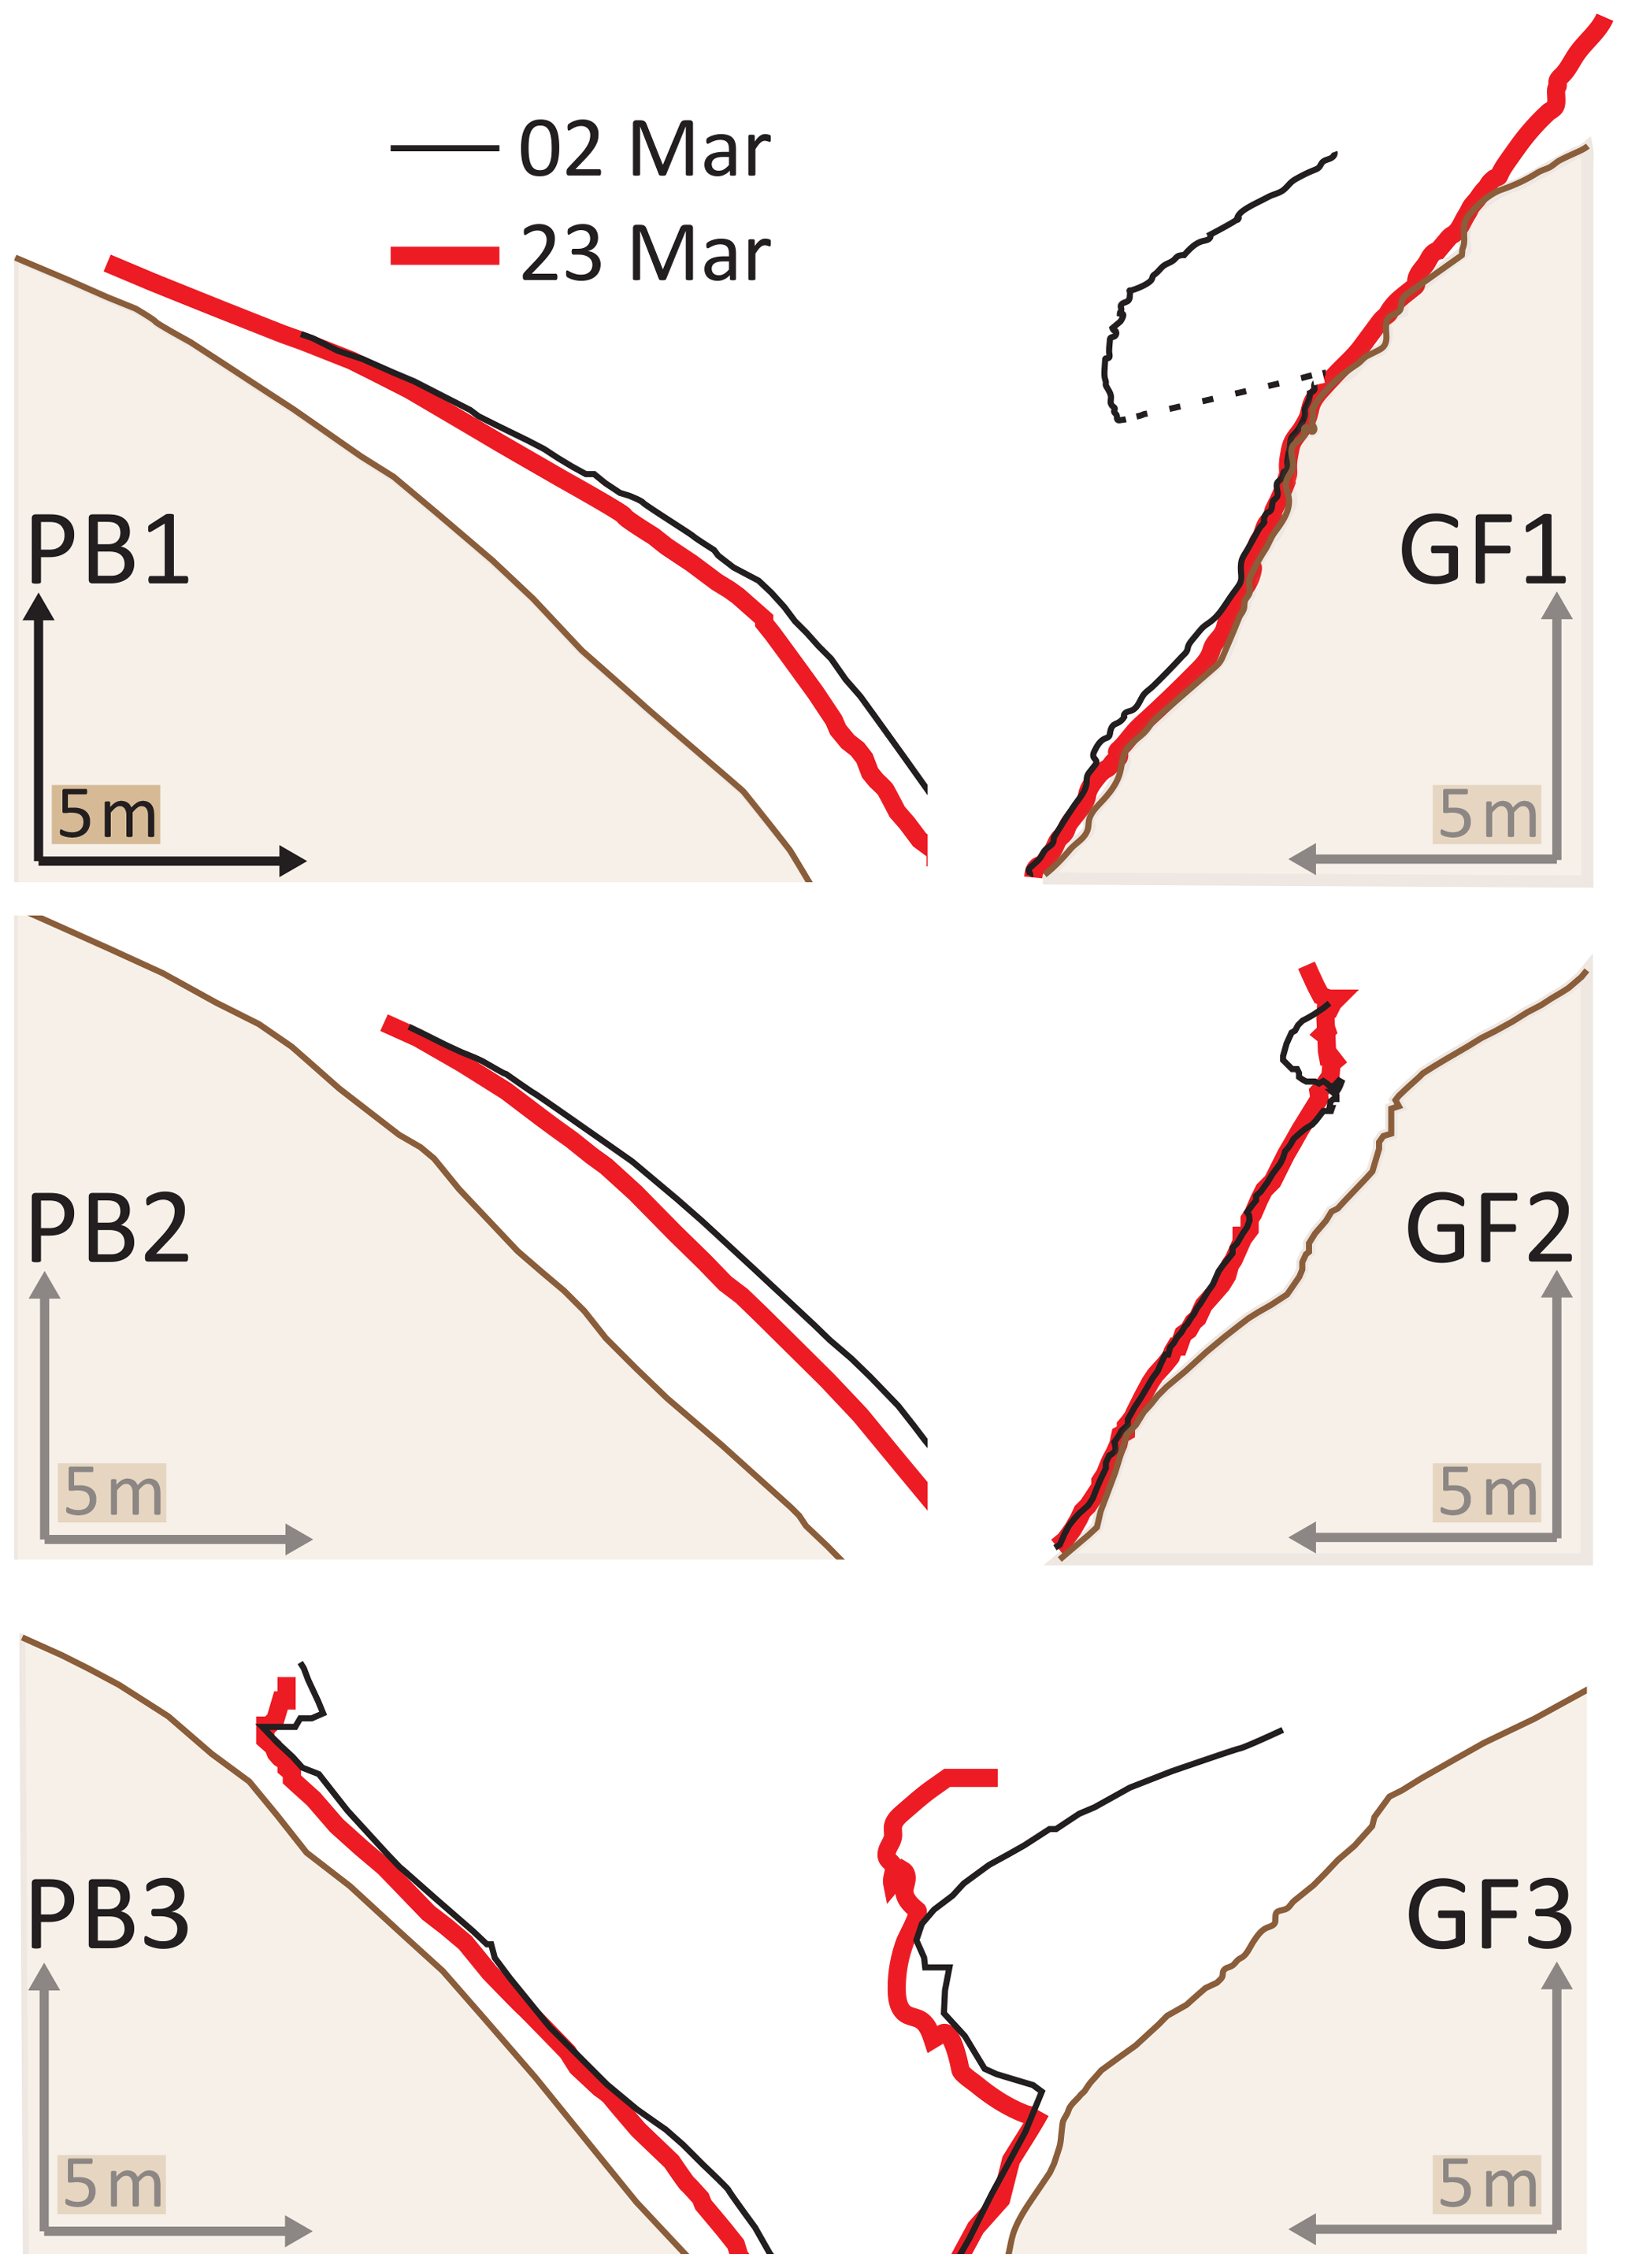
Figure 13Cornice profiles illustrating cornice dynamics during the March 2018 case study, with each profile labeled as it is referred to in the text. Dashed lines indicate interpolated data where overhanging cornice structure shadowed the snow surface from the TLS.
5.1 Seasonal cornice dynamics
TLS-derived cornice data from the 2016–2017 and 2017–2018 winter seasons provide quantitative reinforcement to the conceptual models of cornice dynamics developed in previous studies (e.g., Montagne et al., 1968; Vogel et al., 2012). In these models, cornices accrete through relatively discrete events and begin to deform under their own weight before either failing or melting away towards the end of the snow season.
Our data show cornices can rapidly accrete at any point in the snow season given abundant snow available for wind transport, wind speeds sufficient to mobilize surface snow, and wind directions oriented relatively perpendicular to the ridgeline. We documented accretion rates in excess of 15 mm h−1 at various times throughout the 2016–2017 season on each side of the valley, which can be considered a minimum given the relatively poor temporal constraints on the accretion events provided by the TLS data. Each of these periods of accretion coincided with measured precipitation at the airport, wind speeds in excess of 5 m s−1, and wind directions roughly placing the plateau margin in the lee. The relatively small proportion of the winter seasons characterized by meteorological conditions conducive for accretion suggests just a few accretion events play a key role in cornice development each season (Table 3). Asynchronous cornice responses on Gruvefjellet and Platåberget to specific weather events further illustrate the importance of wind direction in controlling cornice dynamics. During the February 2017 event, for example, cornices on Gruvefjellet rapidly accreted and gained volume with plentiful snow available for transport and strong easterly winds. Cornices on Platåberget lost volume, however, as they were eroded by the same easterly winds. Similar out-of-phase behavior was exhibited in late April 2017, when precipitation and westerly winds resulted in considerable cornice growth on Platåberget accompanied by slight decreases to horizontal and vertical extension in profiles GF2 and GF3 and minimal representative volume changes near profile GF1.
Following initial accretion, the cornices' leading edges begin to deform downslope. Deformation becomes more pronounced later in the season, presumably as increased air temperatures and solar radiation begin to warm the snow, decreasing the stiffness of the cornices and increasing creep (e.g., Schweizer et al., 2003). Further accretion events can then be superimposed on this deformation as the season progresses, with short accretion events interspersed by longer periods of downslope creep. This can be seen in the minor increases in horizontal extension and continued downslope deformation in GF1 and GF3 through the latter portion of the 2017–2018 season (Fig. 7). Cornice accretion and downslope deformation can also occur almost simultaneously with air temperatures approaching or even exceeding freezing at cornice level, as evidenced by the rapid accretion and downslope creep shown in profile PB1 for the 25 April–1 May scan interval (Fig. 10).
While meteorological conditions control the specific timing of cornice accretion and downslope deformation, the underlying topography appears to act as a fundamental control on cornice structure and seasonal cornice dynamics. The presence of the steep bedrock face directly beneath the Gruvefjellet plateau margin limits the support provided by the underlying topography compared to the gentler sloping Platåberget margin. The result is a more overhung cornice structure on Gruvefjellet, while Platåberget's topography allows for more slope-normal snow accumulation. Profiles PB1 and PB2 failed to develop cornices at all during the 2017–2018 winter season (Fig. 7). The presence of cornices with horizontal extension approaching 5 m in these locations during the 2016–2017 winter season (Fig. 5), however, shows the topography can support cornice development given the right meteorological conditions. Differences in meteorological conditions between the 2016–2017 and 2017–2018 winter seasons may provide a partial explanation for differing seasonal snow cover responses on Platåberget (Table 3). Winds in excess of 5 m s−1 – a conservative estimate for threshold wind speeds required to mobilize loose snow (Li and Pomeroy, 1997) – from the western quadrant conducive to cornice accretion on Platåberget were slightly less prevalent during the 2017–2018 season, and these winds also coincided with precipitation roughly half as frequently as during the 2016–2017 season. Easterly winds exceeding 5 m s−1 were considerably more prevalent during the 2017–2018 season, which may have increased cornice scouring or limited snow available for transport – and thus accretion – on Platåberget. Nevertheless, the meteorological differences between the two winter seasons are subtle enough when compared to the noteworthy differences in cornice dynamics to suggest specific interactions between meteorology and topography not necessarily captured by our analyses meaningfully impact cornice development.
Topography also seems to control the relative size of cornice failures. Vogel et al. (2012) describe a “geomorphologically determined sedimentary step approximately 3 m below the plateau that most likely acts as the cornice pivot point” on Gruvefjellet. This pivot point is most evident in profile GF1, where in both winter seasons the downslope creep of the overhung cornice beyond this pivot point ultimately became overburdened during an accretion event and caused the cornice to fail completely. The cornice represented by GF1 has the least topographic support and developed the most overhanging cornice structure of the specific cornices we investigated, and also failed completely both seasons. By contrast, the topographic support provided by Platåberget does not promote overhanging cornices to the same degree, instead promoting a thicker slope-normal snowpack which in itself supports the cornice structure. Here, observed cornice failures such as that shown in PB2 during the 25 April–1 May 2017 scan interval (Fig. 10) are limited to the recently accreted snow and did not involve the entire cornice mass. Similarly, profile GF2 failed in March 2018 within hours of profile GF1's full failure but involved a much smaller portion of the cornice predating the 2 March scan – potentially related to increased topographic support to this cornice relative to GF1 (Fig. 13).
5.2 Cornice fall avalanches
Previous work has differentiated cornice fall avalanche types by the inferred mechanism of cornice failure – via either increased snow load from accretion or decreased snow strength in the cornice related to increased snow and air temperatures. Five of the six cornice fall avalanche events observed in this study coincided with winter storms leading to accretion just prior to cornice failure (Table 1). This is in contrast to previous findings from this location, where no cornice failures were observed in direct response to snow loading caused by a snowstorm (Vogel et al., 2012). The lone cornice fall avalanche event we cannot link to cornice accretion occurred in January 2018. This event coincided with heavy precipitation, but positive temperatures at the Gruvefjellet AWS and decreasing snow depths at the Gruvefjellet snow sensor indicate this precipitation fell as rain (Fig. 6). Our truncated TLS observation record in late spring 2018 unfortunately omits the May–June period found by Vogel et al. (2012) to be critical for air-temperature-induced cornice failures in this location, but observational records throughout this time do not indicate further cornice fall avalanches. Accretion's role in determining cornice failure is also reflected in the asynchronous timing of cornice failures on Gruvefjellet and Platåberget during our study. None of the observed avalanche events included activity on both Gruvefjellet and Platåberget simultaneously as would be expected with air-temperature-induced failures, with avalanches instead occurring only on the leeward aspect.
Observed cornice fall avalanche size appears to be controlled largely by the snow conditions in the underlying release area. Cornice fall avalanches on Gruvefjellet follow a pattern exemplified by the April 2017 case study in which the cornice fails and removes snow from the steep bedrock face below as it descends before impacting the release areas at the base of the cliff (e.g., Fig. 9a). The cornice block can then, depending on the snow conditions in the release area, entrain snow from its impact crater and the avalanche path below or trigger a larger slab avalanche. Cornice failures near profile GF3 in both April 2017 and March 2018 triggered small slab avalanches, but the majority of the avalanche debris resulted from entrainment as the cornice blocks bounced downslope.
Platåberget's topography promotes slightly different avalanche dynamics. The gentler slope at the plateau edge allows snow to accumulate directly under the cornices such that failed cornice masses land directly on the snow to be released as an avalanche. Release areas on Platåberget collect snow during accretion events much more efficiently than those on Gruvefjellet, where blowing snow mass losses due to suspension are promoted by the separation created between the cornices and the release areas by the bedrock cliff. Accumulation in the upper release areas on Platåberget coinciding with accretion events primes these locations for slab avalanche release with even small cornice failures. Relatively small cornice failures triggering larger slab avalanches on Platåberget in April 2017 resulted in magnitude avalanches (D2, R2–R3) comparable to those releasing from much larger cornice failures but less entrainable snow on Gruvefjellet in March 2018 (Figs. 9b and 13a).
5.3 Hazard management implications
Cornice fall avalanches are the most common avalanche type observed in the portion of central Svalbard surrounding our study area where the broad plateau summits and steep valley walls of Longyeardalen's topography are recurrent across the region (Eckerstorfer and Christiansen, 2011b). Cornice fall avalanches observed in this study thus represent processes occurring elsewhere throughout central Svalbard – and to a lesser extent other locations throughout the world – and provide an opportunity to reinforce existing forecasting frameworks with detailed cornice data. The conceptual model of avalanche hazard in North America treats cornice failure both as an individual avalanche problem to be considered by forecasters and as a potential trigger when assessing the likelihood of other avalanche types releasing in a given forecasting area and time period (Statham et al., 2018). Cornice fall avalanche hazard assessments should thus consider both the likelihood of cornice failure and the nature of the snow conditions in the release area to best judge cornice fall avalanche hazard. Our limited dataset, especially in the absence of multiple air-temperature-induced failures, is insufficient to make broad generalizations linking cornice failure type and resulting cornice fall avalanche activity. As a specific example, however, fairly widespread wind slab avalanche activity throughout the region accompanied each of the accretion-induced avalanche events observed in this work. The conditions leading to cornice accretion – strong winds and available snow for wind transport – also promote the development of wind slab problems. Thus, when conditions are favorable for cornice accretion and accretion-induced cornice failures, conditions are also favorable for the development of more widespread – and potentially more sensitive – slab avalanche problems. In this scenario, the chance of a cornice failure triggering a secondary slab avalanche would rise, subsequently amplifying the cornice fall avalanche hazard by also increasing the expected size of the resulting cornice fall avalanche. Furthermore, in all cornice fall avalanches observed on Gruvefjellet the main cornice blocks traveled further downslope than the rest of the avalanche debris. This pattern is apparent on larger failures on Platåberget as well, but is in some cases less obvious, likely due to the smaller cornice blocks being functionally indistinguishable from the avalanche debris. While the dataset presented here is insufficient to draw more quantitative conclusions regarding the runout distance of these cornice blocks, hazard management strategies should consider the destructive potential and extended runout of these blocks relative to the other entrained snow.
5.4 Uncertainties and limitations
The TLS data acquisition and processing techniques employed in this work allowed us to illustrate and quantify changes to the observed cornice systems in detail not previously achieved, but our results and subsequent interpretations are nonetheless limited by several factors. Measurement uncertainties specifically related to measuring snow surfaces with TLS are well-discussed in previous research (Deems et al., 2015; Prokop, 2008), but we introduced additional uncertainty to our results and interpretations due to the scan timing. Our TLS data acquisition scheme involved time-intensive manual input, so we were unable to achieve the temporal resolution required to better constrain individual accretion and cornice failure events. Decreasing time between scans would allow for more continuous and robust accretion rate calculations and could better constrain failure and avalanche snow surfaces, especially pre-event. Sufficiently decreasing the between-scan interval to a sub-daily resolution for such applications would likely require some degree of automation, and future work should consider employing a permanently installed TLS acquiring data automatically similar to systems employed for mining applications or slope stability assessments.
Uncertainties in cornice volume calculations are also affected by occasionally lengthy inter-scan intervals. Volume changes corresponding to specific meteorological conditions are in these cases aggregated across the entire scan interval, making disentangling the specific contributions to volume changes difficult. These conceptual uncertainties are magnified by the technical uncertainties related to TLS data acquisition. The TLS accuracy is of increased importance for volume quantification as measurement uncertainties are propagated throughout the volume calculation process. However, calculated volume uncertainties (Appendix A) are sufficiently low to instill a degree of confidence in the volume calculation process presented here. Finally, volume calculations are perhaps least robust in this study for times when the lack of obvious cornice structure makes calculating volumes particularly challenging (e.g., Platåberget during the 2017–2018 season).
Our experimental design focused on investigating the evolution and failure of the lower cornice surfaces from scan positions underneath the cornices where accessibility has precluded previous research. These scan positions did not, however, allow for systematic monitoring of the cornice roof. The orientation of the cornices' leading edges frequently shielded the cornice roof from the scanner, and our profiles often do not include the complete cornice roof. This also has implications for representative volume calculations, as uncertainty in the location of the cornice roof can result in inaccurate horizontal difference calculations in these specific locations. By failing to capture the cornice roof in our data, we also limit comparisons with earlier work on Gruvefjellet relating downslope cornice deformation and cornice failure to the appearance of tension cracks between the cornice roof and the plateau anchoring point (Vogel et al., 2012). Future work should pair TLS data with some form of tension crack observation, and approaches combining TLS and unmanned aerial vehicle (UAV) photogrammetry present intriguing possibilities for future work in this and other locations.
TLS was shown to be a particularly suitable remote sensing tool for cornice monitoring in Svalbard where we were able to obtain useful data during the early winter seasons when the polar night precludes direct visual observation and cornice photography. Svalbard's unique environmental characteristics – such as the polar night – limit to a degree the applicability of our results to lower latitudes where more diurnal variations in radiation and temperature may influence cornice dynamics in ways not represented in Svalbard (e.g., Munroe, 2018). It is also unclear how representative the two winter seasons for which we present data are for the cornice systems in Longyeardalen, as previous research has also noted considerable differences in cornice dynamics between seasons (Vogel et al., 2012). Continued cornice monitoring in this and other lower-latitude settings would help clarify such uncertainties.
We monitored seasonal cornice dynamics and associated cornice fall avalanche activity with a TLS over two winter seasons in high-Arctic Svalbard. The spatial and temporal resolution at which we acquired snow surface data with the TLS allowed us to quantify changes to the cornices with sub-decimeter accuracy. These data provide quantitative reinforcement to existing conceptual models of cornice dynamics and further strengthen the validity of these models. Notable quantitative contributions from this work include documentation of conservatively calculated horizontal accretion rates well in excess of 10 mm h−1 and a methodology for calculating cornice volumes from TLS data.
This study demonstrated the viability of TLS methods for monitoring cornice dynamics. TLS methods for obtaining snow surface data are appropriate in Svalbard where the long polar night precludes data acquisition via other methods (e.g., photogrammetry), but techniques presented in this work are also suitable for cornices in other lower-latitude environments. Future work should investigate automated TLS data acquisition as an avenue to improve the temporal resolution of the measurements and better constrain cornice dynamics to specific meteorological conditions.
Our findings show complex interactions between topography, wind speed and direction, snow available for transport, existing snowpack, and cornice structure govern the growth, failure, and associated avalanche activity of the cornices in Longyeardalen. In particular, we show cornices rapidly accrete given winds strong enough to mobilize surface snow from a direction roughly perpendicular to the plateau edge, placing the cornices in the lee. Our findings also reinforce previous work indicating an increased likelihood of cornice failure and associated avalanche activity during these periods of cornice accretion. This is encouraging for hazard managers seeking to forecast cornice fall avalanches, as anticipating the relatively infrequent conditions leading to cornice accretion can help predict periods of elevated cornice fall avalanche hazard. We observed the largest failures in our dataset in areas with minimal topographic support, demonstrating knowledge of the topography underlying the cornices can be beneficial when considering the specific location of cornice failure. Nevertheless, our limited dataset of cornice failures hinders conclusions drawn from this work, and continued work in a variety of environments is needed to better understand the specific mechanisms and dynamics of cornice fall avalanches.
Table A1TLS data summary for the 2016–2017 winter season. n/a denotes “not applicable”.
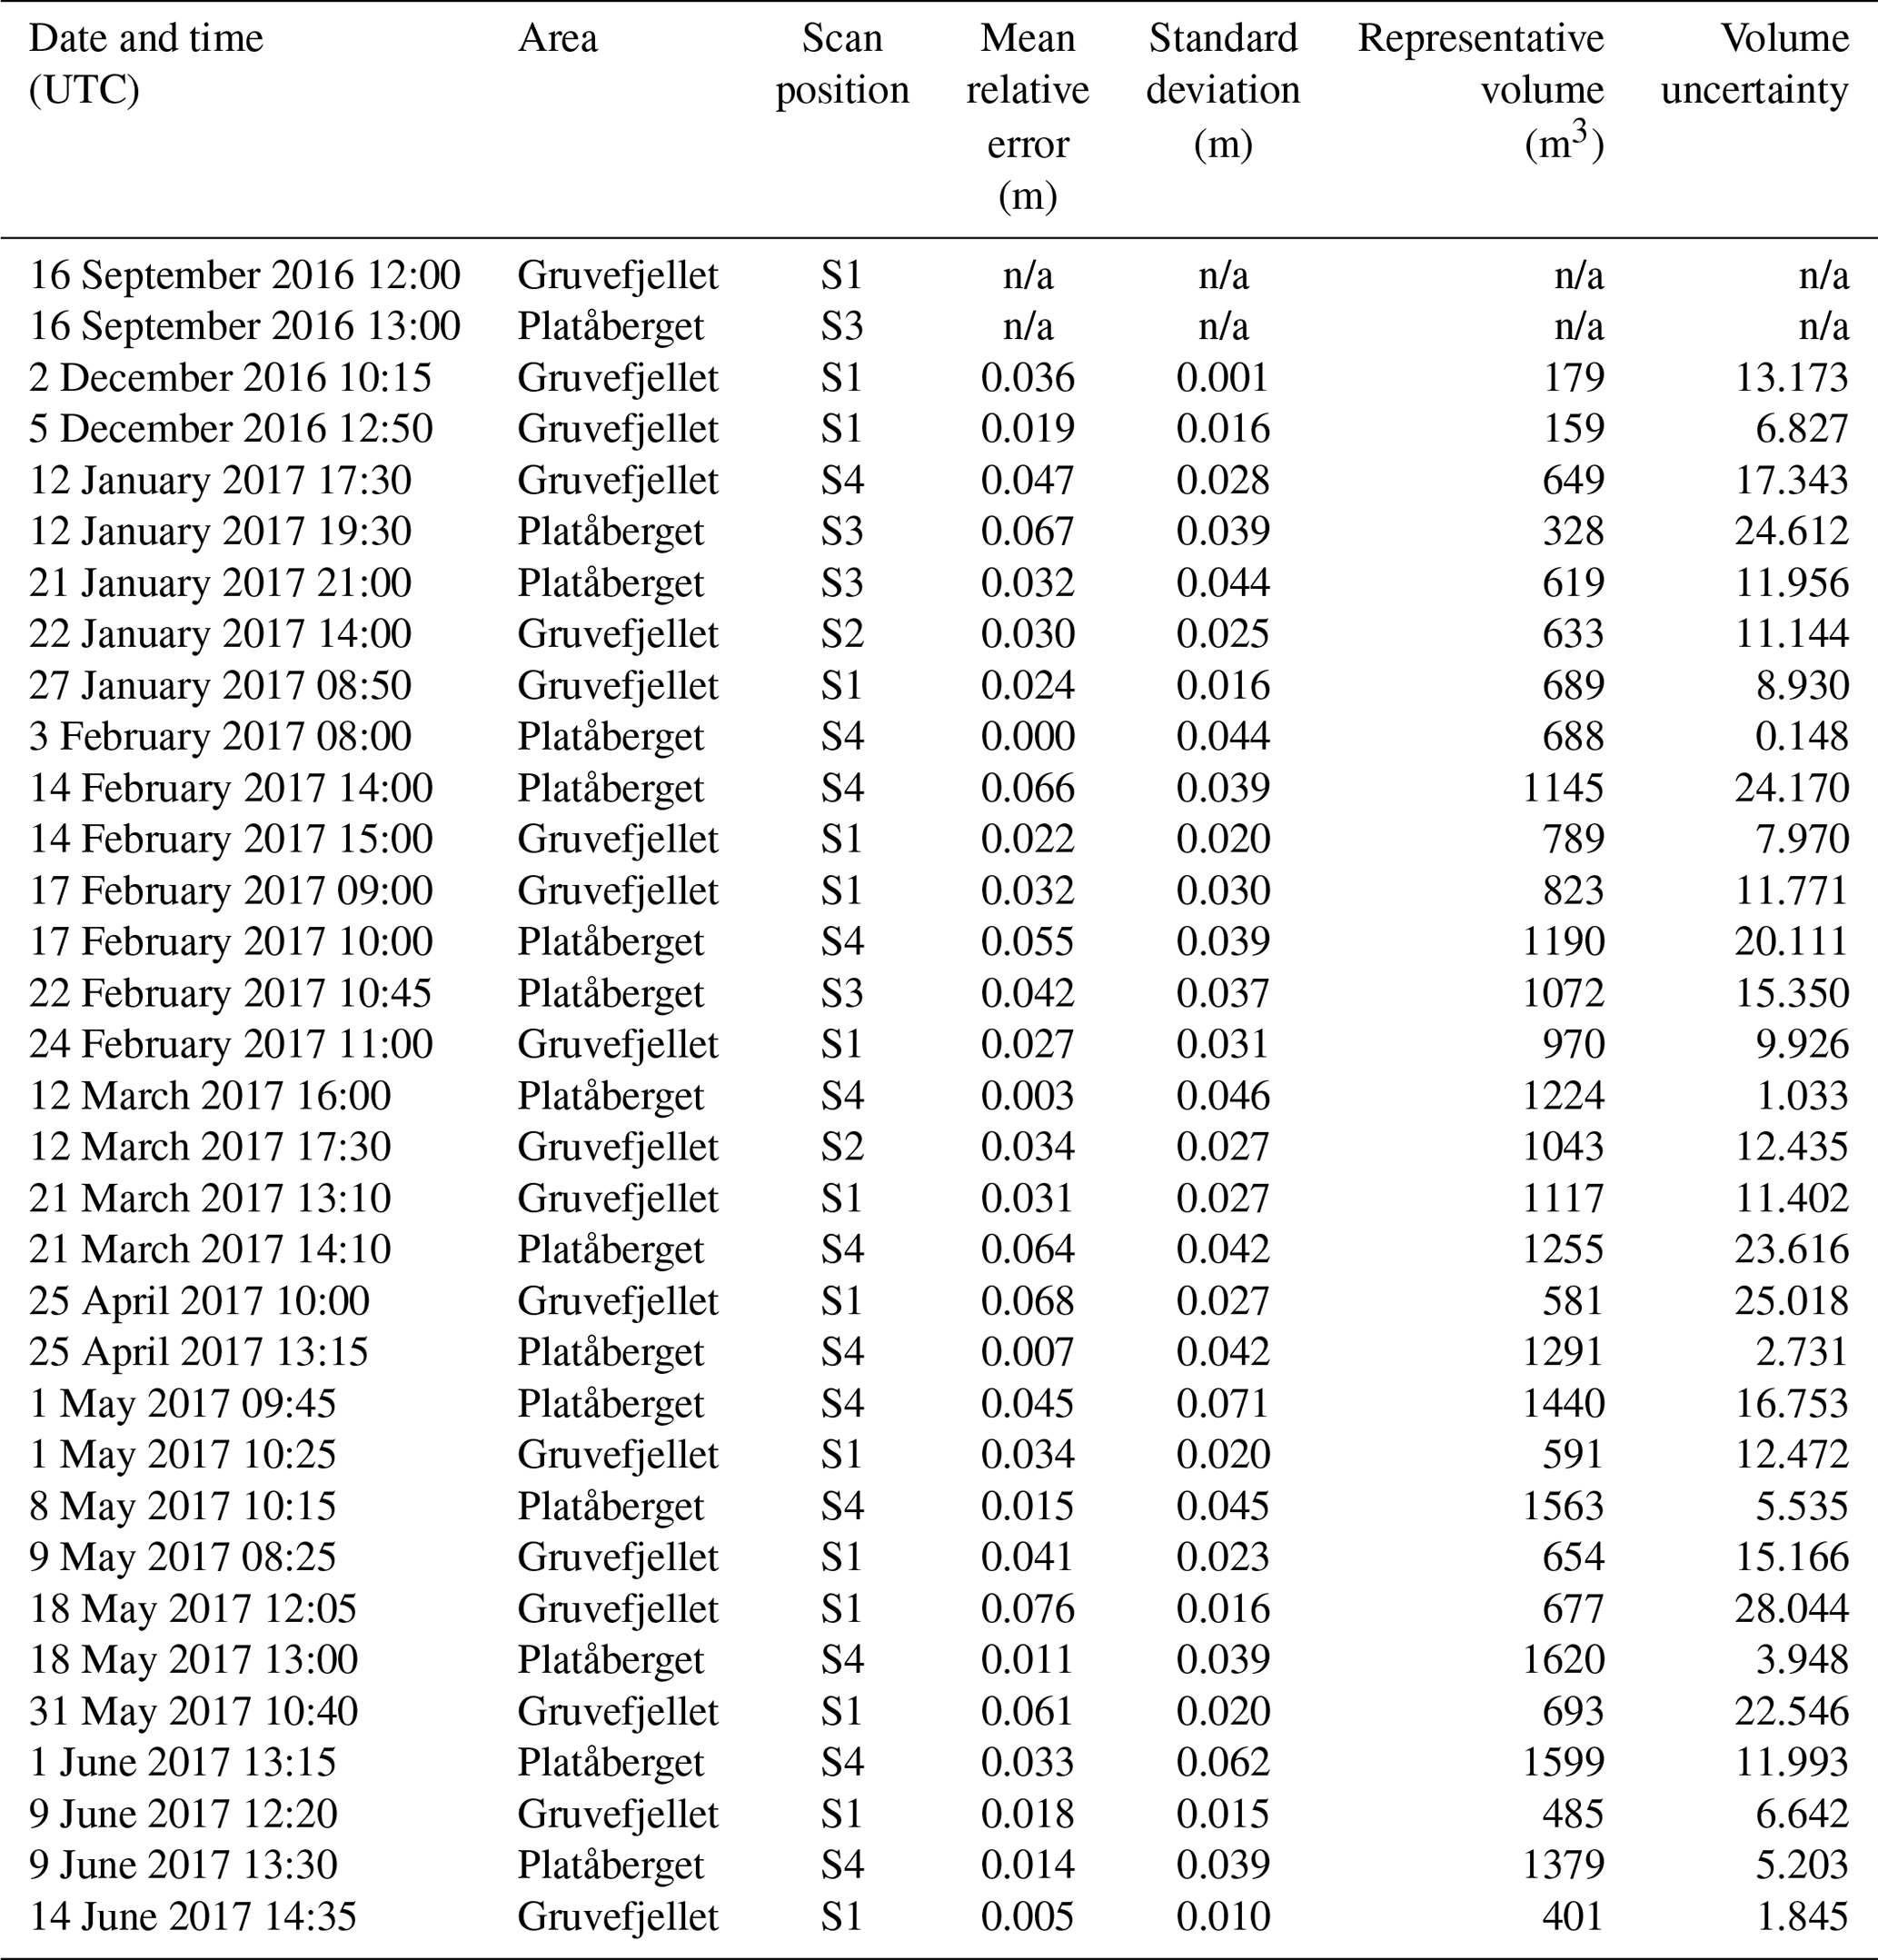
n/a = not applicable.
Data from the Svalbard Airport AWS are freely available through the Norwegian Meteorological Institute's web portal, eKlima (eKlima, 2019). Data from the Gruvefjellet AWS are freely available through the University Centre in Svalbard (UNIS) via https://www.unis.no/resources/weather-stations/ (UNIS, 2019). All TLS, snow depth, and other auxiliary data can be obtained by contacting the corresponding author by email (holt.hancock@unis.no).
HH was responsible for the majority of the data acquisition, analyses, and interpretation of the results. ME helped develop the conceptual framework for the study and contextualized and interpreted the results within a broader snow and avalanche perspective. AP provided technical guidance with regards to TLS data acquisition and analysis techniques and assisted in the development of the study's technical framework in addition to assisting in data acquisition. JH provided advice and supervision relating to study design, data analysis, and interpretation of the results. HH and ME were responsible for manuscript preparation with input from AP and JH.
The authors declare that they have no conflict of interest.
We thank Christine Fey and Jeffrey Munroe for their thorough and constructive reviews which greatly improved this work. Andreas Günther is thanked for serving as editor for this work.
This paper was edited by Andreas Günther and reviewed by Christine Fey and Jeffrey Munroe.
Abellán, A., Oppikofer, T., Jaboyedoff, M., Rosser, N. J., Lim, M., and Lato, M. J.: Terrestrial laser scanning of rock slope instabilities, Earth Surf. Proc. Land., 39, 80–97, https://doi.org/10.1002/esp.3493, 2014.
American Avalanche Association: Snow, Weather and Avalanches: Observation Guidelines for Avalanche Programs in the United States, 3rd Edn., Victor, ID, 104 pp., 2016.
Anderton, S. P., White, S. M., and Alvera, B.: Evaluation of spatial variability in snow water equivalent for a high mountain catchment, Hydrol. Process., 18, 435–453, https://doi.org/10.1002/hyp.1319, 2004.
Caputo, T., Marino, E., Matano, F., Somma, R., Troise, C., and De Natale, G.: Terrestrial Laser Scanning (TLS) data for the analysis of coastal tuff cliff retreat: application to Coroglio cliff, Naples, Italy, Ann. Geophys., 61, SE110, https://doi.org/10.4401/ag-7494, 2018.
Christiansen, H. H., Humlum, O., and Eckerstorfer, M.: Central Svalbard 2000–2011 meteorological dynamics and periglacial landscape response, Arct. Antarct. Alp. Res., 45, 6–18, https://doi.org/10.1657/1938-4246-45.16, 2013.
CloudCompare: version 2.10.2 [GPL Software], available at: http://www.cloudcompare.org, last access: 17 August 2019.
Deems, J. S., Painter, T. H., and Finnegan, D. C.: Lidar measurement of snow depth: a review, J. Glaciol., 59, 467–479, https://doi.org/10.3189/2013JoG12J154, 2013.
Deems, J. S., Gadomski, P. J., Vellone, D., Evanczyk, R., LeWinter, A. L., Birkeland, K. W., and Finnegan, D. C.: Mapping starting zone snow depth with a ground-based lidar to assist avalanche control and forecasting, Cold Reg. Sci. Technol., 120, 197–204, https://doi.org/10.1016/j.coldregions.2015.09.002, 2015.
Eckerstorfer, M. and Christiansen, H. H.: The “High Arctic Maritime Snow Climate” in Central Svalbard, Arct. Antarct. Alp. Res., 43, 11–21, https://doi.org/10.1657/1938-4246-43.1.11, 2011a.
Eckerstorfer, M. and Christiansen, H. H.: Topographical and meteorological control on snow avalanching in the Longyearbyen area, central Svalbard 2006–2009, Geomorphology, 134, 186–196, https://doi.org/10.1016/j.geomorph.2011.07.001, 2011b.
Eckerstorfer, M., Christiansen, H. H., Rubensdotter, L., and Vogel, S.: The geomorphological effect of cornice fall avalanches in the Longyeardalen valley, Svalbard, The Cryosphere, 7, 1361–1374, https://doi.org/10.5194/tc-7-1361-2013, 2013.
eKlima: Free access to weather- and climate data from the Norwegian Meteorological Institute from historical data to real time observations, The Norwegian Meteorological Institute, available at: http://sharki.oslo.dnmi.no/portal/page?_pageid=73,39035,73_39049&_dad=portal&_schema=PORTAL, last access: 7 August 2018.
Farizy, B.: Cornice control by helicopter, in: International Snow Science Workshop, 7–11 October 2013, Grenoble – Chamonix Mont-Blanc, 845–847, 2013.
Fey, C., Schattan, P., Helfricht, K., and Schöber, J.: A compilation of multitemporal TLS snow depth distribution maps at the Weisssee snow research site (Kaunertal, Austria), Water Resour. Res., 55, 5154–5164, https://doi.org/10.1029/2019wr024788, 2019.
Førland, E., Benestad, R., Hanssen-Bauer, I., Haugen, J. E., and Skaugen, T. E.: Temperature and precipitation development at Svalbard 1900–2100, Adv. Meteorol., 2011, 1–14, https://doi.org/10.1155/2011/893790, 2011.
Hanssen-Bauer, I., Solås, M. K., and Steffensen, E.: The Climate of Spitsbergen, Report 39/90, Det Norske Meteorologiske Institutt, Oslo, Norway, 40 pp., 1990.
Hanssen-Bauer, I., Førland, E., Hisdal, H., Mayer, S., Sandø, A., and Sorteberg, A.: Climate in Svalbard 2100 – a knowledge base for climate adaptation, 1/2019, Norwegian Centre for Climate Services, 207 pp., available at: https://www.miljodirektoratet.no/globalassets/publikasjoner/M1242/M1242.pdf (last access: 25 February 2020), 2019.
Hartzell, P. J., Gadomski, P. J., Glennie, C. L., Finnegan, D. C., and Deems, J. S.: Rigorous error propagation for terrestrial laser scanning with application to snow volume uncertainty, J. Glaciol., 61, 1147–1158, https://doi.org/10.3189/2015JoG15J031, 2017.
Humlum, O., Instanes, A., and Sollid, J. L.: Permafrost in Svalbard: a review of research history, climatic background and engineering challenges, Polar Res., 22, 191–215, 2003.
Humlum, O., Christiansen, H. H., and Juliussen, H.: Avalanche-derived rock glaciers in Svalbard, Permafrost Periglac. Process., 18, 75–88, 2007.
Isaksen, K., Nordli, Ø., Førland, E. J., Łupikasza, E., Eastwood, S., and Niedźwiedź, T.: Recent warming on Spitsbergen – Influence of atmospheric circulation and sea ice cover, J. Geophys. Res.-Atmos., 121, 11913–11931, https://doi.org/10.1002/2016JD025606, 2016.
Jaboyedoff, M., Oppikofer, T., Abellán, A., Derron, M.-H., Loye, A., Metzger, R., and Pedrazzini, A.: Use of LIDAR in landslide investigations: a review, Nat. Hazards, 61, 5–28, https://doi.org/10.1007/s11069-010-9634-2, 2012.
Jaedicke, C. and Sandvik, A. D.: High resolution snow distribution data from complex Arctic terrain: a tool for model validation, Nat. Hazards Earth Syst. Sci., 2, 147–155, https://doi.org/10.5194/nhess-2-147-2002, 2002.
Kobayashi, D., Ishikawa, N., and Nishio, F.: Formation process and direction distribution of snow cornices, Cold Reg. Sci. Technol., 15, 131–136, https://doi.org/10.1016/0165-232X(88)90059-6, 1988.
Lague, D., Brodu, N., and Leroux, J.: Accurate 3D comparison of complex topography with terrestrial laser scanner: Application to the Rangitikei canyon (N-Z), ISPRS J. Photogram. Remote Sens., 82, 10–26, https://doi.org/10.1016/j.isprsjprs.2013.04.009, 2013.
Latham, J. and Montagne, J.: The Possible Importance of Electrical Forces in the Development of Snow Cornices, J. Glaciol., 9, 375–384, https://doi.org/10.3189/S0022143000022899, 1970.
Li, L. and Pomeroy, J. W.: Estimates of Threshold Wind Speeds for Snow Transport Using Meteorological Data, J. Appl. Meteorol., 36, 205–213, https://doi.org/10.1175/1520-0450(1997)036<0205:EOTWSF>2.0.CO;2, 1997.
Major, H., Haremo, P, Dallmann, W. K., Andresen, A., and Salvigsen, O.: Geological map of Svalbard , sheet C9G Adventdalen, Norsk Polarinstitutt, Tromsø, Norway, 2001.
McCarty, D., Brown, R., and Montagne, J.: Cornices: their growth, properties, and control, in: International Snow Science Workshop, Lake Tahoe, CA, USA, 41–45, 1986.
Montagne, J., McPartland, J., Super, A., and Townes, H.: The Nature and control of snow cornices on the Bridger Range, Southwestern Montana, Miscellaneous Report, Alta Avalanche Study Center, Bozeman, MT, 1968.
Mott, R., Schirmer, M., and Lehning, M.: Scaling properties of wind and snow depth distribution in an Alpine catchment, J. Geophys. Res.-Atmos., 116, D06106, https://doi.org/10.1029/2010JD014886, 2011.
Munroe, J. S.: Monitoring snowbank processes and cornice fall avalanches with time-lapse photography, Cold Reg. Sci. Technol., 154, 32–41, https://doi.org/10.1016/j.coldregions.2018.06.006, 2018.
Naruse, R., Nishimura, H., and Maeno, N.: Structural Characteristics of Snow Drifts and Cornices, Ann. Glaciol., 6, 287–288, 1985.
Prokop, A.: Assessing the applicability of terrestrial laser scanning for spatial snow depth measurements, Cold Reg. Sci. Technol., 54, 155–163, https://doi.org/10.1016/j.coldregions.2008.07.002, 2008.
Prokop, A. and Panholzer, H.: Assessing the capability of terrestrial laser scanning for monitoring slow moving landslides, Nat. Hazards Earth Syst. Sci., 9, 1921–1928, https://doi.org/10.5194/nhess-9-1921-2009, 2009.
Prokop, A. and Procter, E. S.: A new methodology for planning snow drift fences in alpine terrain, Cold Reg. Sci. Technol., 132, 33–43, https://doi.org/10.1016/j.coldregions.2016.09.010, 2016.
Prokop, A., Schirmer, M., Rub, M., Lehning, M., and Stocker, M.: A comparison of measurement methods: terrestrial laser scanning, tachymetry and snow probing for the determination of the spatial snow-depth distribution on slopes, Ann. Glaciol., 49, 210–216, https://doi.org/10.3189/172756408787814726, 2008.
Prokop, A., Schön, P., Singer, F., Pulfer, G., Naaim, M., Thibert, E., and Soruco, A.: Merging terrestrial laser scanning technology with photogrammetric and total station data for the determination of avalanche modeling parameters, Cold Reg. Sci. Technol., 110, 223–230, 2015.
Prokop, A., Hancock, H., Praz, M., and Jahn, E.: Slope scale avalanche forecasting in the arctic (Svalbard), in: International Snow Science Workshop, Innsbruck, Austria, 1035–1039, 2018.
Riegl® Laser Measurement Systems: VZ-6000 Datasheet, available at: http://www.riegl.com/uploads/tx_pxpriegldownloads/RIEGL_VZ-6000_Datasheet_2019-05-28_01.pdf, last access: 6 October 2019.
Rogers, J. C., Yang, L., and Li, L.: The role of Fram Strait winter cyclones on sea ice flux and on Spitsbergen air temperatures, Geophys. Res. Lett., 32, L06709, https://doi.org/10.1029/2004GL022262, 2005.
Schirmer, M., Wirz, V., Clifton, A., and Lehning, M.: Persistence in intra-annual snow depth distribution: 1. Measurements and topographic control, Water Resour. Res., 47, W09516, https://doi.org/10.1029/2010WR009426, 2011.
Schön, P., Prokop, A., Vionnet, V., Guyomarc'h, G., Naaim-Bouvet, F., and Heiser, M.: Improving a terrain-based parameter for the assessment of snow depths with TLS data in the Col du Lac Blanc area, Cold Reg. Sci. Technol., 114, 15–26, https://doi.org/10.1016/j.coldregions.2015.02.005, 2015.
Schweizer, J., Bruce Jamieson, J., and Schneebeli, M.: Snow avalanche formation, Rev. Geophys., 41, 1016, https://doi.org/10.1029/2002RG000123, 2003.
Seligman, G.: Snow structure and ski fields: being an account of snow and ice forms met with in nature and a study on avalanches & snowcraft, Macmillan, London, 1936.
Statham, G., Haegeli, P., Greene, E., Birkeland, K., Israelson, C., Tremper, B., Stethem, C., McMahon, B., White, B., and Kelly, J.: A conceptual model of avalanche hazard, Nat. Hazards, 90, 663–691, https://doi.org/10.1007/s11069-017-3070-5, 2018.
UNIS: Weather Station Resources – Gruvefjellet, The University Centre in Svalbard, available at: https://www.unis.no/resources/weather-stations/, last access: 7 August 2018.
van Herwijnen, A. and Fierz, C.: Monitoring snow cornice development using time-lapse photography, in: Proceedings of the International Snow Science Workshop 2014, Banff, Canada, 865–869, 2014.
Vikhamar-Schuler, D., Isaksen, K., Haugen, J. E., Tømmervik, H., Luks, B., Schuler, T. V., and Bjerke, J. W.: Changes in winter warming events in the Nordic Arctic region, J. Climate, 29, 6223–6244, https://doi.org/10.1175/jcli-d-15-0763.1, 2016.
Vionnet, V., Martin, E., Masson, V., Guyomarc'H, G., Naaim Bouvet, F., Prokop, A., Durand, Y., and Lac, C.: Simulation of wind-induced snow transport and sublimation in alpine terrain using a fully coupled snowpack/atmosphere model, The Cryosphere, 8, 395–415, https://doi.org/10.5194/tc-8-395-2014, 2014.
Vogel, S., Eckerstorfer, M., and Christiansen, H.: Cornice dynamics and meteorological control at Gruvefjellet, Central Svalbard, The Cryosphere, 6, 157–171, https://doi.org/10.5194/tc-6-157-2012, 2012.
Watson, C. S., Quincey, D. J., Smith, M. W., Carrivick, J. L., Rowan, A. V., and James, M. R.: Quantifying ice cliff evolution with multi-temporal point clouds on the debris-covered Khumbu Glacier, Nepal, J. Glaciol., 63, 823–837, https://doi.org/10.1017/jog.2017.47, 2017.