the Creative Commons Attribution 4.0 License.
the Creative Commons Attribution 4.0 License.
 | 21 Feb 2020
Measuring compound flood potential from river discharge and storm surge extremes at the global scale
Dirk Eilander
Sanne Muis
Ted I. E. Veldkamp
Ivan D. Haigh
Thomas Wahl
Hessel C. Winsemius
Philip J. Ward
The interaction between physical drivers from oceanographic, hydrological, and meteorological processes in coastal areas can result in compound flooding. Compound flood events, like Cyclone Idai and Hurricane Harvey, have revealed the devastating consequences of the co-occurrence of coastal and river floods. A number of studies have recently investigated the likelihood of compound flooding at the continental scale based on simulated variables of flood drivers, such as storm surge, precipitation, and river discharges. At the global scale, this has only been performed based on observations, thereby excluding a large extent of the global coastline. The purpose of this study is to fill this gap and identify regions with a high compound flooding potential from river discharge and storm surge extremes in river mouths globally. To do so, we use daily time series of river discharge and storm surge from state-of-the-art global models driven with consistent meteorological forcing from reanalysis datasets. We measure the compound flood potential by analysing both variables with respect to their timing, joint statistical dependence, and joint return period. Our analysis indicates many regions that deviate from statistical independence and could not be identified in previous global studies based on observations alone, such as Madagascar, northern Morocco, Vietnam, and Taiwan. We report possible causal mechanisms for the observed spatial patterns based on existing literature. Finally, we provide preliminary insights on the implications of the bivariate dependence behaviour on the flood hazard characterisation using Madagascar as a case study. Our global and local analyses show that the dependence structure between flood drivers can be complex and can significantly impact the joint probability of discharge and storm surge extremes. These emphasise the need to refine global flood risk assessments and emergency planning to account for these potential interactions.
- Article
(3816 KB) - Full-text XML
-
Supplement
(10050 KB) - BibTeX
- EndNote


Flooding in deltas and estuaries is driven by the interactions of oceanographic, hydrological, and meteorological phenomena such as extreme rainfall, river discharge, storm surge, and wave action. When these co-occur in space and time, they can exacerbate the flood extent, depth, and duration locally, resulting in a so-called compound flood event (Zscheischler et al., 2018). These events have the potential to cause large social and economic impacts and can directly or indirectly impact flood emergency response and infrastructure (Leonard et al., 2014; Zscheischler et al., 2018). The potentially extreme impacts of compound flood events were recently highlighted by Cyclone Idai in March 2019. The long-lived tropical cyclone travelled within the Mozambique Channel, causing catastrophic damage along its path in Madagascar, Malawi, Zimbabwe, and, most importantly, in Mozambique, where it made landfall twice. Its second landfall near Beira on 14 March devastated the city and surrounding villages. The combination of extreme winds of more than 160 km h−1 with torrential rains happening several days prior to and after the landfall contributed to the severe and widespread flooding observed in this area. At this moment, there are no observations of sea levels freely available; maximum storm surge of 4.4 m was calculated for this location and more than 600 mm of accumulated rainfall were measured over a period of 2 weeks, resulting in local rivers going out of their bank (JRC, 2019; Probst and Annunziato, 2019). It was reported that Idai directly affected 3 000 000 people, caused at least 960 casualties, destroyed about USD 1 billion in infrastructure, ruined 500 000 ha of crops, and caused widespread power outages and multiple road closures that complicated aid distribution and the humanitarian interventions to keep cholera outbreaks under control (Nhamire and Hill, 2019; ERCC, 2019; USAID, 2019). In Europe, between 1870 and 2016, at least 23 damaging flood events reported the co-occurrence of coastal and river floods, representing about 1.5 % of all flood events (Paprotny et al., 2018b). For this study, Paprotny at al. (2018b) used four indicators (i.e. losses, persons affected, persons killed, or area flooded) as a threshold to consider an event damaging. However, little is known about the impacts and occurrence of compound flood events globally (Bevacqua et al., 2017).
Classical methodologies for large-scale flood hazard and flood risk studies mainly consider univariate flooding mechanisms and do not include compound flood events (Ward et al., 2015). These assessments therefore focus on either river (e.g. Alfieri et al., 2014; Dottori et al., 2016; Hirabayashi et al., 2013; Ward et al., 2013, 2017; Winsemius et al., 2013, 2016) or coastal floods (e.g. Brown et al., 2016; Hinkel et al., 2014; Muis et al., 2016; Vousdoukas et al., 2018), neglecting riverine and sea level interactions. Yet, these interactions can significantly influence the magnitude of simulated water levels (Santiago-Collazo et al., 2019). At the global scale, Ikeuchi et al. (2017) found the annual maximum river water level for 2005 in low-lying flat areas to be underestimated by more than 0.5 m when ignoring sea level interactions. Local studies have shown that ignoring the dependence between river discharge and storm surge can underestimate the return period of a given water level within a river mouth (Bevacqua et al., 2017; Couasnon et al., 2018; Moftakhari et al., 2019; Serafin et al., 2019).
Compound flood events can occur due to synoptic weather systems (Seneviratne et al., 2012). Clearly, tropical cyclones have the potential to cause simultaneous high river discharge and storm surge, as exemplified by Cyclone Idai. Storms with prevailing wind directions hitting mountains have also been documented to generate strong sustained winds accompanied with intense rainfall, due to orographic effects (Martius et al., 2016; Svensson and Jones, 2002, 2004). However, the co-occurrence of coastal and river floods can also occur by chance and not be related to an underlying common synoptic weather system. The expected number of co-occurrences happening by chance (i.e. statistical independence) can be determined based on probability theory (Kew et al., 2013; Martius et al., 2016). The impact of a compound flood event is influenced by the magnitude of the river and coastal flood drivers. The presence of a positive and significant statistical dependence between flood drivers indicates a higher probability for the occurrence of extreme combinations of these variables when compared to statistical independence (Diermanse and Geerse, 2012).
A consistent mathematical definition of compound flood events does not exist and multiple statistical methods have been suggested to study this phenomenon (Hao et al., 2018; Tilloy et al., 2019). These methods usually examine the number of joint extremes or the statistical dependence between proxy variables of different flood hazard types such as rainfall and storm surge, river flow and storm surge, and river flow and sea level (Bevacqua et al., 2019; Hendry et al., 2019; Kew et al., 2013; Paprotny et al., 2018a; Sadegh et al., 2018; Svensson and Jones, 2002, 2004; Wahl et al., 2015; Ward et al., 2018; Wu et al., 2018; Zheng et al., 2013). Recent compound flooding studies carried out at the regional to global scale used copula theory to characterise the bivariate joint distribution and assess complex dependence structures, e.g. in the case of upper tail dependence (Bevacqua et al., 2019; Paprotny et al., 2018a; Ward et al., 2018). Possible compound flooding mechanisms are examined by sampling a set of events from the full bivariate time series and then analysing the dependence structure of the latter. Wahl et al. (2015), Moftakhari et al. (2017), and Ward et al. (2018) used conditional sampling to assess the bivariate relationship between a riverine flood driver and a coastal flood driver when one variable was in an extreme state (e.g. by selecting annual maxima or peaks over threshold). Other studies defined compound flood events as pairs based on joint exceedances above a predefined quantile such as the 95th or 97.5th percentile of the respective marginal distribution (Bevacqua et al., 2019; Hawkes, 2008; Kew et al., 2013). However, directly applying such approaches for flood hazard quantification can be difficult due to the challenge of both defining independent and identically distributed events and capturing extremes from both time series (Hawkes, 2008; Hawkes et al., 2008).
A statistically robust analysis of bivariate flood drivers requires an extensive set of high-quality observations. Studies based on observations from gauge data have therefore provided an overview of the compound flood potential globally but are strongly biased towards gauge-rich areas. In the case of Ward et al. (2018), this resulted in a selection of 187 pairs of stations located mainly around the coasts of North America, Europe, Australia, and Japan. Non-stationarities in the observations may be present due to anthropogenic activities, such as water extractions, dam construction, and land-use changes. These factors increase the complexity of the signal and make the attribution of the dependence to synoptic meteorological drivers challenging. One way to address these limitations is by using hydrodynamic models to simulate river discharge and storm surge, and using these simulated time series for the statistical analysis of compound flood potential. Such an approach has been carried out for the European (Bevacqua et al., 2019; Paprotny et al., 2018a) and the Australian coastlines (Wu et al., 2018).
In this paper, we identify potential hotspot regions for compound floods from riverine and coastal floods along the entire global coastline by taking advantage of the extensive spatial and temporal coverage from a global river discharge and a global storm surge model. In doing so, we provide a first statistical assessment of the compound flood potential in areas where observations from discharge and tide gauges are absent or insufficient. We do not limit our analysis to one specific statistical approach but purposefully examine the compound flood potential by analysing both the timing between river discharge and storm surge extremes, and their dependence. We further suggest and apply a new methodology to quantify compound flood hazard that integrates these characteristics while fully capturing both extreme marginal distributions. Finally, we exemplify the critical influence of the dependence structure on the probability of compound discharge and coastal flood events by means of a case study example in Madagascar. Therefore, our global analysis should be considered a first step towards statistically characterising compound flooding from extreme river discharge and storm surge worldwide.
This paper is divided in four parts, as follows. Section 2 introduces the global datasets used and the method developed for this study. Section 3 presents the results and discusses the observed spatial patterns of high (low) compound flood potential based on previous literature. We also emphasise the implication of compound flood events for flood hazard quantification by looking at a selected location in Madagascar and the limitations of our study. The conclusions and outlook for future research are presented in Sect. 4.
We assess the compound flood potential between riverine and coastal flood drivers using simulated daily river discharge and maximum daily storm surge as proxy variables, respectively. The latter is a common choice for studying compound flood hazard analysis in deltas and estuaries (Khanal et al., 2019; Klerk et al., 2015; Svensson and Jones, 2002; Ward et al., 2018). The research involves the following steps, each of which is described in the following subsections:
- 1.
selecting global datasets of river discharge and storm surge time series,
- 2.
defining sets of events to analyse compound flooding,
- 3.
quantifying compound flood potential using the defined sets.
2.1 Selecting global datasets of river discharge and storm surge variables
We use simulations of instantaneous daily discharge of the river-routing model CaMa-Flood version 3.62 (Yamazaki et al., 2014) forced by daily average runoff data of the land surface model JULES WRR2 eartH2Observe (Best et al., 2011; Clark et al., 2011; Dutra et al., 2017; Schellekens et al., 2017) available at https://doi.org/10.5281/zenodo.3552820 (Eilander, 2019). The maximum daily storm surge is obtained from the Global Tide and Surge Model (GTSM) (Muis et al., 2016; Verlaan et al., 2015). These two datasets are selected because they have shown good performance when compared to outputs from other global-scale models and are in good agreement with observations (Beck et al., 2017b; Muis et al., 2016; Schellekens et al., 2017). Both models were forced based on the same meteorological dataset, namely the ERA-Interim global reanalysis dataset developed by the European Centre For Medium-Range Weather Forecasts (Dee et al., 2011). For precipitation, the MSWEPv1.2 dataset was used, which complements the ERA-Interim dataset with other reanalysis, satellite, and gauge datasets (Beck et al., 2017b). In the following paragraphs, we provide an overview of both global models.
Daily river discharge is obtained by routing the mean daily runoff of the JULES model from the eartH2Observe WRR2 reanalysis data at 0.5∘ resolution (Best et al., 2011; Clark et al., 2011; Schellekens et al., 2017) with CaMa-Flood at a 0.25∘ resolution (Yamazaki et al., 2011). The output is the instantaneous discharge at 00:00 GMT daily for the period 1980–2014. For the eartH2Observe WRR2 reanalysis dataset, the hydrological model was forced with temperature and potential evaporation derived from ERA-Interim and precipitation from the MSWEPv1.2 dataset (Beck et al., 2017c). The effect of human water use on the water balance was not included, and therefore the dataset characterises the compound flood potential stemming from the climate forcing only. Additional preprocessing of the runoff data was required to define runoff and remove negative runoff outliers (Eilander et al., 2018). The river discharge obtained at the coast is based on the assumption of a constant 0 m+EGM96 coastal water level and not corrected for coastal discharges, e.g. due to the influence of tidal currents, which means that the discharge variable is the result from upstream catchment processes only. The JULES model was specifically selected as it showed one of the best mean overall performances in terms of runoff signatures and temporal correlation when excluding polar regions (Beck et al., 2017b).
Storm surge, the change in sea level driven by high winds and low atmospheric pressure, is simulated in GTSM with wind speed and atmospheric pressure from ERA-Interim (Muis et al., 2016; Verlaan et al., 2015). The model is a global hydrodynamic model using an unstructured grid with a higher resolution on the shallow continental shelf (up to 3 arcmin) than in deeper parts of the oceans (0.5∘). The surge component is modelled separately from the tide and thereby does not include surge–tide interactions, which allows us to isolate the meteorological contribution only. Storm surge time series are available at 16 395 output locations unevenly distributed along the coastline, with a temporal resolution of 10 min between 1979 and 2014.
We carry out additional validation for both models extending the validation performed by Beck et al. (2017b) and Muis et al. (2016) by looking more specifically at the timing and correlation of discharge and storm surge extremes over a time period of at least 20 years between 1980 and 2014; see Sect. S1 in the Supplement. We calculate the percentage of annual maxima dates correctly predicted, termed “hit rate”, and the Spearman's rank correlation coefficient between observed and simulated annual maxima. For the discharge, we find a relatively high rank correlation globally (median: 0.57; SD: 0.22). Capturing the timing of extreme river discharge is more challenging (median hit rate: 0.21; SD: 0.18), but the hit rate increases close to the coast (see Fig. S1). For the storm surge, we find a higher hit rate (median: 0.34; SD: 0.22) and a lower rank correlation coefficient (median: 0.37; SD: 0.31) than for the discharge. In this case, coastal stations with a high correlation coefficient also capture the timing of storm surge extremes well. As a result, the timing and correlation of extreme storm surge is generally well represented along the European, North American, Japanese, and Australian coasts but not the South African and South American coasts. We further assess how the respective performance of both models can affect the compound flood potential measures defined in Sect. 2.3 (see Sect. S1.3). Due to the selection criteria we impose, this results in 25 pairs of observation stations, which is insufficient for a rigorous comparison at large regional scales. In general, we find that using the simulated discharge and storm surge variables captures the sign of the dependence correctly, but the magnitude of this dependence can largely vary. Moreover, the models tend to correctly identify the locations with the highest number of co-occurring discharge and storm surge annual maxima but overestimate this number. This additional validation showed that the performance of both models vary globally, which as a result can locally bias the compound flood potential. Nevertheless, it provides an acceptable performance on average for the purpose of this study, i.e. to provide a first-cut assessment of the compound flood potential at the global scale.
Finally, each discharge location at the river mouth of coastal catchments larger than 1000 km2 is paired with the nearest (≤75 km) GTSM output location (Eilander et al., 2018). This leads to 3434 stations of paired river discharge and storm surge time series between 1980 to 2014, representing 35 years of daily data.
2.2 Defining sets of events to analyse compound flooding
We do not restrict our analysis to one specific set of extreme river discharge and storm surge events per location but instead define different sets of events from the paired time series in order to measure the compound flood potential (presented in Sect. 2.3). In this subsection, we explain the differences between the sets and illustrate them for an example location along the coast of Madagascar (Fig. 1c). Figure 1a and b present the paired time series of simulated daily discharge q and the maximum daily storm surge s for the example location.
To investigate the strength of the dependence between the two variables, we select the conditional sampling method used in Wahl et al. (2015) and Ward et al. (2018). We create two sets of events based on the conditional sampling of the annual maxima of the river discharge Q and storm surge S. We select for year n the maximum of the daily storm surge height sn within tn±Δ (days) from the occurrence of the annual maximum of the river discharge Qn:
Conversely, the other set is created as follows:
This leads to two sets of pairs (Qn, sn) and (Sn, qn) with . The two sets of events are shown in Fig. 1d for the example location and a time window of Δ=3 d. They can be interpreted as the highest daily storm surge height (river discharge) associated with the river discharge (storm surge) annual maximum. Note that peaks could also be selected based on a peaks over threshold (POT) approach. We do not expect this choice to significantly influence the results if selecting an equivalent threshold, as investigated by Ward et al. (2018).
We also examine the co-occurrence of annual maxima by defining another set of events, the annual maxima pairs of river discharge and of storm surge: . If the timing between both annual maxima in a year is less than or equal to Δ (days), i.e. , we consider it as a co-occurring event. We denote such a co-occurrence with (, ). Figure 1e shows all the pairs of annual maxima obtained for the example location for Δ=3 d. In this case, 14 co-occurring events are recorded over the whole 35 years of simulation period (red dots). We transform the annual maxima pairs (Qn, Sn) to probability space using the empirical cumulative distribution functions of both variables (Fig. 1f). The pseudo-observations of the co-occurring events (shown in red) do not only correspond to joint high quantiles but also a combination of high, moderate, and low storm surge with moderate to high quantiles of discharge. Unlike the conditional sampling method, the marginal distribution using this sampling approach now corresponds to the respective annual maxima distribution. This means that we can easily convert the corresponding quantiles to their marginal return period.
In the extreme case where annual maxima of discharge and surge are always co-occurring, this means that all the sets of events defined above are equivalent. In other words, . We do not expect to observe such an extreme case, but this highlights that (, ) events are always part of all sets. For the example location, the 14 overlapping pairs from both conditional sets in Fig. 1d correspond to the co-occurring annual maxima in Fig. 1e and 1.

Figure 1Maximum daily storm surge s (a) and daily discharge q (b) paired for a location along the coast of Madagascar (c). Discharge Q and storm surge S annual maxima from both (a, b) are used to construct event time series based on the conditional sampling method, (Qn,sn) and (Sn,qn), using a time window of Δ=3 d (d) and joint annual maxima (Qn,Sn) (e). Joint annual maxima co-occurring within Δ=3 d, , are shown in red. Events shown in (e) are shown in probability space in (f).
2.3 Quantifying compound flood potential using the defined sets
We use the different sets of events constructed from the marginal extremes as defined in Sect. 2.2 to measure the compound flood potential at all the paired locations in three ways. First, we calculate the conditional dependence strength between river discharge and storm surge. Second, we calculate the total number of co-occurring annual maxima from the simulation period globally and analyse the probability of obtaining such a result if discharge and surge were independent. Finally, we calculate the compound flood hazard that corresponds to the probability of observing a co-occurring discharge and storm surge annual maxima above a certain magnitude in a given year. These three approaches are described in the three subsections below.
2.3.1 Conditional dependence strength
We characterise the interactions between river discharge and storm surge by calculating the rank correlation coefficient for the two sets of pairs (Qn, sn) and (Sn, qn) constructed from the conditional sampling method at all paired locations. We use Spearman's rank correlation coefficient rs to assess the monotonic dependence strength. This is an advantage over the Pearson's linear correlation coefficient, which quantifies the presence of linear relationships. We present results for values with a statistical significance up to 5 % level (α=0.05) and a time period of Δ=3 d but perform a sensitivity analysis of Δ for up to 7 d and α=0.10 (Table S1 in the Supplement). For the example in Fig. 1d, the dependence patterns observed correspond to rs=0.38 (p value: 0.02) for the (Qn, sn) pairs and rs=0.51 (p value: 0.001) for the (Sn, qn) pairs. This positive and significant dependence behaviour for both sets of pairs suggests a high compound flood potential. This is further analysed in Sect. 3.1.
2.3.2 Number of co-occurring annual maxima
We analyse the number of co-occurrences of annual maxima of river discharge and storm surge along the global coastline. To do so, we count the total number x of co-occurring annual maxima obtained for each paired location over the whole simulation period. Let X represent the total number of co-occurrences within N years (here N = 35 and , we use a binomial distribution to calculate the probability of obtaining X=x co-occurrences under the assumption of statistical independence:
where p is the probability of a co-occurrence in a given period under the assumption of statistical independence. We empirically derive p by assuming that the co-occurrence can happen randomly within a period of a year (365 d) or 3 months (90 d), based on 1 000 000 repetitions and for different values of the time window Δ. For example, for Δ=3 d, we find p=0.0187 for the former and p=0.0760 for the latter.
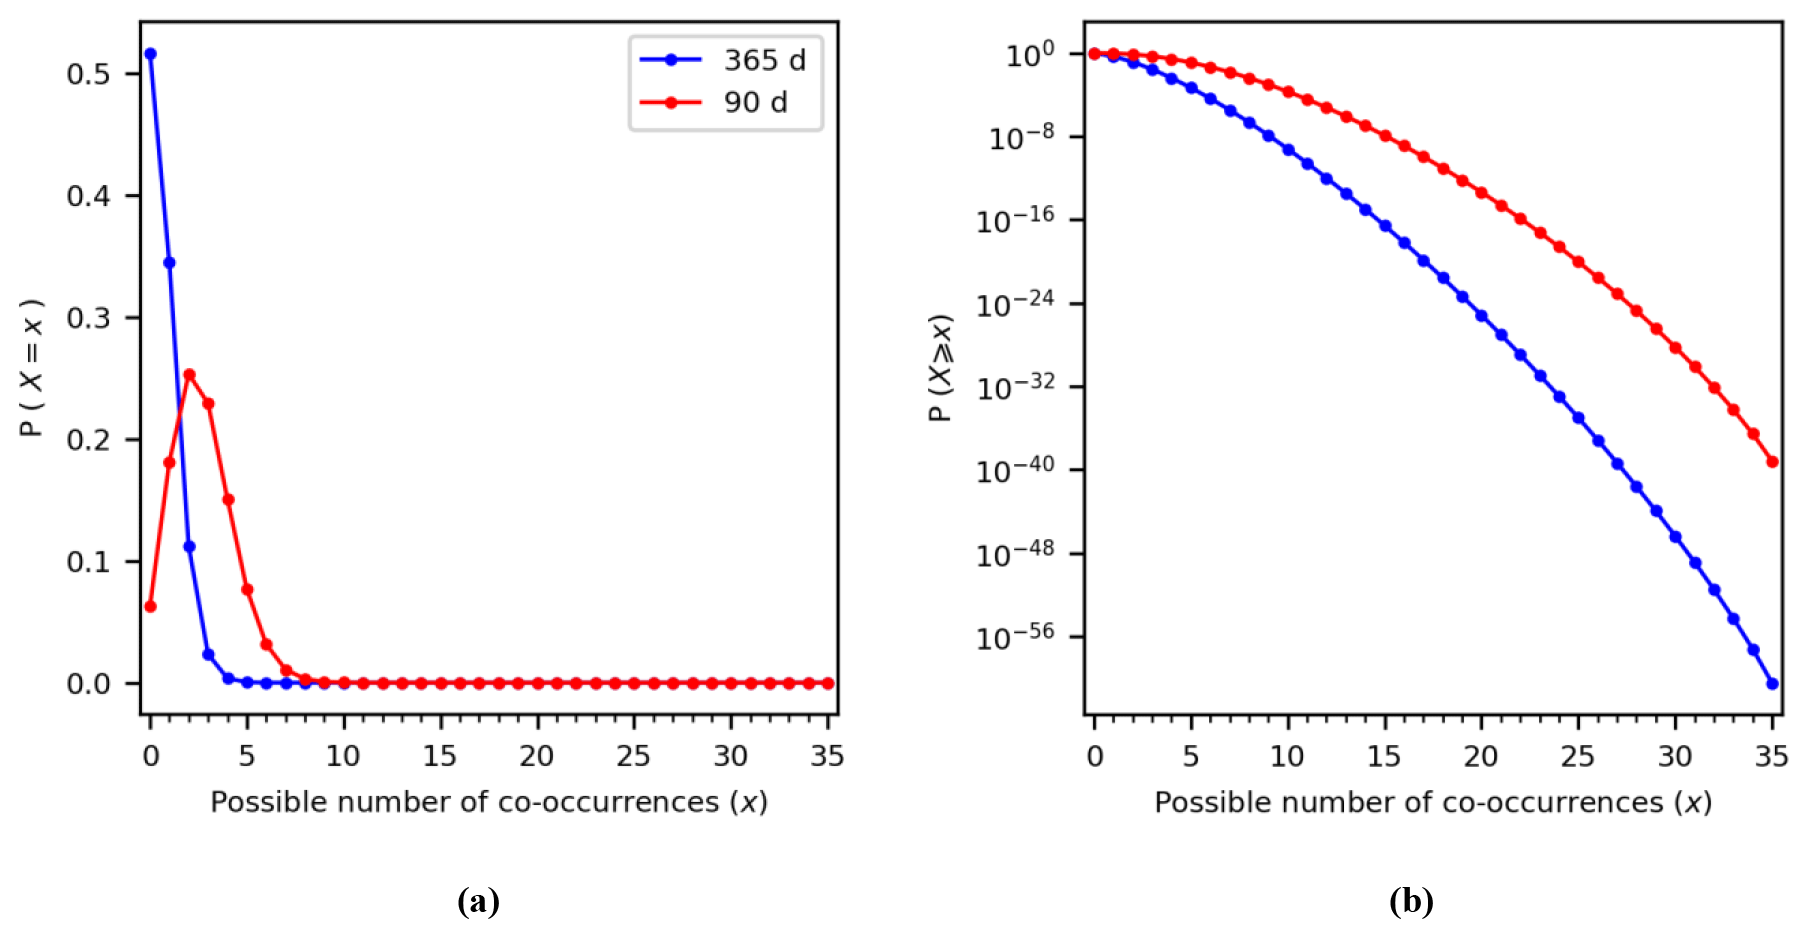
Figure 2Probability mass function for the probability of observing X co-occurrences of annual maxima in N=35 years and for Δ=3 d (a). The same as (a) but shown as the exceedance probability P(X≥x) (b). Note that the y axis for (b) is logarithmic.
As shown in Fig. 2a, one can expect a higher chance of observing two or more co-occurrences within the 35 years if both annual maxima are consistently occurring within the same 90 d season (red curve) compared to if they occur randomly throughout the whole year (blue curve). This finding can be summarised as the exceedance probability of obtaining X or more co-occurrences P(X≥x) and is calculated as the area under the curve right of X=x; see Fig. 2b. As the number of co-occurrences increases, the exceedance probability of observing such a situation in the data due to randomness decreases for all cases and approaches 0, but this value is modulated by the period in which both annual maxima can occur. For our example location, we observe X=14 co-occurrences. Assuming that both annual maxima occur randomly within the year, we read an exceedance probability of from Fig. 2b, whereas if they can occur randomly within the same season of 90 d this probability increases to but in both cases remains a very low probability. The right tail of the distributions in Fig. 2b nevertheless show that one could expect to observe some locations with a large number of co-occurrences even under the assumption of statistical independence, but these situations are expected up to a certain frequency. In other words, if the total number of co-occurrences along all stations would be statistically independent, we would expect to observe this situation at none of the stations ( stations). Therefore, we compare the distributions of co-occurrences along the global coastline obtained with the ones shown in Fig. 2.
2.3.3 Quantification of the compound flood hazard potential
Finally, we examine the probability PF of observing a co-occurring riverine and coastal event in any given year with a discharge magnitude and a storm surge magnitude higher than a threshold value z1, z2, respectively. We refer to probability PF as the compound flood hazard and calculate it as follows:
where Pc is the probability of a co-occurrence in a given year. We estimate Pc from the number of co-occurring annual maxima obtained within the time series. Here, we assume that Pc is not a function of the threshold considered. This assumption seems reasonable based on visual observations at randomly selected locations (see Fig. S9) since the pseudo-observations of co-occurring annual maxima (red circles in Fig. S9) are not concentrated in a specific area of the probability space. Therefore, at a given paired location, we approximate Pc with the following equation:
If no co-occurrences were measured (X=0), we cannot rule out that co-occurrences will never happen and we select Pc=p, i.e. the probability of observing a co-occurrence under the assumption of statistical independence in any given year. As explained in Sect. 2.3.2, this requires some knowledge about the coastal and riverine flood season. Here, we simplify the analysis by selecting a flood season of 365 d. The joint survival probability, , can be quantified as follows using copula modelling (Serinaldi, 2015):
where C is the copula function joining the uniform ranks u and v of variables Q and S, respectively. We might underestimate the joint probability C(u,v) if the strength of the dependence between the (Q, S) pairs significantly deviates from the (Q*, S*) pairs. We use bootstrapping to calculate whether the correlation between co-occurring annual maxima is statistically different to the correlation between non co-occurring annual maxima (two-tailed test, significance level α=0.05). Note that the latter is possible only if we observe at least two pairs of (Q*, S*) pairs. Finally, if no statistical dependence is measured, we assume independence between the magnitude of the joint exceedances and Eq. (6) reduces to the following product:
Given the limited temporal coverage of the data, we present the result for a quantile threshold equivalent to a 5-year discharge magnitude and a 5-year storm surge magnitude (i.e. ). While this represents a relatively low threshold value, we note that such conditions can be sufficient to cause flooding in areas with no or low flood protection standards (see Scussolini et al., 2016 for a global overview). Overbank flooding from unprotected rivers can already happen for discharge return periods higher than 1.5 years (Dunne and Leopold, 1978) and result in damaging floods when impacting human livelihoods (Ward et al., 2013). We also select the Gaussian copula to model the dependence structure but assess the sensitivity of this choice on the compound flood hazard, using Madagascar as a case study.
In this section, we present the results for each compound flood potential measure introduced in Sect. 2.3 along the global coastline. We compare the results with respect to existing literature on compound flooding. Relevant meteorological processes likely to lead to the observed regional patterns of high compound flood potential are also discussed.
3.1 Conditional dependence strength
Figure 3 presents the Spearman's correlation coefficient rs for all paired locations along the global coastline and a time window of Δ=3 d around the flood annual maxima. For storm surge conditional on extreme discharge (Qn, sn) pairs, we find statistically significant (α=0.05) and positive dependence for 14 % of locations (Fig. 3a). For discharge conditional on extreme storm surge, (Sn, qn) pairs, we find statistically significant and positive dependence for 20 % of locations (Fig. 3b). On average, the dependence is also slightly stronger for the latter case compared to the former: overall mean rs=0.09 for (Qn, sn) pairs; overall mean rs=0.11 for (Sn, qn) pairs; Welch's t test p value: 0.0007. Finally, 67 % of the locations do not exhibit statistically significant correlation for either case. A similar analysis was performed by varying the time window Δ from 0 to 7 d (Table S1) and was found to lead to similar results, except for Δ=0 d where we observe a smaller value of 11 % for (Qn, sn) pairs. For a higher significance level (α=0.10), a higher percentage of statistically significant correlations is found: 17 %–22 % for (Qn, sn) pairs; 24 %–25 % for (Sn, qn) pairs. However, the results are consistent with those obtained under α=0.05.
We observe clear regional patterns of positive dependence globally. These dependence behaviour patterns are similar to those found by Ward et al. (2018) using observations from river and tide gauges. We obtain more locations for southwestern Japan that exhibit statistically significant dependence when conditional on extreme storm surge (Fig. 3b) than when conditional on extreme discharge (Fig. 3a). We also find positive and statistically significant dependence for locations both on the West and East coasts of the United States (US). However, our results also highlight regions that could not be examined by Ward et al. (2018) due to a lack of gauge observations. Along the South American coastline, we find a cluster of positive dependence along the south coast of Chile. Along the African coastline, the coast of Madagascar is consistently highlighted in both cases, as well as the coast of Morocco. Finally, the coasts of India and large parts of East Asia also show large regions with positive dependence.
Other regions, such as the East Coast of the US, Italy, the United Kingdom (UK) or China, show a more complex dependence behaviour. Riverine flooding in these regions is related to multiple mechanisms, not all of which are related to the mechanisms causing high storm surge. On the East Coast of the US, even though tropical cyclone activity is known to contribute to high storm surge levels and intense precipitation (Villarini and Smith, 2010; Wahl et al., 2015), other river flood generating mechanisms also play a role. For example, high river discharge could also be due to snowmelt or convective storms happening upstream in the catchment (Berghuijs et al., 2016). Similarly, for the eastern coast of the UK, Hendry et al. (2019) found that storms that generate high river discharge are different to the ones that generate high storm surge. This explains why the presence of a statistical significance for discharge conditional on extreme storm surge (Fig. 3a) may be absent when conditionally sampling on extreme discharge (Fig. 3b).
Locations in several regional clusters exhibit a positive statistical dependence in both cases (6 % of all the locations studied) and therefore present the highest potential for compound flooding. Among others, we note the coasts of Madagascar, Portugal, northern Morocco, northern Australia, Vietnam, and Taiwan, which all consistently show a positive and significant dependence between discharge and storm surge.
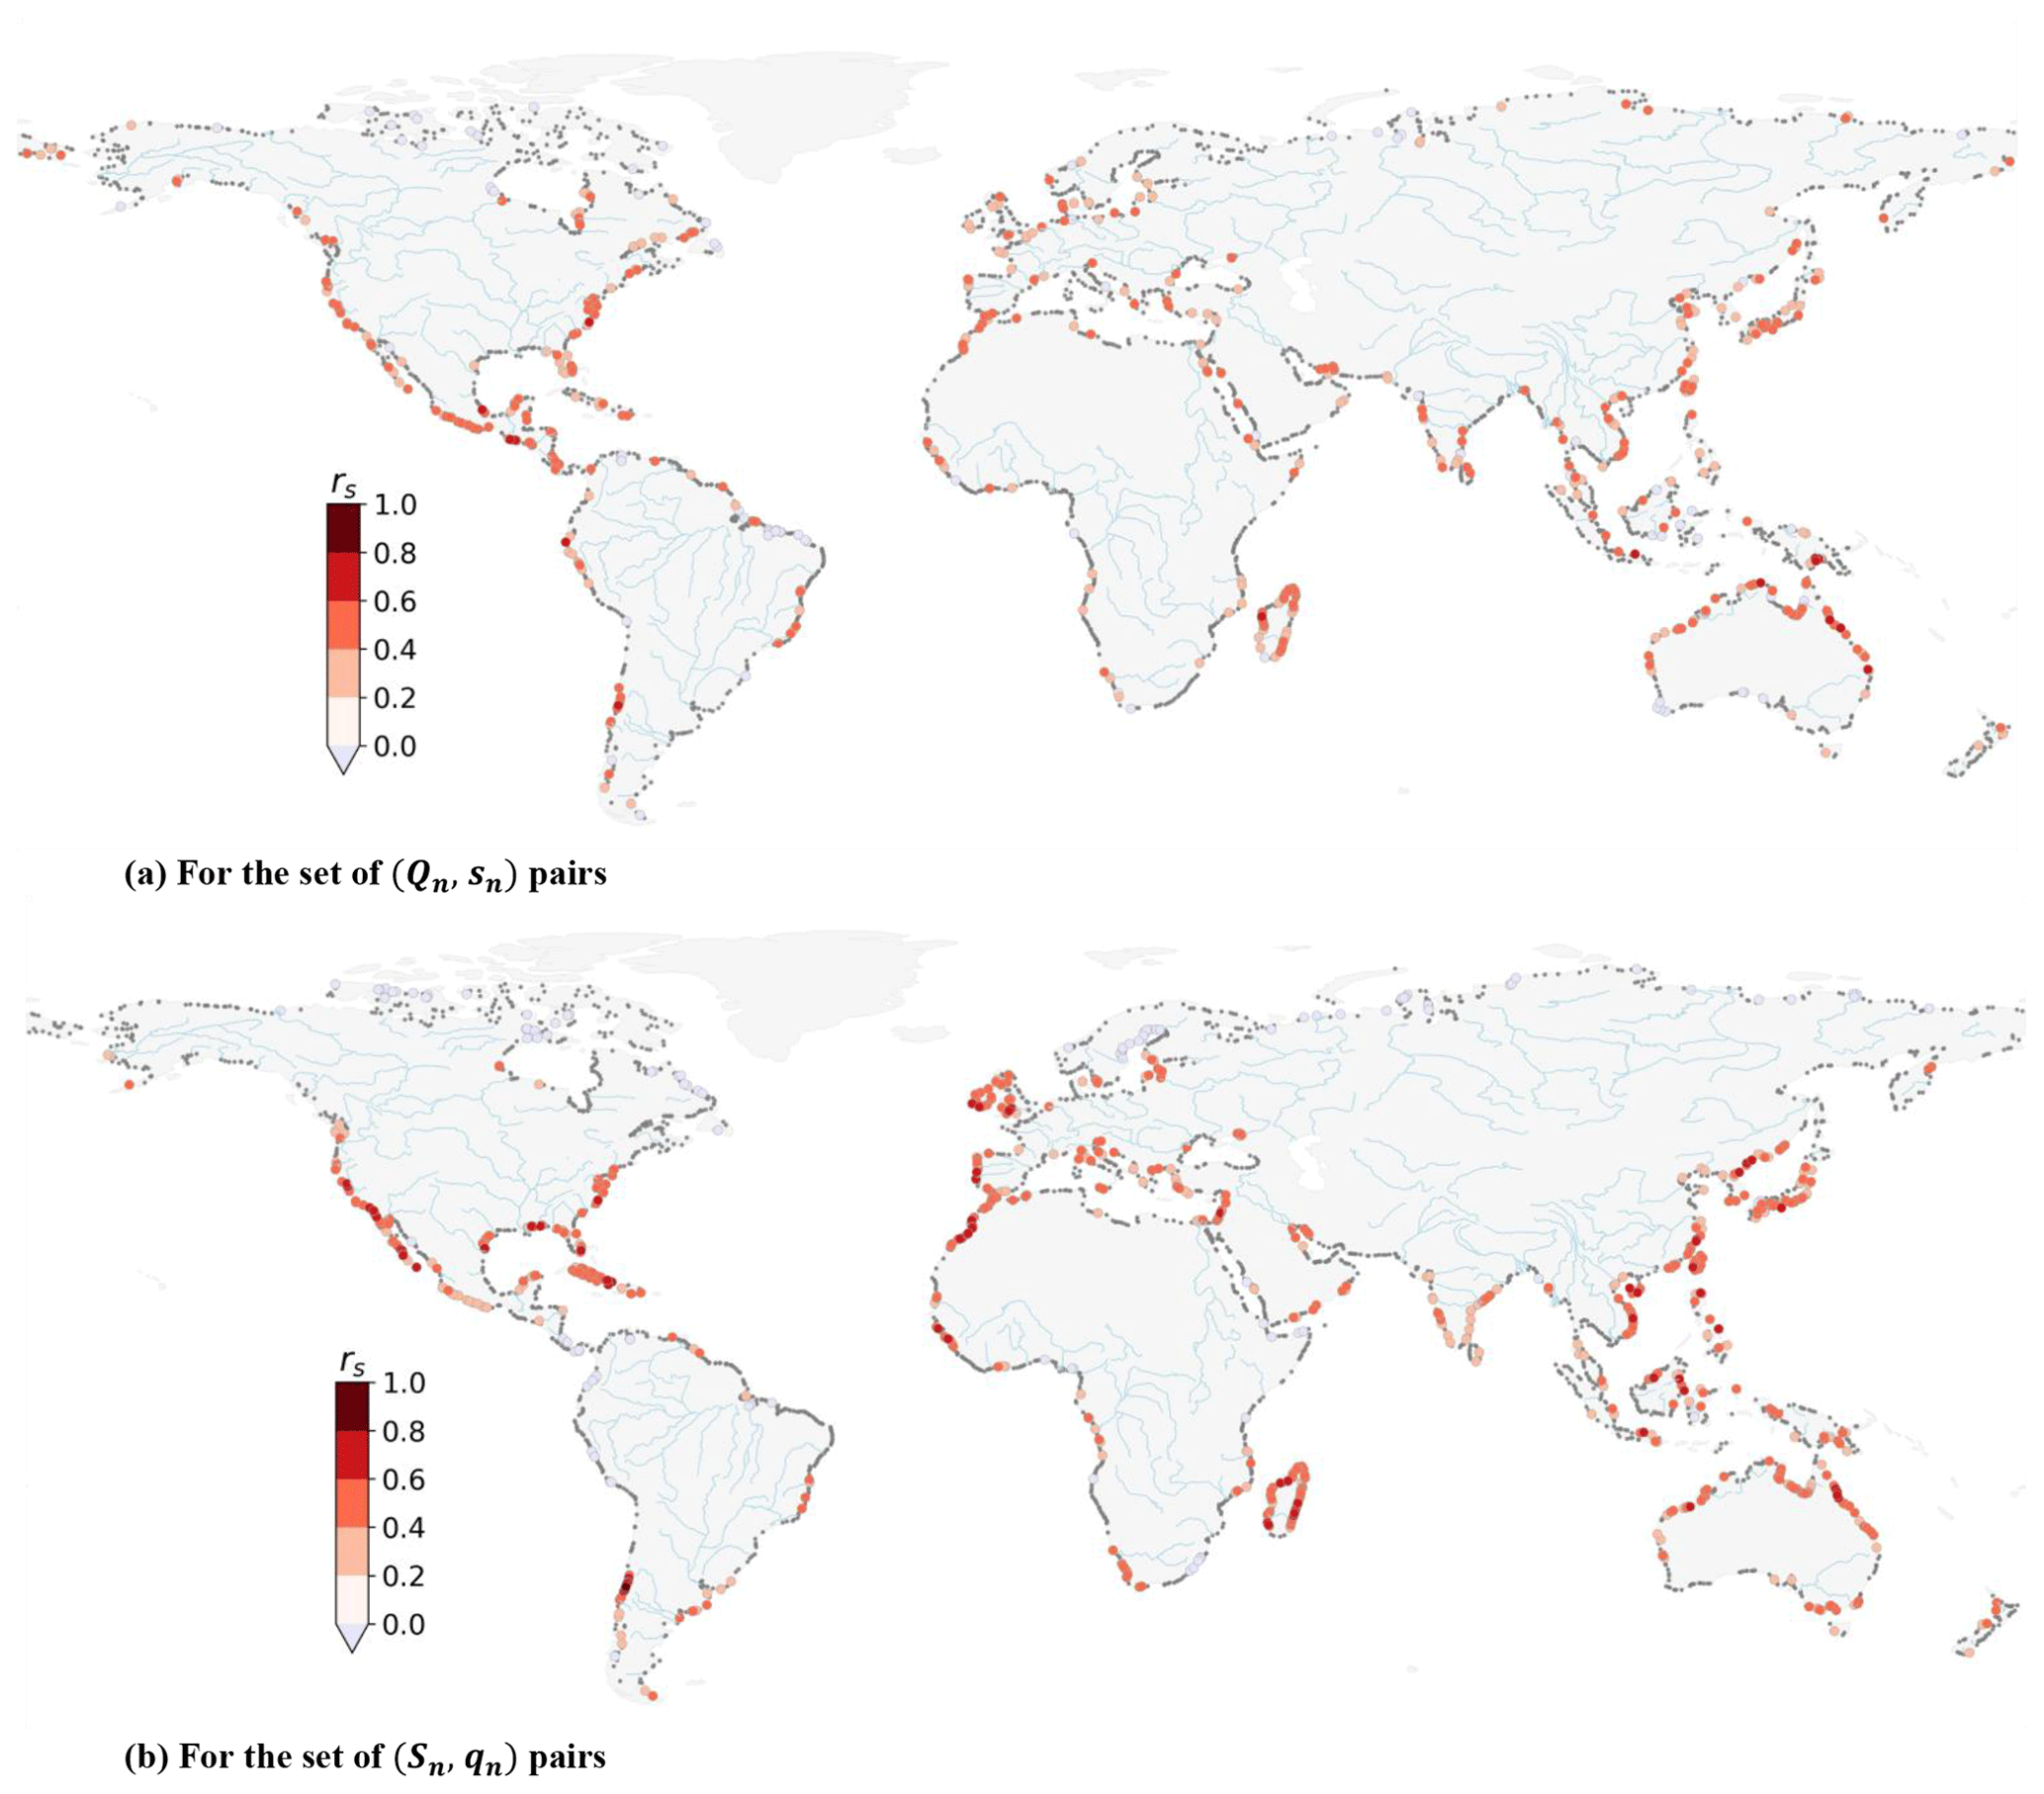
Figure 3Spearman's rs correlation coefficient between storm surge conditional on annual maxima discharge (Qn, sn) (a) and discharge conditional on annual maxima storm surge (Sn, qn) (b). Black dots denote locations with no significant dependence (α=0.05). Major rivers are shown in light blue.
3.2 Number of co-occurring annual maxima
We examine the total number of co-occurrences between discharge and storm surge annual maxima obtained from the simulation period and assess their probability of co-occurrence under the assumption of statistical independence. Figure 4 presents the total number of co-occurring annual maxima, (, ) events, considering a time window of Δ=3 d. We observe a minimum of 0 co-occurrence and a maximum of 19 co-occurrences within the 35 years simulation period. At 64 % of the locations, we observe at least 1 co-occurrence. Clearly, the absence of a significant dependence (measured at 67 % of the locations; see Sect. 3.1) does not preclude the co-occurrence of discharge and storm surge annual maxima. Finally, at 5 % of the locations, yearly maxima co-occur more than 30 % of the time (i.e. representing 10 co-occurrences or more over 1980–2014).
We test the significance of these results globally by comparing the empirical distribution obtained from the data with the binomial distributions shown in Fig. 2. Figure 5 presents the uncertainty bounds around the empirical distribution using non-parametric bootstrapping with 5000 bootstrap samples and a significance level α=0.05. The right tail obtained in our results significantly deviates from any of the binomial distributions considered here. Therefore, we obtain more co-occurrences than we would expect under the assumption of independence (i.e. compared with binomial draws). This suggests that in regions with a high number of co-occurrences, discharge and storm surge annual maxima are very unlikely to be independent and cannot be explained by seasonality only. Instead, we argue that synoptic weather systems could explain the high number of co-occurring annual maxima. We note that even though the influence of the time window clearly influences the number of co-occurrences measured (see Fig. S14), it will not affect the interpretation of Fig. 5. This is because the time window is already accounted for when deriving the binomial probability distributions. Therefore, selecting a larger time window would only result in a shift of all distributions to the right, but similar conclusions would prevail.
Locations where results deviate the most from independence coincide with areas of strong tropical or extratropical cyclone activity. Martius et al. (2016) found that coastal regions affected by frequent tropical cyclones experience the highest number of co-occurring wind and precipitation extremes. Their study highlighted very similar regional patterns compared to the ones presented in Fig. 6 but with less geographical spread. This can be attributed to the fact that they focused on the analysis of climate extremes, whereas we use river discharge and storm surge where these meteorological phenomena are propagated through model chains. In other regions, they identify the interaction of weather systems with regional orographic features that cause compound wind and precipitation extremes. Atmospheric rivers landing on the West Coast of the US have caused recurrent major flood events (Gimeno et al., 2014). Composite analyses of these systems show that they can be accompanied by extreme skew surge (Ridder et al., 2018; Ward et al., 2018). The Iberian Peninsula and the Atlas Mountains contain major orographic features that can block prevailing wind flows and trigger orographic rainfall during low pressure systems, thereby causing high river discharge. These synoptic weather systems were documented to have caused serious flood events in Portugal during windstorms Klaus in 2009, Xynthia in 2010, and Gong in 2013 (Liberato, 2014).
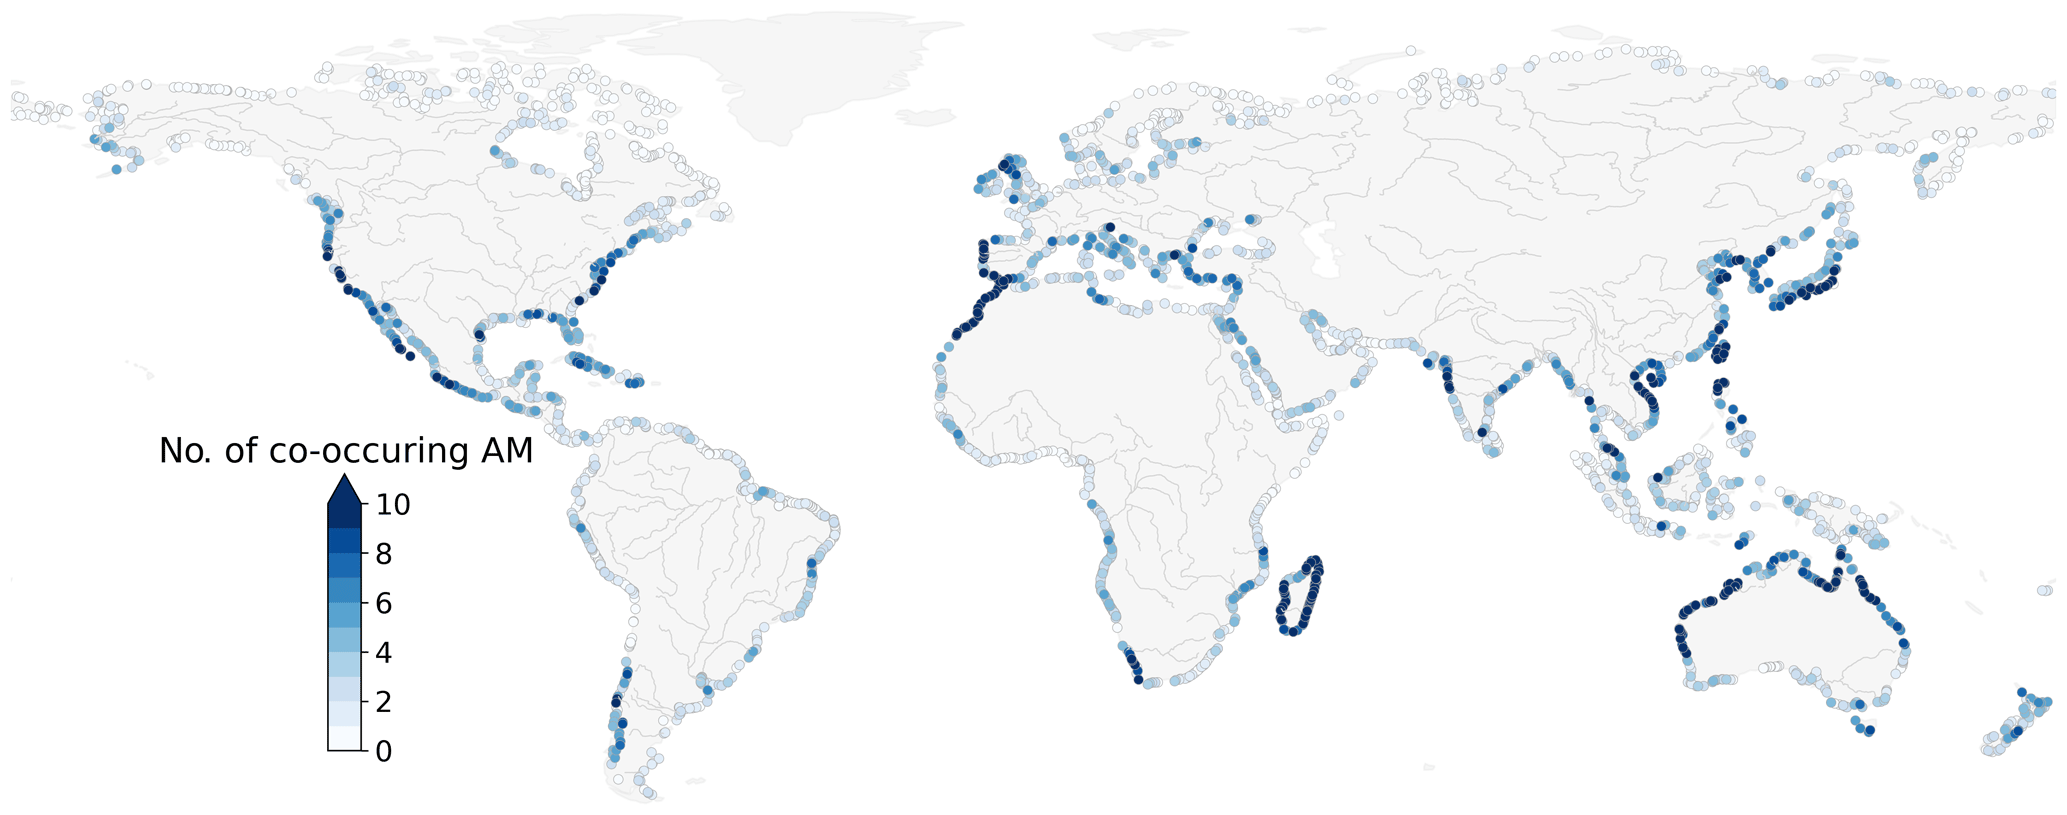
Figure 4Number of co-occurring annual maxima of discharge and storm surge obtained between 1980 and 2014 using a time window of 3 d. Major rivers are shown in grey.
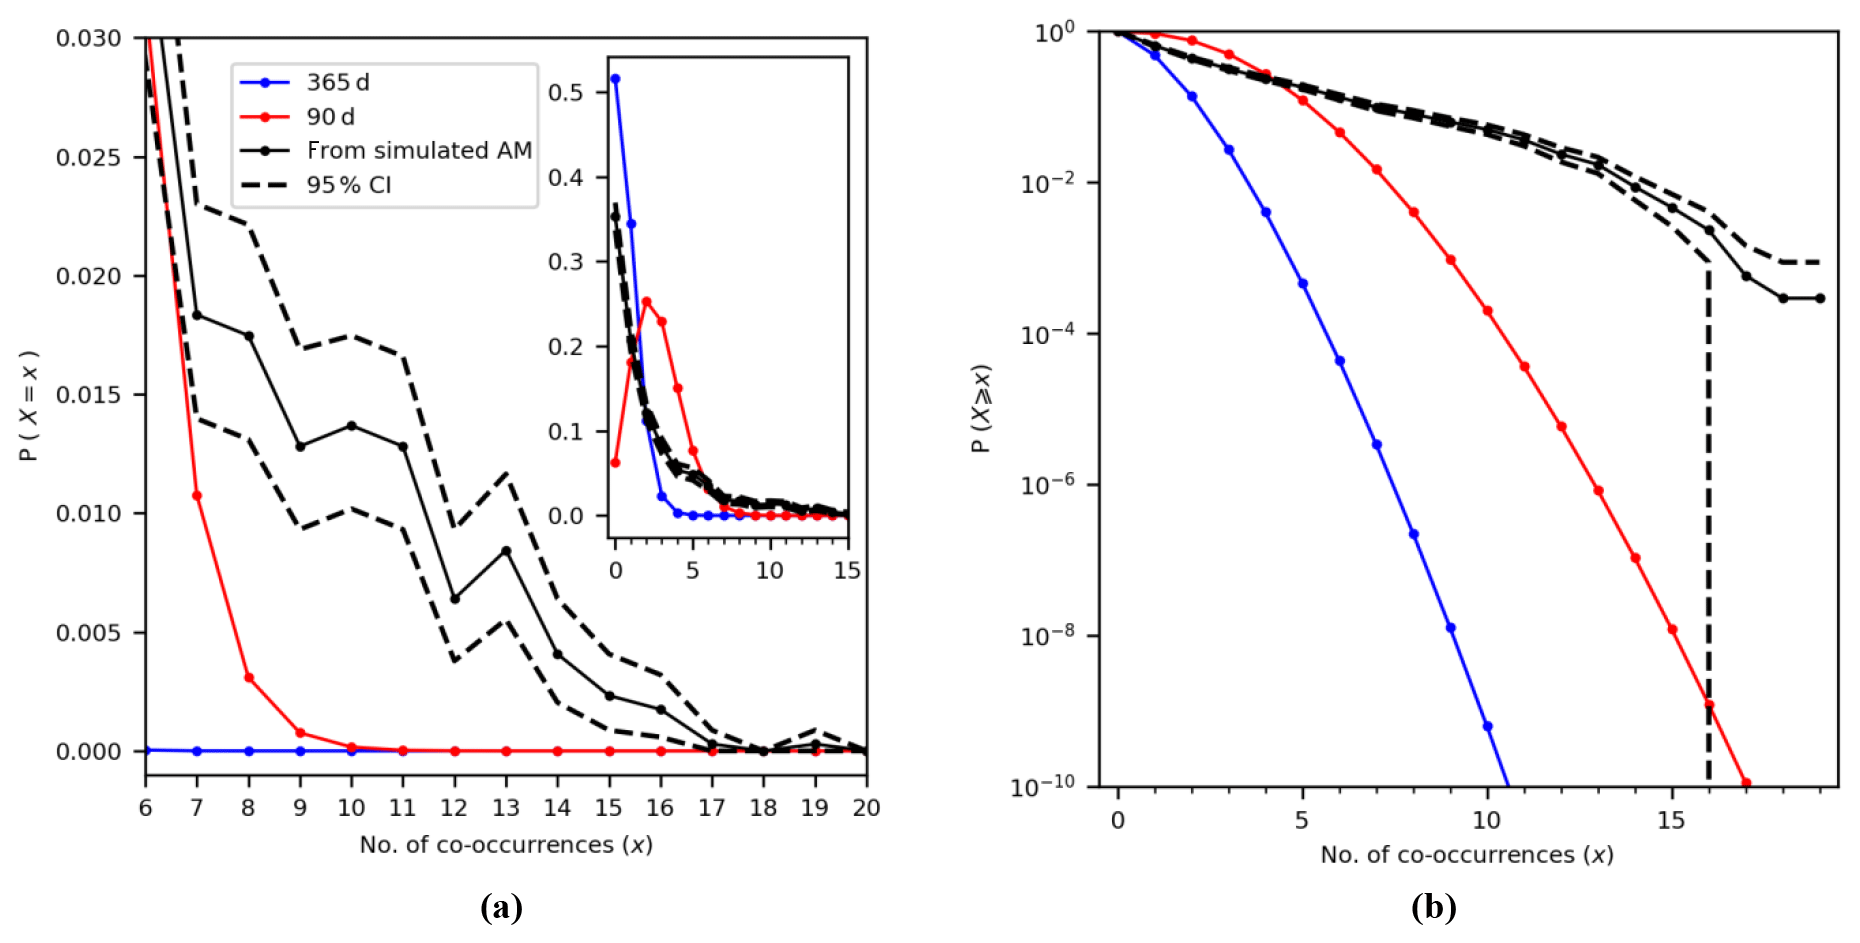
Figure 5Comparison of the empirical distribution of the number of co-occurrences from the simulations (in black) with the binomial distributions, assuming that annual maxima can happen randomly within the year (365 d, blue curve) or within the same season (90 d, red curve). Probability mass function (a) and exceedance probability function (b). The 95 % confidence intervals (CI) are calculated using bootstrapping.
3.3 Quantification of the compound flood hazard potential
We use Eq. (4) to calculate the probability PF of a discharge and storm surge annual maxima co-occurring in any given year with a magnitude higher than a threshold value, and referred to as the compound flood hazard potential. Figure 6 shows the result using a threshold equivalent to a 5-year return discharge level and a 5-year return storm surge level. The probability PF is presented as a joint return period in years (1∕PF). A low (high) joint return period indicates a high (low) probability of a river discharge and storm surge annual maxima co-occurring, each higher than their individual 5-year return level. Assuming independence between the two variables, these conditions would be exceeded about once every 1337 years on average, i.e. . In the case of complete dependence, this would happen once every 5 years on average, i.e. 1/0.2×1. In 66 % of the paired locations, the joint return period obtained is lower than that of independence. Therefore, this indicates some compound flood hazard potential along most of the global coastline. However, the magnitude of this potential varies per region.
Focusing on Europe (inset in Fig. 6), we find the highest compound flood hazard potential mainly on the western coast, more specifically along the coasts of Portugal and Ireland, the western coast of the United Kingdom, and the Straits of Gibraltar. This regional pattern is also observed in the studies of Bevacqua et al. (2019) and Paprotny et al. (2018a). However, contrary to Bevacqua et al. (2019), we do not find a high compound flood hazard potential for the coast of France. We attribute this difference to the fact that we focus on river discharge, whereas their study examined rainfall. In this area, a cross-correlation analysis on the results from this study (not shown here) shows a lag between ±12 to 30 d, which exceeds the maximum lag of ±3 d considered for this analysis.
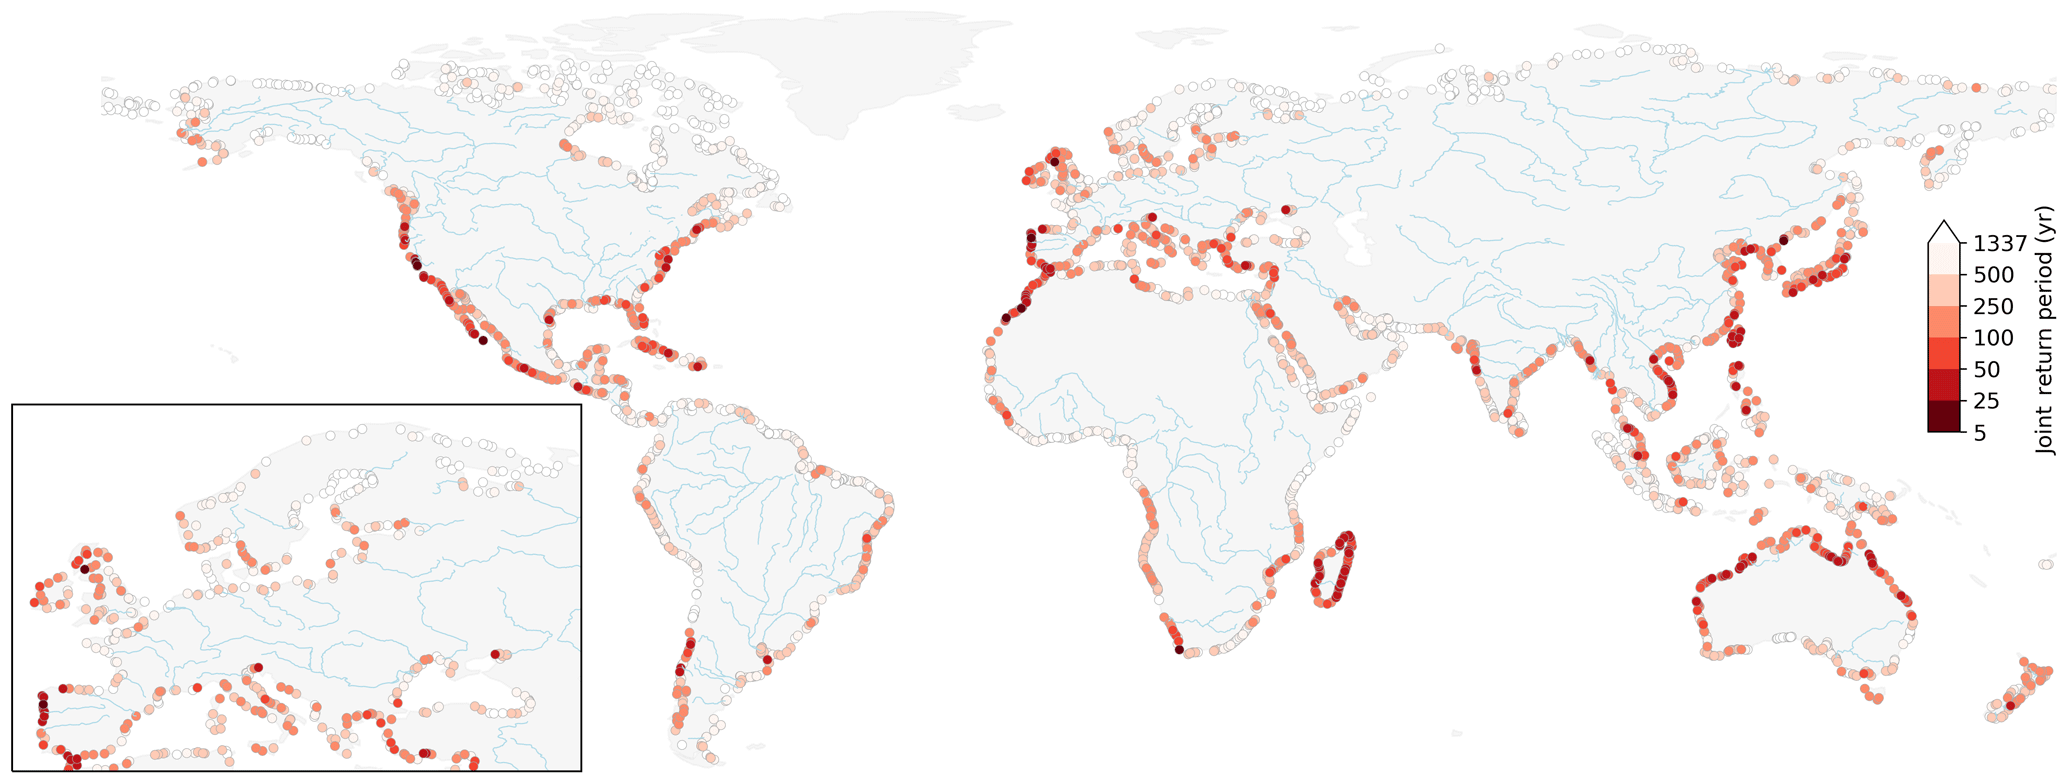
Figure 6Probability of a co-occurring annual maxima in a given year PF presented as the return period in years exceeding the marginal 5-year return periods of discharge and of storm surge. Major rivers are shown in light blue.
Regions with a high compound flood hazard potential identified in Fig. 6 coincide with regions with a high number of co-occurring annual maxima (Fig. 4) and a strong positive statistical dependence (Fig. 3). This is to be expected since co-occurring annual maxima (, ) events are present in both sets of events (Qn, sn) and (Sn, qn). Similarly, regions with a large joint return period (500 years or more) correspond with areas with a low probability of annual maxima co-occurrence and/or no statistical dependence. Finally, we observe regions with no clear spatial patterns, such as along the Mediterranean Sea, the Gulf of Mexico, and India. This could be explained by one or a combination of the following reasons. First, the fact that there are multiple river flood generating mechanisms that lower the likelihood of co-occurring discharge and storm surge annual maxima. Second, even in the presence of synoptic weather systems, this does not ensure a strong and positive dependence between storm surge and discharge. Drivers of maximum storm surge heights are particularly complex, and are influenced by external factors such as local bathymetry and the geometry of the coastline (Bloemendaal et al., 2019). Third, in large catchments, there may also be a lag of several days for river flood waves to reach the basin outlet (Allen et al., 2018), such that the riverine and coastal flood annual maxima do not interact (Kew et al., 2013; Klerk et al., 2015; Ward et al., 2018).
We assess the sensitivity of the joint return period shown in Fig. 6 to the selected dependence model by selecting on a location in a region with a high compound flood hazard potential in Madagascar. The selected paired location is shown in Fig. 1. Figure 7 presents the probability PF as a joint return period but for multiple dependence models, and for different threshold values corresponding to from 5-year to 100-year marginal return levels. We use the lowest Akaike information criteria (AIC) value as an indication for the best fitting bivariate copula model for the data, as implemented in the R-package VineCopula. Out of the 40 copula families tested, we find the Joe Clayton (BB7) copula to best model the dependence structure. For a 5-year marginal return level, the difference in joint return period between the Gaussian and the BB7 copula models is minor (27 and 21 years, respectively). This is not the case for higher threshold values. For threshold values corresponding to a 100-year return discharge or storm surge level, we observe an approximate fourfold increase between the two (joint return period of 1588 years with the Gaussian copula versus 428 years with the best fitting copula model). Therefore, for large thresholds this shows that the dependence structure model can greatly influence the probability of concurrent extremes. This is because, unlike the Gaussian copula, the BB7 copula models upper tail dependence (Joe, 2015). In the presence of upper tail dependence, the dependence coefficient in the tail of the distribution is higher than the overall dependence coefficient, thereby increasing the probability of observing a concurrent extreme (Hobaek Haff et al., 2015). Even though detecting upper tail dependence with confidence from limited data length remains challenging (Serinaldi et al., 2015), these results show that it can significantly impact the joint return period. For flood impact assessments, it is therefore recommended to thoroughly assess the dependence structure when considering multiple flood drivers.

Figure 7Effect of the dependence structure on the joint return period of a discharge and storm surge annual maxima co-occurring in any given year with a magnitude higher than a selected threshold. The latter corresponds to the marginal return period of discharge and of storm surge levels.
3.4 Limitations
While we identify potential compound flooding hotspot regions from extreme discharge and storm surge variables, substantial uncertainties remain as to how this phenomenon will propagate into inland flooding. Flood events in a coastal catchment typically result from the interactions of other drivers not considered in this study, such as local rainfall, wave effects, tidal amplitude, and surge–tide interactions (Saleh et al., 2017; Vousdoukas et al., 2016). Moreover, local characteristics like the bathymetry, catchment properties, and the presence of water control structures further influence the extent to which these interactions contribute to water level extremes at the considered river mouths (Gori et al., 2019; Veldkamp et al., 2018). Specific compound flood event modelling studies (Bilskie and Hagen, 2018; Kumbier et al., 2018) and comprehensive probabilistic simulations at local scales show that multivariate flood drivers result in highly non-linear responses of flood impact variables such as flood depth and flood extent (Couasnon et al., 2018; Serafin et al., 2019). Future assessments of compound flood hazard at the global scale should therefore focus on incorporating those multivariate processes and is left for future work.
In this study, we base our statistical analysis on annual maxima, which results in 35 data points per paired location. Alternative strategies, such as a peaks over threshold approach or sampling the r-largest events per year, could be used to increase the sample size (Coles et al., 2001; Tawn, 1988). However, those approaches also suffer from disadvantages (Hawkes, 2008). For example, they may result in sampling events that are not relevant for the flood hazard analysis and therefore add some noise in the sets of events used to measure the compound flood potential. Ward et al. (2018) found lower statistical dependence when using a POT method with a 95th percentile. POT methods may also result in a different number of events for the discharge than the storm surge variable if they are used to obtain independent and identically distributed extremes. This becomes particularly problematic for the analysis of their joint probability, which requires pairs. Instead, another more promising option to increase the sample size could be to work with climate ensemble models, such as those applied in Kew et al. (2013) and Khanal et al. (2019), provided that their performance is satisfactory and that the multivariate dependence structure is not affected by bias adjustments (Zscheischler et al., 2019).
Moreover, the results presented in this study are dependent on the accuracy of the models. The validation performed in this study indicates an acceptable performance on average, albeit with large spatial differences. The timing of the simulated storm surge compared with observations shows a poor performance of the model for stations along the coasts of South America and Africa. Yet, the accuracy of the models in measuring the compound flood potential along large parts of the coastline in South America, Africa, and Asia could not be assessed due to a lack of long-term gauge observations of discharge and sea levels. This was the main motivation for examining different compound flood measures and selecting moderate joint return period conditions, in order to identify regions potentially most exposed to this phenomenon. Nevertheless, important processes for compound flood events may be underestimated or absent in the global models used for this study. Small-scale convective and short-lived processes affecting both wind and precipitation extremes are not fully represented in the weather forcing but may be of critical importance in areas affected by tropical cyclones (Beck et al., 2017a; Martius et al., 2016; Muis et al., 2016). Interactions with ice and snow cover are also currently not resolved at higher latitude, which affects the timing and magnitude of both storm surge heights (Muis et al., 2016) and river discharge (Yamazaki et al., 2011). Therefore, results in northern regions, where we find the lowest compound flood hazard potential, are particularly uncertain and should be interpreted with care. More generally, this emphasises the need for local-scale studies in order to accurately quantify compound flood hazard locally.
Finally, we investigate compound flooding interactions under current climate conditions from hydrometeorological processes only, and neglect anthropogenic changes on the catchment and the climate. Human interventions, such as water extractions, water retention, or flood protection infrastructure can affect the travel time and magnitude of extreme discharges and modify the discharge time series (Allen et al., 2018; Veldkamp et al., 2018). Combined with changes in environmental conditions, e.g. due to sea-level rise and changes in storminess, these additional non-stationary drivers can strongly modulate the multivariate dependence structure between flood drivers and affect compound flood hazard (Moftakhari et al., 2017; Wahl et al., 2015).
This paper provides a global perspective of the compound flood potential from riverine and coastal flood drivers. By selecting time series of flood drivers for both hazard types, we derived a global overview of areas particularly exposed to the co-occurrence of high discharge and storm surge level, and we quantified the strength of the interactions between the two variables. We analysed important characteristics of compound flooding related to the timing and joint dependence between river discharge and storm surge extremes. Regional clusters consistently exhibit a high potential for compound flooding. Hotspot regions such as Madagascar, Portugal, northern Morocco, northern Australia, Vietnam, and Taiwan all show a positive and significant dependence between flood drivers and a large number of co-occurring annual maxima. Using the binomial distribution for different flood season lengths, we showed that the dependence between these variables cannot be explained by random extreme interactions within a season. Instead, we hypothesise that this dependence results from synoptic weather systems and interactions between these weather systems and topography.
Extreme impact events caused by synoptic weather systems, like Hurricane Harvey or Idai, highlight the importance of considering compound flood events for flood protection in coastal communities. Currently, regulatory flood hazard maps, such as those used in the US, often only model flooding due to one flood driver (Federal Emergency Management Agency, 2015; Moftakhari et al., 2019). Because such a methodology discards the interactions between river and coastal floods, it can strongly flaw the representation of flood hazard in deltas and estuaries. This is also the case for current global state-of-the-art flood models, and our study provides a first indication of regions along the global coastline where discharge and storm surge extremes are likely to co-occur. In areas coinciding with rapid economic development, this can have strong implications for emergency responders, reinsurance, and local decision makers.
How compound flood events will affect flood impacts, adaptation strategies, and management operations at local scales is strongly dependent on local conditions and is therefore left for future research. We presented our first insights into how the dependence structure impacts on the probability of hazardous riverine and coastal conditions globally. Such a method could be used to generate stochastic events to explore the impact of unforeseen events within a certain catchment through hydrodynamic and impact model experiments. Similarly, future studies should investigate the importance of synoptic weather conditions with respect to the contributions from local drivers such as estuarine topography, land cover, human interventions, and water management and control in determining the impacts from current and future compound flood events.
The paired daily discharge and storm surge time series at the river mouth locations used for this study are available at: https://doi.org/10.5281/zenodo.3552820 (Eilander, 2019). Storm surge daily maxima at all the output locations from the GTSR dataset are available for scientific purposes at https://doi.org/10.4121/uuid:17769b8a-33cd-455c-8bbd-b65ab504f07e (Muis et al., 2019). High-resolution figures of the results can be downloaded from the online version (full-text html), and the corresponding datasets are available on request.
The supplement related to this article is available online at: https://doi.org/10.5194/nhess-20-489-2020-supplement.
AC wrote the manuscript with assistance and input from all co-authors. DE and SM performed the numerical simulations for the discharge and storm surge data, respectively, and DE compiled it in the dataset used in this study. AC designed the methodology with the help from DE, HCW, and PJW. AC performed the analysis and analysed the results with all co-authors.
The authors declare that they have no conflict of interest.
This article is part of the special issue “Global- and continental-scale risk assessment for natural hazards: methods and practice”. It is a result of the European Geosciences Union General Assembly 2018, Vienna, Austria, 8–13 April 2018.
This research has been supported by the Netherlands Organisation for Scientific Research (NWO) (VIDI; grant no. 016.161.324) and the UK's National Environmental Research Council (grant no. NE/S010262/1).
This paper was edited by James Daniell and reviewed by two anonymous referees.
Alfieri, L., Salamon, P., Bianchi, A., Neal, J., Bates, P., and Feyen, L.: Advances in pan-European flood hazard mapping, Hydrol. Process., 28, 4067–4077, https://doi.org/10.1002/hyp.9947, 2014.
Allen, G. H., David, C. H., Andreadis, K. M., Hossain, F., and Famiglietti, J. S.: Global Estimates of River Flow Wave Travel Times and Implications for Low-Latency Satellite Data, Geophys. Res. Lett., 45, 7551–7560, https://doi.org/10.1029/2018GL077914, 2018.
Beck, H. E., Vergopolan, N., Pan, M., Levizzani, V., van Dijk, A. I. J. M., Weedon, G. P., Brocca, L., Pappenberger, F., Huffman, G. J., and Wood, E. F.: Global-scale evaluation of 22 precipitation datasets using gauge observations and hydrological modeling, Hydrol. Earth Syst. Sci., 21, 6201–6217, https://doi.org/10.5194/hess-21-6201-2017, 2017a.
Beck, H. E., van Dijk, A. I. J. M., de Roo, A., Dutra, E., Fink, G., Orth, R., and Schellekens, J.: Global evaluation of runoff from 10 state-of-the-art hydrological models, Hydrol. Earth Syst. Sci., 21, 2881–2903, https://doi.org/10.5194/hess-21-2881-2017, 2017b.
Beck, H. E., van Dijk, A. I. J. M., Levizzani, V., Schellekens, J., Miralles, D. G., Martens, B., and de Roo, A.: MSWEP: 3-hourly 0.25∘ global gridded precipitation (1979–2015) by merging gauge, satellite, and reanalysis data, Hydrol. Earth Syst. Sci., 21, 589–615, https://doi.org/10.5194/hess-21-589-2017, 2017c.
Berghuijs, W. R., Woods, R. A., Hutton, C. J., and Sivapalan, M.: Dominant flood generating mechanisms across the United States, Geophys. Res. Lett., 43, 4382–4390, https://doi.org/10.1002/2016GL068070, 2016.
Best, M. J., Pryor, M., Clark, D. B., Rooney, G. G., Essery, R. L. H., Ménard, C. B., Edwards, J. M., Hendry, M. A., Porson, A., Gedney, N., Mercado, L. M., Sitch, S., Blyth, E., Boucher, O., Cox, P. M., Grimmond, C. S. B., and Harding, R. J.: The Joint UK Land Environment Simulator (JULES), model description – Part 1: Energy and water fluxes, Geosci. Model Dev., 4, 677–699, https://doi.org/10.5194/gmd-4-677-2011, 2011.
Bevacqua, E., Maraun, D., Hobæk Haff, I., Widmann, M., and Vrac, M.: Multivariate statistical modelling of compound events via pair-copula constructions: analysis of floods in Ravenna (Italy), Hydrol. Earth Syst. Sci., 21, 2701–2723, https://doi.org/10.5194/hess-21-2701-2017, 2017.
Bevacqua, E., Maraun, D., Vousdoukas, M. I., Voukouvalas, E., Vrac, M., Mentaschi, L., and Widmann, M.: Higher probability of compound flooding from precipitation and storm surge in Europe under anthropogenic climate change, Science Advances, 5, eaaw5531, https://doi.org/10.1126/sciadv.aaw5531, 2019.
Bilskie, M. V. and Hagen, S. C.: Defining Flood Zone Transitions in Low-Gradient Coastal Regions, Geophys. Res. Lett., 45, 2761–2770, https://doi.org/10.1002/2018GL077524, 2018.
Bloemendaal, N., Muis, S., Haarsma, R. J., Verlaan, M., Irazoqui Apecechea, M., de Moel, H., Ward, P. J., and Aerts, J. C. J. H.: Global modeling of tropical cyclone storm surges using high resolution forecasts, Clim. Dynam., 52, 5031, https://doi.org/10.1007/s00382-018-4430-x, 2019.
Brown, S., Nicholls, R. J., Lowe, J. A., and Hinkel, J.: Spatial variations of sea-level rise and impacts: An application of DIVA, Climatic Change, 134, 403–416, https://doi.org/10.1007/s10584-013-0925-y, 2016.
Clark, D. B., Mercado, L. M., Sitch, S., Jones, C. D., Gedney, N., Best, M. J., Pryor, M., Rooney, G. G., Essery, R. L. H., Blyth, E., Boucher, O., Harding, R. J., Huntingford, C., and Cox, P. M.: The Joint UK Land Environment Simulator (JULES), model description – Part 2: Carbon fluxes and vegetation dynamics, Geosci. Model Dev., 4, 701–722, https://doi.org/10.5194/gmd-4-701-2011, 2011.
Coles, S., Bawa, J., Trenner, L., and Dorazio, P.: An introduction to statistical modeling of extreme values, Springer, London, 2001.
Couasnon, A., Sebastian, A., and Morales-Nápoles, O.: A Copula-Based Bayesian Network for Modeling Compound Flood Hazard from Riverine and Coastal Interactions at the Catchment Scale: An Application to the Houston Ship Channel, Texas, Water, 10, 1190, https://doi.org/10.3390/w10091190, 2018.
Dee, D. P., Uppala, S. M., Simmons, A. J., Berrisford, P., Poli, P., Kobayashi, S., Andrae, U., Balmaseda, M. A., Balsamo, G., Bauer, P., Bechtold, P., Beljaars, A. C. M., van de Berg, L., Bidlot, J., Bormann, N., Delsol, C., Dragani, R., Fuentes, M., Geer, A. J., Haimberger, L., Healy, S. B., Hersbach, H., Hólm, E. V., Isaksen, L., Kållberg, P., Köhler, M., Matricardi, M., McNally, A. P., Monge-Sanz, B. M., Morcrette, J.-J., Park, B.-K., Peubey, C., de Rosnay, P., Tavolato, C., Thépaut, J.-N., and Vitart, F.: The ERA-Interim reanalysis: configuration and performance of the data assimilation system, Q. J. Roy. Meteor. Soc., 137, 553–597, https://doi.org/10.1002/qj.828, 2011.
Diermanse, F. L. M. and Geerse, C. P. M.: Correlation models in flood risk analysis, Reliab. Eng. Syst. Safe, 105, 64–72, https://doi.org/10.1016/j.ress.2011.12.004, 2012.
Dottori, F., Salamon, P., Bianchi, A., Alfieri, L., Hirpa, F. A., and Feyen, L.: Development and evaluation of a framework for global flood hazard mapping, Adv. Water Resour., 94, 87–102, https://doi.org/10.1016/j.advwatres.2016.05.002, 2016.
Dunne, T. and Leopold, L. B.: Water in environmental planning, W. H. Freeman & Co., San Francisco, 818 pp., 1978.
Dutra, E., Balsamo, G., Calvet, J.-C., Munier, S., Burke, S., Fink, G., van Dijk, A., Martinez-de la Torre, A., van Beek, R., de Roo, A., and Polcher, J.: Report on the improved Water Resources Reanalysis, EartH2Observe, Report No. 5.2., 94 pp., https://doi.org/10.13140/RG.2.2.14523.67369, 2017.
Eilander, D.: Paired time series of daily discharge and storm surge, Data set, Zenodo, https://doi.org/10.5281/zenodo.3552820, 2019.
Eilander, D., Ikeuchi, H., Couasnon, A., Muis, S., Yamazaki, D., Winsemius, H., and Ward, P. J.: AGU18 presentation: An impact-based assessment of riverine flooding from compound events at the global scale, figshare https://doi.org/10.6084/m9.figshare.7546727.v2, 2018.
ERCC: DG ECHO daily map of 27/03/2019, available at: https://erccportal.jrc.ec.europa.eu/getdailymap/docId/2872, last access: 1 May 2019.
Federal Emergency Management Agency: Guidance for Flood Risk Analysis and Mapping; Combined Coastal and Riverine, Federal Emergency Management Agency, Washington, D.C., USA, available at: https://www.fema.gov/media-library/assets/documents/34953 (last access: 1 September 2019), 2015.
Gimeno, L., Nieto, R., Vázquez, M., and Lavers, D. A.: Atmospheric rivers: a mini-review, Front. Earth Sci., 2, 1–6, https://doi.org/10.3389/feart.2014.00002, 2014.
Gori, A., Blessing, R., Juan, A., Brody, S., and Bedient, P.: Characterizing urbanization impacts on floodplain through integrated land use, hydrologic, and hydraulic modeling, J. Hydrol., 568, 82–95, https://doi.org/10.1016/j.jhydrol.2018.10.053, 2019.
Hao, Z., Singh, V., and Hao, F.: Compound Extremes in Hydroclimatology: A Review, Water, 10, 718, https://doi.org/10.3390/w10060718, 2018.
Hawkes, P. J.: Joint probability analysis for estimation of extremes, J. Hydraul. Res., 46, 246–256, https://doi.org/10.1080/00221686.2008.9521958, 2008.
Hawkes, P. J., Gonzalez-Marco, D., Sánchez-Arcilla, A., and Prinos, P.: Best practice for the estimation of extremes: A review, J. Hydraul. Res., 46, 324–332, https://doi.org/10.1080/00221686.2008.9521965, 2008.
Hendry, A., Haigh, I. D., Nicholls, R. J., Winter, H., Neal, R., Wahl, T., Joly-Laugel, A., and Darby, S. E.: Assessing the characteristics and drivers of compound flooding events around the UK coast, Hydrol. Earth Syst. Sci., 23, 3117–3139, https://doi.org/10.5194/hess-23-3117-2019, 2019.
Hinkel, J., Lincke, D., Vafeidis, A. T., Perrette, M., Nicholls, R. J., Tol, R. S. J., Marzeion, B., Fettweis, X., Ionescu, C., and Levermann, A.: Coastal flood damage and adaptation costs under 21st century sea-level rise, P. Natl. Acad. Sci. USA, 111, 3292–3297, https://doi.org/10.1073/pnas.1222469111, 2014.
Hirabayashi, Y., Mahendran, R., Koirala, S., Konoshima, L., Yamazaki, D., Watanabe, S., Kim, H., and Kanae, S.: Global flood risk under climate change, Nat. Clim. Change, 3, 816–821, https://doi.org/10.1038/nclimate1911, 2013.
Hobaek Haff, I., Frigessi, A., and Maraun, D.: How well do regional climate models simulate the spatial dependence of precipitation? An application of pair-copula constructions, J. Geophys. Res.-Atmos., 120, 2624–2646, https://doi.org/10.1002/2014JD022748, 2015.
Ikeuchi, H., Hirabayashi, Y., Yamazaki, D., Muis, S., Ward, P. J., Winsemius, H. C., Verlaan, M., and Kanae, S.: Compound simulation of fluvial floods and storm surges in a global coupled river-coast flood model: Model development and its application to 2007 Cyclone Sidr in Bangladesh, J. Adv. Model. Earth Sy., 9, 1847–1862, https://doi.org/10.1002/2017MS000943, 2017.
Joe, H.: Dependence Modeling with Copulas, Chapman & Hall/CRC, London, UK, 2015.
JRC: FLOODS in Malawi and Mozambique – JRC Emergency Report #030, available from: https://fscluster.org/sites/default/files/documents/2019-03_floods_malawi_mozambique_update1a.pdf, last access: 1 September 2019.
Kew, S. F., Selten, F. M., Lenderink, G., and Hazeleger, W.: The simultaneous occurrence of surge and discharge extremes for the Rhine delta, Nat. Hazards Earth Syst. Sci., 13, 2017–2029, https://doi.org/10.5194/nhess-13-2017-2013, 2013.
Khanal, S., Ridder, N., de Vries, H., Terink, W., and van den Hurk, B.: Storm Surge and Extreme River Discharge: A Compound Event Analysis Using Ensemble Impact Modeling, Front. Earth Sci., 7, 1–15, https://doi.org/10.3389/feart.2019.00224, 2019.
Klerk, W. J., Winsemius, H. C., van Verseveld, W. J., Bakker, A. M. R., and Diermanse, F. L. M.: The co-incidence of storm surges and extreme discharges within the Rhine–Meuse Delta, Environ. Res. Lett., 10, 035005, https://doi.org/10.1088/1748-9326/10/3/035005, 2015.
Kumbier, K., Carvalho, R. C., Vafeidis, A. T., and Woodroffe, C. D.: Investigating compound flooding in an estuary using hydrodynamic modelling: a case study from the Shoalhaven River, Australia, Nat. Hazards Earth Syst. Sci., 18, 463–477, https://doi.org/10.5194/nhess-18-463-2018, 2018.
Leonard, M., Westra, S., Phatak, A., Lambert, M., van den Hurk, B., Mcinnes, K., Risbey, J., Schuster, S., Jakob, D., and Stafford-Smith, M.: A compound event framework for understanding extreme impacts, WIREs Clim. Change, 5, 113–128, https://doi.org/10.1002/wcc.252, 2014.
Liberato, M. L. R.: The 19 January 2013 windstorm over the North Atlantic: large-scale dynamics and impacts on Iberia, Weather and Climate Extremes, 5–6, 16–28, https://doi.org/10.1016/j.wace.2014.06.002, 2014.
Martius, O., Pfahl, S., and Chevalier, C.: A global quantification of compound precipitation and wind extremes, Geophys. Res. Lett., 43, 7709–7717, https://doi.org/10.1002/2016GL070017, 2016.
Moftakhari, H., Schubert, J. E., AghaKouchak, A., Matthew, R., and Sanders, B. F.: Linking Statistical and Hydrodynamic Modeling for Compound Flood Hazard Assessment in Tidal Channels and Estuaries, Adv. Water Resour., 128, 28–38, https://doi.org/10.1016/j.advwatres.2019.04.009, 2019.
Moftakhari, H. R., Salvadori, G., AghaKouchak, A., Sanders, B. F., and Matthew, R. A.: Compounding effects of sea level rise and fluvial flooding, P. Natl. Acad. Sci. USA, 114, 9785–9790, https://doi.org/10.1073/pnas.1620325114, 2017.
Muis, S., Verlaan, M., Winsemius, H. C., Aerts, J. C. J. H., and Ward, P. J.: A global reanalysis of storm surges and extreme sea levels, Nat. Commun., 7, 11969, https://doi.org/10.1038/ncomms11969, 2016.
Muis, S., Aerts, J. C. J. H., Verlaan, M., Ward, P. J., and Winsemius, H. C.: Daily maxima of storm surge from the Global Tide and Surge Reanalysis (GTSR) dataset, 4TU.Centre for Research Data, Dataset, https://doi.org/10.4121/uuid:17769b8a-33cd-455c-8bbd-b65ab504f07e, 2019.
Nhamire, B. and Hill, M.: UN Says Damage From Southern African Cyclone May Top $1 Billion, available at: https://www.bloomberg.com/news/articles/2019-03-25/damage -from-southern-african-cyclone-may-top-1-billion-un-says, last access: 1 September 2019.
Paprotny, D., Vousdoukas, M. I., Morales-Nápoles, O., Jonkman, S. N., and Feyen, L.: Compound flood potential in Europe, Hydrol. Earth Syst. Sci. Discuss., https://doi.org/10.5194/hess-2018-132, 2018a.
Paprotny, D., Sebastian, A., Morales-Nápoles, O., and Jonkman, S. N.: Trends in flood losses in Europe over the past 150 years, Nat. Commun., 9, 1985, https://doi.org/10.1038/s41467-018-04253-1, 2018b.
Probst, P. and Annunziato, A.: Tropical Cyclone IDAI: Analysis of the wind, rainfall and storm surge impact, European Commission Joint Research Center, 9 pp., available at: available at: https://www.humanitarianresponse.info/en/operations/ mozambique/document/tropical-cyclone-idai-analysis-wind-rainfall-and-storm-surge-impact-9, last access: 1 September 2019.
Ridder, N., de Vries, H., and Drijfhout, S.: The role of atmospheric rivers in compound events consisting of heavy precipitation and high storm surges along the Dutch coast, Nat. Hazards Earth Syst. Sci., 18, 3311–3326, https://doi.org/10.5194/nhess-18-3311-2018, 2018.
Sadegh, M., Moftakhari, H., Aghakouchak, A., Gupta, H. V, Mazdiyasni, O., Sanders, B., and Matthew, R.: Multi-hazard scenarios for analysis of compound extreme events, Geophys. Res. Lett., 45, 5470–5480, https://doi.org/10.1029/2018GL077317, 2018.
Saleh, F., Ramaswamy, V., Wang, Y., Georgas, N., Blumberg, A., and Pullen, J.: A Multi-Scale Ensemble-based Framework for Forecasting Compound Coastal-Riverine Flooding: The Hackensack-Passaic Watershed and Newark Bay, Adv. Water Resour., 110, 371–386, https://doi.org/10.1016/j.advwatres.2017.10.026, 2017.
Santiago-Collazo, F. L., Bilskie, M. V., and Hagen, S. C.: A comprehensive review of compound inundation models in low-gradient coastal watersheds, Environ. Modell. Softw., 119, 166–181, https://doi.org/10.1016/j.envsoft.2019.06.002, 2019.
Schellekens, J., Dutra, E., Martínez-de la Torre, A., Balsamo, G., van Dijk, A., Sperna Weiland, F., Minvielle, M., Calvet, J.-C., Decharme, B., Eisner, S., Fink, G., Flörke, M., Peßenteiner, S., van Beek, R., Polcher, J., Beck, H., Orth, R., Calton, B., Burke, S., Dorigo, W., and Weedon, G. P.: A global water resources ensemble of hydrological models: the eartH2Observe Tier-1 dataset, Earth Syst. Sci. Data, 9, 389–413, https://doi.org/10.5194/essd-9-389-2017, 2017.
Scussolini, P., Aerts, J. C. J. H., Jongman, B., Bouwer, L. M., Winsemius, H. C., de Moel, H., and Ward, P. J.: FLOPROS: an evolving global database of flood protection standards, Nat. Hazards Earth Syst. Sci., 16, 1049–1061, https://doi.org/10.5194/nhess-16-1049-2016, 2016.
Seneviratne, S. I., Nicholls, N., Easterling, D., Goodess, C. M., Kanae, S., Kossin, J., Luo, Y., Marengo, J., McInnes, K., Rahimi, M., Reichstein, M., Sorteberg, A., Vera, C., Zhang, X., Rusticucci, M., Semenov, V., Alexander, L. V., Allen, S., Benito, G., Cavazos, T., Clague, J., Conway, D., Della-Marta, P. M., Gerber, M., Gong, S., Goswami, B. N., Hemer, M., Huggel, C., van den Hurk, B., Kharin, V. V., Kitoh, A., Tank, A. M. G. K., Li, G., Mason, S., McGuire, W., van Oldenborgh, G. J., Orlowsky, B., Smith, S., Thiaw, W., Velegrakis, A., Yiou, P., Zhang, T., Zhou, T., and Zwiers, F. W.: Changes in Climate Extremes and their Impacts on the Natural Physical Environment, in: Managing the Risks of Extreme Events and Disasters to Advance Climate Change Adaptation, edited by: Field, C. B., Barros, V., Stocker, T. F., and Dahe, Q., Cambridge University Press, Cambridge, 109–230, 2012.
Serafin, K. A., Ruggiero, P., Parker, K., and Hill, D. F.: What's streamflow got to do with it? A probabilistic simulation of the competing oceanographic and fluvial processes driving extreme along-river water levels, Nat. Hazards Earth Syst. Sci., 19, 1415–1431, https://doi.org/10.5194/nhess-19-1415-2019, 2019.
Serinaldi, F.: Dismissing return periods!, Stoch. Env. Res. Risk A., 29, 1179–1189, https://doi.org/10.1007/s00477-014-0916-1, 2015.
Serinaldi, F., Bárdossy, A., and Kilsby, C. G.: Upper tail dependence in rainfall extremes: would we know it if we saw it?, Stoch. Env. Res. Risk A., 29, 1211–1233, https://doi.org/10.1007/s00477-014-0946-8, 2015.
Svensson, C. and Jones, D. A.: Dependence between extreme sea surge, river flow and precipitation in eastern Britain, Int. J. Climatol., 22, 1149–1168, https://doi.org/10.1002/joc.794, 2002.
Svensson, C. and Jones, D. A.: Dependence between sea surge, river flow and precipitation in south and west Britain, Hydrol. Earth Syst. Sci., 8, 973–992, https://doi.org/10.5194/hess-8-973-2004, 2004.
Tawn, J. A.: An extreme-value theory model for dependent observations, J. Hydrol., 101, 227–250, https://doi.org/10.1016/0022-1694(88)90037-6, 1988.
Tilloy, A., Malamud, B. D., Winter, H., and Joly-Laugel, A.: A review of quantification methodologies for multi-hazard interrelationships, Earth-Sci. Rev., 196, 102881, https://doi.org/10.1016/j.earscirev.2019.102881, 2019.
USAID: Southern Africa – Tropical Cyclones. Fact Sheet #14, Fiscal year 2019, available at: https://www.usaid.gov/sites/default/files/documents/1866/08.12.19_-_USAID-DCHA_SA_Tropical_Cyclones_Fact_Sheet_14_0.pdf, last access: 1 September 2019.
Veldkamp, T. I. E., Zhao, F., Ward, P. J., de Moel, H., Aerts, J. C. J. H., Schmied, H. M., Portmann, F. T., Masaki, Y., Pokhrel, Y., Liu, X., Satoh, Y., Gerten, D., Gosling, S. N., Zaherpour, J., and Wada, Y.: Human impact parameterizations in global hydrological models improve estimates of monthly discharges and hydrological extremes: a multi-model validation study, Environ. Res. Lett., 13, 055008, https://doi.org/10.1088/1748-9326/aab96f, 2018.
Verlaan, M., De Kleermaeker, S., and Buckman, L.: GLOSSIS: Global storm surge forecasting and information system, in: Australasian Coasts & Ports Conference 2015, 15–18 September 2015, Auckland, New Zealand: 22nd Australasian Coastal and Ocean Engineering Conference and the 15th Australasian Port and Harbour Conference/Engineers Australia, IPENZ, New Zealand Coastal Society, 229–234, 2015.
Villarini, G. and Smith, J. A.: Flood peak distributions for the eastern United States, Water Resour. Res., 46, W06504, https://doi.org/10.1029/2009WR008395, 2010.
Vousdoukas, M. I., Voukouvalas, E., Mentaschi, L., Dottori, F., Giardino, A., Bouziotas, D., Bianchi, A., Salamon, P., and Feyen, L.: Developments in large-scale coastal flood hazard mapping, Nat. Hazards Earth Syst. Sci., 16, 1841–1853, https://doi.org/10.5194/nhess-16-1841-2016, 2016.
Vousdoukas, M. I., Mentaschi, L., Voukouvalas, E., Bianchi, A., Dottori, F., and Feyen, L.: Climatic and socioeconomic controls of future coastal flood risk in Europe, Nat. Clim. Chang., 8, 776–780, https://doi.org/10.1038/s41558-018-0260-4, 2018.
Wahl, T., Jain, S., Bender, J., Meyers, S. D., and Luther, M. E.: Increasing risk of compound flooding from storm surge and rainfall for major US cities, Nat. Clim. Change, 5, 1093–1097, https://doi.org/10.1038/nclimate2736, 2015.
Ward, P., Jongman, B., Weiland, F., Bouwman, A., van Beek, R., Bierkens, M., Ligtvoet, W., and Winsemius, H.: Assessing flood risk at the global scale: Model setup, results, and sensitivity, Environ. Res. Lett., 8, 44019, https://doi.org/10.1088/1748-9326/8/4/044019, 2013.
Ward, P., Jongman, B., Salamon, P., Simpson, A., Bates, P., De Groeve, T., Muis, S., de Perez, E. C., Rudari, R., Trigg, M. A., and Winsemius, H.: Usefulness and limitations of global flood risk models, Nat. Clim. Change, 5, 712–715, https://doi.org/10.1038/nclimate2742, 2015.
Ward, P. J., Jongman, B., Aerts, J. C. J. H., Bates, P. D., Botzen, W. J. W., Diaz Loaiza, A., Hallegatte, S., Kind, J. M., Kwadijk, J., Scussolini, P., and Winsemius, H. C.: A global framework for future costs and benefits of river-flood protection in urban areas, Nat. Clim. Change, 7, 642–646, https://doi.org/10.1038/nclimate3350, 2017.
Ward, P. J., Couasnon, A., Eilander, D., Haigh, I. D., Hendry, A., Muis, S., Veldkamp, T. I. E., Winsemius, H. C., and Wahl, T.: Dependence between high sea-level and high river discharge increases flood hazard in global deltas and estuaries, Environ. Res. Lett., 13, 084012, https://doi.org/10.1088/1748-9326/aad400, 2018.
Winsemius, H. C., Van Beek, L. P. H., Jongman, B., Ward, P. J., and Bouwman, A.: A framework for global river flood risk assessments, Hydrol. Earth Syst. Sci., 17, 1871–1892, https://doi.org/10.5194/hess-17-1871-2013, 2013.
Winsemius, H. C., Aerts, J. C. J. H., van Beek, L. P. H., Bierkens, M. F. P., Bouwman, A., Jongman, B., Kwadijk, J. C. J., Ligtvoet, W., Lucas, P. L., van Vuuren, D. P., and Ward, P. J.: Global drivers of future river flood risk, Nat. Clim. Change, 6, 381–385, https://doi.org/10.1038/nclimate2893, 2016.
Wu, W., McInnes, K., O'Grady, J., Hoeke, R., Leonard, M., and Westra, S.: Mapping Dependence Between Extreme Rainfall and Storm Surge, J. Geophys. Res.-Oceans, 123, 2461–2474, https://doi.org/10.1002/2017JC013472, 2018.
Yamazaki, D., Kanae, S., Kim, H., and Oki, T.: A physically based description of floodplain inundation dynamics in a global river routing model, Water Resour. Res., 47, W04501, https://doi.org/10.1029/2010WR009726, 2011.
Yamazaki, D., O'Loughlin, F., Trigg, M. A., Miller, Z. F., Pavelsky, T. M., and Bates, P. D.: Development of the Global Width Database for Large Rivers, Water Resour. Res., 50, 3467–3480, https://doi.org/10.1002/2013WR014664, 2014.
Zheng, F., Westra, S., and Sisson, S. A.: Quantifying the dependence between extreme rainfall and storm surge in the coastal zone, J. Hydrol., 505, 172–187, https://doi.org/10.1016/j.jhydrol.2013.09.054, 2013.
Zscheischler, J., Westra, S., van den Hurk, B. J. J. M., Seneviratne, S. I., Ward, P. J., Pitman, A., AghaKouchak, A., Bresch, D. N., Leonard, M., Wahl, T., and Zhang, X.: Future climate risk from compound events, Nat. Clim. Change, 8, 469–477, https://doi.org/10.1038/s41558-018-0156-3, 2018.
Zscheischler, J., Fischer, E. M., and Lange, S.: The effect of univariate bias adjustment on multivariate hazard estimates, Earth Syst. Dynam., 10, 31–43, https://doi.org/10.5194/esd-10-31-2019, 2019.