the Creative Commons Attribution 4.0 License.
the Creative Commons Attribution 4.0 License.
 | 18 Dec 2020
Style of faulting of expected earthquakes in Italy as an input for seismic hazard modeling
Silvia Pondrelli
Francesco Visini
Andrea Rovida
Vera D'Amico
Bruno Pace
Carlo Meletti
The style of faulting and distributions of nodal planes are essential input for probabilistic seismic hazard assessment. As part of a recent elaboration of a new seismic hazard model for Italy, we defined criteria to parameterize the styles of faulting of expected earthquake ruptures and to evaluate their representativeness in an area-based seismicity model. Using available seismic moment tensors for relevant seismic events (Mw≥4.5), first arrival focal mechanisms for less recent earthquakes, and also geological data on past activated faults, we collected a database for the last ∼100 years by gathering a thousand data points for the Italian peninsula and regions around it. In this dataset, we adopted a procedure that consists, in each seismic zone, of separating the available seismic moment tensors into the three main tectonic styles, making a summation within each group, identifying possible nodal plane(s), taking into account the different percentages of styles of faulting, and including where necessary total or partial (even in terms of tectonic style) random source contributions. Referring to the area source model used, for several seismic zones we obtained robust results; e.g., along the central and southern Apennines we expect future earthquakes to be mostly extensional, although in the outer part of the chain reverse and strike-slip events are possible. In the northern part of the Apennines we expect different styles of faulting for different hypocentral depths. In zones characterized by a low seismic moment release, the possible style of faulting of future earthquakes is less clear and it has been represented using different combinations of random sources. The robustness of our results is confirmed when compared with recent relevant earthquakes occurring in Italy.
- Article
(15679 KB) - Full-text XML
-
Supplement
(1011 KB) - BibTeX
- EndNote


The determination of the style of faulting in seismicity models for probabilistic seismic hazard assessment (PSHA) represents the key ingredient to define the orientation and the kinematics of the seismic source. The orientation (strike and dip) of the seismic source impacts the source-to-site distance, an input for ground motion prediction equations (GMPEs), whereas the kinematics (i.e., rake) that take into account the style of faulting affect the choice of coefficients in GMPEs. The comparison of ground motions produced by reverse, strike-slip, or normal faults shows that reverse-faulting events generate higher-amplitude motions, especially with respect to normal faulting ones (e.g., Bommer et al., 2003). According to Bindi et al. (2011), in the case of the Italian strong motion data, the main differences in the ground motion result from the medium- to short-period range (T<1 s) wherein the expected values for a reverse mechanism are significantly larger than those produced by other styles of faulting. Regarding the source orientation, changing the strike of the fault leads to an increment or reduction of the rupture-to-site distance. For instance, in the case of a normal fault with Mw 6.3, the GMPE by Bindi et al. (2011) shows that increasing the distance from 20 to 30 km reduces the mean expected peak ground acceleration (PGA) by about 40 %.
Although the orientation and kinematics of finite ruptures are key ingredients for PSHA, there are no standard objective approaches for defining the style of faulting in tectonic regions, and this is generally done through the analysis of available fault mechanisms and a comparison with mapped active faults. Roselli et al. (2017) defined the style of faulting on a regular grid in Italy. They used a smoothed 2-D approach based on the computation of a cumulative focal mechanism within each cell obtained through the weighted summation of previous focal mechanisms. However, in general, the lack of a seismotectonic model behind the calculation can affect the results, especially in small areas characterized by the coexistence of normal, reverse, and strike-slip tectonics. In addition, the variation of each style of faulting with depth should be detected and taken into account where possible.
Our objective is to define an approach based on seismotectonic zones because it allows the inclusion of possible variability in the style of faulting with depth and prevents undesired rotations of the average focal solution in the case of transitions to different kinematics at the surface or at depth. Meletti et al. (2019) released a seismogenic zone model, called ZS16, that represents the update of the ZS9 model (Meletti et al., 2008) adopted by the current reference seismic hazard model of Italy (Stucchi et al., 2011). ZS16 is based on the same seismotectonic knowledge used for designing ZS9 but includes new data available for the study area (an earthquake catalog and fault database among others). The new data allow a better definition of the boundary and of the seismogenic depth of each seismic source zone.
In this paper, we illustrate the selection and weighting criteria to gather a representative dataset of nearly 100 years of focal mechanisms in Italy. We tested and applied the procedure to define the style of faulting using the recently produced ZS16 seismotectonic zoning for the update of the national PSHA for Italy.
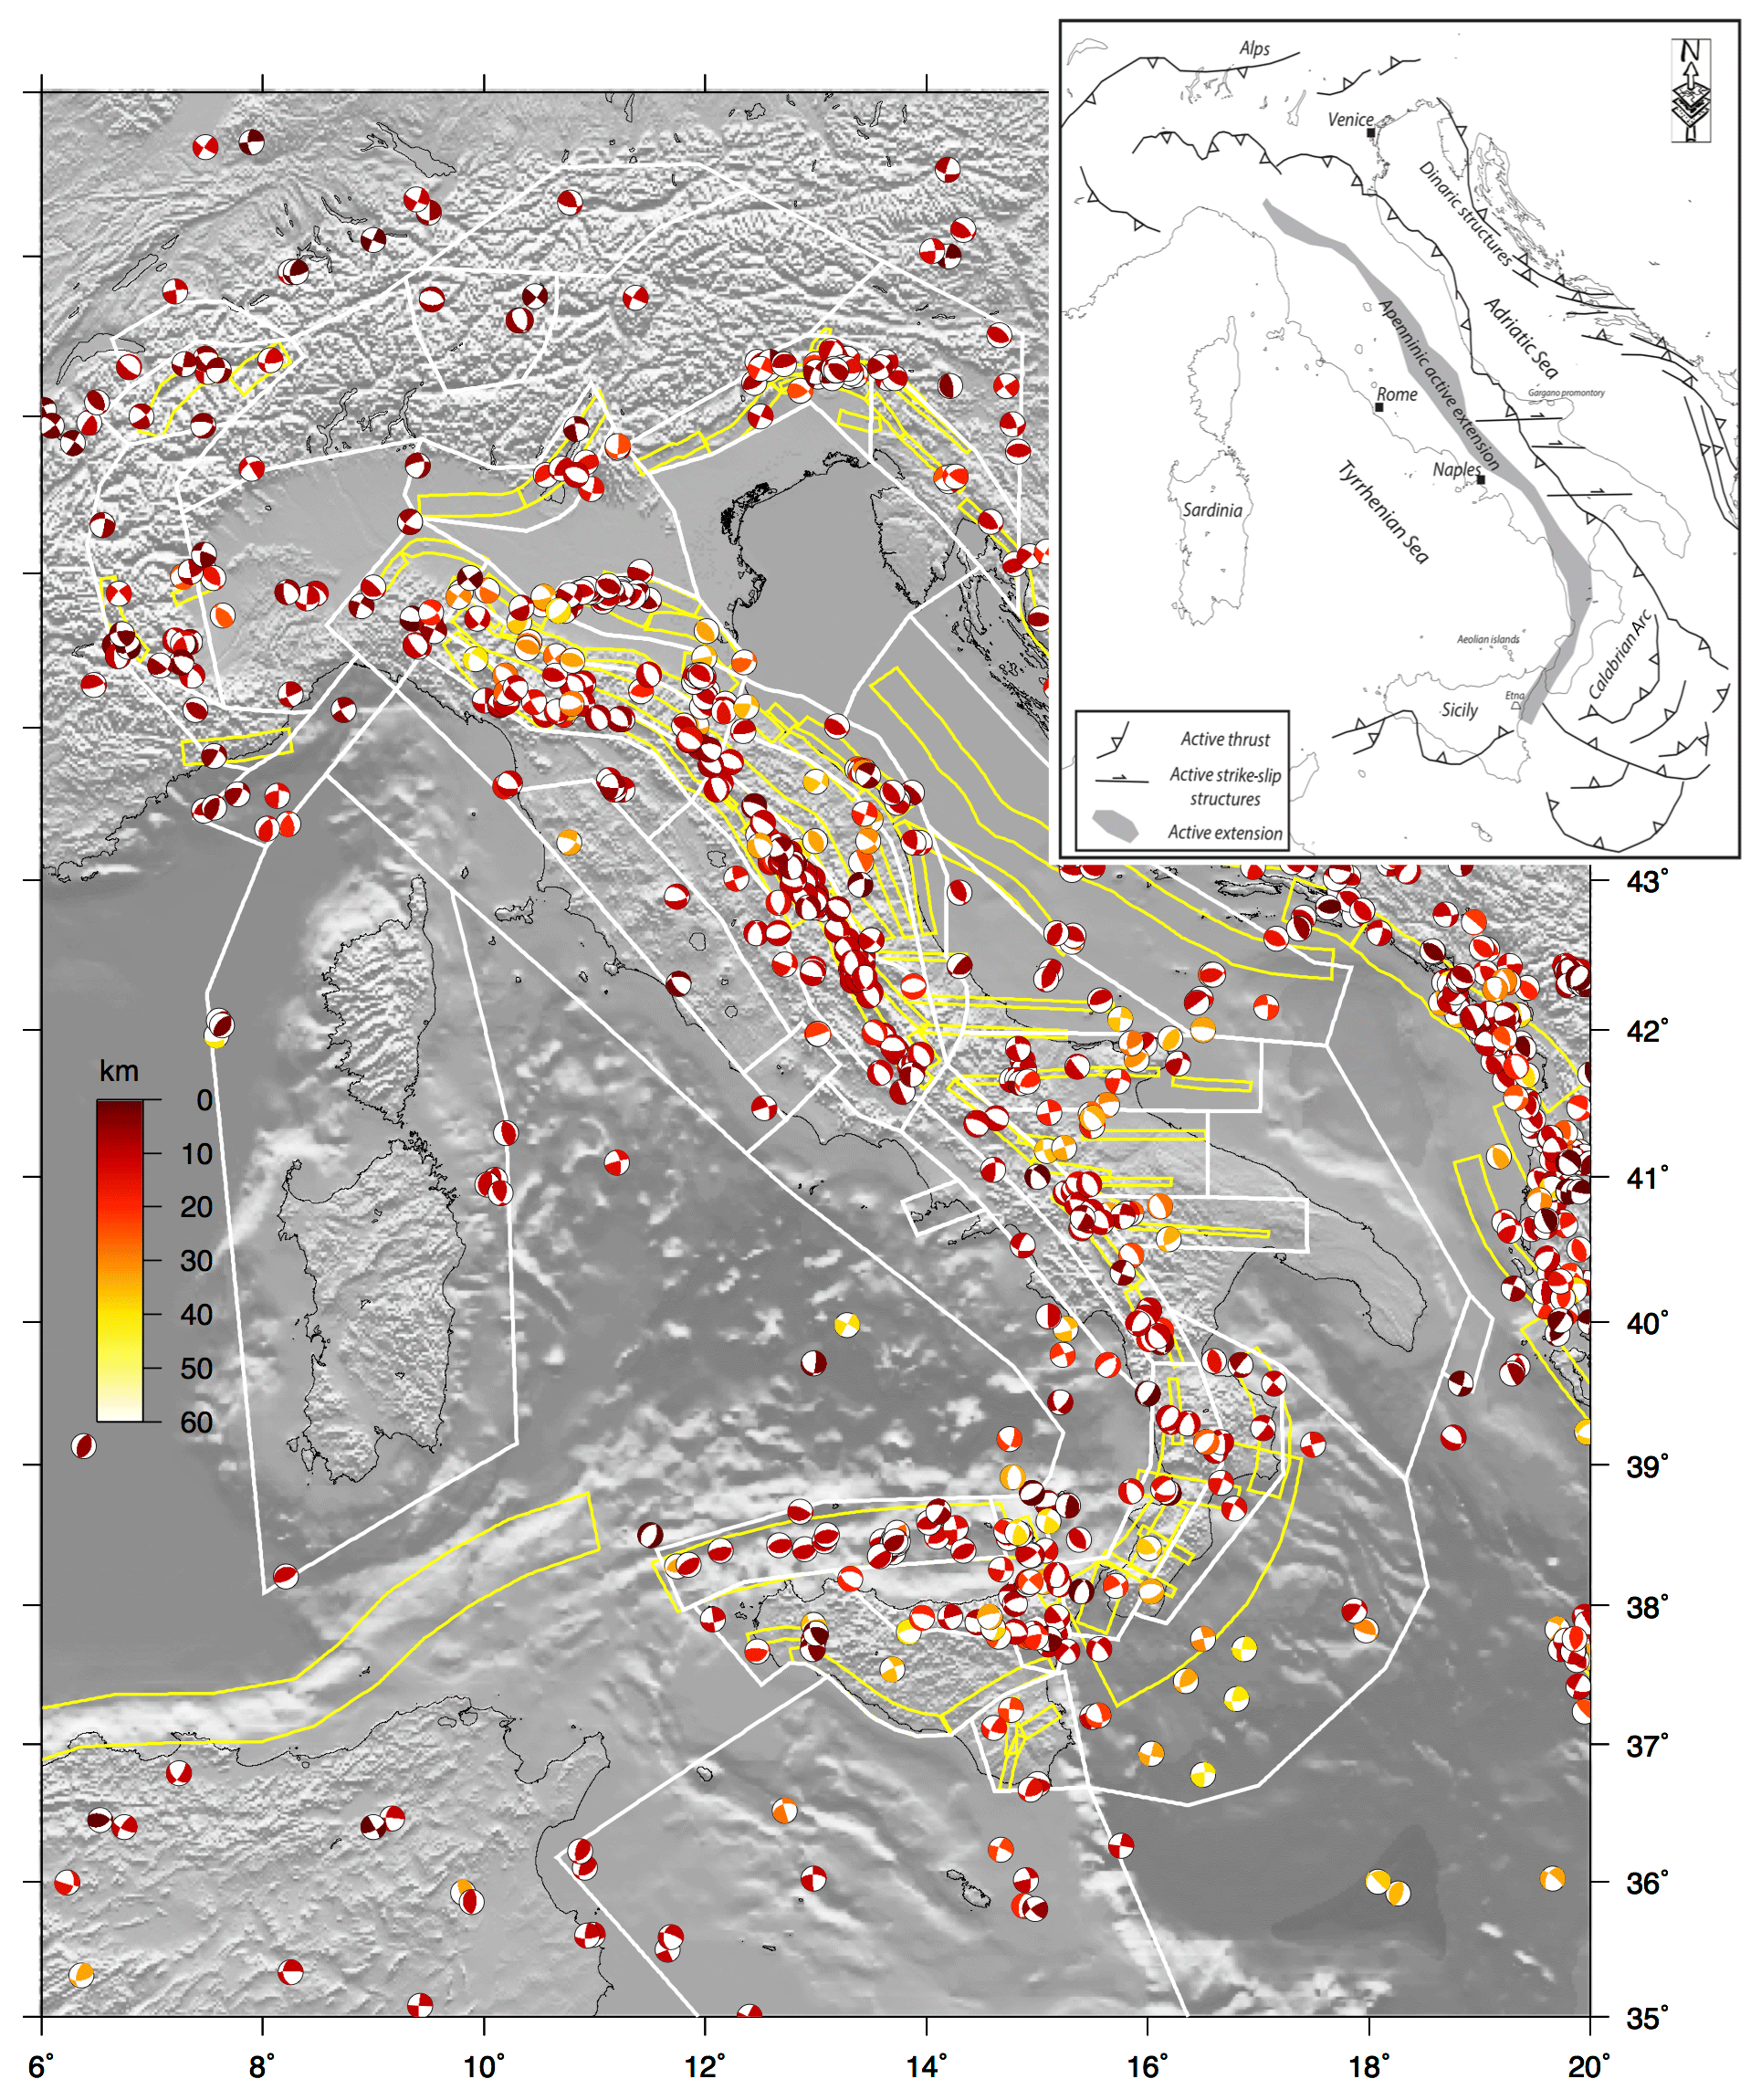
Figure 1Map of the entire available dataset. Different colors of the focal mechanisms represent different hypocentral depths, following the scale on the left. In the background, the borders of the seismic source zones of ZS16 (Meletti et al., 2019) are reported in white; in yellow, composite seismogenic sources are taken from the DISS database (DISS Working Group, 2018). Top right: map of the main tectonic features of the study region.
The seismotectonic setting of Italy shows the presence of normal, compressive, and strike-slip tectonics as well as combinations of these (Fig. 1). In the Alps, the most seismically active part is in the east, where the south-verging Alpine thrusts meet the strike-slip Dinaric structures and where the famous 1976 Friuli seismic sequence included several severe to moderate earthquakes with reverse and strike-slip focal mechanisms (Pondrelli et al., 2001). Moving towards the south, along the entire Apennines watershed, shallow extensional tectonics dominates, as exemplified by the seismic sequences of 1997/98 in Umbria–Marche, L'Aquila in 2009, and the recent 2016/17 in central Italy (Fig. 1; Chiarabba et al., 2018, and references therein). This normal tectonic style continues up to the Calabrian Arc and in N–NE Sicily. However, in the outer part of the chain on the Adriatic side, compression tectonics occur in correspondence to the northern Apennine arc; the 2012 Emilia seismic sequence was the most recent expression of this (Anzidei et al., 2012). To the south, the tectonics become strike-slip to transpressive in correspondence with the outer part of the southern Apennines, i.e., in the Gargano Promontory (Fig. 1). Another characteristic of the seismicity of the Adriatic side of the peninsula is a general greater hypocentral depth of the earthquakes, resulting not only in a lateral variation of the dominating tectonic style, but also in a variation with depth. Crossing the Strait of Messina that separates Calabria from Sicily, we still find a shallow extensional seismicity along the mountain watershed, which is, however, a low persistent feature. In Sicily, other tectonic styles prevail, such as in the north–south narrow bend from the Aeolian Islands up to the south of Mt. Etna, which is densely populated by strike-slip earthquakes, and in the active compressive front west of the Aeolian Islands offshore of northern Sicily in the southern Tyrrhenian Sea (Fig. 1). This quick overview of the seismotectonic characteristics of the Italian peninsula is based on seismological and geological data, strictly related to what happens at crustal depth. Note that the subduction system and related deep seismicity active beneath the Calabrian Arc and the southern Tyrrhenian Sea are excluded here because we focus on the shallow seismicity responsible for the seismic hazard.
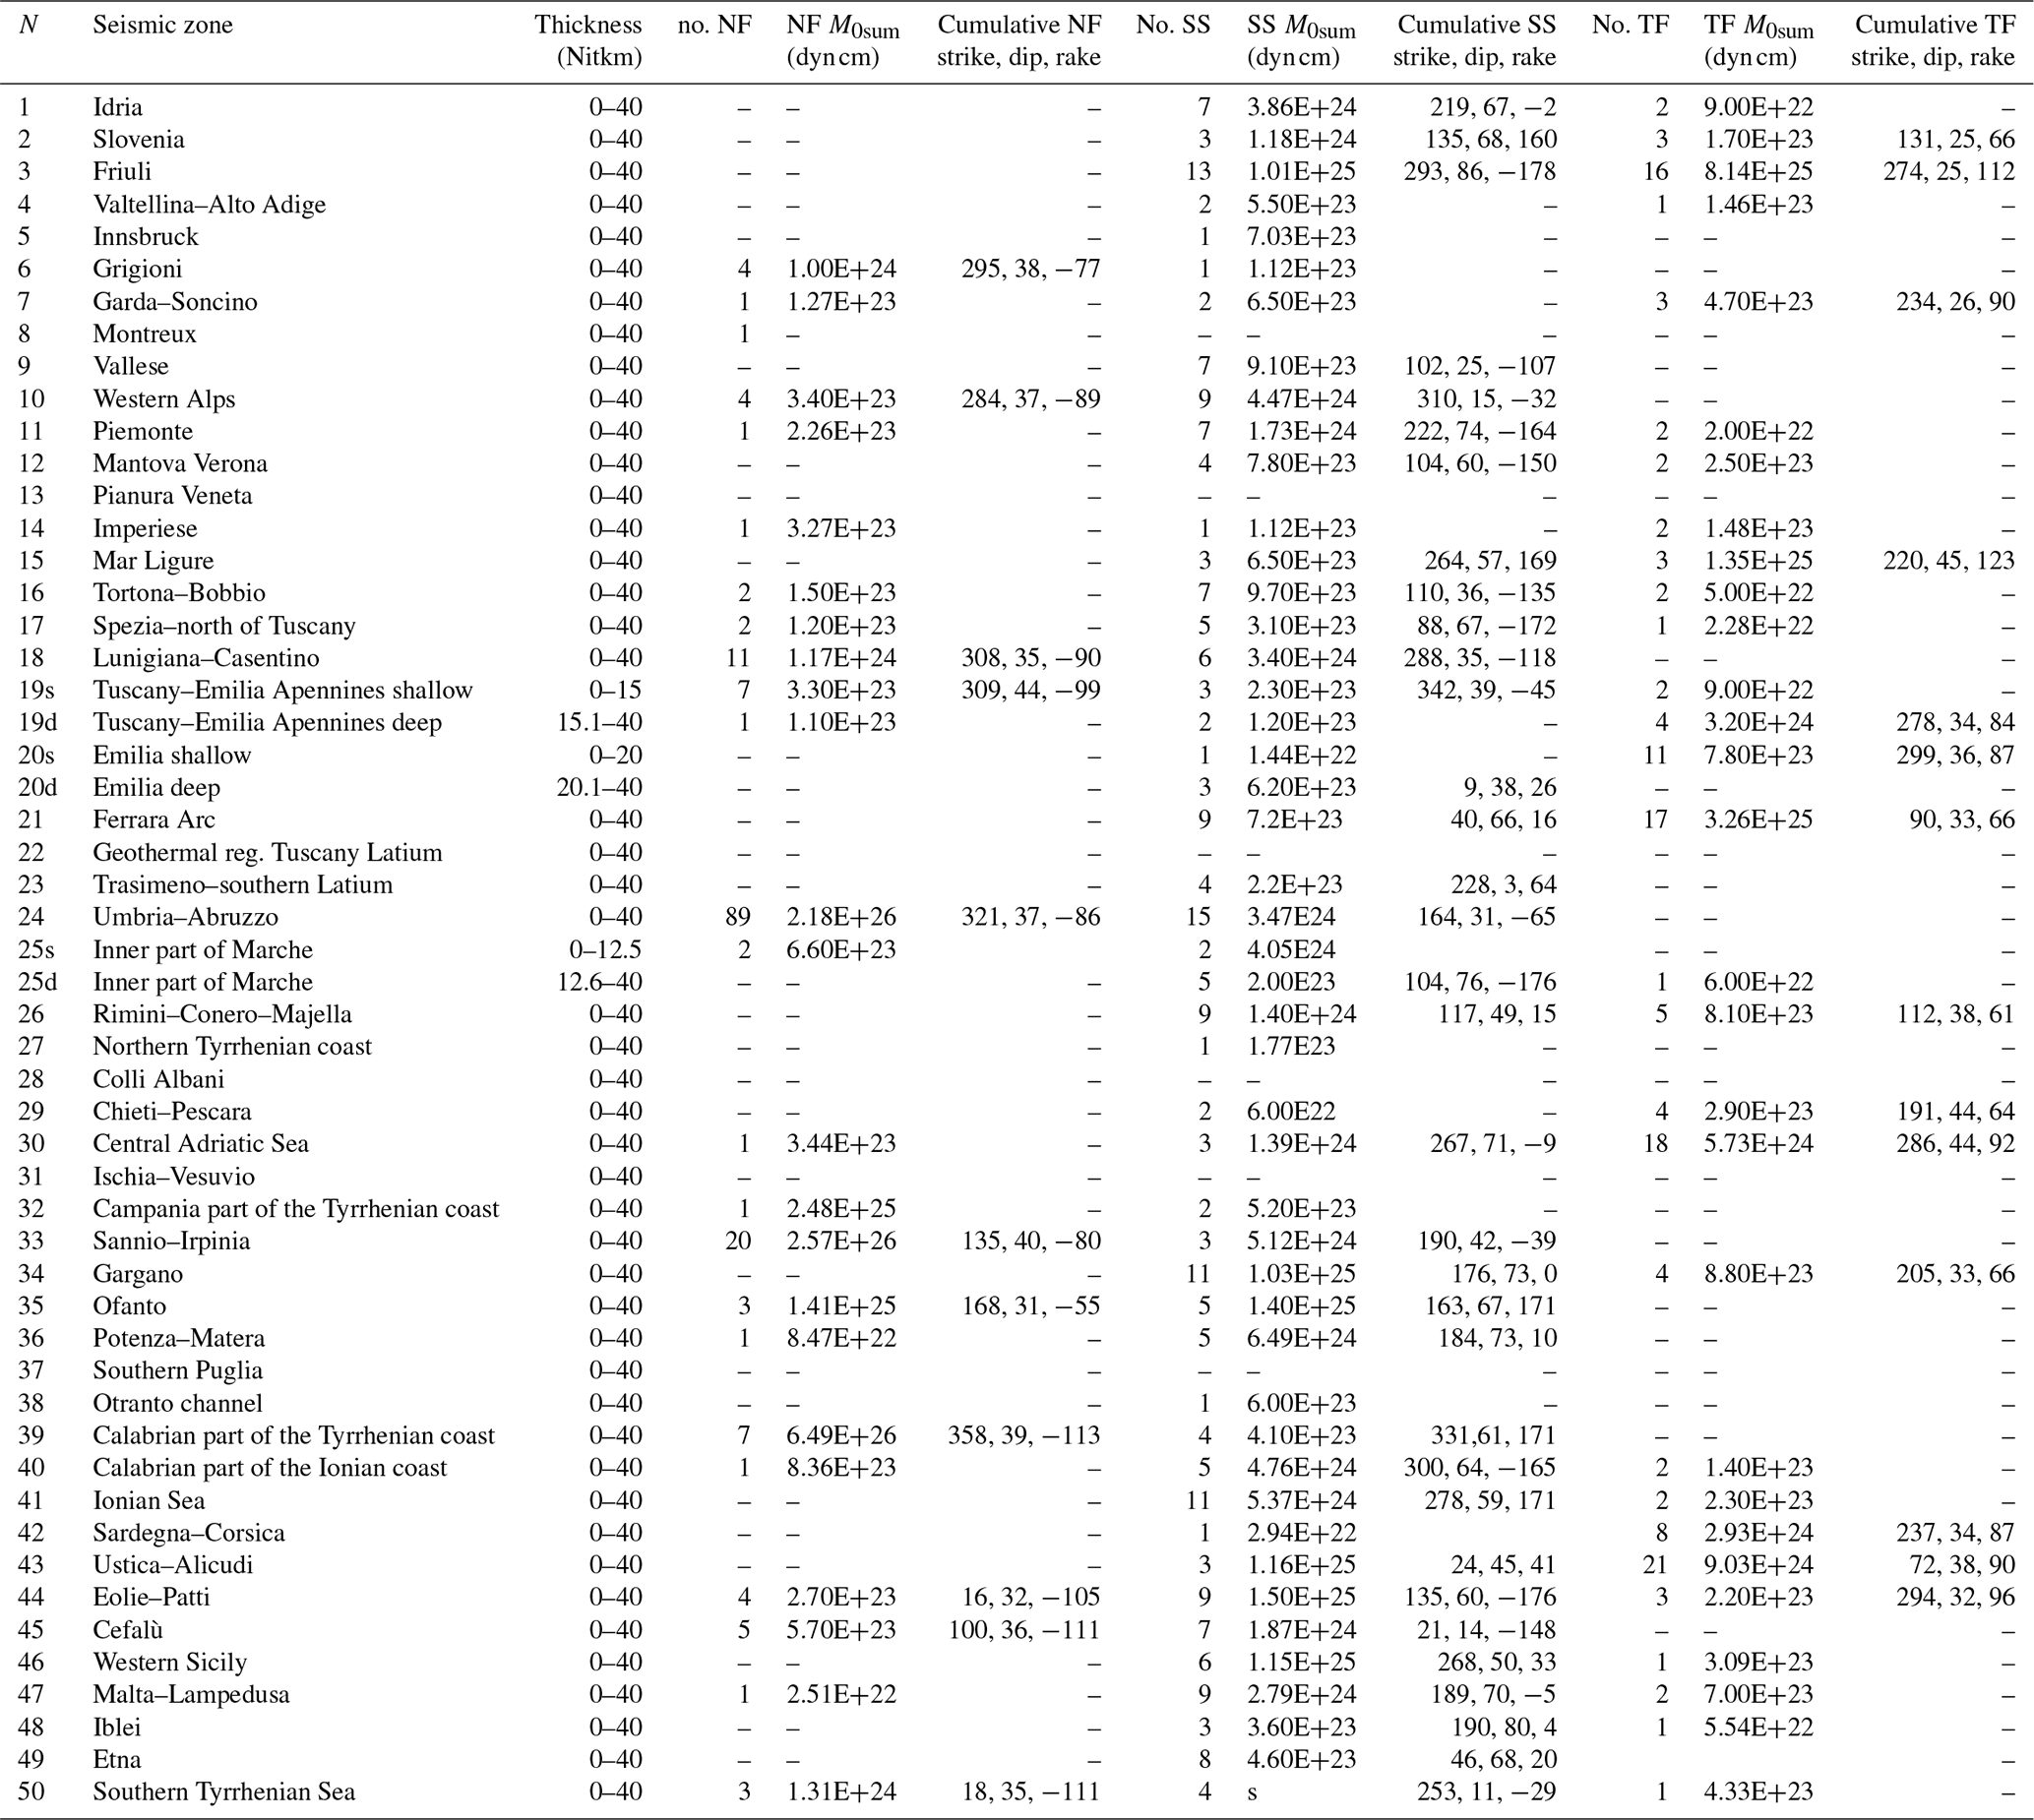
Meletti et al. (2019) defined a seismotectonic zoning, called ZS16, reflecting the structural tectonic framework of Italy, which we adopt for our study. It is composed of 50 area sources representing regions of spatially uniform occurrence of seismicity (Fig. 1 and Table S1 in the Supplement). To define the borders of the zones, and the upper and lower bounds of the characteristic seismogenic depth, data from mapped active faults (DISS Working Group, 2018) that played a major role have been integrated with earthquake catalogs (Rovida et al., 2016), geodetic strain data (Devoti et al., 2017), and focal mechanisms (Global CMT, Ekström et al., 2012; Pondrelli, 2002). In order to estimate the upper and lower seismogenic depths of the ZS16 zones for the earthquakes above the threshold relevant for the PSHA, the instrumental catalog prepared for the recent elaboration of a new seismic hazard model for Italy (MPS19 Project) has been used (Gasperini et al., 2016). Earthquakes with fixed depth have been removed from the reference dataset; only earthquakes that likely occurred within the shallow crust, with a maximum depth of 40 km, have been included. The 5th and 95th percentiles of the cumulative depth distribution of the selected dataset have been assumed as the upper and lower boundaries of the seismogenic layer depth. Finally, the definition of the upper and lower depths is determined by comparing the percentiles resulting from catalogs with different minimum magnitudes (from Mw 2 to Mw 4) with the depth of the composite seismogenic sources from DISS 3.2.1. The obtained depth values used in ZS16 for the 50 area sources are listed in Table 1.
Table 1Data for each seismic zone, including the seismogenic thickness used for the summation of focal mechanisms, the number of available focal mechanisms, cumulative M0sum, and the cumulative focal mechanism for each tectonic style (NF, SS, TF); “s” and “d” are added to the seismic zone number to refer to shallow and deep zones when the summation is done for different depth intervals.
Here we describe the building of the focal mechanism database and the procedure applied to evaluate the prevailing style of faulting.
3.1 Data
To collect a representative dataset useful to define the different seismotectonic styles for the Italian peninsula, we started from the best-quality moment tensors available, which are in the CMT Italian Dataset (Pondrelli and Salimbeni, 2006; Pondrelli et al., 2006). It is a continuously updated merge of the existing Global CMT Project (Dziewonski et al., 1981; Ekström et al., 2012) and European Mediterranean RCMT data (European Mediterranean RCMT Catalog, 2020; Pondrelli et al., 2002; Pondrelli and Salimbeni, 2015) including all moment tensors available for earthquakes with M≥4.5 in the time interval from 1976 to 2015 included in the geographical window with latitude from 35 to 48∘ N and longitude from 6 to 20∘ E. To reach the best homogeneity in terms of spatial distribution, we added the moment tensors of a few M≥4.0 earthquakes that occurred in the Alpine region, obtained through seismic data inversions and belonging to the GFZ and ETHZ datasets (Saul et al., 2011, and Bernardi et al., 2004, respectively).
In addition, to get a longer dataset in terms of time, we considered the first polarity focal solutions selected from the EMMA database (Database of Earthquake Mechanisms of the Mediterranean Area; Vannucci and Gasperini, 2004). Such data have been used when they were the only available ones, such as relevant events that occurred before the digital era of seismological data like the 1968 Belice (Sicily) earthquakes. In a few cases, multiple focal mechanisms are available for a single event. To choose among them we applied the quality evaluation given in the EMMA database by selecting the so-called “preferred” solutions.
Unfortunately, for two severe events of the past century, the 1905 M6.9 in Calabria and the 1915 M6.9 in the southern Apennines, several first arrival focal mechanisms available in the EMMA database are of low quality and different from one to another, indicating a different tectonic style from that expected in the regions where they occurred. For both earthquakes, none of the preferred nearly strike-slip solutions were considered reliable enough because the strike-slip kinematics seem to be incompatible with the crustal tectonic style of the southern Apennines and Calabria regions, usually described as extensional (e.g., Devoti et al., 2017).
Considering the high magnitude of these events and the aim of this study, we decided to look for different data to reconstruct their focal mechanisms. To do so, we took into account the following statements: (1) the first arrival focal mechanisms are often different from seismic moment tensor focal mechanisms (see the astonishing example of the Mw 6.0 Amatrice earthquake, central Italy, 24 August 2016 in Fig. 2 in Marchetti et al., 2016); (2) the first arrival focal mechanisms represent the initial fault slip, while seismic moment tensors describe the entire seismic source, which in turn is considered the most representative indicator of the tectonic style dominating the epicentral region.
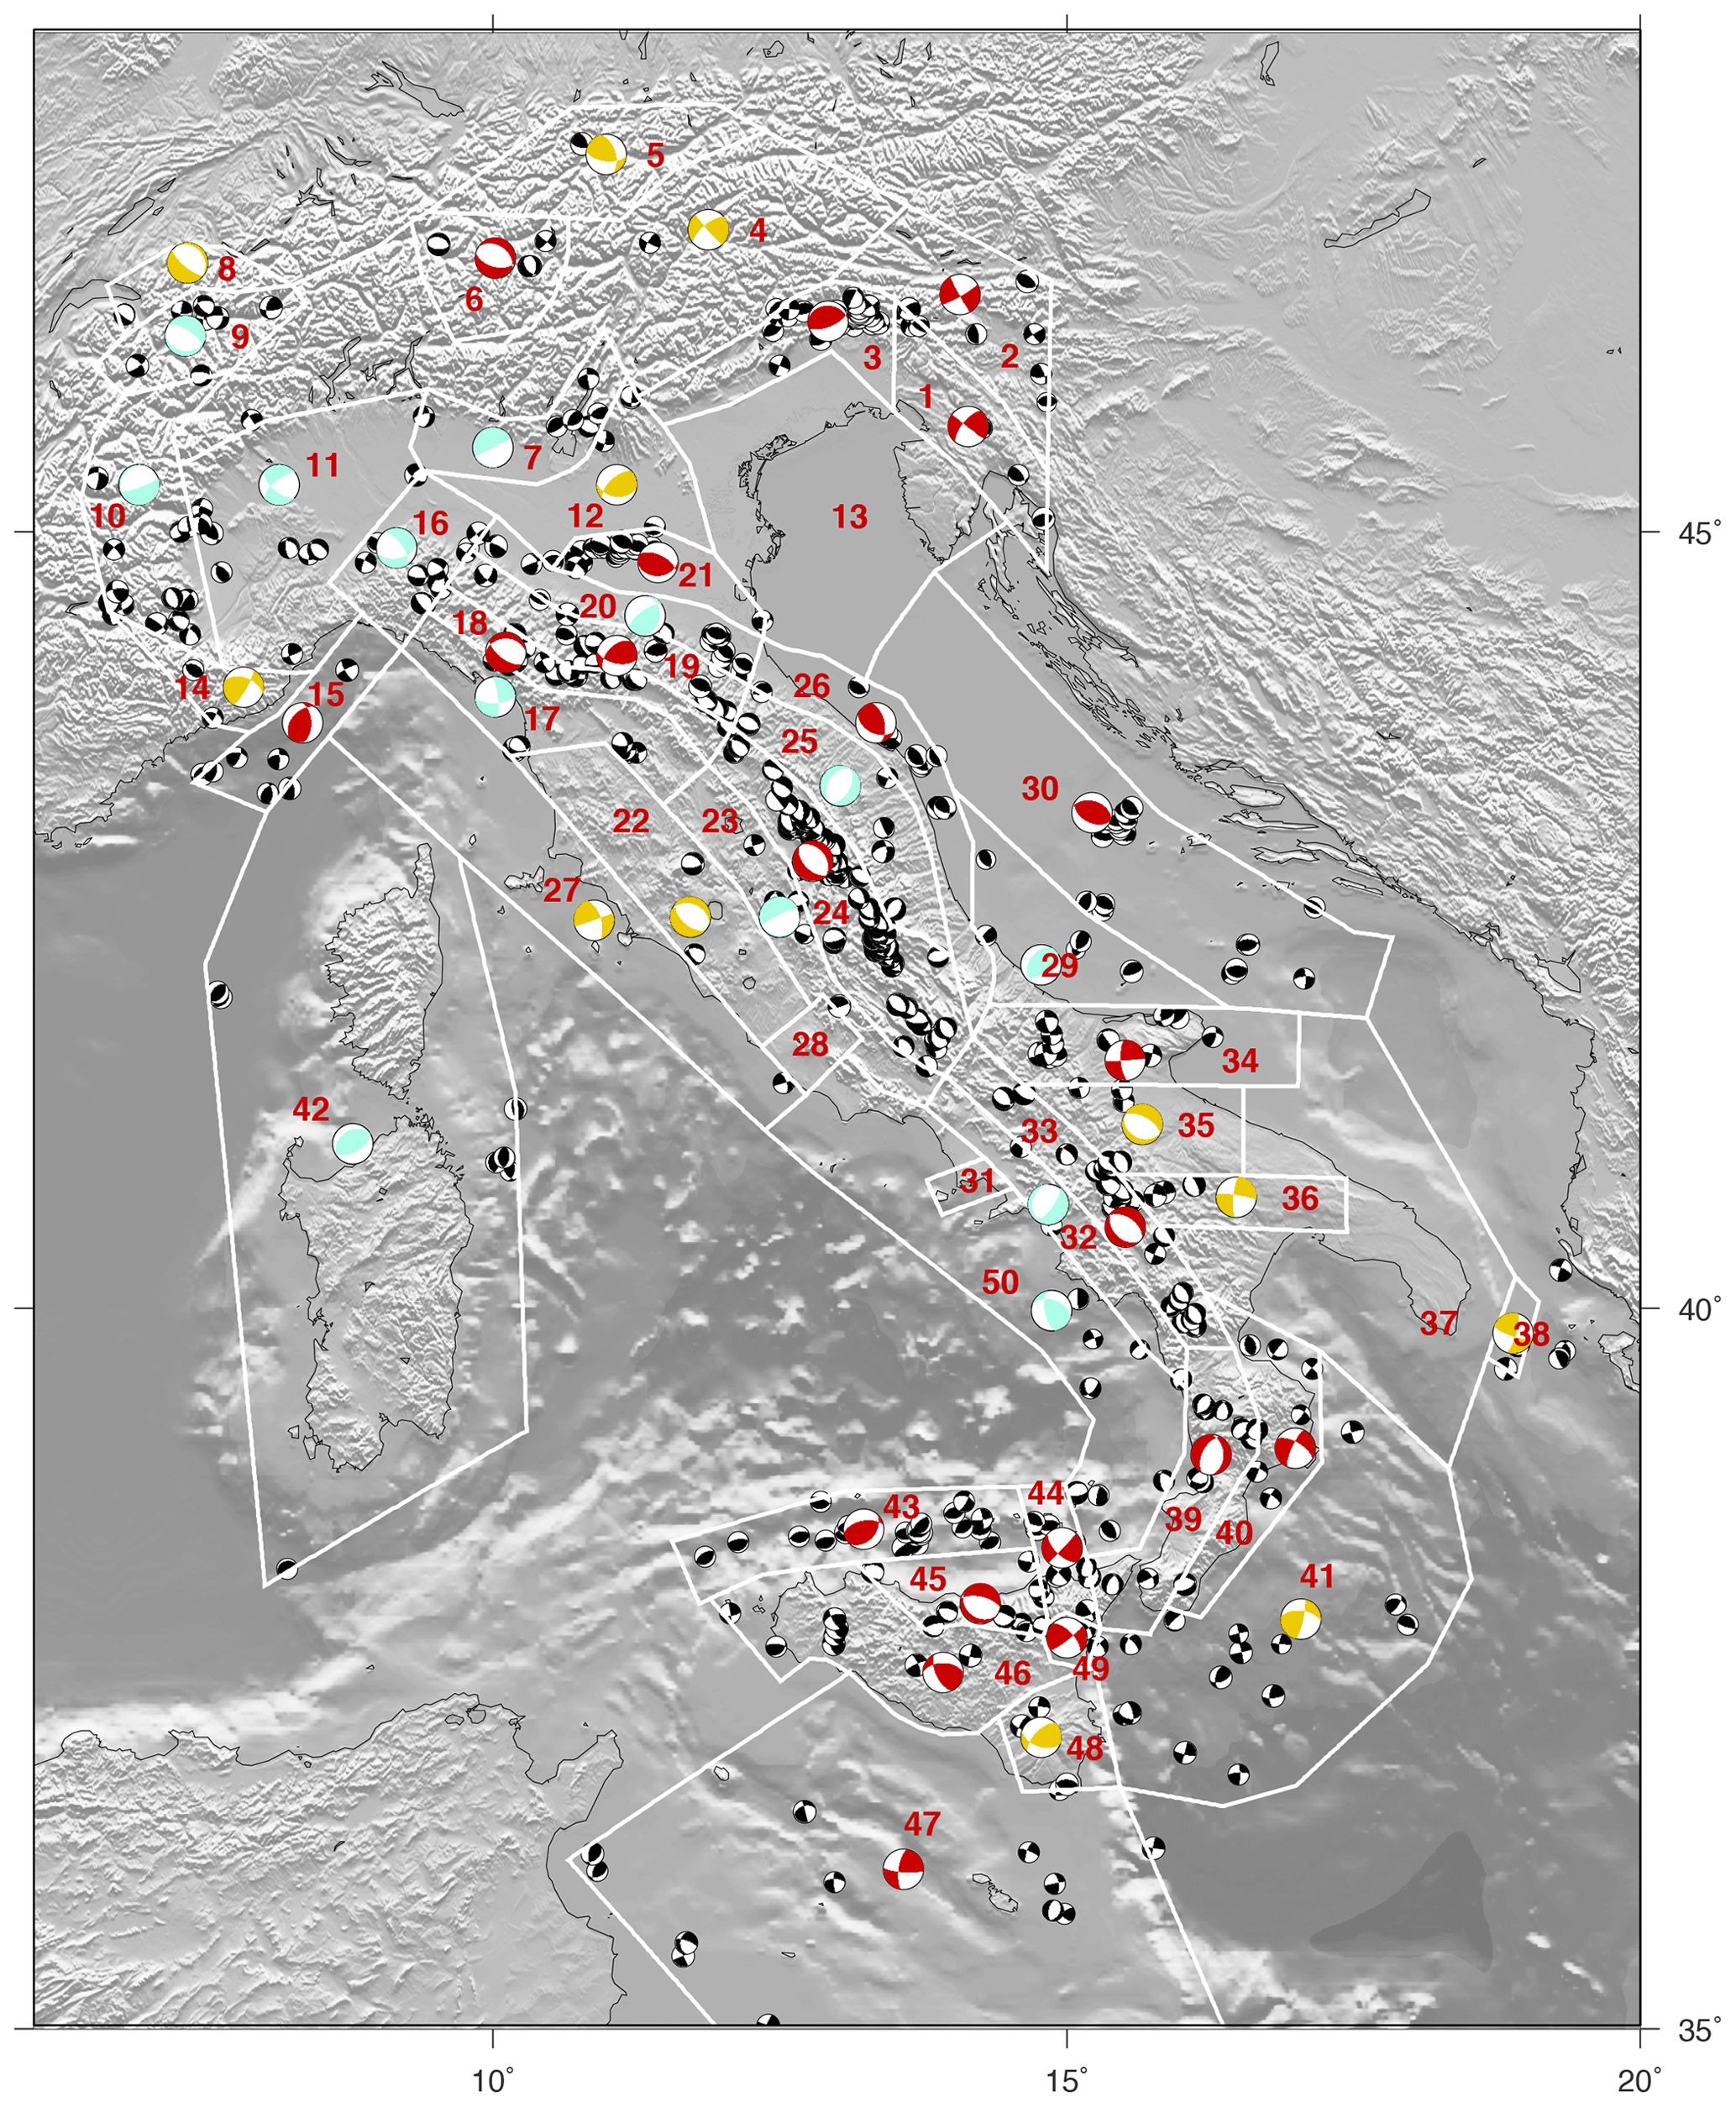
Figure 2Map of the results of a test of focal mechanism summation for each seismic zone in ZS16 (contoured in white, numbered in red) using a 20 km seismogenic layer thickness. Obtained cumulative focal mechanisms are in red when considered a stable result, yellow when less reliable, and light blue when too uncertain because of the heterogeneity of input data (see the text for quality evaluation criteria). In the background, the small black focal mechanisms represent the input dataset.
Our attention thus went to Quaternary tectonics information in the DISS database (DISS Working Group, 2018), according to which the seismogenic sources of both events are described as purely extensional based on geological studies (e.g., Loreto et al., 2013, for the 1905 Calabria earthquake; Galadini and Galli, 1999, for the 1915 earthquake). Thus, for the 1905 earthquake we used a seismic moment tensor reconstructed using the strike, dip, and rake given in the seismogenic source ITIS139 (Sant'Eufemia Individual Source), and for the 1915 earthquake we used those given in ITIS002 (Fucino Basin Individual Source). It is worth noting that from DISS we exported only the strike, slip, and rake reported in the parameters lists, while for magnitude and seismic moment we kept those from the preferred solution in the EMMA database determined with seismological recordings, as was done for all other similar data in our dataset.
The final database (Fig. 1 and Table S2 in the Supplement) includes nearly 1000 focal mechanisms for crustal earthquakes, representative of about 100 years of seismicity in the Italian peninsula and surrounding areas.
We are aware that for some regions the possible largest earthquake could be not represented in the available observations. Looking for the prevailing style of faulting, we needed information on the focal mechanism of events, which of course does not exist for big earthquakes in the past. This lack of knowledge should be taken into account together with other uncertainties when the results of this work will be used in hazard model computations, as is done for data from historical catalogs, wherein it is known that ancient big earthquakes may be lacking. Also, considering how long geological processes last, we assume that where we have focal mechanisms for recent events coherent with geological structures, they may be considered representative of historical earthquakes, too.
3.2 Methods
Several ground motion prediction equations include the “style of faulting” as a possible variable (e.g., Bindi et al., 2011, 2014; Akkar et al., 2014). Modern seismic hazard software (e.g., OpenQuake Engine; Pagani et al., 2014) needs the prevalent fault geometry of the expected ruptures to be used for the source definition. However, because the style of faulting impacts the PSHA in an area, it is important to define when the calculated style of faulting can be considered robust and representative of the kinematics of a region.
We started by applying a traditional Kostrov method (Kostrov, 1974), in which the sum of the moment tensor elements Mij is taken for all of the Nev earthquakes located within the volume V, obtaining a cumulative seismic moment tensor representative of the seismic deformation occurring within V. This method can be applied to every volume, i.e., each seismic zone, for which earthquake moment tensors are available, which corresponds to 41 of the 50 source areas in our study (Table 1). In nos. 4 and 5 of the remaining nine areas, the summation cannot be done because only one event or no events with M≥4.5 are present (Table 1).
A sensitive parameter is the depth of the seismogenic layer we use in the summation for each zone. We already have indications from the values attributed to ZS16 seismic zones, but we also know that in some regions a change in the tectonic style with depth may occur, so we performed one test to find the most appropriate values. We calculated the cumulative seismic moment tensors, assuming different thicknesses (10, 20, and 30 km) of the volume V, which remains the same for all zones within each model (an example in Fig. 2). Comparing the results, we observed that in some zones the cumulative moment tensors are different when calculated using different thickness. An example is given by zone no. 19 in the northern Apennines, where a seismogenic layer of 10 km shows a purely extensional cumulative seismic moment tensor (Fig. 3), while a summation over a layer of 20 km produces a transpressive focal mechanism. The distribution with depth of the focal mechanism style of this part of the Apennines shows a prevailing presence of extensional earthquakes in the shallower part of the crust, while moving E–NE beneath normal sources, reverse and strike-slip focal mechanisms are the most frequent (see Sect. in Fig. 3). We schematically defined this behavior as a “tectonic layering”, and where we detected it in the three seismic zone nos. 19, 20, and 25, we proceed with a summation over two different layers, with thickness depending on the local seismicity distribution with depth (Table 1). For all the other zones, we used a 40 km thickness for conservative reasons to ensure the inclusion of all selected seismic events in our computation.
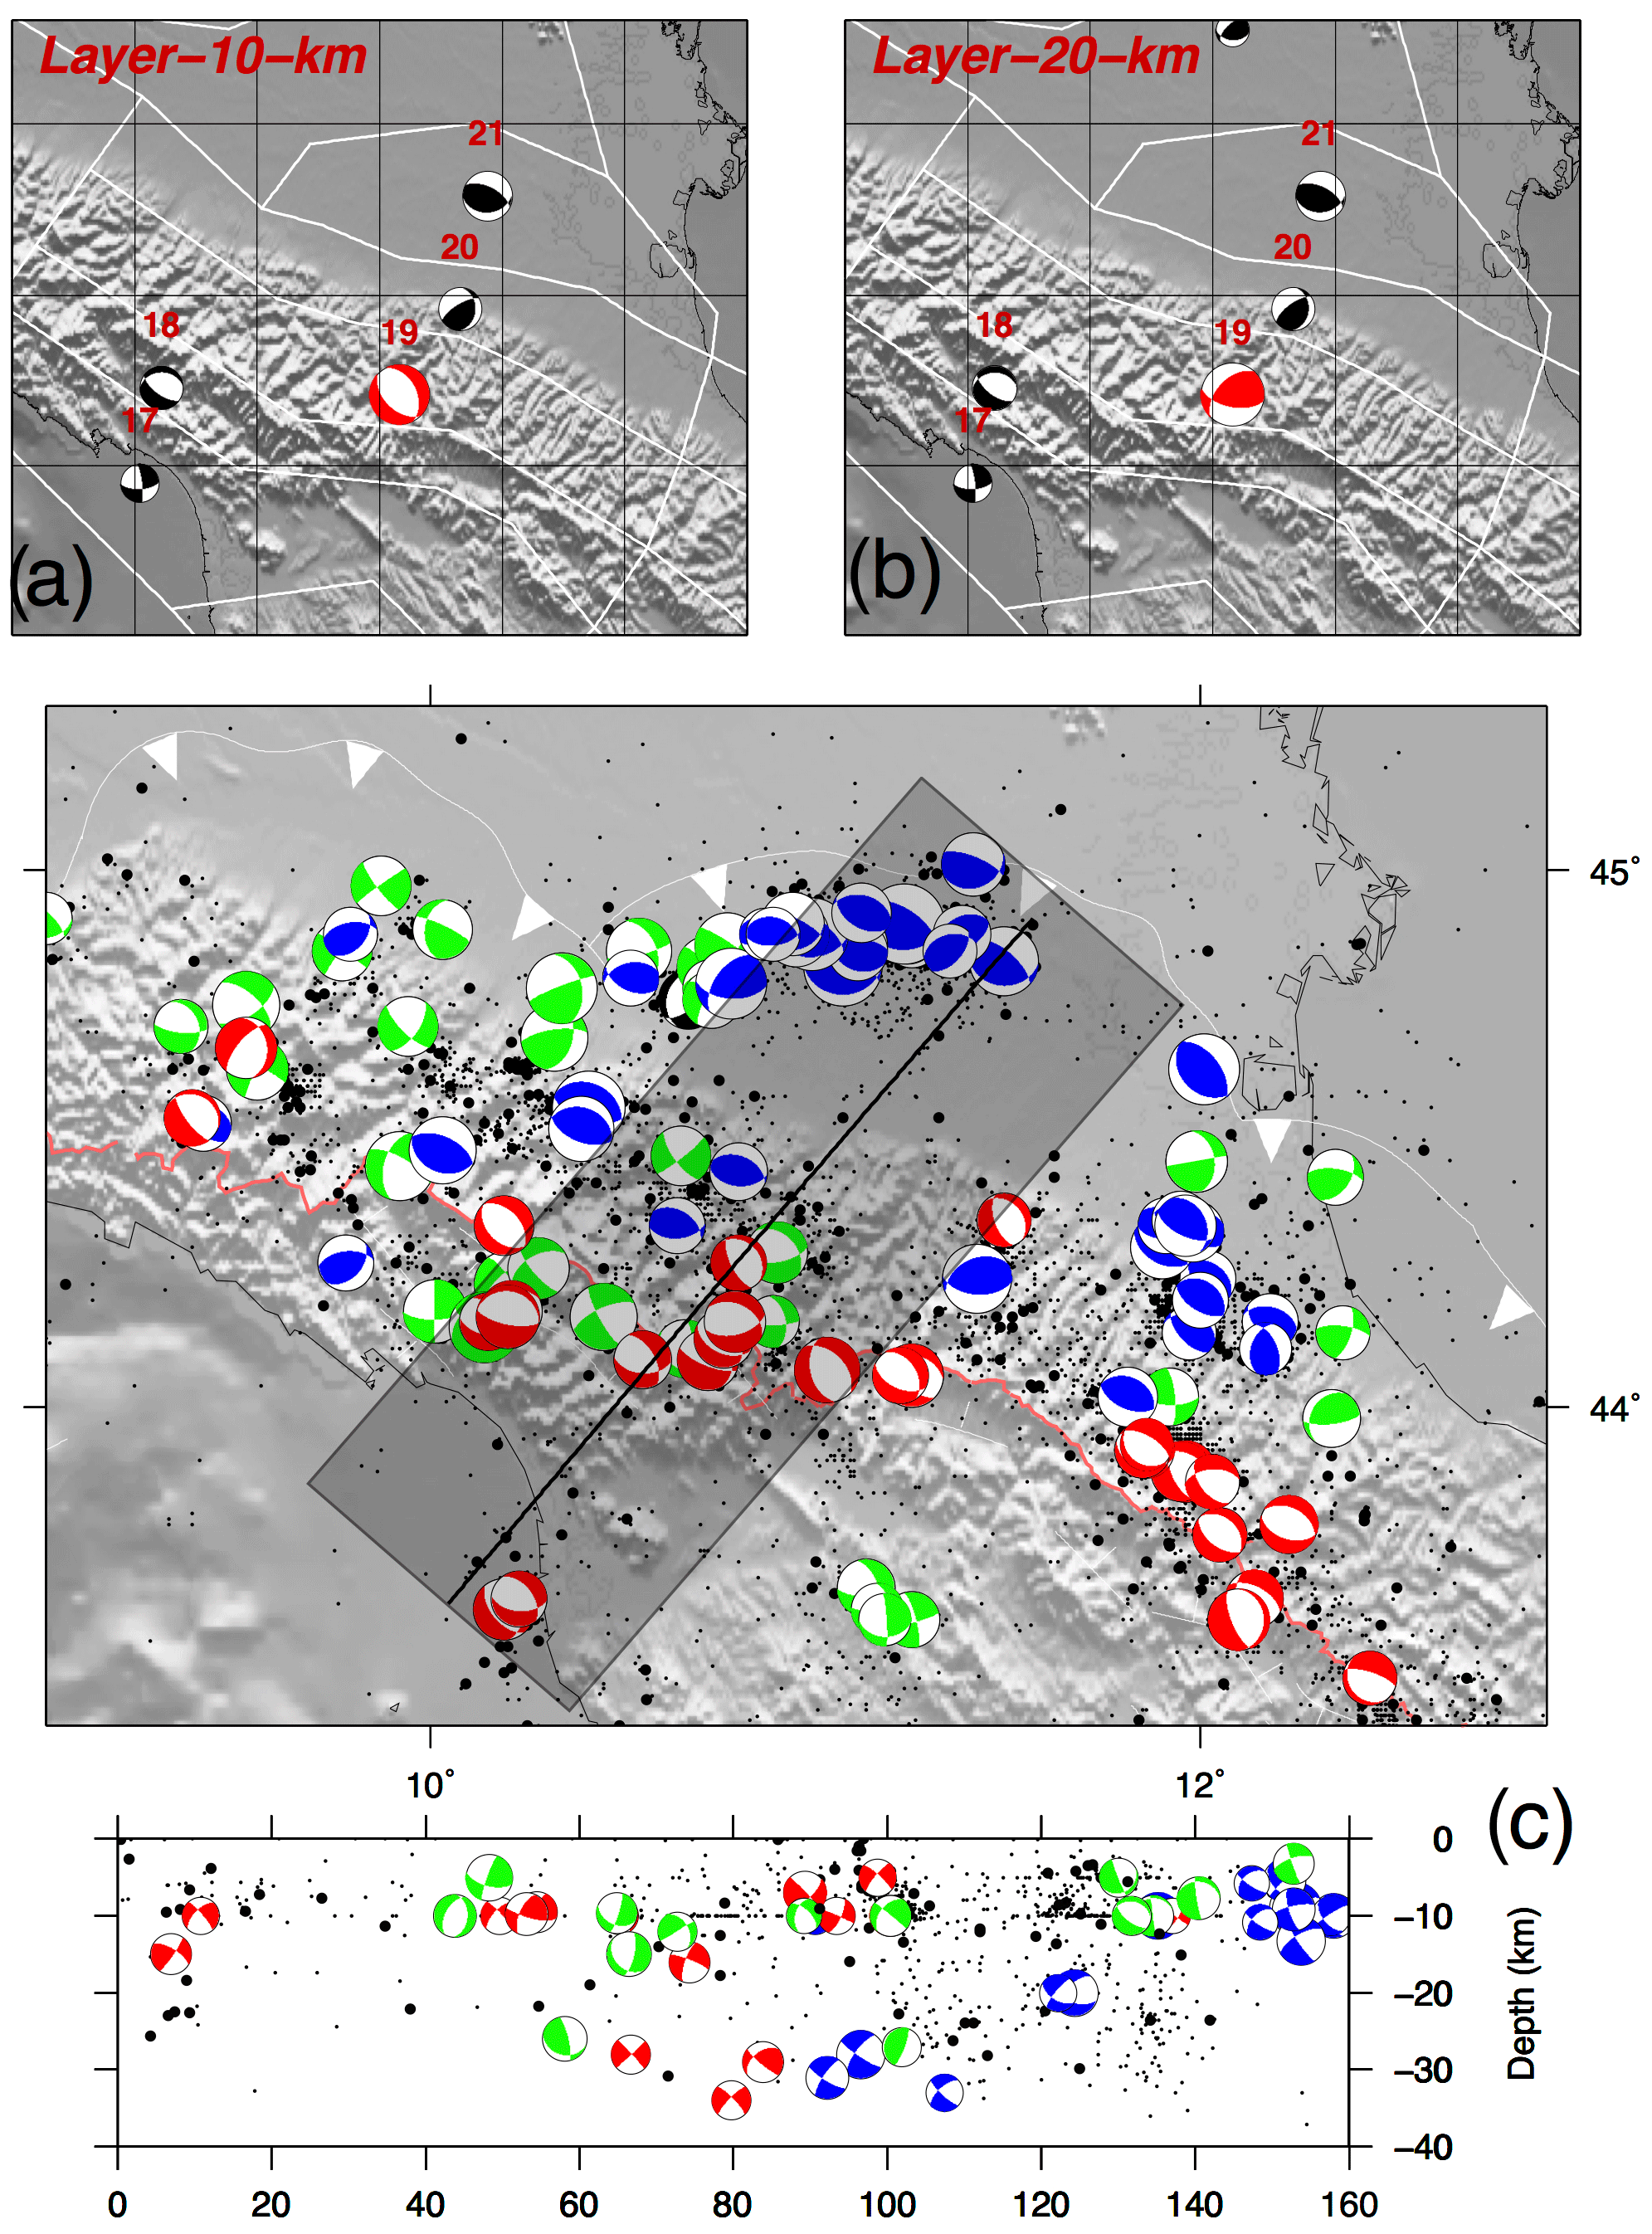
Figure 3(a, b) An example of tectonic style layering for seismic zone no. 19. The cumulative moment tensor obtained for 10 km of thickness shows a completely different result with respect to the one given by 20 km. Red numbers indicate the seismic zones. (c) Map and section of our dataset in the region of seismic zone no. 19; red, green, and blue focal mechanisms are respectively normal, strike-slip, and reverse. Seismicity in the background (black dots, smaller for events with M<3) is from the ISIDe Working Group (2007).
These summation tests allowed investigation of whether the summed solutions were representative of the kinematics of each zone and how the input dataset influences the robustness of the results. When the cumulative moment tensors were obtained by summing data for Nev≥3 and the input dataset was homogeneous concerning the tectonic style, the results were consistent with the tectonics of the region and thus considered representative (red focal mechanisms in Fig. 2). A good example is given by the eastern Alpine region, where for seismic zones 1, 2, and 3, reverse and strike-slip cumulative focal mechanisms sufficiently reflect the compressive active tectonics of the southern Alps and the strike-slip deformation which prevails to the east in the Dinaric chain. In contrast, when the cumulative moment tensor was the sum of three or fewer moment tensors (yellow focal mechanisms in Fig. 2) or it was obtained with more than three earthquakes but with the summation of a heterogeneous dataset (light blue focal mechanisms in Fig. 2), i.e., several focal mechanisms with different tectonic styles and/or very different directions of strike, dip, and rake, we considered the results insufficiently representative. This last case occurs mainly in seismic zones characterized by small- to moderate-magnitude earthquakes, or including seismotectonic structures with different orientations. An example is area source no. 11, which contains part of western Alps and the western Po Plain (Fig. 2), where most of the available focal mechanisms are strike-slip but with very different and scattered directions of the focal planes.
To reduce the quantity of such unreliable results that affect nearly half of the seismic zones, we implemented the following methodology. In each seismic zone we split the entire dataset into the three main tectonic styles following the rake-based criteria given in Akkar et al. (2014), which attribute each focal mechanism to either reverse, normal, or strike-slip. In particular, normal solutions have a rake between −135 and −45∘, reverse solutions between 45 and 135∘, and other rake values are classified as strike-slip.
We then applied the Kostrov summation over each homogenous – from the tectonic point of view – group of moment tensors having more than one earthquake. In Table 1 the results for each zone are reported (cumulative M0, strike, dip, and rake of the cumulative focal mechanism for each tectonic style).
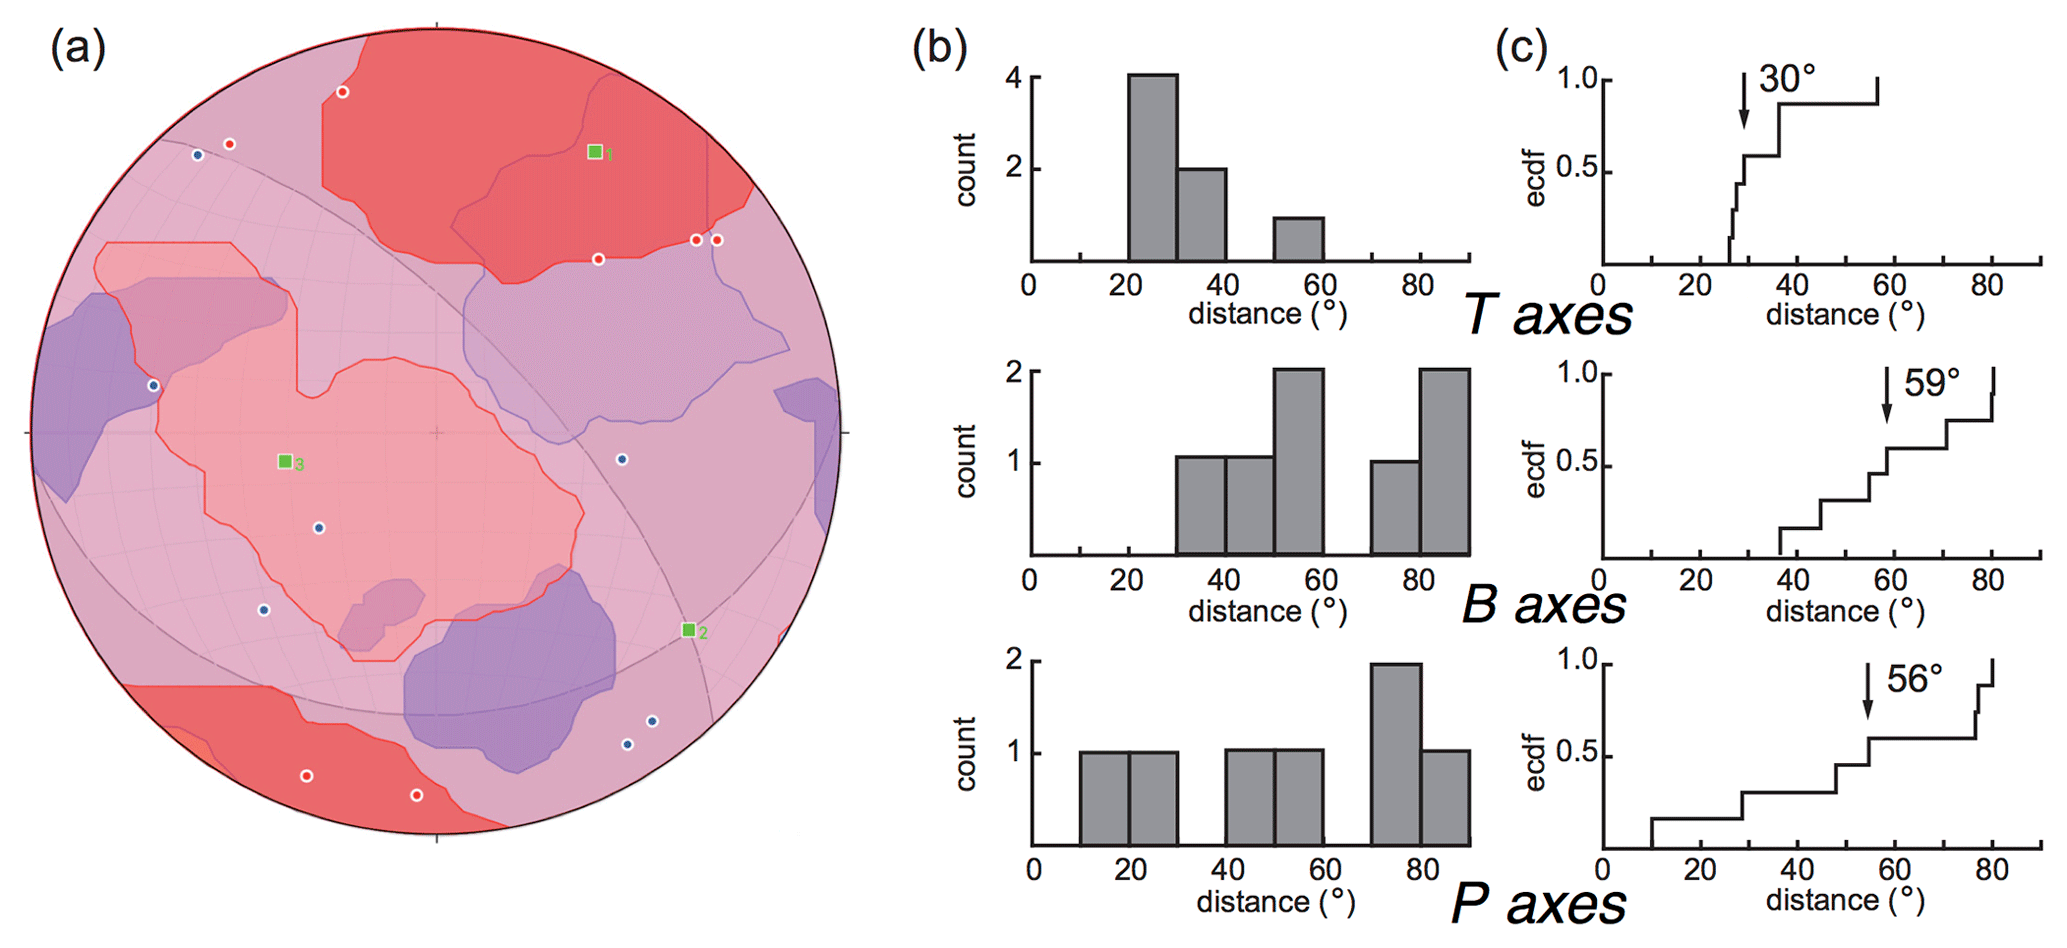
Figure 4An example of dispersion analysis for data of seismic zone no. 9. (a) The possible cumulative focal mechanism obtained with the summation of all focal mechanisms available for this zone, all strike-slip. Blue and red circles are the P and T axes of input focal mechanisms, and green symbols are the P, T, and B axes of the cumulative one; blue and red areas are P- and T-axis contours. (b) Histograms and (c) cumulative curve of the angular difference between T (top), B (middle), and P (bottom) axes of input and cumulative focal mechanisms. (c) Cumulative plots. Black arrows: median value.
We computed the dispersion of the P, T, and B axes of the input focal mechanisms with respect to the position of the P, T, and B axes of the cumulative moment tensor (Table 2). For example, as reported in Fig. 4, in source area no. 9 we have seven input data points; we computed the angular distance between the P, T, and B axes (red and blue points in Fig. 4a) and the axes of the cumulative focal mechanism (green symbols in Fig. 4a). The three median values of the angular distances of the three axes are a measure of how dispersed and heterogeneous the input data are and consequently the robustness of the obtained nodal plane distribution. The three median values are then used as a weighting factor for defining the final style of faulting for each zone.
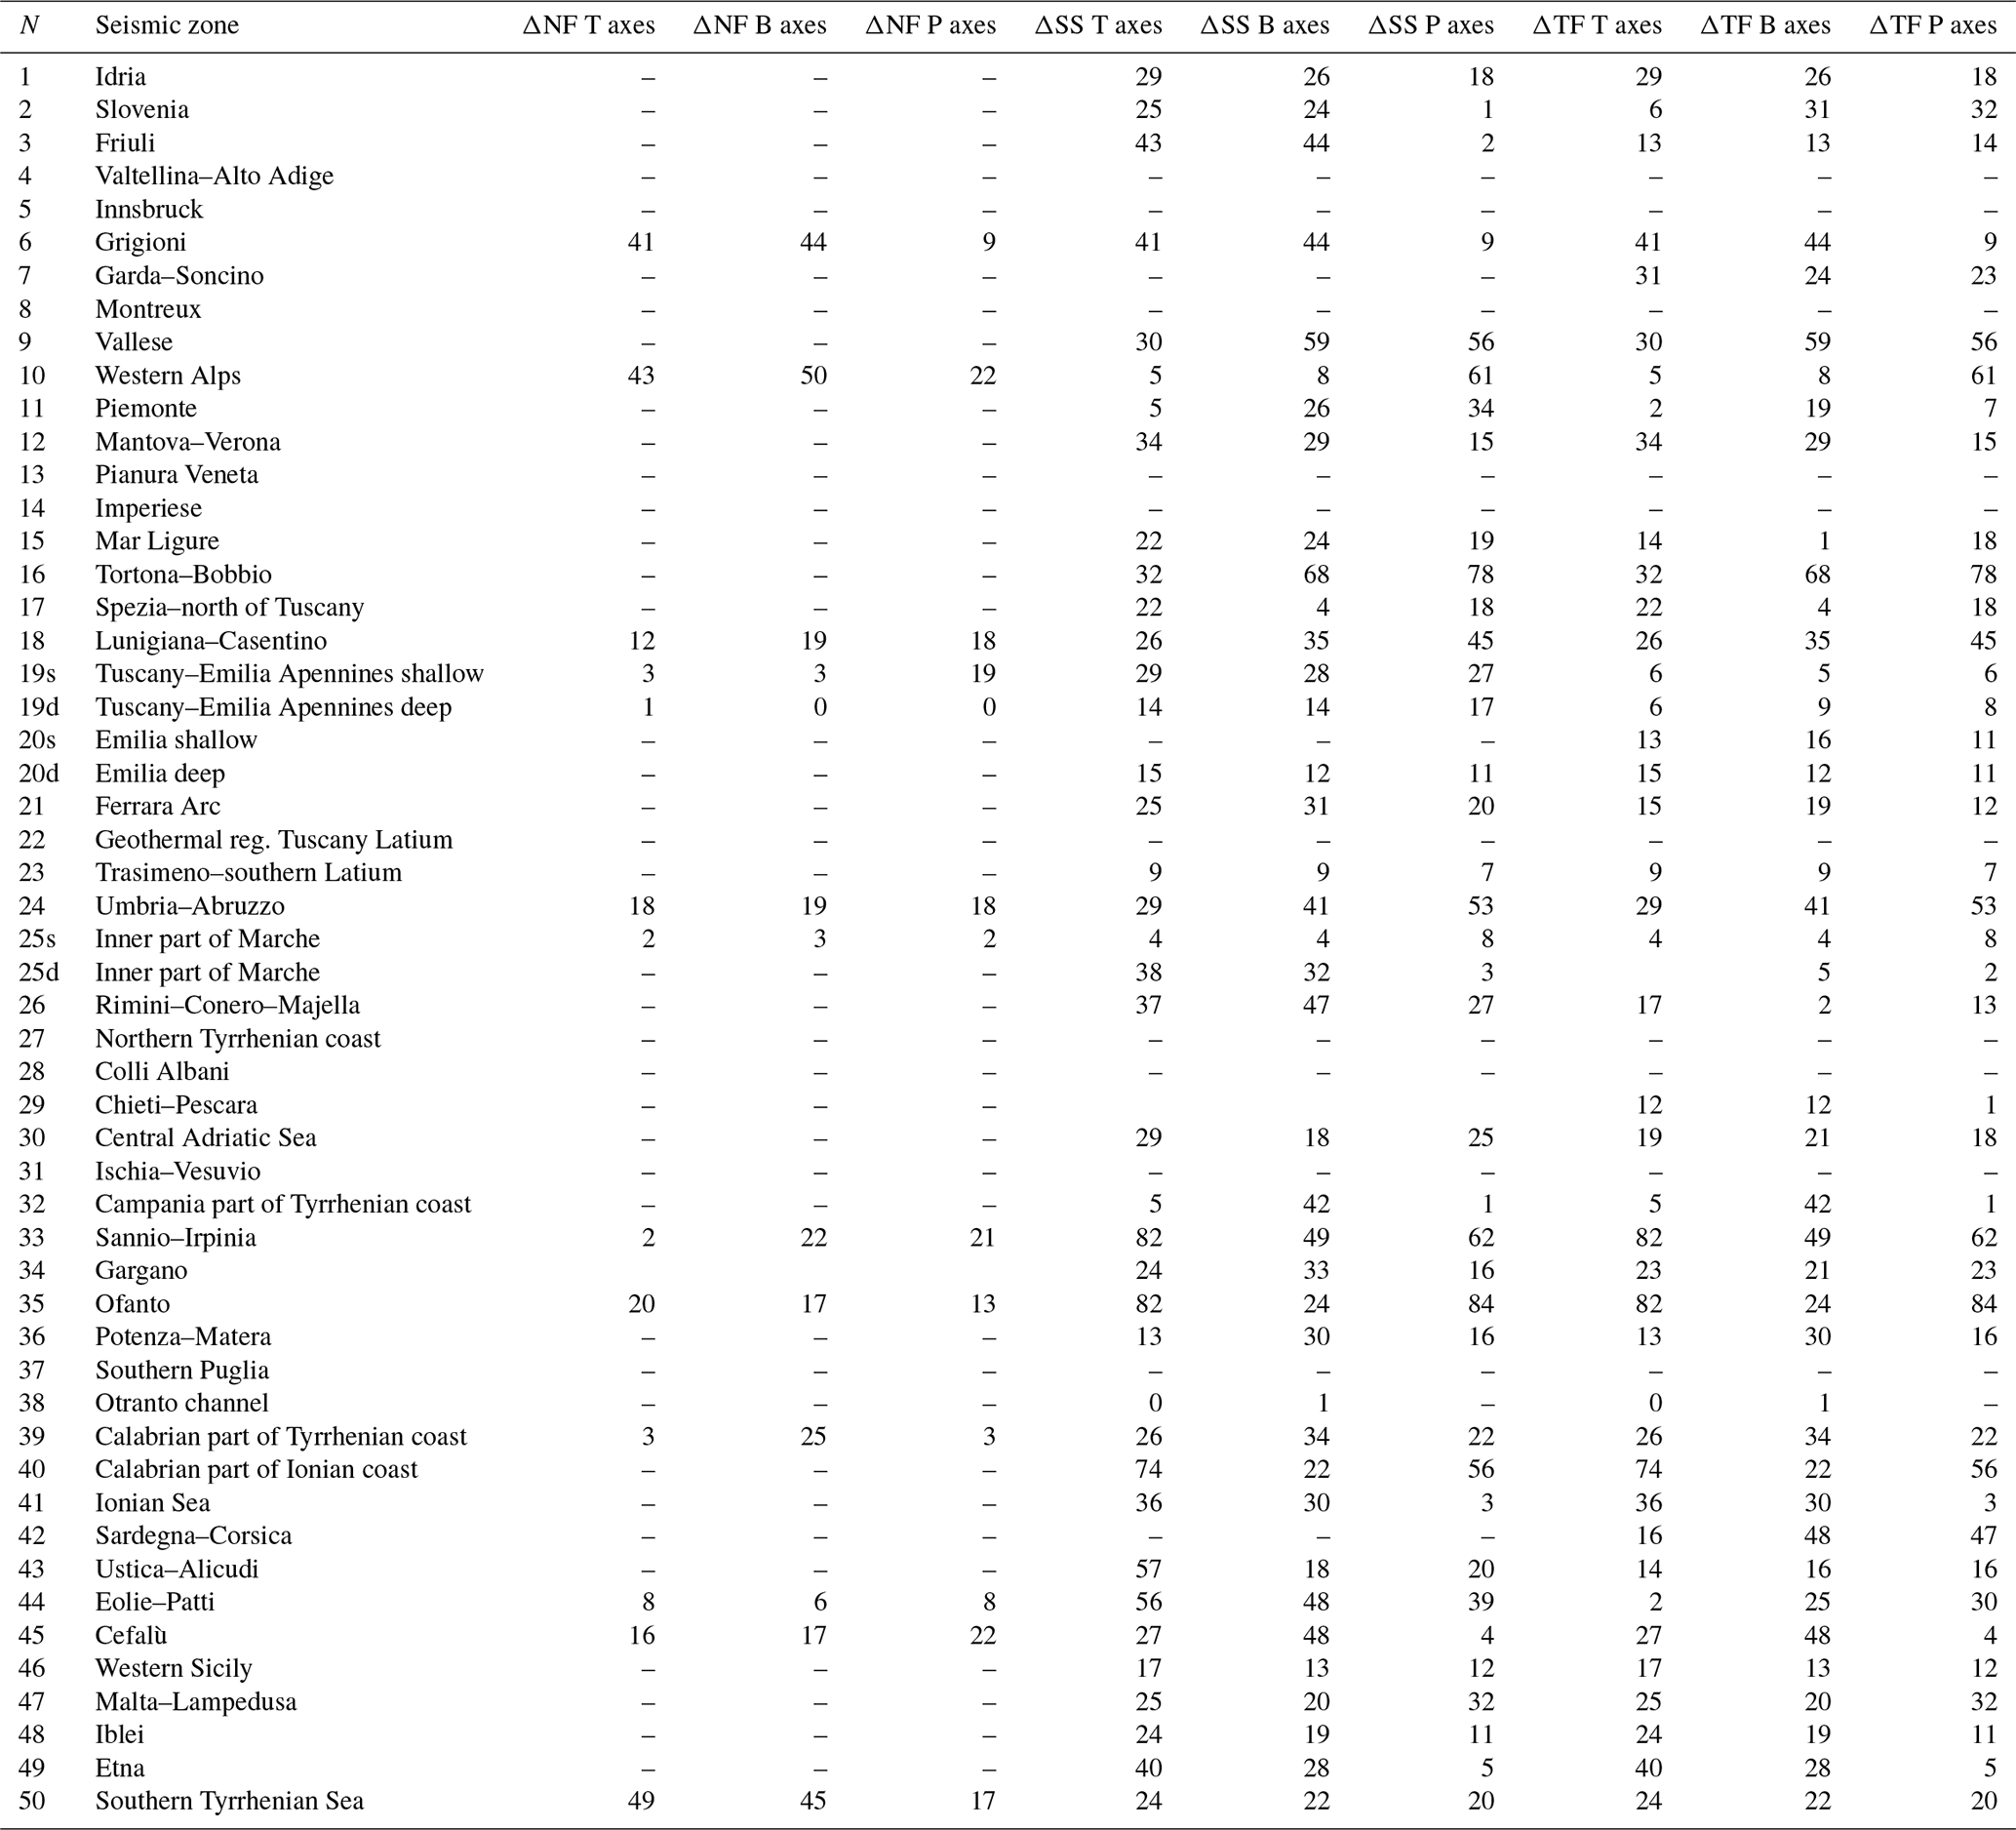
Table 2Results of the evaluation of P-, T-, and B-axis dispersion. In each column Δ is reported in degrees, i.e., the median of the angular differences between the axes of each single focal mechanism and the axes of the cumulative one (see Fig. 4).
To identify the representative style of faulting for each source zone, we used a procedure based on the following parameters:
-
Nev, the number of available focal mechanisms for each zone and for each tectonic style;
-
M0sum, the seismic moment obtained from the summation for each zone and tectonic style, in particular its percentage with respect to the M0Total, the total seismic moment for each seismic zone independently by the tectonic style (Table 3); and
-
the median of the angular distance between the P, T, B axes (Table 2) as a measure of data input dispersion.
Table 3Final style of faulting for each seismic zone, with the total number of focal mechanisms used, the total released seismic moment M0Total per zone, and the percentage of contribution of each tectonic style to the final source.
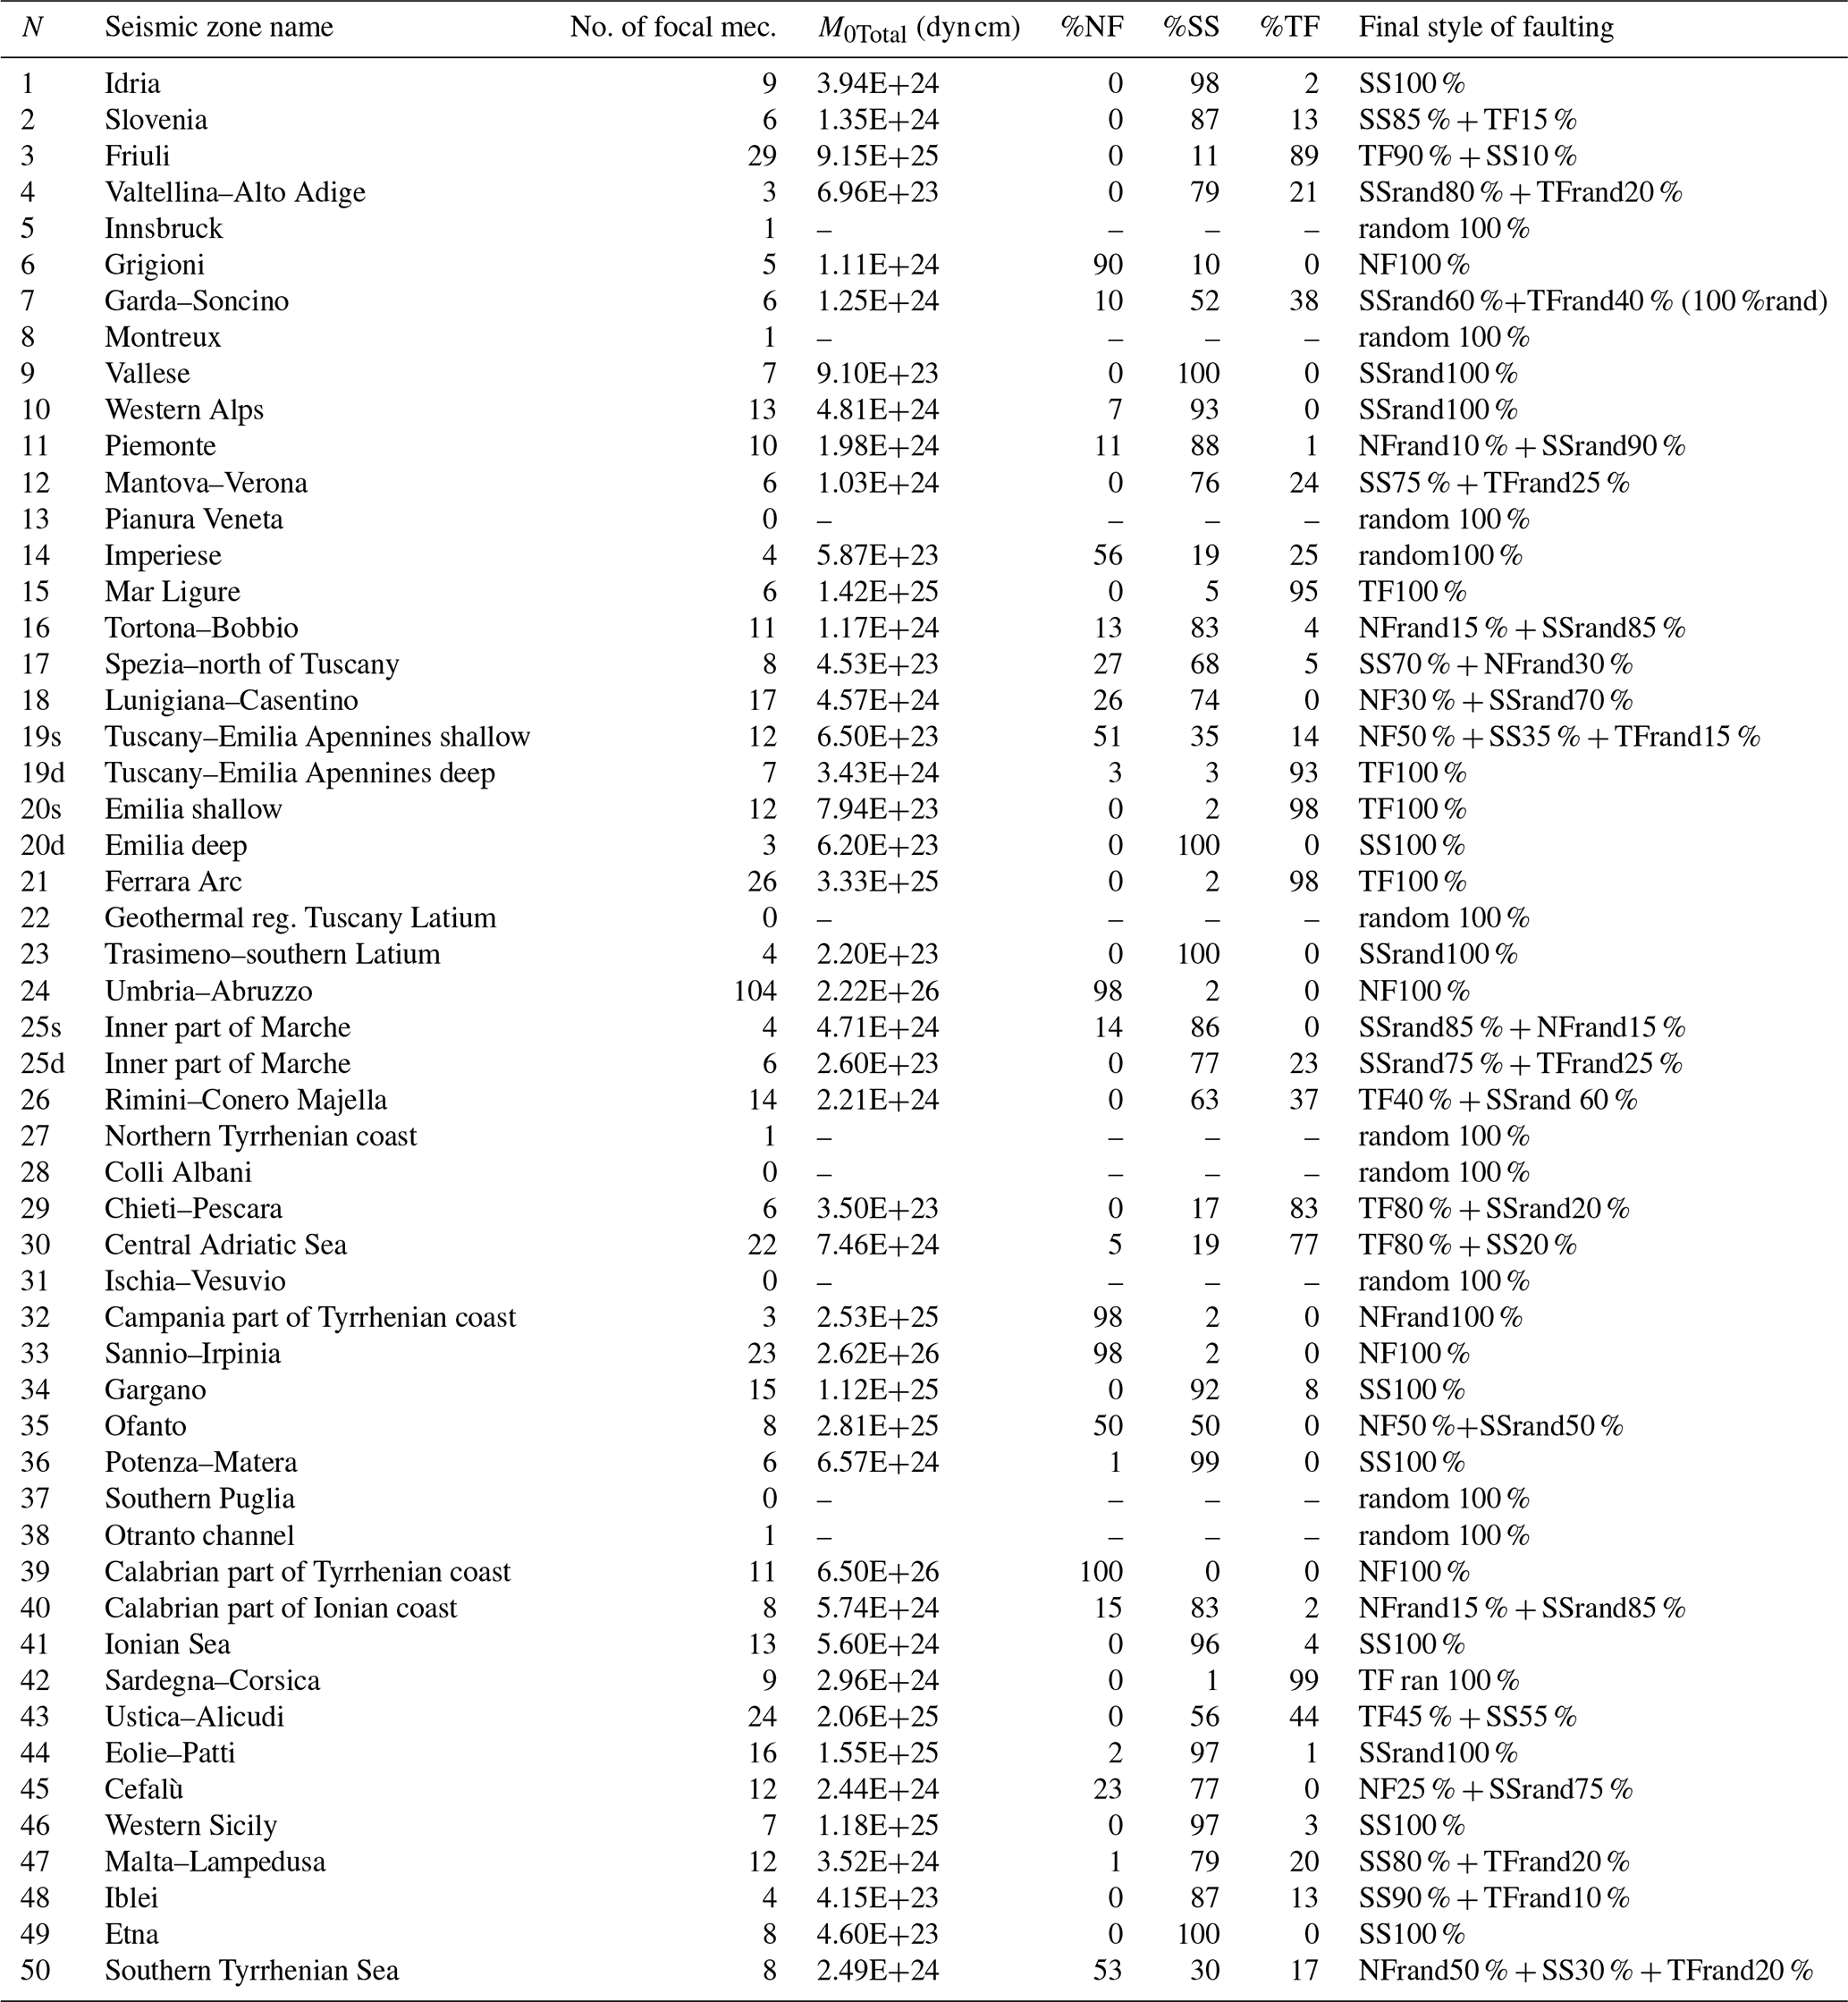
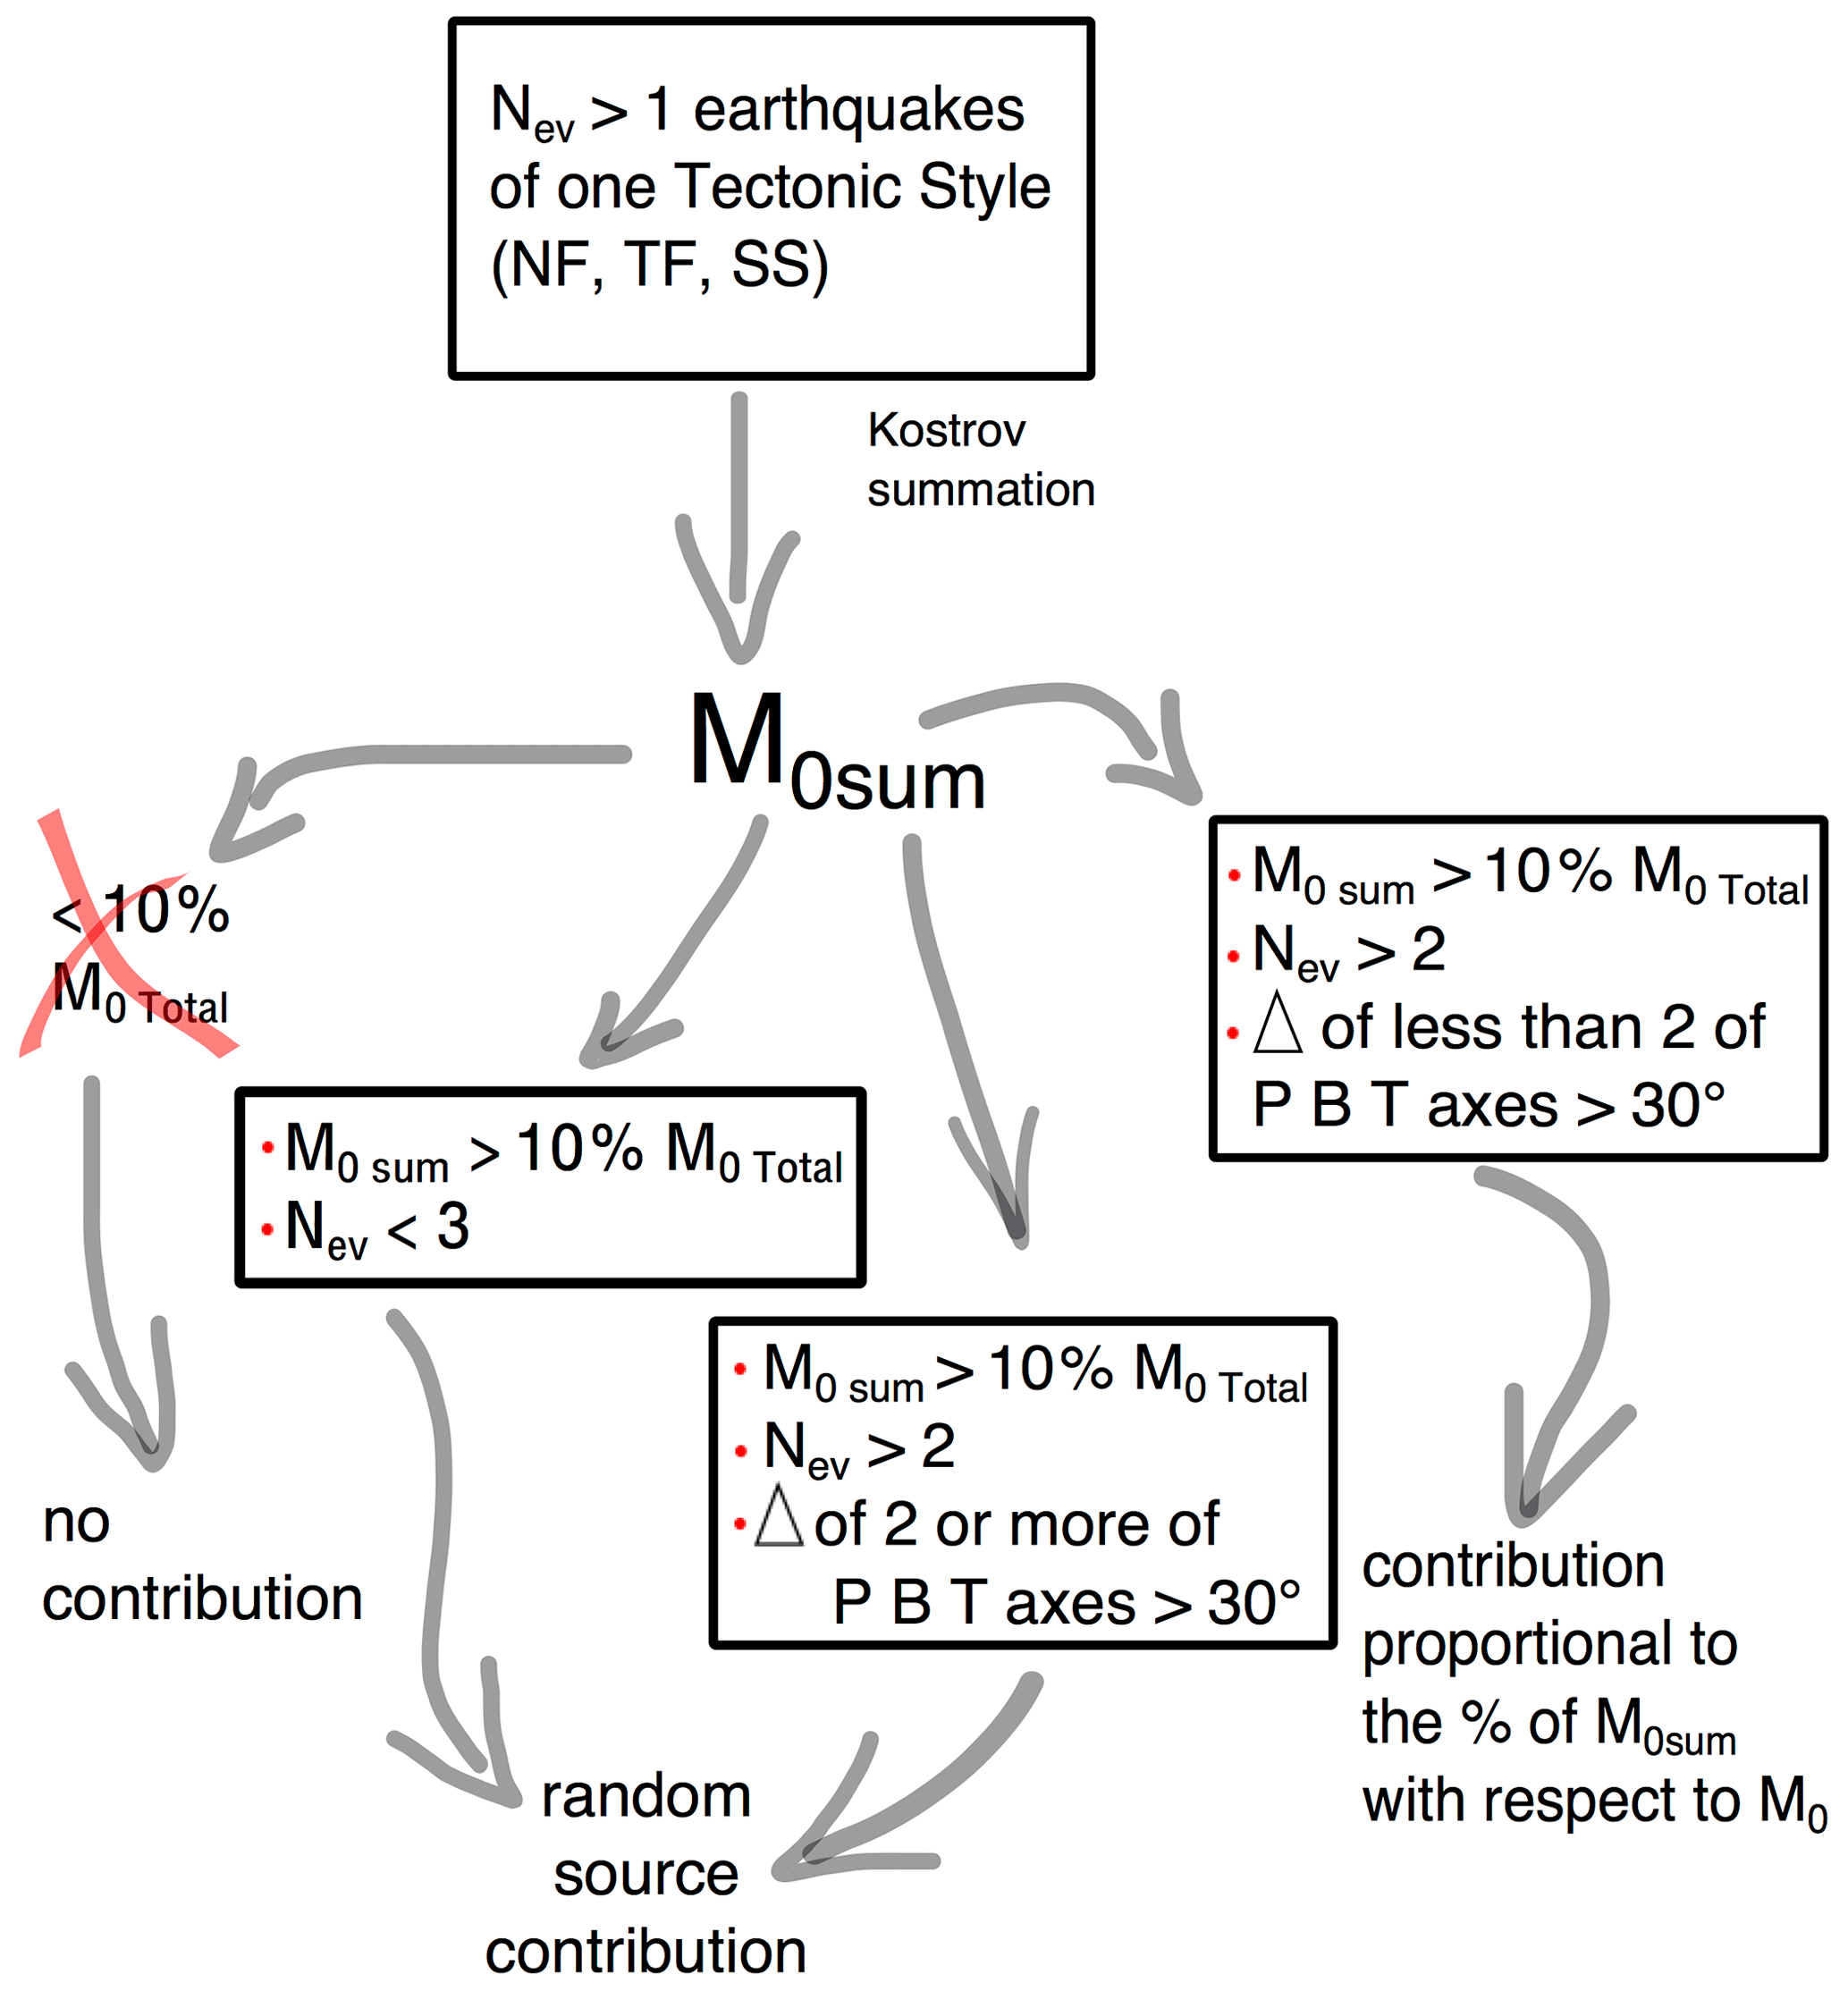
Figure 5Sketch of the decision-making process applied to each zone and to each tectonic style group of earthquakes. Nev is the number of available earthquakes; M0sum is the seismic moment obtained summing the NevM0; M0Total is the cumulative seismic moment release in the singular zone independently of the tectonic style of events; Δ is the angular distance between the P, T, and B axes of a single focal mechanism involved in the summation and those of the cumulative one.
The value of these parameters has been used to apply the following decision-making process, also sketched in Fig. 5:
- a.
in areas where no focal planes were available, we parameterized the less informative solution given by an equal contribution of normal, reverse, and strike-slip tectonic styles by adopting a uniform distribution of geometries (strike and dip) in the space, defining a 100 % random source;
- b.
if more than one event of the same tectonic style is located in an area, we identified the nodal planes and their contributions in terms of seismic moment M0. As a first step we summed the seismic moment tensors to obtain M0sum and a cumulative moment tensor, then we apply the following criteria.
-
If M0sum for a particular tectonic style is lower than 10 % of M0Total of the zone, we do not take that tectonic style into account in the final solution. For example, in zone no. 39, the strike-slip component is not included in the final result (Tables 1 and 3).
-
If M0sum of a single tectonic style is greater than 10 % of M0Total of the zone, but the number of summed earthquakes is lower than three, we kept this tectonic style in the final seismic source by adopting a uniform distribution of geometries (strike-dip) in the space with a fixed rake, also defined as a random component. An example is zone no. 12 (Tables 1 and 3), where the compressive contribution is included, defined as TFrandom, but modeled without preferred fault planes.
-
For each tectonic style of the zones with a contribution to M0sum greater than 10 % of M0Total obtained with more than two earthquakes, we measure the dispersion of the P, T, and B axes of the input focal mechanisms with respect to those of the cumulative moment tensor: if two or more of the three axes have a median of the angular differences greater than 30∘ (Table 2), we include this tectonic style but adopting a uniform distribution of geometries (random strike and dip) in the space with a fixed rake. An example is given by zone no. 9 where all data are strike-slip, but the analysis of the P-, T-, and B-axis distributions shows a dispersion larger than 30∘ for two of three axes (Fig. 4) and the final style of faulting is 100 % strike-slip random.
-
If the M0sum of a single tectonic style is greater than 10 % of the M0Total, obtained with more than two events and with the maximum of the median of the angular distances of the P, T, and B axes greater than 30∘, it contributes to the final solution proportionally to its percentage with respect to the M0Total. Moreover, the final focal mechanism is given by the cumulative one obtained by the Kostrov summation of available moment tensors of the single tectonic styles. An example is given by zone no. 43, where the final style of faulting is represented by 45 % reverse and 55 % strike-slip; strike, dip, and rake values reported in Table 3 for these final solutions originate from the cumulative moment tensors obtained by respectively summing the reverse and strike-slip input focal mechanisms.
-
Applying this decision-making process to all seismic zones, we defined an expected style of faulting for all of them, reported in Table 3 and Fig. 6.

Figure 6Map of the expected style of faulting obtained for each seismic zone. Full circles represent random seismic sources: white circles are 100 % random; blue, red, and green circles are reverse, normal, and strike-slip random sources, respectively. The same colors also refer to cumulative focal mechanisms. Focal mechanisms with a grey background or circles with darker colors represent the sources for deeper layers. Numbers in black are the percentages of contribution to the final source when it is composed of different styles.
In Fig. 6 and Table 3 the results of the applied decision-making process are shown. The variety of symbols and colors in Fig. 6 represents the complexity of the seismotectonics of the Italian peninsula and the attempt we made to take all of them into account, encountering all possible cases between the 100 % single tectonic style source and the 100 % random source.
In only 15 zones is the resulting focal solution 100 % of a single tectonic style, and often this occurs where severe earthquakes are located, as in zone no. 33, which includes the 1980 Irpinia Mw 6.9 event. On the other hand, in 10 seismic areas the final source is 100 % random due to the lack or scarcity of seismic events with M≥4.5, such as in zone nos. 27 and 31 along the Tyrrhenian coast and nos. 37 and 38 offshore of southern Puglia.
In several zones the final style of faulting is a partitioning between more than one tectonic style, with contributions defined by the percentage of the seismic moment M0sum of each tectonic style. For instance, in seismic zone no. 30 (central Adriatic Sea), the tectonic style of the final seismic source is 80 % compressive and 20 % strike-slip. The 5 % normal style is excluded because it does not reach the 10 % threshold (Fig. 5).
In some zones, the final style of faulting has a percentage of uniform distribution of geometries (strike-dip) in the space, which for the sake of simplicity we defined as a random component, namely NFrandom, TFrandom, or SSrandom (Table 3). This means that when a tectonic style can be used only as a constraint, only the rake is fixed. In seismic area no. 29 we defined a final style of faulting composed of 80 % reverse tectonic type and 20 % random strike-slip, i.e., a strike-slip mechanism with a uniformly distributed value for strike and dip and a fixed rake.
Another case is represented by zones where the final source is given by different percentages of more than one tectonic style, all random. For instance, in zone no. 40, the Ionian Sea side of the Calabria region, the final result is a combination of 15 % extensional random and 85 % strike-slip random. These kinds of results occur mainly where the input dataset shows large dispersion and heterogeneity in input focal plane directions. For instance, in the NW of Italy, in seismic zone nos. 9, 10, and 11 (Table 3), the final style of faulting we propose is a uniform distribution of strike-slip geometries derived from several earthquakes located in the area, mostly strike-slip, but without any prevailing direction for the strike of focal planes.
A tectonic layering has been identified in three seismic zones, nos. 19, 20, and 25, so we defined a style of faulting for both a shallow and a deep seismogenic layer (the latter is represented in Fig. 6 by focal mechanisms with a grey background or with circles with darker colors). Seismic zone no. 19s, for instance, has a final source composed of 50 % normal, 35 % strike-slip, and 15 % compressive random; the final result for the deep layer (19d in Table 3, hypocentral depth between 15 and 40 km) is a 100 % reverse style of faulting.
We propose a set of criteria to select focal mechanisms for the definition of the style of faulting in area source models, and we apply them to the ZS16 seismotectonic zoning (Meletti et al., 2019). Results are shown in Fig. 6 and listed in Table 3. We are confident in our results for several reasons.
First, the style of faulting defined for each zone using our decision-making process is in agreement with other geological (DISS Working Group, 2018) and geodetic data (Serpelloni et al., 2005; Devoti et al., 2017). For instance, the normal tectonics that characterize the Apennines are confirmed in all the seismic zones that concern the highest part of the belt. The normal tectonic style changes to compressive and/or strike-slip moving towards the Adriatic side or with depth. For example, two of the three zones where a variation of the tectonic style with depth has been detected show a prevailing extensional regime at shallow depth and a deeper reverse and/or strike-slip tectonic type. For the Alpine region, the western part of the belt presents more uncertain results due to the characteristics of the seismicity, usually characterized by small to moderate magnitude; in the eastern Alps our results are completely in agreement with the active deformation field, with compressive to transpressive tectonics of the southern Alps and Dinarides.
Secondly, from a qualitative point of view, we observed general agreement between our results and those in Roselli et al. (2017) (who used a different approach), with major differences along the boundary between areas that in Roselli et al. (2017) are characterized by lateral changes in tectonic regimes. Roselli et al. (2017) smoothed their dataset over a regular 0.1∘ grid and did not take into account the possible variability of the prevailing tectonic styles with depth. It is worth noting that the regions where we differ with Roselli et al. (2017) are where we detected a variation in the style of faulting with depth and thus used a 3-D approach. For instance, in the northern Apennines we obtain an opposite style of faulting at different depths, as in zone no. 19, where the shallow solution is mainly a normal type while, at depth it is reverse. Modeling earthquake occurrence in this region, the definition of the hypocentral depth makes a difference; if we model a seismic event deeper than 15 km beneath zones 19 or 20, we should assume a mainly reverse style of faulting and therefore a GMPE different from the one to be used if the earthquake were shallower, i.e., if it had a normal style of faulting.
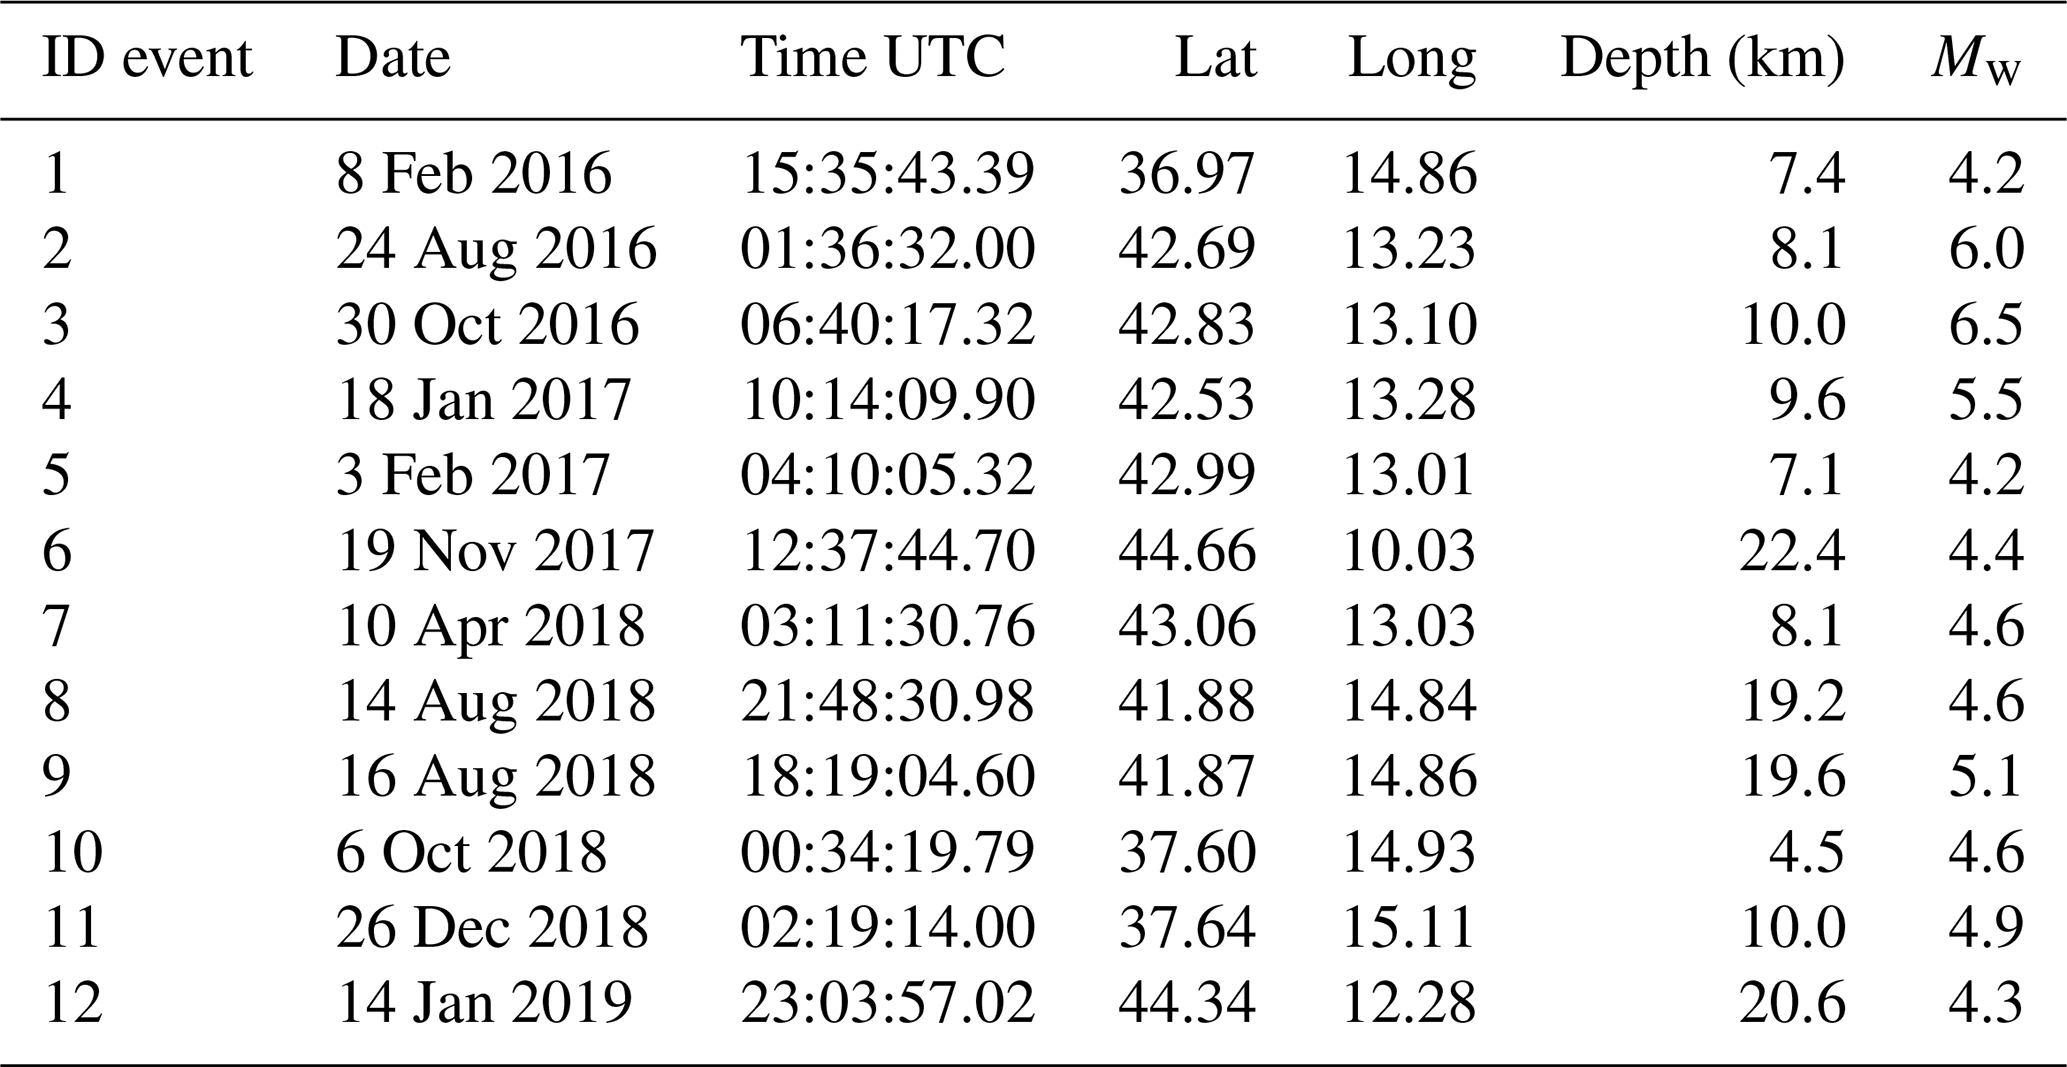
To further evaluate when our results are reliable indicators of the style of faulting of expected earthquakes, we compared them with recent earthquakes. For this exercise, the input dataset includes only events before 2015 to allow the seismicity recorded afterwards, including the 2016/17 central Italy seismic sequence, to be used for a comparison test. Selecting from the INGV Italian Seismological Instrumental and Parametric Database (ISIDe Working Group, 2007) all M≥4.5 shallow earthquakes (less than 40 km hypocentral depth) that occurred between January 2016 and August 2019, we obtain the list of earthquakes reported in Table 4. We also included four events with magnitudes of 4.2–4.4 to increase the number of case studies. For all these recent earthquakes, the corresponding seismic moment tensors have been extracted from the European Mediterranean RCMT Catalog (Fig. 7). For earthquakes belonging to the central Italy seismic sequence, we selected the largest ones only: 24 August 2016, Mw 6.0; 30 October, Mw 6.5; and 18 January 2017, Mw 5.5. The focal mechanisms of these three earthquakes agree with the 100 % normal style of faulting we computed for seismic zone no. 24 (Fig. 7c). Another correspondence is found in the northern Apennines, where an event with hypocentral depth below 15 km (Fig. 7a, event no. 6 in Table 4) in the lower layer of seismic zone no. 19 shows close similarity to the style of faulting defined for the area. Good agreement is found for the event located at the border of seismic zone no. 21, where both the expected and observed style of faulting are purely reverse (Fig. 7a, event no. 12 in Table 4). The same applies to the two strike-slip events that occurred in the summer of 2018 in seismic zone no. 34, both showing a strong coherence with the expected style of faulting (Fig. 7c, event nos. 8 and 9 in Table 4). In Sicily, all recent earthquakes show a strike-slip focal mechanism, in agreement with our results (Fig. 7b).
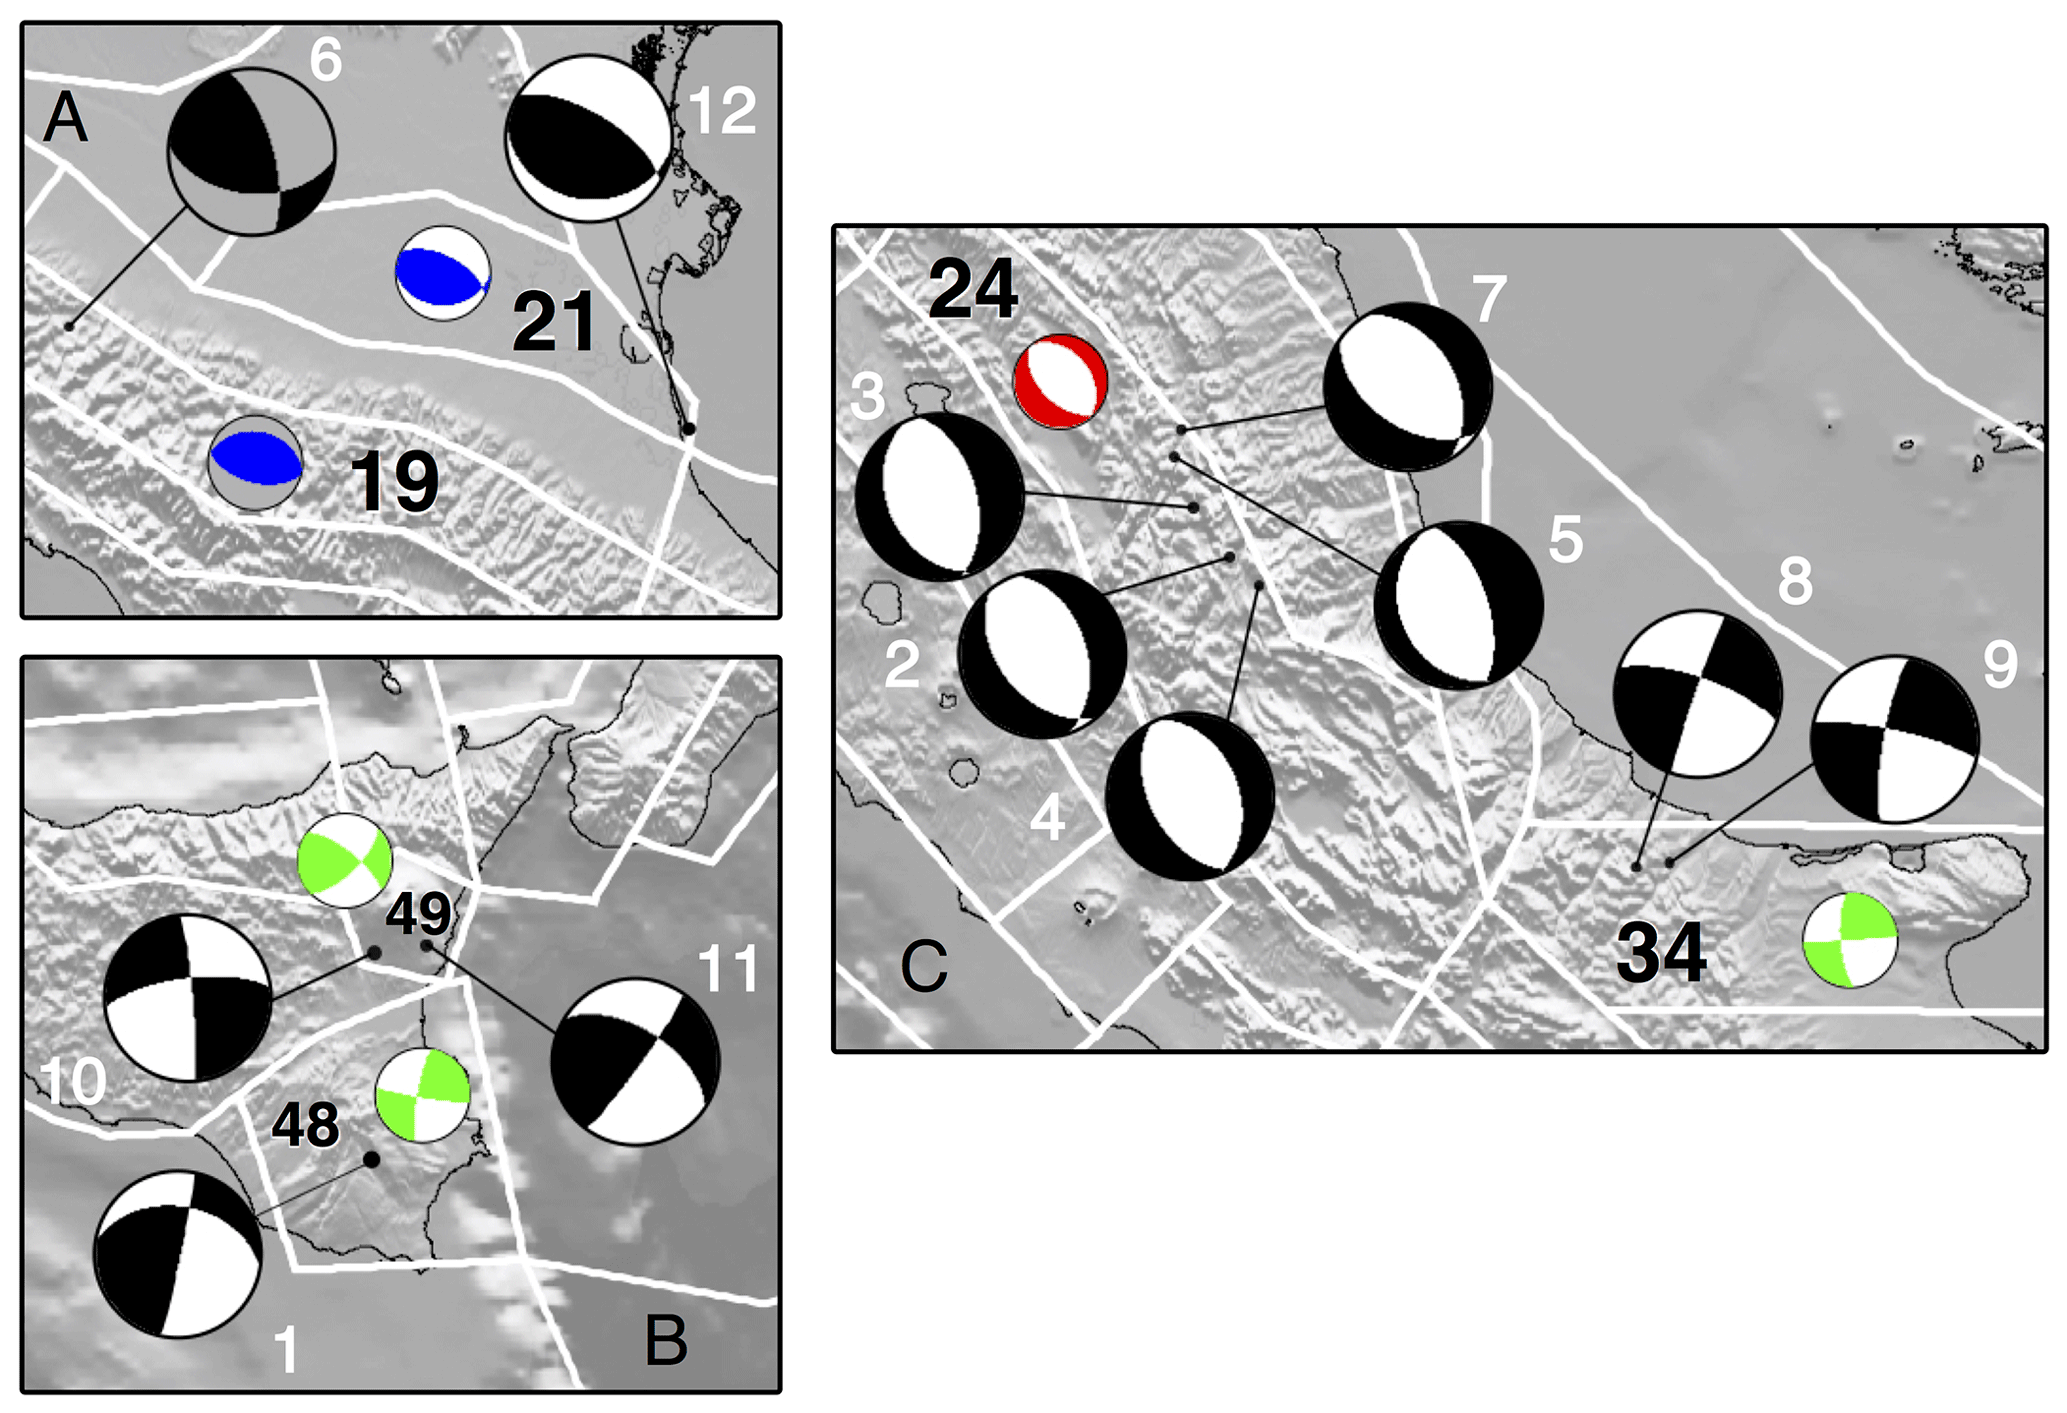
Figure 7Comparison of seismic moment tensors of earthquakes that occurred after 2015 (in black, see Table 4) and the expected style of faulting identified in the same seismic zone (for colors see Fig. 6): (a) northern Apennines; (b) eastern Sicily; (c) central and southern Apennines. Focal mechanisms with a grey background are associated with deeper sources. Black numbers indicate the seismic zones, while white numbers refer to the seismic events listed in Table 4.
Table 4List of earthquakes occurring after 2015 used in the comparison with the results of this study and mapped in Fig. 7.
In conclusion, recent earthquakes provide a positive test of our results, also in areas characterized by variations of the style of faulting with depth, such as in the northern Apennines.
The methodology we proposed to calculate the style of faulting in a seismic zone model is based on the selection of input data (focal mechanisms) aimed to ensure the following: (i) representativeness of the observed kinematics expected to occur in the future; (ii) summation of focal mechanisms representative of similar styles of faulting; and (iii) the control of the dispersion of the nodal planes before their summation with respect to the cumulative one. The described procedure can be exported to any area-source-based model, as it represents a data-driven approach, with subjectivity restrained to define the threshold for dispersions of the input focal mechanisms.
Ultimately, we defined the tectonic style of faulting of possible expected earthquakes for each seismic zone of the seismogenic area source model ZS16 (Meletti et al., 2019).
In Fig. 6, which shows a map of the final results, the various symbols reflect all the different situations we detected and mirror the seismotectonic complexities we took into account even in a simplified seismic zone model. Overall, in the Alps a compressive regime is found in the eastern part of the belt (zone nos. 1, 2, 3), mixed in a different percentage with a strike-slip style of faulting moving toward the Dinaric chain to the east. The rest of the Alps show examples of all the possible styles of faulting with different percentages of random sources, sometimes entirely random (e.g., zone nos. 6, 8, 14) and sometimes a combination of different quantities of single tectonic style random sources (e.g., zone no. 11); this is mainly due to the seismicity of the western and central Alps characterized by only small to moderate events.
In our results the expected normal regime dominating the Apennines is confirmed all along the watershed (zone nos. 18, 19, 24, 33, 39, 45) following the typical tectonic style of the seismic sequences that occurred in this narrow zone over the last decades, i.e., from north to south the 1997/98 in Umbria–Marche, the 2016/17 in central Italy, the 2009 in L'Aquila, and the 1980 Irpinia earthquakes. In the outer part of the Apennines the style of faulting changes with depth and, moving to the east, to a reverse regime sometimes mixed with a strike-slip style, as in zone nos. 21, 26, 29, 34, and 36. The 3-D approach we applied allowed the detection of the transition from a normal to reverse style of faulting with depth along the northern and central Apennines without the abruptness of this transition given by a 2-D approach only.
Along the peninsula, few seismic zones have a final 100 % random source result, and this occurs where the seismicity is really scarce with small to moderate earthquakes (zone nos. 22, 27, 28, 31, 37, and 38).
The seismic zones where a strike-slip style of faulting dominates are in eastern Sicily from the Aeolian Islands to the Etna volcano toward the south up to the Iblei mountains (zone nos. 44, 49, 48); this is not surprising considering that this N–S narrow band is interpreted as the transfer zone between the Calabrian Arc subduction system and the Sicily continental environment.
The robustness of these results is confirmed by their correspondence to the geological models and by the good comparison made with the most recent earthquakes that occurred in Italy, independently of their magnitudes. Finally, these results are in use in the recent elaboration of a new seismic hazard model for Italy.
The dataset of focal mechanisms used for this study is included in the Supplement (see below). All results and data used to obtain them are reported in the tables in the text.
Table 1_Supplement – Depth parameters used for ZS16 seismic zones. Table 2_Supplement – Dataset used in this study, gathering all seismic moment tensors used in this work, also including single earthquake information. The supplement related to this article is available online at: https://doi.org/10.5194/nhess-20-3577-2020-supplement.
SP wrote half of the paper, collected the focal mechanism dataset, and performed the comparison with recent seismicity. FV designed the decision-making process and computed statistic parameters. BP, AR, CM, and VD wrote the paper and contributed to the quality check of the dataset, the first trial results, and the discussion and conclusions.
The authors declare that they have no conflict of interest.
This paper describes one of the many products released in the framework of the Dipartimento Protezione Civile (DPC)–INGV Seismic Hazard Center (Centro Pericolosità Sismica, CPS) agreement for producing MPS19, the new seismic hazard model of Italy. This paper does not necessarily represent DPC official opinions and policies. The authors want to thank Joanna Faure Walker for the careful reading of the paper. All maps have been plotted using the GMT mapping tool (Wessel and Smith, 1998). The Fig. 4a plot was produced using FaultKin 7.7.4 (Marrett and Allmendinger, 1990; Allmendinger et al., 2012).
This research has been supported by the Italian Presidenza del Consiglio dei Ministri–Dipartimento della Protezione Civile (DPC).
This paper was edited by Filippos Vallianatos and reviewed by two anonymous referees.
Allmendinger, R. W., Cardozo, N., and Fisher, D.: Structural geology algorithms: Vectors and tensors in structural geology, Cambridge University Press, 302 pp., 2012.
Anzidei, M., Maramai, A., and Montone, P. (Eds.): The Emilia (northern Italy) seismic sequence of May–June 2012: preliminary data and results, Ann. Geophys., 55, 4, 515–842, https://doi.org/10.4401/ag-6232, 2012.
Akkar, S., Sandıkkaya, M. A., and Bommer, J. J.: Empirical ground-motion models for point- and extended-source crustal earthquake scenarios in Europe and the Middle East, B. Earthq. Eng., 12, 359–387, https://doi.org/10.1007/s10518-013-9461-4, 2014.
Bernardi, F., Braunmiller, J., Kradolfer, U., and Giardini, D.: Automatic regional moment tensor inversion in the European-Mediterranean region, Geophys. J. Int., 157, 703–716, 2004.
Bindi, D., Pacor, F., Luzi, L., Puglia, R., Massa, M., Ameri, G., and Paolucci, R.: Ground motion prediction equations derived from the Italian strong motion database, B. Earthq. Eng., 9, 1899–1920, https://doi.org/10.1007/s10518-011-9313-z, 2011.
Bindi, D., Massa, M., Luzi, L., Ameri, G., Pacor, F., Puglia, R., and Augliera, P.: Pan-European ground-motion prediction equations for the average horizontal component of PGA, PGV, and 5 %-damped PSA at spectral periods up to 3.0 s using the RESORCE dataset. B. Earthq. Eng., 12, 391–430, https://doi.org/10.1007/s10518-013-9525-5, 2014.
Bommer, J. J., Douglas, J., and Strasser, F. O.: Style-of-Faulting in Ground-Motion Prediction Equations, B. Earthq. Eng., 1, 171–203, https://doi.org/10.1023/A:1026323123154, 2003.
Chiarabba, C., De Gori, P., Cattaneo, M., Spallarossa, D., and Segou, M.: Faults geometry and the role of fluids in the 2016–2017 Central Italy seismic sequence, Geophys. Res. Lett., 45, 6963–6971, https://doi.org/10.1029/2018GL077485, 2018.
Devoti, R., D'Agostino, N., Serpelloni, E., Pietrantonio, G., Riguzzi, F., Avallone, A., Cavaliere, A., Cheloni, D., Cecere, G., D’Ambrosio, C., Falco, L., Selvaggi, G., Métois, M., Esposito, A., Sepe, V., Galvani, A., and Anzidei, M.: A Combined Velocity Field of the Mediterranean Region. Ann. Geophys., 60, 1–16, https://doi.org/10.4401/ag-7059, 2017.
DISS Working Group: Database of Individual Seismogenic Sources (DISS), Version 3.2.1: A compilation of potential sources for earthquakes larger than M 5.5 in Italy and surrounding areas, Istituto Nazionale di Geofisica e Vulcanologia, https://doi.org/10.6092/INGV.IT-DISS3.2.1, 2018.
Dziewonski, A. M., Chou, T.-A., and Woodhouse, J. H.: Determination of earthquake source parameters from waveform data for studies of global and regional seismicity, J. Geophys. Res., 86, 2825–2852, https://doi.org/10.1029/JB086iB04p02825, 1981.
Ekström, G., Nettles, M., and Dziewonski, A. M.: The global CMT project 2004–2010: Centroid-moment tensors for 13,017 earthquakes, Phys. Earth Planet. In., 200–201, 1–9, https://doi.org/10.1016/j.pepi.2012.04.002, 2012.
Pondrelli, S.: European-Mediterranean Regional Centroid-Moment Tensors Catalog (RCMT) [Data set], Istituto Nazionale di Geofisica e Vulcanologia (INGV), https://doi.org/10.13127/rcmt/euromed, 2002.
Galadini, F. and Galli, P.: The Holocene paleo-earthquakes on the 1915 Avezzano earthquake faults (central Italy): implications for active tectonics in the central Apennines, Tectonophysics, 308, 143–170, 1999.
Gasperini, P., Lolli, B., and Vannucci, G.: Relative frequencies of seismic main shocks after strong shocks in Italy, Geophys. J. Int., 207, 150–159, https://doi.org/10.1093/gji/ggw263, 2016.
ISIDe Working Group: Italian Seismological Instrumental and Parametric Database (ISIDe), Istituto Nazionale di Geofisica e Vulcanologia (INGV), https://doi.org/10.13127/ISIDE, 2007.
Kostrov, V. V.: Seismic moment and energy of earthquakes and seismic flow of rocks, Izv. Acad. Sci. USSR Phys. Solid Earth, 1, 23–40, 1974.
Loreto, M. F., Fracassi, U., Franzo, A., Del Negro, P., Zgur, F., and Facchin, L.: Approaching the seismogenic source of the Calabria 8 September 1905 earthquake: New geophysical, geological and biochemical data from the S. Eufemia Gulf (S Italy), Mar. Geol., 343, 62–75, https://doi.org/10.1016/j.margeo.2013.06.016, 2013.
Marchetti, A., Ciaccio, M. G., Nardi, A., Bono, A., Mele, F. M., Margheriti, L., Rossi, A., Battelli, P., Melorio, C., Castello, B., Lauciani, V., Berardi, M., Castellano, C., Arcoraci, L., Lozzi, G., Battelli, A., Thermes, C., Pagliuca, N., Modica, G., Lisi, A., Pizzino, L., Baccheschi, P., Pintore, S., Quintiliani, M., Mandiello, A., Marcocci, C., Fares, M., Cheloni, D., Frepoli, A., Latorre, D., Lombardi, A. M., Moretti, M., Pastori, M., Vallocchia, M., Govoni, A., Scognamiglio, L., Basili, A., Michelini, A., and Mazza, S.: The Italian Seismic Bulletin: strategies, revised pickings and locations of the central Italy seismic sequence, Ann. Geophys., 59, 1–7, https://doi.org/10.4401/ag-7169, 2016.
Marrett, R. A. and Allmendinger, R. W.: Kinematic analysis of fault-slip data, J. Struct. Geol., 12, 973–986, 1990.
Meletti, C., Galadini, F., Valensise, G., Stucchi, M., Basili, R., Barba, S., Vannucci, G., and Boschi, E.: A seismic source model for the seimic hazard assessment of the Italian territory, Tectonophysics, 85–108, https://doi.org/10.1016/j.tecto.2008.01.003, 2008.
Meletti, C., Marzocchi, W., and MPS16 Working Group: The 2016 Italian seismic hazard model, in: Proc. 16th World Conference on Earthquake Engineering, Santiago de Chile, 9–13 January, 747, S-P1463070033, 2017.
Meletti, C., Visini, F., D'Amico, V., Pace, B., and Rovida, A.: The seismicity model for Italy MA4, Internal report, Seismic Hazard Center-INGV, Roma, 10 pp., 2019.
Pagani, M., Monelli, D., Weatherill, G., Danciu, L., Crowley, H., Silva, V., Henshaw, P., Butler, L., Nastasi, M., Panzeri, L., Simionato, M., and Vigano, D.: OpenQuake engine: An open hazard (and risk) software for the global earthquake model, Seismol. Res. Lett., 85, 692–702, https://doi.org/10.1785/0220130087, 2014.
Pondrelli, S. and Salimbeni, S.: Italian CMT Dataset [Data set], Istituto Nazionale di Geofisica e Vulcanologia (INGV), https://doi.org/10.13127/rcmt/italy, 2006.
Pondrelli, S. and Salimbeni, S.: Regional Moment Tensor Review: An Example from the European Mediterranean Region, in: Encyclopedia of Earthquake Engineering Springer, Berlin Heidelberg, 1–15, available at: http://link.springer.com/referenceworkentry/10.1007/978-3-642-36197-5_301-1 (last access: 11 December 2020), 2015.
Pondrelli, S., Ekström, G., and Morelli, A.: Seismotectonic re-evaluation of the 1976 Friuli, Italy, seismic sequence, J. Seismol., 5, 73–83, https://doi.org/10.1023/a:1009822018837, 2001.
Pondrelli, S., Morelli, A., Ekström, G., Mazza, S., Boschi, E., and Dziewonski, A. M.: European-Mediterranean regional centroid-moment tensors: 1997–2000, Phys. Earth Planet. In., 130, 71–101, 2002.
Pondrelli, S., Salimbeni, S., Ekström, G., Morelli, A., Gasperini, P. and Vannucci, G.: The Italian CMT dataset from 1977 to the present, Phys. Earth Planet. Int., 159, 286–303, https://doi.org/10.1016/j.pepi.2006.07.008, 2006.
Roselli, P., Marzocchi, W., Mariucci, M. T., and Montone, P.: Earthquake focal mechanism forecasting in Italy for PSHA purposes, Geophys. J. Int., 212, 491–508, https://doi.org/10.1093/gji/ggx383, 2017.
Rovida, A., Locati, M., Camassi, R., Lolli, B., and Gasperini, P. (Eds.): CPTI15, the 2015 version of the Parametric Catalogue of Italian Earthquakes, Istituto Nazionale di Geofisica e Vulcanologia. https://doi.org/10.6092/INGV.IT-CPTI15, 2016, last access: 15 July 2020.
Saul, J., Becker, J., and Hanka, W.: Global moment tensor computation at GFZ Potsdam, AGU 2011 Fall Meeting, San Francisco, USA, abstract ID. S51A-2202, 2011.
Serpelloni, E., Anzidei, M., Baldi, P., Casula, G., and Galvani, A.: Crustal velocity and strain-rate fields in Italy and surrounding regions: new results from the analysis of permanent and non-permanent GPS networks, Geophys. J. Int., 161, 3, 861–880, https://doi.org/10.1111/j.1365-246X.2005.02618.x, 2005.
Stucchi, M., Meletti, C., Montaldo, V., Crowley, H., Calvi, G. M., and Boschi, E.: Seismic Hazard Assessment (2003–2009) for the Italian Building Code, B. Seismol. Soc. Am. 101, 1885–1911, 2011.
Vannucci, G. and Gasperini, P.: The new release of the database of Earthquake Mechanisms of the Mediterranean Area (EMMA Version 2), Ann. Geophys., 47, 307–334, 2004.
Wessel, P. and Smith, W. H. F. New, improved version of Generic Mapping Tools released, Eos T. American Geophys. Un., 79, 579, https://doi.org/10.1029/98EO00426, 1998.