the Creative Commons Attribution 4.0 License.
the Creative Commons Attribution 4.0 License.
 | 17 Dec 2020
Dynamic maps of human exposure to floods based on mobile phone data
Matteo Balistrocchi
Rodolfo Metulini
Maurizio Carpita
Roberto Ranzi
Floods are acknowledged as one of the most serious threats to people's lives and properties worldwide. To mitigate the flood risk, it is possible to act separately on its components: hazard, vulnerability, exposure. Emergency management plans can actually provide effective non-structural practices to decrease both human exposure and vulnerability. Crowding maps depending on characteristic time patterns, herein referred to as dynamic exposure maps, represent a valuable tool to enhance the flood risk management plans. In this paper, the suitability of mobile phone data to derive crowding maps is discussed. A test case is provided by a strongly urbanized area subject to frequent flooding located on the western outskirts of Brescia (northern Italy). Characteristic exposure spatiotemporal patterns and their uncertainties were detected with regard to land cover and calendar period. This novel methodology still deserves verification during real-world flood episodes, even though it appears to be more reliable than crowdsourcing strategies, and seems to have potential to better address real-time rescues and relief supplies.
- Article
(11772 KB) - Full-text XML
- BibTeX
- EndNote


Floods are natural phenomena whose hazards afflict nearly 20 million people worldwide (Kellens et al., 2013), posing a serious challenge to the protection of people's lives and the liveability of urban settlements. A high-confidence increasing trend in the economic damages and social costs due to extreme weather events has globally been documented (Kreibich et al., 2019). Two major factors can be advocated for justifying such a trend: climate change and increased urbanization (Hartmann et al., 2013). These factors involve different components of the risk concept (UN ISDR, 2009), which is given by the combination of hazard, exposure, and vulnerability. Climate change was popularly acknowledged as a leading cause for the increases in the frequency and intensity of heavy storms and, consequently, of the flood hazard (Solomon et al., 2007). However, according to the Intergovernmental Panel on Climate Change (IPCC) (Hartmann et al., 2013) and as also confirmed by up-to-date analyses of flood intensity in Europe (Blöschl et al., 2019), the absence of a likely global trend in the incidence of floods arises. Reasons lie in the high regional variability in heavy storm trends as well as in the strong influence played by watershed hydrologic characteristics and local flood management practices.
In contrast, population urbanization represents a likely global trend, though characterized by a strong regional variability. Migration from the countryside or mountain areas to cities is the main driver of urban sprawl. In 2008, for the first time in human history, more than half of the world population was living in urban settlements, and the percentage continues to augment (UN DESA Population Division, 2012). Touristic demand is an additional driver for urbanization growth that plays a peculiar role in developed countries. For instance, in Italy many areas are affected by emigration, namely Alpine and Apennine valleys, southern regions, and islands, and urbanization growth rates are equal to or greater than the national average rate. A clear example is provided by southern Italy, where the annual rate of soil consumption between 2017 and 2018 was 0.23 %, greater than the national average of 0.21 % (ISPRA, 2019), even if southern Italy faced a population decrease of 1.5 % between 2015 and 2019 (the national average loss was estimated at 0.7 %) (CENSIS, 2019). An additional example is provided by the Sondrio province (in the mountainous part of the Adda river basin, Lombardy, northern Italy), where the yearly soil consumption per capita is 1.11 m2, whereas the regional one is 0.63 m2.
Urbanization determines dramatic increases in human exposure and vulnerability to floods in immigration areas since most of recent urbanization lies in flood-prone areas, and local communities are not able to put effective flood defence practices in place. Moreover, urbanization usually leads to the impairment of the conveyance capacity of the stream network so that flooding areas are basically larger than in the undeveloped condition. The urbanization sprawl consequently results in increased damage to communities, private properties, and public infrastructures and must be regarded as the main cause for the likely increasing trend of flood risk (Barredo et al., 2009). A vast body of research on flood risk changes under economic and population growth scenarios indicates that this contribution is at least equal to but commonly larger than the climate change one (Feyen and Dankers, 2009; Maaskant et al., 2009; Bouwer et al., 2010; Te Linde et al., 2011; Rojas et al., 2013).
This flood risk trend forced an unavoidable shift in the paradigms of flood defence, by recognizing that not all events can be completely controlled and that structural practices have limits (Johnson and Priest, 2008). Thus, focus must be placed on how to mitigate the damages to flood-prone communities (European Union, 2007). Over the last decades, flood risk management has evolved from a structural-based defence approach, aimed at decreasing the hazard component, towards a more holistic perspective (Merz et al., 2010; Arrighi et al., 2019) taking into consideration vulnerability and exposure. Novel concepts were introduced, such as residual risk (UN ISDR, 2009), accounting for the potential structural failure of the defence system (Vorogushin et al., 2009; Schumann, 2017; Balistrocchi et al., 2019), and resilience, that is the ability to recover from a damage or to absorb an impact (Liao, 2012).
Differently from the hazard, the mitigation of exposure and vulnerability can be pursued by means of non-structural practices. Among them, a prime role is played by emergency management plans, which allow authorities responsible for the protection of local communities to dispatch timely and appropriate mitigation measures during the occurrence of flood episodes. The development of effective emergency management plans is closely related to the concept of authorities' preparedness (European Union, 2007). Such plans are actually intended to provide people with early warnings, reliable real-time information, and the improvement of relief supplies and rescue efforts. In this regard, a detailed and reliable picture of the real-time spatiotemporal variability in the flood risk would be highly beneficial.
Presently, large numbers of geospatial data can be obtained from a number of sources, namely remote sensing or aircraft platforms. These sources yield situation snapshots but do not provide information at the spatiotemporal resolution needed for managing urban flooding and are hardly validated on the field. To overcome these problems, the possibility of taking advantage of crowdsourcing techniques has recently attracted much attention (Mazumdar et al., 2017; Rosser et al., 2017; Hirata et al., 2018; Mazzoleni et al., 2018). These techniques have been made available by the widespread proliferation of smartphones and tablets, along with the success of social media. During emergency phases, the advantages in the real-time implementation of the emergency plan are twofold: firstly, a large amount of volunteered geographical information suitably georeferenced can be collected (Goodchild, 2007), guiding authorities in developing collaborative flooding maps or in estimating the number and location of exposed people; secondly, crucial information can be communicated to the people exposed, making them aware of the actual risk magnitude and enhancing their capability to face the situation. After the emergency phase, authorities can also exploit the collected data to enhance their preparedness and to better match the emergency management plans to specific real-world needs of the flood-prone community.
Capabilities and drawbacks of various crowdsourcing techniques have long been debated, even though crowdsourcing has already found successful applications in some weather related disasters (Poser and Dransch, 2010; Hung et al., 2016; Guntha et al., 2018). Such studies have underlined that, in many cases, during the emergency phase, crowdsourced data have at least the same quality as the authoritative ones (Goodchild et al., 2017). Nevertheless, several concerns have been pointed out through analyses of crowdsourcing technique applications to real-world disasters: (i) the raw data quality is generally poor because of malicious intentions of nasty elements in the community or incompetence of stakeholders so that spurious, erroneous, malformed, redundant, or incomplete data must be purged out of the database to make them suitable; (ii) the sample significance is basically low, owing to the limited number of exposed people actively participating in crowdsourcing so that information of general interest must be extrapolated from an exiguous fraction of the whole population; (iii) the communication network is not completely reliable as it could fail or malfunction during disaster occurrences.
Efforts of the research have therefore been addressed towards the development of methodologies to filter such rumours from crowdsourced data (Han and Ciravegna, 2019). However, other approaches can be followed to develop effective dynamic information tools through the exploitation of mobile phone data collected by providers. Such data make it possible to geo-localize mobile phone users over time in order to derive time-dependent crowding maps. When such maps are intersected with hazard maps, showing the flooding-area extensions corresponding to a selected frequency of occurrence, dynamic exposure maps are obtained. As demonstrated by Carpita and Simonetto (2014) with reference to episodic crowd concentrations due to social events, recurrent spatiotemporal patterns can be derived from mobile phone data by means of geostatistical analyses. Herein, the application of this methodology to the periodic spatiotemporal variability in the resident population related to home–work mobility is investigated. To do so, additional tools are developed to extrapolate the real-world population from the crowding maps of providers clients.
Dynamic exposure maps respond to a general demand for a dynamic approach to flood risk assessment and management (Viglione et al., 2014). Actually, flood risk varies over time not only with regard to climate non-stationarities and urban development trends since hydrological, economical, political, technological, and social processes are also involved. For instance, effective campaigns devoted to increasing awareness of flood risk, to promoting people's capability to undertake effective waterproofing practices, or to exploiting warning systems can dramatically diminish the flood risk over time. The same occurs by keeping the memory of flood disasters. These processes are interrelated and evolve over time (Di Baldassare et al., 2013). In this regard, some authors proposed dynamic agent-based models to assess the temporal change in flood risk (Dawson et al., 2011; Haer et al., 2016). Such models are capable of performing a spatially distributed analysis of flood risk, accounting for multiple factors, or agents, and their action–feedback relationships.
It must be pointed out that dynamic risk maps should account for the spatial heterogeneity of urbanization in order to obtain precise assessments. Flood-prone urbanization can feature very different characteristics relevant to both exposure and vulnerability, even inside the same watershed. Land use is the first discrimination level to be considered as population densities and temporal patterns could significantly differ in commercial, industrial, service, transport, and residential areas. Secondly, the fabric type may also have remarkable impacts on the overall risk. Indeed, Fuchs et al. (2015) evidenced significantly different exposures among various types of land use (tourist accommodation, commercial, recreational, residential) in Austria. Urbanization heterogeneity is also relevant for flood risk studies in developing countries as shown by Vu and Ranzi (2017); in their assessment of flood risk in central Vietnam, they estimated the exposure and vulnerability of buildings and people by collecting questionnaires including data on building types.
To demonstrate the capabilities of the geostatistical analysis proposed herein, it is applied to a suitable case study, identified in the western outskirts of Brescia (Lombardy, northern Italy). A detailed knowledge of the flooding dynamics and a sizable set of mobile phone data are available for this watershed. The suggested approach made it possible to derive reliable dynamic exposure maps with respect to the land coverage and the calendar time periods, obtaining estimates of the expected number of people affected by flood hazards along with its uncertainty. Hence, the paper is organized according to the following sections: (i) firstly, the innovative aspects of the geostatistical analysis methodology utilized herein are illustrated; (ii) secondly, the main hydraulic–hydrologic features of the analysed study area are described along with the available mobile phone data; (iii) the methodology application and the results are finally discussed.
The proposed geostatistical approach relies on erlang mobile phone measures. An erlang is the unit of measure of traffic intensity in a telecommunication system or network and it is widely used to quantify load and efficiency. The name is a tribute to Agner Krarup Erlang (1878–1929), a Danish mathematician and statistician who was the first to work on traffic engineering (Erlang, 1909). In this study, erlang measures consist of two-dimensional matrices which provide the spatial distribution of the average number of mobile phone users (MPUs) bearing a SIM connected to the network within a temporal interval and inside a spatial region. These data are collected by mobile phone providers and recorded at constant time steps with reference to a georeferenced grid of square cells. The availability of this kind of data is progressively capturing the attention of urban planners (Becker et al., 2011; Calabrese et al., 2015) as they offer a variety of potential applications. In this study, the MPU spatiotemporal variability was summarized by means of daily density profiles (DDPs) that provide the variability within a day of the MPU included in a spatial region of interest. Such regions are inundation areas, thus expressing the spatiotemporal variability in people exposed to the flood risk. To define DDP, let eit be the number of MPUs in the ith grid cell in a generic time interval t. Let be the set of grid cells in region r of interest. Furthermore, let be the set of intervals of time in a day d. The daily density profile (DDPrd) can be defined according to Eq. (1) as a vector of the sums of MPUs (a sum for each considered time instant) in region r and day d (length o):
Herein, the interest lies in analysing and classifying the occurrences in a time series of DDPrd, related to a set of n analysed days. More precisely, the proposed approach firstly involves the clustering of similar DDPrd, as discussed in detail in Sect. 2.1. The clustering procedure consists of two steps. In the first one, MPU spatial variability inside region r is considered by changing index i in an R2 x–y coordinate space; to do so a data reduction strategy is applied. In the second one, the DDPrd temporal variability is evaluated by changing index t in an R1 space.
The characteristics of our data raise some issues related to the choice of the clustering technique to be chosen. In fact, traditional techniques (Arabie and De Soete, 1996) may not produce robust results when the number of variables is larger than the number of observations. Our data amount to n observations and variables (number of MPUs per day). For instance, let us consider a case in which available data refer to 1 year (i.e. n=365): information in each cell of the grid is available 4 times per hour (thus, o=96), and the region is covered by 500 grid cells (m=500). It follows that the number of variables is much larger than the number of observations (p>n), and so we refer to a high-dimensional data set-up (Donoho, 2000). In high dimensionality, some issues need to be considered, such as those of the curse of dimensionality (Keogh and Mueen, 2017). Bouveyron et al. (2007) addressed this issue with regard to clustering. However, as suggested by Jovi et al. (2015), a suitable solution is represented by data reduction. To do so, the histogram of oriented gradients (HOG) approach is used in this paper. Therefore, data reduction works on index i in order to convert the support from R2 (x–y coordinate space) to R1.
Once the DDPrd are clustered in statistically similar groups, the total number of people in set Td and region r can be estimated and associated with descriptive bands (DBs), as discussed in Sect. 2.2. In this regard, there is crucial concern due to the lack of MPU data from all companies providing phone services in northern Italy. To deal with this problem, as first suggested by Metulini and Carpita (2020), the approach proposed in this paper adopts a strategy to infer the total number of people by matching census data to available mobile phone data.
2.1 Data reduction and clustering
To cluster similar DDPs, a technique for high-dimensional data reduction is adopted first. Then, reduced data are analysed by using a high-dimensional data clustering. Separately for each element of set Td (i.e. for a given t), let be the MPU vector of region r in time instant t (dimension m). The aim is to reduce εit to the vector of values κit (dimension m′<m), which contains the relevant information contained in set εit. To do so, set εit, separately for each t, undergoes a histogram of oriented gradients (HOG) feature extraction (Dalal and Triggs, 2005; Tomasi, 2012). Traditionally, HOG is applied to red–green–blue (RGB) images in order to find similarities among images and to classify them. Vector εit can be considered a raster that expresses the magnitude of its elements through colours since each value has an associated location in the R2 x–y coordinate space. In consideration of our setting, the application of the HOG method looks straightforward.
According to first-step clustering, the interest lies in the relative distribution of the MPUs in region r, not in the absolute number of users. To be consistent with this aim, the HOG was applied to a normalized vector of εit. Vector zit is thus defined as . In order to obtain the vector of features κit, by displaying the relevant information in zit, the HOG method firstly divides the cells of the grid in S smaller grids G1, … , GS ( and ,… , S with i≠j), where is a parameter that needs to be chosen. Then, by using two different gradient matrices of each grid Gi (for details, see Dalal and Triggs, 2005), the direction and the magnitude matrices are obtained. These matrices are used to derive the histogram of gradients with k equal bins, where k is a parameter that needs to be chosen. The larger the parameter k is, the better the results are; moreover, in related literature k usually ranges from 4 to 20 (Salhi et al., 2013). The vector of features κit is given by all the elements of the derived histogram of oriented gradients, stacked ∀S. Considering that the length of κit is S⋅k, the vector κit is stacked over the subscript t in order to derive (for region r and day d) the vector of features κd (dimension ).
κd is used in the first clustering step of the method, where days represent the objects to be clustered in terms of how the MPUs are distributed over region r according to index i. κd is computed for all the days in dataset and a k-means cluster analysis (Hartigan and Wong, 1979), in which the objects to be clustered are the n days, and κd contains the values of the (with ) variables for day d to be attributed to a cluster. According to the Hartigan-and-Wong criterion, the cluster number H is chosen by looking at the ratio between the total within the sum of squares (Tot within SSH) and the total sum of squares (Tot SSH) for different values of H that needs to be minimized with respect to H. For a certain H, the total within the sum of squares is defined as , where μi is the centroid vector (length ) for cluster i; the total sum of squares is defined as , where μ is the centroid vector for the full set of data. At this point the elements in (the days) have been assigned to a number of clusters C1, …, CH (, and with i≠j).
In the second step, when the MPU variability over time is accounted for, we consider the vector DDPrd (for a given region r) as the collection of functional observations xrd (Td), Td⊆(t1, …, to) of length o, with d varying in (i.e. in t1). To do so, we adopt a model-based functional data-clustering method (Becker et al., 2011) since it is more flexible than the alternatives: to each cluster it provides an estimated functional curve with specific parameters. We group days d (cluster's objects) in terms of the o DDPrd values (cluster's variables) separately for each cluster of the previous step. Similarities in the functional form of the DDPrd are considered if viewed in terms of curves of values (y axis) with respect to time instants (x axis). The curves of each group are modelled by using a group-specific set of distributional parameters (see Becker et al., 2011 for details). The adopted method can be used in high dimensionality since the clustering process employs the criterion of the sub-space clustering (Agrawal et al., 1998), which is adopted when one is only interested in considering the minimum number of variables needed for grouping objects, and thus to reduce the dimensionality. In detail, it is proposed herein to adopt the following path: (i) functional data outlier detection by likelihood ratio test (LRT) is adopted to remove the anomalous DDPrd, as proposed by Febrero-Bande et al. (2008); (ii) the Bouveyron et al. (2015) clustering method is applied using the funFEM package in R.
The aim of this strategy is to assign the elements in (the days) to final clusters CF,1, …, CF,Z (, , , … , Z), with Z≥H. Thus, adopting these steps makes it possible to represent the dynamic of the MPUs' presence in terms of a representative DDP for each group of days. Representative here means that each group includes days that are similar in terms of index i (spatial distribution of MPUs) and index t (temporal dynamic of MPUs) and dissimilar from those included in other groups.
2.2 Population assessment
With the clustering strategy it is possible to display the number of mobile phone users in region r for a set of time instants in clusters of days. However, the estimate of the total amount of people is needed for developing dynamic exposure maps. Unfortunately, data availability regards only one mobile phone company. To have a reliable estimation of the total number of people actually present in the study area, users of other mobile phone providers must be considered as well. Collecting all these data is either unfeasible or unsustainably expensive. To perform analysis on a national scale, a convenient solution is represented by the use of the market share of the provider company, which can be applied to “correct” the DDPrd. Hence, an estimation of the total number of people can be obtained (e.g. let sn be the national-level share assuming values in the range [0,1]; the correct DDP would be DDP). Country-level estimates are available from Il Sole 24 Ore newspaper (Il Sole 24 Ore, 2017). However, the market share usually varies significantly among cities, according to different socio-economic characteristics of users. For instance, per capita revenues are on average EUR 19 514 per year in Italy and EUR 23 418 per year in the Brescia Municipality (data by Italian Ministry of Economy and Finance, Department of Finance, 2016), whereas the percentages of foreigners are 8.5 % and 18.5 %, respectively (data by the Italian National Institute of Statistics; ISTAT, 2011). Furthermore, families featuring more than four people are about 21.0 % in Italy and 16 % in the Brescia Municipality, while the percentage of people older than 65 is quite near the national average of about 22.0 % (ISTAT, 2011).
Thus, to suitably estimate the market share, the smallest level of aggregation, represented by the “Sezioni di Censimento” (SCs) (i.e. population census districts), was used in this study (ISTAT, 2011). The following strategy is suggested: the number of residents from administrative archives is compared with the number of Telecom Italia Mobile (TIM) users in a residential area in the late evening hours. Bearing in mind the characteristics of the social dynamics of the analysed residential areas, it is reasonable to assume that, in the late evening hours, residential SCs are only populated by residents. The comparisons, using data from ISTAT (Anagrafe Comunale), were performed separately for each SC.
Since the MPU grid is made of square cells, while SCs are irregular polygons, the number of TIM users belonging to each SC was estimated by intersecting these spatial data. Thus, the portion of the cell belonging to the SC polygon was calculated in order to count how many TIM users are present in each polygon by using the function extract in the raster package in R. Let Cellj () be the TIM cells (pixels) which overlap a chosen SC; the ratio Aj in Eq. (2),
represents how much of Cellj is included in the chosen SC (for each SC, Aj>0; . If Cellj is completely covered by the SC, then Aj=1, otherwise Aj<1. Let TUCj be the density of TIM users in Cellj; the estimation of the number of TIM users in SC ETUSC is computed as shown in Eq. (3).
The estimated TIM market share in SC ETMSSC is thus given by the ratio in Eq. (4), where PSC is the resident number assessed by population census for the SC.
Differently from sn, the ETMSSC range is not necessarily [0,1] since PSC could be smaller than ETUSC. An application example of this procedure can be found in Metulini and Carpita (2019b). In the count of PSC, children (younger than 11 years) and elderly people (older than 80 years) were excluded, aiming to take into consideration only people bearing a smartphone. The distribution of ETMSSC can be used as a proxy for the TIM market share on a city level. More specifically, it appears to be convenient to use the median of the distribution of ETMSSC. The median is preferable to the mean in those cases when the distribution is symmetric. Metulini and Carpita (2019b) showed the presence of a strongly asymmetric distribution of ETMSSC for the case study of the city of Brescia. Moreover, Carpita (2019) showed good results in terms of the comparison between estimated people and official data by using the median for the case study of Lake Iseo during the Floating Piers. Let me(.) be the median statistics; the estimated for a given region r for a given day d is finally given by Eq. (5).
2.3 Result representation
For the sake of result interpretation, a graphical representation is herein adopted. Let us consider the DDPrd vector to be a functional curve xrd (Td) displaying, on the y axis, the sum of MPUs in region r and day d with respect to time instants on the x axis. Functional box plots (FBPs) (Sun and Genton, 2011, 2012) can be used to display the profile for representative days.
In FBPs, a cluster of curves is ordered in terms of its “band depth”. A “median” value and an “envelope” are generally used to define the functional counterpart of traditional descriptive bands. Moreover, one can detect outlier curves. Specifically, a curve is an outlier if it exceeds the margins of the envelope by 1.5 in at least one considered time instant.
Separately for each final cluster, an FBP is derived. Let us consider cluster h, let be the group of days that belong to cluster h, and let be the matrix of dimension o⋅nh with a in each column. By considering each vector as a curve, the FBP representing the profile plot of the total number of people (that we will call “city users”, or simply “users”) at different hours (with DBs) on representative days is computed using matrix .
The study area was selected as an emblematic and widespread situation of the unacceptable high flood risk affecting the foothill zone of the Po river valley (Lombardy Region, northern Italy). It lies on the western outskirts of Brescia (Fig. 1) and is overall included in the watershed of the Oglio river, a primary left-bank tributary of the Po river. The main drainage is supplied by the Mella river, which is a left-bank tributary of the Oglio river and bounds the eastern side of the study area. As can be seen in Fig. 1, the study area features five natural streams originating from the southern boundary of the Alpine chain. From west to east, they are Laorna, Gandovere, Vaila, La Canale, and Solda.
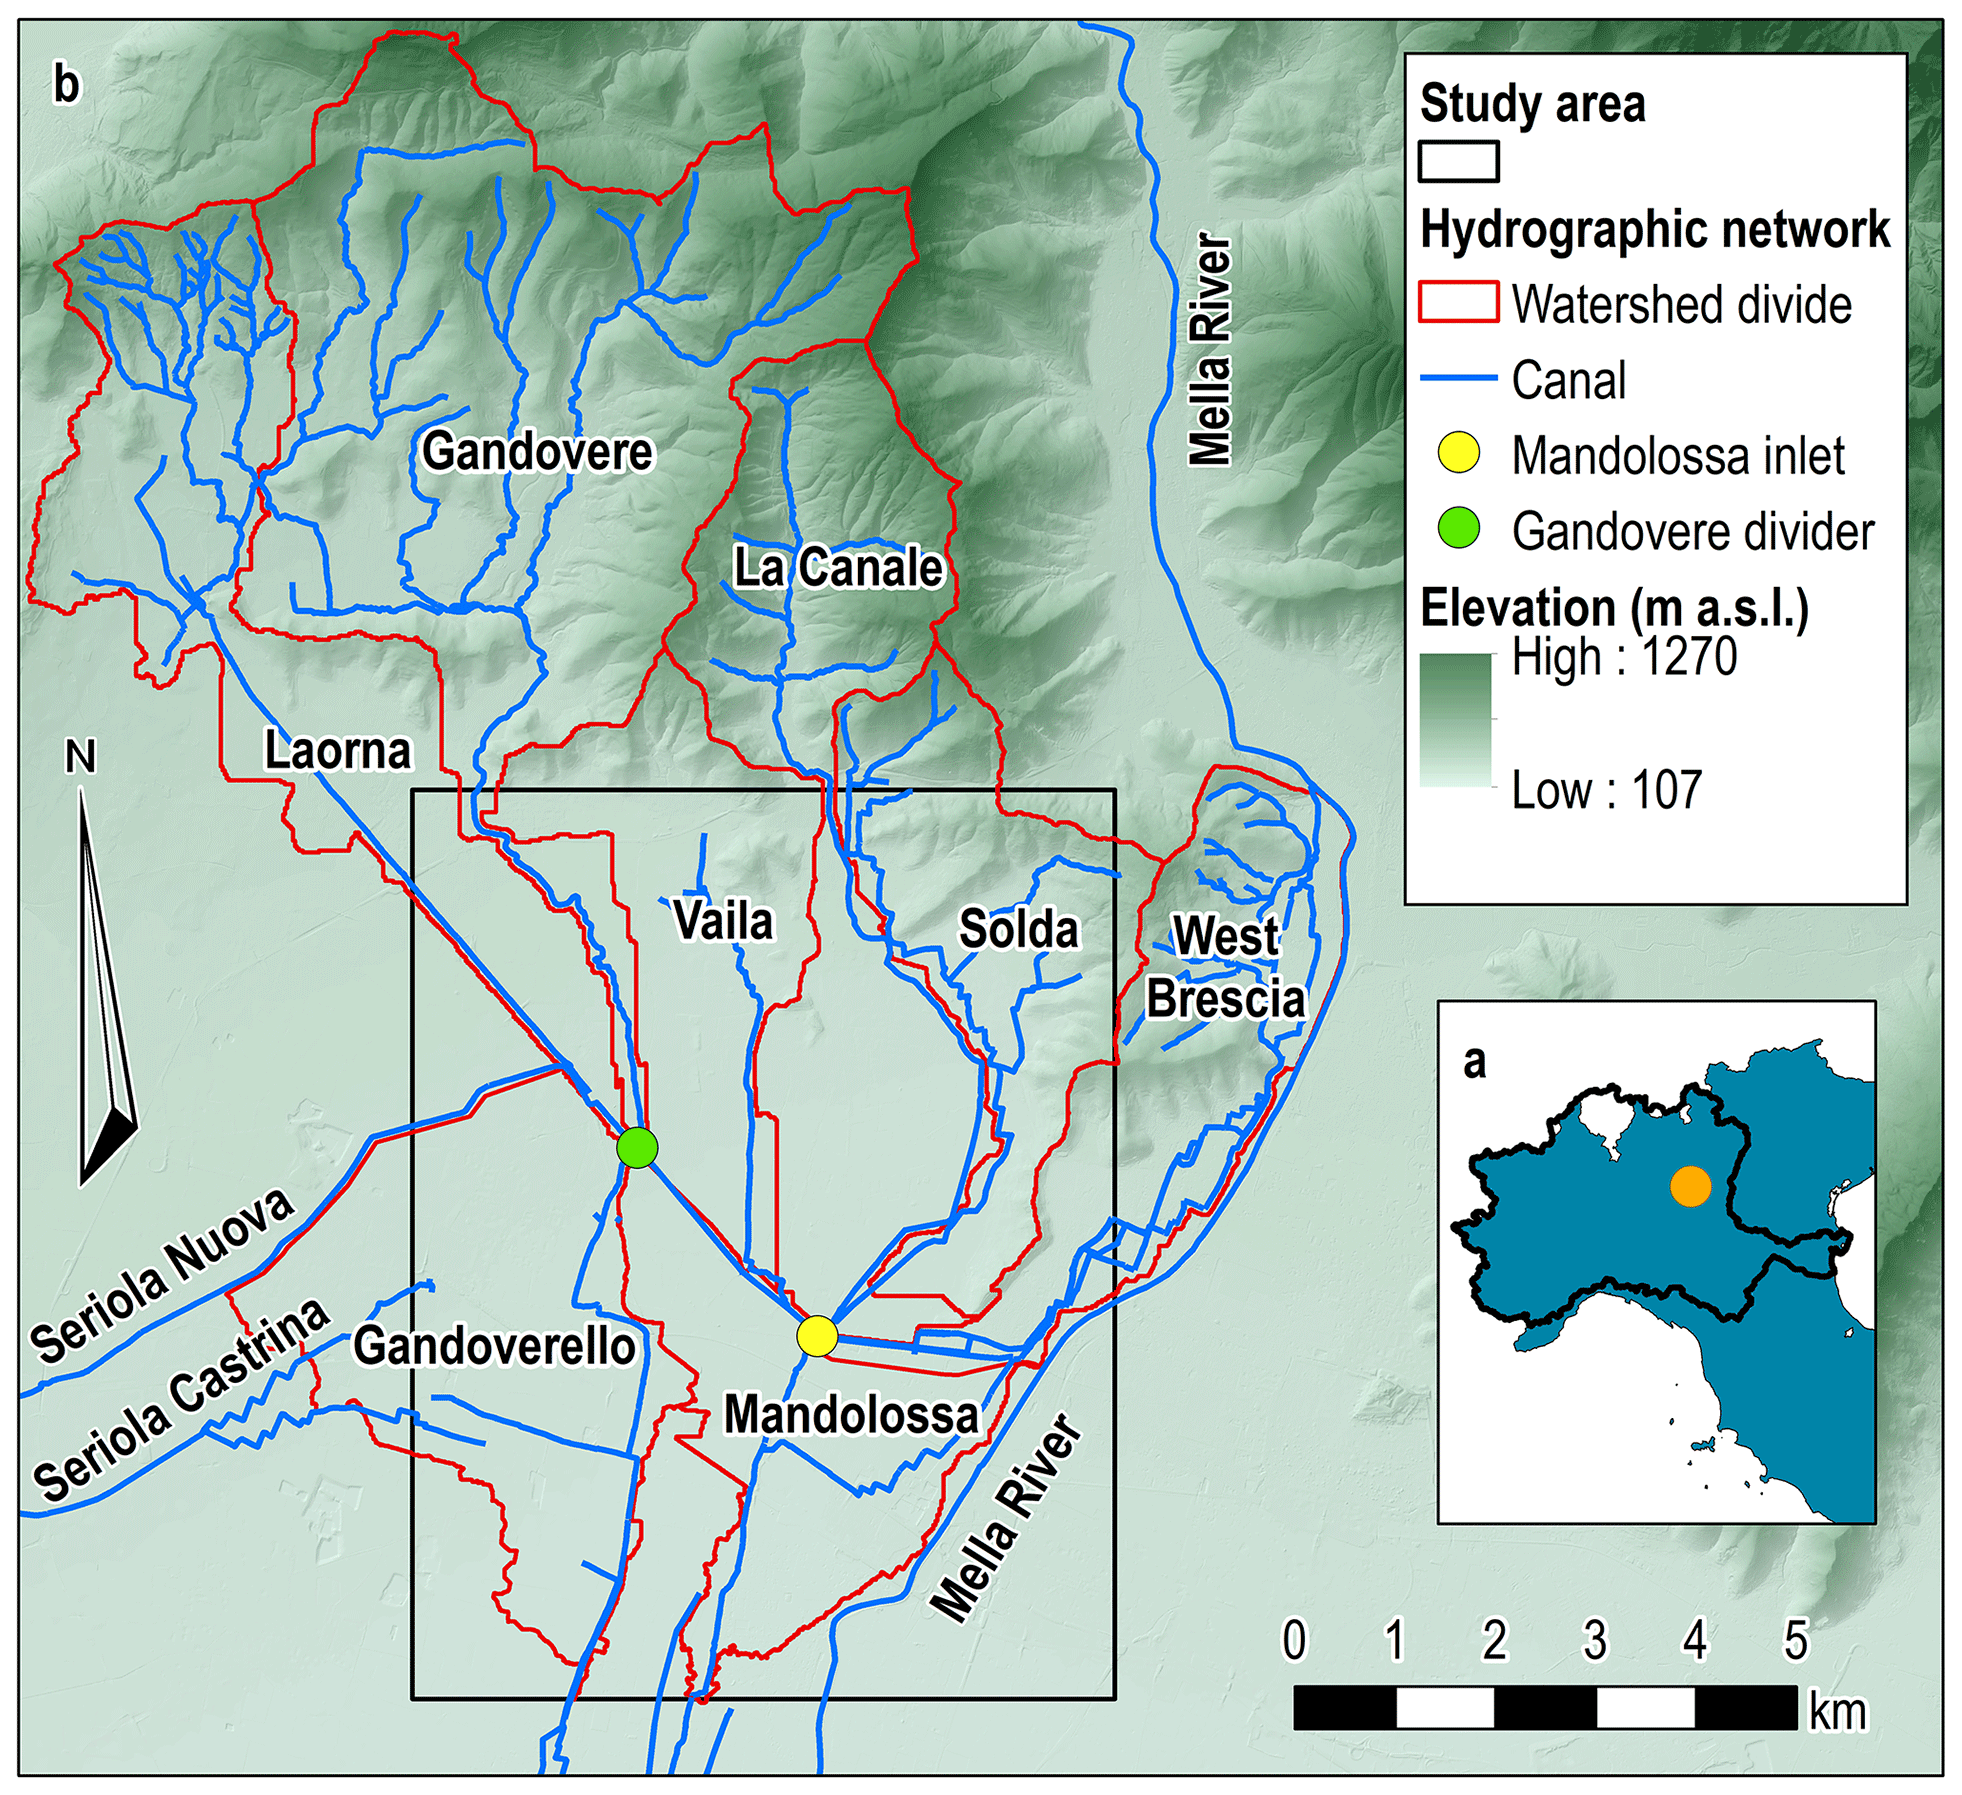
Figure 1Location of the study area with respect to the Po river valley in northern Italy (a) and main hydrographic features of the foothill area west of the town of Brescia (b); base map 5 m Digital Elevation Model provided by Lombardy Region (http://www.geoportale.regione.lombardia.it/, last access: 3 March 2020).
Before the area was anthropized, most of such streams had probably flooded the alluvial plain swamping into marshes without a main outlet in the main river network. This was the result of both their almost ephemeral regime and the endorheic morphology of their watersheds. As the agricultural use of the alluvial plain grew, these streams were connected to the constructed irrigation–drainage network in order to exploit their low flow for irrigation purposes and to drain the flood flow into the Mella river. These constructed downstream reaches feature two main drainage canals: the Gandoverello canal and the Mandolossa canal, depicted in Fig. 1. They have become the artificial downstream reaches of the five watersheds, providing a drainage capacity in the southern direction both for the mountain watersheds and lowlands located in the alluvial plain. The total catchment area amounts to 112.3 km2, featured by an average imperviousness of about 22 %.
In particular, the Laorna drainage path was strongly manipulated by a constructed straight canal 7 km long that diverts its streamflow towards the Gandovere stream and intercepts additional surface run-off produced by the northward lowlands. Both streams thus converge into the Gandoverello canal. This was formerly the downstream reach of the Gandovere stream, whose limited conveyance capacity made it necessary to decrease the hydrologic load. Thus, a flow divider was constructed upstream of the Laorna confluence so that almost half of the Gandovere streamflow is diverted towards the Mandolossa canal inlet by means of a diversion canal that intercepts the Vaila stream. All these flow discharges, along with those coming from the La Canale stream and the Solda stream, converge into the inlet of the Mandolossa canal, which is characterized by the largest conveyance capacity in the study area.
This drainage network is also exploited by the irrigation system of Franciacorta, a vineyard agricultural district located west of the study area, for the final disposal of the residual flow discharges. In Fig. 1 two of the most important irrigation canals belonging to this system, Seriola Castrina and Seriola Nuova, are reported. Their discharges mainly affect the Gandovere and Laorna streamflows. Further contributions come from the western Brescia outskirts in terms of both urban storm waters and irrigation excess flows, which directly drain into the Mandolossa canal. Finally, water table resurgences of the high Po river valley are also present downstream of the Mandolossa canal inlet. Their fresh waters are however intercepted and drained by the downstream reach of the Mandolossa canal.
3.1 Hazard mapping
Since the late '50s of the last century, this area has been subject to a deep urbanization sprawl, yielding the present land cover condition depicted in Fig. 2. The dramatic increase in both the urban fabric and the industrial–commercial coverage has occurred at the expense of croplands and permanent crops so that sparse and isolated fabrics have evolved in a continuous and heterogeneous urbanization. In addition, various transport units have been upgraded to speedways, and two highways were constructed. The flood risk perception in this area has historically been related to the Mella river inundations, which affected the Brescia outskirts in the late '60s of the last century until its riverbed underwent important engineering works. Conversely, with reference to the secondary stream network, the absence of a clear risk perception allowed such an urbanization sprawl to occur regardless of the floodplain extents. As Fig. 2 clearly shows, most of the urban-fabric areas and the industrial and commercial settlements are adjacent to the stream network.
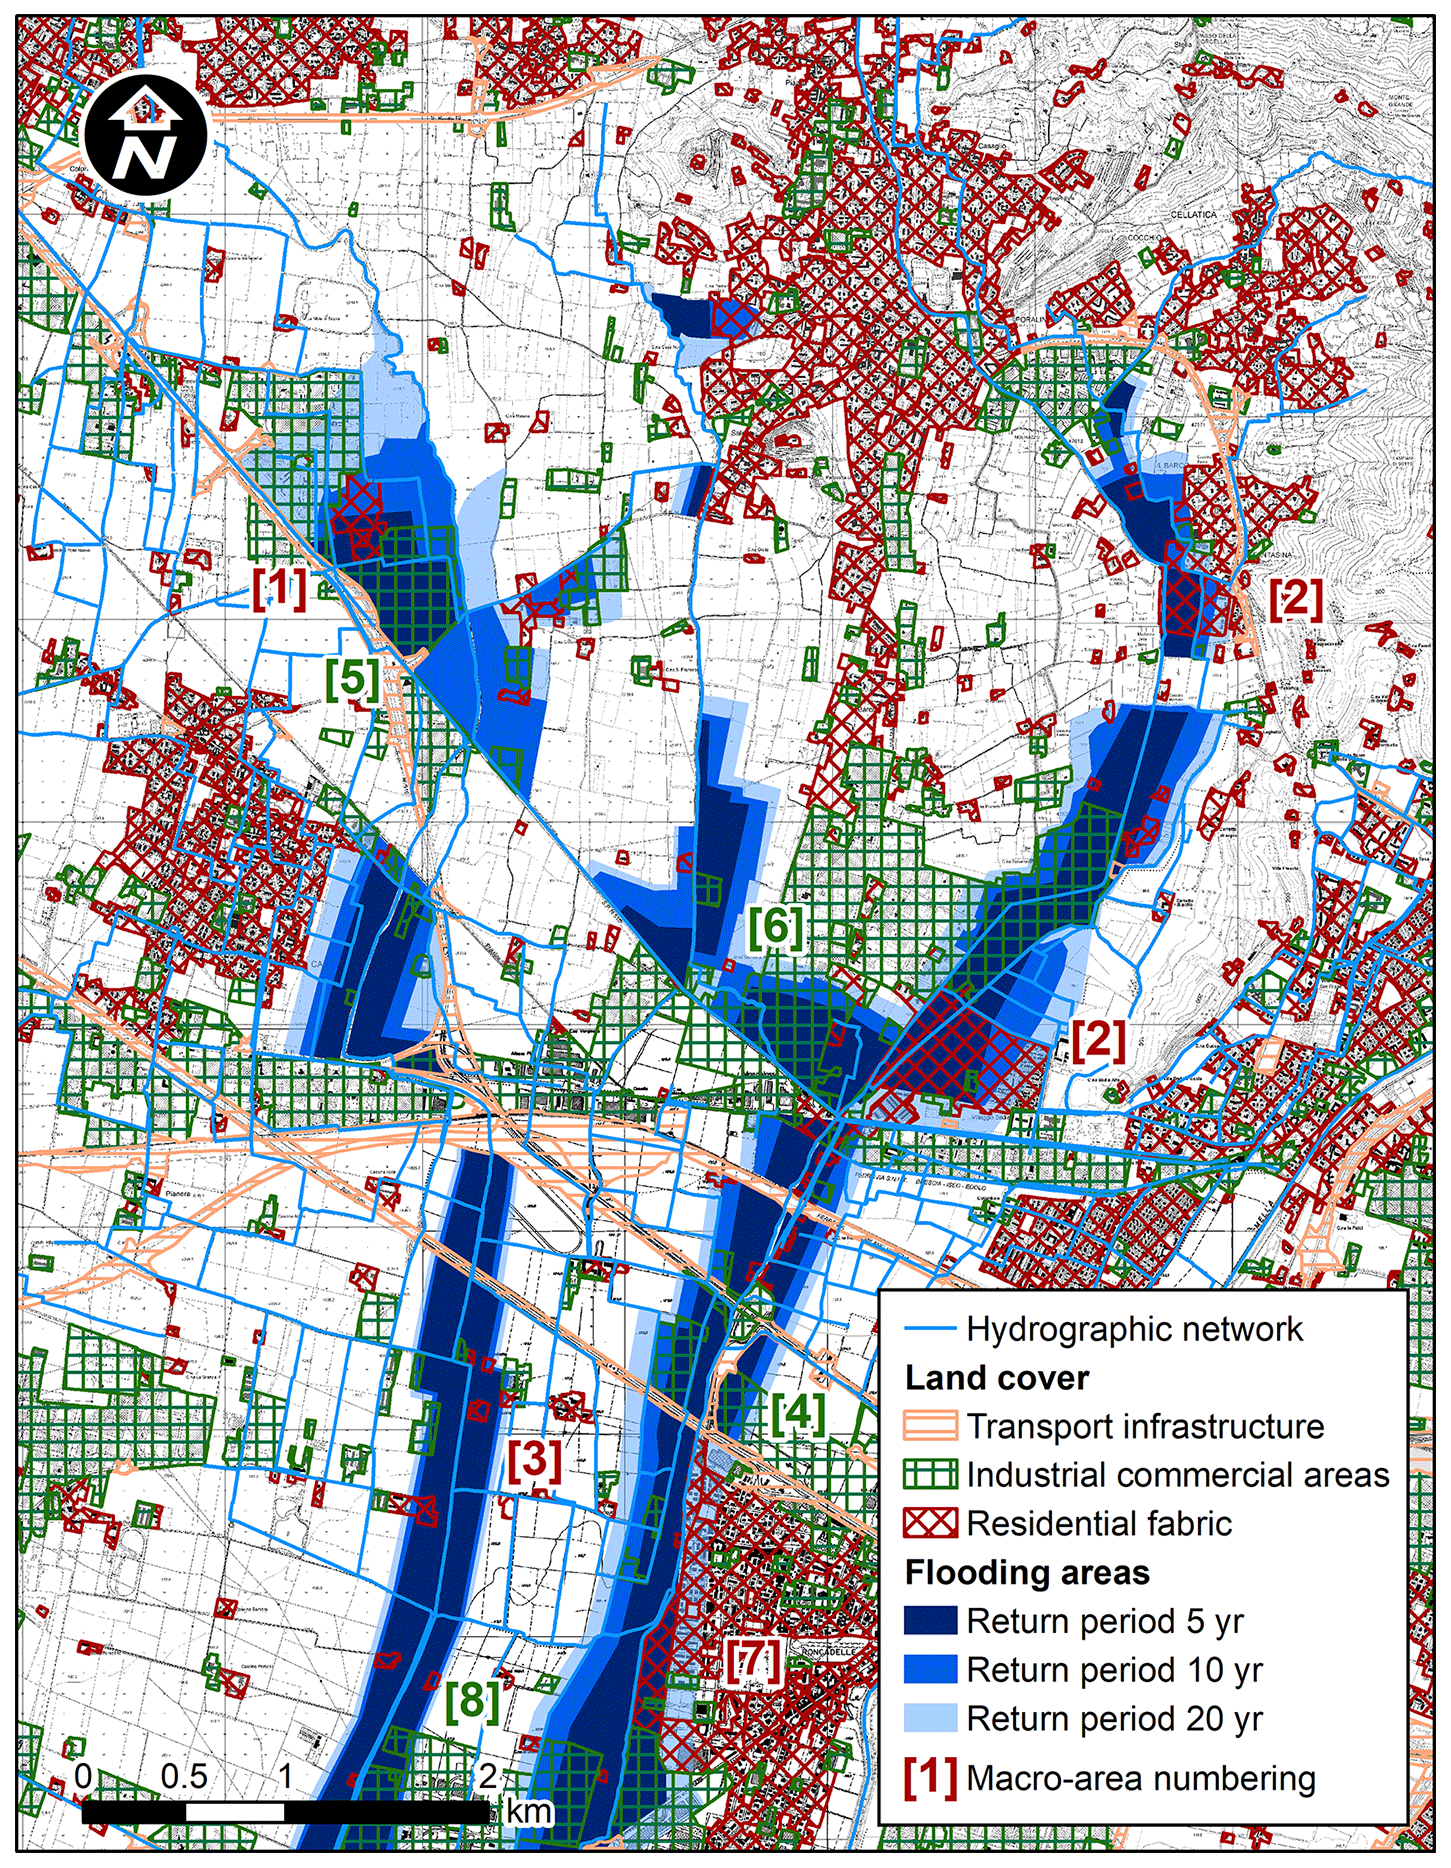
Figure 2Flooding-hazard map of the study area comparing present land cover and flooding-area extensions referring to return periods varying between 5 and 20 years; exposed residential areas are (1) Laorna and Gandovere streams, (2) La Canale and Solda streams, (3) southern Gandovere canal, and (7) Mandolossa canal, and exposed industrial and commercial settlements are (4) Mandolossa canal, (5) Laorna and Gandovere streams, (6) La Canale and Solda streams, and (8) southern Gandovere canal; the base map is the Lombardy Regional Technical Map (CTR), 1:5000, provided by the Lombardy Region (http://www.geoportale.regione.lombardia.it/, last access: 3 March 2020).
The increase in the land coverage yields huge impermeability degrees for the plain watersheds. Except for a combined sewer overflow located in the western Brescia watershed that discharges into the Mella river, all the storm waters produced by these areas discharge into this secondary stream network as well as those produced by many settlements in the Franciacorta district, which improperly exploits the irrigation system as a final receipt of combined sewer systems. Moreover, the low risk perception has led to a significant impairment of the functionality of these canals. The streamflow is now constrained to a number of narrow culverts and bridges with low decks and large piers. In addition, urbanized canals are no longer maintained so that the riparian vegetation grows in an uncontrolled manner. The combination of the increase in the peak flow discharges and in the exposure, along with the decrease in the stream network conveyance capacity, has led to a dramatic increase in the flood risk. Flood episodes explained by the secondary-hydrographic-network insufficiency have been observed since the late '90s, evidencing an empirical frequency of occurrence far less than 20 years. The hazard mapping was thus conducted by considering return periods spanning from 5 to 20 years, which are significantly less than those conventionally required in Italy for a secondary stream network to be considered verified (20–50 years).
The hazard analysis was herein conducted by using a design event method. As demonstrated by Balistrocchi et al. (2013) in this climatic context, a design event method is capable of providing results comparable to those of more sophisticated continuous approaches if it is based on the Chicago synthetic hyetograph with a duration equal to double the catchment time of concentration. A classical leaf hydrologic model was developed in accordance with the sub-catchment subdivision illustrated in Fig. 1. Extensive surveys of the stream cross sections and the inline structures were carried out to assess the actual conveyance capacities of the stream reaches. Flooding volumes were hence estimated by limiting the flood hydrographs generated through the hydrologic model to the overflow threshold discharges. Surveys of the historical flooding extensions that occurred during the last 3 decades addressed the delimitation of the flood-prone areas. The total amount of exposed urban area is about 160 ha (return period 5 years), 230 ha (return period 10 years), and 330 ha (return period 20 years). Most of such areas are devoted to industrial–commercial settlements (70 %), whereas the remaining part includes residential areas of medium to low density featuring similar fabric types (detached or semi-detached houses). Distinguishing between these two classes was found to be useful in decreasing the estimate uncertainty in population estimates. The resulting flood hazard map is reported in Fig. 2 along with the land cover, and it highlights the large number of residential fabrics, and industrial and commercial settlements potentially affected by flood events featuring low to medium return periods. An unacceptably high flood risk is therefore evidenced for the study area. Most of such areas were too dispersed or small to have suitable intersections with MPU grid cells. Therefore, they were grouped into four macro-areas referring to the individual canals and the land use that was classified in urban fabrics (red) and commercial–industrial settlements (dark green). As shown in Fig. 2, they are the Laorna and Gandovere streams confluence (areas 1 and 5), the La Canale and Solda streams (areas 2 and 6), the southern Gandovere canal (areas 3 and 7), and the Mandolossa canal in Roncadelle Municipality (areas 4 and 8).
3.2 Available mobile phone data
In this work we use mobile phone data provided by Telecom Italia Mobile (TIM), which is currently the largest mobile phone operator in Italy. According to the national economic newspaper, TIM's national share amounted to 30.2 % in December 2016 (Il Sole 24 ore). In our analysis, erlang measure data represent the average number of both calling and non-calling mobile phone SIMs (assigned to a certain cell of the considered grid in a certain quarter. Statistical research in the area of urban planning using erlang measure data is increasing: for example Carpita and Simonetto (2014) and Metulini and Carpita (2019a) studied the dynamics of people's presence at big events in the city of Brescia; Zanini et al. (2016) applied an independent component analysis (ICA) method for separating the city of Milan into a few main areas. Other works (Manfredini et al., 2015; Secchi et al., 2015) used erlang measure data to study the dynamics of people's presence in Milan.
In this study, reliable erlang measures of MPUs recorded by the TIM company are available. The investigated area is marked by a solid black line in Fig. 1 (WGS 84 UTM 32 N coordinates: 5 040 920–5 049 980 N, 585 970–592 970 E, area about 64 km2) and is centred on the Mandolossa–Gandovere network. The area is covered by a georeferenced grid of square cells with 150 m sides, which provides the number of TIM users every 15 min. More precisely, for each cell of the grid and for each interval of time, the recorded data refer to an average measure of the number of mobile phones simultaneously connected to the network. For instance, Fig. 3 shows a detail of the spatiotemporal distribution of TIM MPUs that occurred on Wednesday, 18 November 2015, in a sample area of cells near the Mandolossa inlet. Therein, exposed areas, obtained by intersecting the urban covers with the flooding areas, were also reported. Thus, Fig. 3 provides a sequence of snapshots of a dynamic map of human exposure to floods. As can be seen, the spatial distribution of raw data is realistic as major densities are observed along the main street network and in the urban areas. The temporal variability is also reasonable; for instance, lower densities are evidenced during nighttime in industrial sectors and main streets; see, for instance, the industrial settlement near the confluence of the La Canale stream in the Mandolossa canal (flooding area marked with 6 in Fig. 2). In these data, the information about the user mobility is hidden, meaning that one cannot trace the path followed by a single MPU over time. Measures are available for the period 2014–2016, even though after data inspection a more limited subset was found to be suitable for the analysis (from 1 July 2015 to 11 August 2016) due to data collection issues.
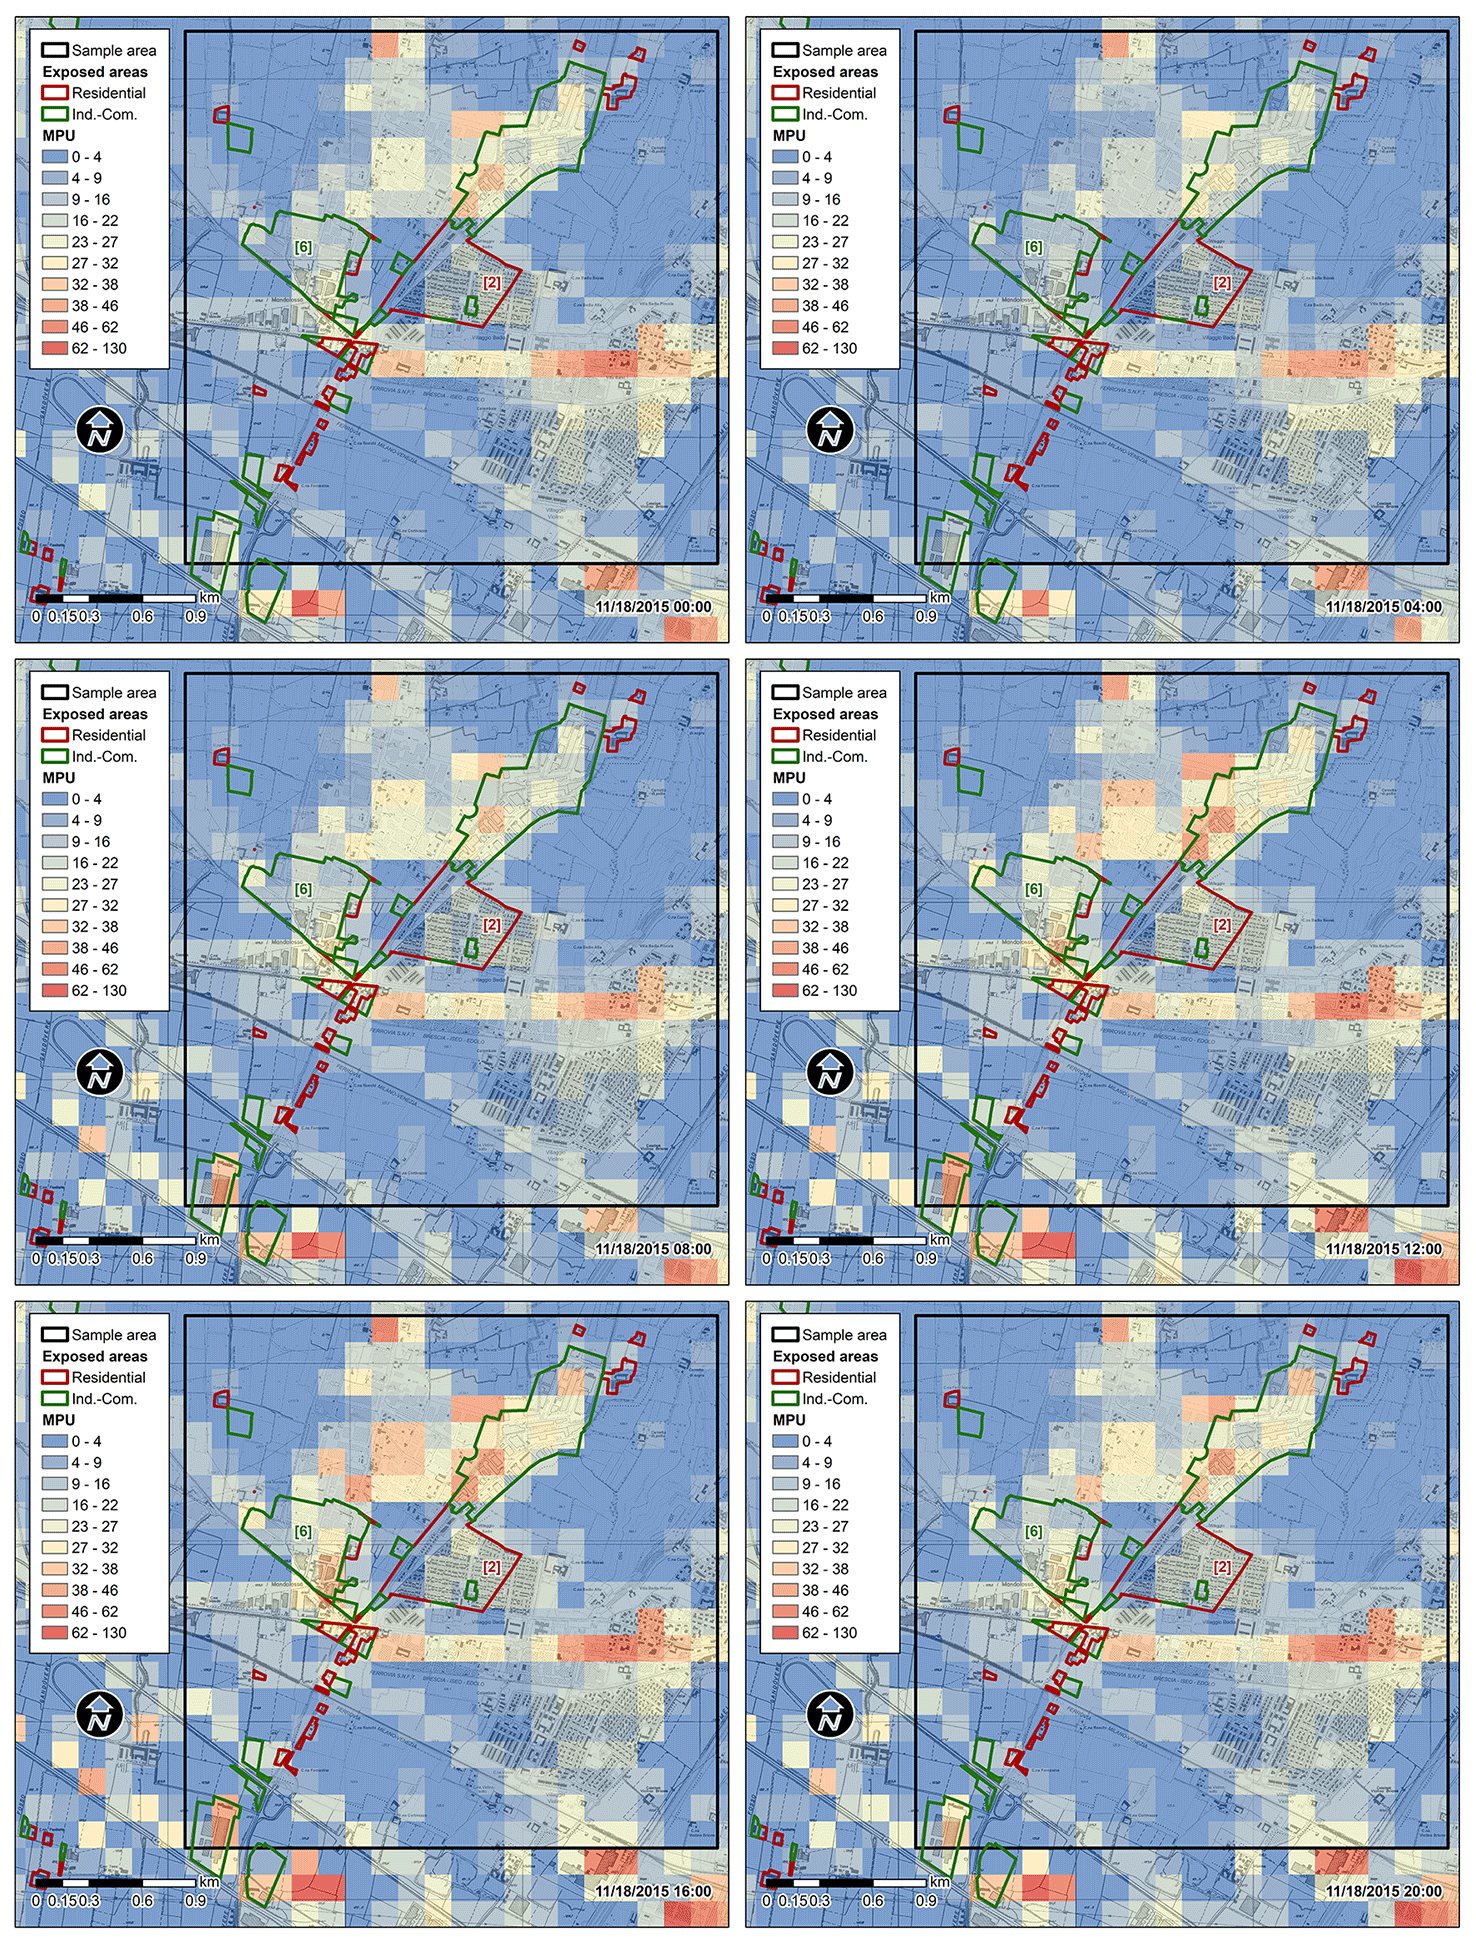
Figure 3Snapshots of a dynamic map showing the spatiotemporal distribution of mobile phone users (MPUs) that occurred on 18 November 2015 (Wednesday) in urban areas exposed to 10-year return period flooding; the base map is the Lombardy Regional Technical Map (CTR), 1:5000, provided by Lombardy Region (http://www.geoportale.regione.lombardia.it/, last access: 3 March 2020).
4.1 Procedure parameterization
The application of the HOG procedure to reduce the dataset dimensionality was performed for each quarter of a day in Td, by dividing the full grid into nine smaller grids Gi, . The parameter was thus set at 3. For each Gi, gradients and direction were then computed, and the histogram of oriented gradients choosing k=4 bins corresponding, respectively, to angles 0–45, 45–90, 90–135, and 135–180∘ was obtained. In general, one can improve the recognition of the analysed grid by increasing the number of bins. This value was chosen in order to maximize k but, at the same time, to avoid the presence of HOG features with zero values. In each quarter, the extracted features are . Therefore, the dimensionality reduction is of the order of . The final vector κd for the sample area near the Mandolossa inlet (sample area evidenced in Fig. 3), with all the quarters stacked for the same day and for day d, contains features.
The hierarchical k-means cluster analysis, with days used as the objects of the cluster and the features of κd used as cluster variables, was performed on a total number of 360 d (d=360) from 1 July 2015 to 11 August 2016. After data inspection, only the days of the last available year (from 1 July 2015 to 11 August 2016) were included in the analysis since the first year (April 2014 to 30 June 2015) features some collection problems. In effect, a configuration with three clusters sharply separating the days of the first year (until June 2015) and the days of the second year (by July 2015) was estimated by performing the cluster analysis by using the full set of data. In the final sample all holidays were removed in consideration of their specific characteristics with respect to typical days. More precisely, 15 August, 1 and 2 November, 8 December, 24 to 26 December, 31 December, 1 January and 6 January, 27 and 28 March (Easter), 25 April, 1 May, and 2 June were removed. In addition, those days where a large number of data (>10 %) were missing were removed as well. Conversely, data on those days where missing data were less than 10 % were maintained. A test for the possible presence of curse of dimensionality, based on the distribution of the distances among pairs of objects, was performed. A unimodal distribution that suggests the absence of such a problem was derived. On the whole, the number of suitable data appears to be sufficient to get reliable estimates of people exposed to the flooding risk in the study area.
The number of first-step clusters was chosen according to the relative decreasing trend of the total within the sum of squares with the group number increase. Figure 4 shows this trend, evidencing that a splitting into four clusters would decrease the total within the sum of squares by half with respect to a one-cluster splitting. Since this decrease appears to be satisfactory, the sample of days was split into H=4 clusters, where, C1 corresponds to all the days mostly occurring in July, August, and September (green spine plots shown in Fig. 5); C2 corresponds to working days mostly occurring from February to June (blue spine plots shown in Fig. 5); C3 corresponds to working days mostly occurring from October to January (red spine plots shown in Fig. 5) and C4 corresponds to the weekends except for those included in cluster C1 (yellow spine plots shown in Fig. 5).
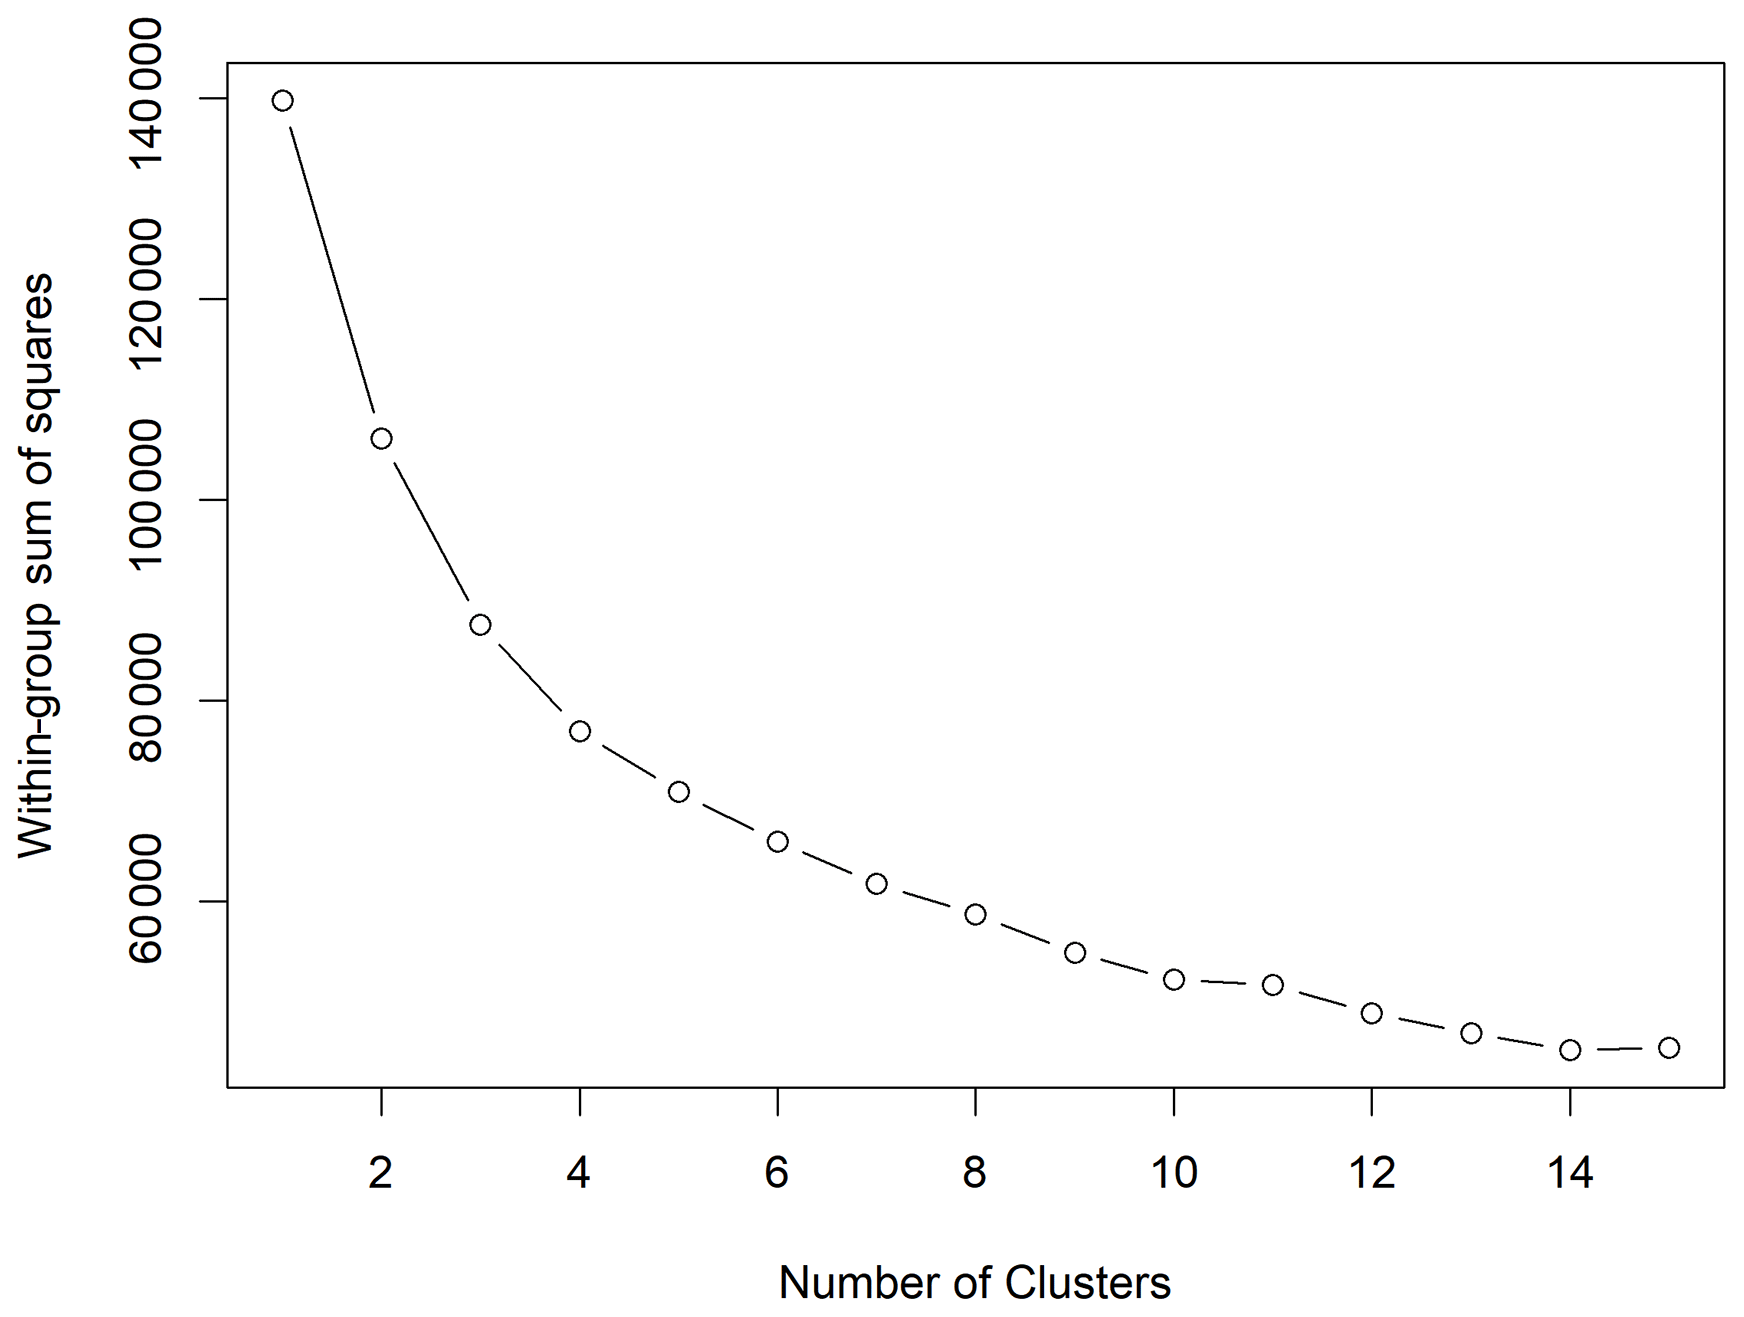
Figure 4Diagnostic for the choice of the number of first-step clusters based on the within-group sum of squares.
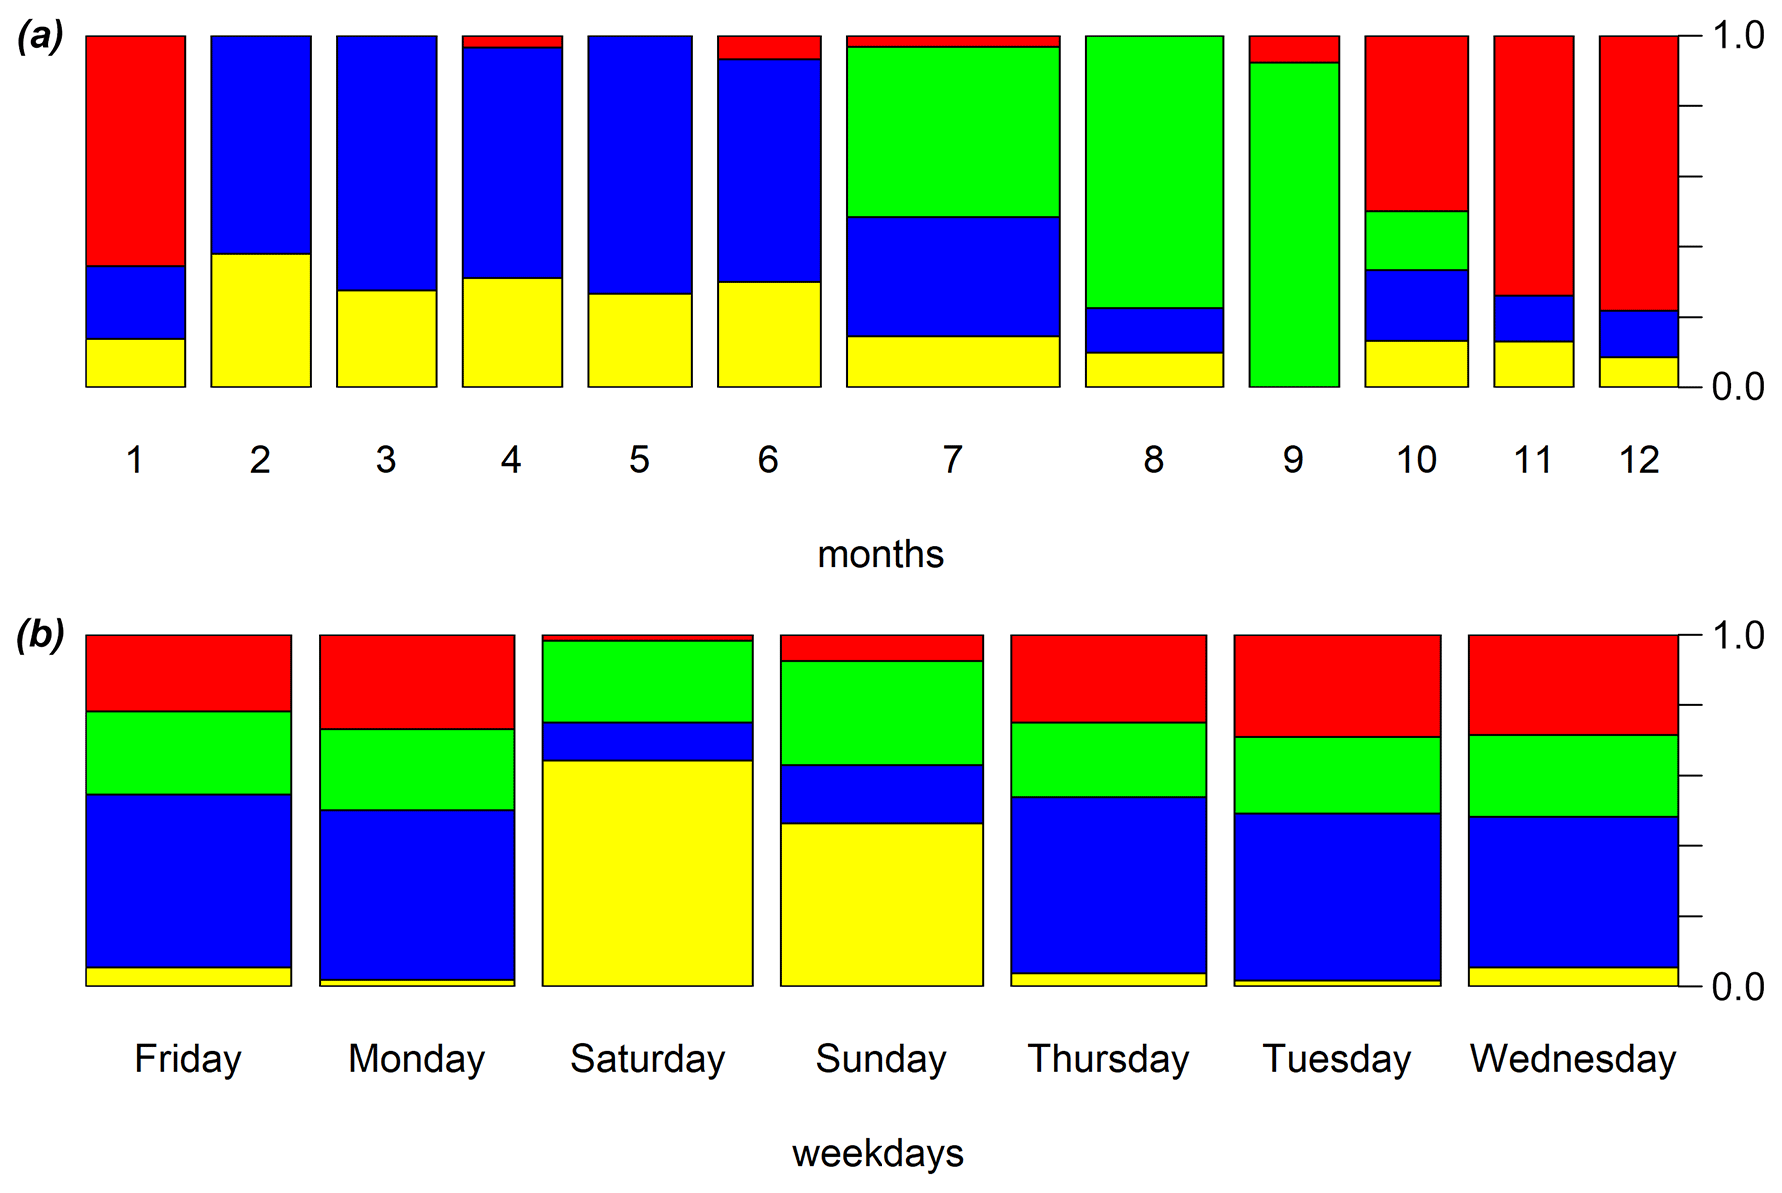
Figure 5Spine plots representing the first-step clustering of days along (a) months and (b) days of the week (green: all days mostly occurring in July, August, and September; blue: working days mostly occurring from February to June; red: working days mostly occurring from October to January; yellow: weekends mostly occurring from October to June).
Hence, MPU variability over time instants was accounted for by considering the Mandolossa's DDP of each day as a functional curve. Firstly, those days that have to be considered outliers were removed by using the curve outlier detection method (Febrero-Bande et al., 2008) separately for each first-step cluster. Secondly, it was evaluated whether days should be further grouped in terms of dissimilarity in the DDP functional curve dynamic. To do so, the assumption of independence of our functional data was tested by using Portmanteau (Gabrys and Kokoszka, 2007) and distance correlation (Székely and Rizzo, 2013) tests. Model-based functional data-clustering techniques (Bouveyron et al., 2015) suggest splitting the “summer” group into three sub-groups containing, respectively, the days of July, the days of August, and the days of September. This second-step splitting leads to Z=6 final clusters, where CF,1 includes days of July; CF,2 includes days of August; CF,3 includes days of September; and CF,4, CF,5, and CF,6 match, respectively, C2, C3, and C4.
Illustrations of DDPs for representative days by using functional box plots are reported in Fig. 6 (residential fabrics) and in Fig. 7 (commercial and industrial settlements) for each of the eight flooding areas shown in Fig. 2 for the 10-year return period. Although functional data clustering suggests splitting into six groups, for the sake of clarity, the summer months (July, August, and September) were combined in a single final cluster (cluster 1, C1) as well as all the working days from October to June in a single final group (cluster 2, C2) and the weekends from October to June (cluster 3, C3), thus leading to three clusters.
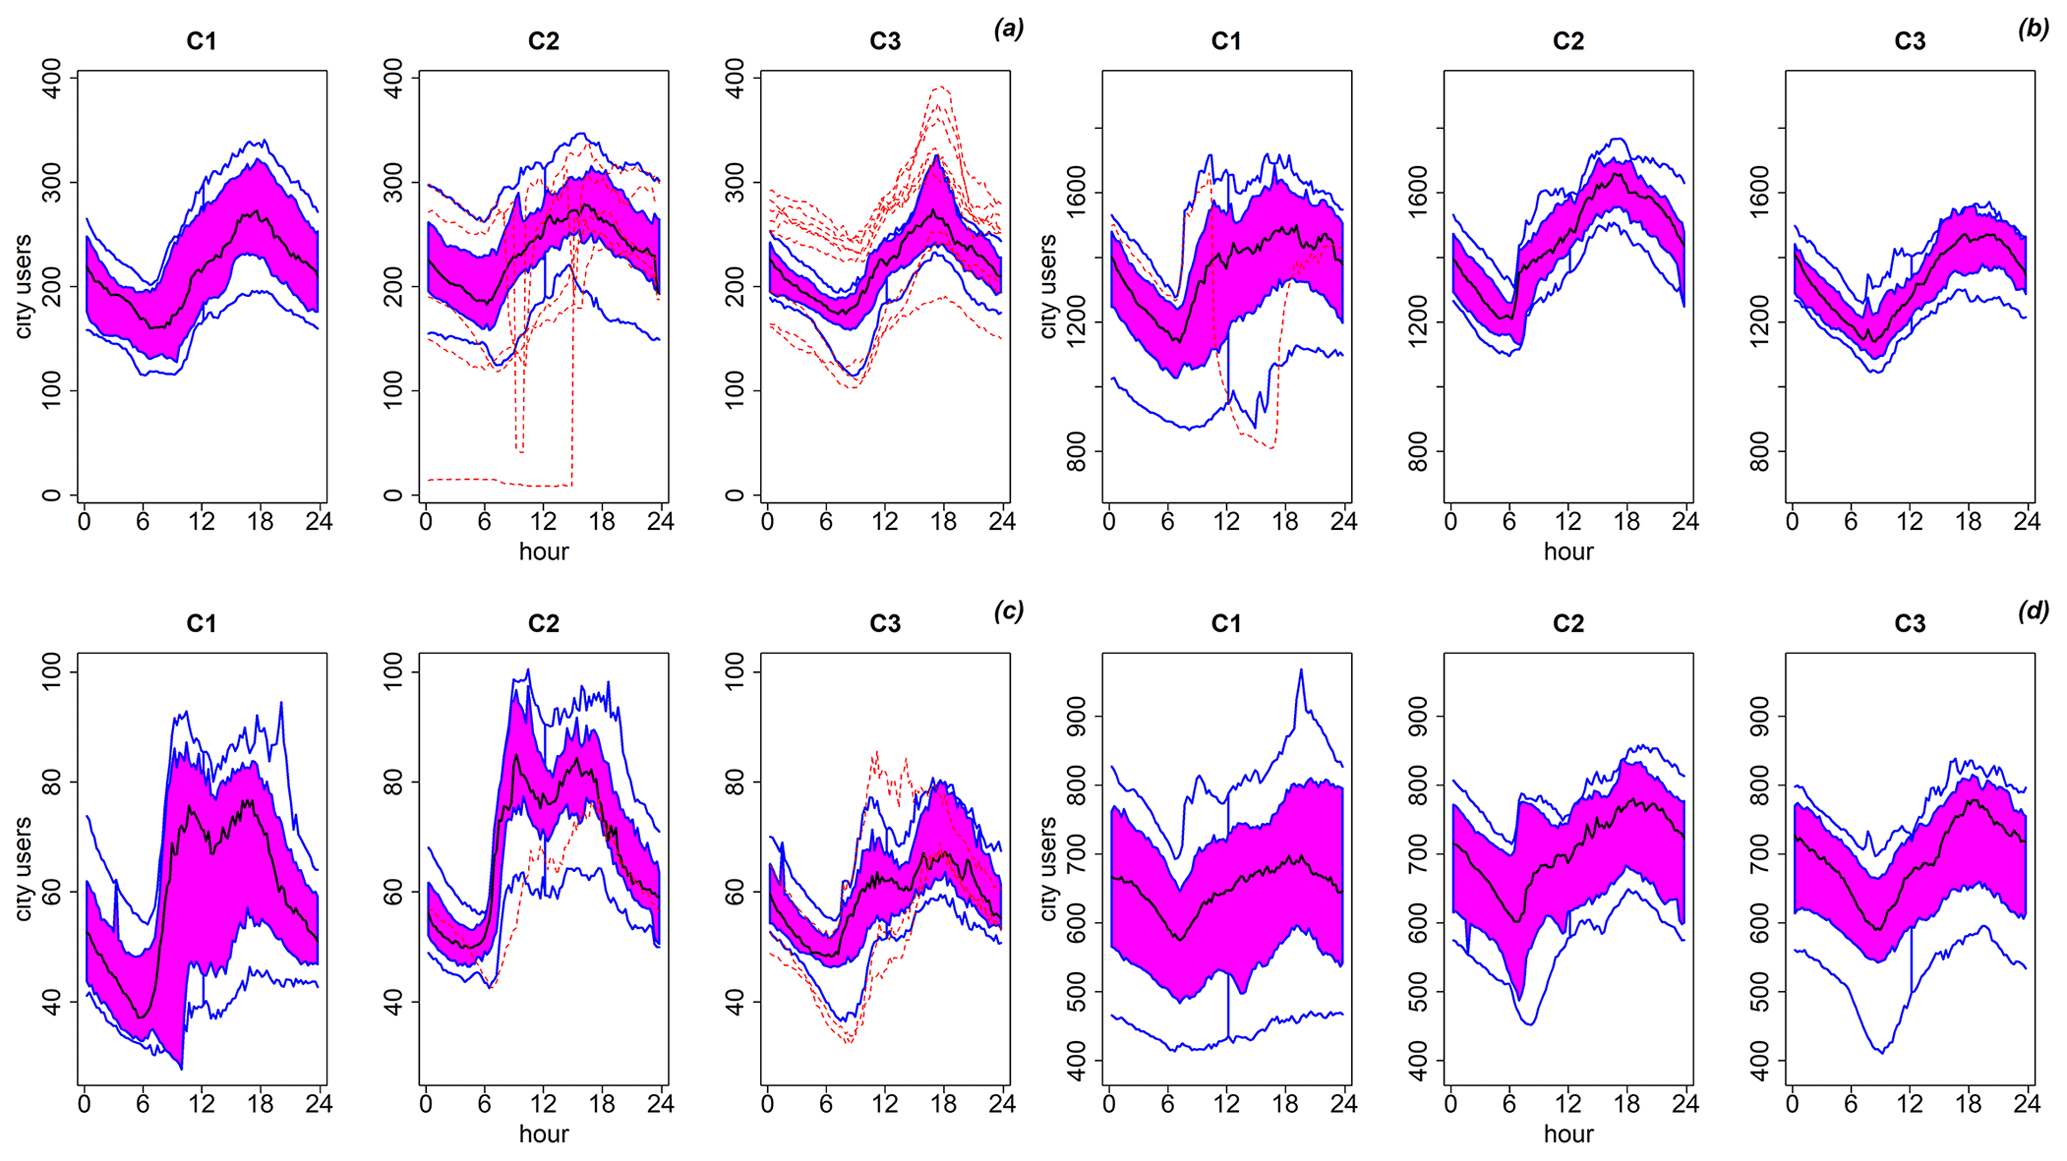
Figure 6Functional box plots of exposed people (“city users”) inside residential areas: (a) Moie di Sotto (area 1 in Fig. 2), (b) Villaggio Badia and Fantasina (area 2 in Fig. 2), (c) southern Gandovere canal (area 3 in Fig. 2), (d) Roncadelle (area 7 in Fig. 2). Cluster 1 (July, August, September; C1), cluster 2 (working days from October to June; C2), cluster 3 (weekends from October to June; C3).
To extract the number of people in each quarter of each day from the grid's cells to the irregular polygon of each area (i.e. to find DDPri,d for area ri; ; and day d), the procedure described in Sect. 2.2 was applied. Hence, MPUs were firstly divided by a constant c=0.85 in order to consider children (>12 years) and old people (>80 years), who likely do not have smartphones (i.e. about 85 % of the people are in the age range [12,80] in Brescia). Then, by estimating the median value of the market share ratio at the SC level by adopting the methodological strategy in Sect. 2.2, which amounts to about 20 %, the estimated DDPs for each area and for each day were derived by applying Eq. (5). The estimated market share is also consistent with that found by Carpita (2019). Estimated DDPri,d underwent the functional box plot strategy separately for days d in the three clusters (with outliers excluded) and for ri corresponding to the eight areas illustrated in Fig. 2.
4.2 Results and discussion
Figures 6 and 7 show, respectively, the resulting functional box plots for residential and productive areas, where the estimated number of city users in different time instants is indicated. The three clusters of days are reported separately. Overall, the number of city users is lower during the first hours of the day and increases in the morning, reaching a peak during working hours (09:00–13:00 and 14:00–18:00 local time) both in residential and in productive areas. In the Moie di Sotto residential area located at the confluence of the Laorna stream and the Gandovere stream (flooding area 1 in Fig. 2), the number of people is estimated at about 200 during the first hours of the day and during the night and increases to about 250 during working hours (inhabitant density is about 25–30 ha−1). The dynamic, similar in all the three clusters, shows irrelevant differences among different periods of the year.
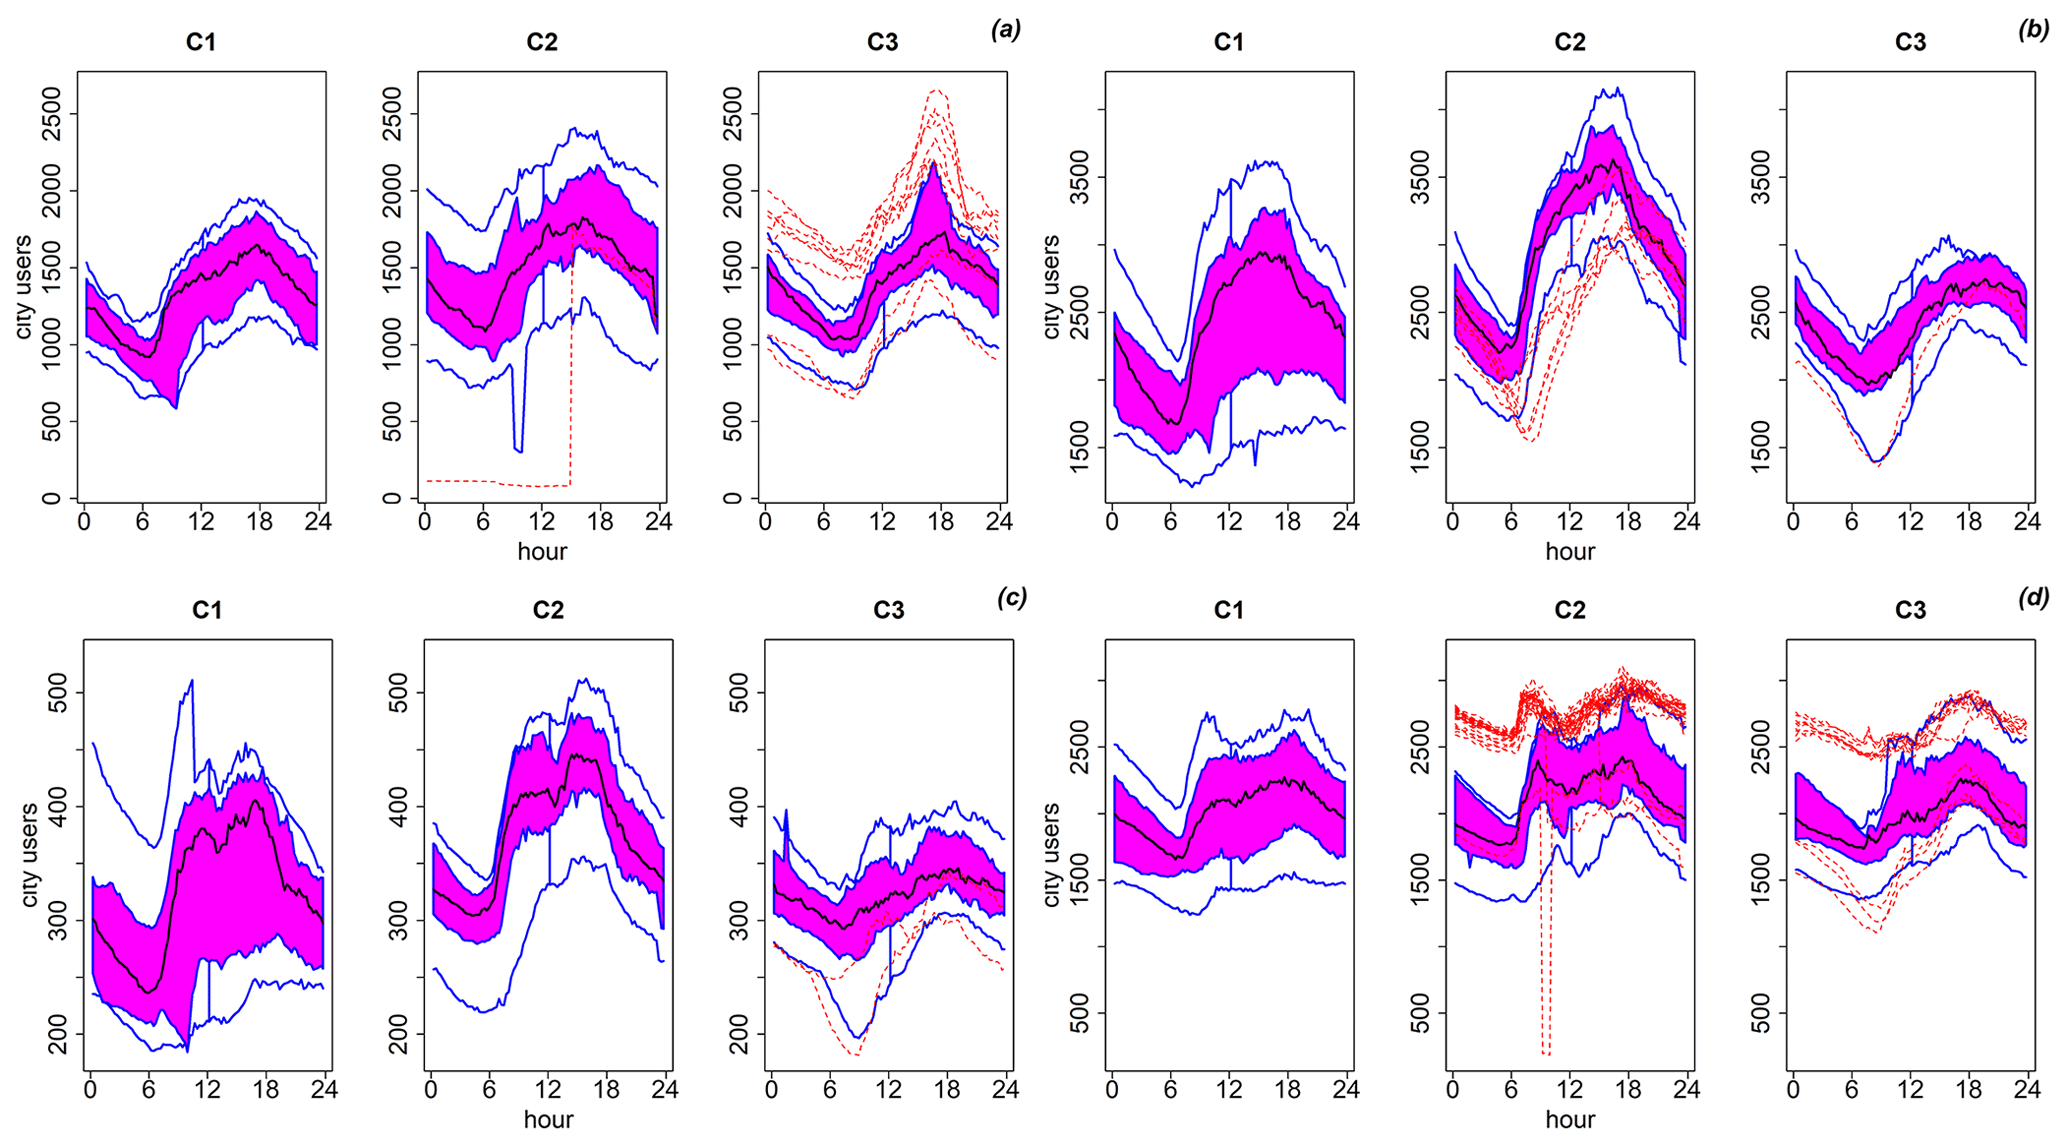
Figure 7Functional box plots of exposed people (“city users”) inside industrial–commercial settlements: (a) Moie di Sotto (area 5 in Fig. 2), (b) Villaggio Badia and Fantasina (area 6 in Fig. 2), (c) southern Gandovere canal (area 8 in Fig. 2), (d) Roncadelle (area 4 in Fig. 2). Cluster 1 (July, August, September; C1), cluster 2 (working days from October to June; C2), cluster 3 (weekends from October to June; C3).
In the Villaggio Badia residential area located north of the Mandolossa canal inlet (flooding area 2 in Fig. 2), the city user number varies between a minimum of 1200 people and a maximum of 1400 people during an average day (inhabitant density is about 30–35 ha−1). During the working days of the months from October to June (C2), the peak reaches 1600 users. Moreover, the descriptive bands appear to be wider in summer (C1) and on weekends (C3) as compared to cluster 2, where bands are narrower (i.e. lower variability between days).
Residential areas along the southern Gandovere canal (flooding area 3 in Fig. 2) are not very populated. Only 50–70 users are there during an average summer day (C1) or during the weekend (C3) (inhabitant density is about 18–23 ha−1). The number amounts to more than 80 people during working hours of working days (C2). The number of city users in Roncadelle's residential area located along the Mandolossa canal (flooding area 7 in Fig. 2) is less sensitive to working hours, especially during summer. In summer, city users vary from a minimum of about 600 up to a maximum of 700. There are about 800 city users during working hours of working days and weekends (days belonging to clusters C2 and C3).
Industrial and commercial settlements of Moie di Sotto (flooding area 5 in Fig. 2) feature 1000–1500 people (minimum during the night and first hours of the day, maximum during the working hours) in summer. These numbers increase up to about 1200–1800 on working days and to about 1100–1600 at weekends. This high density is mainly due to the presence of a commercial outlet of regional interest in this area. Industrial and commercial settlements along the La Canale and Solda stream network (flooding area 6 in Fig. 2) are very highly populated by city users, and the difference between the number of people in summer and on working days is significant. Daily minimum and maximum values are included between 2000 and 3000 in summer and between 2500 and 3500 during working days. Weekends follow a stable dynamic (about 2500 people throughout the entire day).
Flooding areas related to the southern Gandovere canal (flooding area 8 in Fig. 2) involve a productive area with an average number of users varying from 250 to 380 in summer and from 300 to 420 during working days. In the same way as Villaggio Badia (southern part of flooding area 2 in Fig. 2), the number of users during the weekends is stable, and it stands at about 320–330. The industrial sector of Roncadelle (flooding area 4 in Fig. 2) is another highly populated area, featuring more than 2000 people during the day. On some particular working days and weekends, this number reaches about 3000 (dashed red lines of outliers in Fig. 7). In this area, a remarkable difference in the number of users between working days, summer days, and weekends was not detected.
In this paper a novel approach to the assessment of the risk related to human exposure to flooding based on a geostatistical analysis of erlang measures was proposed. Such a procedure takes advantage of data reduction (histogram of oriented gradients discussed in Sect. 2.1) in order to face the dimensionality curse issue. Its suitability and potential were demonstrated with regard to a suburban area located near Brescia (Lombardy, northern Italy), which is affected by widespread and frequent flooding. In Fig. 3 the possibility of expressing the spatiotemporal variability in exposed people by using time-variable maps was illustrated. These data feature high spatial resolution (150 m) and a short time step (15′), thus providing reliable assessments even for the smallest analysed areas (about 4–5 ha) and a precise evaluation of the temporal dynamics. Indeed, daily density profiles can be derived according to this procedure. Then, these profiles can be clustered, yielding groups of similar daily time patterns. Clustering results are definitively meaningful since working days and weekends are acknowledged to show different temporal dynamics when they belong to working months (from October to June). Conversely, daily dynamics in summer months (July, August, and September; usually exploited for the longest holidays in Italy) must be regarded as different from the others. In addition, working days and weekends feature more similar daily density profiles during such months. As can be seen in Figs. 6 and 7, the daily temporal variability in people exposed to flooding can be assessed with respect to the day cluster and the type of urban areas (residential or industrial–commercial), both in terms of expected value (the median) and uncertainty (confidence band), thus providing comprehensive information to agencies and authorities devoted to the flood risk management.
The need to assess the entire population would theoretically require the gathering of a huge number of datasets from all the providers that operate in the area of interest. This issue would lead to a remarkable increase in the data collection cost and would be difficult to overcome. Nevertheless, census data make it possible to infer the total population from the users of a single provider by means of local estimates of its market share, as discussed in Sect. 2.2.
It is worth underlining that this statistical support, along with the high spatiotemporal resolution and the reliability of the raw data, makes the proposed procedure particularly appealing in order to decrease the errors in exposed-people estimates. Such a support is not provided by crowdsourcing techniques, which are based on voluntary data supplies and commonly rely on very limited datasets with respect to the number of exposed people. A second advantage that must not be disregarded lies in the possibility of exploiting dynamic exposure maps, or alternatively the clustered daily density profiles, by directly implementing them in emergency plans, regardless of the potential malfunctioning of the mobile phone connection during the flood episode. Conversely, crowdsourcing could be strongly compromised by the difficulties of connecting to the network during the emergency period. Indeed, dynamic exposure maps derived by mobile phone data have strong potential to substantially improve emergency plans so that real-time rescues, relief supplies, and traffic management could be better addressed.
Future developments of the geostatistical approach proposed in this paper could be addressed towards multiple items which deserve further in-depth analyses. First, complete mobile phone data feature more additional information than those available for this study. Actually, datasets include the collection of matrices of origin–destination (OD) vectors in different seasons, days of the week, and hour of the day, which are constructed by using the SIM identification numbers. Hence, it would be possible to track users down. By knowing the density of origin–destination vectors of the paths around critical traffic nodes, it would be possible to forecast potential critical conditions for mobility and better manage traffic in a more precise manner.
Second, coupling traffic-management-decision support systems with real-time rainfall–run-off–flooding modelling is also a research perspective being considered. Presently, the exploitation of mobile phone data in real time is problematic. Nevertheless, in the future, a more common use of 5G and GPS technologies in mobile devices will facilitate the real-time assessments of the spatial distribution of people. From a prevention perspective, this could make the identification of preferential traffic flows possible, thus evidencing potential risks during inundation onsets or emergency situations. Alternative safe pathways could be identified and communicated to exposed people in order to facilitate their evacuation.
Third, it would be possible to profile the SIM users, even if they remain anonymous and their privacy is respected. Users could be categorized in order to isolate specific targets from the whole user set, and their behaviours could be statistically analysed separately from the others. Thus, a future development of the statistical matching procedure between mobile phone data and census data could use demographic and socio-economic information about the SC areas, for example the ISTAT ARCH.I.M.E.DE database (https://www.istat.it/it/archivio/190365, last access: 1 July 2020). Since it is likely to assume heterogeneous behaviours of individuals, this database will be beneficial in future works in order to organize individuals into classes in terms of their age, gender, income, or their job. In fact, different mobile phone companies have different costs, and this may affect the choice of different classes of individuals.
Fourth, exposed human behaviours and habits can significantly change after hydro-climatic alarms or during flood events since people would be aware of flood hazard and limit their exposure in flood-prone areas. Mobile phone data make the identification of anomalous exposed human mobility during alarms possible, while the geostatistical approach proposed herein provides a tool to analyse whether and the extent to which human behaviours are different from those of common days. Actually, a sample far larger than 2 years would be beneficial to make such statistics more reliable since alarms involve a few days in a year. It is worth noting that, in the analysed area, the risk perception towards the secondary network is almost absent as well as a capillary local warning system. Flood risk perception is mainly related to the primary hydrographic network (i.e. Mella river). Therefore, regarding the specific test case, in this research the possibility of drastic changes in human behaviour during heavy-rainfall alarms is not expected. Indeed, virtuous human behaviours are usually the result of extensive campaigns to raise public awareness against flood risk, coupled with trusted and effective warning systems. Hence, a final objective of the ongoing research will take into consideration the effectiveness of the non-structure practices that will be adopted to mitigate flood risk in the test watershed.
Mobile phone data can be shared after motivated request due to restrictions enforced by the provider. Geographical data can be freely downloaded at http://www.geoportale.regione.lombardia.it/ (Lombardy Region, 2020). Hydrological-simulation outcomes and models cannot be shared at this time because they are part of ongoing research.
RR and MC delineated the research topic, guided its development, and supervised the writing of the paper. MB and RM performed the hydrologic analyses and the geostatistical analyses, respectively, and wrote the paper.
The authors declare that they have no conflict of interest.
The content of this article does not reflect the official opinion of the Cariplo Foundation. Responsibility for the information and views expressed in this paper lies entirely with the authors. The research will continue after additional funding by the Lombardy Region (Mo.So.Re. project on sustainable and resilient mobility).
The authors want to thank the two anonymous reviewers and the author who provided the scientific comment for their fruitful suggestions and their contributions to the improvement of the paper.
This research was developed at University of Brescia in the course of the FLOod RIsk MAnagement Policies (FLORIMAP) project, which received funding from the Cariplo Foundation under grant number 2017/0708.
This paper was edited by Sven Fuchs and reviewed by two anonymous referees.
Agrawal, R., Gehrke, J., Gunopulos, D., and Raghavan, P.: Automatic subspace clustering of high dimensional data for data mining applications, in: Proceedings of the 1998 ACM SIGMOD International Conference on Management of Data, ACM Press, 1–4 June 1998, Seattle, Washington, USA, 94–105, https://doi.org/10.1145/276304.276314, 1998.
Arabie, P. and De Soete, G.: Clustering and classification, World Scientific, Seattle, Washington (USA), June, 1998, https://doi.org/10.1142/1930, 1996.
Arrighi, C., Pregnolato, M., Dawson, R. J., and Castelli, F.: Preparedness against mobility disruption by floods, Sci. Total Environ., 654, 1010–1022. https://doi.org/10.1016/j.scitotenv.2018.11.191, 2019.
Balistrocchi, M., Grossi, G., and Bacchi, B.: Deriving a practical analytical-probabilistic method to size flood routing reservoirs, Adv. Water Resour., 62, 37–46, https://doi.org/10.1016/j.advwatres.2013.09.018, 2013.
Balistrocchi, M., Moretti, G., Orlandini, S., and Ranzi, R.: Copula-based modelling of earthen levee breach due to overtopping, Adv. Water Resour., 134, 103443, https://doi.org/10.1016/j.advwatres.2019.103433, 2019.
Barredo, J. I.: Normalised flood losses in Europe: 1970–2006, Nat. Hazards Earth Syst. Sci., 9, 97–104, https://doi.org/10.5194/nhess-9-97-2009, 2009.
Becker, R. A., Caceres, R., Hanson, K., Loh, J. M., Urbanek, S., Varshavsky, A., and Volinsky, C.: Route classification using cellular handoff patterns, in: Proceedings of the 13th international conference on Ubiquitous computing, Beijing (China), September 2011, 123–132, ACM press, 2011.
Blöschl, G., J. Hall, A. Viglione, R. A. P. Perdigão, J. Parajka, B. Merz, D. Lun, B. Arheimer, G. T. Aronica, A. Bilibashi, M. Boháč, O. Bonacci, M. Borga, I. Čanjevac, A. Castellarin, G. B. Chirico, P. Claps, N. Frolova, D. Ganora, L. Gorbachova, A. Gül, J. Hannaford, S. Harrigan, M. Kireeva, A. Kiss, T. R. Kjeldsen, S. Kohnová, J. J. Koskela, O. Ledvinka, N. Macdonald, M. Mavrova-Guirguinova, L. Mediero, R. Merz, P. Molnar, A. Montanari, C. Murphy, M. Osuch, V. Ovcharuk, I. Radevski, J. L. Salinas, E. Sauquet, M. Šraj, J. Szolgay, E. Volpi, D. Wilson, K. Zaimi, and N. Živković: Changing climate both increases and decreases European river floods, Nature, 573, 108–111, https://doi.org/10.1038/s41586-019-1495-6, 2019.
Bouveyron, C., Girard, S., and Schmid, C.: High-dimensional data clustering, Comput. Stat. Data An., 52, 502–519, https://doi.org/10.1016/j.csda.2007.02.009, 2007.
Bouveyron, C., Come, E., and Jacques, J.: The discriminative functional mixture model for a comparative analysis of bike sharing systems, Ann. Appl. Stat., 9, 1726–1760, https://doi.org/10.1214/15-AOAS861, 2015.
Bouwer, L. M., Bubeck, P., and Aerts, J. C. J. H.: Changes in future flood risk due to climate and development in a Dutch polder area, Global Environ. Chang., 20, 463–471, https://doi.org/10.1016/j.gloenvcha.2010.04.002, 2010.
Calabrese, F., Ferrari, L., and Blondel, V. D.: Urban sensing using mobile phone network data: A survey of research, ACM Comput. Surv., 47, 2655691, https://doi.org/10.1145/2655691, 2015.
Carpita M.: The mobile phone big data tell the story of Christo's The Floating Piers impact on the Lake Iseo, in: Book of Short Papers of the ASA 2019 Conference “Statistics for Health and Well-being”, edited by: Carpita, M. and Fabbris, L., CLEUP, 25–27 September 2019, Brescia (Italy), pp. 53–56, ISBN 978-88-5495-135-8, 2019.
Carpita, M. and Simonetto, A.: Big data to monitor big social events: Analysing the mobile phone signals in the Brescia smart city, Electron. J. Appl. Stat. Anal., 5, 31–41, https://doi.org/10.1285/i2037-3627v5n1p31, 2014.
CENSIS: 53∘ Rapporto sulla situazione sociale del Paese, Franco Angeli, https://www.censis.it/rapporto-annuale/sintesi-del-53%C2%B0-rapporto-censis (last access: 1 December 2020), 2019 (in Italian).
Dawson, R. J., Peppe, R., and Wang, M.: An agent-based model for risk-based flood incident management, Nat. Hazards, 59, 167–189, https://doi.org/10.1007/s11069-011-9745-4, 2011.
Dalal, N. and Triggs, B.: Histograms of oriented gradients for human detection, in: Proceedings of the International Conference on Computer Vision & Pattern Recognition (CVPR '05), June 2005, San Diego, United States, pp. 886–893, https://doi.org/10.1109/CVPR.2005.177, 2005.
Donoho, D. L.: High-dimensional data analysis: The curses and blessings of dimensionality, AMS Math Challenges Lecture, 1–32, 2000.
Di Baldassarre, G., Viglione, A., Carr, G., Kuil, L., Salinas, J. L., and Blöschl, G.: Socio-hydrology: conceptualising human-flood interactions, Hydrol. Earth Syst. Sci., 17, 3295–3303, https://doi.org/10.5194/hess-17-3295-2013, 2013.
European Union: Directive 2007/60/EC on the assessment and management of flood risks, Official Journal of European Union, 227, 27–34, 2007.
Erlang, A. K.: The theory of probabilities and telephone conversations, Nyt Tidsskrift Matematika, 20, 33–39, 1909.
Febrero-Bande, M., Galeano, P., and Gonzalez-Manteiga, W.: Outlier detection in functional data by depth measures, with application to identify abnormal NOx levels, Environmetrics, 19, 331–345, https://doi.org/10.1002/env.878, 2008.
Feyen, L. and Dankers, R.: Impact of global warming on streamflow drought in Europe, J. Geophys. Res.-Atmos., 114, D17116, https://doi.org/10.1029/2008JD011438, 2009.
Fuchs, S., Keiler, M., and Zischg, A.: A spatiotemporal multi-hazard exposure assessment based on property data, Nat. Hazards Earth Syst. Sci., 15, 2127–2142, https://doi.org/10.5194/nhess-15-2127-2015, 2015.
Gabrys, R. and Kokoszka, P.: Portmanteau test of independence for functional observations, J. Am. Stat. Assoc., 102, 1338–1348, https://doi.org/10.1198/016214507000001111, 2007.
Guntha, R., Rao, S., Benndorf, M., and Haenselmann. T.: A comprehensive crowd-sourcing approach to urban flood management, in: Lecture Notes of the Institute for Computer Sciences, Social-Informatics and Telecommunications Engineering (LNICST), 218, 13–24, Springer Verlag, NY, 2018.
Goodchild, M. F.: Citizens as sensors: The world of volunteered geography, Geojournal, 69, 211–221, https://doi.org/10.1002/9780470979587.ch48, 2007.
Goodchild, M. F., Aubrecht, C., and Bhaduri. B.: New questions and a changing focus in advanced VGI research, T. GIS, 21, 189–190, https://doi.org/10.1111/tgis.12242, 2017.
Haer, T., Botzen, W. J. W., and Aerts, J. C. J. H.: The effectiveness of flood risk communication strategies and the influence of social networks-insights from an agent-based model, Environ. Sci. Policy, 60, 44–52, https://doi.org/10.1016/j.envsci.2016.03.006, 2016.
Han, S. and Ciravegna, F.: Rumour detection on social media for crisis management, Paper presented at the Proceedings of the International ISCRAM Conference, 19–22 May 2019, Valencia, Spain, 660–673, 2019.
Hartigan, J. A. and Wong, M. A.: Algorithm AS 136: A k-means clustering algorithm, J. R. Stat. Soc. C, 28, 100–108, https://doi.org/10.2307/2346830, 1979.
Hartmann, D. L., Klein Tank, A. M. G., Rusticucci, M., Alexander, L. V., Brönnimann, S., Charabi, Y., Dentener, F. J., Dlugokencky, E. J., Easterling, D. R., Kaplan, A., Soden, B. J., Thorne, P. W., Wild, M., and Zhai, P. M.: Observations: Atmosphere and surface, in: “Climate Change 2013: The Physical Science Basis. Contribution of Working Group I to the Fifth Assessment Report of the Intergovernmental Panel on Climate Change”, edited by: Stocker, T. F., Qin, D., Plattner, G.-K., Tignor, M., Allen, S. K., Boschung, J., Nauels, A., Xia, Y., Bex, V., and Midgley, P. M.: Cambridge University Press, Cambridge, UK, 2013.
Hirata, E., Giannotti, M. A., Larocca, A. P. C., and Quintanilha, J. A.: Flooding and inundation collaborative mapping - use of the Crowdmap/Ushahidi platform in the city of Sao Paulo, Brazil, J. Flood Risk Manag., 11, S98–S109, https://doi.org/10.1111/jfr3.12181, 2018.
Hung, K.-C., Kalantari, M., and Rajabifard., A.: Methods for assessing the credibility of volunteered geographic information in flood response: a case study in Brisbane, Australia, Appl. Geogr., 68, 37–47, https://doi.org/10.1016/j.apgeog.2016.01.005, 2016.
Kellens, W., Terpstra, T., and De Maeyer, P.: Perception and communication of flood risks: A systematic review of empirical research, Risk Anal., 33, 24–49, https://doi.org/10.1111/j.1539-6924.2012.01844.x, 2013.
Keogh, E. and Mueen, A.: Curse of dimensionality, in: Encyclopedia of Machine Learning and Data Mining, edited by: Sammut, C. and Webb, G. I., Springer, New York, https://doi.org/10.1007/978-1-4899-7687-1_192, 314–315, 2017.
Italian Ministry of Economy and Finance: Department of Finances, Data and Statistics, available at: https://www.finanze.it/opencms/it/statistiche-fiscali/, last access: 1 December 2020.
Johnson, C. L. and Priest, S. J.: Flood risk management in England: A changing landscape of risk responsibility?, Water Resour. Dev., 24, 513–525, https://doi.org/10.1080/07900620801923146, 2008.
Jovi, A., Brki, K., and Bogunovi, N.: A review of feature selection methods with applications, in: Proceedings of the 38th International Convention on Information and Communication Technology, Electronics and Microelectronics (MIPRO), 25–29 May 2015, Opatija, Croatia, 1200–1205, https://doi.org/10.1109/MIPRO.2015.7160458, 2015.
Kreibich, H., Thaler, T., Glade, T., and Molinari, D.: Preface: Damage of natural hazards: assessment and mitigation, Nat. Hazards Earth Syst. Sci., 19, 551–554, https://doi.org/10.5194/nhess-19-551-2019, 2019.
Il Sole 24 Ore: Telefoni cellulari: è corsa al ribasso per le tariffe, available at: https://www.ilsole24ore.com/art/telefoni-cellulari-e-corsa-ribasso-le-tariffe-AESqTnQB, last access: 23 May 2017 (in Italian).
ISPRA: Soil consumption in Italy – 2019 Edition, Report SNPA, 08/19, ISBN 978-88-448-0964-5, 2019 (in Italian).
ISTAT: Basi territoriali e variabili censuarie, available at: https://www.istat.it/it/archivio/104317 (last access: 17 July 2019) 2011.
Liao, K.-H.: A theory on urban resilience to floods – A basis for alternative planning practices, Ecol. Soc., 17, 40, https://doi.org/10.5751/ES-05231-170448, 2012.
Lombardy Region: Home Geoportale della Regione Lombardia, available at: http://www.geoportale.regione.lombardia.it/, last access: 3 March 2020.
Maaskant, B., Jonkman, S. N., and Bouwer, L. M.: Future risk of flooding: an analysis of changes in potential loss of life in South Holland (the Netherlands), Environ. Sci. Policy, 12, 157–169, https://doi.org/10.1016/j.envsci.2008.11.004, 2009.
Manfredini, F., Pucci, P., Secchi, P., Tagliolato, P., Vantini, S., and Vitelli, V.: Treelet decomposition of mobile phone data for deriving city usage and mobility pattern in the Milan urban region, in: Advances in Complex Data Modeling and Computational Methods in Statistics, Contributions to Statistics, edited by: Paganoni, A. M. and Secchi, P., Springer, Cham, 133–147, 2015.
Mazumdar, S., Wrigley, S., and Ciravegna, F.: Citizen science and crowdsourcing for earth observations: An analysis of stakeholder opinions on the present and future, Remote Sens., 9, 87, https://doi.org/10.3390/rs9010087, 2017.
Mazzoleni, M., Cortes Arevalo, V. J., Wehn, U., Alfonso, L., Norbiato, D., Monego, M., Ferri, M., and Solomatine, D. P.: Exploring the influence of citizen involvement on the assimilation of crowdsourced observations: a modelling study based on the 2013 flood event in the Bacchiglione catchment (Italy), Hydrol. Earth Syst. Sci., 22, 391–416, https://doi.org/10.5194/hess-22-391-2018, 2018.
Merz, B., Kreibich, H., Schwarze, R., and Thieken, A.: Review article ”Assessment of economic flood damage”, Nat. Hazards Earth Syst. Sci., 10, 1697–1724, https://doi.org/10.5194/nhess-10-1697-2010, 2010.
Metulini, R. and Carpita, M.: The HOG-FDA Approach with Mobile Phone Data to Modeling the Dynamic of Peoples Presences in the City, in: IES 2019 Innovation & Society – Statistical Evaluation Systems at 360: Techniques, Technologies and new Frontiers Book of Abstracts, edited by: Bini, M., Amenta, P., D'Ambra, A., and Camminatiello, I., Cuzzolin Editing, Rome (Italy), 2019a.
Metulini, R. and Carpita, M.: A strategy for the matching of mobile phone signals with census data, in: SIS 2019 Smart Statistics for Smart Applications Book of Short Papers, edited by: Arbia, G., Peluso, S., Pini, A., and Rivellini, G., 427–434, Pearson Publishing, Milan (Italy), 2019b.
Metulini, R. and Carpita, M.: A Spatio-Temporal Indicator for City Users based on Mobile Phone Signals and Administrative Data, Soc. Indic. Res., https://doi.org/10.1007/s11205-020-02355-2, online first, 2020.
Poser, K. and Dransch, D.: Volunteered geographical information for disasters management with application to rapid flood damage estimation, Geomatica, 64, 89–98, 2010.
Rojas, R., Feyen, L., and Watkiss, P.: Climate change and river floods in the European Union: socio-economic consequences and the costs and benefits of adaptation, Global Environ. Change, 23, 1737–1751, https://doi.org/10.1016/j.gloenvcha.2013.08.006, 2013.
Rosser, J. F., Leibovici, D. G., and Jackson, M. J.: Rapid flood inundation mapping using social media, remote sensing and topographic data, Nat. Hazards, 87, 103–120, https://doi.org/10.1007/s11069-017-2755-0, 2017.
Salhi, A. I., Kardouchi, M., and Belacel, N.: Histograms of fuzzy oriented gradients for face recognition, in: 2013 International conference on computer applications technology (ICCAT), 20–22 January, 2013, Sousse (Tunisia), 1–5, IEEE, 2013.
Secchi, P., Vantini, S., and Vitelli, V.: Analysis of spatio-temporal mobile phone data: A case study in the metropolitan area of Milan, Stat. Method. Appl., 24, 279–300, https://doi.org/10.1007/s10260-014-0294-3, 2015.
Solomon, S., Qin, D., Manning, M., Chen, Z., Marquis, M., Averyt, K. B., Tignor, M., and Miller, H. L.: AR4 Climate Change 2007: The Physical Science Basis. Contribution of Working Group I to the Fourth Assessment Report of the Intergovernmental Panel on Climate Change, Cambridge University Press, Cambridge, UK, 2007.
Schumann, A.: Flood safety versus remaining risks – options and limitations of probabilistic concepts in flood management, Water Resour. Manag., 31, 3131–3145, https://doi.org/10.1007/s11269-017-1700-z, 2017.
Sun, Y. and Genton, M. G.: Functional boxplots, J. Comput. Graph. Stat., 20, 316–334, https://doi.org/10.1198/jcgs.2011.09224, 2011.
Sun, Y. and Genton, M. G.: Adjusted functional boxplots for spatiotemporal data visualization and outlier detection, Environmetrics, 23, 54–64, https://doi.org/10.1002/env.1136, 2012.
Székely, G. J. and Rizzo, M. L.: The distance correlation t-test of independence in high dimension, J. Multivariate Anal., 117, 193–213, https://doi.org/10.1016/j.jmva.2013.02.012, 2013.
te Linde, A. H., Bubeck, P., Dekkers, J. E. C., de Moel, H., and Aerts, J. C. J. H.: Future flood risk estimates along the river Rhine, Nat. Hazards Earth Syst. Sci., 11, 459–473, https://doi.org/10.5194/nhess-11-459-2011, 2011.
Tomasi, C.: Histograms of oriented gradients, Computer Vision Sampler, 1–6, 2012.
UN DESA Population Division: World urbanization prospects: The 2011 revision, United Nations Department of Social Affairs (UN DESA) Population Division, New York, USA, 2012.
UN ISDR: 2009 UNISDR terminology on disaster risk reduction, United Nations International Strategy for Disaster Reduction (UN ISDR), Geneva, CH, 2009.
Viglione, A., Di Baldassarre, G., Brandimarte, L., Kuil, L., Carr, G., Salinas, J. L., Scolobig, A., and Blöschl, G.: Insights from socio-hydrology modelling on dealing with flood risk - roles of collective memory, risk-taking attitude and trust, J. Hydrol., 518, 71–82, https://doi.org/10.1016/j.jhydrol.2014.01.018, 2014.
Vorogushyn, S., Merz, B., and Apel, H.: Development of dike fragility curves for piping and micro-instability breach mechanisms, Nat. Hazards Earth Syst. Sci., 9, 1383–1401, https://doi.org/10.5194/nhess-9-1383-2009, 2009.
Vu, T. T. and Ranzi, R.: Flood risk assessment and coping capacity of floods in central Vietnam, J. Hydro-Environ. Res., 14, 44–60. https://doi.org/10.1016/j.jher.2016.06.001, 2017.
Zanini, P., Shen, H., and Truong, Y.: Understanding resident mobility in Milan through independent component analysis of Telecom Italia mobile usage data, Ann. Appl. Stat., 10, 812–833, https://doi.org/10.1214/16-AOAS913, 2016.